better trace for better software - arm - the architecture for the
TRANSCRIPT
Copyright © 2010 ARM Limited. All rights reserved. The ARM logo is a registered trademark of ARM Ltd.
All other trademarks are the property of their respective owners and are acknowledged
Page 1 of 12
Better Trace for Better Software
Introducing the new ARM CoreSight System Trace Macrocell and Trace Memory Controller
Roberto Mijat Senior Software Solutions Architect
Synopsis
The majority of engineering costs throughout the SoC lifecycle increasingly come from software. If you
want your product to succeed you need to get your software right. This means developing higher quality
code, fixing more bugs and implementing more optimizations – quicker. Having the best debug and
trace1 options is essential to achieve this. CoreSight is the de-facto standard for debug and trace of ARM
based SoCs.
Traditional debug techniques are invasive and characterised by high cost of information. ARM
introduces two new components to the CoreSight architecture, the System Trace Macrocell (STM) and
Trace Memory Controller (TMC). This white paper explores the limitations of existing software debug
and trace technologies, and explains how the STM and TMC enable system level visibility to more
developers, with reduced latency and increased throughput, whilst leveraging on existing open source
trace infrastructures: Better debug and trace for better software at affordable price. 1 Although trace is a debug technology, in this document, with debug we intend interactive techniques, and with trace the
collection and analysis of run-time diagnostic data (such as instruction, program flow, events).
Copyright © 2010 ARM Limited. All rights reserved. The ARM logo is a registered trademark of ARM Ltd.
All other trademarks are the property of their respective owners and are acknowledged
Page 2 of 12
Introduction
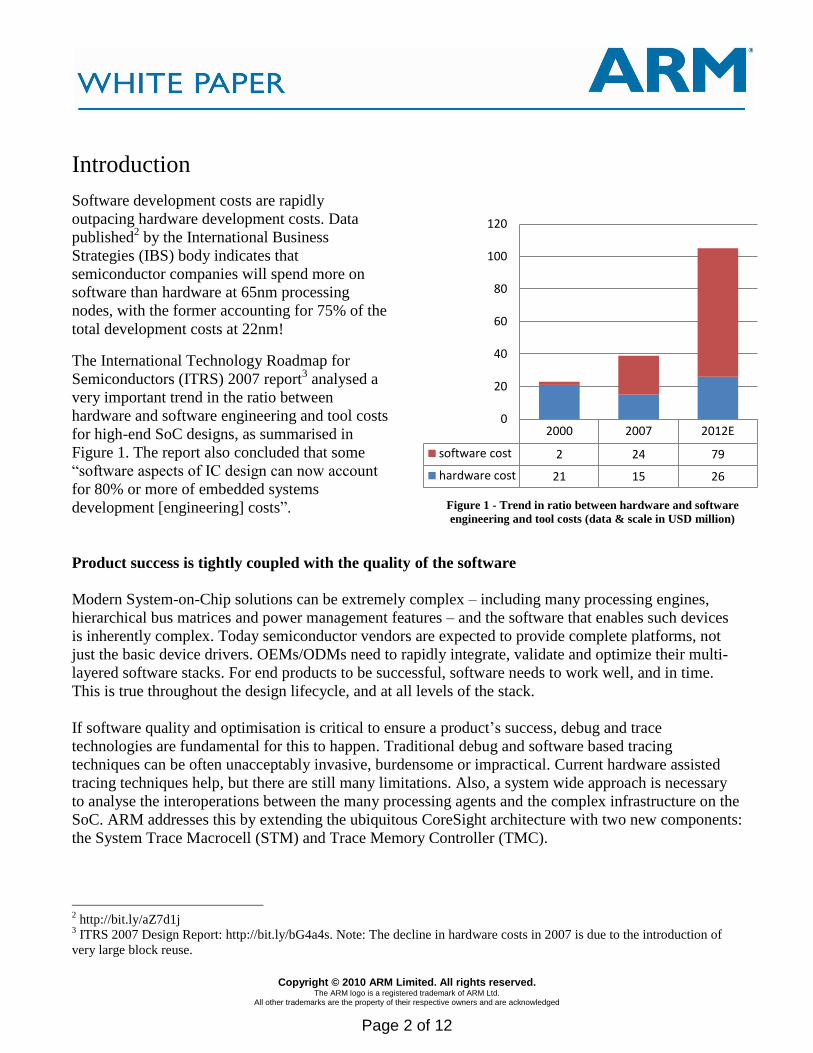
Software development costs are rapidly
outpacing hardware development costs. Data
published2 by the International Business
Strategies (IBS) body indicates that
semiconductor companies will spend more on
software than hardware at 65nm processing
nodes, with the former accounting for 75% of the
total development costs at 22nm!
The International Technology Roadmap for
Semiconductors (ITRS) 2007 report3 analysed a
very important trend in the ratio between
hardware and software engineering and tool costs
for high-end SoC designs, as summarised in
Figure 1. The report also concluded that some
“software aspects of IC design can now account
for 80% or more of embedded systems
development [engineering] costs”.
Product success is tightly coupled with the quality of the software
Modern System-on-Chip solutions can be extremely complex – including many processing engines,
hierarchical bus matrices and power management features – and the software that enables such devices
is inherently complex. Today semiconductor vendors are expected to provide complete platforms, not
just the basic device drivers. OEMs/ODMs need to rapidly integrate, validate and optimize their multi-
layered software stacks. For end products to be successful, software needs to work well, and in time.
This is true throughout the design lifecycle, and at all levels of the stack.
If software quality and optimisation is critical to ensure a product’s success, debug and trace
technologies are fundamental for this to happen. Traditional debug and software based tracing
techniques can be often unacceptably invasive, burdensome or impractical. Current hardware assisted
tracing techniques help, but there are still many limitations. Also, a system wide approach is necessary
to analyse the interoperations between the many processing agents and the complex infrastructure on the
SoC. ARM addresses this by extending the ubiquitous CoreSight architecture with two new components:
the System Trace Macrocell (STM) and Trace Memory Controller (TMC).
2 http://bit.ly/aZ7d1j
3 ITRS 2007 Design Report: http://bit.ly/bG4a4s. Note: The decline in hardware costs in 2007 is due to the introduction of
very large block reuse.
2000 2007 2012E
software cost 2 24 79
hardware cost 21 15 26
0
20
40
60
80
100
120
Figure 1 - Trend in ratio between hardware and software
engineering and tool costs (data & scale in USD million)
Copyright © 2010 ARM Limited. All rights reserved. The ARM logo is a registered trademark of ARM Ltd.
All other trademarks are the property of their respective owners and are acknowledged
Page 3 of 12
Tracing today
Debug and trace tools and techniques play an exceptionally important role at all stages of the design
cycle. This affects system architecture and low-level software, operating system porting, application
development, integration, followed by validation, and in-field maintenance and failure analysis. The
purpose of debug and tracing does not stop at fixing bugs, but also extends to profiling system behaviour
and performance analysis, with the aim of improving overall system efficiency.
Interactive debug activities, such as stop-and-resume, direct access and manipulation of memory and
peripherals registers and instruction stepping, are all very invasive and can alter system state and
execution patterns. Traditional debug agents have troublesome side-effects such as the triggering of
interrupts and other system events like cache flushing. Many types of bug and instances of erroneous
behaviour need to be analysed by observing the system whilst it is running. This is particularly true for
multi-processor systems. Tracing techniques provide an invaluable complement to interactive debug by
tracking run-time information that can either be displayed at run-time or stored for later analysis.
Tracing in Linux
The Linux kernel comes with a large number of built-in debugging and tracing features. These features
are normally disabled in production builds, due to the space (code and data size) and performance
overheads. Kernel developers can statically enable a wide range of debug options. These can help to:
track memory corruption via extra checks on kernel memory allocation functions and removal of freed
pages, track improper usage of locking mechanisms (spinlocks), and track kernel stack usage and stack
overflows. It is also possible to statically enable the inclusion of kernel symbol information and full
debug information, verbose logging of input events, profiling support and low-level support code debug
information.
The programmer can use print statements anywhere in the code to provide access to run-time
information via the standard output channel. However this is very invasive. In kernel space, printk()
allows the developer to classify messages according to their severity by associating a different loglevel,
or priority, such as KERN_INFO, KERN_WARNING, KERN_ALERT, KERN_EMERG for example. The
location where these messages should be stored or displayed is configurable. Additionally, daemons like
syslogd and klogd can be enabled to intercept and log system and kernel messages. The strace
command shows the system calls issued by a user space program, including arguments and return values
in symbolic form, with information retrieved directly from the kernel. ltrace is a debugging utility to
monitor the library calls used by a program and all the signals it receives, as well as system calls.
The Linux kernel also provides instrumentation in the form of kernel Markers and Tracepoints4. These
are hooking mechanisms that provide static instrumentation that can be enabled at runtime and have a
4 For more information see: http://lttng.org/tracingwiki/index.php/Tracepoints_and_Markers.
Copyright © 2010 ARM Limited. All rights reserved. The ARM logo is a registered trademark of ARM Ltd.
All other trademarks are the property of their respective owners and are acknowledged
Page 4 of 12
very small footprint when disabled. The main consumer of these markers in the LTTng framework5, but
custom probes can also be attached to them.
Limitations of software tracing solutions
Whilst widely used, the execution of tracing primitives in software (for example using printf/printk
primitives to output to terminal or filesystem) can have a considerable performance overhead. Adding
instrumentation code also increases the size of the binary image. A program may no longer fit in cache
as well as it did before and this can have repercussions on performance and interfere with debugging
by altering the code being executed and debugged. Due to their high latencies, traditional
printf/printk methods are not suitable for use in critical areas such as inside an interrupt service
routine (ISR). Also they cannot be used before the necessary libraries have been initialized, therefore
making them of no use for tracing at early boot stages. When disabled, this kind of instrumentation will
affect system behaviour, since the execution flow is altered and this also can interfere with debugging.
All instrumentation overhead should be reduced to a minimum.
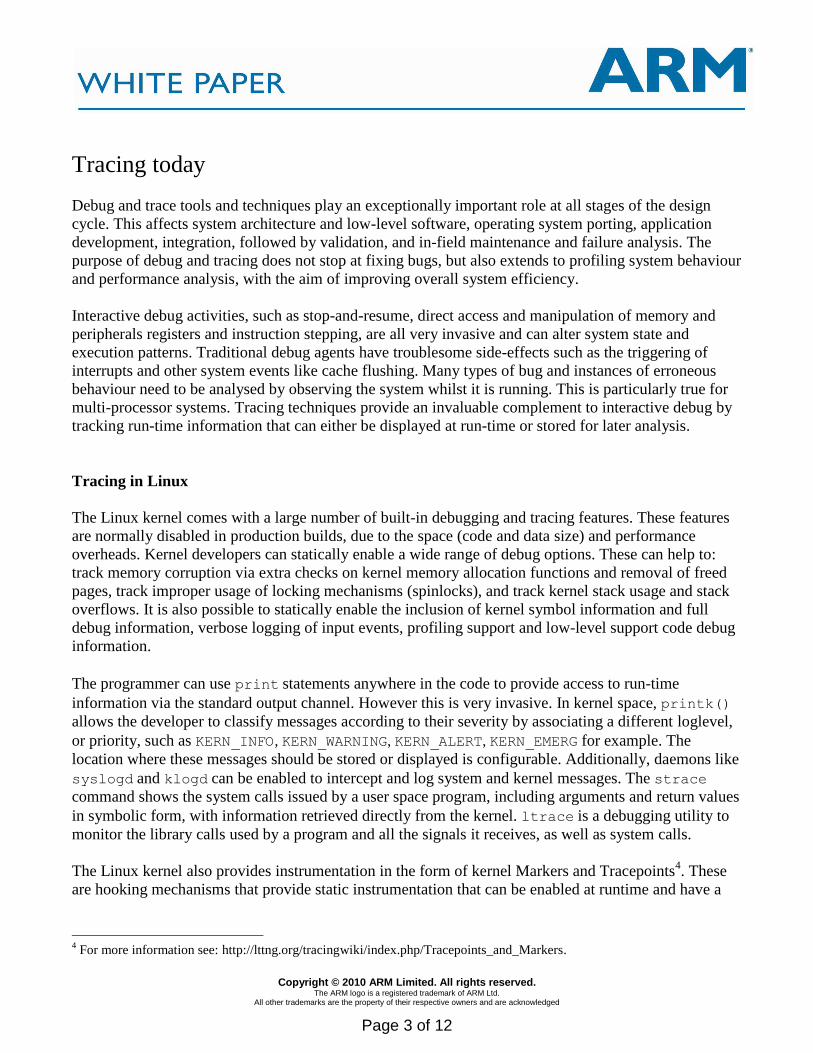
Instrumentation of Operating System (OS) and application software only gives a very narrow view of
what is happening in the system as a whole. Modern devices are complex systems composed of several
specialised processing units: 3D graphics is mainly processed on a GPU, multimedia via dedicated audio
and video accelerators, signal processing by the DSP and so on. All of these processors are
interconnected via a hierarchical high-performance bus matrix. To be able to understand what really
goes on in the system it is necessary to extend tracing visibility to the whole SoC. This means being able
to track execution on other processors as well as bus
activity and events throughout the system, something that
traditional software tracing techniques do not cater for.
Software instrumentation has also limitations in respect to
providing an accurate system wide time correlation for
activities coming from all the various components in the
system.
For the kernel developer there is some level of tracing
infrastructure support, for example in the form of
prioritization and grouping when using printk
statements, and tracepoint hooks for probe functions
scattered around the kernel sources. None of this is
available to the application developer.
Hardware instruction and data tracing (e.g. with an Embedded Trace Macrocell, where every single
instruction executed and its associated data and cycle count is traced) provides very detailed information
but produce a very large amount of data for detailed analysis of shorter runs. Program flow tracing 5 Linux Trace Toolkit next generation. For more information see: http://lttng.org/.
Figure 2 - Cost vs Intrusiveness of various
tracing techniques
Copyright © 2010 ARM Limited. All rights reserved. The ARM logo is a registered trademark of ARM Ltd.
All other trademarks are the property of their respective owners and are acknowledged
Page 5 of 12
(where the behaviour of the Program Counter is tracked) has a smaller overhead but provides less
accurate information. The number of pins and the physical interface to get data off-chip can also be
critical bottlenecks. In general, as illustrated in Figure 2, there is a trade-off between how intrusive a
technique is, the accuracy and granularity of the information that can be gathered, and the associated
overheads, such as performance and resource footprint.
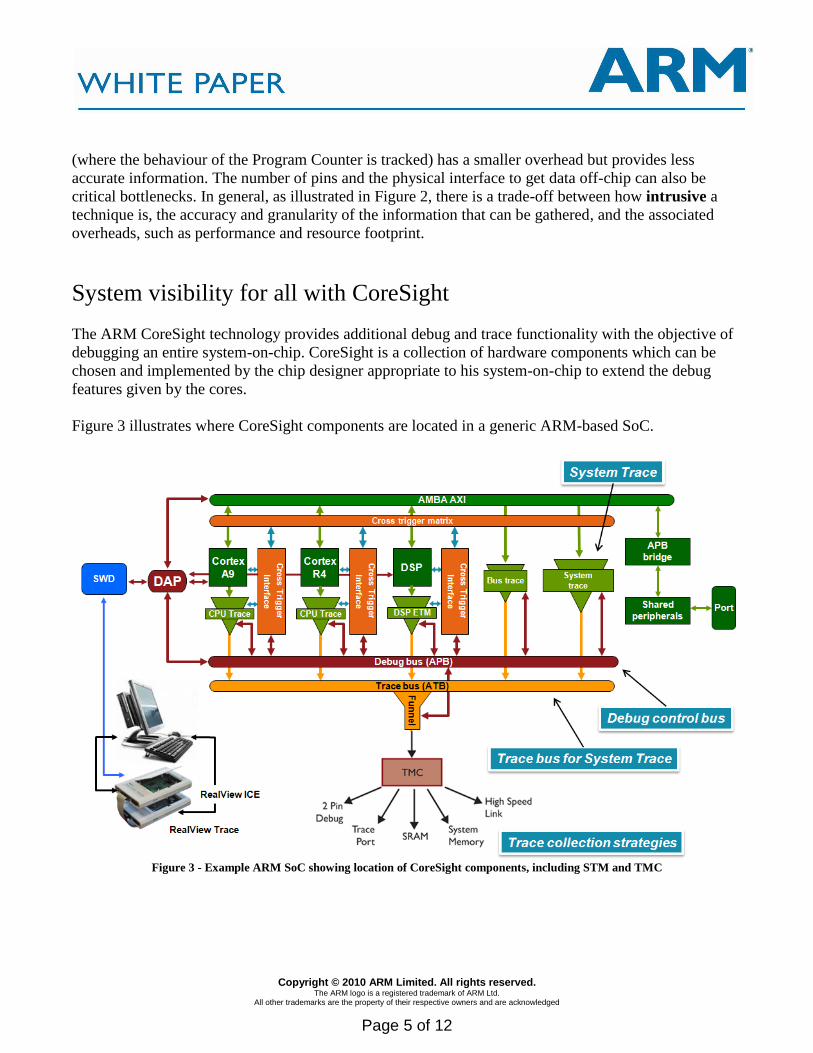
System visibility for all with CoreSight
The ARM CoreSight technology provides additional debug and trace functionality with the objective of
debugging an entire system-on-chip. CoreSight is a collection of hardware components which can be
chosen and implemented by the chip designer appropriate to his system-on-chip to extend the debug
features given by the cores.
Figure 3 illustrates where CoreSight components are located in a generic ARM-based SoC.
Figure 3 - Example ARM SoC showing location of CoreSight components, including STM and TMC
Copyright © 2010 ARM Limited. All rights reserved. The ARM logo is a registered trademark of ARM Ltd.
All other trademarks are the property of their respective owners and are acknowledged
Page 6 of 12
In a typical System-on-Chip implementation, the CoreSight6 infrastructure includes a debug subsystem
and a trace subsystem. Each processing element (DSP, CPU etc) can be paired with an instruction/data
(ETM) or program (PTM) trace IP block, enabling it to generate trace information about executed
instructions or program flow respectively. CoreSight is an open architecture, therefore third party tracing
IP blocks can be integrated in the system. Since it is not practical to have one external channel for each
trace source, CoreSight enable all trace sources to be consolidated into one stream (through the Funnel
component). The unique trace stream, marked with suitable identifiers and timestamps, can then be
duplicated at a later stage if required to be produced to different targets (a trace port, a memory buffer, a
serial wire interface, etc). A cross-triggering matrix enables events to be broadcasted throughout the
system, so that an interrupt, or signal, or breakpoint, can cause other cores to stop execution for
example. This is very valuable for interactive debug of complex multi-processor systems. Events can
also be tracked by the tracing infrastructure. Control mechanisms and busses connect the whole
infrastructure together, with the system accessible via a unique access point (Debug Access Port, or
DAP).
Improved tracing with the new CoreSight STM and TMC
In order to improve tracing capabilities in ARM based systems, the CoreSight architecture has been
extended to include two new components: the System Trace Macrocell (STM) and the Trace Memory
Controller (TMC). The STM is designed for tracing system activity from both software (using memory-
mapped stimulus ports) and hardware events. The activity observed by the STM is packaged and
delivered to a trace buffer, either on-chip or off-chip. The TMC provides a larger variation of trace
collection strategies than was previously available.
System-wide low-overhead visibility for all
The STM connects to the AXI system main bus. This provides a flexible, high bandwidth and low
latency access point that can be used by any master in the system (such as the CPU, the DMA
Controller, the GPU etc) to push tracing data through to the trace infrastructure. The STM supports time
stamping, and this enables the temporal correlation of message7 streams generated by any master both
via the PTM, ETM or even third party trace units.
Due to the reduced processing overheads of piping trace streams through dedicated hardware channels
(as opposed to using traditional software only mechanisms), it is possible to enable tracing on
production devices. Trace data can, for example, be written to volatile memory and downloaded via
wireless communication channels or serial wire debug port (which uses only two pins and is preferable
for production devices than 5 pin JTAG ports).
6 For more information of CoreSight: Debug and Trace for Multicore SoCs, whitepaper by William Orme
(http://bit.ly/9dV2a0) and ARM website product’s page (http://bit.ly/a1LCim) 7 A packet of trace data.
Copyright © 2010 ARM Limited. All rights reserved. The ARM logo is a registered trademark of ARM Ltd.
All other trademarks are the property of their respective owners and are acknowledged
Page 7 of 12
In addition to the trace streams from other processing units and the system bus (via the Bus Trace
Macrocell), it is possible to collect information about events occurring throughout the system. This
information is also globally timestamped for later correlation with all other system trace data.
The STM is driven by low level software in the same way as its predecessor, the Instrumentation Trace
Macrocell. Configuration and management is performed via writing to memory mapped registers. The
trace data is also written directly to a memory mapped peripheral. This process is abstracted from the
perspective of processor8 code via a library API. ARM has developed a Linux reference device driver,
supplied with the STM deliverables. This enables not just kernel but also application developers to
instrument trace. STM extends system wide trace visibility to all software developers. Software
developers at all levels of the stack can tune for system performance, and have visibility of the SoC
internal signals.
Superseding ITM
The STM is a natural successor to the CoreSight Instrumentation Trace Macrocell (ITM) in
mid/high-performance applications. The STM provides the following advantages over the
ITM for software instrumentation:
- A dedicated AXI slave interface for receiving instrumentation. This provides significantly lower
latency than the APB interface of the ITM, and is separate to the APB interface for programming the
STM registers.
- Multiple processors and processes can share and directly access the STM without being aware of
each other, by being allocated a different channel (aka an STM stimulus). 128 masters, each
supporting 65,536 stimulus ports, enable significant scalability, with 16 stimulus ports per 4KB
page. The ITM supports only 32 channels.
- The STM can optionally stall the AXI when its FIFO becomes full, ensuring that no data is lost
because of overflow, without having to poll the FIFO status in software. This behaviour depends on
the address written to, and can therefore be controlled by each stimulus port independently.
- An improved, configurable FIFO, supporting up to 32 words of data, reduces the likelihood of the
FIFO becoming full. The ITM has only a single word FIFO.
- Timestamping can be requested for each write independently, based on the address written to.
Bandwidth can be optimized by requesting a timestamp for only one write in a message made up of
several writes.
- Timestamps are automatically correlated with other timestamping trace sources in the CoreSight
system, enabling automatic correlation with, for example, full program trace from a PTM
The STM architecture specification provides backwards compatibility with the ARMv7-M (ARM DDI
0403 ARM ARMv7-M Architecture Reference Manual) and CoreSight ITM programmer’s models
(ARM DDI 0314 ARM CoreSight Components Technical Reference Manual). This allows for easy
transition for software written for an ARMv7-M or CoreSight ITM to be ported to this new STM.
Clearly, older software will not use the new features offered by this STM. 8 Processor can be the CPU, GPU, DSP or any other component that emits trace information.
Copyright © 2010 ARM Limited. All rights reserved. The ARM logo is a registered trademark of ARM Ltd.
All other trademarks are the property of their respective owners and are acknowledged
Page 8 of 12
The Trace Memory Controller (TMC)
The Trace Memory Controller (TMC) is designed as a successor to the CoreSight Embedded
Trace Buffer (ETB). It extends the capture of trace streams using:
- a debug interface such as 2-pin serial wire debug or JTAG
- the system memory
- the high-speed links that already exists in the System-on-Chip (SoC) peripheral as well as the
existing dedicated on-chip trace buffer or off-chip trace port interface.
The TMC can also operate as a First In First Out (FIFO) in the system. This reduces trace
overflows and the required trace port size by averaging out the trace bandwidth to reduce peaks.
The TMC has the following major configurations that are fixed when the design is integrated
into a system:
- Embedded Trace Buffer (ETB). This enables trace to be stored in a dedicated SRAM, used as a
Circular Buffer. This configuration is similar to the CoreSight ETB.
- Embedded Trace FIFO (ETF). This enables trace to be stored in a dedicated SRAM, used either as a
Circular Buffer or as a FIFO. The functionality of this configuration is a superset of the functionality
of the ETB configuration.
- Embedded Trace Router (ETR). This enables trace to be routed over an AXI bus to system memory
or to any other AXI slave.
CoreSight: The ubiquitous debug and trace architecture
When silicon vendors and OEMs choose the debug architecture for their system, they must also consider
the level of the technology’s adoption and tools support. The ARM CoreSight debug and trace is the de-
facto standard debug & trace architecture: it is adopted by major OEMs and SiPs and it is used across all
market segments. The CoreSight infrastructure is already implemented by the vast majority of market
leading platform provides, including NVIDIA (Tegra-2), Texas Instruments (OMAP4), ST-Ericsson
(U8500) and Samsung (S5PCx10).
CoreSight debug & trace is supported by ARM tools but there is also a large tool ecosystem (over 27
tool vendors, including Lauterbach, Green Hills Software, American Arium, Mentor Graphics). This
forms an implicit guarantee for SiPs and OEMs that their silicon will be supported by tool vendors.
Standardization helps rapid adoption in the industry. ARM is a leading member of the MIPI9 Test and
Debug Working Group. STM implements the newly defined System Trace Protocol (STPv2).
9 The Mobile Industry Processor Interface (MIPI) Alliance is an open membership organization that includes leading
companies in the mobile industry that share the objective of defining and promoting open specifications for interfaces inside
mobile terminals. Formed in July 2003 by ARM, Nokia, STMicroelectronics and Texas Instruments, MIPI aims to shave
complexity and costs while boosting flexibility for cell phones and the chips that drive them. http://www.mipi.org/
Copyright © 2010 ARM Limited. All rights reserved. The ARM logo is a registered trademark of ARM Ltd.
All other trademarks are the property of their respective owners and are acknowledged
Page 9 of 12
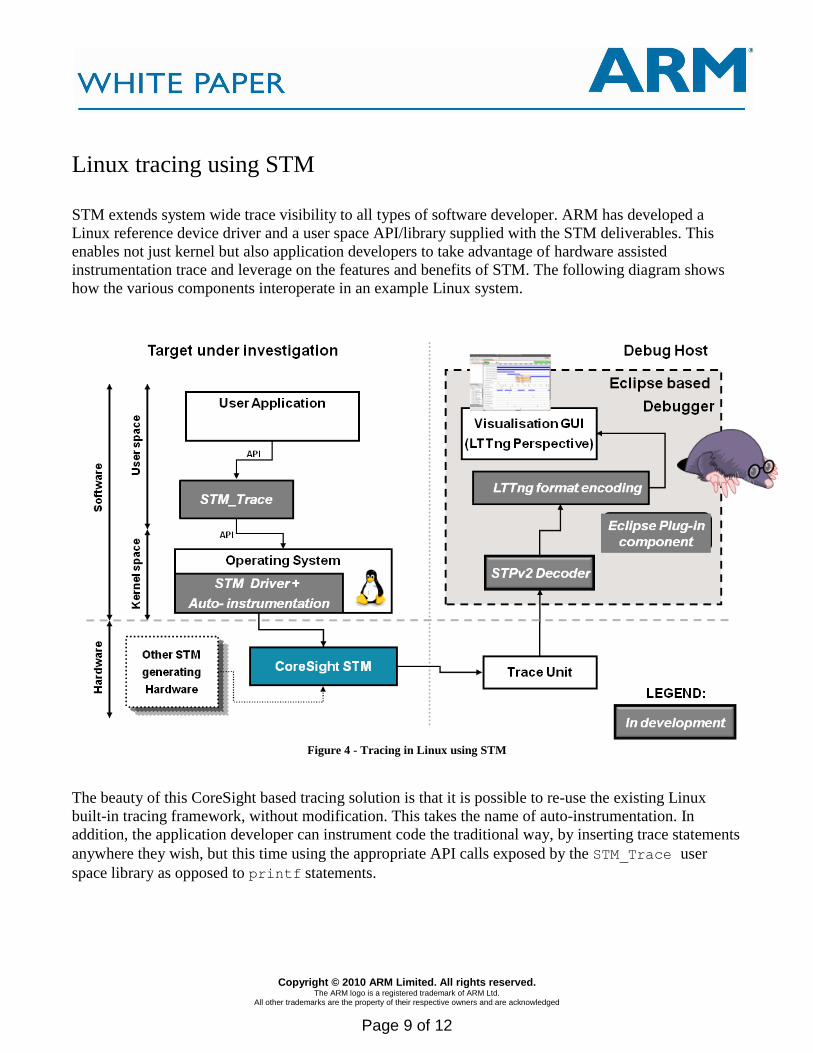
Linux tracing using STM
STM extends system wide trace visibility to all types of software developer. ARM has developed a
Linux reference device driver and a user space API/library supplied with the STM deliverables. This
enables not just kernel but also application developers to take advantage of hardware assisted
instrumentation trace and leverage on the features and benefits of STM. The following diagram shows
how the various components interoperate in an example Linux system.
Figure 4 - Tracing in Linux using STM
The beauty of this CoreSight based tracing solution is that it is possible to re-use the existing Linux
built-in tracing framework, without modification. This takes the name of auto-instrumentation. In
addition, the application developer can instrument code the traditional way, by inserting trace statements
anywhere they wish, but this time using the appropriate API calls exposed by the STM_Trace user
space library as opposed to printf statements.
Copyright © 2010 ARM Limited. All rights reserved. The ARM logo is a registered trademark of ARM Ltd.
All other trademarks are the property of their respective owners and are acknowledged
Page 10 of 12
Auto-instrumentation
The Linux kernel provides instrumentation in the form of kernel Tracepoints10
. These are hooking
mechanisms that provide static instrumentation that can be enabled at runtime, and have a very small
footprint when disabled. The main consumer of Tracepoints is the LTTng framework, but custom probes
can also be attached to them. There are over 150 of these instrumentation points across the Linux kernel,
mainly in critical areas such as the scheduler, the memory manager, file system, entry/exit of interrupt
routines and system calls. Simply by enabling the provided STM Linux driver and the Linux tracing
infrastructure, all of this information is sent to the STM hardware. Markers/Tracepoints can be grouped
into subsystems, and the supplied supporting API allows for each subsystem’s trace to be sent over a
specific STM channel. STM channels are dynamically allocated to each kernel subsystem.
Application tracing
The application developer must define templates for trace statements that can then be used when
performing the actual instrumentation of the application code. These templates are known as Tracers,
and work very similarly to printf routines, in that they consist of a text string and placeholders for
data variables. Tracers can be grouped together into trace producer subsystems: each subsystem trace
stream can then be allocated to a single STM channel. This classification is arbitrary, the programmer’s
decision, and it is possible to ignore by using a single global subsystem or trace channel.
The STM Trace API is very easy to use. The following is an example of instrumenting an MP3 player
application. An MP3 playback application using hardware acceleration can, very infrequently, drop
frames. This happens if the decoding is not accomplished by the set deadline. It is not possible to debug
this behaviour using traditional debugging tools and mechanisms: the application must be analysed at
runtime, the codec is implemented in hardware and there is no correlation between user, kernel and
hardware events. CoreSight addresses all of these limitations by enabling the runtime tracing and
correlation of hardware events and auto-tracing (if enabled). The supplied user space library API enables
the developer to also instrument the user application, complementing the available information.
In order to instrument the application code, the programmer needs to proceed as follows. The first step is
to define a handler for the trace stream producer:
Then, in the appropriate location in the application code, the programmer needs to initialize the Tracer:
10
There is also a variant of Tracepoints, known as Markers, that enables the direct generation of LTTng events from printf-
like functions.
static unsigned long mp3_decode_tracer;
Copyright © 2010 ARM Limited. All rights reserved. The ARM logo is a registered trademark of ARM Ltd.
All other trademarks are the property of their respective owners and are acknowledged
Page 11 of 12
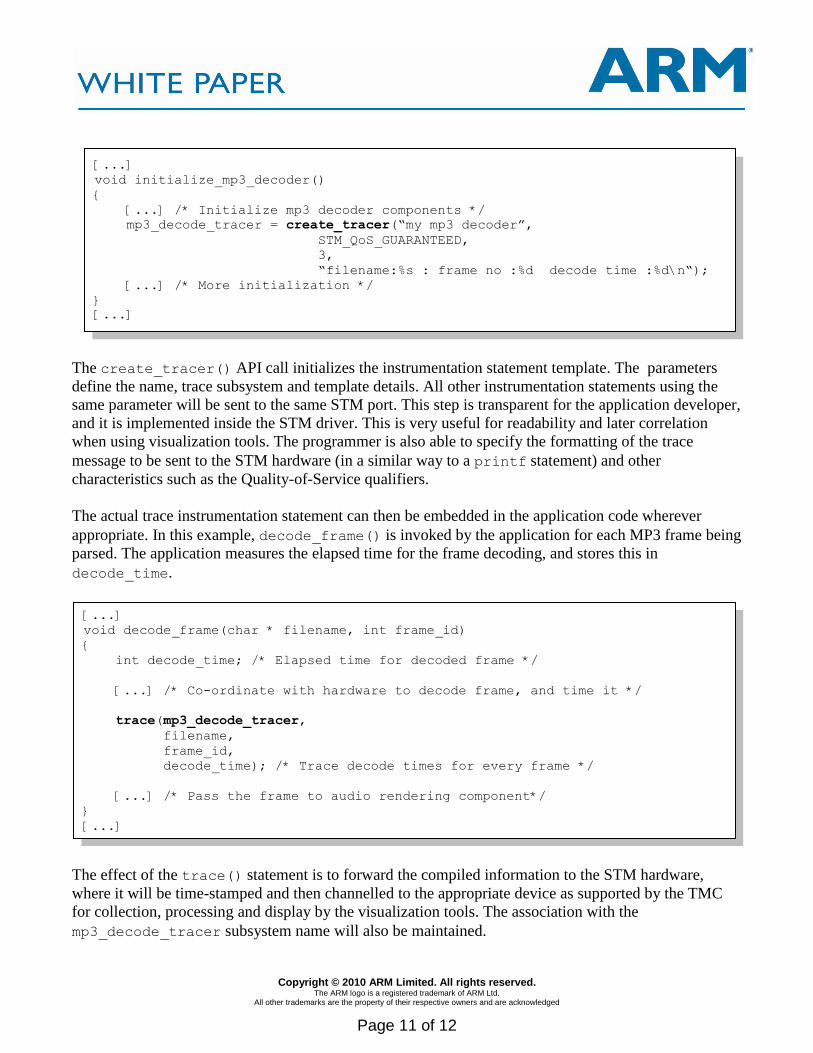
The create_tracer() API call initializes the instrumentation statement template. The parameters
define the name, trace subsystem and template details. All other instrumentation statements using the
same parameter will be sent to the same STM port. This step is transparent for the application developer,
and it is implemented inside the STM driver. This is very useful for readability and later correlation
when using visualization tools. The programmer is also able to specify the formatting of the trace
message to be sent to the STM hardware (in a similar way to a printf statement) and other
characteristics such as the Quality-of-Service qualifiers.
The actual trace instrumentation statement can then be embedded in the application code wherever
appropriate. In this example, decode_frame() is invoked by the application for each MP3 frame being
parsed. The application measures the elapsed time for the frame decoding, and stores this in
decode_time.
The effect of the trace() statement is to forward the compiled information to the STM hardware,
where it will be time-stamped and then channelled to the appropriate device as supported by the TMC
for collection, processing and display by the visualization tools. The association with the
mp3_decode_tracer subsystem name will also be maintained.
[...]
void initialize_mp3_decoder()
{
[...] /* Initialize mp3 decoder components */
mp3_decode_tracer = create_tracer(“my mp3 decoder”,
STM_QoS_GUARANTEED,
3,
“filename:%s : frame no :%d decode time :%d\n“);
[...] /* More initialization */
}
[...]
[...]
void decode_frame(char * filename, int frame_id)
{
int decode_time; /* Elapsed time for decoded frame */
[...] /* Co-ordinate with hardware to decode frame, and time it */
trace(mp3_decode_tracer,
filename,
frame_id,
decode_time); /* Trace decode times for every frame */
[...] /* Pass the frame to audio rendering component*/
}
[...]
Copyright © 2010 ARM Limited. All rights reserved. The ARM logo is a registered trademark of ARM Ltd.
All other trademarks are the property of their respective owners and are acknowledged
Page 12 of 12
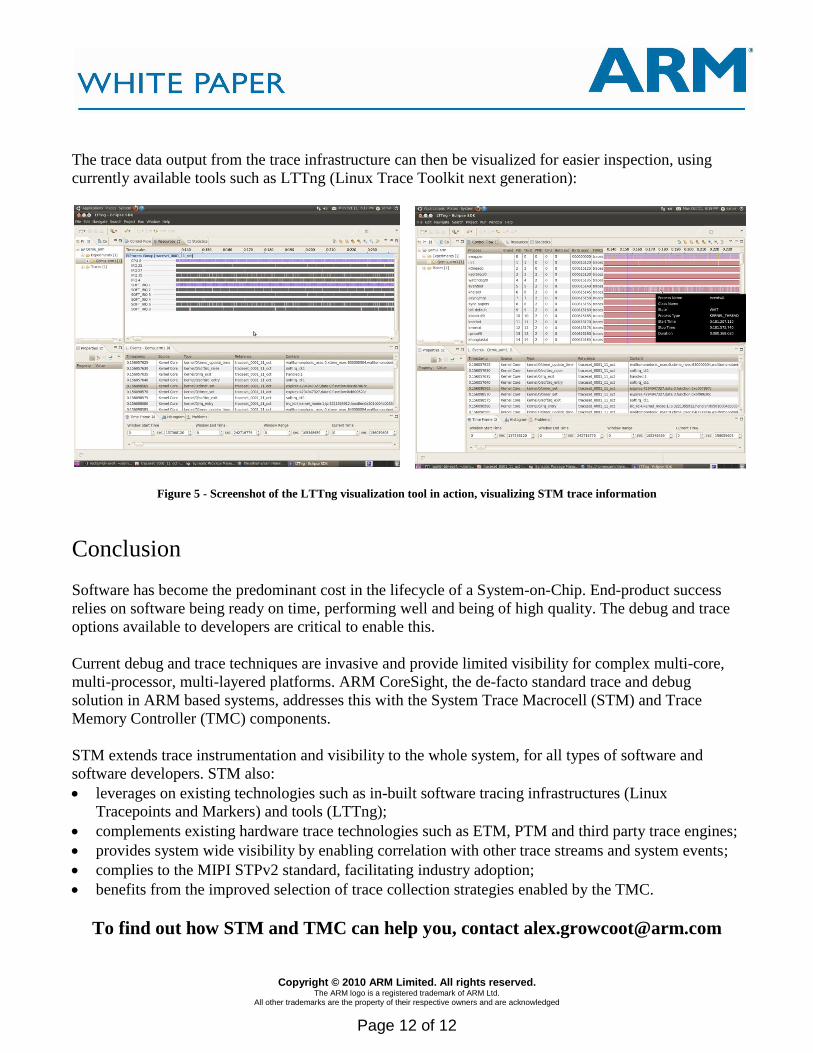
The trace data output from the trace infrastructure can then be visualized for easier inspection, using
currently available tools such as LTTng (Linux Trace Toolkit next generation):
Figure 5 - Screenshot of the LTTng visualization tool in action, visualizing STM trace information
Conclusion
Software has become the predominant cost in the lifecycle of a System-on-Chip. End-product success
relies on software being ready on time, performing well and being of high quality. The debug and trace
options available to developers are critical to enable this.
Current debug and trace techniques are invasive and provide limited visibility for complex multi-core,
multi-processor, multi-layered platforms. ARM CoreSight, the de-facto standard trace and debug
solution in ARM based systems, addresses this with the System Trace Macrocell (STM) and Trace
Memory Controller (TMC) components.
STM extends trace instrumentation and visibility to the whole system, for all types of software and
software developers. STM also:
leverages on existing technologies such as in-built software tracing infrastructures (Linux
Tracepoints and Markers) and tools (LTTng);
complements existing hardware trace technologies such as ETM, PTM and third party trace engines;
provides system wide visibility by enabling correlation with other trace streams and system events;
complies to the MIPI STPv2 standard, facilitating industry adoption;
benefits from the improved selection of trace collection strategies enabled by the TMC.
To find out how STM and TMC can help you, contact [email protected]