beyond attendance: a multi-modal understanding of arts participation
TRANSCRIPT

National Endowment for the Arts
Beyond attendance: A multi-modal understanding of arts participation
Jennifer L. Novak-Leonard and Alan S. Brown, WolfBrown


National Endowment for the Arts
Beyond attendance: A multi-modal understanding of arts participation
Jennifer L. Novak-Leonard and Alan S. Brown, WolfBrown
Based on the 2008 Survey of Public Participation in the Arts

Research Report #54
February 2011
National Endowment for the Arts 1100 Pennsylvania Avenue, NW Washington, DC 20506-0001 Telephone: 202-682-5400
Prepared for the Office of Research & Analysis by Jennifer L. Novak-Leonard and Alan S. Brown, WolfBrown
Produced by the Office of Research & Analysis Sunil Iyengar, Director Tom Bradshaw, Senior Research Officer Sarah Sullivan, Senior Program Analyst
Other staff contributors: Bonnie Nichols, Ellen Grantham, Patricia Shaffer, and Nona Milstead
Designed by Roman/Thayer Design Inc.
Front Cover Photo: Students at the Bates Dance Festival in Lewiston, Maine, perform in Stephan Koplowitz’s The Atrium Project. Photo by Phyllis Graber Jensen
Printed in the United States of America
Library of Congress Cataloging-in-Publication DataNovak-Leonard, Jennifer L. (Jennifer Leigh), 1977- Beyond attendance : a multi-modal understanding of arts participation / submitted by Jennifer L. Novak-Leonard & Alan S. Brown. p. cm. -- (Research report ; #54) Includes bibliographical references and index. 1. Arts--United States--Citizen participation--Statistics. 2. Arts audiences--United States--Statistics. 3. Arts surveys--United States. I. Brown, Alan S. (Alan Stuart), 1960- II. National Endowment for the Arts. III. Title. NX230.N38 2011 700.973’09051--dc22 2011004097
Available after February 24, 2011, in the PDF version of the report at www.arts.gov.
202-682-5496 Voice/TTY (a device for individuals who are deaf or hearing-impaired)
Individuals who do not use conventional print materials may contact the Arts Endowment’s Office for AccessAbility at 202-682-5532 to obtain this publication in an alternate format.
This publication is available free of charge at www.arts.gov, the website of the National Endowment for the Arts.
The authors wish to thank Aimee Fullman for serving as an early reviewer and contributing to this monograph’s initial shape.

CHAIRMAN’S NOTE
“Art works.” Those two words — with their three meanings — are perhaps the simplest and clearest declaration of what we are about at the National Endowment for the Arts. They first refer to works of art themselves, to the creations of artists. They also remind us that art works on audiences, to comfort, challenge, and inspire us. And finally, they are a bold reminder of the artists and arts workers across this country who earn wages, pay taxes, and contribute toward our country’s economy.
Our 2008 Survey of Public Participation in the Arts seems to report that art is working for fewer Americans, a finding that is deeply disturbing to all of us who care about the arts in our country. It reports a 5 percentage point decline in arts participation by Americans.
But as I have been traveling across this country, those findings did not ring true with what I was seeing: young people signing on to Pandora and plugged into all manner of mp3 players; people of all ages watching Dancing with the Stars and So You Think You Can Dance; the prevalence of etsy.com and the quarter of a million military families who visited one of our 920 Blue Star Museums over 4 months this summer; the Kindles and Nooks in front of every airport passenger; Netflix and YouTube allowing all manner of film and media, past and present, to be consumed anywhere. And how about Glee?
I am witness to a voracious American appetite for the arts that does not seem to track with a decline in arts participation. Luckily, Sunil Iyengar, our director of research and analysis, had the foresight to commission a series of deeper looks at this data, and asked fellow researchers to interrogate this data about the roles that technology, arts education, age, and personal arts creation play in American arts participation.
Each of these reports individually expands and shades our understanding of the arts participation numbers. Collectively they report that one factor, above all others, is the prime indicator of arts participation — a factor not surprising to any Glee-ks:
Arts education in childhood is the most significant predictor of both arts attendance and personal arts creation throughout the rest of a person’s life.
All of us who care about the arts in this country have to care about arts education, about exposing young people, early and often, to the arts in rich, rigorous, and repeated ways. That is largely why, over the past year, we funded arts education projects in every Congressional district in America.
The reports on technology and personal creation greatly expand our institutional understanding of meaningful arts participation.
And the report on age shows that it’s not the audiences who are graying, it’s our country: the age distribution of audiences generally mirrors the adult population of the United States. Baby Boomers continue to dominate audiences, just as we did in the 1980s, when we were among the youngest audience members.
Taken together, the 2008 Survey of Public Participation in the Arts with its follow-up reports, present the most nuanced understanding of arts participation that the NEA has yet presented. I am pleased to share these reports with you, and proud of the way we are expanding our understanding of how art works in America.
Rocco Landesman Chairman National Endowment for the Arts
Photo by Michael Eastman

National Endowment for the Arts6
“Professional arts programs cannot be sustained without a constituency that actively engages in other forms of cultural practice.”
– Jennifer L. Novak-Leonard and Alan Brown

TABLE OF CONTENTS
11 PREFACE
15 EXECUTIVE SUMMARY
21 INTRODUCTION 21 Data and Analysis Methods 22 Organization of the Report
25 CHAPTER 1. CONTEXT 26 “Arts Participation:” Defining a Central Term 26 Measuring “Arts Participation” 27 Cultural Ecology 33 Considerations of Policy and Practice throughout this Report
37 CHAPTER 2. A LOOK WITHIN THE MODES OF PARTICIPATION 37 Mode of Participation: Attendance 45 Mode of Participation: Arts Creation 52 Mode of Participation: Electronic Media-Based
59 CHAPTER 3. A LOOK BETWEEN MODES: ATTENDANCE AND ARTS CREATION 59 Rates 60 Arts Lessons 61 Civic and Social Engagement 61 Rates Within Disciplines 63 Rates Across Disciplines 65 Effect of Attendance on Rates of Arts Creation 65 Effect of Arts Creation on Rates of Attendance 67 Exploratory Factor Analysis
71 CHAPTER 4. THE RELATIONSHIP OF ELECTRONIC MEDIA-BASED PARTICIPATION TO ATTENDANCE AND ARTS CREATION
71 Rates 71 Rates Within Disciplines (Participation via Recordings or Broadcasts) 73 Rates Within Disciplines (Exclusively Online Participation) 74 Ratios Across Disciplines
77 CHAPTER 5. HOW THE THREE MODES INTERSECT 80 Distribution of Modal Participation Rates, by Discipline
83 CHAPTER 6. WHERE DO WE GO FROM HERE? 83 Implications for Practice 86 Implications for Research 89 Implications for Policy
93 RECOMMENDED SOURCES
97 TECHNICAL APPENDIX

LIST OF TABLES
38 Table 1: Percentage of U.S. adults reporting arts attendance in the past 12 months: 1982, 1992, 2002, and 2008 39 Table 2: Distribution of U.S. adults’ self-reported race/ethnicity: 2008 40 Table 3: U.S. adults’ arts attendance rates between May 2007–May 2008, by demographic group 44 Table 4: Marginal impact of demographics on U.S. adults’ likelihood of arts participation via attendance: 2008 45 Table 5: Factor analysis results for arts attendance activities: 2008 46 Table 6: Rates of U.S. adult participation in arts creation activities: 1992, 2002, 2008 48 Table 7: U.S. adult participation rates in arts creation activities, by demographic group: 2008 50 Table 8: Marginal impact of demographics on U.S. adults’ likelihood of participating via arts creation: 2008 51 Table 9: Factor analysis results for arts creation activities: 2008 54 Table 10: Rates of U.S. adult participation in electronic media and internet arts activities, by demographic
group: 2008 56 Table 11: Marginal impact of demographics on U.S. adults’ likelihood of participating via broadcasts or
recordings of artworks or art programs: 2008 61 Table 12: Rate of U.S. adult participation in civic and social activities, by mode of arts participation cohort:
2008 63 Table 13: Percentage of U.S. adults who report arts attendance that participate in arts creation activities,
by disclipline: 2008 64 Table 14: Percentage of U.S. adults who report arts creation that participate via arts attendance,
by discipline: 2008 67 Table 15: Odds of U.S. adults’ participation via attendance and arts creation, by discipline: 2008 68 Table 16: Factor analysis results for arts attendance and arts creation activities: 2008 78 Table 17: Distribution of U.S. adult participation rates across modes, by demographic group: 2008 79 Table 18: Demographic distribution of modal participation rates: 2008

LIST OF FIGURES
16 Figure A: A multi-modal distribution of U.S. adults’ arts participation rates: 2008 17 Figure B: A multi-modal distribution of U.S. adults’ arts participation rates, by artistic discipline: 2008 27 Figure 1: Cultural ecology framework 32 Figure 2: Five modes of arts participation framework 52 Figure 3: Percentage of U.S. adults who accessed artistic content via recorded or live arts broadcasts: 2008 59 Figure 4: Distribution of U.S. adults, based on participation in arts attendance and arts creation: 2008 60 Figure 5: Trend analysis of the distribution of U.S. adults based on participation in arts attendance and
arts creation: 1992, 2002, and 2008 60 Figure 6: Comparative rates of arts attendance and creation among adults who did or did not take arts classes
or lessons: 2008 62 Figure 7: Distribution of U.S. adults, based on participation in arts attendance and arts creation,
by discipline: 2008 65 Figure 8: Comparative rates of arts creation, by discipline, among adults who did or did not attend any
arts activities: 2008 65 Figure 9: Comparative rates of arts attendance, by discipline, among adults who did or did not create
artwork: 2008 72 Figure 10: Distribution of U.S. adults, based on arts participation via attendance and viewing and/or listening to
arts recordings or broadcasts, by discipline: 2008 73 Figure 11: Distribution of U.S. adults, based on participation via arts creation and/or viewing and/or listening
to recordings or broadcasts, by discipline: 2008 73 Figure 12: Distribution of U.S. adults, based on participation via arts attendance and/or accessing the
arts online: 2008 74 Figure 13: Distribution of U.S. adults, based on participation via arts creation and accessing the arts online:
2008 74 Figure 14: Comparative rates of arts attendance among adults who did or did not experience arts broadcasts or
recordings: 2008 77 Figure 15: A multi-modal distribution of U.S. adults’ arts participation rates: 2008 80 Figure 16: U.S. adults’ modal participation rates across artistic disciplines: 2008 81 Figure 17: A multi-modal distribution of U.S. adults’ arts participation, by discipline: 2008 92 Figure 18: Cultural ecology framework

National Endowment for the Arts10

11Beyond attendance: A multi-modal understanding of arts participation
PREFACE
The National Endowment for the Arts’ Survey of Public Participation in the Arts (SPPA) is the nation’s largest periodic survey of adult involvement in arts and cultural activities. For more than a quarter-century, since the survey was first conducted, researchers at the Arts Endowment have issued summary reports and key findings to the public. In addition to reporting the survey results as a whole, the NEA has made the data files available to other arts and cultural researchers for their own analyses and publications.1
The 2008 SPPA provided a fascinating glimpse into changing patterns of arts participation. Since the prior survey period of 2001–2002, rapid advances in technology had enabled more access to arts events and arts creation through portable devices and the Internet. Also, in 2007–2008, many representatives of Gen Y (or the “Millennials”) — the second largest generation since the Baby Boomers — became eligible for taking the survey.
These factors alone would have made the 2008 SPPA data an attractive prospect for researchers. But in still other ways the 2007–2008 survey year marked an aberration. For the first time since 1982, attendance rates declined for virtually all art forms captured by the survey; also for the first time, many of those declines occurred for adults 45 years or older — an age group that historically has accounted for the largest share of arts audiences.
Therefore, even before the 2008 SPPA results had been announced, the NEA posted the survey data online, to allow researchers to conduct their own analyses. The NEA also commissioned reports on five cross-cutting topics: media and technology, arts education, arts creation, age, and race and ethnicity.2
Results from the study of media, technology, and arts participation appeared in June 2010.3 For the remaining topics, the NEA was fortunate to obtain the services of four researchers or research teams already renowned for their work in characterizing trends in arts participation. Those researchers included Mark Stern, University of Pennsylvania, and separate teams at WolfBrown and the National Opinion Research Center (NORC) at the University of Chicago.
Each of these researchers has added a vitally new dimension to the NEA’s official summary of the 2008 data, as published in 2009.4 This report, one of three to become available in 2011, is a direct result of their efforts.
In their analysis, NORC researchers Nick Rabkin and Eric Hedberg test and ultimately confirm the validity of an assumption made with prior SPPA data, that participation in arts lessons and classes is the most significant predictor of arts participation later in life, even after controlling for other variables. They also show that long-term declines in Americans’ reported rates of arts learning align with a period in which arts education has been widely acknowledged as devalued in the public school system. Nor are the declines distributed equally across all racial and ethnic groups.
Working along quite different lines, Mark Stern similarly concludes that arts education is the most important known factor in influencing arts participation trends. But he is much more skeptical about the impact of other variables, especially age. Practically since the SPPA began, in 1982, there has been much talk about the “graying” of arts audiences. And while it is certainly true that the audiences
12 National Endowment for the Arts
for many art forms tracked by the SPPA are aging more rapidly than the U.S. population, Stern brings out the sobering fact that age and generational cohort differences account for less than 1 percent of the variance in the total number of arts events that Americans attended over the period of 1982–2008. Observing that arts attendance may be far less dependent on age than usually considered, he gives the lie to the notion of “demographic destiny” when it comes to arts engagement.
Based on their own analysis of the SPPA data, Jennifer Novak-Leonard and Alan Brown advance a “multi-modal” framework for understanding arts participation. Novak-Leonard and Brown challenge the orthodoxy of representing overall participation rates merely as a function of visual or performing arts attendance. They suggest that a more expansive benchmarking system — one accounting for participation across three modes (arts creation or performance; arts engagement through media; and attendance at a broader array of activities) — would produce more relevant results for arts funders, arts managers, and the general public.
The NEA’s Office of Research & Analysis already has begun to incorporate the ideas of these report-writers into its deliberations about the future of the SPPA. The authors offer three distinctive takes on a federal data source which, since 1982, has shaped much of the conversation about how arts and cultural policies and programming can engage audiences more effectively. By supporting independent research of this type, we hope to broaden the scope of that conversation.
Sunil Iyengar Director, Research & Analysis National Endowment for the Arts

13Beyond attendance: A multi-modal understanding of arts participation
NOTES1 For example, see the National Endowment for the Arts website,
Supplementary Materials Related to the NEA’s 2008 Survey of Public Participation in the Arts, www.nea.gov/research/SPPA/index.html.
2 The report on race/ethnicity and arts participation is still in progress. Authored by Vincent Welch, et al. of the National Opinion Research Center (NORC), it will be made available via the NEA website in 2011.
3 This report was published in multi-media and PDF versions as Audience 2.0: How Technology Influences Arts Participation, based on research by Sameer Bawa, Kevin Williams, and William Dong, BBC Research & Consulting. Audience 2.0, Research Report #50 (Washington, DC: National Endowment for the Arts, 2010), available online, www.nea.gov/research/ResearchReports_chrono.html.
4 See 2008 Survey of Public Participation in the Arts, Research Report #49 (Washington, DC: National Endowment for the Arts, 2009), available online, www.nea.gov/research/2008-SPPA.pdf. The Executive Summary of that data appeared as Arts Participation 2008: Highlights from a National Survey (Washington, DC: National Endowment for the Arts, 2009), available online, www.nea.gov/research/NEA-SPPA-brochure.pdf.
National Endowment for the Arts14
Arts participation can be understood as occurring in multiple modes, sometimes overlapping: arts attendance, personal creation and performance, and arts participation through electronic media.

15Beyond attendance: A multi-modal understanding of arts participation
EXECUTIVE SUMMARY
First conducted in 1982, the NEA’s Survey of Public Participation in the Arts (SPPA) serves as the longest-standing resource for studying U.S. adult levels of arts attendance, personal arts creation and performance, and arts participation through electronic media. The SPPA evolved from the need to establish a consistent baseline for quantifying arts audiences nationwide (DiMaggio, Useem, and Brown, 1978). It also evolved from the need to collect better information about those audiences, in keeping with the NEA’s programmatic and policy priorities at the time of the survey’s development (Tepper and Gao, 2008).5 Today, SPPA-based information about arts attendance continues to provide the nonprofit arts sector with useful, reliable information about Americans’ rates of participation in live arts events.
The environment in which arts organizations function has changed dramatically in the 29 years since the first SPPA. Alternatives for arts and entertainment activities have proliferated, and expectations for personalization and individual control over those experiences have increased. The proliferation of new technologies for interacting with digital content is occurring at a heightened pace, while the nation’s demographic characteristics grow increasingly diverse.
For arts funders and grantee organizations alike, conferences and meetings have tended to focus on adapting to this new environment. Such discussions often lead to debates over what “arts participation” is and how arts organizations might best channel the myriad pathways through which Americans now engage in artistic and creative expression.
Those pathways are blurring in several important respects. The evolution of art forms themselves is inevitable and this evolution is rapidly underway with the introductions of new or blended forms that infuse technology, different cultural traditions, and elements of multiple art disciplines. Similarly, the settings in which Americans choose to engage in arts activities have long expanded well beyond purpose-built arts facilities, moving into bookstores, community centers, schools, places of worship, and especially the home. The nonprofit arts and cultural sector has grown accustomed to these shifting boundaries of participation — a realization that takes in a larger swatch of the “cultural ecology,” including professional arts, personal participatory practice, and cultural literacy (Kreidler and Trounstine, 2005).
Using SPPA data from 1982–2008, this monograph explores the breadth of participation within and between three primary categories, or “modes,” of arts activities: arts attendance, personal arts creation and performance, and arts participation through electronic media.6 In addition, the monograph offers a unique context for understanding arts participation, suggesting that a more expansive framework for the cultural ecology is needed, and discusses implications of the SPPA data and other trends for practice, policy, and future research.

16 National Endowment for the Arts
SUMMARY OF FINDINGS AND IMPLICATIONSFour key contextual factors emerge from the current literature and research; they are crucial to a more comprehensive understanding of arts participation. These four factors are 1) the skill level of the artist or participant, 2) the form of artistic expression, 3) the setting in which the activity occurs, and 4) the degree to which the individual exercises creative control over the activity.
Modal patterns of arts participation
■ Arts participation can be understood as occurring in multiple modes, sometimes overlapping: arts attendance, personal creation and performance, and arts participation through electronic media. The absolute levels of participation within each mode, and the relative extent of overlap in arts participation across the modes, supports this multi-modal theory.
■ When we expand the scope of activities counted in “arts attendance,” for example, we find that 74% of U.S. adults reported having participated in the arts via at least one of three modes. U.S. adults participate in each of the three modes at approximately the same rate (50%). Meanwhile, approximately the same portion of U.S. adults (26%) participated in all three modes as did in none of the three modes (26%).7
■ Approximately 23% of U.S. adults participate in the arts, but do not attend. This figure does not account for the reading of literature as a form of arts participation. (See Figure A.)
■ Rates of aggregate arts attendance have declined significantly from 2002, when 39.5% of adults reported attending at least one “benchmark” arts event in the prior 12 months. In 2008, the attendance rate was 34.6% over the same period.8 Adult rates of aggregated arts creation have remained stable (42.2% in 2002, 41.1% in 2008). However, rates for both aggregate measures in attendance and arts creation declined from 1992 to 2002.9,10
■ Data underscore the relationship between having had arts lessons and participating in all modes of arts activities as an adult. Specifically, having had any arts lessons increases the likelihood of arts creation by 32%, increases the likelihood of media-based arts participation by 33%, and increases the likelihood of arts attendance by 29%, after controlling for demographics variables.
■ Over half of U.S. adults participate in some way in music (52.6%) and in visual arts (51.7%). Adult participation rates in theater (29.8%) and dance (16.0%) are substantially lower. (See Figure B.)
■ The vast majority of participation in theater and visual arts is through attendance, whereas the majority of participation in music and dance occurs via electronic media.
FIGURE AA multi-modal distribution of U.S. adults’ arts participation rates: 2008
Attendance8%
Creation6%
Media-based participation10%
No participation26%
7%
7%10%
All modes26%
In Percentages of U.S. Adults

17Beyond attendance: A multi-modal understanding of arts participation
Arts attendance
■ Data suggest that the form of artistic expression and the setting in which it occurs are two contextual factors that influence who participates. For example, respondents who self-identified as African American were significantly more likely than other racial/ethnic groups to report attendance at religious institutions, and their highest rate across the creative activities was reported for “singing in a chorale, choir, or glee club or other type of vocal group.” The disparities between rates of attendance for non-benchmark activities tend to be smaller between whites and other racial/ethnic groups compared to the disparities in the “benchmark” arts attendance rates.
■ Art or craft fairs and festivals, and other outdoor festivals that feature performing artists, attract notably different people than benchmark arts activities; overall, these activities produce some of the highest rates of attendance on record in the SPPA. Given their popularity, these activities appear to play a central role in the landscape of arts participation, especially for Americans of color.
■ Community venues (schools and religious institutions) play a major role in the cultural lives of Americans as settings for arts activities. The rates of attendance at these types of venues were among the highest for any individual arts-attendance activity reported between May 2007 and May 2008.
■ Demographic variables, including race/ethnicity, age, educational attainment, family income, and others, explain less than 20% of the variation in attendance rates at arts events.
Personal arts creation and performance
■ Arts-creation activities are embedded in the lives of Americans, and vary by racial/ethnic group. For example, American Indians and people of two or more races tend to create “pottery, ceramics, jewelry, or any leatherwork or metalwork” at higher rates than other racial/ethnic groups. Furthermore, arts-creation activities generally appeal to younger adults. Conversely, older adults’ creative participation wanes sharply (with the exception of stitchery), which raises a policy issue as to what incentives can be effected to foster programs and activities designed to keep older Americans engaged in arts creation, especially in the context of life-long learning opportunities.
■ After controlling for the respondent’s history of taking arts lessons, the role of demographic characteristics diminishes. In 2008, SPPA respondents with any history of arts lessons were, on average, 32% more likely than those without any arts lessons to participate in arts-creation activities. In addition to arts lessons, two demographic characteristics significantly predict the likelihood that someone participates in arts creation: females (15% more likely than males to participate), and people living in metropolitan areas (10% less likely to participate in arts creation).
EXEC
UTIV
E SU
MM
ARY
FIGURE BA multi-modal distribution of U.S. adults’ arts participation rates, by artistic discipline: 2008
Perc
enta
ge o
f U.S
. adu
lts
0%
10%
20%
30%
40%
50%
60%
70%
80%
90%
100%
Via recordings or broadcasts onlyAttended and via recordings or broadcastsAttended onlyAttended and created
Created onlyCreated and via recordings or broadcastsCreated, attended, and via recordings or broadcasts
Visual (51.7%)Dance (16.0%)Theater (29.8%)Music (52.6%)
25.9%
21.1%
19.7%
5.3%
10.0%
7.0%
11.1%
53.5%
19.8%
22.1%
36.2%
10.7%
11.6%
24.8%
11.9%
15.9%
6.0%
19.2.0%
14.4%
34.6%
2.7%
6.7%
3.3%2.1%1.3%
1.9% 1.0%0.4%
In percentages of U.S. adults
Note: The rate of U.S. adult participation in the discipline is included in the column labels. The columns themselves demonstrate the distribution of rates across each participation mode within the discipline.
18 National Endowment for the Arts
Electronic media-based participation
■ Approximately 15% of adults in the U.S. participate in the arts via electronic media only.
■ Broadcasts and recordings reach a large and distinct segment of the American population that does not attend live performances. For example, 26% of those who participate at all in music activities do so via recordings or broadcasts only. Americans with lower incomes and lower levels of educational attainment are more likely to participate via broadcasts and recordings, suggesting the vital role that these distribution channels play in making the arts accessible to more Americans.
■ “Audiences” for dance and music are largely comprised of adults who do not attend, but access the art form via live or recorded broadcasts.
This monograph invites discussion about how people engage in the arts (through multiple modes of participation) and what those patterns of participation across modes imply for arts and cultural organizations, and for broader policy decisions and investments.
In planning for the first SPPA in 1982, one of the 10 key policy questions was, “How is amateur participation related to attendance?” (NEA, 1995) While the framing language may have changed over the years, the question remains as essential as ever. The need to know more about the inventive and imaginative arts activities of Americans, and the connections between these activities and other forms of participation, are not new (Cwi, ed., 1977), but are perhaps more urgent than before, given the dramatic societal changes the U.S. has seen in terms of shifting demographics, evolving cultural tastes, and new technological opportunities. Aligning cultural policy and practice with a fuller understanding of how Americans engage with culture is a necessary step toward a more vibrant arts ecology.

19Beyond attendance: A multi-modal understanding of arts participation
NOTES5 Beginning in the 1960s, the nonprofit arts business model
boomed, fuelled in part by a surge in public funding for these organizations. See Arts and Culture in the Metropolis: Strategies for Sustainability, Kevin F. McCarthy, Elizabeth Heneghan Ondaatje, and Jennifer L. Novak (Santa Monica, CA: RAND, 2007); and “Leverage Lost: The Nonprofit Arts in the Post-Ford Era,” John Kreidler, in The Journal of Arts Management, Law and Society 26, no. 2 (1996): 79–100.
6 For the purpose of this report, arts education was not treated as a separate “mode” of arts participation. The three principal modalities of participation discussed in the monograph are: arts attendance, creation, and media-based participation. Arts education, as captured in the SPPA, is difficult to view as a distinct modality because it spans both attendance- and media-based participation (e.g., music appreciation and art appreciation/history) and more inventive/interpretive modes of participation (e.g., music lessons or classes, and dance lessons or classes). Further, by treating arts education outside our tri-modal framework, we could better test its influence on rates of attendance and arts creation. (See also the NEA’s Arts Education in America: What the Declines Mean for Arts Participation, Nick Rabkin and Eric C. Hedberg.)
7 These aggregate measures of arts participation are described in Chapter 4. See the Technical Appendix for specific variables used.
8 “Benchmark” activities include: attendance at a live jazz performance, a classical music performance, a live opera, a live musical stage play, a live performance of a non-musical stage play, a live ballet, and a visit to an art museum or gallery.
9 Throughout this monograph, multi-year analyses contain only a subset of activities captured in the 2008 survey due to differences between SPPA waves. Hence, the percentages reported in this bullet differ from those reported in Figure A. See the Technical Appendix for details on which variables from the longitudinal analyses are included in this report.
10 Difference in question-wording across SPPA waves does not allow longitudinal analysis of electronic media-based participation.
EXEC
UTIV
E SU
MM
ARY

National Endowment for the Arts20
What are the implications for policy and practice of embracing a broader definition of arts participation?
21Beyond attendance: A multi-modal understanding of arts participation
INTRODUCTION
The NEA’s report 2008 Survey of Public Participation in the Arts (Research Report #49) contributes to a growing body of literature and the experiences of arts professionals that have affirmed a long-term decline in arts attendance. Should policymakers be concerned? Does the decline in attendance signal a broader cultural shift away from the arts, or are Americans engaging in other forms of artistic expression? Conversations about the decline in attendance raise fundamental questions about the definition of arts participation — for example, what counts and what does not, and what conceptual models should be used to take stock of arts participation, cultural engagement, and creative vitality?
“Arts participation” includes more possibilities than attendance alone. How many Americans make art? How many Americans engage with art online? The NEA’s Survey of Public Participation in the Arts (SPPA) captures data on three modes of arts participation essential to the health of the overall arts ecology — attendance, personal arts creation, and electronic media-based arts participation. Does participation in one mode — such as attending, listening, or creating — increase the likelihood of engaging via another mode? What are the implications for policy and practice of embracing a broader definition of “arts participation?” Using the SPPA data, this monograph investigates arts participation across modes and other questions deemed critical to the future of arts participation in America.
DATA AND ANALYSIS METHODSThe SPPA uniquely provides national benchmarking indicators of arts creation, arts learning, and arts attendance to inform cultural policy and stimulate discourse on cultural development in the U.S. First conducted in 1982, the SPPA is a national survey of adults resident in the U.S. and their self-reported behavioral participation in arts and cultural activities.11 The appendices of the 2008 Survey of Public Participation in the Arts reproduce the data-collection methods and changes to the questionnaire for each of the SPPA data-collection years, the corresponding design effects, and the survey questions in their entirety.12
Our findings are based on a statistical analysis of four cycles of SPPA data, from 1982, 1992, 2002 and 2008, including cross-tabulations, likelihood ratios, factor analysis, and logistic regression. The SPPA uses a complex survey design, the effects of which are considered in the analyses.
22 National Endowment for the Arts
ORGANIZATION OF THE REPORTChapter 1 discusses the existing perspectives on arts participation, and recent research and conversations happening within the arts and cultural policy fields about adopting a broader perspective for understanding arts participation. In this chapter, we seek to clarify the usage of the term “arts participation” and review literature and existing research that identify four factors (beyond demographics) that motivate and bring value to individuals’ participation with the arts. The four elements are: skill level, form of expression, setting, and creative control. The chapter also discusses new frameworks for measuring participation and introduces the potential implications for practice and policy that stem from a broader perspective of arts participation.
Chapter 2 looks at relationships between disciplines and genres within attendance, within arts creation, and within electronic media-based participation modes of arts participation. This chapter recaps, and expands upon, the analysis of participation rates originally published in the NEA’s Arts Participation 2008: Highlights from a National Survey (June 2009) and 2008 Survey of Public Participation in the Arts (Research Report #49, November 2009). Chapter 2 reports participation rates by demographics and explores underlying factors — other than demographics — that explain observed differences in arts participation in the SPPA.
Chapters 3 and 4 examine the pair-wise relationships between modes. Chapter 3 discusses the relationships between arts attendance and arts creation, while Chapter 4 discusses the relationships between electronic media-based participation with attendance and with arts creation.
Chapter 5 considers the interconnectedness of all three modes of arts participation — attendance, arts creation and electronic-media based participation, while Chapter 6 contemplates the implications for practice, research and policy, based on the totality of the SPPA data and relevant literature.
Throughout the process of creating this report, the NEA has invited us to think broadly about personal arts creation as a discrete mode of arts participation, to draw from our prior work within this context, and to consider what the findings from the SPPA might imply for cultural policy and programming decisions.
23Beyond attendance: A multi-modal understanding of arts participation
NOTES11 In the 2008 SPPA, the survey design was changed to allow
for proxy responses for spouses or partners in the same household. See 2008 SPPA Public-Use Data File User’s Guide: A Technical Research Manual, Timothy Triplett (Washington, DC: Urban Institute, 2009), available online, www.cpanda.org/cpanda.
12 National Endowment for the Arts (NEA), 2008 Survey of Public Participation in the Arts, Research Report #49 (Washington, DC: National Endowment for the Arts, 2009), available online, www.arts.gov/research/ResearchReports_chrono.html.
INTR
ODUC
TION

National Endowment for the Arts24
Symbolic identification with different types of venues plays an important role in decisions that Americans make about arts attendance. Moreover, setting is one of the few variables that arts presenters and producers might be able to control.
25Beyond attendance: A multi-modal understanding of arts participation
CHAPTER 1
CONTEXT
How people participate in the arts is influenced by technological, social, demographic, and economic changes. The environment in which arts organizations now function is different from what it was in the early 1980s, when the SPPA originated. In 1981, for example, Sony Corporation introduced the first prototype digital camera. Now, millions of Americans have digital cameras in their cellular telephones. The first entirely digital audio recording of a popular-music record album had been made only a few years prior to the first SPPA. Now, iTunes and other online platforms dominate the landscape of music distribution. The King Tut exhibition had been drawing record crowds to museums in the late 1970s, while The Phantom of the Opera, the musical that would change the course of Broadway history, did not open until 1986. Among the many trends that have re-shaped the landscape of arts participation since 1982 are:
■ Technology – The proliferation of artistic content via
broadcast media (cable television, satellite radio, online media, etc.)
– The availability of low-cost, high-quality audio and visual recording devices (e.g., digital cameras) and portable sound systems
– The widespread availability of computer software for downloading, organizing, and composing music
– The availability of digital reading devices such as Amazon’s Kindle
■ Diversification – A diversification of settings where arts
activities happen (e.g., bookstores, coffee houses, churches, art exhibitions in airports)
– More rapidly changing aesthetic tastes, aided by technology
– Increased mobility, immigration patterns, ethnic diversification, and the rapid evolution and amalgamation of cultural traditions and practices
– The emergence of spoken word, hip-hop, and self-made videos as popular forms of cultural expression
■ Accessibility and flexibility – The Internet and public expectations for
high-speed exchanges and availability of information
– Higher productivity expectations and increased scarcity of time outside work and family obligations
– Delayed decision-making patterns among those who attend arts events, and the erosion of the subscription-marketing model
These and other demographic, technological, and cultural trends have profoundly changed society and the landscape of arts participation since 1982. Together, they pose serious challenges to many existing arts organizations.

26 National Endowment for the Arts
“ARTS PARTICIPATION:” DEFINING A CENTRAL TERMThe term “arts participation” is far-reaching, but is commonly interpreted to mean “arts attendance.” “Arts participation” studies in the U.S. have largely evolved from arts organizations undertaking their own audience surveys, and have traditionally focused on visits to museums and attendance at live performances by professional artists at arts-specific venues, such as theaters and concert halls. Tepper and Gao (2008, 26) consider the trade-offs between focusing data collection on institutional program offerings versus a broader array of arts activities to represent the public interest. These researchers discuss the disproportionate emphasis on attendance metrics, especially at events historically designated as “benchmark” arts activities by the NEA.
Attendance is only one way that Americans participate in the arts. Does downloading music and burning CDs qualify as arts participation? How about meeting with a book club? Re-writing the lyrics to a popular song? Making an online scrapbook of family pictures? When does digital photography cross the line from social expression to artistic creation? Increasingly over the past decade, the conversation about “arts participation” has become a discourse more broadly accepted to imply multiple modes of engagement — including attendance, interactivity through the electronic media, arts learning, and arts creation (McCarthy et al., 2001; NEA, 1995)13 — and a broader scope of contexts and settings (Brown et al., 2008).
MEASURING “ARTS PARTICIPATION”Although much has been written about the changing cultural climate, measurement systems have been slow to adapt. To permit comparability of SPPA results over time, relatively few changes to the SPPA protocol have been made since 1982. In 2008, the SPPA expanded the range of events it uses to measure arts attendance. Such events now include “Latin, Spanish, or salsa music” and “Outdoor festival that featured performing artists.” Also in 2008, the SPPA included more questions about accessing, creating, and posting artworks on the Internet. For example, “During the last 12 months, did you use the Internet to watch, listen to, or download live or recorded music, theater or dance performances?” 2008 was also the first year that the SPPA included a question about playing an instrument independent of musical genre.14 Earlier modifications included listening to “rap or hip-hop music” (added in 1992), attending “a live dance performance other than ballet, such as modern, folk, tap, or Broadway style” (1992), and “singing with a chorale, choir, or glee club or other type of vocal group” (1992).
Until recently, few organizations or researchers have pushed forward with new definitional frameworks or methods that offer an improved understanding of the changing ways in which people experience culture. Within the past few years, however, several papers have made a compelling case for a new generation of measurement tools. Carole Rosenstein wrote in 2005 that old ways of measuring arts participation focus too much on passive forms of engagement (e.g., attendance) within the classical Western art forms and fail to incorporate participatory forms of engagement that are more prevalent among immigrants and communities of color (Rosenstein, 2005). When broader definitions of culture are used, the study asserts, significantly higher levels of participation are seen among populations of color. In their paper for 1st ACT Silicon Valley, Tom Borrup and Heidi Wagner (2007) argue for specific changes in future measurement systems. They hold that research on cultural engagement should measure:

27Beyond attendance: A multi-modal understanding of arts participation
■ Acts of art-making, creative activity, and content creation
■ Cross-cultural activity in which individuals are exposed to cultures outside their own life experience
■ Various forms of participatory and social forms of engagement (to include, for example, “amateur” involvement in music or dance, community theater, etc.)
■ Forms of cultural engagement involving technology
A recent report on arts attendance in England, part of the continuous “Take Part” survey of 28,000 adults — sponsored by Arts Council England and its parent agency, the Department for Culture, Media and Sport — identifies psychological and practical barriers to increased attendance. Yet the report also concludes that many people, including those in the higher education and income cohorts, do not attend the arts, or attend at very low levels. Reflecting on this “self-exclusion” phenomenon, the authors conclude that different measurement systems are necessary to “better understand the extent to which people have opportunities to experience the arts beyond the established forms that typically receive public funding.” The authors inquire “whether public money could be used in the future to support arts activities and experiences of a very different nature” (Bunting, et al., 2008, 14).
Developing a broader and more inclusive definition of “participation” is not just an academic issue; it is critical to the future of cultural policy. The Urban Institute’s Arts and Culture Indicators Project has made significant advances in setting forth a conceptual framework for defining and assessing cultural vitality and in establishing its critical link to the overall quality of life. The Urban Institute defines cultural vitality as “evidence of creating, disseminating, validating, and supporting arts and culture as a dimension of everyday life in communities” (Jackson et al., 2006, 4). Moreover, a growing body of literature suggests that future measurement systems should position the arts within the larger contexts of cultural vitality, civic engagement, and social capital.
CULTURAL ECOLOGYOur research suggests that a better conceptual framework is needed to guide future efforts to measure participation in arts and culture.
With the conceptual expansion of arts participation, recent publications and research have emphasized three spheres of arts and cultural activities: centralized, attendance-based activity within the traditional structures of arts organizations and institutions; relatively decentralized personal practice in community contexts; and an awareness and appreciation of arts and culture in daily life, embedded in culture and daily activities, such as electronic media-based participation. Each of these spheres is recognized for its contribution to cultural vitality and creative, productive communities (Brown et al., 2008; Kreidler and Trounstine, 2005).
FIGURE 1Cultural ecology framework15
Cultural literacy
Participatory cultural practice
Professional culturalgoods and services
CHAP
TER
1John Kreidler and Philip Trounstine (2005) developed a simple framework for thinking about the cultural ecology of a community, as illustrated in Figure 1. In their framework, cultural literacy is the foundation of a healthy cultural ecology, supporting higher levels of engagement such as participatory cultural practice and consumption of professional cultural goods and services. The authors define

28 National Endowment for the Arts
cultural literacy as “fluency in traditions, aesthetics, manners, customs, language and the arts, and the ability to apply critical thinking and creativity to these elements” (2005, 6).16 They define participatory cultural practice as “engagement of individuals and groups in cultural activities in a nonprofessional setting” (2005, 6), regardless of the arts participation mode. One can think of the cultural ecology framework as describing spheres of activity, whereas attendance, personal arts creation and performance, and electronic media-based arts participation, as documented by the SPPA, describe modes of participation within each of those spheres of activity.
In assessing the cultural ecology of a community or region, therefore, one must look not only at attendance of professional programs, but also at participatory activities such as singing in a choir or writing poetry. This perspective also might encompass more basic aspects of cultural literacy such as reading books or magazines and preparing traditional cuisines. Notably, the framework suggests that professional arts programs cannot be sustained without a constituency that actively engages in other forms of cultural practice. The key notion we take from this model is that cultural life in a community cannot flourish without all three spheres of activity.
Internationally, arts and cultural researchers have raised questions about the connections between these spheres of activity, and especially how personal practice relates to attendance.17 To address this question, we analyze SPPA data and look for patterns and relationships between personal arts creation and performance, arts attendance, and electronic media-based participation. In order to interpret these findings and gain a deeper understanding of their interrelationships, however, we must move beyond discipline-based activity categories and consider some overriding variables that occur in arts participation. Four key constructs of arts participation emerged from our literature review. They are:
1. the skill level of the artist or participant, 2. the form of artistic expression, 3. the setting in which the activity occurs, and 4. the degree to which the individual exercises
creative control over the activity.18
The skill level of the artists or participants
The distinctions between professional and amateur19 artists are blurring. “Amateur” has been used to refer to “informal” arts, or arts activities that fall outside the nonprofit arts infrastructure and commercial arts (Wali et al., 2002; McCarthy et al., 2001). But the high level of competency, dedication, and resourcefulness of many individuals engaging in such arts activities and forms challenge the pejorative connotation of “amateur arts.” Researcher Charles Leadbeater (2004) argues that professional amateurs will greatly shape the 21st century. He has termed this social phenomenon the “Pro-Am Revolution,” as it is comprised of individuals who are not professionals (because they earn their livelihood through other means), but who work in fields such as the arts at a professional standard. Not being connected to a professional arts organization does not mean that “amateur” artists lack significant network-organizing mechanisms. In a similar vein, Maria Rosario Jackson of the Urban Institute is leading a study of artists with “hybrid careers” — artists working outside of mainstream performance and presentation traditions, whose artistic expression may take several forms, and who may choose to work at several jobs that satisfy their artistic and other aspirations.20
The widespread availability of easily used artistic tools creates opportunities for millions of Americans to experiment with arts creation, not all of which might be termed “artistic expression.” From a policy perspective, this raises a sticky question about when an activity crosses the line between amusement and arts participation. For example, when does selecting a digital image to use as wallpaper on your computer desktop become “arts participation?” Does it matter if the individual consciously goes about the activity with “artistic intentions?” Or, is it sufficient to assume that the artistic benefits are inherent in the activity, regardless of intent? And how does one ascertain “artistic intent?” The 2008 SPPA brought back a question used in the 1982 wave to address this issue: “Did you make photographs, movies, or videotapes as an artistic activity?” (emphasis added). In this case, it is left to the respondent to ascertain artistic intent. As more and more Americans gain access to low-cost tools of creativity, these issues will only grow in importance.

29Beyond attendance: A multi-modal understanding of arts participation
The standard of quality for amateur involvement in the arts has been bolstered by greater accessibility to technology. This trend may also be attributed to the prevalence of technologies driving down production costs and lowering hurdles to attracting and serving audiences (Tepper, 2008, 370). But what is the distinction between professional and amateur? Whether or not one is paid for his or her work? This is a difficult definitional line to draw, given that many artists do not receive pecuniary compensation for their work.21
The distinction between amateur and professional in general use has also implied the pursuit of a livelihood. Sources such as the Bureau of Labor Statistics’ Current Employment Statistics22 capture whether or not an individual earned money from involvement with the arts. But payment for time and services does not necessarily indicate the artist’s skill level, passion, or even the artist’s own definition of “success.” Which is more important to know — whether an artist earns a portion of his or her income from producing art, or the artist’s skill level or the centrality of art-making to the artist’s life, regardless of whether or not that activity is coupled with pecuniary benefits?
In querying arts creation and arts attendance, the SPPA does not distinguish between amateur and professional, although school performances are excluded (i.e., “with the exception of elementary or high school performances…”). In other words, when asked if “during the last 12 months did you do any painting, drawing, sculpture, or printmaking activities” — an individual who doodles during business meetings may be as likely to respond “yes” as a professional sculptor. We do not mean to deny the value or meaning of such questions, but their phrasing does lead us to challenge what is being measured (e.g., incidence and frequency of participation) versus what is not being measured (skill level, centrality, or salience of the activity). Future efforts to characterize the arts-creation activities of Americans might benefit from a more dimensional analysis.
The form of artistic expression
Many forms of arts and cultural expression extend far beyond those traditionally included in surveys of arts participation,23 and they are becoming increasingly diverse, in keeping with changes in public tastes (e.g., watching dance competitions on television) and new technologies that have facilitated the proliferation of artistic content (e.g., cable television and satellite radio).
Public perception is shifting the boundaries of what we mean by “classical” in relation to other art forms.24 Consider, for example, the likely effect that the “classical crossover”25 phenomenon has had on the public definition of classical music (e.g., Charlotte Church, Andrea Bocelli, the Three Tenors, etc.). Does “classical music” today mean the same thing it meant to the American public of 1982? This raises the question of whether increases or declines in classical music participation might be due, in part, to a change in the definition of “classical music” in the public consciousness.
We also observe a greater blurring of lines between artistic genres, and, within genres, uncertainty about what constitutes “original” work. Within the realm of music, for example, the “iPod shuffle”26 approach to music-listening, in which the listener is never sure what comes next, and the complete control that digital audio-players afford to listeners, promote a breakdown in the distinction between music genres. We have observed this phenomenon anecdotally in focus-group research on the music preferences of young adults, some of who completely refuse to categorize their tastes in music, and who insist that they are as equally pleased with Ella Fitzgerald as with Radiohead.27 We hypothesize a similar breakdown with regard to dance forms, given the blending of Latin, jazz and tap, hip-hop, and modern forms on television shows such as So You Think You Can Dance and Dancing with the Stars.
CHAP
TER
1

30 National Endowment for the Arts
The aesthetic landscape is continuously changing as new artistic and cultural forms come to the fore. Moreover, as immigrant populations have grown and become acculturated, more aesthetics and cultural forms have been introduced into the arts participation landscape, emphasizing the role and meaning of participatory art forms (Moriarty, 2008).28 Considering the multitude of changes, cultural anthropologist Dr. Maribel Alvarez writes in There’s Nothing Informal About It, “Out of these observations grows a recognition among some of the more progressive cultural policy-makers in the United States that other forms of ‘artistic expression, arts enjoyment and arts discourse,’ beyond the traditional definitions are taking shape both apart from, and in conversation with, the established nonprofit arts field” (2005, 13).
Any quantitative survey of public participation in the arts is necessarily limited by fixed and ambiguous definitions of art forms. To limit survey length, in some cases multiple types of activities are collapsed into a single survey item (e.g., “During the last 12 months did you do any weaving, crocheting, quilting, needlepoint, or sewing?”). Given the rapidly changing landscape, however, we wonder if periodic additional research might be necessary to better establish how the forms themselves are evolving, so that participation research can remain relevant and can keep up with the pliable imagination of the American public.
The setting in which the activity occurs
All arts activities occur in the context of a physical or virtual setting, whether it is an automobile,29 a concert hall, or Second Life.30 The settings in which one participates in arts activities have many symbolic, practical, social, and behavioral connotations. Consider, for example, the differences between seeing a great work of art in a museum versus seeing a reproduction of the same artwork on the kitchen wall every day for 20 years. Both are acts of viewing art, and surely both have meaning to the viewer, but only visiting museums is covered in the SPPA.31 Does art-viewing at home qualify as “arts participation?” If it does, what are the implications for cultural policy? Would museums take more interest in what hangs on the walls in people’s homes? While a detailed analysis of the settings in which arts activities occur is beyond the scope of this monograph, the overall importance of setting to understanding patterns of arts participation is sufficiently important to merit a brief discussion here.
One element of “setting” is the ambiance, comfort, and convenience of the venue. In focus groups, arts patrons characterize arts facilities as “friendly,” “welcoming,” “cold,” or “intimidating” — attributes often ascribed to people.32 Consumers have deeply entrenched emotional feelings about arts spaces, which may relate to the aesthetics of the architecture and design, physical attributes such as accessibility, acoustics and temperature, as well as the way that they are treated by ushers, ticket-sellers, and other staff.
This physical setting also reflects a set of cultural norms, either based on actual experience or transmitted through social networks. To some young people, theaters, museums, and concert halls evoke their parents’ and grandparents’ culture, which they often reject. One young man put it this way: “Sitting in a dark room for two hours and not being able to talk to my girlfriend is not my idea of an enjoyable evening.”33 As a result, arts groups’ efforts to attract younger ticket-buyers, even when successful, are sometimes thwarted by the actual experience that young people have when they attend and do not see their peer group in attendance. Thus it seems that younger adults attach greater importance to setting, although this assertion is based solely on anecdotal evidence.

31Beyond attendance: A multi-modal understanding of arts participation
In research conducted in California for the James Irvine Foundation, the home and places of worship emerged as important settings for arts participation. For example, African Americans were significantly more likely than whites and Hispanics to cite places of worship as settings for cultural activities. With respect to race/ethnicity, significant differences were observed in terms of incidence of use of conventional arts facilities (i.e., theaters and concert halls, and museums and galleries). Whites reported significantly higher levels of use of conventional arts facilities across all four disciplines (music, dance, theater, and visual arts) — at approximately three times the rate of Hispanics (Brown et. al., 2008). Many factors may contribute to this finding, and further research is needed to better understand how different communities construct belief sets around cultural facilities. The implications for both policy and practice are enormous.
Further evidence of the home as a key setting for the creative development of children was found in a 2008 study of Dallas Independent School District students. For example, 63% of all students in grades 4–12, on average, reported drawing or painting at home, and 50% reported dancing for fun at home. A third of students in grades 4–12 reported little or no in-school activity (zero or one mention of any activity done in-school, of the 71 activities tested). This rate compares with 98% of all students who reported doing at least two arts activities at home. The average student cited the home as a setting for 12 arts activities, and cited friends’ homes as a setting for five activities. This figure compares with four activities, on average, in school and just one activity, on average, after-school (Brown, et al., 2008). If the home is the cradle of the imagination and the most common setting for creative expression among school-age children, then who is designing home-based arts activities for children and their caregivers?
Setting is a critical backdrop to arts participation; it forms a rich topic for further research, mainly because so much rides on this variable in terms of future attendance patterns. We hypothesize that symbolic identification with different types of venues plays an important role in decisions that Americans make about arts attendance. Moreover, setting is one of the few variables that arts presenters and producers might be able to control.
The degree of creative control exercised by the individual
Existing literature has framed the extent to which an individual engages with art as either active or passive. However, this framework increasingly has been challenged with concerns that it is too simplistic or implies negative value judgments about “passive attendance” when many people who sit quietly through arts programs are vigorously engaged. Looking past “active or passive,” we find an underlying continuum of creative control. In stitching a quilt, for example, the individual might exercise substantial, if not complete, creative control, depending on whether or not a pattern is used. In contrast, listening to music might involve no creative control, except perhaps to the extent that the participant selects the music. This distinction does not imply that people lack imaginative experiences when viewing art or listening to music. Rather, the focus here is on the degree to which an individual is involved in the process of creating the art.
One way of thinking about creative control is the “Five Modes of Art Participation” framework developed by Alan Brown in The Values Study (2004). The framework identifies five categories of arts activities based on the level of creative control exercised by the participant, ranging from total control (inventive participation) to no control at all (ambient participation). (See Figure 2.) The underlying hypothesis is that different sets of personal benefits are associated with different modes of engagement. For example, certain benefits that can accrue from creating an original work of art are not attainable from watching someone else make art, regardless of the artistic discipline or the artist’s level of technical skill. Conversely, it is also true that certain benefits that can result from observing a work of art are not attainable from the act of creating a work of art.
CHAP
TER
1

32 National Endowment for the Arts
FIGURE 2Five modes of arts participation framework
ObservationalAmbient
Curatorial
Interpretive
Inventive
Amount of creative control Amount of creative controlNone NoneTotal
The five modes are defined briefly as follows:
1. Inventive Participation engages the mind, body, and spirit in an act of artistic creation that is unique and idiosyncratic, regardless of skill level (e.g., composing music, writing original poetry, painting).
2. Interpretive Participation is a creative act of self-expression that brings alive and adds value to pre-existing works of art, either individually or collaboratively, or engages one in arts learning (e.g., playing in a band, learning to dance).
3. Curatorial Participation is the creative act of purposefully selecting, organizing, and collecting art to the satisfaction of one’s own artistic sensibility (e.g., collecting art, downloading music, and burning CDs).
4. Observational Participation occurs when you see or hear arts programs or works of art created, curated, or performed by other people (e.g., attending live performances, visiting art museums). We define two sub-types of observational participation: 1) participation in live events, and 2) electronic media-based participation.
5. Ambient Participation includes encounters with art that the participant does not select (e.g., seeing architecture and public art, hearing music in a store).
The Five Modes framework is an attempt to move beyond simplistic characterization of arts activities as being either “active” or “passive.” It provides a more nuanced framework to think about forms of participation captured in the SPPA and discussed throughout this report.34,35 For example, the SPPA’s questions about personal arts creation and performance capture a wide range of inventive and interpretive forms of participation.36 Similarly, the survey’s questions about arts attendance and electronic media-based participation capture a wide range of observational activities. The 2008 SPPA even includes two questions that provide insight on ‘curatorial’ activities — “Do you own any original pieces of art, such as paintings, drawings, sculpture, prints, or lithographs?” and “Did you purchase or acquire any of these pieces during the last 12 months?”
In this section we have discussed four underlying aspects of arts participation: 1) the skill level of the artist or participant, 2) the form of artistic expression, 3) the setting in which the activity occurs, and 4) the extent of creative control. They are key drivers of both arts creation and arts attendance, and thus might be useful to policymakers, artists, and arts administrators in reflecting on current and potential arts programs and activities, and the likely audiences and participants those activities will serve. The Five Modes framework might also be useful in considering options for future research on arts participation.

33Beyond attendance: A multi-modal understanding of arts participation
CONSIDERATIONS OF POLICY AND PRACTICE THROUGHOUT THIS REPORTThroughout this monograph, we discuss implications both for arts organizations’ practices and for cultural policy. In terms of arts organizations’ practices, there are currently two prominent lines of questioning about the relationship between personal practice and attendance. The first line of questioning considers how existing audiences can be engaged more deeply through increased personal interaction with the arts. Artists, arts producers, and arts presenters are broadening the ways in which they seek to engage their audiences and are experimenting with new approaches (Farrell, 2008). These approaches provide opportunities for individuals to directly interact with the arts through more contextualized and personal experiences, both inside and outside traditional arts venues.37
The second line of questioning concerns how personal practice drives or enhances audience participation. Recently released data on cultural engagement in Philadelphia and in the UK (Martin et al., 2010) demonstrate how personal practice correlates with attendance and the use of arts facilities. While these analyses are exploratory, they suggest that more frequent arts practice38 increases the likelihood of attendance in the same discipline (WolfBrown, 2009, 72). Likewise, social frameworks indicate that those engaged in the arts are more likely to be engaged in their communities and that social networks, including spousal status (NEA, 2007) and peers, influence attendance rates. These studies add to a growing body of evidence that arts and culture contribute to the overall health and welfare of communities by stimulating civic participation, building social and human capital, and serving as assets that contribute to local economies and support other community-building processes (NEA, 2009a; Jackson et al., 2002).
In terms of policy, we invite readers to consider the following policy questions as they read this monograph:
■ With limited resources, where does one invest in the “cultural ecology” and what should be policy priorities?
■ How do we understand the public value generated from different types of arts participation?39
■ How do we understand the relationship between the instrumental benefits of arts participation, such as community-building, and the intrinsic benefits stemming from support for individual creative and artistic expression and engagement?40
While these policy questions are not directly addressed in this monograph, we hope the following chapters stimulate discussion of these and other foundational issues pertaining to arts participation in the U.S.
CHAP
TER
1

34 National Endowment for the Arts
NOTES13 In its research on patterns of arts engagement in the UK, Arts
Council England uses the phrase “arts participation” to refer specifically to active forms of arts creation such as photography, making films, or playing an instrument, and considers attendance separately. From Indifference to Enthusiasm: Patterns of Arts Attendance in England, Catherine Bunting, Tak Wing Chan, John Goldthorpe, Emily Keaney, and Anni Oskala (London: Arts Council England, 2008), 13, available online, www.artscouncil.org.uk/publication_archive/from-indifference-to-enthusiasm-patterns-of-arts-attendance-in-england.
In the U.S., the NEA opts to use the phrase “arts creation” to describe this milieu of activity. The most recent analysis of arts participation in Australia uses the term “creative participation” to describe similar activities. See More than bums on seats: Australian participation in the arts, Australia Council for the Arts (Sydney, Australia: Australia Council for the Arts, 2010).
14 Earlier SPPA waves included questions such as “During the last 12 months, did you play a musical instrument in a public performance or rehearse for a public musical performance?” (1985, 1982 SPPAs), and about playing a specific genre of music on an instrument, “During the last 12 months, did you play any jazz?” (1985, 1982 SPPAs). The 1992 SPPA included questions about performing and rehearsing music, but did not directly address whether someone played an instrument.
15 This diagram is adapted from Creative Community Index: Measuring Progress toward a Vibrant Silicon Valley, John Kreidler and Philip J. Trounstine (San Jose, CA: Cultural Initiatives Silicon Valley, 2005), 6, available online, www.ci-sv.org/pdf/Index-2005.pdf.
16 Electronic media-based arts participation is not directly addressed in the Kreidler and Trounstine model, but seems to cut across the three spheres given the range of activities permitted by electronic media — accessing artistic content online, creating and posting content online, and accessing information.
17 The international discourse about the connections between the spheres grounds the conversation in the idea of individuals’ “expressive lives” and, with that as a priority, how arts organizations approach their work. See Expressive Lives, ed. Samuel Jones (London: DEMOS, 2009), available online, www.demos.co.uk/publications/expressive-lives; and Arts, Inc. How Greed and Neglect Have Destroyed Our Cultural Rights, Bill Ivey (Berkeley, CA: University of California Press, 2008).
18 Of the four key constructs, the 2008 SPPA captures data on 2) form of artistic expression, and some data on 3) setting.
19 Non-professional arts have also been referred to as “informal arts” and “advocational,” among other terms.
20 Maria Rosario Jackson, “Revisiting Selected Themes from the ‘Investing in Creativity’ Study: Support for Artists Pursuing Hybrid Work,” presented as an interim report at the NEA in November 2009, available online, www.nea.gov/research/Workforce-Forum/PDF/Jackson.pdf. The work is cited with the researcher’s permission.
21 For brief but lively thoughts on the distinctions between professional and amateur see Andrew Taylor, “Amateur vs. professional,” theArtfulmanager (blog), June 18, 2009, www.artsjournal.com/artfulmanager/main/amateur-vs- professional.php.
22 Bureau of Labor Statistics, Current Employment Statistics, www.bls.gov/ces/home.htm.
23 The arts disciplines considered in arts participation research have been those traditionally in concert halls, venues, and institutions. “Engaging Art: What Counts?” Steven Tepper and Yang Gao, in eds. Steven J. Tepper and Bill Ivey, Engaging Art: The Next Great Transformation of America’s Cultural Life (New York, NY: Routledge, 2007), 25–26.
24 See “A Conversation about the 2008 Survey of Public Participation in the Arts,” National Endowment for the Arts webcast, December 10, 2009, www.nea.gov/research/SPPA-webcast.html.
25 A Grammy has been awarded for the category of Best Classical Crossover Album since 1999.
26 iPod®®® and iPod shuffle®®® are registered trademarks of Apple Inc.
27 Focus group research for SFJAZZ, 2009 was conducted by WolfBrown.
28 For example, at the January 2010 open auditions for the San Francisco Ethnic Dance Festival, 136 groups and individual artists representing many different cultures vied for a coveted spot in the festival program, an increase of 28% over the previous year. Julie Mushet, executive director of World Arts West, which presents the festival, says the forms themselves are evolving, especially with the rise of “fusion” dance forms that amalgamate two or more different dance traditions.
29 In the Classical Music Consumer Segmentation Study, the automobile was identified as the dominant setting for experiencing classical music, followed closely by the home. Classical Music Consumer Segmentation Study, Audience Insight (Miami, FL: John S. and James L. Knight Foundation, 2002), 51, available online, www.knightfoundation.org/dotAsset/131779.pdf.
30 Second Life is a virtual world developed by Linden Lab that launched in 2003, www.secondlife.com.
31 The 2008 SPPA asks, “During the last 12 months, did you visit an art museum or gallery?” It does not investigate art-viewing in other settings, other than “crafts fairs and visual arts festivals,” but does include questions about personally owning and buying artwork.
32 In the context of a larger, proprietary study of student attitudes and perceptions of the arts, WolfBrown conducted experiential tours of the Hopkins Center for the Arts with Dartmouth College students in 2007. Results are not publicly available, but may be requested from the Hopkins Center. http://hop.dartmouth.edu.
33 Ibid.
34 Tepper and Gao suggest that different forms of participation could be added to the framework, such as giving, membership, and literacy. “What Counts?” Tepper and Gao, in Tepper and Ivey, Engaging Art, 36.
35 Recognizing that the specific wording of some SPPA survey questions does not allow for unambiguous categorization into one of the five proposed modes, we do not impose this framework directly on the SPPA data, but rather propose it as a framework for understanding participation. WolfBrown’s Observational-Live mode corresponds to the SPPA questions that address attendance at arts events, and the Observational-Media mode includes watching, listening, and downloading art via some form of electronic media. This framework does not contradict previous frames used in NEA monographs, but aims to contribute deeper understanding of how individuals create and participate in the arts. The SPPA does not include indicators of ambient engagement.
36 The question wording in the 2008 SPPA does not enable the distinction between “inventive” or “interpretive” participation. Both those modes imply greater personal creative control than observational participation, which includes both attendance and electronic media-based observation (applying Brown’s theoretical framework for modes of arts participation — refer to Figure 2). Some previous SPPA questions do enable the distinction between inventive and interpretive modes, however. For example, in 1992 and 2002, the question “Did you write or compose any music during the last 12 months?” would serve as a measure of strictly “inventive” participation.
35Beyond attendance: A multi-modal understanding of arts participation
37 Research on the intrinsic impacts of live performances has developed measurement systems that bring to light whether, and how, engagement with the arts experience is being deepened for audiences. Assessing the Intrinsic Impacts of a Live Performance, Alan S. Brown and Jennifer L. Novak (San Francisco, CA: WolfBrown, 2007), available online, www.wolfbrown.com/mups_downloads/Impact_Study_Final_Version_full.pdf.
38 The SPPA does not collect data on the frequency of participation in arts-creation activities, so we are unable to test this hypothesis with the SPPA data.
39 The CASE program in the UK (the culture and sport evidence programme) is undertaking a large-scale initiative to articulate the impacts of both arts and sports activities, for the express purpose of informing policy. See www.culture.gov.uk/case/case.html.
40 For discussion of instrumental and intrinsic benefits see Gifts of the Muse: Reframing the Debate About the Benefits of the Arts, Kevin F. McCarthy, Elizabeth H. Ondaatje, Laura Zakaras, and Arthur Brooks (Santa Monica, CA: RAND, 2004).
CHAP
TER
1

National Endowment for the Arts36
Attendance patterns suggest that Americans with different demographic backgrounds have different needs and interests, and that educational attainment and family income are significant barriers to attendance.
37Beyond attendance: A multi-modal understanding of arts participation
CHAPTER 2
A LOOK WITHIN THE THREE MODES OF PARTICIPATION
This chapter looks within each mode of participation — live attendance, personal arts creation, and electronic media-based participation — to explore patterns of participation. Specifically, we:
■ Revisit published analyses on rates of participation to establish baseline knowledge
■ Expand upon existing analysis by considering the implications of a broader set of demographic variables
■ Explore patterns of participation within each participation mode
This chapter reviews some analyses of participation rates originally published in the NEA’s Research Report #49 (2009a). Throughout this report, rates of arts participation are determined by the percentage of adults in the U.S. who participated at least once in a given activity during the 12 months between May 1, 2007 and May 1, 2008.
This chapter reports new analysis of participation rates by previously unreported demographic variables and explores underlying factors — other than demographics — that explain observed differences in arts participation in the SPPA.
MODE OF PARTICIPATION: ATTENDANCERates of attendance
The SPPA captures self-reported data on attendance for a range of performing arts events, as well as visits to art museums, galleries, fairs, festivals, and historic sites. The SPPA categories used to measure attendance have been updated over the years to reflect cultural shifts and changing preferences. For example, in 2008, the SPPA expanded the range of events to include “Latin, Spanish, or salsa music” and “Outdoor festival that featured performing artists.” In 2008, 49.1%41 of U.S. adults reported attending an arts event or performance at least once in the 12 months ending in May 2008.
The SPPA balances the expansion of categories with maintenance of comparable attendance measures to allow trend analysis over the years. The attendance measures most commonly utilized for trend analysis are referred to as “benchmark” activities.42 In addition to the benchmark activities, the SPPA includes two additional measures that are comparable across its waves — attendance at arts or craft fairs and festivals, and attendance at historical parks or monuments, or touring of buildings or neighborhoods for their historic or design value. Because this monograph aims to examine the breadth of arts participation activity captured by the SPPA, we include these two measures in addition to the benchmark activities to examine aggregate arts attendance rates over time; this aggregate measure is presented as “All Comparable Attendance Activities” in Table 1.43,44

38 National Endowment for the Arts
TABLE 1Percentage of U.S. adults reporting arts attendance in the past 12 months: 1982, 1992, 2002, and 2008
Percent of adults attending/visiting/reading
1982 1992 2002 2008
Aggregate measures
All comparable attendance activities 44.6% 59.5% 54.2% 46.4%
% change from prior year 14.9^ -5.3^ -7.8^
Benchmark arts activities 39.2 41.2 39.5 34.6
% change from prior year 2.0 -1.7 -4.9^
Attendance activities
Performing arts
Music Jazz* 9.6% 10.6% 10.8% 7.8%
% change from prior year 1.0 0.2 -3.0^
Classical music* 13.0 12.5 11.6 9.3
% change from prior year -0.5 -0.9 -2.3^
Opera* 3.0 3.3 3.2 2.1
% change from prior year 0.3 -0.1 -1.1^
Latin music na na na 4.9
Performing arts festivals na na na 20.8
Plays Musical plays* 18.6 17.4 17.1 16.7
% change from prior year -1.2 -0.3 -0.4
Non-musical plays* 11.9 13.5 12.3 9.4
% change from prior year 1.6 -1.2 -2.9^
Dance Ballet* 4.2 4.7 3.9 2.9
% change from prior year 0.5 -0.8 -1.0^
Other dance na 7.1 6.3 5.2
% change from prior year -0.8 -1.1
Visual arts
Art exhibitions Art museums/galleries* 22.1 26.7 26.5 22.7
% change from prior year 4.6^ -0.2 -3.8^
Art/craft fairs and festivals 39.0 40.7 33.4 24.5
% change from prior year 1.7 -7.3^ -8.9^
Parks and historic sites
Parks/monuments/historical buildings/neighborhoods
37.0 34.5 31.6 24.9
% change from prior year -2.5 -2.9 -6.7^
Other attendance and participation
Literature
Literature (plays, poetry, novels, short stories) 56.4% 54.2% 46.7% 50.2%
% change from prior year -2.2 -7.5^ 3.5^
Community venues (for music, theater, or dance)
School na** na na 23.7
Religious Institution (e.g. church or synagogue) na** na na 19.1
^ Significant at 95% confidence* Benchmark activity** Survey protocol included questions about community venues, but changes in question wording do not allow for comparison

39Beyond attendance: A multi-modal understanding of arts participation
Table 1 reports the percentages of U.S. adults attending an arts program or activity, for 1982, 1992, 2002, and 2008. The top rows include rates of participation across the years, using both the broader set of comparable attendance measures, and the benchmark activities alone, for comparison. The changes between years for all comparable activities are statistically significant at the 95% confidence level, whereas attendance at benchmark activities held relatively stable until the statistically significant decline to 34.6% in 2008.45,46,47
Other arts activities in Table 1 include literary reading and attendance at community venues (i.e., schools and religious institutions). While both attendance and literary reading involve an individual’s consumption of another’s creative or artistic work, reading literature connotes a different type of arts experience than attendance. For the purpose of the analyses throughout this monograph, we consider reading literature as separate from attendance at live events.48 Reading literature, unlike any of the individual attendance activities, shows a significant increase in the rate of participation from 2002 to 2008, from 46.7% to 50.2% of U.S. adults.
Two new questions were added to the 2008 SPPA, inquiring about attendance at performing arts events at community venues, specifically at schools and religious institutions.49 In contrast, the other SPPA questions about attendance at performing arts events do not specify the venue type or location of the performance, but they do exclude performances at elementary or high schools. Due to this exclusion, some might infer that these questions imply a venue specifically intended for the arts, but the data do not permit determinations about what venues respondents actually considered when answering these attendance questions.
In 2008, 23.7% of U.S. adults reported attendance at a music, theater, or dance performance at a school, and 19.1% reported attending such a performance at a religious institution. These percentages are among the highest rates of attendance for a single attendance activity captured by the 2008 SPPA.
Specific rates of attendance, by demographics
Other SPPA reports50 discuss demographic differences in the attendance patterns captured in the SPPA 2008. In this section, we review some of those findings and make additional observations about the rates of attendance across demographic cohorts. Table 3 presents detailed rates of attendance by gender, race/ethnicity, age, educational attainment, family income, and citizenship status.
GenderFemales attended arts activities at higher rates than males in 2008. The largest difference between rates of participation by gender is for attendance at benchmark activities generally, and specifically at musical plays, art fairs and festivals, and literary reading (see ranges in Table 3). However, there is a <1% difference between rates of attendance by gender for attendance at live jazz performances; Latin, Spanish, or salsa music performances; and attendance at outdoor festivals featuring performing artists. These types of activities, apparently, tend to attract men and women in more equal proportions.
Race/ethnicityOther research utilizing the SPPA (DiMaggio and Ostrower, 1992) has established that arts attendance rates vary across race and ethnicity cohorts. Table 2 contains the distribution of race/ethnicity cohorts in the 2008 SPPA.
TABLE 2Distribution of U.S. adults’ self-reported race/ethnicity: 2008
U.S. population
Millions Percent
Race/ethnicity
White, Non-Hispanic 154.4 68.7%
African American, Non-Hispanic 25.6 11.4
Hispanic 30.3 13.5
Asian, Non-Hispanic 10.3 4.6
American Indian/Alaskan native, Non-Hispanic
1.2 0.5
2 or more races, Non-Hispanic 2.8 1.3
Total 224.8 100.0%
CHAP
TER
2

40 National Endowment for the Arts
TABLE 3U.S. adults’ arts attendance rates between May 2007–May 2008, by demographic group
Any arts attendance activity in 2008 Any arts attendance activity in 2008
Benchmark arts activities Performances at community venues
Any arts attendance
activity
Any benchmark
activityJazz Classical
music Opera MusicalsNon-
musical plays
Ballet Art museum
Latin/salsa music
Other dance
Art fairs and
festival
Outdoor artists
festival
Historic location
Literary reading
Performance at school
Performance at religious institution
All adults49.1% 34.6% 7.8% 9.3% 2.1% 16.7% 9.4% 2.9% 22.7% 4.9% 5.2% 24.5% 20.8% 24.9% 50.2% 23.7% 19.1%
GenderMale 47.0% 32.3% 7.7% 8.5% 1.8% 14.4% 8.2% 2.2% 21.4% 4.8% 4.4% 20.5% 20.6% 24.4% 41.9% 20.4% 17.1%Female 51.1 36.8 7.9 10.0 2.4 18.9 10.6 3.6 24.0 4.9 5.9 28.3 20.9 25.4 58.0 26.7 21.0
Range 4.1% 4.5% 0.2% 1.5% 0.6% 4.5% 2.4% 1.4% 2.6% 0.1% 1.5% 7.8% 0.3% 1.0% 16.1% 6.3% 3.9%Race/ethnicityWhite, Non-Hispanic 55.1% 39.7% 8.8% 11.3% 2.6% 20.0% 11.4% 3.5% 26.0% 3.1% 5.9% 29.3% 23.1% 29.5% 55.7% 26.2% 19.3%African American, Non-Hispanic 31.1 21.5 8.6 4.3 0.7 8.6 5.5 1.1 12.0 1.6 3.0 12.2 15.4 12.6 42.6 17.3 26.3Hispanic 36.7 21.0 3.9 3.8 1.1 8.1 4.3 2.2 14.5 17.4 3.2 13.7 14.8 14.0 31.9 17.5 14.2American Indian, Non-Hispanic 54.1 23.8 7.6 6.2 3.3 10.6 3.7 0.3 18.3 5.2 2.2 30.9 28.0 19.4 45.2 23.3 15.2Asian, Non-Hispanic 41.1 32.7 3.1 9.7 1.4 13.6 6.0 1.9 24.0 1.8 4.7 13.4 15.8 19.6 41.6 19.2 14.92 or more races, Non-Hispanic 45.0 32.4 5.8 6.3 4.8 14.2 7.3 1.9 23.5 4.9 7.3 24.1 20.7 21.9 51.6 21.9 18.0
Range 24.0% 18.7% 5.7% 7.5% 4.1% 11.9% 7.7% 3.2% 14.0% 15.8% 5.1% 18.7% 13.2% 16.9% 23.8% 8.9% 12.1%Age18–24 46.4% 32.7% 7.3% 6.9% 1.2% 14.5% 8.2% 2.5% 22.9% 7.0% 5.7% 17.8% 21.6% 21.9% 51.7% 20.5% 14.4%25–34 51.6 36.0 7.7 7.0 1.7 16.0 9.2 2.3 24.3 5.9 4.7 22.7 22.8 25.7 50.1 21.6 17.335–44 52.9 37.2 7.2 8.9 2.5 18.2 8.9 3.4 25.7 6.1 4.7 27.2 24.1 26.8 50.8 35.2 21.345–54 53.1 36.1 9.8 10.2 2.4 17.4 8.7 3.2 23.3 4.4 5.2 29.1 23.4 28.0 50.3 26.9 21.955–64 51.5 36.9 9.7 11.6 2.4 19.5 12.3 3.1 24.3 4.6 6.6 28.9 20.5 27.6 53.1 19.9 20.065–74 44.9 33.4 6.1 12.2 2.9 18.0 11.0 4.3 19.9 2.0 6.1 24.8 15.4 24.1 49.1 18.8 20.575+ 28.8 21.3 4.0 9.7 1.8 10.0 7.4 1.4 10.5 0.8 2.6 12.7 6.8 11.2 42.3 10.8 16.1
Range 24.3% 15.9% 5.8% 5.3% 1.7% 9.5% 4.9% 2.9% 15.2% 6.2% 4.0% 16.4% 17.3% 16.8% 10.8% 24.4% 7.5%EducationGrade school 14.7% 6.5% 1.5% 1.8% 0.2% 1.7% 0.7% 0.1% 3.8% 8.5% 1.2% 4.9% 6.0% 3.8% 18.5% 8.1% 12.0%Some high school 28.4 14.5 2.4 2.3 0.5 5.2 2.8 0.6 9.2 5.5 2.2 11.2 11.6 9.1 34.3 17.6 13.2High school graduate 35.0 19.0 3.9 3.1 0.7 8.1 4.0 1.0 9.6 3.3 2.2 17.3 14.6 14.6 39.1 18.8 15.0Some college 55.6 38.1 8.1 9.1 1.7 17.1 9.0 3.0 23.8 4.0 5.8 27.5 23.4 28.4 56.2 26.2 21.2College graduate 69.3 57.2 13.7 16.7 4.1 30.1 17.5 5.4 40.6 6.8 8.0 35.8 30.6 39.4 66.6 30.6 23.5Graduate school 77.1 67.3 17.4 27.1 7.3 37.9 24.3 8.2 52.2 5.8 12.7 41.6 31.7 48.1 71.2 33.2 27.7
Range 62.4% 60.8% 15.9% 25.3% 7.1% 36.2% 23.6% 8.1% 48.4% 5.2% 11.5% 36.7% 25.7% 44.3% 52.7% 25.1% 15.7%Family income<$10,000 27.0% 16.1% 4.3% 4.0% 0.3% 6.6% 4.2% 0.9% 9.4% 6.7% 2.0% 10.7% 12.8% 10.3% 38.6% 10.8% 12.0%$10,000–19,999 29.3 16.8 3.6 3.9 0.9 6.3 3.7 0.6 10.3 3.4 2.5 13.0 11.2 11.4 38.3 13.2 15.1$20,000–29,999 34.6 19.3 4.1 4.4 1.5 7.7 4.1 1.4 11.9 5.5 2.6 15.5 14.0 13.9 41.7 18.3 15.2$30,000–39,999 42.5 27.0 7.1 6.8 1.1 11.0 6.7 2.6 16.3 6.1 3.8 21.8 18.7 19.9 43.2 19.7 17.6$40,000–49,999 48.8 31.8 8.9 8.7 1.6 15.4 7.4 1.7 20.2 5.9 4.1 24.7 20.7 23.2 51.9 24.2 19.5
$50,000–74,999 52.9 36.2 7.6 9.5 2.1 15.4 8.6 3.4 23.9 4.8 5.3 26.2 22.5 26.8 50.1 24.7 19.9$75,000–99,999 61.9 46.2 8.7 11.7 2.1 21.8 13.4 3.7 31.3 4.2 6.8 33.8 28.1 32.6 59.1 31.9 22.7$100,000–149,999 70.0 55.0 13.4 14.8 3.3 32.0 14.1 5.0 34.4 5.6 8.3 34.5 28.4 41.2 62.1 36.2 26.2$150,000+ 77.9 68.1 15.4 22.8 6.8 40.1 24.2 7.8 51.9 5.3 12.5 37.5 32.3 47.3 71.2 33.6 23.5
Range 50.9% 52.0% 11.8% 18.9% 6.5% 33.8% 20.5% 7.2% 42.5% 3.3% 10.5% 26.8% 21.1% 37.0% 32.9% 25.4% 14.2%Citizenship statusNative 51.4% 36.4% 9.6% 9.6% 2.2% 18.1% 10.3% 3.0% 23.7% 4.0% 5.5% 26.6% 22.1% 26.7% 52.7% 24.7% 19.7%Naturalized 39.0 28.6 3.8 9.2 2.4 11.4 6.0 2.7 19.8 7.7 4.4 15.4 15.1 16.9 39.3 21.0 19.1Non-citizen 33.9 21.0 3.5 5.9 0.9 7.3 3.4 2.6 15.3 11.3 2.9 10.4 12.2 12.8 34.1 15.0 12.9
Range 17.5% 15.4% 6.1% 3.7% 1.5% 10.8% 6.9% 0.4% 8.4% 7.3% 2.6% 16.2% 9.9% 13.9% 18.6% 9.7% 6.8%
Note: “Any arts attendance activity” includes all benchmark activities and attendance at Latin, Spanish, or salsa music events, non-ballet dance events, arts fairs and festivals, outdoor artists festivals, and visits to historic locations.
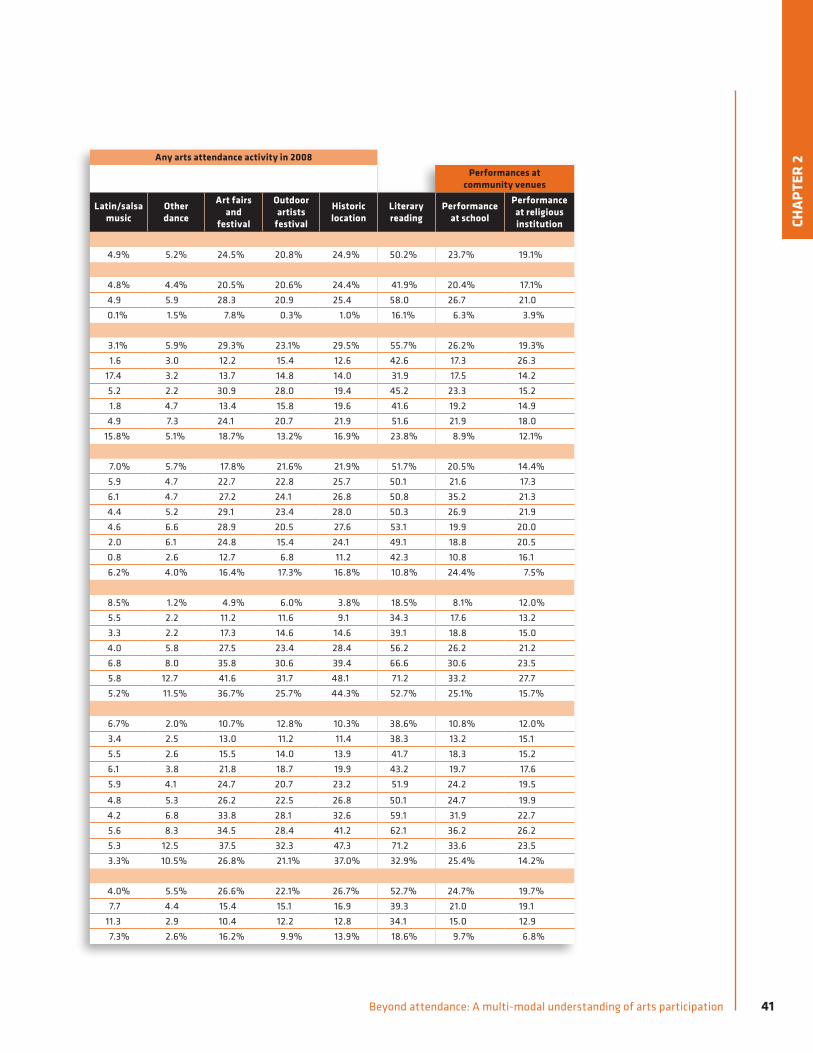
41Beyond attendance: A multi-modal understanding of arts participation
Any arts attendance activity in 2008 Any arts attendance activity in 2008
Benchmark arts activities Performances at community venues
Any arts attendance
activity
Any benchmark
activityJazz Classical
music Opera MusicalsNon-
musical plays
Ballet Art museum
Latin/salsa music
Other dance
Art fairs and
festival
Outdoor artists
festival
Historic location
Literary reading
Performance at school
Performance at religious institution
All adults49.1% 34.6% 7.8% 9.3% 2.1% 16.7% 9.4% 2.9% 22.7% 4.9% 5.2% 24.5% 20.8% 24.9% 50.2% 23.7% 19.1%
GenderMale 47.0% 32.3% 7.7% 8.5% 1.8% 14.4% 8.2% 2.2% 21.4% 4.8% 4.4% 20.5% 20.6% 24.4% 41.9% 20.4% 17.1%Female 51.1 36.8 7.9 10.0 2.4 18.9 10.6 3.6 24.0 4.9 5.9 28.3 20.9 25.4 58.0 26.7 21.0
Range 4.1% 4.5% 0.2% 1.5% 0.6% 4.5% 2.4% 1.4% 2.6% 0.1% 1.5% 7.8% 0.3% 1.0% 16.1% 6.3% 3.9%Race/ethnicityWhite, Non-Hispanic 55.1% 39.7% 8.8% 11.3% 2.6% 20.0% 11.4% 3.5% 26.0% 3.1% 5.9% 29.3% 23.1% 29.5% 55.7% 26.2% 19.3%African American, Non-Hispanic 31.1 21.5 8.6 4.3 0.7 8.6 5.5 1.1 12.0 1.6 3.0 12.2 15.4 12.6 42.6 17.3 26.3Hispanic 36.7 21.0 3.9 3.8 1.1 8.1 4.3 2.2 14.5 17.4 3.2 13.7 14.8 14.0 31.9 17.5 14.2American Indian, Non-Hispanic 54.1 23.8 7.6 6.2 3.3 10.6 3.7 0.3 18.3 5.2 2.2 30.9 28.0 19.4 45.2 23.3 15.2Asian, Non-Hispanic 41.1 32.7 3.1 9.7 1.4 13.6 6.0 1.9 24.0 1.8 4.7 13.4 15.8 19.6 41.6 19.2 14.92 or more races, Non-Hispanic 45.0 32.4 5.8 6.3 4.8 14.2 7.3 1.9 23.5 4.9 7.3 24.1 20.7 21.9 51.6 21.9 18.0
Range 24.0% 18.7% 5.7% 7.5% 4.1% 11.9% 7.7% 3.2% 14.0% 15.8% 5.1% 18.7% 13.2% 16.9% 23.8% 8.9% 12.1%Age18–24 46.4% 32.7% 7.3% 6.9% 1.2% 14.5% 8.2% 2.5% 22.9% 7.0% 5.7% 17.8% 21.6% 21.9% 51.7% 20.5% 14.4%25–34 51.6 36.0 7.7 7.0 1.7 16.0 9.2 2.3 24.3 5.9 4.7 22.7 22.8 25.7 50.1 21.6 17.335–44 52.9 37.2 7.2 8.9 2.5 18.2 8.9 3.4 25.7 6.1 4.7 27.2 24.1 26.8 50.8 35.2 21.345–54 53.1 36.1 9.8 10.2 2.4 17.4 8.7 3.2 23.3 4.4 5.2 29.1 23.4 28.0 50.3 26.9 21.955–64 51.5 36.9 9.7 11.6 2.4 19.5 12.3 3.1 24.3 4.6 6.6 28.9 20.5 27.6 53.1 19.9 20.065–74 44.9 33.4 6.1 12.2 2.9 18.0 11.0 4.3 19.9 2.0 6.1 24.8 15.4 24.1 49.1 18.8 20.575+ 28.8 21.3 4.0 9.7 1.8 10.0 7.4 1.4 10.5 0.8 2.6 12.7 6.8 11.2 42.3 10.8 16.1
Range 24.3% 15.9% 5.8% 5.3% 1.7% 9.5% 4.9% 2.9% 15.2% 6.2% 4.0% 16.4% 17.3% 16.8% 10.8% 24.4% 7.5%EducationGrade school 14.7% 6.5% 1.5% 1.8% 0.2% 1.7% 0.7% 0.1% 3.8% 8.5% 1.2% 4.9% 6.0% 3.8% 18.5% 8.1% 12.0%Some high school 28.4 14.5 2.4 2.3 0.5 5.2 2.8 0.6 9.2 5.5 2.2 11.2 11.6 9.1 34.3 17.6 13.2High school graduate 35.0 19.0 3.9 3.1 0.7 8.1 4.0 1.0 9.6 3.3 2.2 17.3 14.6 14.6 39.1 18.8 15.0Some college 55.6 38.1 8.1 9.1 1.7 17.1 9.0 3.0 23.8 4.0 5.8 27.5 23.4 28.4 56.2 26.2 21.2College graduate 69.3 57.2 13.7 16.7 4.1 30.1 17.5 5.4 40.6 6.8 8.0 35.8 30.6 39.4 66.6 30.6 23.5Graduate school 77.1 67.3 17.4 27.1 7.3 37.9 24.3 8.2 52.2 5.8 12.7 41.6 31.7 48.1 71.2 33.2 27.7
Range 62.4% 60.8% 15.9% 25.3% 7.1% 36.2% 23.6% 8.1% 48.4% 5.2% 11.5% 36.7% 25.7% 44.3% 52.7% 25.1% 15.7%Family income<$10,000 27.0% 16.1% 4.3% 4.0% 0.3% 6.6% 4.2% 0.9% 9.4% 6.7% 2.0% 10.7% 12.8% 10.3% 38.6% 10.8% 12.0%$10,000–19,999 29.3 16.8 3.6 3.9 0.9 6.3 3.7 0.6 10.3 3.4 2.5 13.0 11.2 11.4 38.3 13.2 15.1$20,000–29,999 34.6 19.3 4.1 4.4 1.5 7.7 4.1 1.4 11.9 5.5 2.6 15.5 14.0 13.9 41.7 18.3 15.2$30,000–39,999 42.5 27.0 7.1 6.8 1.1 11.0 6.7 2.6 16.3 6.1 3.8 21.8 18.7 19.9 43.2 19.7 17.6$40,000–49,999 48.8 31.8 8.9 8.7 1.6 15.4 7.4 1.7 20.2 5.9 4.1 24.7 20.7 23.2 51.9 24.2 19.5
$50,000–74,999 52.9 36.2 7.6 9.5 2.1 15.4 8.6 3.4 23.9 4.8 5.3 26.2 22.5 26.8 50.1 24.7 19.9$75,000–99,999 61.9 46.2 8.7 11.7 2.1 21.8 13.4 3.7 31.3 4.2 6.8 33.8 28.1 32.6 59.1 31.9 22.7$100,000–149,999 70.0 55.0 13.4 14.8 3.3 32.0 14.1 5.0 34.4 5.6 8.3 34.5 28.4 41.2 62.1 36.2 26.2$150,000+ 77.9 68.1 15.4 22.8 6.8 40.1 24.2 7.8 51.9 5.3 12.5 37.5 32.3 47.3 71.2 33.6 23.5
Range 50.9% 52.0% 11.8% 18.9% 6.5% 33.8% 20.5% 7.2% 42.5% 3.3% 10.5% 26.8% 21.1% 37.0% 32.9% 25.4% 14.2%Citizenship statusNative 51.4% 36.4% 9.6% 9.6% 2.2% 18.1% 10.3% 3.0% 23.7% 4.0% 5.5% 26.6% 22.1% 26.7% 52.7% 24.7% 19.7%Naturalized 39.0 28.6 3.8 9.2 2.4 11.4 6.0 2.7 19.8 7.7 4.4 15.4 15.1 16.9 39.3 21.0 19.1Non-citizen 33.9 21.0 3.5 5.9 0.9 7.3 3.4 2.6 15.3 11.3 2.9 10.4 12.2 12.8 34.1 15.0 12.9
Range 17.5% 15.4% 6.1% 3.7% 1.5% 10.8% 6.9% 0.4% 8.4% 7.3% 2.6% 16.2% 9.9% 13.9% 18.6% 9.7% 6.8%
CHAP
TER
2

42 National Endowment for the Arts
There are distinct differences between the race/ethnicity cohorts among the arts attendance rates:
■ The rate reported by African Americans for attending performances at religious institutions (26.3%) is almost twice as high as attendance at any other single activity. Only the rate for literary reading participation is higher for African Americans (42.6%). Moreover, the rate at which African Americans attend performances at religious institutions is significantly higher than the rates observed for other race cohorts. The next highest rate is 19.3% among non-Hispanic whites. These findings illustrate the key role that religious institutions play in the arts experiences of many Americans, especially African Americans. Aside from attendance at religious institutions, the next highest participation rate for African Americans is for attendance at outdoor festivals (15.4%).
■ The highest attendance rates for self-identified Hispanics are: Latin, Spanish, or salsa music (17.4%), art museums and galleries, art or craft fairs and festivals, outdoor performing arts festivals, and historic locations — all at approximately 14%. The addition of the “Latin, Spanish, or salsa music” question to the 2008 SPPA protocol illustrates how dramatically the overall picture of arts participation can change when new or different arts activities are considered.
■ Among adults who self-identified as American Indian, an emphasis was observed on festival activities, with 30.9% attending art or craft fairs and festivals, and 28.0% attending outdoor performing arts festivals — the highest rates observed across the race/ethnicity cohorts. Asians reported above-average rates of participation in classical music (9.7%) and art museums and galleries (24.0%).
■ With the exception of visiting art museums, African Americans, Hispanics, and American Indians reported relatively higher rates of attendance at non-benchmark activities, compared to whites. Overall, the most popular non-benchmark arts activities are arts or craft fairs and festivals, outdoor arts festivals featuring performing artists, and visits to historic locations and parks, suggesting the key role that these events and facilities play in the cultural lives of Americans as a whole.
Overall, many significant differences in participation rates across the race/ethnicity cohorts were observed, suggesting that Americans with different ethnic and cultural backgrounds have different experiences with the arts. Of course, many other factors apart from racial/ethnic identity may influence participation rates, such as mobility, setting preferences, cultural customs, and, of course, supply.
AgeRates of attendance at art or craft fairs and festivals, outdoor performing arts festivals, and historic locations and parks, are higher for Americans under age 64, while attendance tends to be highest among those aged 55 and older. Attendance rates for Latin, Spanish, or salsa music are inversely related to age — the lower the age, the higher the attendance rate.
Educational attainmentEducational attainment is positively associated with arts attendance, as discussed in numerous other SPPA reports. Mirroring prior research, higher levels of education are associated with higher levels of attendance for each of the activities, except for attendance at Latin, Spanish, or salsa music concerts, for which the highest rate of attendance is observed among individuals reporting a grade-school education level (8.5%).
Looking at the percentages in Table 3, there is a noticeable jump in rates of attendance between those having graduated from high school and those having had some college education. For many activities, there is another jump in attendance rates for college graduates. This pattern may suggest something like a “Sheepskin Effect” in the data — attendance rates may not necessarily increase incrementally with an additional year of education, but surpassing certain educational milestones, like graduation from high school, attending college and completing college, are significant correlates with higher attendance rates.
Family income
Participation rates by family income level generally mirror those observed for educational attainment — Americans with higher income levels tend to report higher rates of attendance. Again, the one exception is attendance at Latin, Spanish, or salsa music events, for which participation rates do not vary significantly by income level.
43Beyond attendance: A multi-modal understanding of arts participation
Citizenship statusPrior research has also explored the types of arts and cultural activities that have meaning to immigrant communities (Moriarty, 2004). We include citizenship status as a rough proxy for personal connection to cultural heritage in the SPPA. While there are a multitude of legal and other reasons that a person takes into consideration when choosing whether to become a naturalized U.S. citizen when eligible, the immigration literature cites ties to cultural heritage as one of them.
Almost uniformly, native-born citizens report the highest rates of attendance, while naturalized citizens report the second highest rates, and non-citizens report the lowest rates, with the exception of Latin, Spanish, or salsa music, for which non-citizens report almost three times the level of activity of native citizens (11.3% vs. 4%, respectively).
Overall, the attendance patterns observed across the SPPA demographic cohorts suggest that Americans with different demographic backgrounds have different needs and interests, and that educational attainment and family income are significant barriers to attendance for almost all of the activities measured in the SPPA, including outdoor events.
Likelihood of attendance
Table 4 examines the marginal differences in the likelihood of attendance51 at benchmark activities and attendance at any arts activities52 by demographic group. Prior NEA research reports have included similar analysis on benchmark activities, but not on the broader set of attendance activities captured in the SPPA. The comparison of these sets of activities reveals different information about arts participation in terms of who participates.
The analysis isolates the marginal effects of specific demographic characteristics while controlling for the effects of other demographics. The demographic categories listed in the table at “0%” serve as the comparison group within each category. For example, individuals who attended graduate school were 44.2% more likely than individuals with a grade-school education to attend a benchmark arts activity in the 12 months ending in May 2008. Asterisks denote statistically significant marginal effects. While statistically significant and positive, the marginal effects of higher levels of education are not as large for attendance at any arts activities as they are for attendance at benchmark arts activities.
As reported in the right-hand columns of Table 4, individuals who have had any experience with an arts lesson are 22% more likely than those with no history of arts lessons to have attended a benchmark activity within the last 12 months, and 29% more likely to have attended any type of arts activity. Controlling for participation in arts lessons increases the differences between genders: women are 8.8% more likely than men to attend a benchmark activity. Also, controlling for arts lessons slightly reduces the impact of income and education on attendance at benchmark activities.
The preceding analyses demonstrate that attendance patterns differ significantly across demographic cohorts and across the various types of events attended. However, these demographic variables account for less than 20% of the variation in attendance at benchmark arts attendance activities.53 Earlier NEA monographs have also looked at the extent to which demographics explain reported attendance, and prior results also hover around 20% (Peterson et al., 2000, 53; Peterson et al., 1996, 40–45). Can the SPPA provide insight into what explains the remaining 80% of the variability in attendance?
Underlying characteristics: an exploratory analysis
This section describes the results of an exploratory factor analysis to ascertain what underlying elements may help to explain the patterns of participation via attendance. Factor analysis looks at the variability of participation in the attendance data captured in the SPPA 2008 to explore underlying, unobserved characteristics within the data. We know that the SPPA captures data on self-reported behavior for specific art forms, and we hypothesize that it also indirectly captures other aspects of the arts participation experience. For example, we hypothesize that analysis of attendance patterns may reveal something about preferences for different settings or venues for participation.
Applying factor analysis to the attendance variables,54 two factors emerge relating to the settings in which arts activities take place, and account for over 30% of the variance among the attendance activities included. The results of the exploratory factor analysis are included in Table 5.55 Based on the theoretical frameworks discussed in the earlier Context section of this monograph, the factors
CHAP
TER
2

44 National Endowment for the Arts
TABLE 4Marginal impact of demographics on U.S. adults’ likelihood of arts participation via attendance: 2008
Any arts lessons
Attend benchmark activity
Attend any arts activities
Attend benchmark activity
Attend any arts activities
Gender
Male 0.0% 0.0% 0.0% 0.0%
Female 6.4** 5.8** 8.8** 5.6**
Race/ethnicity
White, Non-Hispanic 0.0% 0.0% 0.0% 0.0%
African American, Non-Hispanic -10.5** -16.2** -10.7** -17.4**
Hispanic -4.1* -3.9* 0.1 1.3
American Indian, Non-Hispanic -4.1 8.2 -20.9 22.0
Asian, Non-Hispanic -10.5** -17.3** 0.6 -7.4
2 or more races, Non-Hispanic -5.0 -7.8 -0.9 -9.1
Age
18–24 0.0% 0.0% 0.0% 0.0%
25–34 8.8** 6.2* 15.4** 9.7
35–44 7.0* 5.3 16.5** 9.6
45–54 7.3** 9.0** 15.1** 15.0**
55–64 6.5* 6.3* 10.0 10.0
65–74 13.5** 7.9** 22.4** 15.3**
75+ 2.0 -6.1 10.6 -0.1
Education
Grade school 0.0% 0.0% 0.0% 0.0%
Some high school -0.2 2.2 2.5 0.8
High school graduate 6.9* 9.3** 7.6 6.8
Some college 21.1** 23.0** 21.3** 18.9**
College graduate 36.2** 31.8** 29.7** 24.1**
Graduate school 44.2** 37.0** 35.2** 29.2**
Family income
Less than $10,000 0.0% 0.0% 0.0% 0.0%
$10,000–19,999 -0.9 0.6 -4.1 -4.5
$20,000–29,999 -2.9 1.6 -4.9 -0.9
$30,000–39,999 6.3 7.7* 4.6 5.1
$40,000–49,999 7.9* 10.8** 1.5 4.5
$50,000–74,999 12.1** 13.9** 11.8* 9.9
$75,000–99,999 20.8** 21.3** 18.3** 18.3**
$100,000–149,999 24.7** 23.6** 18.9** 17.4**
$150,000+ 33.8** 28.1** 32.9** 24.7**
Citizenship status
Native 0.0% 0.0% 0.0% 0.0%
Naturalized -5.5** -9.6** -1.8 -2.5
Non-citizen -5.7** -6.5** -1.3 -0.2
Other
Married 0.1% 4.0%** 0.4% 6.0%*
No child or child under 18 0.0 -5.2** 2.3 -5.8**
Reside in metropolitan area 5.9** 2.0 4.2* 2.0
Any arts lessons – – 22.0** 28.7**
* Statistically significant at the 90% confidence level ** Statistically significant at the 95% confidence level

45Beyond attendance: A multi-modal understanding of arts participation
appear to separate the attendance activities based on the types of settings implied by the activities. Regarding Factor 1, musical and non-musical stage plays, classical music, jazz, and dance are all types of live performances. These activities are usually one-off, temporal events, meaning that they occur sometimes only once, and usually at a specific time and place. Attending such an event requires prior planning (to get tickets if required, to research what is being offered, etc.). This behavior contrasts with the type associated with Factor 2 activities — attendance at art or craft fairs and festivals or outdoor performing arts festivals, and visits to historic locations — which might be considered to be “destination activities.” They may or may not require advance information-gathering, and may or may not involve an admission price. For these “destination” activities, attendees often can decide what specific programs and exhibits they want to see after they arrive, allowing themselves an additional level of control over the experience. Art museums are uniquely, and equally, associated with each of the two factors, suggesting that they incorporate both “event” and “destination” qualities.
MODE OF PARTICIPATION: ARTS CREATION Rates of arts creation
In 2008, 45.3% of U.S. adults reported participating in an arts-creation activity as measured by the SPPA. Table 6 reports rates of participation in arts-creation activities for 1992, 2002, and 2008.56 Among the highest rates of individual arts-creation activities were the rates for “weaving, crocheting, quilting, needlepoint, or sewing” (13.1%) and making “photographs, movies, or videotapes as an artistic activity” (14.7%). For the first time, the 2008 SPPA included a question about “creating and posting you own art online” (7.3%).
The SPPA first included questions about arts creation in 1982; however, changes in question-wording limited trend analysis between 1992, 2002, and 2008.57 Using questions that have remained constant over time, U.S. adults reported lower rates of participation in arts creation and performance activities in 2002, compared to the 1992 rates. Yet the rate of participation in arts-creation activities reported in 2008 (41.1%) is not statistically different from the 2002 rate (42.2%). Although these data originated from only two points in time, spanning six years, they suggest that U.S. adult participation in personally creating and performing arts is holding steady, albeit at a rate lower than in 1992.58
The curatorial act of owning original art is among the highest of the personal participation rates, at 20.4% in 2008.59 The participation rate for purchasing art within the prior 12 months is 5.9%.
CHAP
TER
2
TABLE 5Factor analysis results for arts attendance activities: 2008
Factor loading
Attendance activity 1 2 Communality
Art museum 0.47 0.47 0.37
Art or craft fairs and festivals 0.72 0.35
Outdoor performing artists festival
0.66 0.32
Historic location 0.36 0.46 0.30
Musical stage play 0.51 0.27
Classical music 0.54 0.26
Non-musical stage play 0.47 0.22
Jazz 0.40 0.19
Other dance 0.41 0.16
Ballet 0.39 0.11
Opera 0.37 0.11
Latin, Spanish, or salsa music 0.06
Eigen values 3.59 1.21
% of variance 29.90 10.04
Note: Loadings < 0.30 are suppressed

46 National Endowment for the Arts
TABLE 6Rates of U.S. adult participation in arts creation activities: 1992, 2002, 2008
Percent of adults personally performing or creating
1992 2002 2008
Total comparable creative activities 54.7% 42.2% 41.1%
% change from prior year -12.5^ -1.1
Performing
Music Jazz 1.7% 1.3% 1.4%
% change from prior year -0.4 0.1
Classical music 4.2 1.8 3.1
% change from prior year -2.4^ 1.3^
Opera 1.1 0.7 0.4
% change from prior year -0.4 -0.3
Choir/chorale 6.3 4.8 5.2
% change from prior year -1.5 0.4
Playing a musical instrument na na 12.6
Plays Musical plays 3.8 2.4 0.9
% change from prior year -1.4 -1.5^
Non-musical plays 1.6 1.4 0.8
% change from prior year -0.2 -0.6
Dance Ballet 0.2 0.3 na
Other dance 8.1 4.2 na
All dance na na 2.1
Creating
Visual arts Painting/drawing/sculpture 9.6% 8.6% 9.0%
% change from prior year -1.0 0.4
Pottery/jewelry 8.4 6.9 6.0
% change from prior year -1.5 -0.9
Weaving/sewing 24.8 16.0 13.1
% change from prior year -8.8^ -2.9^
Photography/movies 11.6 11.5 14.7
% change from prior year -0.1 3.2^
Literature Creative writing 7.4 7.0 6.9
% change from prior year -0.4 -0.1
Online Created/posted own art** na na 7.3
Curatorial activities
Own original art 22.1% 19.3% 20.4%
% change from prior year -2.8 1.1
Purchased art in the last 12 months*
7.3 5.7 5.9
% change from prior year -1.6 0.2
^ Significant at 95% confidence* Not utilized in Total Comparable Activities because the activity is a subset of
“Own original art”** Not utilized in Total Comparable Activities because of weighting differences in SPPA08
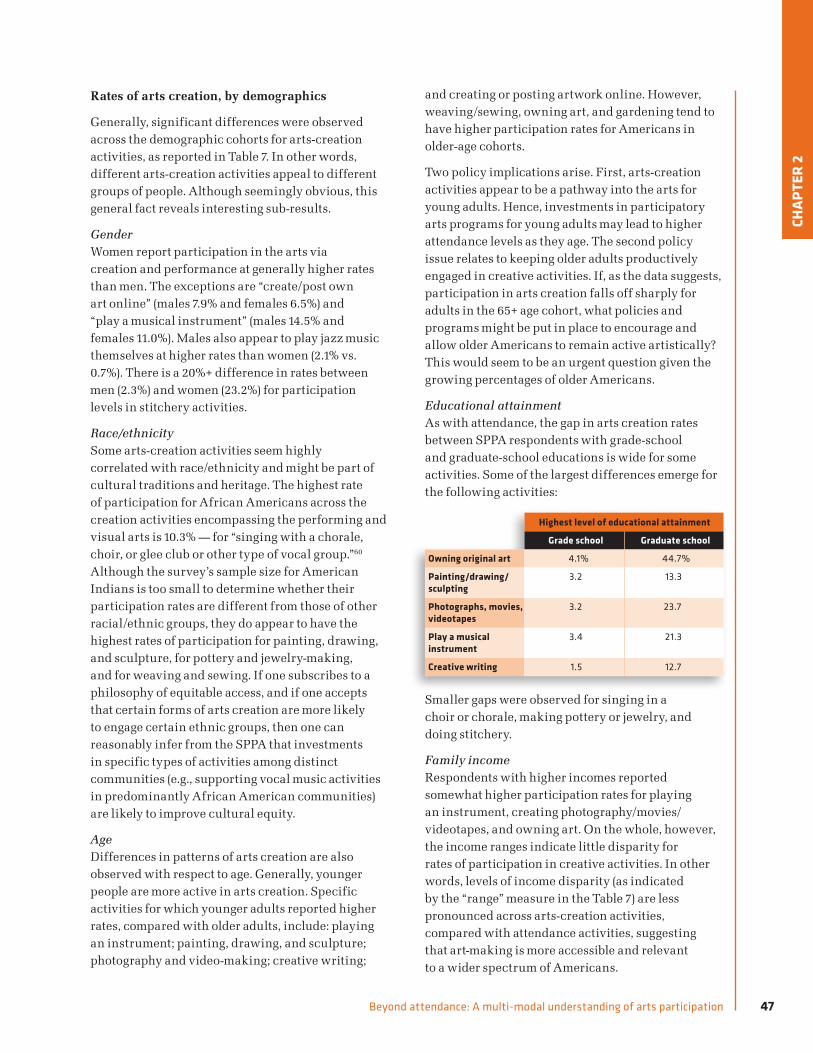
47Beyond attendance: A multi-modal understanding of arts participation
Rates of arts creation, by demographics
Generally, significant differences were observed across the demographic cohorts for arts-creation activities, as reported in Table 7. In other words, different arts-creation activities appeal to different groups of people. Although seemingly obvious, this general fact reveals interesting sub-results.
GenderWomen report participation in the arts via creation and performance at generally higher rates than men. The exceptions are “create/post own art online” (males 7.9% and females 6.5%) and “play a musical instrument” (males 14.5% and females 11.0%). Males also appear to play jazz music themselves at higher rates than women (2.1% vs. 0.7%). There is a 20%+ difference in rates between men (2.3%) and women (23.2%) for participation levels in stitchery activities.
Race/ethnicitySome arts-creation activities seem highly correlated with race/ethnicity and might be part of cultural traditions and heritage. The highest rate of participation for African Americans across the creation activities encompassing the performing and visual arts is 10.3% — for “singing with a chorale, choir, or glee club or other type of vocal group.”60 Although the survey’s sample size for American Indians is too small to determine whether their participation rates are different from those of other racial/ethnic groups, they do appear to have the highest rates of participation for painting, drawing, and sculpture, for pottery and jewelry-making, and for weaving and sewing. If one subscribes to a philosophy of equitable access, and if one accepts that certain forms of arts creation are more likely to engage certain ethnic groups, then one can reasonably infer from the SPPA that investments in specific types of activities among distinct communities (e.g., supporting vocal music activities in predominantly African American communities) are likely to improve cultural equity.
AgeDifferences in patterns of arts creation are also observed with respect to age. Generally, younger people are more active in arts creation. Specific activities for which younger adults reported higher rates, compared with older adults, include: playing an instrument; painting, drawing, and sculpture; photography and video-making; creative writing;
and creating or posting artwork online. However, weaving/sewing, owning art, and gardening tend to have higher participation rates for Americans in older-age cohorts.
Two policy implications arise. First, arts-creation activities appear to be a pathway into the arts for young adults. Hence, investments in participatory arts programs for young adults may lead to higher attendance levels as they age. The second policy issue relates to keeping older adults productively engaged in creative activities. If, as the data suggests, participation in arts creation falls off sharply for adults in the 65+ age cohort, what policies and programs might be put in place to encourage and allow older Americans to remain active artistically? This would seem to be an urgent question given the growing percentages of older Americans.
Educational attainmentAs with attendance, the gap in arts creation rates between SPPA respondents with grade-school and graduate-school educations is wide for some activities. Some of the largest differences emerge for the following activities:
Highest level of educational attainment
Grade school Graduate school
Owning original art 4.1% 44.7%
Painting/drawing/sculpting
3.2 13.3
Photographs, movies, videotapes
3.2 23.7
Play a musical instrument
3.4 21.3
Creative writing 1.5 12.7
CHAP
TER
2
Smaller gaps were observed for singing in a choir or chorale, making pottery or jewelry, and doing stitchery.
Family incomeRespondents with higher incomes reported somewhat higher participation rates for playing an instrument, creating photography/movies/ videotapes, and owning art. On the whole, however, the income ranges indicate little disparity for rates of participation in creative activities. In other words, levels of income disparity (as indicated by the “range” measure in the Table 7) are less pronounced across arts-creation activities, compared with attendance activities, suggesting that art-making is more accessible and relevant to a wider spectrum of Americans.
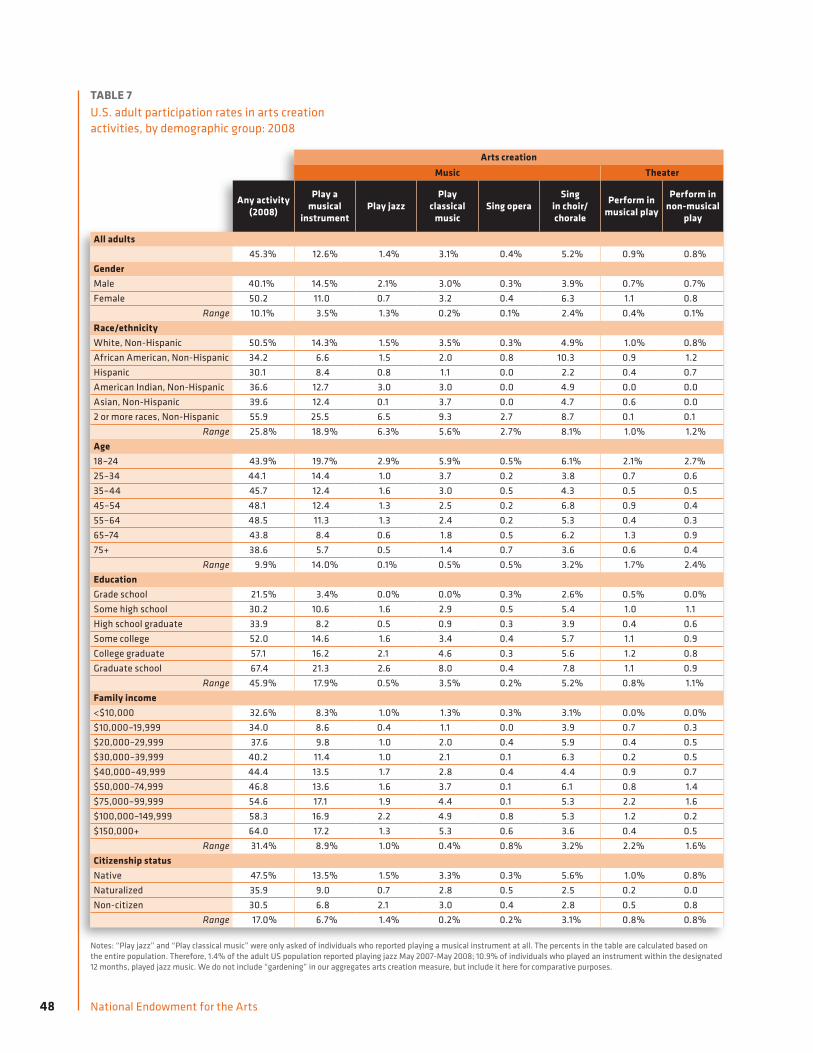
48 National Endowment for the Arts
TABLE 7U.S. adult participation rates in arts creation activities, by demographic group: 2008
Arts creation Arts creationMusic Theater Dance Visual arts Literature Curation Other
Any activity
(2008)
Play a musical
instrumentPlay jazz
Play classical
musicSing opera
Sing in choir/chorale
Perform in musical play
Perform in non-musical
playDance Paint/draw/
sculpt
Make pottery/jewelry
Weave/sew
Photo- graphy/
make movies
Creative writing
Own original
art
Acquire art
Create/post own art online
Gardening
All adults45.3% 12.6% 1.4% 3.1% 0.4% 5.2% 0.9% 0.8% 2.1% 9.0% 6.0% 13.1% 14.7% 6.9% 20.4% 5.9% 7.2% 41.6%
GenderMale 40.1% 14.5% 2.1% 3.0% 0.3% 3.9% 0.7% 0.7% 1.4% 7.1% 4.5% 2.3% 13.3% 6.2% 19.7% 5.8% 7.9% 33.6%Female 50.2 11.0 0.7 3.2 0.4 6.3 1.1 0.8 2.8 10.7 7.4 23.2 16.1 7.5 21.1 5.9 6.5 48.9
Range 10.1% 3.5% 1.3% 0.2% 0.1% 2.4% 0.4% 0.1% 1.4% 3.6% 2.9% 20.9% 2.8% 1.3% 1.4% 0.1% 1.4% 15.3%Race/ethnicityWhite, Non-Hispanic 50.5% 14.3% 1.5% 3.5% 0.3% 4.9% 1.0% 0.8% 2.2% 9.4% 6.9% 15.5% 16.1% 7.0% 25.1% 7.7% 7.1% 47.2%African American, Non-Hispanic 34.2 6.6 1.5 2.0 0.8 10.3 0.9 1.2 1.6 6.8 3.5 7.6 10.0 7.5 9.0 1.8 5.8 24.4Hispanic 30.1 8.4 0.8 1.1 0.0 2.2 0.4 0.7 1.5 7.4 3.6 7.1 10.9 5.3 9.1 2.8 7.2 28.0American Indian, Non-Hispanic 36.6 12.7 3.0 3.0 0.0 4.9 0.0 0.0 0.7 13.9 12.3 14.2 7.9 14.0 16.3 3.8 10.8 23.7Asian, Non-Hispanic 39.6 12.4 0.1 3.7 0.0 4.7 0.6 0.0 3.7 9.3 2.8 8.0 14.0 7.6 12.7 1.4 10.4 41.92 or more races, Non-Hispanic 55.9 25.5 6.5 9.3 2.7 8.7 0.1 0.1 4.1 21.9 17.1 17.0 29.1 8.2 18.1 5.0 11.3 40.5
Range 25.8% 18.9% 6.3% 5.6% 2.7% 8.1% 1.0% 1.2% 3.4% 15.1% 14.3% 9.9% 21.2% 8.7% 16.1% 6.3% 5.5% 23.5%Age18–24 43.9% 19.7% 2.9% 5.9% 0.5% 6.1% 2.1% 2.7% 2.9% 14.7% 6.4% 9.0% 17.8% 11.3% 11.5% 4.3% 12.5% 15.1%25–34 44.1 14.4 1.0 3.7 0.2 3.8 0.7 0.6 2.2 11.3 6.1 10.0 16.1 9.7 17.6 6.9 9.4 34.835–44 45.7 12.4 1.6 3.0 0.5 4.3 0.5 0.5 1.8 9.9 7.5 11.4 18.6 6.2 20.6 5.6 7.2 43.945–54 48.1 12.4 1.3 2.5 0.2 6.8 0.9 0.4 2.1 7.4 7.0 15.4 14.6 6.4 23.7 6.6 3.7 49.155–64 48.5 11.3 1.3 2.4 0.2 5.3 0.4 0.3 1.8 6.8 5.4 15.7 13.0 4.4 26.7 6.8 5.1 52.465–74 43.8 8.4 0.6 1.8 0.5 6.2 1.3 0.9 3.1 5.0 4.1 17.7 10.4 5.2 21.0 6.0 4.4 54.575+ 38.6 5.7 0.5 1.4 0.7 3.6 0.6 0.4 1.5 4.4 2.1 15.4 5.5 3.1 20.2 2.9 1.2 41.0
Range 9.9% 14.0% 0.1% 0.5% 0.5% 3.2% 1.7% 2.4% 1.6% 10.3% 5.4% 8.7% 13.1% 8.2% 15.2% 4.0% 11.3% 39.4%EducationGrade school 21.5% 3.4% 0.0% 0.0% 0.3% 2.6% 0.5% 0.0% 0.6% 3.2% 2.3% 9.5% 3.2% 1.5% 4.1% 0.5% 0.0% 30.3%Some high school 30.2 10.6 1.6 2.9 0.5 5.4 1.0 1.1 0.8 9.1 4.4 7.6 10.0 4.5 5.5 0.5 5.8 29.5High school graduate 33.9 8.2 0.5 0.9 0.3 3.9 0.4 0.6 1.6 5.0 4.0 11.2 8.3 3.4 10.7 2.6 4.1 37.7Some college 52.0 14.6 1.6 3.4 0.4 5.7 1.1 0.9 2.8 11.3 7.5 15.9 17.0 8.8 23.1 6.2 8.0 43.2College graduate 57.1 16.2 2.1 4.6 0.3 5.6 1.2 0.8 2.4 11.1 7.9 15.0 22.7 9.5 32.3 10.5 9.3 49.0Graduate school 67.4 21.3 2.6 8.0 0.4 7.8 1.1 0.9 3.5 13.3 7.8 15.2 23.7 12.7 44.7 14.6 9.1 53.3
Range 45.9% 17.9% 0.5% 3.5% 0.2% 5.2% 0.8% 1.1% 2.9% 10.1% 5.6% 8.3% 20.5% 11.2% 40.6% 14.2% 9.3% 23.8%Family income<$10,000 32.6% 8.3% 1.0% 1.3% 0.3% 3.1% 0.0% 0.0% 1.7% 8.0% 4.0% 12.3% 10.1% 8.8% 10.9% 3.9% 13.7% 25.3%$10,000–19,999 34.0 8.6 0.4 1.1 0.0 3.9 0.7 0.3 1.8 7.4 3.6 13.5 9.6 5.4 9.0 1.2 5.4 30.4$20,000–29,999 37.6 9.8 1.0 2.0 0.4 5.9 0.4 0.5 1.9 8.5 5.0 13.6 9.1 7.7 11.5 2.1 9.0 35.4$30,000–39,999 40.2 11.4 1.0 2.1 0.1 6.3 0.2 0.5 2.5 8.4 6.0 13.1 12.1 6.2 13.4 2.8 5.3 37.7$40,000–49,999 44.4 13.5 1.7 2.8 0.4 4.4 0.9 0.7 2.3 9.1 5.1 14.1 13.8 7.1 19.5 6.4 4.8 44.9$50,000–74,999 46.8 13.6 1.6 3.7 0.1 6.1 0.8 1.4 1.5 10.5 6.7 13.6 15.2 5.9 21.2 6.3 7.7 42.8$75,000–99,999 54.6 17.1 1.9 4.4 0.1 5.3 2.2 1.6 2.8 10.3 7.7 13.7 20.7 9.3 26.3 6.8 8.0 50.2$100,000–149,999 58.3 16.9 2.2 4.9 0.8 5.3 1.2 0.2 2.9 10.0 8.5 13.1 22.3 8.6 32.1 11.5 8.4 54.0$150,000+ 64.0 17.2 1.3 5.3 0.6 3.6 0.4 0.5 2.4 9.8 8.2 13.8 21.3 6.6 44.5 14.4 7.0 50.9
Range 31.4% 8.9% 1.0% 0.4% 0.8% 3.2% 2.2% 1.6% 1.4% 3.1% 4.9% 1.8% 13.2% 3.9 35.5% 13.2% 8.9% 28.7%Citizenship statusNative 47.5% 13.5% 1.5% 3.3% 0.3% 5.6% 1.0% 0.8% 2.2% 9.5% 6.5% 13.7% 15.4% 7.3% 22.0% 6.6% 7.3% 42.7%Naturalized 35.9 9.0 0.7 2.8 0.5 2.5 0.2 0.0 3.6 7.3 4.7 10.4 12.0 5.0 12.3 2.0 8.0 43.2Non-citizen 30.5 6.8 2.1 3.0 0.4 2.8 0.5 0.8 0.8 5.0 1.8 9.1 9.7% 4.5 10.2 1.1 4.5 27.9
Range 17.0% 6.7% 1.4% 0.2% 0.2% 3.1% 0.8% 0.8% 2.8% 4.5% 4.7% 4.6% 5.7% 2.8% 11.8% 5.5% 3.5% 15.3%
Notes: “Play jazz” and “Play classical music” were only asked of individuals who reported playing a musical instrument at all. The percents in the table are calculated based on the entire population. Therefore, 1.4% of the adult US population reported playing jazz May 2007-May 2008; 10.9% of individuals who played an instrument within the designated 12 months, played jazz music. We do not include “gardening” in our aggregates arts creation measure, but include it here for comparative purposes.

49Beyond attendance: A multi-modal understanding of arts participation
Arts creation Arts creationMusic Theater Dance Visual arts Literature Curation Other
Any activity
(2008)
Play a musical
instrumentPlay jazz
Play classical
musicSing opera
Sing in choir/chorale
Perform in musical play
Perform in non-musical
playDance Paint/draw/
sculpt
Make pottery/jewelry
Weave/sew
Photo- graphy/
make movies
Creative writing
Own original
art
Acquire art
Create/post own art online
Gardening
All adults45.3% 12.6% 1.4% 3.1% 0.4% 5.2% 0.9% 0.8% 2.1% 9.0% 6.0% 13.1% 14.7% 6.9% 20.4% 5.9% 7.2% 41.6%
GenderMale 40.1% 14.5% 2.1% 3.0% 0.3% 3.9% 0.7% 0.7% 1.4% 7.1% 4.5% 2.3% 13.3% 6.2% 19.7% 5.8% 7.9% 33.6%Female 50.2 11.0 0.7 3.2 0.4 6.3 1.1 0.8 2.8 10.7 7.4 23.2 16.1 7.5 21.1 5.9 6.5 48.9
Range 10.1% 3.5% 1.3% 0.2% 0.1% 2.4% 0.4% 0.1% 1.4% 3.6% 2.9% 20.9% 2.8% 1.3% 1.4% 0.1% 1.4% 15.3%Race/ethnicityWhite, Non-Hispanic 50.5% 14.3% 1.5% 3.5% 0.3% 4.9% 1.0% 0.8% 2.2% 9.4% 6.9% 15.5% 16.1% 7.0% 25.1% 7.7% 7.1% 47.2%African American, Non-Hispanic 34.2 6.6 1.5 2.0 0.8 10.3 0.9 1.2 1.6 6.8 3.5 7.6 10.0 7.5 9.0 1.8 5.8 24.4Hispanic 30.1 8.4 0.8 1.1 0.0 2.2 0.4 0.7 1.5 7.4 3.6 7.1 10.9 5.3 9.1 2.8 7.2 28.0American Indian, Non-Hispanic 36.6 12.7 3.0 3.0 0.0 4.9 0.0 0.0 0.7 13.9 12.3 14.2 7.9 14.0 16.3 3.8 10.8 23.7Asian, Non-Hispanic 39.6 12.4 0.1 3.7 0.0 4.7 0.6 0.0 3.7 9.3 2.8 8.0 14.0 7.6 12.7 1.4 10.4 41.92 or more races, Non-Hispanic 55.9 25.5 6.5 9.3 2.7 8.7 0.1 0.1 4.1 21.9 17.1 17.0 29.1 8.2 18.1 5.0 11.3 40.5
Range 25.8% 18.9% 6.3% 5.6% 2.7% 8.1% 1.0% 1.2% 3.4% 15.1% 14.3% 9.9% 21.2% 8.7% 16.1% 6.3% 5.5% 23.5%Age18–24 43.9% 19.7% 2.9% 5.9% 0.5% 6.1% 2.1% 2.7% 2.9% 14.7% 6.4% 9.0% 17.8% 11.3% 11.5% 4.3% 12.5% 15.1%25–34 44.1 14.4 1.0 3.7 0.2 3.8 0.7 0.6 2.2 11.3 6.1 10.0 16.1 9.7 17.6 6.9 9.4 34.835–44 45.7 12.4 1.6 3.0 0.5 4.3 0.5 0.5 1.8 9.9 7.5 11.4 18.6 6.2 20.6 5.6 7.2 43.945–54 48.1 12.4 1.3 2.5 0.2 6.8 0.9 0.4 2.1 7.4 7.0 15.4 14.6 6.4 23.7 6.6 3.7 49.155–64 48.5 11.3 1.3 2.4 0.2 5.3 0.4 0.3 1.8 6.8 5.4 15.7 13.0 4.4 26.7 6.8 5.1 52.465–74 43.8 8.4 0.6 1.8 0.5 6.2 1.3 0.9 3.1 5.0 4.1 17.7 10.4 5.2 21.0 6.0 4.4 54.575+ 38.6 5.7 0.5 1.4 0.7 3.6 0.6 0.4 1.5 4.4 2.1 15.4 5.5 3.1 20.2 2.9 1.2 41.0
Range 9.9% 14.0% 0.1% 0.5% 0.5% 3.2% 1.7% 2.4% 1.6% 10.3% 5.4% 8.7% 13.1% 8.2% 15.2% 4.0% 11.3% 39.4%EducationGrade school 21.5% 3.4% 0.0% 0.0% 0.3% 2.6% 0.5% 0.0% 0.6% 3.2% 2.3% 9.5% 3.2% 1.5% 4.1% 0.5% 0.0% 30.3%Some high school 30.2 10.6 1.6 2.9 0.5 5.4 1.0 1.1 0.8 9.1 4.4 7.6 10.0 4.5 5.5 0.5 5.8 29.5High school graduate 33.9 8.2 0.5 0.9 0.3 3.9 0.4 0.6 1.6 5.0 4.0 11.2 8.3 3.4 10.7 2.6 4.1 37.7Some college 52.0 14.6 1.6 3.4 0.4 5.7 1.1 0.9 2.8 11.3 7.5 15.9 17.0 8.8 23.1 6.2 8.0 43.2College graduate 57.1 16.2 2.1 4.6 0.3 5.6 1.2 0.8 2.4 11.1 7.9 15.0 22.7 9.5 32.3 10.5 9.3 49.0Graduate school 67.4 21.3 2.6 8.0 0.4 7.8 1.1 0.9 3.5 13.3 7.8 15.2 23.7 12.7 44.7 14.6 9.1 53.3
Range 45.9% 17.9% 0.5% 3.5% 0.2% 5.2% 0.8% 1.1% 2.9% 10.1% 5.6% 8.3% 20.5% 11.2% 40.6% 14.2% 9.3% 23.8%Family income<$10,000 32.6% 8.3% 1.0% 1.3% 0.3% 3.1% 0.0% 0.0% 1.7% 8.0% 4.0% 12.3% 10.1% 8.8% 10.9% 3.9% 13.7% 25.3%$10,000–19,999 34.0 8.6 0.4 1.1 0.0 3.9 0.7 0.3 1.8 7.4 3.6 13.5 9.6 5.4 9.0 1.2 5.4 30.4$20,000–29,999 37.6 9.8 1.0 2.0 0.4 5.9 0.4 0.5 1.9 8.5 5.0 13.6 9.1 7.7 11.5 2.1 9.0 35.4$30,000–39,999 40.2 11.4 1.0 2.1 0.1 6.3 0.2 0.5 2.5 8.4 6.0 13.1 12.1 6.2 13.4 2.8 5.3 37.7$40,000–49,999 44.4 13.5 1.7 2.8 0.4 4.4 0.9 0.7 2.3 9.1 5.1 14.1 13.8 7.1 19.5 6.4 4.8 44.9$50,000–74,999 46.8 13.6 1.6 3.7 0.1 6.1 0.8 1.4 1.5 10.5 6.7 13.6 15.2 5.9 21.2 6.3 7.7 42.8$75,000–99,999 54.6 17.1 1.9 4.4 0.1 5.3 2.2 1.6 2.8 10.3 7.7 13.7 20.7 9.3 26.3 6.8 8.0 50.2$100,000–149,999 58.3 16.9 2.2 4.9 0.8 5.3 1.2 0.2 2.9 10.0 8.5 13.1 22.3 8.6 32.1 11.5 8.4 54.0$150,000+ 64.0 17.2 1.3 5.3 0.6 3.6 0.4 0.5 2.4 9.8 8.2 13.8 21.3 6.6 44.5 14.4 7.0 50.9
Range 31.4% 8.9% 1.0% 0.4% 0.8% 3.2% 2.2% 1.6% 1.4% 3.1% 4.9% 1.8% 13.2% 3.9 35.5% 13.2% 8.9% 28.7%Citizenship statusNative 47.5% 13.5% 1.5% 3.3% 0.3% 5.6% 1.0% 0.8% 2.2% 9.5% 6.5% 13.7% 15.4% 7.3% 22.0% 6.6% 7.3% 42.7%Naturalized 35.9 9.0 0.7 2.8 0.5 2.5 0.2 0.0 3.6 7.3 4.7 10.4 12.0 5.0 12.3 2.0 8.0 43.2Non-citizen 30.5 6.8 2.1 3.0 0.4 2.8 0.5 0.8 0.8 5.0 1.8 9.1 9.7% 4.5 10.2 1.1 4.5 27.9
Range 17.0% 6.7% 1.4% 0.2% 0.2% 3.1% 0.8% 0.8% 2.8% 4.5% 4.7% 4.6% 5.7% 2.8% 11.8% 5.5% 3.5% 15.3%
CHAP
TER
2

50 National Endowment for the Arts
TABLE 8Marginal impact of demographics on U.S. adults’ likelihood of participating via arts creation: 2008
Participate in arts creation activity
Controlling for any arts lessons
Gender
Male 0.0% 0.0%
Female 15.5** 14.9**
Race/ethnicity
White, Non-Hispanic 0.0% 0.0%
African American, Non-Hispanic -7.2** 3.8
Hispanic -4.4 -0.4
American Indian, Non-Hispanic -13.1 0.1
Asian, Non-Hispanic -5.3 -4.8
2 or more races, Non-Hispanic 5.1 22.0
Age
18–24 0.0% 0.0
25–34 -1.7 3.3
35–44 0.7 4.0
45–54 3.1 8.7
55–64 0.8 8.1
65–74 3.2 9.2
75+ -1.7 14.0
Education
Grade school 0.0% 0.0%
Some high school -1.0 2.2
High school graduate -2.4 -7.7
Some college 12.8** 2.0
College graduate 15.6** 1.2
Graduate school 23.3** 9.1
Family income
Less than $10,000 0.0% 0.0%
$10,000–19,999 -2.3 7.2
$20,000–29,999 3.7 11.0
$30,000–39,999 3.1 5.2
$40,000–49,999 7.2 13.2
$50,000–74,999 4.8 14.9
$75,000–99,999 10.3** 18.9*
$100,000–149,999 9.9* 15.1
$150,000+ 1.3 15.9
Citizenship status
Native 0.0% 0.0%
Naturalized -8.3** -4.4
Non-citizen -6.5* 6.4
Other
Married 3.3% 0.3%
No child or child under 18 -5.6** -5.4
Reside in metropolitan area -5.7** -10.2**
Any arts lessons 32.1**
* Statistically significant at the 90% confidence level ** Statistically significant at the 95% confidence level
“Who” is likely to create?
Demographic characteristics play a minor role in predicting “who” is likely to participate in arts-creation activities at least once in the past year. When we control for the respondent’s history of taking arts lessons, the role of demographic characteristics diminishes. In 2008, SPPA respondents who had taken arts lessons at any point in their lives were, on average, 32% more likely than adults who had not to participate in arts-creation activities that year. In addition to arts lessons, two demographic characteristics significantly predict the likelihood that someone participates in arts-creation activities: females (15% more likely than males to participate), and people living in metropolitan areas (10% less likely to participate in arts-creation activities). (See Table 8.)
Underlying characteristics
Overall, the demographic variables explored in these analyses account only for 6% of the variability observed in the participation rates for arts creation.61 What other factors might explain more of the variability? The following section uses exploratory factor analysis to look at what underlying characteristics may be derived from patterns of participation via arts creation. (See Table 9.) We hypothesize, for example, that creative activities may naturally group together based on the implied settings for those activities.
The arts-creation activities included in this analysis group into two underlying dimensions. The first grouping includes: painting, drawing, and sculpting; photography, film- and video-making; creative writing; and pottery, jewelry-making, and ceramics. The second grouping includes performing in plays and musicals. We suggest three possible interpretations of this exploratory analysis:

51Beyond attendance: A multi-modal understanding of arts participation
■ A difference in terms of social versus solitary activities. For example, consider participation in theater (i.e., “sing or act in a musical play” or “act in a non-musical play”) — activities that are fundamentally social in nature (i.e., working with other singers, actors, directors, designers, etc.). In 2008, less than 1% of the population creatively participated in theatrical performances; whereas participation rates for other activities that could be done in solitude tended to be higher, such as playing a musical instrument and painting, drawing, and sculpture work. (See Table 6.)
■ A difference between activities taking place in public performance spaces versus private spaces, such as the home. The distinction between public and private contexts is worthy of further consideration. The 1992 SPPA protocol asked follow-up questions about arts creation specifically related to public performance, and demonstrated that participation rates were lower for displaying or performing arts in public (NEA, 1993). The comfort level and accessibility that some people associate with private settings may stimulate participation in certain activities, while it may preclude participation in other activities that are more public in nature, such as singing or acting in a musical play.
■ A difference between activities involving vocal and verbal expression (singing, acting) and activities involving other forms of creative expression (painting, writing).
Although the SPPA measures behavior in a specific categories of artistic discipline, this exploratory factor analysis does not necessarily suggest that arts-creation activities cluster by discipline. Beyond artistic discipline, future research might focus on issues related to accessibility of the form (are formal classes or equipment needed or can anyone readily participate?), preferences for settings, whether an individual can engage in the activity alone or must join a social group, and other contexts for being involved in arts-creation activity.
TABLE 9Factor analysis results for arts creation activities: 2008
Factor loading
Arts creation activity 1 2 Communality
Musical play 0.76 0.20
Paint/draw/sculpt 0.59 0.19
Non-musical play 0.49 0.17
Photo/movies/video 0.50 0.15
Creative writing 0.45 0.14
Pottery/ceramics/jewelry 0.41 0.11
Played a musical instrument 0.32 0.10
Sang with a vocal group 0.32 0.10
Weave/needlework/sewing 0.33 0.08
Sang music from an opera 0.04
Danced 0.03
Eigen values 2.23 1.45
% of variance 20.31 13.20
CHAP
TER
2
Note: Loadings < .30 are suppressed

52 National Endowment for the Arts
MODE OF PARTICIPATION: ELECTRONIC MEDIA-BASED The SPPA has included questions about viewing and listening to arts programming since 1982, although the technologies to which the questions refer have changed over the years, in effort to keep up with technological advances. In 1982, questions were asked about watching a program on TV; today the questions ask about watching and listening via iPods, cell phones, and portable DVD players, in addition to TV and radio. Questions about Internet usage were first included in the 2002 survey. Given the changes in question-wording over the years, data between 2008 and prior years are not directly comparable. Therefore, only 2008 data are presented in this report. Further analyses can be found in NEA Research Report #50, Audience 2.0: How Technology Influences Arts Participation (2010).
Rates
Approximately 70% of the U.S. adult population used the Internet within the 12 months ending in May 2008, and 20% of U.S. adults reported using the Internet to watch, listen to or download live or recorded performing arts, specifically music, theater or dance. Fourteen percent of adults used the Internet to access visual arts content. In sum, approximately four in 10 adults access art via live or recorded broadcasts.62
The highest rates of electronic media participation were observed for listening to recordings or watching broadcasts of music: classical music (17.8%), Latin, Spanish, or salsa music (14.9%), and jazz (14.2%). Broadcasts about artists, artworks and museums, and programs about books and writers also garnered participation rates of 15%. However, the genres and disciplines that tend to be more visual and theatrical in nature (opera, musical plays, non-musical plays and dance) each have relatively lower electronic media participation rates when compared with the other genres and disciplines queried.63 What drives these rates is uncertain; it may suggest either a limitation in the availability of these programs or a limited interest in listening to or watching these art forms via recordings or live broadcasts. (See Figure 3.)
FIGURE 3Percentage of U.S. adults who accessed artistic content via recorded or live arts broadcasts: 2008
Percentage of U.S. adults
0% 2% 4% 6% 8% 10% 12% 14% 16% 18% 20%
Opera
Non-musical plays
Musical plays
Dance
Literature
Jazz
Latin music
Programs aboutbooks/writers
Programs about art
Classical music 17.8%
15.1%
15.0%
14.9%
14.2%
10.0%
8.0%
7.9%
6.8%
4.9%
53Beyond attendance: A multi-modal understanding of arts participation
Rates of electronic media-based participation, by demographic group
GenderIn general, men and women participate via electronic media at similar rates. Men report higher rates for accessing performing arts content online, and listening to or watching broadcasts of jazz and Latin, Spanish, or salsa music. (See Table 10.)
Race/ethnicityHispanics listen to broadcasts of Latin, Spanish, or salsa music at levels far above other race/ethnicity cohorts (55.2%, compared with the next highest reported rate: 12% for American Indians).
AgeRates of Internet use are negatively correlated with older ages; younger respondents reported using the Internet at higher rates than older respondents. For example, 42.5% of 18- to 24-year-olds reported watching, listening to or downloading live or recorded music, theater or dance performances, compared with 1.3% of respondents aged 75 and older. Similarly, 20.2% of 18- to 24-year-olds reported viewing visual arts online, compared with 2.7% of respondents aged 75 and older. Overall, results illustrate a dramatic age skew associated with accessing art online.
Educational attainmentRates of Internet usage are positively correlated with education. Levels of Internet use to access performing arts and visual arts are greater with higher educational attainment, especially at the levels of “some college” and above. Educational attainment and rates of accessing the arts through recorded and broadcast electronic media are positively correlated, except for viewing and/or listening to Latin, Spanish, or salsa music through media, for which individuals with “grade-school” education levels reported the highest rates (25.8%).
Family incomeFamilies with lower incomes report lower rates of Internet usage. However, there is less of a range of reported rates across income levels, compared with rates by education level. Generally, there appears to be less of a disparity across income levels for electronic media usage than there is in media use across education levels.
Citizenship statusNative-born citizens use the Internet at significantly higher rates than either naturalized or non-citizen U.S. adults. Native-born citizens listen to Latin, Spanish, or salsa music at a significantly lower rate, compared with naturalized and non-citizen U.S. adults.
“Who” is likely to watch and listen?
People with past exposure to arts lessons (of any discipline) at some point in their lives are 33% more likely than those without exposure to listen to or watch broadcasts or recordings. Again, people with any arts lessons are more likely than Americans who have not taken art lessons to participate in the arts. (See Table 11.)
Adults who self-identify as Hispanic are approximately 30% more likely than whites to view or listen to recordings or live broadcasts. When we control for participation in arts lessons, African Americans are 17% more likely than whites, and American Indians are 40% more likely than whites to watch or listen to an arts recording or broadcast.
Individuals who identified as non-citizens are significantly more likely than native U.S. citizens to listen to or watch an arts recording or broadcast (33% more likely, controlling for arts lessons).
Controlling for arts lessons, individuals with at least some college are 22% more likely to view or listen to arts recordings or broadcasts, compared with adults who have a minimal grade-school education. Overall, results of this analysis suggest that arts participation via recorded and broadcast electronic media is an effective means of reaching diverse communities as well as older Americans.
CHAP
TER
2
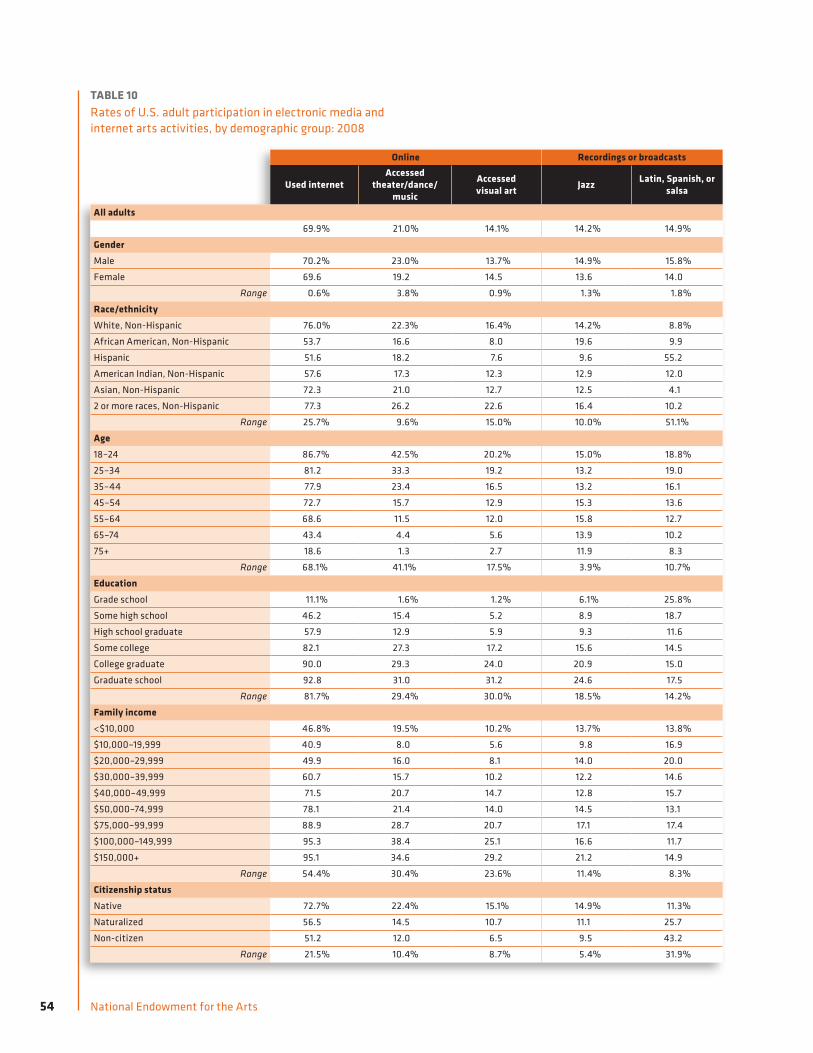
54 National Endowment for the Arts
TABLE 10Rates of U.S. adult participation in electronic media and internet arts activities, by demographic group: 2008
Online Recordings or broadcasts Recordings or broadcasts
Used internetAccessed
theater/dance/music
Accessed visual art Jazz Latin, Spanish, or
salsa Classical music Opera Musical play Non-musical play DancePrograms about
artists, artworks or museums
Programs about books or writers
All adults69.9% 21.0% 14.1% 14.2% 14.9% 17.8% 4.9% 7.9% 6.8% 8.0% 15.0% 15.0%
GenderMale 70.2% 23.0% 13.7% 14.9% 15.8% 16.7% 4.2% 6.5% 5.9% 6.0% 14.4% 13.8%
Female 69.6 19.2 14.5 13.6 14.0 18.9 5.5 9.2 7.6 9.9 15.7 16.1
Range 0.6% 3.8% 0.9% 1.3% 1.8% 2.2% 1.3% 2.7% 1.7% 3.9% 1.3% 2.3%
Race/ethnicityWhite, Non-Hispanic 76.0% 22.3% 16.4% 14.2% 8.8% 19.6% 5.5% 8.7% 6.4% 9.1% 16.8% 17.1%
African American, Non-Hispanic 53.7 16.6 8.0 19.6 9.9 10.7 2.5 6.9 8.4 6.6 9.8 10.8
Hispanic 51.6 18.2 7.6 9.6 55.2 12.1 3.5 5.8 7.4 4.0 11.0 8.3
American Indian, Non-Hispanic 57.6 17.3 12.3 12.9 12.0 8.1 0.0 2.2 0.0 2.2 15.0 15.2
Asian, Non-Hispanic 72.3 21.0 12.7 12.5 4.1 27.0 7.4 6.5 8.5 8.1 14.8 14.2
2 or more races, Non-Hispanic 77.3 26.2 22.6 16.4 10.2 17.0 1.9 2.3 1.0 5.6 12.8 13.1
Range 25.7% 9.6% 15.0% 10.0% 51.1% 18.9% 7.4% 6.5% 8.5% 6.9% 7.0% 8.8%
Age18–24 86.7% 42.5% 20.2% 15.0% 18.8% 16.9% 3.9% 6.9% 8.2% 7.5% 14.5% 14.9%
25–34 81.2 33.3 19.2 13.2 19.0 14.3 3.7 6.2 6.1 5.3 12.5 12.8
35–44 77.9 23.4 16.5 13.2 16.1 14.7 2.7 7.7 5.0 5.8 13.3 14.1
45–54 72.7 15.7 12.9 15.3 13.6 17.2 4.3 8.2 7.0 8.7 17.0 15.7
55–64 68.6 11.5 12.0 15.8 12.7 24.7 8.6 9.6 6.9 9.4 20.1 18.2
65–74 43.4 4.4 5.6 13.9 10.2 20.1 7.3 9.9 8.5 13.3 14.8 16.8
75+ 18.6 1.3 2.7 11.9 8.3 21.6 6.6 8.0 7.5 9.9 11.8 12.3
Range 68.1% 41.1% 17.5% 3.9% 10.7% 10.4% 5.9% 3.7% 3.5% 8.0% 8.3% 5.9%
EducationGrade school 11.1% 1.6% 1.2% 6.1% 25.8% 8.4% 3.3% 4.2% 4.5% 4.5% 7.9% 4.9%
Some high school 46.2 15.4 5.2 8.9 18.7 8.6 2.3 3.6 4.0 3.1 8.4 6.2
High school graduate 57.9 12.9 5.9 9.3 11.6 9.7 2.3 4.0 5.2 5.3 8.0 6.7
Some college 82.1 27.3 17.2 15.6 14.5 18.9 4.8 9.7 7.8 9.6 16.5 17.0
College graduate 90.0 29.3 24.0 20.9 15.0 28.1 7.5 14.1 8.9 10.7 24.2 24.5
Graduate school 92.8 31.0 31.2 24.6 17.5 39.1 12.8 11.0 9.3 14.8 28.9 35.4
Range 81.7% 29.4% 30.0% 18.5% 14.2% 30.7% 10.5% 10.5% 5.3% 11.7% 21.0% 30.5%
Family income<$10,000 46.8% 19.5% 10.2% 13.7% 13.8% 11.0% 5.2% 6.4% 5.8% 8.9% 12.2% 11.5%
$10,000–19,999 40.9 8.0 5.6 9.8 16.9 12.5 4.0 5.1 5.4 6.2 9.0 9.5
$20,000–29,999 49.9 16.0 8.1 14.0 20.0 14.6 3.9 7.4 8.4 8.8 11.3 10.9
$30,000–39,999 60.7 15.7 10.2 12.2 14.6 14.2 2.3 4.1 5.8 6.7 11.7 13.3
$40,000–49,999 71.5 20.7 14.7 12.8 15.7 18.9 4.4 9.3 6.8 9.7 16.8 14.8
$50,000–74,999 78.1 21.4 14.0 14.5 13.1 16.8 4.8 8.3 6.1 7.1 15.0 13.1
$75,000–99,999 88.9 28.7 20.7 17.1 17.4 22.0 5.6 8.9 8.4 8.8 18.3 19.7
$100,000–149,999 95.3 38.4 25.1 16.6 11.7 25.6 7.3 12.4 6.6 11.2 21.7 25.8
$150,000+ 95.1 34.6 29.2 21.2 14.9 32.4 8.7 13.4 10.2 9.9 24.5 24.3
Range 54.4% 30.4% 23.6% 11.4% 8.3% 21.4% 6.4% 9.3% 4.8% 5.0% 15.5% 16.3%
Citizenship statusNative 72.7% 22.4% 15.1% 14.9% 11.3% 17.9% 4.8% 8.0% 6.5% 8.3% 15.5% 15.6%
Naturalized 56.5 14.5 10.7 11.1 25.7 19.9 7.4 9.3 10.6 6.4 14.2 14.9
Non-citizen 51.2 12.0 6.5 9.5 43.2 15.9 3.9 6.2 6.8 6.4 10.8 8.9
Range 21.5% 10.4% 8.7% 5.4% 31.9% 4.0% 3.5% 3.1% 4.1% 1.9% 4.7% 6.7%

55Beyond attendance: A multi-modal understanding of arts participation
Online Recordings or broadcasts Recordings or broadcasts
Used internetAccessed
theater/dance/music
Accessed visual art Jazz Latin, Spanish, or
salsa Classical music Opera Musical play Non-musical play DancePrograms about
artists, artworks or museums
Programs about books or writers
All adults69.9% 21.0% 14.1% 14.2% 14.9% 17.8% 4.9% 7.9% 6.8% 8.0% 15.0% 15.0%
GenderMale 70.2% 23.0% 13.7% 14.9% 15.8% 16.7% 4.2% 6.5% 5.9% 6.0% 14.4% 13.8%
Female 69.6 19.2 14.5 13.6 14.0 18.9 5.5 9.2 7.6 9.9 15.7 16.1
Range 0.6% 3.8% 0.9% 1.3% 1.8% 2.2% 1.3% 2.7% 1.7% 3.9% 1.3% 2.3%
Race/ethnicityWhite, Non-Hispanic 76.0% 22.3% 16.4% 14.2% 8.8% 19.6% 5.5% 8.7% 6.4% 9.1% 16.8% 17.1%
African American, Non-Hispanic 53.7 16.6 8.0 19.6 9.9 10.7 2.5 6.9 8.4 6.6 9.8 10.8
Hispanic 51.6 18.2 7.6 9.6 55.2 12.1 3.5 5.8 7.4 4.0 11.0 8.3
American Indian, Non-Hispanic 57.6 17.3 12.3 12.9 12.0 8.1 0.0 2.2 0.0 2.2 15.0 15.2
Asian, Non-Hispanic 72.3 21.0 12.7 12.5 4.1 27.0 7.4 6.5 8.5 8.1 14.8 14.2
2 or more races, Non-Hispanic 77.3 26.2 22.6 16.4 10.2 17.0 1.9 2.3 1.0 5.6 12.8 13.1
Range 25.7% 9.6% 15.0% 10.0% 51.1% 18.9% 7.4% 6.5% 8.5% 6.9% 7.0% 8.8%
Age18–24 86.7% 42.5% 20.2% 15.0% 18.8% 16.9% 3.9% 6.9% 8.2% 7.5% 14.5% 14.9%
25–34 81.2 33.3 19.2 13.2 19.0 14.3 3.7 6.2 6.1 5.3 12.5 12.8
35–44 77.9 23.4 16.5 13.2 16.1 14.7 2.7 7.7 5.0 5.8 13.3 14.1
45–54 72.7 15.7 12.9 15.3 13.6 17.2 4.3 8.2 7.0 8.7 17.0 15.7
55–64 68.6 11.5 12.0 15.8 12.7 24.7 8.6 9.6 6.9 9.4 20.1 18.2
65–74 43.4 4.4 5.6 13.9 10.2 20.1 7.3 9.9 8.5 13.3 14.8 16.8
75+ 18.6 1.3 2.7 11.9 8.3 21.6 6.6 8.0 7.5 9.9 11.8 12.3
Range 68.1% 41.1% 17.5% 3.9% 10.7% 10.4% 5.9% 3.7% 3.5% 8.0% 8.3% 5.9%
EducationGrade school 11.1% 1.6% 1.2% 6.1% 25.8% 8.4% 3.3% 4.2% 4.5% 4.5% 7.9% 4.9%
Some high school 46.2 15.4 5.2 8.9 18.7 8.6 2.3 3.6 4.0 3.1 8.4 6.2
High school graduate 57.9 12.9 5.9 9.3 11.6 9.7 2.3 4.0 5.2 5.3 8.0 6.7
Some college 82.1 27.3 17.2 15.6 14.5 18.9 4.8 9.7 7.8 9.6 16.5 17.0
College graduate 90.0 29.3 24.0 20.9 15.0 28.1 7.5 14.1 8.9 10.7 24.2 24.5
Graduate school 92.8 31.0 31.2 24.6 17.5 39.1 12.8 11.0 9.3 14.8 28.9 35.4
Range 81.7% 29.4% 30.0% 18.5% 14.2% 30.7% 10.5% 10.5% 5.3% 11.7% 21.0% 30.5%
Family income<$10,000 46.8% 19.5% 10.2% 13.7% 13.8% 11.0% 5.2% 6.4% 5.8% 8.9% 12.2% 11.5%
$10,000–19,999 40.9 8.0 5.6 9.8 16.9 12.5 4.0 5.1 5.4 6.2 9.0 9.5
$20,000–29,999 49.9 16.0 8.1 14.0 20.0 14.6 3.9 7.4 8.4 8.8 11.3 10.9
$30,000–39,999 60.7 15.7 10.2 12.2 14.6 14.2 2.3 4.1 5.8 6.7 11.7 13.3
$40,000–49,999 71.5 20.7 14.7 12.8 15.7 18.9 4.4 9.3 6.8 9.7 16.8 14.8
$50,000–74,999 78.1 21.4 14.0 14.5 13.1 16.8 4.8 8.3 6.1 7.1 15.0 13.1
$75,000–99,999 88.9 28.7 20.7 17.1 17.4 22.0 5.6 8.9 8.4 8.8 18.3 19.7
$100,000–149,999 95.3 38.4 25.1 16.6 11.7 25.6 7.3 12.4 6.6 11.2 21.7 25.8
$150,000+ 95.1 34.6 29.2 21.2 14.9 32.4 8.7 13.4 10.2 9.9 24.5 24.3
Range 54.4% 30.4% 23.6% 11.4% 8.3% 21.4% 6.4% 9.3% 4.8% 5.0% 15.5% 16.3%
Citizenship statusNative 72.7% 22.4% 15.1% 14.9% 11.3% 17.9% 4.8% 8.0% 6.5% 8.3% 15.5% 15.6%
Naturalized 56.5 14.5 10.7 11.1 25.7 19.9 7.4 9.3 10.6 6.4 14.2 14.9
Non-citizen 51.2 12.0 6.5 9.5 43.2 15.9 3.9 6.2 6.8 6.4 10.8 8.9
Range 21.5% 10.4% 8.7% 5.4% 31.9% 4.0% 3.5% 3.1% 4.1% 1.9% 4.7% 6.7%
CHAP
TER
2
Note: Dance here refers to all forms of dance, not just ballet.

56 National Endowment for the Arts
TABLE 11Marginal impact of demographics on U.S. adults’ likelihood of participating via broadcasts or recordings of artworks or art programs: 2008
Listen/watch broadcasts or recordings of
artworks or art programs
Controlling for any arts lessons
GenderMale 0.0% 0.0%
Female 2.3 -2.3
Race/ethnicityWhite, Non-Hispanic 0.0% 0.0%
African American, Non-Hispanic 4.1 16.7**
Hispanic 27.9** 32.7**
American Indian, Non-Hispanic 3.7 39.7**
Asian, Non-Hispanic -13.8** -4.8
2 or more races, Non-Hispanic -13.8 -10.9
Age18–24 0.0% 0.0%
25–34 -2.3 9.4
35–44 -0.9 15.8
45–54 3.2 15.1
55–64 6.2 25.4**
65–74 4.3 24.8**
75+ 10.4 23.6*
EducationGrade school 0.0% 0.0%
Some high school 2.4 7.7
High school graduate 9.5 13.2
Some college 24.3** 22.1*
College graduate 32.7** 27.6**
Graduate school 39.5** 24.5*
Family incomeLess than $10,000 0.0% 0.0%
$10,000–19,999 -6.1 -1.1
$20,000–29,999 -1.6 10.8
$30,000–39,999 -7.6 6.4
$40,000–49,999 0.3 7.1
$50,000–74,999 -4.1 10.7
$75,000–99,999 -0.9 7.6
$100,000–149,999 -1.3 11.2
$150,000+ 2.1 22.4*
Citizenship statusNative 0.0% 0.0%
Naturalized 5.6 4.0
Non-citizen 16.4** 33.1**
OtherMarried 1.7% 2.7%
No child or child under 18 2.6 -2.8
Reside in metropolitan area 5.5** 4.3
Any arts lessons 32.9**
* Statistically significant at the 90% confidence level** Statistically significant at the 95% confidence level

57Beyond attendance: A multi-modal understanding of arts participation
NOTES41 This rate includes all data available in 2008 and listed in Table 1
on performing arts, visual arts, and parks and historic site attendance; this aggregate rate does not include participation in literature or attendance specifically at community venues.
42 “Benchmark” activities include: attendance at a live jazz performance, a classical music performance, a live opera, a live musical stage play, a live performance of a non-musical stage play, a live ballet, and a visit to an art museum or gallery.
43 Attendance at a live dance performance other than ballet is not included in the “All Comparable Attendance Activities” rate because this activity has been included in the SPPA only since 1992. We looked at the effect of including this variable in the aggregate measures for years 1992–2008 and found the rate of the aggregated measures increased by an amount much smaller than the margin of error. Thus, we concluded it does not have an effect.
44 See the Technical Appendix for further details.
45 To test significant changes over time we employ procedures as outlined in the 2008 SPPA Technical Research Manual (June 2009), using the average design effect for each survey year. See www.cpanda.org/cpanda/documents/a00249/users-guide.pdf.
46 Further discussion of the trends within each arts attendance activity appears in 2008 Survey of Public Participation in the Arts, NEA Report #49; and in Arts Participation 2008: Highlights from a National Survey (Washington, DC: NEA, 2009). Some rates in Table 1 were previously published in 2008 Survey of Public Participation in the Arts, NEA Report #49.
47 There is a notable difference between all comparable attendance activities and attendance at benchmark activities between 1982 and 1992. Because neither attendance at art or craft fairs and festivals nor attendance at parks and historic sites (the two non-benchmark arts activities included in the aggregate index) seems to drive this change in and of itself, the significant increase in attendance rates suggests that a broader set of people participated at least once in the attendance activities in 1992 as compared to 1982.
48 In the Australia Council for the Arts national survey of arts participation, the authors consider attendance and reading together as “receptive” arts participation activities. This distinction seems to capture aptly the reduced level of personal creative control implied by both types of activities. More than bums on seats, Australia Council for the Arts (see n. 12).
49 The questions read: “During the last 12 months, did you (or your spouse/partner) attend an elementary, middle or high school music, theater or dance performance?”; and “During the last 12 months, did you (or your spouse/partner) attend a music, theater or dance performance at a church, synagogue or other religious institution?”
50 The foundation for this discussion appears in 2008 Survey of Public Participation in the Arts, NEA Report #49, chapter 3.
51 A marginal effects probit model is used for this analysis.
52 This category includes those attendance activities labeled as “Any Arts Attendance” in Table 3; it excludes attendance at community venues and reading literature, which are not included in this aggregate variable due to the different nature of the questions addressing them.
53 Using a linear probability model. Output is available in the Technical Appendix.
54 Data on reading literature and attending music, theater, and dance performances at schools and religious institutions are omitted from this analysis due to differences in the nature of the questions addressing them, compared with questions addressing other attendance activities.
55 Correlation table available upon request.
56 2008 is the first year that the SPPA asked about participation in dance by using one question combining ballet with other genres of dance. This was also the first year that the SPPA collected information on individuals who play a musical instrument regardless of whether the musician played or rehearsed for a public performance. Hence, we omit prior years’ data for “all dance” and for playing an instrument.
57 Earlier SPPA waves included questions such as, “During the last 12 months, did you play a musical instrument in a public performance or rehearse for a public musical performance?” (SPPA 1982 and 1985), which the NEA has deemed not comparable to 1992 and later waves due to the change in wording regarding “public performance.” The NEA reports that the inclusion of “public performance” in the question appeared to suppress response rates.
58 If owning art is omitted from the index, the aggregate rate for arts creation is approximately 6% lower in 1992, 2002, and 2008 than the currently reported rates.
59 Unlike most core questions in the SPPA, this question asks only about the act of owning art, and does not ask about behavior undertaken within the 12 months ending in May 2008.
60 Note that the highest reported rate of attendance for African Americans was 26.3% for attending performances at religious institutions.
61 Using a linear probability model to examine explained variability.
62 This data was originally published in 2008 Survey of Public Participation in the Arts, NEA Report #49, 35.
63 While the electronic media rate for opera is low relative to rates for other art forms, the rate of electronic media participation in opera is more than double that for live attendance.
CHAP
TER
2

National Endowment for the Arts58
In 2007–2008, one out of three U.S. adults participated in the arts through both creation and attendance.

59Beyond attendance: A multi-modal understanding of arts participation
CHAPTER 3
A LOOK BETWEEN MODES: ATTENDANCE AND ARTS CREATION
Prior studies utilizing the SPPA have looked extensively at attendance, and then separately at participation via creation. While the SPPA captures information on both types of participation, relatively little has been studied empirically about the relationship between arts creation and attendance.64 Regional studies have made strides in investigating these relationships,65 but the linkage between arts creation and attendance activity has not been deeply explored with national data — until now.
RATESIn 2008, 33% of U.S. adults reported participating in both creation-based and attendance-based arts activities,66 17% reported attendance-based activities only, 12% reported participation in the arts via creation-based activities only, and 38% of U.S. adults reported both no attendance and no creative participation, as illustrated in Figure 4.67
In total, 45% of Americans do creative arts activities (as defined by the 2008 SPPA), while 50% of Americans engage in the arts by attending arts events. The overlap is substantial, but there are sizeable segments of the population that participate only in one mode or the other. While these figures do not connote either the frequency with which they do these activities or the importance that they ascribe to them, the percentages do suggest that a majority of Americans find meaning in both modes of participation — attendance and creation.
Across the SPPA survey years, the distribution of adult activity has changed. Referring to Figure 5, proportionally fewer adults in the U.S. are participating in both attendance-based and arts-creation activities, and more adults are reporting no attendance or creative activity. In contrast, the percentage of U.S. adults that only attends or only creates remained relatively constant across SPPA years.
FIGURE 4Distribution of U.S. adults, based on participation in arts attendance and arts creation: 2008
Attended only17%
Created and attended33%
Created only12%
Neither38%

60 National Endowment for the Arts
ARTS LESSONSFigure 6 illustrates the effect of any arts lessons69 on attendance, arts creation, and participation via both modes. The boxed number in the chart reports the ratio of the rates of participation by comparing adults who had taken arts lessons to those who had not. For example, adults with any arts lessons were 2.2 times as likely as those without any arts lessons to report attending an arts event between May 2007 and May 2008. Having any arts lessons appears to have a slightly larger effect on rates of personal arts creation than on attendance rates.
The greatest difference is seen in the ratio for adults’ participation in both attendance and creative activities. Adults who report ever having an arts lesson are 3.8 times more likely than those who report no lessons to engage in both attendance-based and creative arts activities. One can also see the
negative correlation of the absence of arts lessons with the incidence of participation as an adult (i.e., respondents with no past involvement in arts lessons were three times more likely than those with a history of having taken any arts lessons to report no participation in the arts over the last year).
In 2008, adults with any history of taking arts lessons reported participating in arts creative activities at a rate 2.6 times that reported by adults who had not taken any arts lessons. The corresponding rate for attendance is 2.2, while the rate for both attendance and creation is 3.8. Although this analysis does not imply causality, prior arts lessons are correlated with higher overall participation levels. One might infer a symbiosis between arts attendance and arts creation, perhaps stimulated by childhood experiences with arts lessons.
FIGURE 5Trend analysis of the distribution of U.S. adults, based on participation in arts attendance and arts creation: 1992, 2002, and 2008
Perc
enta
ge o
f U.S
. adu
lts
0%
10%
20%
30%
40%
50%
60%
70%
80%
90%
100%
Attended onlyCreated and attended
Created onlyNeither
200820021992
19.0%
42.1%
12.6%
26.3%
21.6%
32.9%
9.4%
36.0%
17.9%
30.2%
11.0%
41.0%
Note: In this figure, the distribution of modal activity in 2008 differs from that presented in the pie chart on the previous page, due to new questions included in the SPPA 2008 data that constitute attendance activities. This graph only includes comparable measures available in each 1992, 2002, and 2008.68
FIGURE 6Comparative rates of arts attendance and creation among adults who did or did not take arts classes or lessons: 2008
Perc
enta
ge o
f U.S
. adu
lts
0%
10%
20%
30%
40%
50%
60%
70%
80%
90%
100%
No arts lessonsAny arts lessons
Both creation and attendanceAny creationAny attendance
2.2 times more2.6 times more
3.8 times more

61Beyond attendance: A multi-modal understanding of arts participation
CIVIC AND SOCIAL ENGAGEMENTParticipation in other civic and social activities covered in the SPPA may also be analyzed for the four cohorts of modal arts participation in Figure 4. Table 12 presents the results of investigating if the mode by which an individual participates in the arts has any bearing on civic and social engagement. In general, the analysis further illustrates the symbiosis between creation and attendance. People who reported both attendance and creative participation over the past year also reported the highest participation rates for civic and leisure activities, usually by a wide margin.70 For example, respondents who reported both creative and attendance-based arts activity between May 2007 and May 2008 were six times as likely as those who reported no arts participation to do volunteer or charity work in their community. This analysis does not explain causality, but the pattern of the results suggests that Americans who attend arts programs and who express themselves creatively through the arts are also more engaged civically, socially, and physically.
RATES WITHIN DISCIPLINESOf people who report participating in a specific discipline, how is their participation within that discipline distributed across the two modes of attendance and arts creation?
Figure 7 illustrates the distribution of SPPA respondents who reported participating in each discipline either through attendance or creation. The percentages in parenthesis at the bottom of each column represent the total rates of participation for all attendance and creation activities for each discipline (for all U.S. adults). Within each of the performing arts disciplines — music, theater, and dance — attendance is the dominant form of participation. Theater participation is nearly all attendance-based (94.0%). Within the visual arts category, the distribution of activity between attendance and creation is more evenly split — 38.9% report only attendance, 36.4% report both attending and creating, and 24.6% report only creating.
TABLE 12Rate of U.S. adult participation in civic and social activities, by mode of arts participation cohort: 2008
Attend movies
Attend sporting events
Exercise Playing sports
Outdoor activities Gardening Community
activitiesVolunteer/
charity
Both attend and create 74.6% 49.5% 78.5% 41.5% 48.7% 61.4% 53.5% 57.4%
Attend only 67.5 39.2 60.0 33.6 30.6 38.2 29.6 35.2
Create only 46.0 21.8 53.9 23.8 24.8 50.0 21.5 28.0
Neither 30.3 12.9 26.7 10.6 10.1 22.8 6.5 9.5
CHAP
TER
3

62 National Endowment for the Arts
What might explain the distributions across the four disciplines? One might interpret these results in relation to a number of factors, including: the training and skill level required to become active in a given discipline; the cost of acquiring instruments or supplies; the social requirements (i.e., private vs. socially-based activities); and the relative emphasis that the arts disciplines historically have been given in arts education curriculum. For example, given the relatively higher emphasis on music and visual arts curriculum in arts education, compared with theater and dance, one can hypothesize that this has bearing on the percentages of Americans involved at the creative level in music and visual arts are higher. One might also argue that the social and cost barriers to creative participation in music and visual arts are considerably lower than those for theater and dance. Music and visual arts activities can be done in private spaces, including the home, while theater
and dance activities often take place in organized social settings. Most surprising is the relatively high proportion of creative activity in dance (23.9%), given the low offerings of dance instruction relative to music and visual arts instruction in public schools. Cultural norms and language may also play a role in shaping these figures. For example, a study of the arts activities of Dallas public school students found that Hispanic children reported higher levels of interest in visual arts and craft activities than African American children, while African American children reported higher levels of interest in dance and music than Hispanic children (Brown and Daniel, 2008, 7).
FIGURE 7Distribution of U.S. adults, based on participation in arts attendance and arts creation, by discipline: 2008
Perc
enta
ge o
f U.S
. adu
lts
0%
10%
20%
30%
40%
50%
60%
70%
80%
90%
100%
Attended onlyCreated and attendedCreated only
Visual arts (47.5%)Dance (8.8%)Theater (21.7%)Music (37.9%)
58.0%
20.6%
21.4%
94.0%
76.1%
8.0%
15.9%
38.9%
36.4%
24.6%
3.7%2.3%
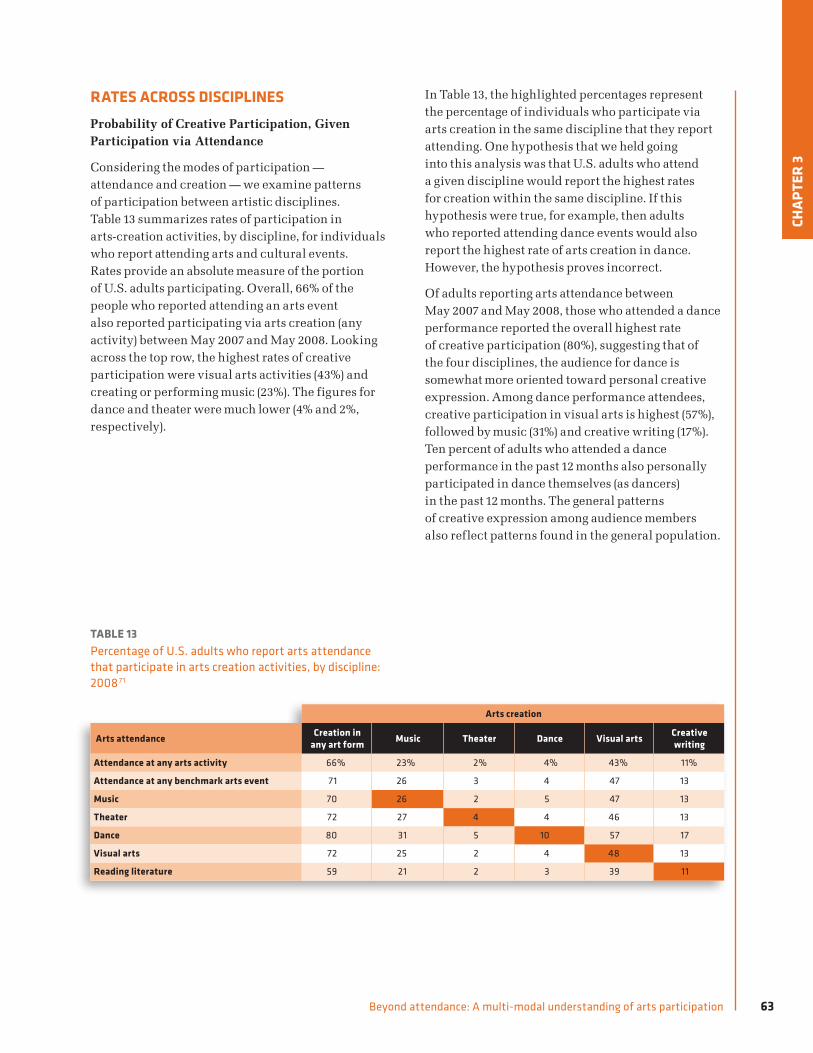
63Beyond attendance: A multi-modal understanding of arts participation
RATES ACROSS DISCIPLINESProbability of Creative Participation, Given Participation via Attendance
Considering the modes of participation — attendance and creation — we examine patterns of participation between artistic disciplines. Table 13 summarizes rates of participation in arts-creation activities, by discipline, for individuals who report attending arts and cultural events. Rates provide an absolute measure of the portion of U.S. adults participating. Overall, 66% of the people who reported attending an arts event also reported participating via arts creation (any activity) between May 2007 and May 2008. Looking across the top row, the highest rates of creative participation were visual arts activities (43%) and creating or performing music (23%). The figures for dance and theater were much lower (4% and 2%, respectively).
In Table 13, the highlighted percentages represent the percentage of individuals who participate via arts creation in the same discipline that they report attending. One hypothesis that we held going into this analysis was that U.S. adults who attend a given discipline would report the highest rates for creation within the same discipline. If this hypothesis were true, for example, then adults who reported attending dance events would also report the highest rate of arts creation in dance. However, the hypothesis proves incorrect.
Of adults reporting arts attendance between May 2007 and May 2008, those who attended a dance performance reported the overall highest rate of creative participation (80%), suggesting that of the four disciplines, the audience for dance is somewhat more oriented toward personal creative expression. Among dance performance attendees, creative participation in visual arts is highest (57%), followed by music (31%) and creative writing (17%). Ten percent of adults who attended a dance performance in the past 12 months also personally participated in dance themselves (as dancers) in the past 12 months. The general patterns of creative expression among audience members also reflect patterns found in the general population.
TABLE 13Percentage of U.S. adults who report arts attendance that participate in arts creation activities, by discipline: 200871
Arts creation
Arts attendance Creation in any art form Music Theater Dance Visual arts Creative
writing
Attendance at any arts activity 66% 23% 2% 4% 43% 11%
Attendance at any benchmark arts event 71 26 3 4 47 13
Music 70 26 2 5 47 13
Theater 72 27 4 4 46 13
Dance 80 31 5 10 57 17
Visual arts 72 25 2 4 48 13
Reading literature 59 21 2 3 39 11
CHAP
TER
3

64 National Endowment for the Arts
Probability of attendance, given participation via arts creation
Given the ongoing deliberation among arts managers about audience development and how to attract more paying customers to arts events, it is also useful to consider the proportion of arts creators that attend arts events. Should arts presenters and producers concern themselves with the inventive and interpretive modes of participation (i.e., arts creation) as ways to build audiences? Table 14 summarizes rates of participation in art attendance activities by discipline for individuals who report creative activities (i.e., the inverse of the previous table).
In sum, 73% of U.S. adults who reported participation in creative activities between May 2007 and May 2008 reported attending at least one arts event as well. As with the previous analysis, the strongest relationship was found between dancers and arts attendance (85%). Within each discipline, relationships between creators and attendees vary widely. The closest relationship is observed between creative writing and literary reading (81%), not an attendance activity at all. Theater and visual arts follow at 60%. In other words, 60% of Americans who painted, drew, sculpted or made prints in the past year also attended a museum or gallery at least once.
(Perhaps it is more interesting to consider that 40% did not.) Regarding music, nearly half of adults who reported playing an instrument or rehearsing or performing classical music, opera, or jazz in the past year also attended a classical music, opera, or jazz performance. The other half did not. Finally, with respect to dance, 35% of Americans who danced in the past year also attended a live dance performance, while 65% did not.
Clearly, the subpopulation of adults who create art in America provides a foundation of informed audience members for museums and performing arts presenters and producers. While causality cannot be concluded in either direction, our analysis does suggest that investments in arts-creation activities are likely to result in attendance outcomes in the long run, and vice versa. While the relationships between arts creation and arts attendance are strong, they are by no means perfectly aligned. Many Americans who dance, sing, play instruments, act, draw, paint, and sculpt do not attend exhibitions or live performances. Perhaps such programs are not available in their communities. Or perhaps other factors contributed to their decision not to attend. In any case, these results might help inform arts organizations in their audience development efforts.
TABLE 14Percentage of U.S. adults who report arts creation that participate via arts attendance, by discipline: 200872
Arts attendance
Arts creationAttendance at
any arts activity
Attendance at any
benchmark arts event
Music Theater Dance Visual arts Literature
Creation in any art form 73% 55% 46% 34% 13% 57% 67%
Music 74 57 49 35 15 57 68
Theater 78 69 55 60 28 59 73
Dance 85 64 68 40 35 68 75
Visual arts 75 57 48 34 15 60 69
Creative writing 81 68 57 40 18 69 81
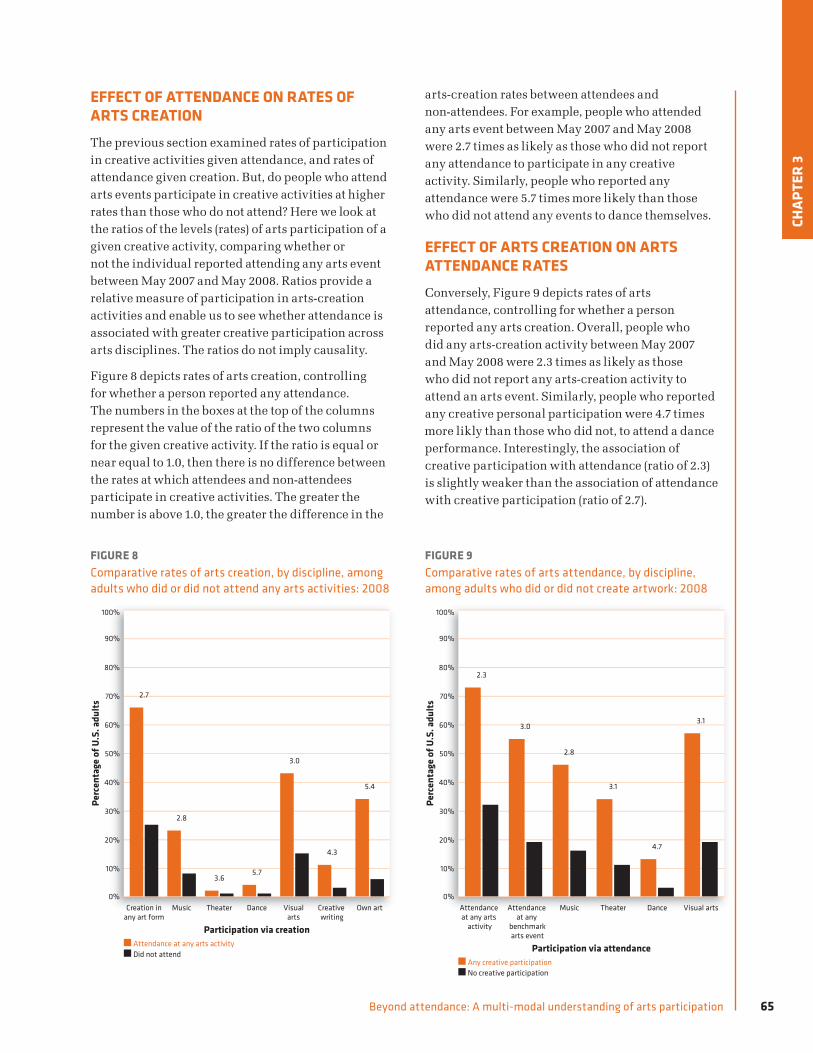
65Beyond attendance: A multi-modal understanding of arts participation
EFFECT OF ATTENDANCE ON RATES OF ARTS CREATIONThe previous section examined rates of participation in creative activities given attendance, and rates of attendance given creation. But, do people who attend arts events participate in creative activities at higher rates than those who do not attend? Here we look at the ratios of the levels (rates) of arts participation of a given creative activity, comparing whether or not the individual reported attending any arts event between May 2007 and May 2008. Ratios provide a relative measure of participation in arts-creation activities and enable us to see whether attendance is associated with greater creative participation across arts disciplines. The ratios do not imply causality.
Figure 8 depicts rates of arts creation, controlling for whether a person reported any attendance. The numbers in the boxes at the top of the columns represent the value of the ratio of the two columns for the given creative activity. If the ratio is equal or near equal to 1.0, then there is no difference between the rates at which attendees and non-attendees participate in creative activities. The greater the number is above 1.0, the greater the difference in the
arts-creation rates between attendees and non-attendees. For example, people who attended any arts event between May 2007 and May 2008 were 2.7 times as likely as those who did not report any attendance to participate in any creative activity. Similarly, people who reported any attendance were 5.7 times more likely than those who did not attend any events to dance themselves.
EFFECT OF ARTS CREATION ON ARTS ATTENDANCE RATES Conversely, Figure 9 depicts rates of arts attendance, controlling for whether a person reported any arts creation. Overall, people who did any arts-creation activity between May 2007 and May 2008 were 2.3 times as likely as those who did not report any arts-creation activity to attend an arts event. Similarly, people who reported any creative personal participation were 4.7 times more likly than those who did not, to attend a dance performance. Interestingly, the association of creative participation with attendance (ratio of 2.3) is slightly weaker than the association of attendance with creative participation (ratio of 2.7).
FIGURE 8Comparative rates of arts creation, by discipline, among adults who did or did not attend any arts activities: 2008
Participation via creation
Perc
enta
ge o
f U.S
. adu
lts
0%
10%
20%
30%
40%
50%
60%
70%
80%
90%
100%
Did not attendAttendance at any arts activity
Own artCreative writing
Visual arts
DanceTheaterMusicCreation inany art form
2.7
2.8
3.65.7
3.0
4.3
5.4
FIGURE 9Comparative rates of arts attendance, by discipline, among adults who did or did not create artwork: 2008
Participation via attendance
Perc
enta
ge o
f U.S
. adu
lts
0%
10%
20%
30%
40%
50%
60%
70%
80%
90%
100%
No creative participationAny creative participation
Visual artsDanceTheaterMusicAttendance at any
benchmarkarts event
Attendance at any arts
activity
6%
2.3
3.0
2.8
3.1
4.7
3.1
CHAP
TER
3

66 National Endowment for the Arts
A summary of the comparative ratios within each of the four disciplines follows.
Ratio of creative participation rates, by
attendance
Ratio of attendance rates, by
creative participation
Music 2.3 1.9
Theater 5.5 2.9
Dance 6.6 5.0
Visual arts 2.6 2.3
Two observations are worth mentioning here. First, the ratios for dance are highest overall among the four disciplines. This suggests a higher degree of symbiosis between attendance-based and creative forms of dance, compared with activities in the other disciplines. People who dance go to dance performances, and people who go to dance performances also dance — at rates higher than for other disciplines. Second, note the large difference between the ratios for theater. Rates of personal participation in theater (i.e., acting) were 5.5 times higher for people who attend theater than for those who do not attend theater. Logically, actors are likely to be drawn from the base of people who attend live theater. However, rates of theater attendance were just 2.9 times higher for adults who reported personal participation in theater, compared with adults who did not. Relatively speaking, audiences are less likely to be drawn from the base of actors.
Attendance at any art event is a significant predictor of creative arts participation, in general, and within each arts discipline. Participation in creative arts activity is also a significant predictor of attendance, in general, and within each arts discipline.
Odds ratios between attendance and creation
Odds ratios provide a relative measure of the strength of the relationship between arts attendance and arts creation. Similar to risk ratios, looking at individual decision-making about arts participation, odds ratios allow us to look at the chances that an individual will or will not participate in both modes. For example, U.S. adults who report any attendance are 5.9 times as likely as adults who did not report attendance to do arts-creation activities. (See Table 15.) The greater the odds ratio is than 1.0, the stronger the relationship between the variables. For example, the relationship between creating music and attending theater (odds ratio=2.4) is not as strong as the relationship between creating theater and attending music (odds ratio=2.9), meaning that actors are a bit more likely to attend music concerts, relative to the likelihood of musicians attending plays.
Looking at the highlighted cells in the table, these odds ratios give us the strength of the relationship between attending and creating within the same artistic discipline. The odds ratios for both theater (5.7) and dance73 (7.2) are noticeably greater than the ratios for music (2.7) and visual arts (2.8). In other words, the association between arts creation and attendance is weaker for musicians and visual artists, than for actors and dancers. This fact may relate to the absolute numbers of musicians and visual artists, which are substantially higher than the absolute numbers of actors and dancers. (Also, given their larger numbers, musicians and visual artists are more diverse in the attendance patterns.) Nevertheless, on a practical level, the data suggest that arts organizations should target practitioners of their art forms, and should consider ways of offering participatory forms of engagement or collaborating with organizations that provide such activities, given the high probability that practitioners will also attend.

67Beyond attendance: A multi-modal understanding of arts participation
Higher odds ratios may suggest greater exclusivity or barriers to participation. With dance, for example, the relatively high odds ratio suggests that individuals who participate in dance via attendance or creation are highly likely to be the same people who engage in dance via the other mode. Why might this be? One possible explanation is the accessibility of space, resources, and the social support structures usually associated with dance creation.
As previously discussed, the SPPA question about creative dance participation asks about specific, mostly Western, dance forms that may imply the need for some level of formal or structured training in order to participate (e.g., ballet and tap).74 In contrast, even though skill is required to play musical instruments and to create visual art, attainment of these skills may lend itself more readily to self-instruction compared to dance or theater.
Also, the implied or assumed setting of the art forms may play a role. Creative participation in theater may suggest putting on a play, which generally requires additional people and collaborators, as well as a public forum. The general nature of the art forms implies differences between public and more social settings, and private, perhaps more secluded spaces.
Creating or performing music, dance, or theater tends to imply a “collaborative” nature about the art form (NEA, 2009b, 5) or an audience. The SPPA question-wordings for each of the arts creation and performance activities do not explicitly state, or necessarily imply, the setting or social aspects of their creative involvement, but it could be argued that they imply a formal setting or venue.75
EXPLORATORY FACTOR ANALYSIS We previously observed that 33% of Americans participate in both attendance-based and creative arts activities, while 17% attend only, and 12% create only. (See Figure 4.) What additional information can be gleaned from the SPPA in terms of the types or groupings of arts activities that Americans do? For example, do people tend to participate in arts activities within the same discipline, or do they tend to participate within a mode — either through attendance or personal creation? Are there natural groupings of activities that might shed light on the larger behavioral patterns of Americans with respect to arts participation?
To address these questions, an exploratory factor analysis was conducted. (See Table 16.) Factor analysis is a data-reduction technique that identifies underlying dimensions or factors across a larger number of variables.76 Four groupings of activities were identified:
Factor 1: Attendance at live performances and museums
Factor 2: Arts-creation activities in the visual arts, film, and creative writing
Factor 3: Attendance at outdoor art fairs and festivals
Factor 4: Singing and acting in plays and musicals
TABLE 15Odds of U.S. adults’ participation via attendance and arts creation, by disclipline: 2008
Arts attendance
Arts creationAttendance at
any arts activity
Attendance at any
benchmark arts event
Music Theater Dance Visual arts
Creation in any art form 5.9 5.4 4.4 4.1 5.3 5.7
Music 3.7 2.9 2.7 2.4 2.6 2.8
Theater 3.6 4.3 2.9 5.7 4.9 2.6
Dance 5.9 3.4 5.2 2.6 7.2 4.0
Visual arts 4.5 3.7 3.2 2.7 3.6 2.8
CHAP
TER
3

68 National Endowment for the Arts
We draw several observations from the analysis. First, we infer that people tend to participate via modes (e.g., attendance, creation), more so than by discipline. Factors 1 and 3 pertain mostly to attendance, while factors 2 and 4 pertain mostly to creation. Factors 1 and 3 suggest that within the realm of attendance-based arts activities, there is a fundamental distinction between attending benchmark attendance activities , and attending outdoor festivals and fairs, which is supported by the earlier “setting” factor analysis (see Chapter 2). There are many differences between these two types of programs, such as setting, cost of admission, appropriateness for children and families, and freedom to move around — all of which would support the notion that the activities compose different classes of participation.
We also observe a distinction between the two creational factors (2 and 4). The activities in factor 2 (painting, drawing, photography, video-making, creative writing) all may be done privately in a wide range of settings, and inherently involve a fair degree of creative expression — they are highly personal and inventive. The activities in factor 4 (singing or acting in a play or musical) typically require an organized group setting and perhaps are more interpretive in nature. There is also a dichotomy between forms of visual expression and forms of spoken or sung expression, which bears further research.
TABLE 16Factor analysis results for arts attendance and arts creation activities: 2008
Factor loading
Arts participation activities (attendance and arts creation) 1 2 3 4 Communality
Attend – classical music 0.56 0.27
Attend – musical theater 0.53 0.27
Attend – art museum 0.50 0.34 0.38
Attend – non-musical 0.48 0.22
Attend – jazz 0.42 0.19
Attend – other dance 0.41 0.18
Attend – historic location 0.39 0.36 0.32
Attend – ballet 0.38 0.12
Attend – opera 0.38 0.11
Attend – Latin, Spanish, or salsa music 0.07
Create – paint/draw/sculpt 0.61 0.20
Create – photography/movies/video 0.48 0.18
Create – creative writing 0.43 0.15
Create – pottery/ceramics/jewelry 0.38 0.12
Create – weave/needlework/sewing 0.10
Create – played a musical instrument 0.12
Create – dance 0.06
Attend – art or crafts fairs and festivals 0.71 0.36
Attend – outdoor performing artists festival 0.60 0.32
Create – sang/acted in a musical play 0.74 0.20
Create – acted in a non-musical play 0.50 0.18
Create – sang with a vocal group 0.32 0.11
Create – sang music from an opera 0.05
Eigen values 4.27 1.67 1.44 1.16
% of variance 8.96 6.35 5.61 4.57
Note: Loadings <.30 are suppressed
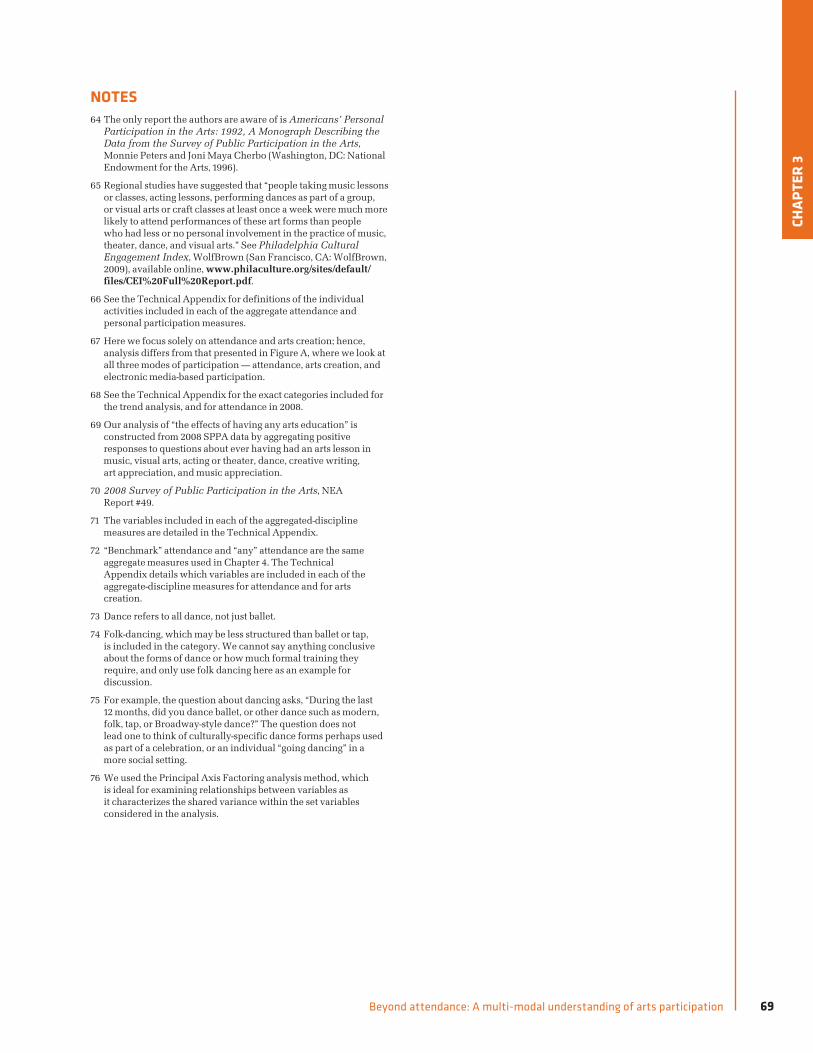
69Beyond attendance: A multi-modal understanding of arts participation
NOTES64 The only report the authors are aware of is Americans’ Personal
Participation in the Arts: 1992, A Monograph Describing the Data from the Survey of Public Participation in the Arts, Monnie Peters and Joni Maya Cherbo (Washington, DC: National Endowment for the Arts, 1996).
65 Regional studies have suggested that “people taking music lessons or classes, acting lessons, performing dances as part of a group, or visual arts or craft classes at least once a week were much more likely to attend performances of these art forms than people who had less or no personal involvement in the practice of music, theater, dance, and visual arts.” See Philadelphia Cultural Engagement Index, WolfBrown (San Francisco, CA: WolfBrown, 2009), available online, www.philaculture.org/sites/default/files/CEI%20Full%20Report.pdf.
66 See the Technical Appendix for definitions of the individual activities included in each of the aggregate attendance and personal participation measures.
67 Here we focus solely on attendance and arts creation; hence, analysis differs from that presented in Figure A, where we look at all three modes of participation — attendance, arts creation, and electronic media-based participation.
68 See the Technical Appendix for the exact categories included for the trend analysis, and for attendance in 2008.
69 Our analysis of “the effects of having any arts education” is constructed from 2008 SPPA data by aggregating positive responses to questions about ever having had an arts lesson in music, visual arts, acting or theater, dance, creative writing, art appreciation, and music appreciation.
70 2008 Survey of Public Participation in the Arts, NEA Report #49.
71 The variables included in each of the aggregated-discipline measures are detailed in the Technical Appendix.
72 “Benchmark” attendance and “any” attendance are the same aggregate measures used in Chapter 4. The Technical Appendix details which variables are included in each of the aggregate-discipline measures for attendance and for arts creation.
73 Dance refers to all dance, not just ballet.
74 Folk-dancing, which may be less structured than ballet or tap, is included in the category. We cannot say anything conclusive about the forms of dance or how much formal training they require, and only use folk dancing here as an example for discussion.
75 For example, the question about dancing asks, “During the last 12 months, did you dance ballet, or other dance such as modern, folk, tap, or Broadway-style dance?” The question does not lead one to think of culturally-specific dance forms perhaps used as part of a celebration, or an individual “going dancing” in a more social setting.
76 We used the Principal Axis Factoring analysis method, which is ideal for examining relationships between variables as it characterizes the shared variance within the set variables considered in the analysis.
CHAP
TER
3

National Endowment for the Arts70
In both dance and music, the size of the media-only segment is larger than the attendance-only segment, suggesting that the audiences for these art forms are significantly comprised of adults who do not attend performances.
71Beyond attendance: A multi-modal understanding of arts participation
CHAPTER 4
THE RELATIONSHIP OF ELECTRONIC MEDIA-BASED PARTICIPATION TO ATTENDANCE AND ARTS CREATION
The most prevalent mode of arts participation in the U.S. is electronic media-based, according to the 2008 SPPA.77 Just over half of U.S. adults reported viewing or listening to a performing arts event or a visual arts program (via recorded or broadcast media), or accessing arts performances or programming online (via Internet). While Chapter 2 reported rates of electronic media-based participation and the demographic characteristics of Americans who participate in the arts via electronic media, this chapter examines the linkages between electronic media-based participation and participation through each attendance and arts creation.
RATESIn 2008, 35% of U.S. adults engaged in the arts through both electronic media-based participation and attendance, while 33% engaged in the arts through both electronic media-based participation and personal arts creation. When we look at the combined rates for electronic media-based participation and attendance-based participation, the American population sub-divides into three roughly equal cohorts — adults who engage in both forms of participation, adults who engage exclusively in one form or another, and adults who participate in neither. A very similar distribution was observed with respect to the combination of electronic media-based participation and participation via arts creation. We find meaningful from these analyses that many adults in the U.S. (approximately 15%) participate in the arts via electronic media only. (See also NEA Research Report #50, Audience 2.0: How Technology Influences Arts Participation, released in 2010.)
RATES WITHIN DISCIPLINES (PARTICIPATION VIA RECORDINGS OR BROADCASTS)The 2008 SPPA investigates participation via recorded and broadcast media for several disciplines, including music, dance, theater, and visual arts, which allows us to report the combinations of attendance and recorded and broadcast media participation, by discipline. Figure 10 illustrates the distribution of modal participation by artistic discipline. The modal distribution is conditioned on the subset of the U.S. adult population that reported participating in either mode between May 2007 and May 2008; the artistic discipline is labeled beneath each column. In 2008, 45.7% of U.S. adults reported participating in music through attendance or broadcast media, compared with 38.2% for visual arts, 26.4% for theater, and 13.0% for dance.

72 National Endowment for the Arts
Figure 10 illustrates that dance has the largest segment of media-only participants (44.6%), followed by music (36.1%). In both dance and music, the size of the broadcast-only segment is larger than the attendance-only segment, suggesting that the audiences for these art forms are significantly comprised of adults who do not attend performances.78
This characteristic raises a number of interesting questions. What populations are engaging via recorded or broadcast media? What are their motivations? How attentively are they watching and listening? What role does setting play in driving participation in attendance-based versus broadcast-based arts activities? Flexibility of choice and timing? What specific forms of music and dance are associated with broadcast-based participation versus attendance-based participation? What proportion of broadcast-based participation is driven by commercial versus nonprofit enterprise? Ever since the Metropolitan Opera began broadcasting into movie theaters worldwide, the arts industry has
been consumed with debate over the relative merits of broadcast-based participation versus attendance at live programs. What is the added value of a live experience over a digital experience, especially when the digital experience occurs in a theatrical setting? This is a central debate facing today’s arts sector. As the amount of high-quality digital content increases, will the public increasingly prefer such experiences? Ten years from now, will movie theaters supersede performing arts theaters as venues for classical music, opera, and theater participation? Or, will home viewing proliferate? All of these questions emerge from the 2008 SPPA.
Figure 11 illustrates the distribution of modal participation rates for U.S. adults who reported participating in the arts via creation or by listening to, or watching, recorded or broadcast media (including via Internet). In contrast to the relationship between electronic media-based and attendance-based modes of participation, much less overlap appears.
When looking at the subset of the U.S. adult population that either creates art or views and/or listens to artistic content through recorded or broadcast media, the pattern is different for visual arts and music, compared with theater and dance. Both music and visual arts have sizeable portions — 22.5% and 25.9%, respectively — of participation via creation and through recorded or broadcast media. However, the ratio of participation in both modes to participation in creative activities alone is very different — 1.19 for music and 0.48 for visual arts.79 In the visual arts, proportionately more Americans create than participate via recorded or broadcast electronic media, whereas performing arts reveals the opposite trend: more adults participate through recordings and broadcasts than through personal arts creation.
FIGURE 10Distribution of U.S. adults, based on arts participation via attendance and viewing and/or listening to arts recordings or broadcasts, by discipline: 2008
Perc
enta
ge o
f U.S
. adu
lts
0%
10%
20%
30%
40%
50%
60%
70%
80%
90%
100%
Attended onlyAttended and viewed and/or listened to broadscasts or recordingsViewed and/or listened to broadscasts or recordings only
Programs about the visual arts (38.2%)
Dance (13.0%)Theater (26.4%)Music (45.7%)
30.4%
33.5%
36.1%
23.1%
20.1%
56.8%
38.5%
16.9%
44.6%
10.5%
28.8%
60.7%

73Beyond attendance: A multi-modal understanding of arts participation
RATES WITHIN DISCIPLINES (EXCLUSIVELY ONLINE PARTICIPATION)The 2008 SPPA also captures information specifically about adults accessing performing and visual arts content online. A single question asks about adults’ use of the Internet to watch, listen to, or download live or recorded performing arts — music, theater, or dance — so we are unable to look separately at each performing arts discipline. Figure 12 shows the modal distribution of electronic media-based participation through online access and attendance.
Of adults who participate in the performing arts through attendance or by accessing content online, 18% engage online only with the performing arts, and 11% engage online only with the visual arts. In both the performing and visual arts, nearly 26% of adults participate through attendance and online access. As with participation via recorded and broadcast media, this pattern raises more questions, especially given the large percentages
that participate this way. What types of music, dance, or theater content do Americans access online? What portion of this activity relates to music downloading? What role do video aggregation websites like YouTube play in driving online participation? Will consumers pay to access professional-quality digital arts content online?80 While we cannot speak to the motivations for individuals’ choices to participate exclusively online, the data do suggest a sizable audience for online artistic content.
When we consider online activity as it relates to creative activity in the performing arts (see Figure 13), it becomes apparent that a large percentage of adults that reported either activity created art only through online participation (42.6% of the one-third of Americans who did both activities in 2008, or 14.2% of all adults). This pattern raises questions, in turn, about the extent to which Americans value the Internet for the purpose of creating artwork versus enjoying content created by others.
FIGURE 11Distribution of U.S. adults, based on participation via arts creation and/or viewing and/or listening to recordings or broadcasts, by discipline: 2008
Perc
enta
ge o
f U.S
. adu
lts
0%
10%
20%
30%
40%
50%
60%
70%
80%
90%
100%
Created onlyCreated art and viewed and/or listened to broadcasts or recordingsOnly viewed and/or listened to broadcasts or recordings
Programs about the visual arts (34.3%)
Dance (10.5%)Theater (13.9%)Music (42.3%)
18.9%
22.5%
58.6%
89.9%
3.6%
6.5%14.3%
8.6%
77.1%
20.4%
25.9%
53.6%
FIGURE 12Distribution of U.S. adults, based on participation via arts attendance and/or accessing the arts online: 2008
Perc
enta
ge o
f U.S
. adu
lts
0%
10%
20%
30%
40%
50%
60%
70%
80%
90%
100%
Attended onlyAttended and participated onlineParticipated online only
Visual arts (38.7%)Performing arts (46.1%)
54.7%
18.2%
27.1%
11.4%
25.1%
63.6%
CHAP
TER
4

74 National Endowment for the Arts
RATIOS ACROSS DISCIPLINESDoes whether or not someone participates via recorded or broadcast media affect the probability he or she will attend? Figure 14 illustrates attendance rates by discipline, comparing figures for those who do watch/listen via media with figures for those who do not.
U.S. adults who reported participation via recorded or broadcast media for a specific genre/discipline in 2008 reported higher rates of attendance for that genre/discipline than those who did not participate via recorded or broadcast media. Most of the attendance rates are small and too statistically unstable to report. But results are stable enough to report on two disciplines — classical music and visual arts.
Among the individuals who reported watching or listening to classical music via recorded or broadcast media in 2008, 13.1% also performed or rehearsed classical music. This rate is 11.9 times higher than the rate for those who did not participate via recorded or broadcast media. It is not surprising that people who perform or rehearse classical music also consume it via recorded or broadcast media. The story is somewhat different, however, for visual arts, where the ratio falls to 2.6. Proportionately fewer adults who create visual arts also watch broadcasts about art, artists, or art museums.
FIGURE 13Distribution of U.S. adults, based on participation via arts creation and accessing the arts online: 2008
Perc
enta
ge o
f U.S
. adu
lts
0%
10%
20%
30%
40%
50%
60%
70%
80%
90%
100%
Created onlyCreated and participated onlineParticipated online only
Visual arts (33.9%)Performing arts (33.3%)
31.8%
42.6%
25.5%
19.5%
26.3%
54.3%
FIGURE 14Comparative rates of arts attendance among adults who did or did not experience arts broadcasts or recordings: 2008
Perc
enta
ge o
f U.S
. adu
lts
0%
10%
20%
30%
40%
50%
60%
70%
80%
90%
100%
Did not listen/watch broadcasts/recordingsListened/watched broadcasts/recordings
Visual arts
DanceNonmusical theater
Musical theater
OperaClassical music
Latin/Salsa music
Jazz
6.3
12.3
6.6
10.7
3.3
3.75.0
2.7

75Beyond attendance: A multi-modal understanding of arts participation
NOTES77 “Electronic media-based participation” includes any form
of participation via broadcasts and recordings, and watching, listening to, or downloading music, theater, or dance performances or visual arts. See the Technical Appendix for the exact variables used. Using electronic media participation defined solely as broadcast-based participation, 29% of U.S. adults participate only by broadcast when looking at the overlaps between attendance at live performances and watching or listening to broadcasts. To look at electronic media participation defined only as broadcast-based participation, see the Technical Appendix.
78 Due to changes in wording about technologies, the NEA has determined that questions regarding broadcast-based media participation are not comparable across SPPA waves. Given the relatively large response regarding broadcast-only participation for music and dance in the 2008 SPPA data, it would be interesting to investigate if that pattern held in prior years. We are curious about the possible influence of popular dance and singing competitions on the 2008 SPPA data registering participation in music and dance via broadcast media.
79 The nature of the question regarding broadcasted programming about the visual arts is different than questions regarding the performing arts disciplines. The visual arts question implies provision of contextual information about artists, artworks, or art museums, whereas questions about the performing arts disciplines imply that the content of an artwork is being consumed (e.g., a broadcasted performance of an orchestral piece as opposed to a program about a composer).
80 Several arts groups are now experimenting with selling digital performances via the Internet, including the Berlin Philharmonic (www.berliner-philharmoniker.de/en) and On The Boards, a Seattle-based performing arts organization (www.ontheboards.tv).
CHAP
TER
4

National Endowment for the Arts76
Roughly half of all U.S. adults reported participating in at least one mode of arts participation: attendance, creation, or electronic media use.

77Beyond attendance: A multi-modal understanding of arts participation
CHAPTER 5
HOW THE THREE MODES INTERSECT
When we review, in aggregate, all three modes of participation captured by the SPPA — attendance, arts creation and performance, and electronic media-based participation — we find that approximately 74% of U.S. adults participated in the arts between May 2007 and May 2008. Figure 15 illustrates the distribution of U.S. adults participating in the three modes, and how the modes intersect.
In total, the rates at which U.S. adults participate in each of the three modes are approximately the same. Roughly 50% of adults reported participating at least once in any of the attendance-based activities, any of the arts creation or performance activities, and in any of the electronic media-based activities.
The three spheres of participation overlap similarly, and also illustrate that some adults reported no participation in the arts. Approximately the same portion of U.S. adults (26%) participated in all three of the modes as did in none of the three modes (26%).81
FIgure 15 illustrates eight mutually exclusive categorizations or “modalities” of participation. Next, we use demographic analysis to understand who participates via each of these modalities. Table 17 reports rates of participation for each of the eight modalities, while Table 18 reports their demographic distributions.
GenderAlthough women tend to participate more than men in creative arts activities, men tend to participate more than women in electronic media-based arts alone, and in the combination of electronic media-based arts and arts attendance-based participation. Men are also more likely than women not to participate in the arts at all (at rates of 28.0% vs. 24.6%, respectively).
AgeA slight skew toward the younger-age cohorts is evident for the modalities that include electronic media-based participation, while the modalities involving attendance-based activities tend to rise in the middle-age cohorts, perhaps as a reflection of who has the time and money to attend arts programs. Note also the significant drop-off in activity levels by range of older adults who participate in all three modalities, from 30.6% for adults in the 55–64 age cohort to 16.9% for those in the 65–74 age cohort. Similarly, a rise is observed in the percentage of older adults who did not participate in the arts at all in 2008 (22.0% up to 31.9%).
FIGURE 15A multi-modal distribution of U.S. adults’ arts participation rates: 2008
Attendance8%
Creation6%
Media-based participation10%
No participation26%
7%
7%10%
All modes26%

78 National Endowment for the Arts
TABLE 17Distribution of U.S. adult participation rates across modes, by demographic group: 2008
Media only
Media and attend
Attend only
Attend and create
Create only
Media and create
All 3 modes None
All adults
10.0% 10.5% 7.5% 6.8% 6.0% 6.9% 26.0% 26.3% 100.0%
Gender
Male 11.0% 12.5% 7.9% 5.1% 5.2% 6.2% 24.2% 28.0% 100%
Female 9.2 8.6 7.0 8.5 6.8 7.5 27.8 24.6 100
Range 1.8% 3.9% 0.9% 3.4% 1.6% 1.3% 3.6% 3.4%
Race/ethnicity
White, Non-Hispanic 5.9% 8.9% 9.0% 8.6% 6.0% 6.0% 30.2% 25.4% 100%
African American, Non-Hispanic 14.2 9.5 5.8 3.7 9.1 8.4 16.0 33.3 100
Hispanic 26.3 18.5 1.8 2.0 4.3 10.3 14.1 22.8 100
American Indian, Non-Hispanic 6.4 6.6 0.6 4.7 5.7 0.6 7.8 67.5 100
Asian, Non-Hispanic 13.5 13.1 5.8 3.3 3.3 4.6 28.3 28.2 100
2 or more races, Non-Hispanic 4.5 7.2 15.5 2.4 11.5 18.3 24.6 16.1 100
Range 21.8% 11.9% 14.9% 6.6% 8.2% 17.7% 22.4% 51.4%
Age
18–24 11.4% 16.8% 4.1% 3.8% 4.6% 9.9% 29.1% 20.3% 100%
25–34 11.8 12.8 5.6 4.9 4.1 6.2 27.3 27.3 100
35–44 10.9 11.3 9.0 6.2 5.0 7.5 24.0 26.1 100
45–54 8.2 7.8 6.6 10.4 7.4 6.6 29.5 23.4 100
55–64 7.8 8.9 12.9 7.2 6.5 4.0 30.6 22.0 100
65–74 11.8 10.1 6.6 8.7 7.5 6.5 16.9 31.9 100
75+ 8.8 2.4 6.9 5.2 9.3 8.0 15.3 44.2 100
Range 4.0% 14.4% 8.8% 6.6% 5.2% 5.9% 15.3% 23.9%
Education
Grade school 20.7% 9.8% 5.5% 0.2% 5.6% 6.2% 2.4% 49.7% 100%
Some high school 18.4 9.8 5.1 5.2 10.7 8.6 7.1 35.1 100
High school graduate 12.5 7.5 8.5 7.3 8.5 6.3 13.6 35.8 100
Some college 7.9 11.0 8.0 7.1 6.1 7.8 29.2 22.8 100
College graduate 5.4 15.6 8.4 7.6 1.3 6.0 41.6 14.0 100
Graduate school 2.4 9.1 4.5 7.9 1.9 5.2 60.7 8.2 100
Range 18.3% 8.1% 4.0% 7.7% 9.4% 3.4% 58.3% 41.5%
Family income
<$10,000 19.8% 1.9% 6.1% 3.9% 4.7% 11.7% 11.9% 40.0% 100%
$10,000–19,999 12.8 13.5 3.5 8.8 8.2 7.4 12.3 33.4 100
$20,000–29,999 17.5 6.6 5.5 4.0 4.6 10.0 18.1 33.7 100
$30,000–39,999 11.6 8.0 11.5 5.2 8.8 7.1 17.6 30.2 100
$40,000–49,999 7.9 13.4 5.6 7.7 8.8 8.3 25.7 22.6 100
$50,000–74,999 11.3 12.2 8.2 8.7 8.7 6.5 22.8 21.6 100
$75,000–99,999 8.2 12.0 5.3 8.6 3.5 7.9 36.9 17.7 100
$100,000–149,999 3.6 14.4 7.9 6.8 3.7 3.8 46.5 13.2 100
$150,000+ 2.6 8.4 9.5 8.2 1.5 3.8 51.7 14.3 100
Range 17.2% 12.5% 8.0% 4.9% 7.3% 7.9% 39.8% 26.8%
Citizenship status
Native 8.1% 9.8% 8.1% 7.4% 6.1% 6.6% 27.7% 26.1% 100%
Naturalized 19.0 15.2 5.6 5.8 2.7 6.5 19.0 26.2 100
Non-citizen 23.9 14.3 2.5 0.8 7.1 9.5 13.7 28.2 100
Range 15.8% 5.4% 5.6% 6.6% 4.4% 3.0% 14.0% 2.1%

79Beyond attendance: A multi-modal understanding of arts participation
TABLE 18Demographic distribution of modal participation rates: 2008
Media only
Media and attend
Attend only
Attend and create
Create only
Media and create
All 3 modes None
All adults U.S. Population
Millions Percent 10.0% 10.5% 7.5% 6.8% 6.0% 6.9% 26.0% 26.3%
Gender
Male 108.6 48.3% 53.3% 58.2% 51.9% 36.4% 42.2% 44.0% 45.4% 52.1%
Female 116.2 51.7 46.7 41.8 48.1 63.6 57.8 56.0 54.6 47.9
Total 224.8 100.0% 100.0% 100.0% 100.0% 100.0% 100.0% 100.0% 100.0% 100.0%
Race/ethnicity
White, Non-Hispanic 154.4 68.7% 40.7% 58.8% 82.8% 86.9% 68.2% 59.9% 80.0% 66.6%
African American, Non-Hispanic 25.6 11.4 16.4 10.5 9.1 6.4 17.4 14.2 7.2 14.7
Hispanic 30.3 13.5 0.5 0.5 0.1 0.5 0.7 0.1 0.2 1.9
American Indian, Non-Hispanic 10.3 4.6 5.1 4.8 2.9 1.9 2.1 2.5 4.1 4.1
Asian, Non-Hispanic 1.2 0.5 0.4 0.6 1.8 0.3 1.6 2.3 0.8 0.5
2 or more races, Non-Hispanic 2.8 1.3 36.9 24.9 3.4 4.1 10.0 21.1 7.6 12.2
Total 224.8 100.0% 100.0% 100.1% 100.1% 100.1% 100.0% 100.1% 99.9% 100.0%
Age
18–24 28.8 12.8% 15.0% 21.4% 7.4% 7.4% 10.1% 19.2% 14.9% 10.3%
25–34 39.8 17.7 20.4 21.2 12.9 12.5 11.6 15.6 18.2 18.0
35–44 41.8 18.6 19.7 19.6 22.0 16.6 15.1 19.9 16.8 18.0
45–54 43.8 19.5 16.6 15.1 17.8 31.0 24.9 19.4 23.0 18.1
55–64 33.3 14.8 11.2 12.3 25.0 15.4 15.5 8.5 17.0 12.0
65–74 19.8 8.8 10.6 8.7 7.9 11.5 11.1 8.6 5.8 10.9
75+ 17.1 7.6 6.6 1.7 7.0 5.7 11.6 8.8 4.4 12.7
Total 224.8 99.8% 100.1% 100.0% 100.0% 100.1% 99.9% 100.0% 100.1% 100.0%
Education
Grade school 11.2 5.0% 9.4% 4.3% 3.3% 0.1% 4.3% 4.1% 0.4% 8.6%
Some high school 22.0 9.8 20.1 10.4 7.5 8.4 19.5 13.8 3.0 14.7
High school graduate 68.3 30.4 35.7 20.6 32.7 30.9 40.2 26.5 15.0 39.1
Some college 61.4 27.3 23.2 30.9 31.5 30.7 29.5 33.5 33.0 25.5
College graduate 41.1 18.3 9.5 26.2 19.6 19.7 3.7 15.4 28.0 9.3
Graduate school 20.5 9.1 2.1 7.7 5.4 10.2 2.8 6.6 20.5 2.8
Total 224.8 99.9% 100.0% 100.1% 100.0% 100.0% 100.0% 99.9% 99.9% 100.0%
Family income
<$10,000 11.6 5.8% 10.2% 1.0% 4.6% 2.9% 4.1% 8.7% 2.4% 8.9%
$10,000–19,999 19.3 9.6 11.9 12.5 4.8 12.0 13.0 10.0 4.4 13.4
$20,000–29,999 23.4 11.7 20.1 7.5 9.2 6.8 9.0 16.6 8.1 16.7
$30,000–39,999 22.6 11.3 12.6 8.5 18.3 8.2 16.2 11.2 7.4 14.1
$40,000–49,999 18.8 9.3 6.9 11.5 7.1 9.8 13.0 10.5 8.7 8.5
$50,000–74,999 40.7 20.3 22.3 23.9 23.9 25.2 29.2 18.7 17.5 18.4
$75,000–99,999 27.2 13.5 10.7 15.6 10.2 16.4 7.8 14.9 18.8 10.0
$100,000–149,999 21.4 10.7 3.2 12.7 10.3 8.8 5.6 4.9 16.1 5.1
$150,000+ 16.0 8.0 2.1 6.9 11.6 9.9 2.2 4.6 16.6 5.1
Total 201.0 100.2% 100.0% 100.1% 100.0% 100.0% 100.1% 100.1% 100.0% 100.2%
Citizenship status
Native 190.9 84.9% 69.6% 80.5% 92.9% 94.2% 87.6% 83.1% 91.5% 85.5%
Naturalized 15.1 6.7 10.6 8.1 4.2 4.8 2.6 5.3 4.1 5.6
Non-citizen 18.7 8.3 19.8 11.4 2.8 1.0 9.8 11.6 4.4 9.0
Total 224.8 99.9% 100.0% 100.0% 99.9% 100.0% 100.0% 100.0% 100.0% 100.1%
CHAP
TER
5

80 National Endowment for the Arts
Educational attainmentAdults with some high school education or those who graduated from high school compose large segments of the subpopulations that participated in the arts via electronic media alone. Over 20% of adults with only grade-school level education reported participating via electronic media alone, while over 18% of adults with some high school education reported the same. For adults with lower levels of educational attainment, the most popular mode of participation in the arts is via electronic media alone, suggesting the key role that electronic media-based forms of arts participation play in making the arts accessible to many Americans. Adults with higher levels of education, on the other hand, tend to participate via all three modes of arts participation.
Family incomeSimilar to adults with higher levels of educational attainment, Americans with higher incomes reported relatively higher rates of participation through all three modes of arts participation than did individuals with lower incomes.
Race/ethnicityResults suggest the key role that electronic media-based arts delivery systems play in serving Hispanics. Hispanics are more than four times as likely as whites to participate in the arts via electronic media alone (26.3% versus 5.9%), and twice as likely as whites to participate in both electronic media-based and attendance-based activities (18.5% versus 8.9%).
Citizenship statusNaturalized citizens and non-citizens participate in the electronic media alone, electronic media plus attendance, and electronic media attendance creation modalities at relatively high rates. Attendance-only rates for these groups are lower than average rates for the general population. Native-born Americans are twice as likely as non-citizens to participate via all three modes (at rates of 27.7% versus 13.7%).
DISTRIBUTION OF MODAL PARTICIPATION RATES, BY DISCIPLINEConsidering all the modalities of participation discussed above, U.S. adults are most likely to participate in the arts via music and visual arts. Approximately 52% of adults participate in music and in visual arts, while almost 30% of adults reported participating in theater, and 16% reported participating in dance. Figure 16 shows the rates of modal participation within each of these disciplines.
Attendance is the most frequently reported mode of participation for both theater and visual arts, whereas the rate for participation through electronic media is the highest for music. For dance, U.S. adults report approximately the same participation rates for arts attendance and media-based arts. The highest rate of participation via arts creation is reported in the visual arts.
FIGURE 16U.S. adults’ modal participation rates across artistic disciplines: 2008
Perc
enta
ge o
f U.S
. adu
lts
0%
10%
20%
30%
40%
50%
60%
70%
80%
90%
100%
Viewed and/or listened to a broadcast or recordingAttendedCreated
Visual (51.7%)Dance (16.0%)Theater (29.8%)Music (52.6%)
33.3%
57.1%
47.5%
56.0%
65.1%
4.6%
75.6%
43.6%
53.8%
14.7%
52.9%
67.5%

81Beyond attendance: A multi-modal understanding of arts participation
Using the same data as the previous figure, Figure 17 illustrates the distribution of modal participation within the subset of the U.S. adult population that reports participation in each of the disciplines. Looking across the discipline-specific columns, we see that dance involves the largest segment of media-only participation, while theater involves the largest segment of attendance-only participation, and visual arts involves the largest segment of creation-only participation. Visual arts also involves the largest segment of overlap between participants who create and attend, compared with other disciplines.
NOTES81 See the Technical Appendix for definitions. This aggregate
measure was defined to maintain consistency with earlier analyses in this monograph.
CHAP
TER
5
FIGURE 17A multi-modal distribution of U.S. adults’ arts participation, by artistic discipline: 2008
Perc
enta
ge o
f U.S
. adu
lts
0%
10%
20%
30%
40%
50%
60%
70%
80%
90%
100%
Via recordings or broadcasts onlyAttended and via recordings or broadcastsAttended onlyAttended and created
Created onlyCreated and via recordings or broadcastsCreated, attended, and via recordings or broadcasts
Visual (51.7%)Dance (16.0%)Theater (29.8%)Music (52.6%)
25.9%
21.1%
19.7%
5.3%
10.0%
7.0%
11.1%
53.5%
19.8%
22.1%
36.2%
10.7%
11.6%
24.8%
11.9%
15.9%
6.0%
19.2.0%
14.4%
34.6%
2.7%
6.7%
3.3%2.1%1.3%
1.9% 1.0%0.4%
In percentages of U.S. adults
Note: The rate of U.S. adult participation in the discipline is included in the column labels. The columns themselves demonstrate the distribution of rates across each participation mode within the discipline.

National Endowment for the Arts82
One out of four U.S. adults participate in the arts exclusively through modes other than attendance.
83Beyond attendance: A multi-modal understanding of arts participation
CHAPTER 6
WHERE DO WE GO FROM HERE?
This research monograph explores “arts participation” in the U.S. by examining the relationships between attendance, personal arts creation and performance, and electronic media-based arts participation, using the breadth of arts events and activities captured by the 2008 SPPA. While the overall rate of arts participation among U.S. adults has declined over time,82 the SPPA demonstrates that people participate in the arts in a variety of modes and disciplines. Over the years, much attention has been devoted to rates of attendance; yet almost a quarter (23%) of U.S. adults participate in the arts exclusively through other modes than attendance. Of the approximately 50% of U.S. adults who do attend arts events, 84% also participate through electronic media or arts creation. A relatively small portion of the U.S. adult population participates solely by attending arts events (8%). These results, considered in the contexts of the rapidly changing cultural climate, a growing body of literature advocating for more democratic approaches to supporting culture, and widespread concern about declines in arts audiences, imply a need for shifts in practice among arts organizations, and a broader lens for examining policies supportive of the arts.
IMPLICATIONS FOR PRACTICEAs audience levels decline and cultural tastes diffuse, arts groups who rely on attendance are under mounting pressure to evolve and adapt so that they remain relevant to their communities. While a substantial infrastructure of book clubs, choruses, community music schools, art centers, and craft workshops satisfy a portion of public demand for arts creation, the much larger and better-funded infrastructure of professional arts producers and presenters has not, historically, been concerned with arts creation, except in acquiring or commissioning new work by professional artists. A 2009 report from the Wallace Foundation (Sherwood, 2009, 6) suggests that one way to develop audiences for live arts performances and events is to understand how current and potential audiences practice art in their own lives.
We do not suggest that attendance and arts creation are dichotomous forms of arts participation. On the contrary, visiting an exhibition or seeing a live performance can be profoundly interactive, allowing the audience member to play a significant role in creating the arts experience. Given that consumer tastes are shifting toward more interactive experiences (Pine and Gilmore, 1999), this section considers practical implications for arts organizations’ operations and their supporting infrastructure.
84 National Endowment for the Arts
Organizational philosophy and operations
Surveying the landscape of arts activity in the U.S. and abroad, there are clear signs of a shift in the types of experiences arts organizations offer, and even in the very definition of what it means to be an audience member. This shift in practice reflects a trend toward arts organizations viewing themselves as “enablers” of arts experiences83 rather than as expert providers or arbiters of artistic taste and quality. Although some artists and curators have voiced concern that the “enabler” framework results in the loss of artistic control and potential degradation of artistic quality, others argue that it creates more opportunities for the “co-production”84 of art. Embracing this philosophy of being an “enabler” requires an arts organization to reprioritize its outcomes and place greater emphasis on providing opportunities for arts and creative engagement in people’s lives. Such a process seems to require more expertise from curators, not less. The challenge is to understand how this new approach changes the core of an organization and its relationship with audiences, both live and virtual. A similar notion is “organizational porosity:” the need to open artistic processes to others, and no longer to be the gatekeepers of culture and arts.85
Below are a few of the strategies employed by arts groups to draw audiences and visitors into more interactive and personal/engaging experiences:
Strategies for Engaging Audiences and Visitors
■ Involving community artists in the creation of artistic work within professional arts organizations and venues. For example, the opera companies of Cincinnati and Knoxville organize programs involving gospel choirs from area churches.
■ Allowing more interpretation and interaction during exhibits and performances. Educational activities surrounding arts programs tend to appeal to patrons and visitors who already are knowledgeable about the art.86 For individuals not inclined to attend educational programs, the challenge lies in figuring out how to embed more context and interpretive assistance into the program or exhibition itself.87 Over the past several years, new developments have included supertitles at dance performances, audio description via cell phones, Twitter broadcasts during orchestra concerts, and introductory videos.
■ Creating new program formats. The arts field is in a period of rapid innovation with respect to developing formats that allow audiences to make choices they have not previously been able to make. An example from the music field is the New World Symphony in Miami Beach, which is testing innovative concert formats, such as mini-concerts (30 minutes each, three per night) and club-style concerts running 10:00 p.m. to 2:00 a.m., in advance of moving into its new concert hall in 2010–11.
Strategies for engaging audiences and visitors beyond the venue
■ Providing artistic content and instruction online and through other media. Despite ongoing debate about the merits of a “live 3D” arts experiences compared to a “2D” arts experiences available online and through video recordings and broadcasts, particularly in the dance and theater fields,88 the SPPA data suggest there is a sizable audience for online “2D” experiences.
■ Providing opportunities for audiences to “enhance” arts experiences by providing forums for conversation and context-building activities. Research suggests that context-building activities, as well as post-performance dialogues, can magnify impact and lead to more satisfying experiences;89 however, the effectiveness of different methods is still being explored. The types of context-building activities and forums for post-performance dialogues now being developed go well beyond the traditional lectures and discussions historically offered by museums and performing arts groups.90

85Beyond attendance: A multi-modal understanding of arts participation
Strategies for engaging people in the creation of artistic works:
■ Involving audiences or visitors in the creation of artistic works. For example, the Cornerstone Theater Company (based in Los Angeles, CA) creates works based on community input.
■ Involving artists in different ways. The need to offer more participatory experiences has a direct effect on artists, who are increasingly called upon not only to create great art, but also to communicate about it compellingly, and, ultimately, to awaken the creative voice in others.91 While some fields are slow to evolve due to structural impediments,92 demand is growing for artists with multiple skill sets. Consequently, there is a need for new approaches to artist training at all levels.
■ Utilizing new approaches to artistic planning and program development. In order to ensure that programs remain relevant and responsive, arts groups are developing more sophisticated and consultative program planning methods that include audience feedback and testing, consultation with a wide range of community stakeholders, and submission of requests for proposals to agents and managers that seek artists to address specific needs.93
This transformation of practice among arts producers is not new, but it appears to be gaining momentum. Perhaps this tendency responds to a loss of market share and greater competition from sports and other leisure activities94 that offer some consumers more intense and satisfying experiences.
Infrastructure
Participation in the arts is not confined to nonprofit arts programs and facilities. As discussed in Chapter 1, the setting in which an arts activity occurs is a key contextual factor related to arts participation. Several recent studies have investigated the settings in which arts activities occur95,96 and found that a great deal of arts activity takes place in the home and in community settings such as coffee houses, parks, and places of worship. Additionally, unlike the infrastructure that supports professional arts production, the infrastructure that supports arts creation in American communities is disparate, informal, self-organizing, and often unsupported by public agencies or private philanthropy (Alvarez, 2005). How do nonprofit arts organizations connect with and foster activity beyond their walls? Some potential implications include:
■ Existing museums and performing arts facilities that are underutilized may be converted, in part, to centers for creative expression, where community members can sing, dance, play music, make art, tell stories, and discuss books. The Active Arts program of the Los Angeles Music Center is an example of the transformation that can occur when a performing arts center recasts itself as a hub of civic cultural expression.97
■ New construction of large, centrally-located arts complexes may give way to a decentralized approach to facility development (e.g., creativity centers scattered around a city or region, one focused on dance, another on digital arts, etc.), enlivening neighborhoods and engaging children and families in creative activities that will strengthen social bonds and family cohesion.
CHAP
TER
6

86 National Endowment for the Arts
■ New physical and virtual ways of displaying, broadcasting, and performing community- generated artistic content are likely to spring up. As more people develop creative interests, more outlets will be needed for their work. For example, regional theaters could consider how to tap into deep veins of interest around storytelling,98 while bookstores or arts centers might consider supporting community writers through programs such as the Poetry Ark.99 Moreover, entirely new types of facilities and programs may be developed to respond to community needs for high-quality social and civic experiences around art. Consider, for example, the Urban Video Project, an initiative of Syracuse University with technology provided by Time Warner Cable. The project encompasses three venues projecting artwork and other cultural video displays daily from dusk to 11:00 p.m. High-definition projection systems are used to project video, photography, animation, and poetry, some drawn from the community, some by professional artists — a sort of giant, outdoor YouTube installation.100
■ Artists, arts organizations, and commercial providers are likely to offer arts experiences designed for a broader range of settings, including the home. Particularly for children, the need for home-based arts programming — programs that allow children to engage creatively with family and friends in the safety of their own homes — is acute.101 Nonprofit arts groups focus quite naturally on attracting audiences to their live programs, but generally say that producing home-based experiences is outside their mission. A handful of groups are experimenting with on-demand video programs, but few make the bridge to arts creation.
IMPLICATIONS FOR RESEARCHAlthough the SPPA has provided valuable periodic information to the NEA’s stakeholders for almost 30 years, conducting a rigorous analysis of the SPPA data naturally leads us to consider potential improvements to the design of the SPPA, and to the scope of arts participation research in general. In this section, we reflect on several questions about the future of arts participation research:
■ What information do policymakers, service organizations, funders, artists, and arts administrators need to more fully understand their place in the changing landscape of arts participation and civic life, more generally?
■ How can the NEA and other arts agencies speak more accurately and compellingly about the vitality and value of the U.S. public’s participation in the arts?
■ How do the data-collection methods and analyses regarding arts participation reflect public priorities in and for the arts?
■ Do we have the data needed to accurately portray the types of arts participation that are most relevant to people’s lives?
■ What sort of measurement system would better equip the cultural sector to detect and respond to changes in demand, and create new opportunities for engaging the public?
Although we recognize the budgetary limitations of pursuing new or additional data-collection efforts, we propose that consideration be given to a range of research topics in thinking about the design of future SPPAs and other NEA research efforts.
Forms of artistic, cultural, and creative expression
Despite the addition of questions over the years, the SPPA captures a necessarily limited scope of arts activities. Although debates will persist about what is and is not ultimately included within this scope of measured arts participation activity, the vital question becomes: are the existing questions relevant to how people experience and participate in the arts?

87Beyond attendance: A multi-modal understanding of arts participation
The current questions in the SPPA follow traditional conventions of separating activities by discipline and genre. This format poses two challenges: it assumes that an individual is familiar with the genre and can classify his or her own participation accordingly, and it assumes that an arts experience itself can be categorized according to genre or discipline. As noted earlier, the definitional lines between art forms are increasingly blurred, enabled in part by demographic shifts and new technologies. Artists themselves sometimes avoid identifying their work with a specific form. What does this blurring imply for the future of arts participation studies?
The blurring of forms does not imply that the survey should refrain from asking about specific genres, but it may imply a different question structure. For example, the Australia Council for the Arts asks about any participation by discipline, and allows an “other” category, then drills down to specific genres.102
Finally, we would like to suggest that some mechanism be put in place to simply catalogue different forms of artistic, cultural, and creative expression, and to detect new forms as they emerge. This “taxonomy of forms of expression” could be useful to many stakeholders who seek to understand the changing nature of creativity in America.
Technology and electronic media
Greater inquiry into usage of technology for accessing, creating, and sharing arts programs and artworks in each of the disciplines is warranted. At a minimum, discipline-specific questions about the creation and posting of original artworks, and accessing artistic/creative works online, should be included. Currently, online access of performing arts content is asked in a single question and visual arts are asked about in a single question. The Australia Council for the Arts includes an expansive list of ways one can use the Internet to engage with the arts, including accessing artistic content (from professional artists and nonprofessional), posting their own content, learning arts skills, participating in online social networks about the arts, and other uses.103
Setting
The 2008 SPPA included for the first time questions about arts attendance at schools and religious institutions. The rates of attendance at these community venues are among the highest rates of any reported for a single attendance activity (23.7% at schools and 19.1% at religious institutions).
As presently worded, there is ambiguity about the physical venue and social context in the questions about attendance.104 Art happens in an array of locations — coffee shops, community centers, online, in private homes, clubs and fitness facilities, places of worship — that are deeply embedded in the daily lives of Americans. The UK’s national “Taking Part” survey inquires about a variety of settings for music and serves as a model for more detailed questions about venue.105 Regional studies in the U.S. also provide models for questions about setting.106
Questions about setting are germane to all three modalities of participation, including arts attendance, personal arts creation, and electronic media-based participation. Where a person engages with the arts implies social and personal benefits derived from the experiences, and would also provide valuable information to policymakers about how to best serve the public based on where interactions with the arts actually occur. More needs to be understood about the impact of setting on personal meaning and public value. Are visual arts activities more accessible to Americans because of the diversity of settings in which they occur? How does the “collaborative” nature of performing arts activities (Nichols, 2010) and the settings, which accommodate these activities, affect participation? Why do some people attend concerts in places of worship, but not concert halls? How do broadcasts of live performances into movie theaters impact audiences differently than experiencing the same programs in person?107
CHAP
TER
6

88 National Endowment for the Arts
Degree of personal creative control
With growing support for customization in social media, and given the larger number of options provided to customers using all sorts of products and services, the question of “personal creative control” is an important research topic in the arts, with implications for both policy and practice. Digital audio devices and other technologies allow people to customize and curate their own experiences. The notion of individual curation underlies the changing nature of arts organizations ticketing packages (e.g., Design-Your-Own packages) as well as the abilities of Americans to “curate” their arts experiences at home through technologies and various sources of on-demand programming. Why do some consumers demand greater control over their arts experiences, while others prefer to have their experiences curated, electronically mediated, and interpreted for them? Is the balance changing?
Although this monograph examines arts creation, the specific creative activities addressed in the SPPA encompass several sub-categories of activity, including activities that involve creating original works of art and activities that involve performing or interpreting pre-existing works of art. In the Five-Modes-of-Arts-Participation conceptual framework discussed in Chapter 1, these activities are identified as Inventive and Interpretive, respectively. Past SPPAs have included a question about music composition, and the current SPPA asks about creative writing, painting, drawing, making photographs, movies and videotapes, and doing various craft activities — all of which are “inventive.” Given the higher level of interest in inventive and imaginative thinking (i.e., creative workforce issues) in the business sector, it may be time to re-examine the breadth and specificity of inventive activities explored by the SPPA, to ensure inclusion of enough indicators for each mode of activity (e.g., composing or arranging music using computer software, making up dance steps, making online scrapbooks, writing lyrics or spoken word).
We also recommend further inquiry into the curatorial mode of arts participation — selecting, organizing, arranging, and editing art to one’s own satisfaction — activities such as downloading music, making playlists and compilations, collecting and organizing digital art, and incorporating artistic objects and other artistic elements into living spaces. What role do these activities play in the aesthetic development of Americans? How much importance do Americans ascribe to these activities? Should these activities be supported by public arts agencies?
Attitudes toward and benefits from arts participation
The SPPA captures much information on arts participation in terms of behaviors — what activities a person did over the prior 12 months, which can be matched to a wealth of additional demographic and lifestyle variables captured by the Current Population Survey, to which the SPPA is appended. However, demographics explain less than 20% of the variation in arts participation behaviors. What other factors might help explain patterns of arts and cultural participation, and provide insights on where to invest public dollars into supporting a healthy and vital arts ecology that serves all Americans?
Attitudinal questions about the arts have been included in the General Social Survey and other national surveys in different years, but not on a regular basis nor with the intent of connecting understanding about attitudes with behaviors. Exploring more about the public’s beliefs, perceptions and attitudes about the arts, and the value and impacts they derive from their arts experiences — both on a personal and public level — would be illuminating.

89Beyond attendance: A multi-modal understanding of arts participation
Skill level and salience
Further exploration of skill level, as discussed in Chapter 1, would reveal more about the “centrality” and “salience” of different arts activities to Americans, based on their level of commitment and interest in the activity regardless of pecuniary benefit. For example, an American who takes photographs, even with artistic intentions, may have a weak or strong connection to photography as an art form, and, in any case, may attach a great deal of importance to the activity, or very little. Questions about whether one creates art as an amusement, hobby, for study, or for income, would provide greater context for how understanding the arts are woven into the fabric of American life. Similarly, understanding more about the importance that people attach to different arts activities (regardless of mode, discipline, or category) would help to paint a clearer picture of what activities matter most to adults in the U.S.
Trend analysis and aggregate indicators
The goal to expand and capture more relevant information about public participation in the arts is challenged by another research objective, which is to maintain comparable measures over time that allow for trend analysis. Analyses within this report do not include all years of the SPPA due to changes in question-wording that do not allow comparison across years. We want to be able to answer the basic question — is arts participation going up or down? To this end, generally, attendance at benchmark arts events have been used as the comparable statistic across years to indicate the health of arts participation at large. However, the SPPA includes two additional attendance activities (attendance at art or craft fairs and festivals and visits to parks, historic sites and monuments) that are comparable across years, as well as 11 personal arts-creation measures108 that are comparable over time since 1992, and which should be included in an aggregate measure of arts participation.
IMPLICATIONS FOR POLICYThe analyses in this monograph suggest a shift in focus for cultural policy, toward an expanded ecology of arts activity that more comprehensively captures how the American public chooses to participate in the arts — as audience members, as listeners or viewers of arts broadcasts or recordings, or as creators of art. (See Figure 18.) Using an expanded lens to view arts activity in multiple modes, genres, settings, skills, and levels of creative control suggests an important reframing of federal arts and cultural policy — from a frame that focuses primarily on indicators of the health of the audience base of nonprofit arts organizations to a frame that focuses on the scope of artistic and cultural expression of individual Americans.
Bill Ivey and Steven J. Tepper have written extensively on the “expressive life” of individuals and have questioned whether the role of the NEA and of U.S. federal policy in general is to support arts and cultural organizations, or to nurture the creative lives of the public.109 Those strategies need not work at cross-purposes. But a broader perspective does suggest the need for policies that support artists at all levels of proficiency, and across all forms of cultural expression, including mechanisms for supporting informal networks of arts creators. Similarly, data from the SPPA may justify greater support for arts creation in a variety of settings that reflect the diversity of the American experience.
A broader lens also navigates greater inquiry into the types of arts participation that are relevant in people’s lives and how they might differ between communities across the U.S. Using a broader lens at the federal level may also re-invigorate cultural policy at the local and state levels to better capture investments in cultural activities that are relevant to specific communities.
CHAP
TER
6

90 National Endowment for the Arts
Understanding how investments in the broader framework create value and make an impact suggests a need for a new conceptual framework that allows policymakers to consider the investments in a more thorough context. If arts activity is happening outside the traditional nonprofit arts infrastructure, then how do policymakers go about supporting this activity? How does one weigh the public value of arts creation versus arts attendance?110 How does one decide whether to support a program that allows citizens to express themselves creatively or a program that offers professional-quality exhibits or performances that inspire the public? Using a broader framework to understand arts participation, do we understand how participation in different parts of the cultural ecology contributes to the public value of arts participation?
Nonprofit cultural institutions compete for resources against a highly decentralized system of arts creation that typically lacks power and influence. Evaluating cultural development strategies and determining the appropriate mix of resources that should be devoted to different categories of activities requires a change in vocabulary and a better framework for assessing the public value of different investment strategies.
The cultural sector requires a simple, intuitive, conceptual framework for creative vitality that re-invigorates cultural policy and enfranchises a diverse set of stakeholders. The impetus for such a framework likely will arise from a dialogue with these stakeholders about the interdependent cultural ecology in which they work.
The analysis in this monograph constitutes reflection on the relevance of what is currently measured and on the relevance of those measures to individuals. We do not present these items as mutually exclusive, but propose them as a means for thinking about how to measure the cultural ecology for the purpose of federal, state, and local policy, and what the information also means to individuals and arts organizations.
The SPPA has provided national, cross-sectional data over the past 29 years, allowing us to benchmark behavioral changes in arts attendance and other forms of participation. This descriptive data on what the American public is doing in terms of arts participation is vital information, yet many questions remain about the shifting nature of arts and culture, as suggested by the data. Measurement systems dealing with arts and culture have been slow to develop and generally have had a narrow lens.
Although limited in scope, the SPPA does capture arts participation via attendance, arts creation, and electronic media-based participation, although most of the official analyses to date have focused on attendance. Yet the creative vitality and expressive voice of the American public requires another level of measurement not yet attained by the SPPA. The SPPA is but one survey that cannot necessarily expand to capture all questions regarding arts participation, attitudes toward the arts, reasons for participating (or not participating) in the arts, and other socio-demographic and lifestyle variables.
Our monograph, then, invites discussion about the interconnectedness of how people engage in the arts — through multiple modes — and what that participation implies for arts and cultural organizations and broader policy decisions and investments. In the decades to come, funders and arts agencies that seek to increase public support for the arts, support greater access to a more diverse set of arts activities, and reposition the arts as central to community life, will need to rely increasingly on a broader definition of “arts participation.”
FIGURE 18Cultural ecology framework111
Cultural literacy
Participatory cultural practice
Professional culturalgoods and services

91Beyond attendance: A multi-modal understanding of arts participation
NOTES82 As defined by a subset of consistently measured indicators of
attendance and personal arts creation in the 1982, 1992, 2002, and 2008 SPPAs. See the Technical Appendix.
83 “We use new-found powers of access to do things we have always liked doing. New and older forms of behavior and preferences are part of the same continuum. . . . We have moved from a model of provision to one of enabling.” Expressive Lives, ed. Samuel Jones, 9–10.
84 Lynne Conner, Associate Professor in the Theater and Dance Department at Colby College in Maine, has written and spoken extensively about the concept of audience and performers being co-creators of meaning.
85 See “Hannah Rudman’s Message to Project Audience: Organisational Porosity and User Generated Content in the Cultural Sector, October 5, 2009.” Vodpod video, 17:01. Posted October 28, 2009. http://vodpod.com/watch/2483545-hannah-rudmans-message-to-project-audience.
86 Classical Music Consumer Segmentation Study, Audience Insight (see n. 28).
87 We recognize that the visual arts have done more in this area than the performing arts. Within the performing arts, there is an ongoing debate over the sanctity of the “live experience” versus the need for interpretive assistance.
88 At a January 2010 gathering of grantees of the Engaging Dance Audiences grant program, which is administered by Dance/USA and funded by the Doris Duke Charitable Foundation, there was a spirited discussion of the artistic merits of live versus digital experiences.
89 Assessing the Intrinsic Impacts of a Live Performance, Brown and Novak (see n. 36).
90 For example, the University Musical Society in Ann Arbor, Michigan, developed a separate website for audience engagement and community interaction. This project was developed through the Innovation Lab for the Performing Arts program created by EmcArts and funded by the Doris Duke Charitable Foundation. See the website of the UMS Lobby, www.umslobby.org, accessed April 4, 2010.
91 The Creative Campus Innovations grant program of the Doris Duke Charitable Foundation (ongoing in 2010) allowed a cohort of university presenters to work with artists in new ways, and to build new connections with academic programs and departments.
92 For example, work rules for union orchestra musicians deter some orchestras from offering concerts in alternative formats that would require overtime payments to musicians. For a broader discussion, see The Economic Environment of American Symphony Orchestras, Robert J. Flanagan (Report to Andrew W. Mellon Foundation, 2008), accessed online April 4, 2010, www.gsb.stanford.edu/news/packages/pdf/Flanagan.pdf.
93 Jackie Bailey, Artistic Vibrancy — A Discussion Paper (Sydney, Australia: Australia Council for the Arts, 2009).
94 Roland J. Kushner and Randy Cohen, National Arts Index 2009: An Annual Measure of the Vitality of Arts and Culture in the United States (Washington, DC: Americans for the Arts, 2010).
95 Alan S. Brown, Jennifer L. Novak, and Amy Kitchener, Cultural Engagement in California’s Inland Regions (San Francisco, CA: WolfBrown, 2008).
96 Alan S. Brown and Theresa M. Daniel, The Arts Activities of Dallas Independent School District Students (San Francisco, CA: WolfBrown, 2008), available online, www.bigthought.org/LinkClick.aspx?fileticket=U8F6pyt9Weg%3d&tabid=267.
97 See the website of the Music Center, Performing Arts Center of Los Angeles County, www.musiccenter.org/events/activearts.html, accessed January 16, 2010.
98 The Stoop Storytelling program in Baltimore illustrates the type of community-based storytelling program that could be replicated in other cities. See the website of The Stoop Storytelling Series, www.stoopstorytelling.org, accessed April 4, 2010.
99 See the website of The Poetry Ark, www.poetryark.org, accessed January 16, 2010.
100 See the website of The Connective Corridor, www.connectivecorridor.syr.edu/corridor-venues/uvp, accessed January 16, 2010.
101 HOPSports Training Systems, for example, is a commercial business that sells fitness videos, including instructional videos for dance that can be viewed at home or used in schools that cannot provide dance instruction. See www.hopsports.com.
102 More than bums on seats, Australia Council for the Arts, 7–10 (see n. 12).
103 Ibid., 15.
104 The questions asked about live jazz, classical music, salsa/Latin music, opera, musical play, nonmusical play, ballet, and other dance specifically exclude “elementary or high school performances.” Otherwise, location and setting are ambiguous.
105 “And in what kinds of venue have you watched this music?” Taking Part: England’s Survey of Leisure, Culture and Sport: Technical Report (2007–08), Department for Culture, Media and Sports, UK Data Archive Study Number 6272, December 2007, 65. Answer items include: “pub/bar, hotel, restaurant/café, small club, medium to large live music venue, clubs and associations (private), student union, church halls/community centers, park/field, other (specify).”
106 In one study of cultural engagement in California’s inland regions, a question about setting was included in reference to each discipline. For example: “Where do your music activities take place?” Cultural Engagement in California’s Inland Regions, Alan S. Brown, Jennifer L. Novak and Amy Kitchener (San Francisco, CA: WolfBrown, 2008). Answer items included: “At your home, or someone else’s home, at work, at a school or college, at a place of worship, at a theater or concert facility, at a park or other outdoor setting, at a coffee shop, restaurant, bar or night club, at a community center, in a car, on the Internet, other place (please describe).”
107 “Innovation in Arts and Cultural Organisations,” Hasan Bakhshi and David Throsby (National Exercise & Sports Trainers Association (NESTA), December 2009), accessed online March 4, 2010, www.nesta.org.uk/library/documents/Innovation-in-arts-and-cultural-interim.pdf.
108 In 2008 the question on visits to “an art or craft fair or festiveal” was replaced by the following two questions: “During the last 12 months did you visit a crafts fair or a visual arts festival?” and “During the last 12 months did you visit an outfoor festival that featured performing artists?” See the Technical Appendix for a list of comparable arts-creation activities since 1992.
109 Expressive Lives, Jones (see n. 16); Arts, Inc., Ivey (see n. 16); Engaging Art, Tepper and Ivey (see n. 22).
110 In England, the Department of Culture, Media and Sports initiated a three-year research program in 2009 to build a better, evidence-based theoretical framework for assessing the value of investments in culture and sport. In the U.S., the Urban Institute has produced significant new thinking about measurement systems for cultural vitality, although few communities have implemented such measurement systems.
111 This diagram is adapted from Creative Community Index, Kreidler and Trounstine, 6 (see n. 14).
CHAP
TER
6

National Endowment for the Arts92

93Beyond attendance: A multi-modal understanding of arts participation
RECOMMENDED SOURCES
Alvarez, Maribel. There’s Nothing Informal About It: Participatory Arts within the Cultural Ecology of Silicon Valley. San Jose, CA: Cultural Initiatives Silicon Valley, 2005.
Audience Insight LLC. Classical Music Consumer Segmentation Study: How Americans Relate to Classical Music and Their Local Orchestras. Miami, FL: John S. and James L. Knight Foundation, 2002.
Australia Council for the Arts. More than bums on seats: Australian participation in the arts. Sydney, Australia: Australia Council for the Arts, 2010.
Bailey, Jackie. Artistic Vibrancy — A Discussion Paper. Sydney, Australia: Australia Council for the Arts, 2009.
Bakhshi, Hasan and David Throsby. “Innovation in Arts and Cultural Organisations.” National Exercise and Sports Trainers Association (NESTA), 2009. www.nesta.org.uk/library/documents/ Innovation-in-arts-and cultural-interim.pdf.
Barton Upright, Craig. Social Capital and Cultural Participation: Spousal Influences on Attendance at Arts Events. Working Paper #32. Princeton, NJ: Center for Arts and Cultural Policy Studies, 2004.
Bawa, Sameer, Kevin Williams, and William Dong. Audience 2.0: How Technology Influences Arts Participation. Research Report #50. Washington, DC: National Endowment for the Arts, 2010.
Borrup, Tom and Heidi Wagner. The Evolving Nature of Cultural Participation and Creative Expression: A Primer of Key Issues and Recommendations for 1st ACT. San Jose, CA: 1st Act Silicon Valley, 2007. Available through 1stACT Silicon Valley, telephone (408) 200-2020.
Brown, Alan S. The Values Study: Rediscovering the Meaning and Value of Arts Participation. Hartford, CT: Connecticut Commission on Culture and Tourism, 2004.
Brown, Alan S., and Theresa M. Daniel. The Arts Activities of Dallas Independent School District Students. San Francisco, CA: WolfBrown, 2008. www.bigthought.org/LinkClick.aspx?fileticket= U8F6pyt9Weg%3dandtabid=267.
Brown, Alan S., and Jennifer L. Novak. Assessing the Intrinsic Impacts of a Live Performance. San Francisco, CA: WolfBrown, 2007. www.wolfbrown.com/mups_downloads/Impact_Study_Final_ Version_full.pdf.
Brown, Alan S., Jennifer L. Novak, and Amy Kitchener. Cultural Engagement in California’s Inland Regions. San Francisco, CA: WolfBrown, 2008.
Bujic, Hannah. “New Ears.” Arts Professional 205 (November 2, 2009): 11.
Bunting, Catherine, Tak Wing Chan, and John Goldthorpe. From indifference to enthusiasm: patterns of arts attendance in England. London: Arts Council England, 2008. www.artscouncil.org.uk/media/uploads/indifferencetoenthusiasm.pdf.
Cwi, David, ed. Research in the Arts: Proceedings of the Conference on Policy Related Studies of the National Endowment for the Arts. Washington, DC: National Endowment for the Arts, 1977.
Department for Culture, Media and Sports (DCMS). Taking Part: England’s Survey of Leisure, Culture and Sport: Technical Report (2007–08). London: Arts Council England, 2008. www.culture.gov.uk/images/research/TPYr3_TechnicalReport_November2008.pdf.

94 National Endowment for the Arts
DiMaggio, Paul, and Francie Ostrower. Race, Ethnicity, and Arts Participation. NEA Research Division Report #25. Washington, DC: Seven Locks Press, 1987. www.nea.gov/research/reports/NEA-Research-Report-25.pdf.
DiMaggio, Paul, Michael Useem, and Paula Brown. Audience Studies of the Performing Arts and Museums: A Critical Review. Research Division Report #9. Washington, DC: National Endowment for the Arts, 1978.
Dwyer, M. Christine. Communicating Value: Re-faming Arts and Culture Data. Portsmouth, NH: RMC Research Corporation, 2008. www.rmcres.com/documents/Communicating_Value.pdf.
Farrell, Betty. “Changing Culture and Practices Inside Organizations.” In Entering Cultural Communities: Diversity and Change in the Nonprofit Arts, edited by Diane Grams and Betty Farrell, 38–63. New Brunswick, NJ: Rutgers University Press, 2008.
Ivey, Bill. Arts, Inc. How Greed and Neglect Have Destroyed Our Cultural Rights. Berkeley, CA: University of CA Press, 2008.
Jackson, Maria-Rosario, and Joaquin Herranz Jr. Culture Counts in Communities: A Framework for Measurement. Washington, DC: The Urban Institute, 2002.
Jackson, Maria-Rosario, Florence Kabwasa-Green, and Joaquin Herranz. Cultural Vitality in Communities: Interpretation and Indicators. Washington, DC: The Urban Institute, 2006.
Jones, Samuel, ed. Expressive Lives. London: DEMOS, 2009. www.demos.co.uk/files/ExpressiveLives_web_ii.pdf?1246871840.
Kreidler, John. “Leverage Lost: The Nonprofit Arts in the Post-Ford Era.” The Journal of Arts Management, Law and Society 26, no. 2 (1996): 79–100.
Kreidler, John, and Philip J. Trounstine. Creative Community Index: Measuring Progress Toward A Vibrant Silicon Valley. San Jose, CA: Cultural Initiatives Silicon Valley, 2005. www.ci-sv.org/pdf/Index-2005.pdf.
Kushner, Roland J., and Randy Cohen. National Arts Index 2009: An Annual Measure of the Vitality of Arts and Culture in the United States. Washington, DC: Americans for the Arts, 2010.
Leadbeater, Charles, and Paul Miller. The Pro-Am Revolution: How enthusiasts are changing our economy and society. London: DEMOS, 2004. www.demos.co.uk/files/proamrevolutionfinal.pdf?1240939425.
Martin, Vanessa, Catherine Bunting, and Anni Oskala. Arts engagement in England 2008/09 — Findings from the Taking Part survey. London: Arts Council England, 2010.
McCarthy, Kevin F., Arthur Brooks, Julia Lowell, and Laura Zakaras. The Performing Arts in a New Era. Santa Monica, CA: RAND, 2001. www.rand.org/pubs/monograph_reports/2007/MR1367.pdf.
McCarthy, Kevin F., Elizabeth Heneghan Ondaatje, and Jennifer L. Novak., Arts and Culture in the Metropolis: Strategies for Sustainability. Santa Monica, CA: RAND Corporation, 2007. www.rand.org/content/dam/rand/pubs/monographs/2007/RAND_MG477.pdf.
McCarthy, Kevin F., Elizabeth H. Ondaatje, and Laura Zakaras. Guide to the Literature on Participation in the Arts. Santa Monica, CA: RAND, 2001. www.rand.org/pubs/drafts/2006/DRU2308.pdf.
McCarthy, Kevin F., Elizabeth H. Ondaatje, Laura Zakaras, and Arthur Brooks. Gifts of the Muse: Reframing the Debate about the Benefits of the Arts. Santa Monica, CA: RAND, 2004. www.rand.org/pubs/monographs/2005/RAND_MG218.pdf.
Moriarty, Pia. Participatory Arts: The Stranger Brings a Gift. San Francisco, CA: The San Francisco Foundation, 2008. www.sff.org/programs/arts-culture/documents-arts-and-culture/ Moriarty_Participatory_Arts.pdf.
National Endowment for the Arts. (2009a) 2008 Survey of Public Participation in the Arts. National Endowment for the Arts, Research Report #49, Washington, DC: National Endowment for the Arts, 2009.

95Beyond attendance: A multi-modal understanding of arts participation
————. The Arts and Civic Engagement: Involved in Arts, Involved in Life. Washington, DC: National Endowment for the Arts, 2007.
————. (2009) Arts Participation 2008: Highlights from a National Survey. Washington, DC: National Endowment for the Arts, 2009.
————. (2009b) “A Conversation about the 2008 Survey of Public Participation in the Arts.” National Endowment for the Arts video, 160:46. December 10, 2009. www.arts.gov/research/SPPA-webcast.html.
————. A Practical Guide to Arts Participation Research. National Endowment for the Arts, Research Division Report #30. Washington, DC: National Endowment for the Arts, 1995.
————. Public Participation in the Arts 1982 and 1992. National Endowment for the Arts, Research Division Note #50. Washington, DC: National Endowment for the Arts, 1993. www.nea.gov/research/Notes/50.pdf.
Nichols, Bonnie. Art-Goers in Their Communities: Patterns of Civic and Social Engagement. NEA Research Note #98. Washington, DC: National Endowment for the Arts, 2009.
————. Come as You Are: Informal Arts Participation in Urban and Rural Communities. NEA Research Note #100. Washington, DC: National Endowment for the Arts, 2010.
Oskali, Anni, Emily Keaning, Tak Wing Chan, and Catherine Bunting. Encourage children today to build audiences for tomorrow. London: Arts Council of England, 2009. http://users.ox.ac.uk/~sfos0006/papers/children.pdf.
Peters, Monnie, and Joni Maya Cherbo. Americans Personal Participation in the Arts: 1992, A Monograph Describing the Data from the Survey of Public Participation in the Arts. Washington, DC: National Endowment for the Arts, 1996.
Peterson, Richard A., Pamela C. Hull, and Roger M. Kern. Age and Arts Participation: 1982–1997. National Endowment for the Arts, Research Division Report #42. Santa Ana, CA: Seven Locks Press, 2000.
Peterson, Richard A., Darren E. Sherkat, Judith Huggins Balfe, and Rolf Meyersohn. Age and Arts Participation with a Focus on the Baby Boom Cohort. National Endowment for the Arts, Research Division Report #34. Santa Ana, CA: Seven Locks Press, 1996.
Rosenstein, Carole. Diversity and Participation in the Arts: Insights from the Bay Area. Washington, DC: Urban Institute, 2005. www.urban.org/UploadedPDF/311252_diversity_in_arts.pdf.
Tepper, Steven J. “Conclusion: The Next Great Transformation: Leveraging Policy and Research to Advance Cultural Vitality.” In Engaging Art: The Next Great Transformation of America’s Cultural Life, edited by Steven J. Tepper and Bill Ivey, 370. New York, NY: Routledge, 2007.
Tepper, Steven, and Yang Gao. “Engaging Art: What Counts?” In Engaging Art: The Next Great Transformation of America’s Cultural Life, edited by Steven J. Tepper and Bill Ivey, 25–26. New York, NY: Routledge, 2007.
Triplett, Timothy. 2008 SPPA Public-Use Data File User’s Guide: A Technical Research Manual. Washington, DC: Urban Institute, 2009. www.nea.gov/research/SPPA/users-guide.pdf.
Wali, Alaka, Rebecca Severson, and Mario Longoni. The Informal Arts: Finding Cohesion, Capacity and other Cultural Benefits in Unexpected Places. Chicago: Chicago Center for Arts Policy at Columbia College, 2002.
Wolf, Dennie Palmer, and Katy Denson. Thriving Minds Year Two. Nurturing Creative Capital: Successful Children, Strong Families, and Vibrant Neighborhoods. Dallas, TX: Big Thought, 2009. www.bigthought.org/LinkClick.aspx?fileticket=zCDBa8NBkbE=&tabid=267.
WolfBrown. Philadelphia Cultural Engagement Index. San Francisco, CA: WolfBrown, 2009. www.philaculture.org/sites/default/files/CEI%20Full%20Report.pdf.
RECO
MM
ENDE
D SO
URCE
S

National Endowment for the Arts96

97Beyond attendance: A multi-modal understanding of arts participation
TECHNICAL APPENDIX
2008 AGGREGATE MEASURES — ATTENDANCEAny Arts Attendance (2008)
Benchmark arts attendance1. [With the exception of elementary or high school
performances] Did you (or your spouse/partner) go to a live jazz performance during the last 12 months?
2. [With the exception of elementary or high school performances] Did you (or your spouse/partner) go to a live classical music performance such as symphony, chamber, or choral music during the last 12 months?
3. [With the exception of elementary or high school performances] Did you (or your spouse/partner) go to a live opera during the last 12 months?
4. [With the exception of elementary or high school performances] Did you (or your spouse/partner) go to a live musical stage play during the last 12 months?
5. [With the exception of elementary or high school performances] Did you (or your spouse/partner) go to a live performance of a non- musical stage play during the last 12 months?
6. [With the exception of elementary or high school performances] Did you (or your spouse/partner) go to a live ballet performance during the last 12 months?
7. [During the last 12 months] Did you (or your spouse/partner) visit an art museum or gallery?
Non-Benchmark arts attendance 8. [With the exception of elementary or high school
performances] Did you (or your spouse/partner) go to a live Latin, Spanish, or salsa music performance during the last 12 months?
9. [With the exception of elementary or high school performances] Did you (or your spouse/partner) go to a live dance performance other than ballet, such as modern, folk, tap- or Broadway-style during the last 12 months?
10. [During the last 12 months] Did you (or your spouse/partner) visit a crafts fair or a visual arts festival?
11. [During the last 12 months] Did you (or your spouse/partner) visit an outdoor festival that featured performing artists?
12. [During the last 12 months] Did you (or your spouse/partner) visit a historic park or monument, or tour buildings or neighborhoods for their historic or design value?
Attend – Music (2008)
13. [With the exception of elementary or high school performances] Did you (or your spouse/partner) go to a live jazz performance during the last 12 months?
14. [With the exception of elementary or high school performances] Did you (or your spouse/partner) go to a live classical music performance such as symphony, chamber, or choral music during the last 12 months?
15. [With the exception of elementary or high school performances] Did you (or your spouse/partner) go to a live opera during the last 12 months?
16. [With the exception of elementary or high school performances] Did you (or your spouse/partner) go to a live Latin, Spanish, or salsa music performance during the last 12 months?
17. [During the last 12 months] Did you (or your spouse/partner) visit an outdoor festival that featured performing artists?

98 National Endowment for the Arts
Attend – Theater (2008)
18. [With the exception of elementary or high school performances] Did you (or your spouse/partner) go to a live musical stage play during the last 12 months?
19. [With the exception of elementary or high school performances] Did you (or your spouse/partner) go to a live performance of a non- musical stage play during the last 12 months?
Attend – Dance (2008)
20. [With the exception of elementary or high school performances] Did you (or your spouse/partner) go to a live ballet performance during the last 12 months?
21. [With the exception of elementary or high school performances] Did you (or your spouse/partner) go to a live dance performance other than ballet, such as modern, folk, tap, or Broadway-style during the last 12 months?
Attend – Visual Arts (2008)
22. [During the last 12 months] Did you (or your spouse/partner) visit an art museum or gallery?
23. [During the last 12 months] Did you (or your spouse/partner) visit a crafts fair or a visual arts festival?
2008 AGGREGATE MEASURES — ARTS CREATION AND PERFORMANCEAny Arts Creation/Performance (2008)
Creation – Music (2008)1. During the last 12 months, did you (or your
spouse/partner) play a musical instrument?2. During the last 12 months, did you (or your
spouse/partner) sing any music from an opera?3. During the last 12 months, did you (or your
spouse/partner) sing with a chorale, choir, or glee club or other type of vocal group?
Creation – Theater (2008)4. During the last 12 months, did you (or your
spouse/partner) sing or act in a musical play?5. During the last 12 months, did you (or your
spouse/partner) act in a non-musical play?
Creation – Dance(2008) 6. During the last 12 months, did you (or your
spouse/partner) dance ballet, or other dance such as modern, folk, tap, or Broadway-style dance?
Creation – Visual Arts (2008)7. During the last 12 months, did you (or your
spouse/partner) work with pottery, ceramics, jewelry, or do any leatherwork or metalwork?
8. During the last 12 months, did you (or your spouse/partner) do any weaving, crocheting, quilting, needlepoint, or sewing?
9. During the last 12 months, did you (or your spouse/partner) make photographs, movies, or video tapes as an artistic activity?
10. During the last 12 months, did you (or your spouse/partner) do any painting, drawing, sculpture, or printmaking activities?

99Beyond attendance: A multi-modal understanding of arts participation
2008 AGGREGATE MEASURES — ELECTRONIC MEDIA-BASED PARTICIPATIONAny Electronic Media-based Participation (2008)
1. During the last 12 months, did you use the Internet to watch, listen to, or download live or recorded music, theater or dance performances?
2. During the last 12 months, did you use the Internet to view visual art online, such as paintings, sculpture, or photography?
3. During the last 12 months did you watch or listen to any recorded or live broadcasted arts performances on your television, radio, or on your computer, including watching or listening on portable media devices such as an iPod, cell phone, or portable DVD player? Arts performances include:
■ Jazz? ■ Latin, Spanish, or salsa music? ■ Classical music? ■ Opera? ■ Musical stage play? ■ Non-musical stage play (with the exception
of movies, sitcoms, or TV series)? ■ Ballet, modern, folk, tap, or Broadway style
dance performances (with the exception of music videos)?
■ A program about artists, art works, or art museums?
■ A program about books or writers?
Broadcast – Music (2008) 4. During the last 12 months did you watch or
listen to any recorded or live broadcasted arts performances on your television, radio, or on your computer, including watching or listening on portable media devices such as an iPod, cell phone, or portable DVD player? Arts performances include:
■ Jazz? ■ Latin, Spanish, or salsa music? ■ Classical music? ■ Opera?
Broadcast – Theater (2008)5. During the last 12 months did you watch or
listen to any recorded or live broadcasted arts performances on your television, radio, or on your computer, including watching or listening on portable media devices such as an iPod, cell phone, or portable DVD player? Arts performances include:
■ Musical stage play? ■ Non-musical stage play (with the exception of
movies, sitcoms, or TV series)?
Broadcast – Dance(2008) 6. During the last 12 months did you watch or
listen to any recorded or live broadcasted arts performances on your television, radio, or on your computer, including watching or listening on portable media devices such as an iPod, cell phone, or portable DVD player? Arts performances include:
■ Ballet, modern, folk, tap, or Broadway style dance performances (with the exception of music videos)?
Broadcast – Visual Arts (2008)7. During the last 12 months did you watch or
listen to any recorded or live broadcasted arts performances on your television, radio, or on your computer, including watching or listening on portable media devices such as an iPod, cell phone, or portable DVD player? Arts performances include:
■ A program about artists, art works, or art museums?
TECH
NIC
AL A
PPEN
DIX

100 National Endowment for the Arts
TREND AGGREGATE MEASURES — ATTENDANCEAll Comparable Attendance Activities
Benchmark arts attendance1. [With the exception of elementary or high school
performances] Did you (or your spouse/partner) go to a live jazz performance during the last 12 months?
2. [With the exception of elementary or high school performances] Did you (or your spouse/partner) go to a live classical music performance such as symphony, chamber, or choral music during the last 12 months?
3. [With the exception of elementary or high school performances] Did you (or your spouse/partner) go to a live opera during the last 12 months?
4. [With the exception of elementary or high school performances] Did you (or your spouse/partner) go to a live musical stage play during the last 12 months?
5. [With the exception of elementary or high school performances] Did you (or your spouse/partner) go to a live performance of a non- musical stage play during the last 12 months?
6. [With the exception of elementary or high school performances] Did you (or your spouse/partner) go to a live ballet performance during the last 12 months?
7. [During the last 12 months] Did you (or your spouse/partner) visit an art museum or gallery?
Non-Benchmark arts attendance 8. [During the last 12 months] Did you (or your
spouse/partner) visit a crafts fair or a visual arts festival?*
9. [During the last 12 months] Did you (or your spouse/partner) visit a historic park or monument, or tour buildings or neighborhoods for their historic or design value?
* In 2008, however, the question on visits to “an art or craft fair or festival” was replaced by the following two questions: [During the last 12 months] Did you visit a crafts fair or a visual arts festival? [During the last 12 months] Did you visit an outdoor festival that featured performing artists?
Attend – Music
10. [With the exception of elementary or high school performances] Did you (or your spouse/partner) go to a live jazz performance during the last 12 months?
11. [With the exception of elementary or high school performances] Did you (or your spouse/partner) go to a live classical music performance such as symphony, chamber, or choral music during the last 12 months?
12. [With the exception of elementary or high school performances] Did you (or your spouse/partner) go to a live opera during the last 12 months?
Attend – Theater
13. [With the exception of elementary or high school performances] Did you (or your spouse/partner) go to a live musical stage play during the last 12 months?
14. [With the exception of elementary or high school performances] Did you (or your spouse/partner) go to a live performance of a non- musical stage play during the last 12 months?
Attend – Dance
15. [With the exception of elementary or high school performances] Did you (or your spouse/partner) go to a live ballet performance during the last 12 months?
16. [With the exception of elementary or high school performances] Did you (or your spouse/partner) go to a live dance performance other than ballet, such as modern, folk, tap, or Broadway-style during the last 12 months?
Attend – Visual Arts
17. [During the last 12 months] Did you (or your spouse/partner) visit an art museum or gallery?
18. [During the last 12 months] Did you (or your spouse/partner) visit a crafts fair or a visual arts festival?

101Beyond attendance: A multi-modal understanding of arts participation
TREND AGGREGATE MEASURES — ARTS CREATION AND PERFORMANCE Variable Names
All Comparable Creation and Performance Activities 1992 2002 2008
Create/Perform – Music 1. During the last 12 months, did you perform or rehearse any jazz music? V226 PESC9A PEC16B2. During the last 12 months, did you play any classical music? V228 PESC10A PEC16C3. During the last 12 months, did you sing any music from an opera? V230 PESC11A PEC17A
Create/Perform – Theater 4. During the last 12 months, did you sing music from a musical play or
operetta?/During the last 12 months, did (name/you) sing or act in a musical play? (2008)* V232 PESC12A PEC18A
Create/Perform – Dance** 5. During the last 12 months, did you dance any ballet? V236 PESC14A PEC21A6. During the last 12 months, did you do any dancing other than ballet such
as modern, folk, or tap? V238 PESC15A
Create – Visual Arts 7. During the last 12 months, did you work with pottery, ceramics, jewelry,
or do any leatherwork or metalwork? V212 PESC2A PEC10A8. During the last 12 months, did you do any weaving, crocheting, quilting,
needlepoint, or sewing? V214 PESC3A PEC11A9. During the last 12 months, did you make photographs, movies, or video
tapes as an artistic activity? V216 PESC4A PEC12A10. During the last 12 months, did you do any painting, drawing, sculpture,
or printmaking activities? V218 PESC5A PEC13A
Create – Creative Writing 11. With the exception of work or school, did you do any creative writing
such as stories, poems, or plays during the last 12 months? V220 PESC6A PEC14A12. Do you own any original pieces of art, such as paintings, drawings,
sculpture, prints, or lithographs? V224 PESC8A PEC15A
* 2008 wording is slightly different than earlier years, but the question was determined to be comparable by the NEA.
** The dance variables were collapsed in 1992 and 2002 in order to be comparable with the revised 2008 question.
TECH
NIC
AL A
PPEN
DIX

102 National Endowment for the Arts
DEMOGRAPHICS AND ATTENDANCE AT BENCHMARK ARTS EVENTS
Number of obs 16532
F( 29, 16502) 123.07
Prob > F 0
R-squared 0.199
Root MSE 0.429
Coef. Robust Standard Error t P>|t| [95% Conf. Interval]
Gender
Female 0.056 0.008 6.95 0 0.040 0.072
Race/ethnicity
African American, Non-Hispanic -0.087 0.013 -6.61 0 -0.113 -0.061
Hispanic -0.037 0.015 -2.43 0.015 -0.066 -0.007
American Indian, Non-Hispanic -0.059 0.042 -1.39 0.163 -0.141 0.024
Asian, Non-Hispanic -0.091 0.026 -3.55 0 -0.141 -0.041
2 or more races, Non-Hispanic -0.002 0.036 -0.06 0.954 -0.073 0.069
Age
25–34 -0.019 0.018 -1.01 0.314 -0.055 0.018
35–44 -0.018 0.019 -0.96 0.336 -0.055 0.019
45–54 -0.020 0.019 -1.08 0.28 -0.057 0.016
55–64 -0.021 0.019 -1.09 0.275 -0.059 0.017
65–74 0.024 0.021 1.15 0.249 -0.017 0.066
75+ -0.046 0.022 -2.11 0.035 -0.088 -0.003
Education
Some high school 0.032 0.017 1.9 0.058 -0.001 0.064
High school graduate 0.048 0.014 3.35 0.001 0.020 0.077
Some college 0.204 0.016 12.69 0 0.172 0.235
College graduate 0.373 0.018 20.81 0 0.338 0.408
Graduate school 0.454 0.020 22.33 0 0.414 0.493
Family income
$10,000–19,999 0.007 0.017 0.41 0.682 -0.027 0.041
$20,000–29,999 0.022 0.017 1.27 0.203 -0.012 0.055
$30,000–39,999 0.078 0.018 4.34 0 0.043 0.113
$40,000–49,999 0.091 0.020 4.63 0 0.052 0.129
$50,000–74,999 0.114 0.018 6.47 0 0.079 0.148
$75,000–99,999 0.178 0.020 9.01 0 0.139 0.217
$100,000–149,999 0.220 0.022 10.14 0 0.178 0.263
$150,000+ 0.304 0.023 13.01 0 0.258 0.349
Marital status
Was married 0.020 0.010 1.94 0.053 -0.000 0.041
Never married 0.055 0.012 4.51 0 0.031 0.079
Citizenship status
Naturalized -0.042 0.019 -2.2 0.028 -0.080 -0.005
Non-citizen -0.040 0.017 -2.36 0.018 -0.074 -0.007
Constant 0.050 0.026 1.91 0.056 -0.001 0.102


National Endowment for the Arts 1100 Pennsylvania Ave, NW
Washington, DC 20506-0001 (202) 682-5400 www.arts.gov
Not for sale. Available for free at www.arts.gov