bgia-report 2/2005e - dguv.de · investigación, que se dedica a estudiar las relaciones entre...
TRANSCRIPT

Berufsgenossenschaftliches Institut für Arbeitsschutz − BGIA
BGIA-Report 2/2005e
Quality based critical review of the epidemiological literature on carpal tunnel syndrome and occupation
HVBG Hauptverband der gewerblichen Berufsgenossenschaften

Authors: Sandra I. Sulsky, MPH, Ph. D,
Martha A. Mastroberti, M.S. and
Michael D. Schmidt, M.S.
Environ International Corporation, Health Science Institute
www.environhsi.com
Editorial coordinators: Annette Nold, Frank Bochmann
Editor: Hauptverband der gewerblichen Berufsgenossenschaften (HVBG)
Berufsgenossenschaftliches Institut für Arbeitsschutz − BGIA
Alte Heerstr. 111, D-53754 Sankt Augustin
Telefon: +49 / 02241 / 231 − 01
Telefax: +49 / 02241 / 231 − 1333
Internet: www.hvbg.de
− July 2005 −
ISBN: 3-88383-681-8 3-88383-690-7
ISSN: 1860-3491

Quality based critical review of the epidemiological
literature on carpal tunnel syndrome and occupation
Abstract
Carpal tunnel syndrome (CTS) is a disorder of the hand wrist caused by mechanical
entrapment or inflammation of the median nerve. Accepted risk factors include age,
gender, hormonal changes, and metabolic diseases. The association between CTS
and physical activities, including work exposures, is less clear. 334 articles published
between 1997 and 2003 were reviewed. This report summarizes results from 34
occupational epidemiological studies that met specific quality criteria. A small number
of studies defined repetitive work and CTS in a consistent enough manner to conclude
that the evidence supports a modest positive association between repetitive work activi-
ties and risk of CTS. Three studies reported an effect of forceful work activities on
CTS risk. However, since exposure and outcome definitions were not comparable, no
firm conclusions regarding this relationship may be drawn. There is insufficient epide-
miological evidence to either support or refute an association between other work
activities and CTS. Overall, the quality of research regarding the association between
occupation and CTS has improved since 1997. However, the lack of a “gold stan-
dard” medical diagnostic technique represents a major hurdle yet to be overcome.
Any future investigation or literature review must address the fact that the prevalence,
incidence and risk factors for CTS depend strongly on the case definition used.

Qualitätsbasierter kritischer Review der epidemiologischen
Literatur: Karpaltunnelsyndrom und Beruf
Kurzfassung
Das Karpaltunnelsyndrom (KTS) ist eine Erkrankung im Handgelenk, die durch eine
Kompression oder Entzündung des Nervus medianus (Mittelhandnerv) entsteht. Zu den
gesicherten Risikofaktoren zählen Alter, Geschlecht, hormonelle Veränderungen und
Stoffwechselerkrankungen. Der Zusammenhang zwischen KTS und körperlichen Aktivi-
täten, einschließlich Belastungen am Arbeitsplatz, ist hingegen weniger klar. Die vor-
liegende Studie soll zur Klärung beitragen. Es wurden 334 Aufsätze aus den Publika-
tionsjahren 1997 bis 2003 ausgewertet. In diesem Report werden die Ergebnisse und
Zusammenfassungen aus 34 arbeitsepidemiologischen Studien, die spezifische Quali-
tätskriterien erfüllten, dargestellt. Bei einer geringen Anzahl von Studien wurden repeti-
tive Arbeiten und KTS einheitlich definiert. Die Ergebnisse weisen auf einen schwachen
Zusammenhang zwischen repetitiven Tätigkeiten und einem KTS-Risiko hin. Bei drei
Studien wurde das Arbeiten mit Kraftaufwand als Einflussfaktor auf das KTS-Risiko
genannt. Da die Definitionen von Belastung und Wirkung nicht vergleichbar waren,
können keine gesicherten Evidenzen für diesen Zusammenhang abgeleitet werden.
Es liegen keine abgesicherten Evidenzen aus der Epidemiologie vor, um auf einen Zu-
sammenhang zwischen weiteren Arbeitstätigkeiten und KTS zu schließen. Insgesamt
hat sich die Qualität der Forschung, die sich mit dem Zusammenhang zwischen beruf-
licher Tätigkeit und KTS beschäftigt, seit 1997 verbessert. Es gibt jedoch immer noch
keinen „gold standard“ für die medizinische Diagnostik. Dieses Problem sollte noch
gelöst werden. Zukünftige Untersuchungen bzw. Literaturauswertungen sollten berück-
sichtigen, dass die Prävalenz bzw. die Inzidenz und die Risikofaktoren für KTS in
starkem Maße von der verwendeten Falldefinition abhängen.

Compte rendu critique de la littérature épidémiologique
sélectionnée selon des critères de qualité : syndrome du
canal carpien et profession
Résumé
Le syndrome du canal carpien (SCC) est causé par une compression, une infection ou
une inflammation du nerf médian dans le poignet. Les facteurs de risque avérés sont,
entre autres, l’âge, le sexe, les modifications hormonales et les troubles du métabo-
lisme. En revanche, le lien entre SCC et activités corporelles, y compris sur le lieu de
travail, n'a pas encore été établi. 334 études publiées entre 1997 et 2003 ont été
exploitées. Dans ce compte rendu sont présentés les résultats et les résumés de
34 études épidémiologiques qui satisfaisaient à des critères de qualité spécifiques.
Dans un petit nombre d’études, travaux répétitifs et SCC étaient définis de la même
manière. Les résultats accréditent l’hypothèse d’un faible lien entre activités répétitives
et risque de SCC. Dans trois études, le travail avec efforts physiques était cité comme
facteur d’influence sur le risque de SCC. Cependant, comme les définitions des termes
charge physique et effet n’étaient pas comparables, il n'est pas possible de tirer des
conclusions indubitables sur cette relation. Du point de vue épidémiologique, il
n’existe pas de conclusions incontestables permettant d’établir un lien entre d'autres
activités professionnelles et le SCC. La qualité des études, qui ont trait à la relation
entre activité professionnelle et SCC, s’est globalement améliorée depuis 1997.
Cependant, il n’existe toujours pas de règle universelle pour le diagnostic médical.
Ce problème reste à résoudre. À l’avenir, les études et les comptes rendus d’ouvrages
devraient tenir compte du fait que la prévalence ou l’incidence et les facteurs de risque
pour le SCC dépendent, dans une large mesure, de la définition de cas utilisée.

Reseña crítica, basada en la calidad, de la literatura
epidemiológica: Síndrome del Túnel Carpiano y profesión
Resumen
El Síndrome del Túnel Carpiano (STC) es una lesión de la muñeca, originada por
compresión o inflamación del nervus medianus (nervio mediano). Factores de riesgo
comprobados son la edad, el sexo, las alteraciones hormonales y los trastornos
metabólicos. En cambio, la relación entre STC y actividades físicas, incluyendo cargas
de origen laboral, aún no está comprobada. La reseña abarca 334 ensayos publi-
cados entre 1997 y 2003. El Report presenta los resultados y resúmenes de 34
estudios epidemiológicos, que cumplen criterios específicos de calidad. Un número
reducido de estudios define trabajos repetitivos y STC de manera uniforme. Los
resultados indican una débil relación entre actividades repetitivas y un riesgo de STC.
Tres estudios indican esfuerzos laborales como factor que influye en el riesgo de STC.
Pero, debido a que las definiciones de carga y efecto no son comparables, no se
pueden derivar evidencias aseguradas para dicha relación. No existen evidencias
aseguradas desde la epidemiología, que permitan deducir una relación entre
ulteriores actividades laborales y el STC. Pero, se puede constatar que la calidad de la
investigación, que se dedica a estudiar las relaciones entre actividades laborales y el
STC, mejoró desde hace 1997. Sin embargo, todavía no existe un „gold standard“
para el diagnóstico médico. Queda pendiente encontrarle solución a esta problemá-
tica. Futuras investigaciones o bien evaluaciones de la literatura deberán tener en
cuenta, que la prevalencia o bien la incidencia y los factores de riesgo para el STC
dependen, en gran medida, de la definición aplicada.

Acknowledgements
The authors gratefully acknowledge Mr. Thomas Birk for his technical assistance and
his careful review of the draft report. Ms. Anne Fortier and Ms. Mona Pion assisted
with cataloguing and managing references.


Contents
1 Introduction .......................................................................................11 1.1 Background............................................................................................11
1.1.1 Occurrence of CTS..................................................................................13
1.1.2 Occupational exposures correlated with CTS ............................................14
2 Methods.............................................................................................17
3 Results ...............................................................................................21 3.1 CTS identified by combination definitions: eight adequate studies..............22
3.2 CTS identified by combination definitions: nine limited studies...................32
3.3 CTS identified by symptoms: three adequate studies .................................38
3.4 CTS identified by symptoms: three limited studies .....................................39
3.5 CTS identified by nerve conduction test results: one adequate study ...........41
3.6 CTS identified by nerve conduction test results: two limited studies .............41
3.7 CTS identified by clinical exam findings: two adequate studies...................43
3.8 CTS identified by Worker’s Compensation claims: two limited studies ........45
3.9 CTS identified by prior CT release surgery or physician diagnosis: one adequate study ................................................................................47
3.10 CTS identified by prior CT release surgery or physician diagnosis: one limited study ....................................................................................48
4 Discussion..........................................................................................51
5 Summary ...........................................................................................55
6 Bibliography ......................................................................................57
7 Annex: Tables ....................................................................................63


1 Introduction
1 Introduction
The number of cases of carpal tunnel syndrome (CTS) has increased rapidly since the
early 1980s in industrialized countries around the world. These increases occurred
coincidentally with several factors; including increased use of personal computers in
the home and at work, increased mechanization of industrial work settings, and the
designation of CTS as a work-related condition by some governments [1 to 3].
The designation of CTS as “work-related” stems from its frequent association with cer-
tain work activities, and the observation of increased prevalence within certain occupa-
tions and industries. Due to its apparent association with certain physical activities,
CTS is usually considered a type of “cumulative trauma disorder” (CTD) or “repetitive
strain injury” (RSI) [1; 3]. However, the general concept of RSI has been challenged
at times, based on the theory that repetitive use of a body part should lead only to
conditioning, as is seen with exercise [1; 3].
Even if the existence of RSI is accepted, there is some controversy over whether or not
CTS should be included under its rubric, since the connection between symptoms and
physical activities is uncertain [3; 4]. A large body of scientific literature has accumu-
lated addressing the question of the work-relatedness of CTS, and a number of
detailed reviews have been published. The current review summarizes results from
studies published between 1997 and 2003 that met specific quality criteria. These
results are summarized and used to evaluate current evidence for and against an
association between occupational activities and CTS.
1.1 Background
Carpal tunnel syndrome (CTS) is a disorder caused by mechanical entrapment or
inflammation of the median nerve [3; 5]. In addition to physical activities and work
exposures, a number of systemic conditions have been associated with occurrence of
CTS. These include the presence of underlying connective tissue disease, such as
rheumatoid arthritis, acromegaly, pregnancy, use of estrogenic hormones, thyroid
BGIA-Report 2/2005e 11

1 Introduction
disease, and obesity. The prevalence of CTS is thought to peak around age 45 years,
and to be as much as three times higher among women compared to men [1; 3].
Diagnosis of CTS is difficult, since no clear “gold standard” technique exists. Symp-
toms are widely used as diagnostic criteria in clinical practice and in epidemiological
surveillance. Symptoms used in case finding include numbness and pain along the
median nerve, weakness of the thenar muscle, and pain in the hand, wrist or forearm
that is especially problematic at night [1; 3]. Nerve conduction (NC) tests may be the
most objective available diagnostic tool for CTS, but their results do not correspond
well with perceived symptoms. In addition, NC tests tend to find a higher prevalence
of cases than symptom-based definitions. This contrasts with screening for other health
conditions, in which symptom-based definitions are generally more inclusive than
objective tests [6].
All currently used diagnostic methods are subject to error [3; 7]. Clinical diagnostic
tools such as Phalen’s test and Tinel’s sign depend on the subjective judgement of the
practitioner. Symptom lists depend on the ability of the patient to be an accurate
reporter. NC is reduced in the absence of pathology if the temperature in the testing
room is low enough to cause vasoconstriction [3]. The validity of NC test results is also
compromised by the anthropometry of the subject, including hand size, wrist architec-
ture, and body composition (cited in [8]). In addition, investigators may choose from a
variety of NC tests, including various measurements on either the sensory or the motor
nerve. Each requires the definition of a different standard against which to judge the
individual findings; and there may be different associations between disease status,
exposure, and each type of NC test.
Given the difficulties in diagnosing CTS, it is not surprising that Homan et al. [8]
found little overlap among the results of six different case-finding techniques. In their
research, diagnostic agreement ranged from Kappa = 0.00 for the combination of
current symptoms, nocturnal symptoms, and positive physical exam findings compared
BGIA-Report 2/2005e 12

1 Introduction
to NC test results to Kappa = 0.13 for patient-reported symptoms using a hand
diagram compared to NC test results.1
It is also unsurprising that the predictive value of any particular surveillance definition
of CTS is uncertain. In cross-sectional and case-control studies, a substantial propor-
tion of participants with NC delays were found to be symptom-free, while a nearly
equal proportion with physical symptoms suggestive of CTS demonstrated normal
nerve conductivity [6; 9 to 13]. Werner et al. [14] reported results from a prospective
study demonstrating that asymptomatic, active employees with abnormal median NC
were no more likely to develop CTS symptoms after 17 months than those with normal
NC test results. In contrast, other investigators have observed that specific symptoms
predict abnormal NC and recommend their use in epidemiological surveillance [5].
Homan et al. [8] recommended that, among the poor choices, the combination of
NC testing and symptom reports offered the best option for case finding. This is com-
patible with an expert consensus panel recommendation to use the combination of
abnormal NC and symptoms for epidemiological classification of CTS [7]. Similarly,
the U.S. National Institute for Occupational Safety and Health (NIOSH) recommended
a surveillance definition of CTS consisting of abnormal NC and either symptoms or
clinical findings consistent with median nerve entrapment [1].
1.1.1 Occurrence of CTS
General population prevalence estimates of CTS have ranged from three per 1,000 in
U.S. men to 68 per 1,000 among women in the Netherlands. The highest estimate
was obtained by identifying cases through a combination of symptom reports and NC
tests; the lowest prevalence was based on prior physician diagnosis of CTS [6].
The estimated prevalence of CTS in occupational cohorts similarly depends on the
case finding technique. Based on reported work absences, five to ten cases per
1 The Kappa statistic is a measure of correlation between categorical variables that is corrected for agreement by chance.
BGIA-Report 2/2005e 13

1 Introduction
10,000 employed persons per year miss work due to CTS in the U.S. [5]. Using NC
alone, Nathan et al. (reported in [6]) found CTS in 39 % of participants, and 20 % had
both NC slowing and clinical symptoms consistent with CTS. At the other end of the
spectrum, a questionnaire-based study yielded an estimated prevalence of 0.6 %, and
the 1988 National Health Interview Survey found 0.5 % of employed adults in the U.S.
to have CTS based on physician diagnosis and physical examination results [6].
The incidence of work-related RSI generally, and CTS in particular, increased dramati-
cally in the U.S. after a NIOSH consensus panel released its report defining these con-
ditions as related to occupation. In 1981 there were 23,000 cases of RSI reported by
the U.S. Bureau of Labor Statistics, accounting for 18 % of all occupational illnesses
that year. In 1991, the figure rose to 224,000 cases of RSI, or 61 % of all occupa-
tional illnesses. As reported in [6], increases in insurance claims for occupational CTS
in specific U.S. states showed a similar trend. Between 1983 and 1988, workers' com-
pensation claims for CTS in Wisconsin rose 462 % (from 432 to 2,429); in California,
reports to the state occupational surveillance system rose 743 % over the same inter-
val; and in Connecticut, the number of claims for all RSI increased ten-fold between
1979 and 1983. Similar patterns of increases were noted in Australia, Canada,
Norway, Sweden, and Japan after RSI was defined as work-related in those countries
[1 to 3]. At least some of the increased incidence might be due to increased awareness
of CTS among the general public and physicians following the classification of RSI as
work-related [2].
1.1.2 Occupational exposures correlated with CTS
Occupational exposures that have been associated with CTS in epidemiological
studies include use of vibrating tools, work in cold temperatures, repetitive high-force
motions, and prolonged activity in postures requiring wrist flexion [1; 3; 5]. The best
studies take particular care with the assessment of occupational exposure. Frequently
this is in the form of time and motion studies which provide individual assessments of
the force, posture, frequency, etc. for each person and job task. Such time-motion
BGIA-Report 2/2005e 14

1 Introduction
studies are extremely costly and time consuming, but are the least likely to result in
misclassification of exposure.
Various industries and jobs have been identified as conferring high risk of CTS on
employees. These include meat processing, assembly work, machine operation,
and computer keyboard work [15]. “Industry” and “job” are thus used as surrogate
measures of exposure to various presumed high-risk occupational activities. Basing
exposure assessment on industry or job title can lead to misclassification to the extent
that there is variability in jobs and tasks required within industry and within job title.
Inter-individual variability in performance of work tasks must also be considered when
assessing exposure based on task.
The state of knowledge in 1997 with respect to occupational exposures and CTS was
summarized in the NIOSH report “Musculoskeletal disorders and workplace factors”
[5]. Of the 30 studies reviewed, only six achieved the minimum quality standard set
forth by the NIOSH review panel, and all six employed the cross-sectional study
design. The panel’s quality assessment was based on four characteristics of study
design or conduct: participation rate of at least 70 %, use of objective criteria for case
ascertainment, investigators blinded to health or exposure status during data collec-
tion, and adequate assessment of exposures to the wrist.
The panel found strong evidence in favour of a positive association between risk of
CTS and work that is both repetitive and forceful, with adjusted odds ratios (OR) in
four studies ranging from about two to about 16. The highest OR resulted from the
largest study with the most detailed exposure assessment. CTS cases were defined
based on the combination of physical exam findings and symptom reports. The panel
found adequate evidence for an independent effect of repetitive work, based on five
studies with adjusted ORs ranging from 1.5 to 6.7. The highest estimate for this
exposure was reported in the smallest study, in which force and repetition were not
evaluated separately. Cases were defined using a combination of symptom reports
and NC tests.
BGIA-Report 2/2005e 15

1 Introduction
The NIOSH panel also reported some evidence for a positive association between
vibration and risk of CTS. However, this conclusion was based on information in only
two studies meeting minimal quality criteria, combined with information from two
case reports. Of the two studies, one did not separate the effects of vibration from
other occupational exposures. The second study of vibration reported an adjusted OR
of 10.9 for employees using vibrating tools at work, compared to their unexposed
counterparts; however, a variety of CTS case definitions based on NC tests in several
different nerves was used.
The current report examines evidence for occupational risk factors for CTS based on
studies published between 1997 and 2003. It is organized by case definition, since
different definitions serve different purposes, including clinical case finding, surveil-
lance, and screening. Each definition also has different implications. For example,
symptoms may be of the most importance to affected individuals, and are likely to
have more impact on work life than would impaired nerve conduction in the absence
of symptoms. Finally, each CTS case definition is likely to identify a different number
of cases in the same population.
BGIA-Report 2/2005e 16

2 Methods
2 Methods
A total of 665 unique papers were identified and provided by the Berufsgenossen-
schaftliches Institut für Arbeitsschutz − BGIA (Sankt Augustin, Germany) or Applied
Epidemiology, Inc. (AEI, Amherst, MA, USA). Two hundred and fifty were screened and
excluded due to lack of peer review or failure to meet the additional inclusion criteria
provided by BGIA or identified by AEI,
epidemiological study of occupation and carpal tunnel syndrome,
published between 1997 and 2003,
English or German language.
Eighty-one papers contained information on non-occupational risk factors for CTS,
population incidence or prevalence estimates, or described methodological issues in
diagnosis/case ascertainment or exposure assessment. Of these, 54 were read care-
fully and 27 were only screened for classification purposes. A total of 34 of the 334
papers described occupational exposures and their relationship with CTS. All 34 were
reviewed by at least two epidemiologists. Data extracted from each occupational study
are
author(s)
year of publication
journal
publication language
purpose of study
location of study population
first date of follow-up (if cohort)
last date of follow-up (if cohort)
industry sector(s)
study design (cohort, case-control, cross-sectional)
minimum duration of employment
BGIA-Report 2/2005e 17

2 Methods
type of analysis/statistical methods
case ascertainment method (nerve conduction test, Phalen’s, Tinel’s,
symptom reporting, etc.)
exposure assessment methods
exposure definition
exposure metrics
- likelihood of exposure
- exposure intensity ranking
- duration of exposure
- timing of exposure
results reported by
- gender
- levels of exposure/tasks
- latency
- different comparison groups
selection bias potential
information bias potential
- investigator blinded?
confounding bias potential
confounding factors controlled
comprehensiveness of follow-up (per cent missing or unknown)
types of comparisons used (control groups, reference populations, etc.)
participation rates (cases and controls).
Specific quality criteria used to identify the methodologically strongest and most
relevant occupational studies are shown in Table 1 (see page 64). The study charac-
teristics we considered in the quality rating were:
BGIA-Report 2/2005e 18

2 Methods
clarity and relevance of the stated study objectives,
clarity of description of study methods,
their appropriateness with respect to the objectives, and
their ability to minimize selection and information bias.
The outcome definition was evaluated for its specificity and the investigators’ ability to
measure it accurately and directly. Exposure assessments were considered to be of
highest quality if they occurred during etiologically relevant time periods and were
measured at the individual versus the group level, since individual level measurements
are less likely than group level assessments to introduce misclassification of exposure.
Studies that assessed potential confounding by known risk factors for CTS, and appro-
priately controlled for identified confounding, were considered to be of better quality
than studies that did not consider the potential for confounding. Quality ratings were
improved when the authors considered alternative explanations for their findings and
assessed the potential for and likely magnitude of uncontrolled biases.
The final quality ratings were based primarily on study design and analysis methods.
Papers rated “Adequate” were free of major bias; residual confounding was unlikely to
have substantially influenced the results; there was reasonably complete ascertainment
of cases and adequate exposure assessment. “Limited” studies were free of major
bias, but residual confounding might have influenced the results; there was reasonably
complete ascertainment of cases and reasonable exposure assessment methods were
used. “Inadequate” studies were judged likely to be substantially influenced by major
bias, or residual confounding was likely to have influenced the results, or the study
outcome was not specifically CTS.
BGIA-Report 2/2005e 19


3 Results
3 Results
The two epidemiologist reviewers agreed on the quality rating of 24 of the 34 occu-
pational papers. Ten required adjudication by a third reviewer, and three of these
disputed papers required discussion to reach consensus.
Table 2 (see page 65) describes the basic characteristics of all 34 occupational papers
reviewed. Details of study design, exposure assessment, and covariate data collected
for all studies are shown in Tables 3, 4 and 5 (see page 68, 72 and 77), respectively.
The information in these Tables is meant to support the overall quality ratings for each
occupational paper, which were as follows (Table 6, see page 80):
inadequate quality: 7,
limited quality: 16, and
adequate for inclusion in the synthesis of evidence regarding the potential associa-
tion between occupation and CTS: 11.
The following section provides a qualitative description of the 11 occupational studies
that were rated adequate to include in the synthesis, as well as the 16 studies that
were of limited quality. The latter were included because they provide information that
can be used to add or subtract from the weight of evidence offered by the 11 better
studies; but their problems with study design, analysis, and bias outweigh the useful-
ness of their specific effect estimates. Therefore, only the 11 adequate studies appear
in the synthesis.
Most of the investigators reporting on the relation between occupational exposures
and CTS used more than one diagnostic method to identify cases in their studies.
Because no reliable screening test exists for detecting early cases or predicting future
cases of CTS, and because the number of cases identified depends so strongly on the
diagnostic method employed, we have organized the following qualitative descriptions
by case definition, rather than according to exposure. Within each section, the
BGIA-Report 2/2005e 21

3 Results
adequate papers are discussed first, in chronological order. The limited papers are
then presented chronologically.
3.1 CTS identified by combination definitions: eight adequate studies
Studies in this section identified CTS using at least two of the following:
self-reported symptoms consistent with median nerve compression,
clinical exam findings possibly including positive Phalen's test or Tinel's sign,
prior physician diagnosis,
prior carpal tunnel release surgery,
nerve conduction test results.
Specific case definitions for each study are shown in Table 3 (see page 68).
Eight adequate studies used combination definitions to identify CTS. Roquelaure et al.
[16] conducted a case-control study in three manufacturing facilities in western France
between 1993 and 1994. Potential cases were employees whose plant medical
records carried any physician note dated 1990 to 1992 that indicated the presence of
symptoms consistent with CTS, positive Phalen's sign or Tinel's test, history of carpal
tunnel release surgery, and/or abnormal NC tests. Individuals with CTS or other mus-
culoskeletal diagnoses recorded prior to 1990 were excluded from the study to avoid
introducing bias due to factors associated with recovery or ability to tolerate disease.
Controls were matched on age (within one year), gender, and worksite, and were
required to be free of CTS and musculoskeletal disorders of the upper extremity from
1984 to 1992. Any individual (potential case or control) with diagnosed malignancy,
rheumatic disease, thyroid dysfunction, or diabetes was excluded from the study.
The main strength of this investigation was its detailed, individual-level exposure as-
sessment. Job task analyses were carried out for each of the 65 cases and 65 controls
who participated, and details of work rotation, tools, materials, and work pace were
also collected. Although the power of the final multivariable logistic regression model
BGIA-Report 2/2005e 22

3 Results
was compromised by the relatively small number of cases, five occupational factors
were statistically significantly positively associated with odds of CTS after controlling for
age, gender, plant, household chores more than 1 hour per day, frequency of specific
hand motions, indicators of wrist, elbow and trunk posture and, for women, parity
greater than 3. Odds ratios (OR) and 95 % confidence intervals (CI) were 9.0 (CI: 2.4,
33.4) for exertion (force > 1 kilogram), 8.8 (CI: 1.8, 44.4) for repetitiveness (elemen-
tary operation 10 seconds or less), 6.0 (CI: 1.8, 20.2) for changes in activity or breaks
less than 15 % daily work time, 6.3 (CI: 2.1, 19.3) for lack of job rotation, and 5.0
(CI: 2.2, 21.2) for manual work station supply.
The authors reported point estimates and confidence intervals only for the occupa-
tional variables that were statistically significant in the final model. When exposure
was re-defined as the total number of occupational risk factors accumulated by each
participant in the study, ORs for CTS increased from 5.6 (CI: 1.6, 24.5) for those with
three risk factors to 93.7 (CI: 13.4, 93.8) for four risk factors and 90 (CI: 8.0, 367) for
those with five or more occupational risk factors compared to participants with one or
two of the occupational risk factors for CTS.
Frost et al. [17] carried out a cross-sectional study within a group of 743 Danish
slaughterhouse employees and 398 chemical plant employees. Individual ergonomic
assessments were conducted for all of the slaughterhouse employees, and 90 % of job
tasks were covered. However, exposure status was reduced in the analysis to three pa-
rameters for comparison with work in the chemical factory: any work in the slaughter-
house, de-boning work, and non-de-boning work. The latter two categories represent
subgroups of the slaughterhouse employees. CTS cases were identified by the combi-
nation of symptom reports and NC test results or history of CT surgery.
The overall prevalence of likely CTS was 5 % among the slaughterhouse employees
and 1 % among the chemical plant employees, in spite of the latter group's slightly
older average age. After controlling for age, history of wrist trauma, body mass index
(BMI), smoking habit, gender, and history of medically diagnosed rheumatoid arthritis,
diabetes, myxedema, or connective tissue disease, the ORs for CTS in either hand was
BGIA-Report 2/2005e 23

3 Results
four times higher (OR = 4.01, CI: 1.72, 9.32) among slaughterhouse versus chemical
plant employees. Slaughterhouse employees engaged in de-boning tasks had ORs for
CTS 5.5 times higher than chemical workers (OR = 5.53, CI: 2.2, 13.9), and those in
jobs other than de-boning had OR = 3.25 (CI: 1.27, 8.33) compared to chemical
plant employees. The reported ORs were similar when CTS in the dominant or non-
dominant hand was analyzed separately.
Three selection biases may have played minor, conflicting roles in the Frost et al. re-
sults: The chemical workers participated at a lower rate than the slaughterhouse work-
ers, and they had both longer duration of service and older average ages. The lower
participation rate suggests an inflation of the OR, since people who suspected health
problems might be more likely to volunteer for health studies, while the older age
and duration of service among the chemical workers suggests possible out-migration
from the slaughterhouse employees experiencing symptoms; such a survivor effect that
would tend to attenuate any effect of occupational exposures on CTS risk.
Latko et al. [18] conducted a cross-sectional study of 352 persons employed in
three manufacturing facilities in North America. Participants completed a symptom
questionnaire and hand diagram, and underwent NC testing. Individual exposure
assessments were completed based on video tapes of participants at work. A total of
109 exposure variables were compiled, including ten anthropometric measures, 25
medical history factors, five demographic characteristics, four tobacco use measures,
and 13 psychosocial factors. Fifty-two physical stressor variables were quantified for
each job, including repetition, force, mechanical stress, posture, temperature, and
vibration. However, repetitiveness was the primary exposure of interest. Latko et al.
evaluated CTS according to several definitions. In this section, we discuss cases identi-
fied by the combination of symptoms and NC test results. Symptoms alone and NC
test results alone are described in the relevant sections, below.
After excluding 16 diagnosed diabetics, the prevalence of CTS was 5.6 % (19 cases),
and the authors noted a trend of increasing prevalence across categories of increasing
job repetitiveness, ranging from 2.7 % of those in low repetition jobs to 7.9 % of
BGIA-Report 2/2005e 24

3 Results
those in high repetition jobs. After controlling for gender, age, and wrist shape
(depth : width ratio at least 0.73 versus less than 0.73), the OR for repetition rating
was 1.22 (CI: 0.98, 1.53).
The strengths of this study include its detailed exposure assessment and reliance on
validated survey instruments. However, since only 19 CTS cases were identified by the
combination of symptoms and NC test results, the multivariable model had limited
statistical power to detect any effects. In addition, participation was limited to persons
who had worked for at least six months. While intended to allow time for disease de-
velopment, this restriction could have introduced a survivor bias if participants most
susceptible to CTS developed symptoms and changed jobs before the six month mini-
mum had elapsed.
A cross-sectional study in an electronics manufacturing facility in Egypt by Abbas et al.
[19] included 198 employees. The 104 people engaged in assembly or quality control
(QC) were considered exposed, while 94 in clerical, administrative or maintenance
jobs were considered unexposed to workplace risk factors for CTS. Cases were identi-
fied by symptom reports, physical exam, and NC tests. The assembly and QC jobs
were assessed individually for demands characterized by weight lifted, work pace,
and predominant grip type. Each workstation was also assessed for its ergonomic
properties.
The prevalence of CTS was 33.7 % in the exposed and 4.3 % in the unexposed group,
yielding an unadjusted OR for CTS of 11.4 (95% CI: 3.6, 40.2). Among the assembly
workers, precision grip was associated with a nearly seven-fold increase in ORs for
CTS (adjusted OR = 6.5, CI: 1.08, 39.23), and the OR for intermediate grip was 1.98
(CI: 0.32, 11.9) compared with power grip. Each additional year of employment
among the assembly workers was associated with an 11 % increase in ORs for CTS
(OR = 1.11, CI: 1.03, 1.20). These estimates were based on only 35 cases and, since
the model also adjusted for age, gender, marital status, job satisfaction, neck posture,
body posture, production rate, and weight of parts used, the statistical power and
stability of the model is questionable. Estimates for these other covariates were not
BGIA-Report 2/2005e 25

3 Results
presented by the authors, presumably due to their lack of statistical significance. In
addition, women comprised over 90 % of the assembly group, so control for gender
in this model is irrelevant and may further compromise the power of the analysis.
Nathan et al. [20] reported on a North American cohort, followed for eleven years, in
which five work factors were evaluated for their association with CTS incidence: force,
repetitiveness, vibration, keyboard use, and heavy lifting. Cases were identified by the
combination of symptoms and positive NC tests. Occupational exposure to the CTS
risk factors listed above was assessed at the 1984 baseline by direct observation and
by questionnaires in 1988 and 1994 to 1995.
About 60 % of the original cohort of 471 people could be traced after 11 years. The
majority of losses occurred in the interval between baseline and the first follow-up and
were attributed to layoffs at one of the four worksites contributing study participants.
Since no follow-up was initially planned, the authors reported inadequate contact
information had been collected at baseline. Two hundred and fifty-six of the 471
original participants were followed at both contact points, and 35 of these (13 %) d
veloped CTS.
e-
After adjustment for gender, age, endocrine conditions, cigarette smoking status, and
BMI, only exposure to vibration was associated with CTS: OR = 3.4 (CI: 1.09, 10.7).
When stratified by gender, the strength of the association between CTS and vibration
was doubled, to 7.3 for men and 8.2 for women. Confidence intervals for these esti-
mates were not provided, but the authors indicated that the p-values were between
0.05 and 0.10. In contrast with the results of the other studies reported in this section,
Nathan et al. found the highest magnitude ORs from their adjusted model were for the
non-work factors of age 50 or older versus less than 30 years (OR = 10.6, CI: 2.7,
42.0) and BMI greater than or equal to 28.2 versus 21.6 or less (OR = 5.4, CI: 1.2,
23.0). Cigarette smoking was also associated with a two-fold increase in ORs for CTS
in this cohort (OR = 2.03, CI: 0.68, 6.03).
BGIA-Report 2/2005e 26

3 Results
The large proportion of the original cohort lost to follow-up raises the concern of
selection bias in the remaining group, as does the younger average age and lower
BMI at baseline (both negatively associated with CTS) among those not followed; how-
ever, these factors should not affect the internal validity of the reported associations
between work factors and CTS incidence, unless age and BMI were also associated
with exposure. In addition, the power of the multivariable model was compromised by
the large number of covariates (11) and the relatively small number of cases (35).
Rosecrance et al. [21] completed a cross-sectional analysis of apprentice construction
workers in several U.S. states. Exposure assessment comprised a descriptive list of
15 job factors, each of which respondents were asked to rate as a contributor to work-
related musculoskeletal symptoms. The ratings ranged from zero (no problem) to ten
(major problem). Ratings of five or above were considered positive contributors in the
analysis; factors rated up to four were not considered to contribute to work-related
musculoskeletal problems. Cases were identified by a combination of self-reported
symptoms and median mononeuropathy assessed by NC testing.
A total of 1,325 apprentices were eligible to participate in the study. Participation rates
were high, but varied by trade group, from 76.5 % of operating engineers to 100 %
of sheet metal workers. After excluding 20 participants for incomplete data or the
presence of comorbidity associated with CTS, the prevalence of CTS in this population
was 8.2 % (91 of 1,115). After adjustment for age and BMI, the OR for each of the
fifteen work factors analyzed ranged from 0.87 for bending/twisting the back (CI:
0.54, 1.41) to 1.7 for working overhead (CI: 1.06, 2.72). The latter was the only work
factor statistically significantly associated with CTS. For each work factor, the analyses
compared the ORs for CTS among participants rating that factor as a moderate-major
problem versus those rating the factor as no problem or a minor problem. As has
been described for several other studies, age and BMI seemed to have higher magni-
tude associations with CTS than did occupational factors. A model containing both
age and BMI yielded OR = 4.9 (CI: 2.4, 10.0) for the highest versus the lowest quar-
tile of BMI and OR = 4.12 (CI: 2.1, 8.1) for the highest versus the lowest quartile of
BGIA-Report 2/2005e 27

3 Results
age. Unfortunately, no estimates for age and BMI were presented for models that also
contained work factors.
This study was conducted within a fairly young population, ranging from 18 to 53
years but with an average age of 27 years. CTS prevalence tends to increase with age.
Therefore, independent of workplace exposures, this represents an otherwise low-risk
group, which might increase the likelihood of identifying work-related factors associ-
ated with CTS. However, the exposure assessment method used in this study represents
its major weakness. The self-ratings and the apparent wording of the questionnaire
items suggests that participants might apply the highest ratings to those work activities
that caused the most symptom aggravation, rather than to those activities bearing an
etiological association with symptoms.
Thomsen et al. [22] completed a short-term (six to 18 months) prospective study of
731 employees at three worksites in Denmark. Cases were defined at the two follow-
up contacts by a sequential process of
reporting symptoms on a mailed questionnaire,
positive findings at a clinical interview, and
NC tests.
Only the “questionnaire cases” were invited to the clinical interview, and only the
cases suspected after the interview underwent NC tests. In this section, we report
results for the two combination case definitions. Findings for the questionnaire cases
are reported below, in the “symptoms only” section. Occupational exposures were
individually assessed at baseline. All jobs at the three participating worksites were
categorized after walk-through assessments into
repetitive,
forceful,
repetitive and forceful, and
varied.
BGIA-Report 2/2005e 28

3 Results
Participants reported hours per week spent in each task observed at their worksite. In
addition, the investigators made individual measurements of handled weights, finger
movements and cycle times, and all participants underwent goniometer measurement
while performing work tasks.
At baseline, there were 35 CTS cases in the working hand and 22 cases in the non-
working hand, based on symptoms plus clinical interview. Of these, eight working
hand and two non-working hand cases were confirmed by NC testing, yielding an
estimated prevalence of 1.4 % and 0.4 %, respectively. The annual incidence of cases
identified by symptoms plus interview was 3.82 % per year in the working hand and
2.29 % in the non-working hand. When the more restrictive case definition was used,
the annual incidence of CTS was 0.27 % for both hands.
Since there were no significant differences between exposure groups in incidence by
symptoms plus clinical interview, and since the incidence of cases identified by addi-
tional NC testing was so low, the authors focused on analyzing prevalent cases for this
report. After controlling for age, gender, BMI and seniority, hours of repetitive work
per week and hours of forceful work per week were associated with CTS. For symp-
toms plus interview cases, the adjusted OR for repetitive work compared to varied
work was 1.27 (CI: 1.01, 1.61) for the working hand and 1.25 (CI: 0.93, 1.68) for
the non-working hand. Similar estimates were obtained for hours of forceful work per
week, OR = 1.12 (CI: 0.86, 1.48) for the working hand, and OR = 1.34 (CI: 1.01,
1.87) for the non-working hand. For cases confirmed by NC, each hour of repetitive
work per week was associated with an 84 % increase in the OR for CTS in the working
hand (OR = 1.84, CI: 1.06, 3.19). The two NC cases in the non-working hand were
not analyzed separately.
As with several other studies discussed in this section, the major strength of Thomsen
et al. [22] is the detailed, individual-level exposure assessment. However, the short
follow-up interval and relatively small study size limits the utility of these data and
allows for only a cross-sectional analysis. Among epidemiological designs, cross-
sectional studies generally offer the least possibility for causal inference, as they are
BGIA-Report 2/2005e 29

3 Results
plagued by uncertain temporal associations as well as the possible action of selection
biases, particularly by factors that might favour the inclusion of less severe cases in
occupational groups. However, to acquire sufficient information to analyze CTS inci-
dence, the authors calculated that 4,000 person years in the exposed and unexposed
groups would be necessary to detect a relative risk of 2.0 with 80 % power and a type
I error rate (alpha level) of 5 %.
Andersen et al. [23] investigated CTS among 6,943 computer users in Denmark
participating in the baseline and one-year follow-up assessment of the Neck and
Upper Extremity Disorders Among Technical Assistants (NU-DATA) study. This group
represents about 60 % of the target population of 9,480 members of a trade union.
At baseline, cases were identified by symptom reports and clinical interviews; after one
year, new cases were identified from among the participants with no or mild symptoms
at baseline. Information on personal characteristics and work exposures, including
hours per week using a keyboard and mouse and in non-computer work tasks,
posture-related variables and work-related psychosocial factors, was collected via
questionnaire.
The baseline prevalence of interview-confirmed CTS was 4.8 % (n = 255). Logistic
regression models describing the association between work factors and prevalent CTS
were adjusted for psychosocial work characteristics (high demands, low control, low
social support, and time pressure) and personal factors (negative affect, type A behav-
iour, age, gender, high or low BMI, poor social network, high physical activity, medical
disorder, and smoking). Among the work factors analyzed, mouse use in categories
above ten hours per week was associated with a statistically significant two- to three-
fold increase in ORs for CTS, and participants reporting dissatisfaction with their work
place design had 70 % increased ORs for CTS (CI: 1.1, 2.6). Point estimates for all
other work factors (arm/wrist support during mouse use, hours per week of keyboard
use, arm/wrist support during keyboard use, abnormal mouse or keyboard positions,
poor adjustment of work chair or desk) were between 0.7 and 1.1.
BGIA-Report 2/2005e 30

3 Results
At follow-up, 198 participants reported new or worsened CTS symptoms, and 41
of these were confirmed by clinical interview. Logistic models for incident CTS were
adjusted for the same personal and psychosocial work factors listed above. As was
seen for prevalent CTS, mouse use in categories of hours per week above ten was
associated with a two- to three-fold increase in odds of incident CTS. Although the
95% CI for all categories were fairly narrow, only those for 20 to 25, 25 to 30 and
more than 30 hours per week (the three highest categories) excluded one. Participants
who reported using arm/wrist supports up to half the time while doing mouse work
had OR = 1.5 (CI: 0.7, 3.3). Point estimates for all other work factors were approxi-
mately 1.0, and no CI excluded 1.0.
Although the types of exposures considered by Andersen et al. [23] were quite different
from those evaluated by Thomsen et al. [22], it is interesting to note that these two
prospective studies reported risk estimates for work factors of similar magnitude, and
that were much lower than the estimates reported from the case-control and cross-
sectional studies. It should also be noted, however, that the exposure assessments
used in the two prospective studies were probably less precise than the individual-level
exposure assessments used in the other studies summarized in this section. Misclassifi-
cation of exposure, if non-differential, tends to result in risk estimates biased towards
the null.
The large number of people included and the prospective design of the NU-DATA
study represent its two main strengths. However, one year of follow-up seems not to be
long enough to detect a sufficient number of new CTS cases to accurately assess risk
factors for incident disease: Only 41 people reported new or worsening CTS after one
year. Since the logistic regression model employed by the authors included 15 covari-
ates and up to eight indicator variables describing work exposure categories, the
analyses certainly suffered from low statistical power. The validity of the results is also
threatened by differential participation in the one-year follow-up for participants with
and without symptoms at baseline: 39 % of participants who were symptom-free at
baseline were lost to follow-up, compared to 26 % lost among those with the most
frequent symptoms at baseline. The differential participation rate suggests selection
BGIA-Report 2/2005e 31

3 Results
bias that might serve to overestimate the true effects at follow-up, due to preferential
inclusion of those with symptoms.
3.2 CTS identified by combination definitions: nine limited studies
There were nine limited studies which used combination definitions to identify CTS.
Werner and colleagues published two studies describing a cohort of about 700
employees at six worksites in the U.S. [14; 24]. Five were manufacturing facilities in
different industries, and the sixth worksite contributed clerical staff. Jobs from three of
the industrial sites were rated by industrial engineers and hygienists as consisting of
high, medium or low levels of repetitive movements. The ratings were applied to all
jobs in all sites, presumably on the basis of job title. For about half of the jobs repre-
sented in the cohort, force and posture measurements were also obtained. In addition,
psychosocial work factors were assessed via self-administered questionnaire at two of
the industrial sites and at the clerical worksite.
Werner et al. [24] describe the baseline cross-sectional analyses conducted to
assess the factors associated with abnormal NC test results and prevalent median
nerve symptoms. All participants underwent NC testing, and 25 % of the population
(n = 184) had results indicating slowing of median NC. Symptoms were assessed by
self-administered questionnaires. The prevalence of symptoms among subgroups of
participants identified by presence or absence of median nerve slowing was nearly
equal: 49.5 % with symptoms, 50.5 % without symptoms.
Job repetition rating was available for all members of the cohort and was statistically
significantly higher among those with symptoms compared to those without symptoms
(average rating of 5.8 versus 4.5 on a 10 point visual analogue scale, p = 0.002).
Several other ergonomic and psychosocial work factors were also statistically signifi-
cantly associated with the presence of symptoms, but these measurements were only
available for half the cohort and the authors presented insufficient information for a
reader to assess the presence of bias (e. g., no information about the distribution of
cases among the subset with data). A logistic regression analysis on the factors that
BGIA-Report 2/2005e 32

3 Results
were available for all participants yielded an OR for repetition rating of 1.2 (CI: 1.05,
1.37). Gender was also a statistically significant predictor of symptoms among those
with abnormal NC tests; OR = 2.9 (CI: 1.5, 5.8) for women versus men.
After 17 months of follow-up, the incidence of hand/wrist symptoms was assessed
among the subset of participants who, at the baseline examination, had positive NC
tests but were free of nerve symptoms [14]. Participants were matched on age, gender,
and worksite. Five of the original six worksites, including the clerical site, were repre-
sented in the follow-up analysis. Cases were identified by self-reported symptoms
using a mailed questionnaire.
Of those participating in the follow-up, 49 had positive NC test results at baseline
(exposed), and 59 had normal NC test results (unexposed). Although the exposed and
unexposed were matched on several characteristics, only the results of unconditional
analyses were reported, and these indicated little or no difference in the rate of devel-
opment of symptoms for the two groups:
12 % of the exposed (n = 6) and 10 % of the unexposed (n = 10). An under-powered
logistic regression model indicated positive associations between the development of
median nerve symptoms and both job repetition rating (OR = 1.35, CI: 1.03, 1.77)
and months of follow-up (OR = 1.19, CI: 1.04, 1.36), and an inverse association
between symptom development and the peak latency of the median sensory nerve in
the right hand (OR = 0.27, CI: 0.05, 1.32). The model also contained terms for BMI
(OR = 1.07, CI: 0.92, 1.24) and median sensory nerve amplitude in the right hand
(OR = 0.94, CI: 0.87, 1.02). The authors did not comment on the expected associa-
tion between the various nerve conduction measures, or on the effect of including both
measures in the same model.
Given the lack of a “gold standard” diagnostic tool for CTS, the basic study design
employed by Werner et al. represents an important innovation and acknowledges
the lack of information available as to the correspondence between abnormal NC
test results and the presence or development of problematic hand/wrist symptoms.
BGIA-Report 2/2005e 33
3 Results
Unfortunately, this study was hampered by the small number of cases and use of in-
appropriate statistical methods. These factors render the results difficult to interpret. In
addition, the loss to follow-up was higher among participants with abnormal NC tests
at baseline (35 % versus 22 %). The authors did not state the method of follow-up
contact; if through the workplace, then a higher proportion of the group with ab-
normal NC tests at baseline might have left their jobs due to the development of
symptoms compared to those who had normal NC tests at baseline. If so, this would
lead to an underestimate of the association between NC tests and development of
median nerve symptoms. The use of unconditional statistical techniques with matched
data would also result in an underestimate of any effect evaluated.
Atroshi et al. [9] completed a community-based cross-sectional study in southern
Sweden. Two-thousand, four-hundred and sixty-six persons responded to a question-
naire eliciting symptom reports and details on occupational activities. Three hundred
and fifty-four respondents (14 %) reported median nerve symptoms; 262 of these
(74 %) participated in a clinical examination and NC testing, as did 125 asymptomatic
respondents.
Among the population as a whole (not just those participating in the clinical exam),
CTS identified by the presence of symptoms and NC test results was statistically signifi-
cantly more common among blue-collar (3.5 %) than white-collar (1.7 %) workers. The
authors reported that the difference in CTS prevalence remained statistically significant
after adjusting for BMI, age, and gender, but did not present any specific estimates.
Other work factors (use of force with the hand more than one hour per day, working
with flexed or extended wrist, repetitive hand or wrist motion, and use of hand-held
vibrating tools) were similarly associated with higher prevalence of CTS. However, the
authors did not report the results of any adjusted analyses of these exposures.
Gorsche et al. [25] conducted a prospective analysis of CTS among 665 employees of
a Canadian meat packing plant. Cases were identified by the combination of self-
reported symptoms and clinical signs (Phalen's or Tinel's tests). Jobs were categorized
according to whether hand-held tools were required; the jobs that did require tools
BGIA-Report 2/2005e 34

3 Results
were described as highly repetitive (cycle time less than 30 seconds or continuous
hand movement for over half of a task cycle).
The prevalence of CTS at baseline was estimated at 37 % of the population (n = 244).
Employees without CTS at baseline were re-examined at two intervals of just under one
year, each; the combined incidence was 11 %. The only occupational characteristic
analyzed by these authors was hand-held tool use. The association between tool use
and prevalent CTS was statistically significantly positive in a model that included
age, BMI, gender, and ethnicity; but the point estimate was not reported. The model
describing risk of incident CTS did not include any occupational factors.
Gorsche et al. offer useful prevalence and incidence estimates for one industry, but
the failure to report work exposure data limits the utility of this study for the current
purpose of identifying occupational risk factors for CTS. In addition, there were some
problems with study execution. The initial response rate among employees of the plant
was relatively low, at 73 %. Only 55 of the original 665 participants had supervisory
or clerical jobs; if this represents the total group of non-tool users, then the authors'
ability to analyze work factors was substantially limited. Unfortunately, the study
groups were not described clearly enough to determine if this was or was not the case.
The prospective study design allowed for an assessment of CTS incidence rates, but
high rates of loss to follow-up at each contact point and low initial participation rates
by clerical personnel both suggest selection bias might have played a role in the
results.
Roquelaure et al. [26] conducted a one-year follow-up study among shoe factory
employees in France. Individual level exposures were assessed via questionnaire and
work station analyses in which eleven separate factors were assessed. Additional
information was collected by questionnaire regarding psychosocial factors, health
history, and leisure time physical activities. Cases were identified by symptoms and
clinical exam findings.
BGIA-Report 2/2005e 35

3 Results
The prevalence of CTS at the baseline examination was 16.6 % (33 of 199). Nineteen
new cases of CTS were identified at the follow-up examination, and performance of
rapid trigger movements with hand tools was found to be statistically significantly
associated with CTS incidence (OR = 3.8, CI: 1.0, 17.2). This was the only objectively
assessed factor associated with the outcome. The model also contained indicators for
BMI above 30 kg/m2 (OR = 4.4, CI: 1.1, 17.1); psychological distress indicated by
scoring above the 90th percentile on the 12-item General Health Questionnaire2
(GHQ-12) (OR = 4.3, CI: 1.0, 18.6); and lack of individual job control (OR = 0.5,
CI: 0.2, 1.3). Categories of age and indicators for female gender and the inability to
take breaks were also included in the model, but the authors reported their associa-
tions were not statistically significant and omitted the point estimates.
While generally quite well-planned and executed, there were two important limitations
to this study: First, there was insufficient variability in ergonomic exposures in the study
population to be able to detect gradients in risk, since all participants were exposed
to at least one of the items included in the work station assessment; and 93 % had
highly repetitive jobs (work cycles less than 30 seconds and/or at least half the cycle
repeating the same motions). Second, too few incident cases accrued after one year to
allow for thorough statistical analysis. In addition, the average duration of employ-
ment was about 20 years, suggesting that the study population might be weighted
towards individuals less susceptible to CTS.
Hamann et al. [10] surveyed 1,079 dentists attending a national meeting in the U.S.
Just under 3 % of the participants were diagnosed with CTS based on median nerve
symptoms and NC tests demonstrating median nerve latencies of 0.5 milliseconds or
longer. Although the authors collected data on a substantial number of potential co-
variates, only bivariate descriptions were presented. For example, participants meeting
the case definition for CTS were, on average, about six years older than those without
CTS (55.2 versus 49.4 years) and had been in practice for about six years longer
2 A measure of current mental health used extensively in different settings and countries.
BGIA-Report 2/2005e 36

3 Results
(27.5 versus 21.4 years). The lack of controlled analyses limits the utility of the results
of this study.
Stevens et al. [11] surveyed 257 computer users employed in a U.S. medical center.
Cases were identified by self-reported symptoms and NC test results. CTS prevalence
rates were compared for computer versus typewriter users. No differences in CTS
prevalence were observed between these two occupational groups, but only the results
of descriptive analyses were reported.
Anton et al. [27] recruited dental hygienists attending an ergonomics conference in the
U.S. to complete a survey and undergo NC testing. The survey elicited demographic
information, ergonomic work factors, work load, symptoms of job-related pain, and
hand symptoms. A hand diagram was also included to evaluate specific median nerve
symptoms. The authors evaluated CTS identified by symptoms alone (discussed below)
and the combination of symptoms and positive NC tests.
The response rate to the questionnaire was 100 % of 109 conference attendees. Due
to time constraints, only 89 of 95 (93 %) female hygienists underwent NC testing.
The prevalence of CTS by the combination of symptoms and NC tests was 8.4 %
(n = 8 cases). No bivariate or multivariate analyses could be carried out with such
a small number of cases.
This study was limited due to the recruitment of subjects during a professional con-
ference about ergonomics. While this assured a good response rate, conference par-
ticipants might have been more likely to be affected by or aware of musculoskeletal
disorders than their non-conference attending peers (selection bias). With 93 % report-
ing at least one work-related musculoskeletal symptom, there was little or no possibil-
ity of detecting an association between symptoms and work factors. The study also
suffered from inadequate statistical power. Not only were too few cases detected by
these authors (n = 8) for any multivariable analyses to be carried out, a post-hoc
power analysis indicated only 51 % probability of rejecting the null hypothesis with the
number of participants included.
BGIA-Report 2/2005e 37

3 Results
Werner et al. [13] described the results of a cross-sectional study of female dental
hygienists attending an annual meeting in the U.S. The prevalence of CTS among
study participants, assessed by symptoms and NC tests, was compared to the preva-
lence among the general population of Sweden as well as the subset of the population
working in white-collar occupations. Nine of 305 participants (2.95 %) were identified
as cases, defined as having median sensory nerve latency of 0.8 milliseconds or
longer in the dominant hand. This was similar to the rate reported for both compari-
son groups (2.7 % and 1.7 %, respectively). The small number of cases among the
participants precluded any detailed analysis.
3.3 CTS identified by symptoms: three adequate studies
Three adequate studies identified CTS by symptoms only. The well-done study by Latko
et al. [18] is described in detail, above. After controlling for age, gender, and wrist
shape (ratio of depth to width), the authors reported that repetitiveness of work was
statistically significantly associated with prevalence of CTS (OR = 1.16, CI: 1.00, 1.34
per unit of repetition; OR = 2.32, CI: 1.07, 4.99 for high versus low repetition). In the
same multivariable model, the participants with a ratio of wrist depth to width 0.73 or
more had OR = 2.59 (CI: 1.35, 4.96) compared to those with ratio less than 0.73.
As summarized above, Thomsen et al. [22] identified CTS cases using symptoms
reported on a mailed questionnaire. There were 70 cases in the working hand and
44 cases in the non-working hand reported at baseline in a cohort of 731 Danes
employed at a bank and two postal centres. After controlling for age, gender, BMI,
and seniority, the odds of CTS were statistically significantly increased by 20 to 30 %
with each ten hour per week increase in repetitive (OR = 1.21, CI:1.01, 1.46) and
forceful work (OR = 1.28, CI: 1.08, 1.52). Due to the small number of incident cases,
the authors were only able to analyze prevalent CTS.
Andersen et al. [23] studied a wide distribution of both mouse and computer use in a
cohort study of computer users (above). A self-administered questionnaire was sent to
9,480 members of a Danish trade union, with responses received from 6,943 (73 %)
BGIA-Report 2/2005e 38

3 Results
at baseline and 5,658 (82 %) at the one-year follow-up. Respondents answered ques-
tions about symptoms, work-related physical and psychosocial factors, and personal
characteristics.
The overall self-reported prevalence of tingling or numbness in the right hand at
baseline was 10.9 %. The proportion with prevalent CTS was reduced to 4.8 % when
clinical confirmation was required. About 1/3 of respondents (1.4 %) experienced
symptoms at night. Tingling or numbness in the right hand was associated with time
spent using a computer mouse, but not time spent using a keyboard. No posture or
psychosocial variables were associated with CTS symptoms, but participants who were
dissatisfied with their physical workplace design had slightly elevated odds of CTS
symptoms compared to those without complaints (OR = 1.6, CI: 1.2, 2.1). Female
gender, smoking, older age, and some medical conditions were also associated with
slightly increased ORs for prevalent CTS symptoms.
After one year of follow-up, mouse use for more than 20 hours per week was associ-
ated with incidence of possible CTS. The OR for 20 to 25 hours per week of mouse
use was 2.6 (CI: 1.2, 5.5), and OR = 3.2 (CI: 1.3, 7.9) for 25 to 30 hours of mouse
use per week. Mouse use for more than 30 hours per week had OR = 2.7 (CI: 1.0,
7.6). In addition, being female, having a medical disorder, and smoking were also
related to the development of possible CTS.
Overall, the study was comprehensive and well-described. There were some problems
with differential rates of loss to follow-up, however: The proportion of those lost was
highest among participants with no symptoms and lowest among those who reported
more frequent symptoms at baseline. The study was also somewhat limited by the
modest number of cases, only 166 at baseline and 173 at one year. This accounts
for the relatively large CIs in models including up to eight exposure categories.
3.4 CTS identified by symptoms: three limited studies
There were three limited studies which identified CTS by symptoms only. Lalumandier
et al. distributed 6,320 surveys to U.S. Army military and civilian dental personnel to
BGIA-Report 2/2005e 39

3 Results
assess the number of hand symptoms, job information, and healthcare utilization
for hand problems. Ethnicity, age, gender, years in the current job, military or civilian
status, and number of patients treated per week was also collected [28; 29]. Over
5,000 questionnaires (response rate = 80.9 %) were returned with complete informa-
tion, and the number of symptoms reported was used to group respondents into three
categories describing the likelihood of CTS.
The overall prevalence of CTS was 25.4 %. Among all dental professionals responding
to the questionnaire, dental therapy assistants had the highest rate of hand problems
(86 %) and probable CTS (73 %) identified by three or more symptoms of median
nerve entrapment. Of the dental hygienists responding, 75 % reported some hand
problem and 57 % had probable CTS. Increased age was positively associated with
the development of hand problems. For respondents younger than 25 years, 13.7 %
reported probable CTS; the proportions increased to 22.8 % (25 to 34 years); 28.4 %
(35 to 47 years); and 34.3 % (45 years and older). Women were more likely to report
CTS symptoms compared to their male counterparts (33.4 % versus 19.1 %).
These studies were clearly designed and had an excellent response rate, thorough
discussion and results tied to the existing literature. Unfortunately, the authors provided
descriptive analyses only, and there was no consideration of confounding in spite of
the availability of data.
The prevalence of CTS among dental hygienists was also assessed by Anton et al.
[27]. These authors used a cross-sectional design and recruited 95 dental hygienists at
a continuing education conference in the U.S. Subjects completed a self-administered
questionnaire and were considered CTS cases if they reported at least “moderate”
symptoms of numbness, tingling, burning or aching, and shaded two of the four
fingers in the median nerve distribution of either hand in a diagram. In addition,
symptoms must have occurred sometime in the past 12 months, been present for at
least one month, and have occurred while practicing as a dental hygienist.
BGIA-Report 2/2005e 40
3 Results
Approximately 93 % of the dental hygienists stated that they had at least one job-
related ache, pain, or discomfort in the 12 months prior to the survey. The majority
of these were in the wrist/hand region (69.5 %). The overall prevalence of CTS based
solely on symptoms was 44.2 % and decreased to 23.2 % if a more conservative
definition including nocturnal symptoms was included. No additional analyses were
performed using the symptoms only definition. Details about the strengths and limita-
tions of this study can be found above.
3.5 CTS identified by nerve conduction test results: one adequate study
Only one study rated as adequate defined cases on the basis of NC test results in the
absence of symptoms or clinical exams. The adequately rated study by Latko et al. [18]
included this outcome definition in addition to symptoms, only, and the combination of
symptoms and NC test results; study details can be found in the combination definition
section. The prevalence of CTS based on NC test results was 24 % in this industrial
cohort. After excluding 16 of 352 participants with diabetes, the authors found no
trend in the association between CTS based on NC test results and repetition level. The
prevalence was 26.8 % for those in low repetition jobs, 16.4 % for medium repetition
jobs, and 25 % for those in high repetition jobs. None of 52 ergonomic factors con-
sidered by these authors were associated with abnormal NC test results in a multiple
logistic regression model controlling for age, gender, wrist shape, and BMI.
3.6 CTS identified by nerve conduction test results: two limited studies
There were two studies rated as limited which defined cases based on NC test results
alone. In the study by Kutluhan et al. [30], rated as limited, 70 Turkish carpet weavers
were compared to 30 housewives using a cross-sectional design. Data on age at be-
ginning work, length of employment, and amount of work produced per year were
collected for each weaver. The authors queried for CTS symptoms and examined for
Tinel's, Phalen's, and reverse Phalen's signs, sensory loss and atrophy of the thenar
eminence, but limited their case finding to NC tests. A distal latency difference
of greater than 0.5 milliseconds between the median and ulnar sensory nerves was
BGIA-Report 2/2005e 41

3 Results
considered indicative of CTS. Participants with slowing of the median sensory con-
duction velocity and delayed distal motor latency were regarded as severe cases;
those with slowing of the median sensory conduction velocity, only, were considered
as moderate cases; and those with normal median sensory conduction velocities but
greater than 0.5 milliseconds distal latency difference between median and ulnar
sensory nerves were regarded as mild CTS cases.
In their analyses, the authors treated each hand independently, and found 31 (22.1 %)
with CTS among the weavers. There was severe involvement in 11, moderate involve-
ment in six, and mild involvement in 14 hands. Among the controls, CTS was present
in four hands, bilaterally in one, and unilaterally in two persons. All cases were mild.
Carpet weaving was associated with an OR of 3.3 (CI: 1.23, 8.9) compared to con-
trols. There was no correlation between CTS and employment duration or amount of
work produced per year. However, in the CTS positive group (31 hands), there was a
positive correlation between the amount of work produced per year and the severity of
CTS (r = 0.639, p = 0.014).
This study has two main limitations. First is the selection of the study population. It is
not clear how weavers were identified and invited to participate, nor was the response
rate stated. Likewise, selection criteria for the ten “healthy housewives” were not speci-
fied. Second, evaluation of potential confounders was not adequately described. The
authors collected a large amount of data about symptom prevalence, physical exami-
nation results, employment duration, age, etc., but these factors were not sufficiently
used or described in the analyses. These factors limit the interpretability of the study
results.
In the second study, Liu and colleagues [31] studied 45 frequent computer users (6 to
8 hours per day). CTS was defined as: median digit II and ulnar digit V sensory latency
difference of greater than 0.4 ms; median distal motor latency greater than 4.0 ms;
and median sensory velocity less than 40 m/sec. In addition to NC, subjects com-
pleted a questionnaire to gather information about age, dominant hand, employment
duration, severity of symptoms and any painful sensation in the involved hands. Pain
BGIA-Report 2/2005e 42

3 Results
severity was measured using a visual analogue scale. Wrist angle measurements (the
exposure of interest) were determined by goniometry during work activities.
In their analysis, the authors treated each hand (n = 90) independently. NC findings
were consistent with CTS in 15 of 90 hands. This included seven dominant hands, two
non-dominant hands, and six hands bilaterally. There was no significant correlation
between CTS development and duration of employment, but a significant positive
correlation was found between wrist angle while typing and motor latency. In addition,
there was a significant negative correlation between wrist angle and median sensory
velocity. The authors concluded that “the larger the wrist angle when typing on a key-
board, the higher the risk of developing CTS.” Wrist angle extension of greater than
20 degrees was defined as “large.” The clinical severity of wrist pain was also signifi-
cantly correlated with both motor latency and sensory conduction velocity in this study.
The main limitations of this paper stem from its cross-sectional design and inadequate
data analysis. Although information on a variety of potential confounders was
collected, no multivariate analyses were described. No firm conclusions can be drawn
from this work.
3.7 CTS identified by clinical exam findings: two adequate studies
There were two studies of adequate quality that used clinical examination findings as
the only criterion for diagnosis of CTS.
Leclerc et al. [32] used a cross-sectional design to evaluate 1,547 workers from
53 different companies. The work was considered “repetitive” by the authors and
included assembly line, clothing and shoe industry, and the food industry. A total of
39 occupational physicians participated by establishing a list of about 50 workers
each, 40 of whom were exposed to repetitive work and ten controls not exposed to
repetitive work. Each participant completed a self-administered questionnaire inquiring
about demographics, co-morbid conditions, job characteristics, and psychosocial
measures. In addition, each participant underwent a standardized clinical exam. CTS
was considered to be present if either Tinel’s sign or Phalen’s test was positive, or if a
BGIA-Report 2/2005e 43

3 Results
definite diagnosis based on nerve conduction velocity had been established before the
medical examination.
One thousand, two hundred and ten subjects were classified by the occupational
physician as engaging in repetitive work. The remaining 337 were workers with a
similar distribution of age and gender, who worked in the same company but did not
have repetitive work. A total of 151 hands were diagnosed with CTS; these were found
in 11.8 % of respondents with repetitive work and 2.4 % of controls. In a logistic
regression model, neither age nor gender was associated with CTS. Job sector was
associated with CTS, with the highest ORs observed for those employed in packaging
(OR = 6.55, CI: 3.02, 14.2). Psychosocial health was related to CTS such that increas-
ing numbers of psychological problems were related to increased ORs for CTS. The
highest category (out of 3) had OR = 2.32 (CI: 1.48, 3.63). Finally, compared to
those with BMI less than 27, respondents with BMI between 27 and 31 had OR for
CTS = 2.16 (CI: 1.35, 3.45), and those with BMI greater than 31 had OR = 1.91
(CI: 1.09, 3.37).
In a second logistic model, the authors added several work-related variables, includ-
ing work satisfaction, need to press with the hand, job control, and cycle time. This
model yielded almost no statistically significant findings, except for BMI greater than
26 (OR = 2.16, CI: 1.41, 3.29), psychological problems (OR = 2.32, CI: 1.40, 3.82),
and cycle time of less than ten seconds (OR = 1.90, CI: 1.04, 3.48).
In a third logistic model, the authors included sex, age, BMI, psychological problems,
job sector, need to press with the hand, job control, and “just in time” inventory
practices. Those with BMI greater than 26 and psychological problems again showed
increased ORs for CTS. In addition, low job control had OR = 1.59 (CI: 1.04, 2.43),
and “just in time” inventory had OR = 2.24 (CI: 1.40, 3.57).
While the definitions of CTS and “repetition” were somewhat poorly described,
they were consistently applied across many companies and industries. The analyses
were thorough and thoughtful, although there were too many parameters in some
BGIA-Report 2/2005e 44

3 Results
of the models for only 127 cases. The findings were consistent with the literature
and also added to existing knowledge by modelling job factors across companies and
industries.
The same cohort was followed after three years with a questionnaire and physical
examination by Leclerc et al. [33]. During that interval, 57 new cases of CTS were
identified among the 467 participants free of CTS at baseline (incidence = 12.2 %).
Industrial sector, age group, and number of other upper-limb disorders were not
related to the development of CTS. For men, work factors related to the development
of CTS were “tighten with force” (OR = 4.09, CI: 1.43, 11.7) and “hold in position”
(OR = 3.59, CI: 1.06, 12.1). For women, the only factor associated with the develop-
ment of CTS was an increase in BMI since baseline of more than 2 kg/m2 (OR = 2.38,
CI: 1.04, 5.47).
The poorly described definitions of CTS and “repetition” were problematic at follow-up
as they were in the initial report for this study. The diversity of participants allowed for
analysis of job factors, physical characteristics, and psychosocial problems. Though
these studies would be substantially strengthened by a more complete description
of case ascertainment and exposure measures, they are still able to add to our under-
standing of CTS.
3.8 CTS identified by Worker’s Compensation claims: two limited studies
Two studies of limited quality described CTS using Worker’s Compensation (WC)
claims as a case-finding technique. The first, by Silverstein et al. [34], examined the
claims incidence rate, cost and industry distribution of work-related upper extremity
disorders in Washington State. The authors abstracted WC claims filed between 1987
and 1995 from a state-wide database and categorized them into general and specific
disorders of gradual and sudden onset.
On average, 3,132 WC claims for CTS were submitted annually during the study
period. There were 2,918 individuals involved, yielding a yearly claim rate per 10,000
full time equivalents of 27.3. The largest claims incidence rates per 10,000 workers
BGIA-Report 2/2005e 45

3 Results
were as follows: shake mills (216 per 10,000), seafood canneries (188), meat/poultry
dealers-wholesale (169), creameries (165), meat products manufacturing (139),
meat dealers-wholesale (133), wallboard insulation (131), aluminium smelting (127),
roofing (117), and logging (116).
This study provides an unbiased estimate of the number of work-related CTS claims in
Washington State over time. Unfortunately, information on only the most severe cases
is provided by this data source, as workers were required to have sought medical
care and filed a WC claim to be included in the sample. Controlled analyses were not
possible due to the use of administrative data, so confounding is quite likely to have
affected the results.
The second study using WC claims was conducted by Davis et al. [35]. The authors
used physician case-reports and WC disability claims to document patterns of work-
related CTS in Massachusetts from March 1992 through June 1997. Work-related
CTS was identified in 4,836 cases. Nineteen percent were identified through physician
reports, only; 75 % through WC claims, only; and 6 % of cases were identified from
both sources.
Overall, there were 4.0 cases per 10,000 employees, and 70 % of cases were women.
The incidence of claims for CTS increased with age from 1.4 among those under age
25 years to 6.0 among those aged 45 to 54 years. Industry sector was related to the
rate of CTS cases per 10,000, including: agriculture (2.4), mining (5.5), construction
(2.5), manufacturing (8.6), transportation (4.0), wholesale trade (3.4), retail trade
(3.4), finance/insurance/real estate (3.3), services (2.4), and public administration
(2.6). The rate of CTS cases was lower for those in white-collar (e. g. managerial and
professional specialty: 1.0 per 10,000) versus blue-collar (e. g. operators and labour-
ers: 7.7 per 10,000) jobs. The industries with the highest case rates included aircraft
and parts manufacturing: 26 per 10,000; fabricated textile products manufacturing:
24.5 per 10,000; and scientific and controlling instrument manufacturing: 24.2 per
10,000.
BGIA-Report 2/2005e 46
3 Results
The use of WC claims and physician surveillance provides an excellent estimate of
burden of occupational CTS by industry and job category for the Commonwealth of
Massachusetts. Again, however, these estimates are likely to include only the most se-
vere cases, as reports are supplied by specialty physicians and are limited to persons
with at least five days lost from work. In addition, confounding is likely as the authors
provided descriptive analyses, only.
3.9 CTS identified by prior CT release surgery or physician diagnosis: one
adequate study
One study rated as adequate identified CTS on the basis of prior CT release surgery
or physician diagnosis. Rossignol et al. [36] used a cross-sectional design to study
the rates of CTS release for adults 20 to 64 years of age on the island of Montreal,
Canada, for 12 months in 1993 to 1994. The number of surgical cases within demo-
graphic categories was compared to the 1991 population census for Montreal, so
annual surgical incidence rates could be calculated. In addition, surgical patients were
identified by 20 plastic surgeons participating in the study. These subjects were inter-
viewed about their CTS symptoms, any diagnostic testing, co-morbidities, job tasks,
and functional limitations prior to surgery.
There were 969 surgeries during the study period, yielding a rate of 0.9 per 1,000
adults in the population. The majority of cases (74 %) were women. The highest rates
were found for women aged 45 to 54 years (2.4 per 1,000 compared to 0.7 per
1,000 for males in the same age group). Two hundred and thirty-eight surgical
patients met the inclusion criteria for interview, and 94 % of them reported having had
at least one diagnostic test prior to surgery. Half the patients reported experiencing
symptoms for at least two years prior to surgery. Functional limitations prior to surgery
included difficulties with: carrying grocery bags (51 %), unscrewing the cap of a jar
(43 %), carrying a full cup (30 %), writing (28 %), and holding a telephone receiver
(27 %). Of all the patients interviewed, 53 % reported that when their symptoms first
began, they had a job with physically demanding tasks for the hands and wrists. Work
demands included the use of force, vibrating hand-held power tools, or exposure to
BGIA-Report 2/2005e 47

3 Results
cold. Forty percent reported the presence of a medical condition known to be associ-
ated with the development of CTS.
For manual workers, the standardized incidence rate (SIR) for surgical CT release was
1.8 (CI: 1.4, 2.2) for women and 1.9 (CI: 1.4, 2.5) for men. The highest risk was
identified for those in housekeeping occupations, including commercial and domestic
categories (SIR = 7.2, CI: 2.8, 13.4 and SIR = 67.2, CI: 17.3, 148.0; for women and
men, respectively). The second highest risk group was data processors (SIR = 3.1, CI:
1.0, 6.3 for women and SIR =11.2, CI: 1.1, 31.8 for men). “Data processor” was the
only job category among all clerical occupations that showed an increased incidence
of CT release. Among participants in material handling occupations, the SIR for
women was 6.0 (CI: 2.2, 11.8) and the SIR for men was 5.5 (CI: 1.4, 12.3).
This study capitalized on the broad accessibility of medical care in Canada and
was enhanced by the inclusion of a majority of surgeons performing CT release in
Montreal. The major strength of this study was its use of census data to calculate inci-
dence rates and SIRs. However, the ability to evaluate and control for confounding,
except for age and gender, was limited by the reliance on administratively collected
data. In addition, the occupational categories used were broad, and exposure catego-
ries were based only on job titles. These factors suggest residual confounding and
misclassification of exposure, respectively, might have influenced some of the reported
results.
3.10 CTS identified by prior CT release surgery or physician diagnosis:
one limited study
There was one limited study which identified CTS on the basis of prior CT release
surgery or physician diagnosis. Dryson et al. [37] identified 964 patients referred to
an occupational physician for CTS in New Zealand. The patients were categorized
according to occupation, and their distribution was compared with the general popu-
lation distribution of occupational categories. For women, CTS cases were more
likely than women in the general population to be identified as working in clerical
BGIA-Report 2/2005e 48

3 Results
occupations (RR = 1.78, CI: 1.03, 3.07), or to be manual labourers in industry (plant/
machine operators, RR = 2.83, CI: 01.21, 6.62; labourers, RR = 2.70, CI: 1.22,
5.98). For men, the CTS cases were more likely than their general population counter-
parts to be identified as working in trades (RR = 3.55, CI: 1.88, 6.68). As with the
other studies summarized in this section, the usefulness of these results is limited by the
lack of information on potential confounders or effect modifiers. However, all of these
studies may be considered hypothesis-generating tools that draw attention to particu-
lar industries or jobs that might be targeted for closer examination in the future.
BGIA-Report 2/2005e 49


4 Discussion
4 Discussion
A large amount of research on the association between occupation and CTS has been
completed since 1997. Much of this work has been of high quality and represents
substantial methodological improvement over the six cross-sectional studies identified
as the best available by NIOSH in their 1997 review [5]. For example, the literature
now includes a number of prospective studies, and many authors have attempted to
employ individual level exposure measures. Careful definitions and descriptions of
both exposure and outcome measures have also added to the quality of the available
literature.
The NIOSH panel identified three occupational exposures as potentially related to
CTS: force, repetition, and vibration. Posture was also considered by the panel, but the
evidence for a connection with CTS was deemed “insufficient”. In Table 7 (see page
86) we summarize the evidence provided by the eleven best quality studies included in
the current synthesis with respect to occupational exposures identified by NIOSH.
Three studies addressed the association between forceful movements and CTS [16;
20; 22]. All three employed a combination technique for identifying cases of CTS that
included at least self-reported symptoms and NC test results, but none of the exposure
measures were comparable. The largest magnitude estimate, OR = 9.0 (CI: 2.4,
33.4), resulted from the smallest of the three studies and the only one employing the
case-control design. The estimate was adjusted for gender, parity (among women),
and other occupational exposures. This was also the only one of the three studies that
employed individual level exposure assessments using job-task analyses: exposed
employees were defined as those who lifted tools and materials in excess of one kilo-
gram. Cases reported symptoms and had either a positive clinical examination or
positive NC test results [16].
Nathan et al. [20] observed participants at work at a baseline contact point, and rated
each job along a five-point scale describing the consistency of use of force (0 = not at
all, 5 = consistent). These ratings were used to categorize participants eleven years
BGIA-Report 2/2005e 51

4 Discussion
later. The authors reported a negative association between the rating and risk of
CTS identified by symptoms plus NC test results (OR = 0.75, CI: 0.21, 2.72) after
controlling for cigarette smoking, age, gender, non-white race, BMI, leisure activity,
presence/absence of hormone use or endocrine conditions, duration of employment,
and several other work exposures.
Thomsen et al. [22] reported a 40 % increase in odds for CTS with each ten hour
increment of forceful work per week (OR = 1.41, CI: 0.86, 2.30) after adjustment for
hours of repetitive work, age, gender, seniority, and BMI. Exposure categories were
based on questionnaire data, and cases were identified from symptom reports, clinical
exam, and NC test results. When the authors re-defined cases based only on symp-
toms, the effect was reduced to OR = 1.28 (CI: 1.08, 1.52), although the number of
cases in the working hand increased from eight to 70.
Although the evidence provided by the NIOSH 1997 review [5] and these three studies
generally supports a positive association between forceful movements and CTS, the
lack of comparability of the exposure metrics and the wide range of effect estimates
reported leave this conclusion open to question.
Repetitive actions were measured by cycle times in several studies [16; 18; 20 to 22;
32]. The reported effect estimates were of similar magnitude, ranging from OR =
1.14 (CI: 1.00, 1.34) per unit of exposure based on a five-point rating scale for cases
based on symptoms only [18] up to OR = 1.90 (CI: 1.01, 3.48) for clinically diag-
nosed CTS among those with jobs involving cycle times of ten seconds or less com-
pared to those whose operations lasted one minute or more [32]. An unusually high
effect estimate, OR = 8.8 (CI: 1.8, 44.4), was provided by Roquelaure et al. from their
case-control study with individual level exposure assessment and cases based on a
combination of symptoms and either clinical exam findings or NC test results [16].
Each of these estimates was controlled for a variety of occupational and non-occupa-
tional factors.
BGIA-Report 2/2005e 52

4 Discussion
Taken together with the material reported in the 1997 NIOSH review [5], the
epidemiological evidence is limited in quantity, but appears to consistently indicate
a small positive association between repetitive actions and the risk of CTS.
The 1997 NIOSH panel reported weak evidence in favour of a positive association
between occupational exposure to vibrations and CTS [5]. Only one of the 11 studies
rated adequate in the current review addressed this exposure. The 11 year follow-up
study reported by Nathan et al. identified cases of CTS based on self-reported symp-
toms and NC tests. Based on individual observation, jobs that were classified as
entailing exposure to vibration were found to be positively associated with risk of
CTS (OR = 3.73, CI: 1.04, 13.33) [20]. This represents an addition to the body of
epidemiological evidence in favour of an association between vibration and CTS, but
the evidence as a whole is insufficient for a firm conclusion to be reached.
The evidence available in 1997 was deemed by NIOSH to be insufficient for determin-
ing whether or not an association exists between wrist postures (flexion) and risk of
CTS [5]. We identified one adequate study that addressed this exposure. Frost et al.
[17] compared slaughterhouse with chemical plant employees. CTS cases were de-
fined on the basis of either symptoms alone, or symptoms combined with NC test
results, and job tasks were analyzed to assess the frequency of wrist movements out
of the neutral position. Slaughterhouse employees were found to work in non-neutral
positions “a substantial part of the time”, and to be at increased risk of CTS relative to
chemical factory employees. However, wrist posture, per se, was not assessed as an
independent determinant of CTS. We conclude that no additional evidence for or
against a connection between CTS and wrist posture has become available since
1997.
None of the other occupational activities that were evaluated in the best quality studies
were assessed in a sufficient number of investigations for any conclusion about the
evidence for or against an association with CTS to be reached. Pressing with the hand,
computer keyboard use, and changes in activity during the work day/job rotation were
each evaluated in two studies. Grip type, manual work station supply, holding items in
BGIA-Report 2/2005e 53

4 Discussion
position, computer mouse use, and de-boning work were each evaluated in one study.
Even if of excellent quality, single studies or pairs of epidemiological studies cannot
provide sufficient evidence to either establish or reject an association between work
activities and CTS. An additional question that remains open is that of the association
between CTS and combinations of any of the four major occupational exposures dis-
cussed here, e. g., work that is both repetitive and forceful.
BGIA-Report 2/2005e 54

5 Summary
5 Summary
Our conclusions are based on a review of the epidemiological literature that was pub-
lished in either the English or the German language since 1997. Three-hundred and
thirty-four studies were screened for content, and the 34 that addressed the associa-
tion between CTS and occupational exposures were assessed for quality. The final
quality ratings were based primarily on study design and analysis methods.
Papers rated “Adequate” were free of major bias; residual confounding was unlikely to
have substantially influenced the results; there was reasonably complete ascertainment
of cases and adequate exposure assessment. “Limited” studies were free of major
bias, but residual confounding might have influenced the results; there was reasonably
complete ascertainment of cases and reasonable exposure assessment methods were
used. “Inadequate” studies were judged likely to be substantially influenced by major
bias, or residual confounding was likely to have influenced the results; or the study
outcome was not specifically carpal tunnel syndrome.
Among the 27 studies rated either “adequate” or “limited”, we found substantial
methodological improvements over the work as summarized in [5]. These improve-
ments include the use of stronger analytical study designs in addition to the cross-
sectional design, and the use of individual-level or group-level job task analyses to
assess exposure. For example, several of the best studies included in this review used
prospective research methods [20; 22; 23; 33], which offer the best support for causal
associations among epidemiological methods. Unfortunately, all but one of the pro-
spective studies employed follow-up intervals of less than two years, which limited the
number of incident cases available for analysis.
Studies published prior to 1997 generally used exposure categories based on job title,
occupation, or industry. This technique offers a general impression of high-risk jobs or
industries, but is likely to result in substantial misclassification of exposure because job,
occupation and industry serve as surrogates for more specific tasks.
BGIA-Report 2/2005e 55

5 Summary
The best of the more recent investigations employed individual level task analyses
or used detailed task assessments for representative jobs that were generalized to
employees in the same or similar job categories. We recognize that group level job
task analyses may result in misclassification of exposure due to inter-individual vari-
ability in task performance. However, the degree of misclassification is likely to be less
than that arising from the use of broader categories, such as occupation.
Even with these methodological improvements, the key issue yet to be fully addressed
is the definition of CTS, itself. The lack of a "gold standard" diagnostic technique
represents a major hurdle to be overcome. Nerve conduction (NC) tests are consid-
ered the most objective measure of median nerve entrapment. However, the lack of
overlap between cases identified by NC tests compared to other methods, and the low
predictive value of abnormal NC tests among asymptomatic individuals followed over
time, suggest the need for improvements in medical diagnostic techniques. Any future
original research or literature review of risk factors for CTS must address the fact that
the prevalence, incidence, and risk factors for CTS, as well as the practical impact of
the disease on patient populations, will depend strongly on the case definition used.
As of 1997, repetition, force, vibration, and wrist posture (flexion) were judged to
be potentially related to the risk of occupational CTS [5]. Based on our review of the
English and German language epidemiology literature published between 1997 and
2003, we conclude that there is consistent evidence for a small, positive association
between repetitive work and CTS. The evidence for an association between CTS and
forceful work is weak and of questionable validity, and there is insufficient evidence for
a conclusion to be drawn about the existence or direction of an association between
CTS and occupational exposure to vibration, work in non-neutral wrist postures, or
combinations of work exposures.
BGIA-Report 2/2005e 56

6 Bibliography
6 Bibliography
[1] Zenz, C.; Dickerson, O. B.; Horvath, E. P. (eds.): Occupational Medicine. 3rd ed.
Mosby, St. Louis1994
[2] Yassi, A.: Repetitive strain injuries. Lancet 349 (1997) No. 9056, pp. 943-947
[3] Hadler, N. M.: Occupational musculoskeletal disorders. 2nd ed. Philadelphia,
Pa, Lippincott, Williams and Wilkins 1999
[4] Katz, R. T.: Carpal tunnel syndrome: a practical review. Am. Fam. Physician 49
(1994) No. 6, pp. 1371-1379, 1385-86
[5] Bernard, B. (ed): Musculoskeletal disorders and workplace factors: A critical
review of epidemiologic evidence for work-related musculoskeletal disorders
of the neck, upper extremity, and low back. U.S. Dept. of Health and Human
Services, Public Health Service, Centers for Disease Control and Prevention,
National Institute for Occupational Safety and Health, Washington, D.C. 1997
[6] Cherniack, M. G.: Epidemiology of occupational disorders of the upper extrem-
ity. Occup. Med. 11 (1996) No. 3, pp. 513-530
[7] Rempel, D.; Evanoff, B.; Amadio, P. C.; de Krom, M.; Franklin, G.; Franzblau,
A.; Gray, R.; Gerr, F.; Hagberg, M.; Hales, T.; Katz, J. N.; Pransky, G.: Consen-
sus criteria for the classification of carpal tunnel syndrome in epidemiologic
studies. Am. J. Public Health 88 (1998) No. 10, pp. 1447-1451
[8] Homan, M. M.; Franzblau, A.; Werner, R. A.; Albers, J. W.; Armstrong, T. J.;
Bromberg, M. B.: Agreement between symptom surveys, physical examination
procedures and electrodiagnostic findings for the carpal tunnel syndrome.
Scand. J. Work Environm. Health 25 (1999) No. 2, pp. 115-124
BIA-Report 2/2005e 57

6 Bibliography
[9] Atroshi, I.; Gummesson, C.; Johnsson, R.; Ornstein, E.; Ranstam, J.; Rosen, I.:
Prevalence of carpal tunnel syndrome in a general population. J. Am. Med.
Assoc. 282 (1999) No. 2, pp. 153-158
[10] Hamann, C.; Werner, R. A.; Franzblau, A.; Rodgers, P. A.; Siew, C.; Gruninger,
S.: Prevalence of carpal tunnel syndrome and median mononeuropathy among
dentists. J. Am. Dent. Assoc. 132 (2001) No. 2, pp. 163-170
[11] Stevens, J. C.; Witt, J. C.; Smith, B. E.; Weaver, A. L.: The frequency of carpal
tunnel syndrome in computer users at a medical facility. Neurology 56 (2001)
No. 11, pp. 1568-1570
[12] Isolani, L.; Bonfiglioli, R.; Raffi, G. B.; Violante, F. S.: Different case definitions to
describe the prevalence of occupational carpal tunnel syndrome in meat industry
workers. Int. Arch. Occup. Environm. Health 75 (2002) No. 4, pp. 229-234
[13] Werner, R. A.; Hamann, C.; Franzblau, A.; Rodgers, P. A.: Prevalence of carpal
tunnel syndrome and upper extremity tendinitis among dental hygienists. J. Dent.
Hyg. 76 (2002) No. 2, pp. 126-132
[14] Werner, R. A.; Franzblau, A.; Albers, J. W.; Buchele, H.; Armstrong, T. J.: Use of
screening nerve conduction studies for predicting future carpal tunnel syndrome.
Occup. Environm. Med. 54 (1997) No. 2, pp.96-100
[15] McDiarmid, M.; Oliver, M.; Ruser, J.; Gucer, P.: Male and female rate differ-
ences in carpal tunnel syndrome injuries: personal attributes or job tasks?
Environm. Res. 83 (2000) No. 1, pp. 23-32
[16] Roquelaure, Y.; Mechali, S.; Dano, C.; Fanello, S.; Benetti, F.; Bureau, D.;
Mariel, J.; Martin, Y. H.; Derriennic, F.; Penneau-Fontbonne, D.: Occupational
and personal risk factors for carpal tunnel syndrome in industrial workers. Scand.
J. Work Environm. Health 23 (1997) No. 5, pp. 364-369
BIA-Report 2/2005e 58

6 Bibliography
[17] Frost, P.; Andersen, J. H.; Nielsen, V. K.: Occurrence of carpal tunnel syndrome
among slaughterhouse workers. Scand. J. Work Environm. Health 24 (1998) No.
4, pp. 285-292
[18] Latko, W. A ; Armstrong, T. J.; Franzblau, A.; Ulin, S. S.; Werner, R. A.; Albers,
J. W.: Cross-sectional study of the relationship between repetitive work and the
prevalence of upper limb musculoskeletal disorders. Am. J. Ind. Med. 36 (1999)
No. 2, pp. 248-259
.
[19] Abbas, M. F.; Faris, R. H.; Harber, P. I.; Mishriky, A. M.; El-Shahaly, H. A.;
Waheeb, Y. H.; Kraus, J. F.: Worksite and personal factors associated with carpal
tunnel syndrome in an Egyptian electronics assembly factory. Int. J. Occup.
Environm. Health 7 (2001) No. 1, pp. 31-36
[20] Nathan, P. A.; Meadows, K. D.; Istvan, J. A.: Predictors of carpal tunnel syn-
drome: an 11-year study of industrial workers. J. Hand Surg. [Am.] 27 (2002)
No. 4, pp. 644-651
[21] Rosecrance, J. C.; Cook, T. M.; Anton, D. C.; Merlino, L. A.: Carpal tunnel
syndrome among apprentice construction workers. Am. J. Ind. Med. 42 (2002)
No. 2, pp. 107-116
[22] Thomsen, J. F.; Hansson, G. A.; Mikkelsen, S.; Lauritzen, M.: Carpal tunnel syn-
drome in repetitive work: a follow-up study. Am. J. Ind. Med. 42 (2002) No. 4,
pp. 344-353
[23] Andersen, J. H.; Thomsen, J. F.; Overgaard, E.; Lassen, C. F.; Brandt, L. P.;
Vilstrup, I.; Kryger, A. I.; Mikkelsen, S.: Computer use and carpal tunnel syn-
drome: a 1-year follow-up study. J. Am. Med. Assoc. 289 (2003) No. 22, pp.
2963-2969
[24] Werner, R. A.; Franzblau, A.; Albers, J. W.; Armstrong, T. J.: Median mono-
neuropathy among active workers: are there differences between symptomatic
and asymptomatic workers? Am. J. Ind. Med. 33 (1998) No. 4, 374-378
BIA-Report 2/2005e 59

6 Bibliography
[25] Gorsche, R. G.; Wiley, J. P.; Renger, R. F.; Brant, R. F.; Gemer, T. Y.; Sasyniuk,
T. M.: Prevalence and incidence of carpal tunnel syndrome in a meat packing
plant. Occup. Environm. Med. 56 (1999) No. 6, pp. 417-422
[26] Roquelaure, Y.; Mariel, J.; Dano, C.; Fanello, S.; Penneau-Fontbonne, D.: Preva-
lence, incidence and risk factors of carpal tunnel syndrome in a large footwear
factory. Int. J. Occup. Med. Environm. Health 14 (2001) No. 4, pp. 357-367
[27] Anton, D.; Rosecrance, J.; Merlino, L.; Cook, T.: Prevalence of musculoskeletal
symptoms and carpal tunnel syndrome among dental hygienists. Am. J. Ind.
Med. 42 (2002) No. 3, pp. 248-257
[28] Lalumandier, J. A.; McPhee, S. D.; Riddle, S.; Shulman, J. D.; Daigle, W. W.:
Carpal tunnel syndrome: effect on Army dental personnel. Milit. Med. 165
(2000) No. 5, pp. 372-378
[29] Lalumandier, J. A.; McPhee, S. D.: Prevalence and risk factors of hand problems
and carpal tunnel syndrome among dental hygienists. J. Dent. Hyg. 75 (2001)
No. 2, pp. 130-134
[30] Kutluhan, S.; Akhan, G.; Demirci, S.; Duru, S.; Koyuncuoglu, H. R.; Ozturk, M.;
Cirak, B.: Carpal tunnel syndrome in carpet workers. Int. Arch. Occup. Envi-
ronm. Health 74 (2001) No. 6, pp. 454-457
[31] Liu, C. W.; Chen, T. W ; Wang, M. C.; Chen, C. H.; Lee, C. L.; Huang, M. H.:
Relationship between carpal tunnel syndrome and wrist angle in computer
workers. J. Med. Sci. 19 (2003) No. 12, pp. 617-623
.
[32] Leclerc, A.; Franchi, P.; Cristofari, M. F.; Delemotte, B.; Mereau, P.; Teyssier-
Cotte, C.; Touranchet, A.: Carpal tunnel syndrome and work organisation in re-
petitive work: a cross sectional study in France. Study Group on Repetitive Work.
Occup. Environm. Med. 55 (1998) No. 3, pp. 180-187
BIA-Report 2/2005e 60

6 Bibliography
[33] Leclerc, A.; Landre, M. F.; Chastang, J. F.; Niedhammer, I.; Roquelaure, Y.:
Upper-limb disorders in repetitive work. Scand. J. Work Environm. Health 27
(2001) No. 4, pp. 268-278
[34] Silverstein, B.; Welp, E.; Nelson, N ; Kalat, J.: Claims incidence of work-related
disorders of the upper extremities: Washington state, 1987 through 1995. Am. J.
Public Health 88 (1998) No. 12, pp. 1827-1833
.
.
[35] Davis, L.; Wellman, H.; Punnett, L.: Surveillance of work-related carpal tunnel
syndrome in Massachusetts, 1992-1997: a report from the Massachusetts Senti-
nel Event Notification System for Occupational Risks (SENSOR). Am. J. Ind. Med.
39 (2001) No. 1, pp. 58-71
[36] Rossignol, M.; Stock, S.; Patry, L.; Armstrong, B.: Carpal tunnel syndrome: what
is attributable to work? The Montreal study. Occup. Environm. Med. 54 (1997)
No. 7, pp. 519-523
[37] Dryson, E. W.; Walls, C. B.: The distribution of occupations in two populations
with upper limb pain. Int. J. Occup. Environm. Health 7 (2001) No. 3, pp. 201-
205
[38] Sulsky, S. I.; Hooven, F. H.; Burch, M. T.; Mundt, K. A.: Critical review of the epi-
demiological literature on the potential cardiovascular effects of occupational
carbon disulfide exposure. Int. Arch. Occup. Environm, Health 75 (2002) No. 6,
pp. 365-380
[39] Bekkelund, I.; Torbergsen, T.; Rom, A. K.; Mellgren, S. I.: Increased risk of me-
dian nerve dysfunction in floor cleaners: a controlled clinical and neurophysi-
ological study. Scand. J. Plast. Reconstr. Surg. Hand Surg. 35 (2001) No. 3, pp.
317-321
[40] Budak, F.; Yenigun, N ; Ozbek, A.; Orhan, S.; Komsuoglu, S.: Carpal tunnel
syndrome in carpet weavers. Electromyogr. Clin. Neurophysiol. 41 (2001) No. 1,
pp. 29-32
BIA-Report 2/2005e 61

6 Bibliography
[41] Cosgrove, J. L.; Chase, P. M.; Mast, N. J.; Reeves, R.: Carpal tunnel syndrome in
railroad workers. Am. J. Phys. Med. Rehabil. 81 (2002) No. 2, pp. 101-107
[42] Diaz, J. H.: Carpal tunnel syndrome in female nurse anesthetists versus operat-
ing room nurses: prevalence, laterality, and impact of handedness. Anesth.
Analg. 93 (2001) No. 4, pp. 975-980
[43] Hess, D.: Employee perceived stress. Relationship to the development of repeti-
tive strain injury symptoms. AAOHN J. 45 (1997) No. 3, pp. 115-123
[44] Yagev, Y.; Carel, R. S.; Yagev, R.: Assessment of work-related risks factors for
carpal tunnel syndrome. Isr. Med. Assoc. J. 3 (2001) No. 8, pp. 569-571
[45] Zetterberg, C.; Ofverholm, T.: Carpal tunnel syndrome and other wrist/hand
symptoms and signs in male and female car assembly workers. Int. J. Ind. Ergon.
23 (1999), pp. 193-204
BIA-Report 2/2005e 62

7 Annex: Tables
7 Annex: Tables
List of Tables
Table 1: Summary of criteria for evaluating study quality..................................64
Table 2: Characteristics of 34 studies of carpal tunnel syndrome
(CTS) and occupation........................................................................65
Table 3: Design details for 34 studies of carpal tunnel syndrome (CTS)
and occupation ................................................................................68
Table 4: Exposure assessment used in 34 studies of occupation and
carpal tunnel syndrome (CTS)............................................................72
Table 5: Covariate data collected by the authors of 34 studies of
occupation and carpal tunnel syndrome (CTS)....................................77
Table 6: Overall quality assessment of 34 studies of occupation and
carpal tunnel syndrome (CTS)............................................................80
Table 7: Summary of adjusted estimates of effect of work exposures from
11 studies rated as “adequate”..........................................................86
Table 8: Conclusions regarding potential risk factors for CTS identified
by the 1997 NIOSH panel.................................................................89
BGIA-Report 2/2005e 63
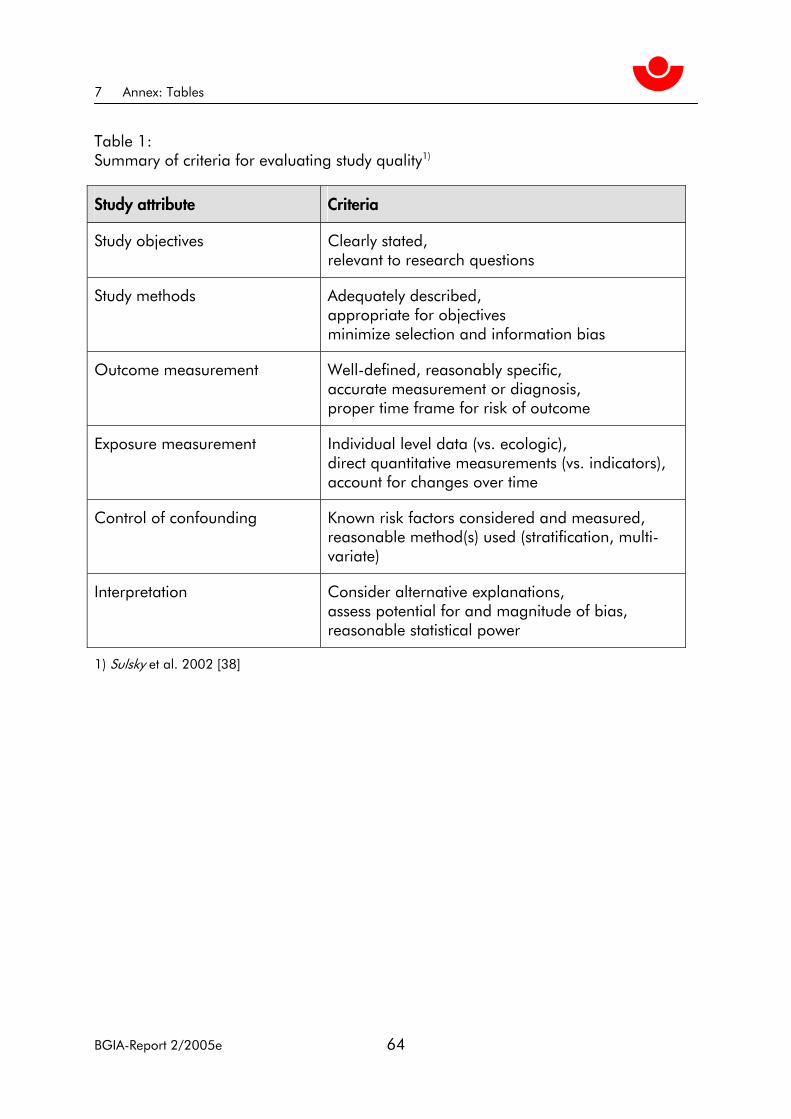
7 Annex: Tables
Table 1: Summary of criteria for evaluating study quality1)
Study attribute Criteria
Study objectives Clearly stated, relevant to research questions
Study methods Adequately described, appropriate for objectives minimize selection and information bias
Outcome measurement Well-defined, reasonably specific, accurate measurement or diagnosis, proper time frame for risk of outcome
Exposure measurement Individual level data (vs. ecologic), direct quantitative measurements (vs. indicators), account for changes over time
Control of confounding Known risk factors considered and measured, reasonable method(s) used (stratification, multi-variate)
Interpretation Consider alternative explanations, assess potential for and magnitude of bias, reasonable statistical power
1) Sulsky et al. 2002 [38]
BGIA-Report 2/2005e 64

7 Annex: Tables
Table 2: Characteristics of 34 studies of carpal tunnel syndrome (CTS) and occupation
First author (Year)
Study population Country Comparison Design Size1 Gender
Abbas (2001) [19]
Electronics manufacturing facility employees
Egypt Internal Cross-sectional 198 Both
Andersen (2003) [23]
Danish Association of Professional Technicians
Denmark Internal Cohort 6,943 Both
Anton (2002) [27]
Dental hygienists attending a professional conference
United States
Internal Cross-sectional 95 Women
Atroshi (1999) [9]
Age- and gender-stratified population random sample
Sweden Internal Cross-sectional 2,466 Both
Bekkelund* (2001) [39]
Cleaners Norway Secretaries Cross-sectional 83 Women
Budak* (2001) [40]
Carpet weavers in a single company
Turkey Undefined internal control group
Cross-sectional 47 Women
Cosgrove* (2002) [41]
Railroad employees suing for compensation for CTS
United States
None Cross-sectional 900 Men
Davis (2001) [35]
All cases of work-related CTS reported to the SENSOR program and all WC claims2
United States
None Cohort 4,836 Both
Diaz* (2001) [42]
Nurse anaesthetists United States
Operating room nurses
Cross-sectional 244 Women
Dryson (2001) [37]
Patients referred to an occupa-tional physician for CTS
New Zealand
General population
Cross-sectional 2,647 Both
Frost (1998) [17]
Slaughterhouse employees Denmark Chemical plant employees
Cohort 1,141 Both
Gorsche (1999) [25]
Meat packing employees who worked >1 month
Canada Internal Cohort 665 Both
Hamann (2001) [10]
Dentists attending one ADA meeting in 1997 or 19983
United States
Internal Cross-sectional 1079 Both
Hess* (1997) [43]
State agency employees who routinely use computers
United States
Internal Cross-sectional 274 Both
Kutluhan (2001) [30]
Carpet weavers Turkey Healthy house-wives
Cross-sectional 100 Women
BGIA-Report 2/2005e 65

7 Annex: Tables
Table 2 (continued):
First author (Year)
Study population Country Comparison Design Size1 Gender
Lalumandier (2000) [28]
U.S. Army military and civilian dental personnel
United States, Panama, Europe, Asia
Internal Cross-sectional 5,115 Both
Lalumandier (2001) [29]
U.S. Army military and civilian dental hygienists
United States, Panama, Europe, Asia
Internal Cross-sectional 177 Both
Latko (1999) [18]
Employees of 3 manufacturing facilities
United States
Internal Cross-sectional 352 Both
Leclerc (1998) [33]
Employees in 4 sectors exposed to repetitive work
France Internal Cross-sectional 1,547 Both
Leclerc (2001)
Employees who participated in a baseline study 1993-94
France Internal Cohort 598 Both
Liu (2003) [31]
Frequent computer users randomly selected from hospital departments
Taiwan Internal Cross-sectional 45 Unknown
Nathan (2002) [20]
Employees in 4 industrial sites in March to October 1984
United States
Internal Cohort 471 Both
Roquelaure (1997) [16]
Television, shoe and auto-mobile brake production employees
France Internal Case-control 130 Both
Roquelaure (2001) [26]
Footwear assembly employees France Internal Cohort 199 Both
Rosecrance (2002) [21]
Construction apprentices United States
Internal Cross-sectional 1,142 Both
Rossignol (1997) [36]
Patients with CTS release Canada General popula-tion of Montreal
Cross-sectional 238 Both
Silverstein (1998) [34]
Washington state employed population
United States
None Cohort 26,262 Both
Stevens (2001) [11]
Computer users United States
Internal Cross-sectional 257 Both
Thomsen (2002) [22]
Employees of a bank and two postal centers
Denmark Internal Cohort 731 Both
Werner (1997) [14]
Employees at 5 manufacturing sites and 1 clerical site
United States
Internal Cohort 154 Both
BGIA-Report 2/2005e 66

7 Annex: Tables
Table 2 (continued):
First author (Year)
Study population Country Comparison Design Size1 Gender
Werner (1998) [24]
Employees at 5 manufacturing sites and 1 clerical site
United States
Internal Cross-sectional 724 Both
Werner (2002) [13]
Dental hygienists attending ADHA meeting in Washington, DC4
United States
Clerical and industrial workers
Cross-sectional 305 Women
Yagev* (2001) [44]
Patients referred for electro-physiological tests
Israel Other examinees in the clinic
Case-control 396 Both
Zetterberg* (1999) [45]
Car assemblers Sweden Internal Cross-sectional 564 Both
1 Total sample size: (exposed plus unexposed) or (cases plus controls)
2 SENSOR: Massachusetts (US) Sentinel Event Notification System for Occupational Risks. WC: Workers' Compensation
3 ADA: American Dental Association
4 ADHA: American Dental Hygiene Association
* Study was rated inadequate for inclusion in critical review.
BGIA-Report 2/2005e 67
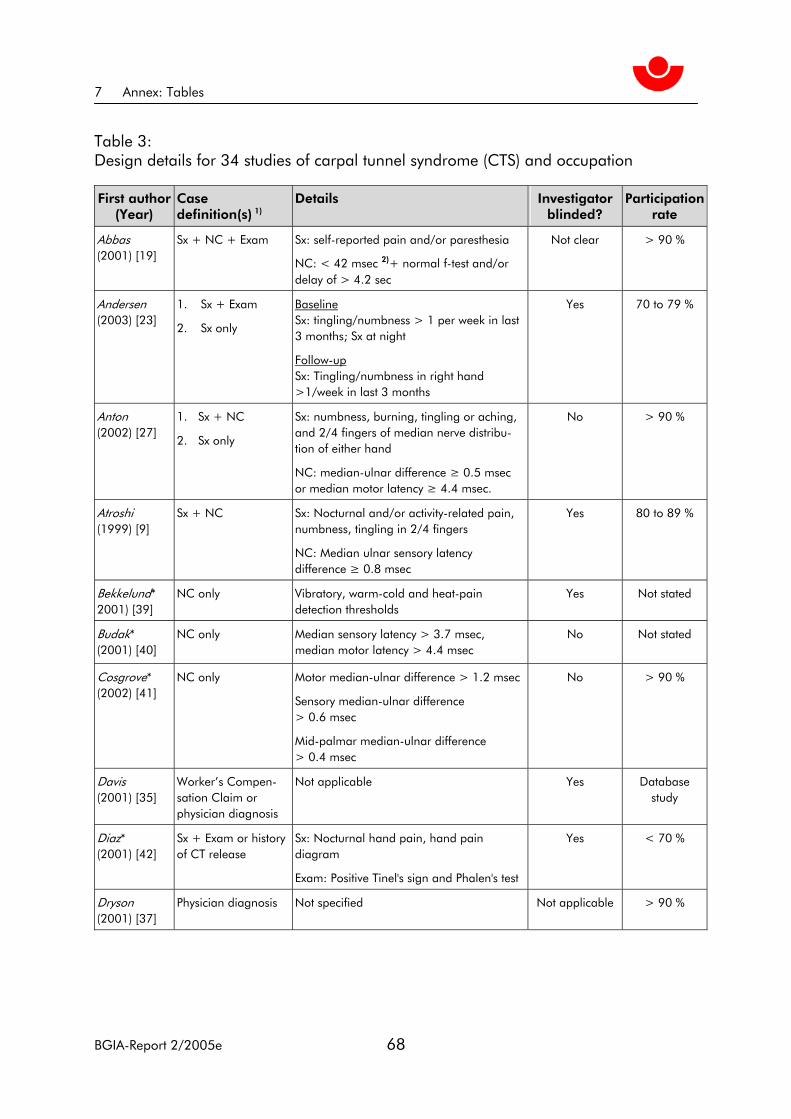
7 Annex: Tables
Table 3: Design details for 34 studies of carpal tunnel syndrome (CTS) and occupation
First author (Year)
Case definition(s) 1)
Details Investigator blinded?
Participation rate
Abbas (2001) [19]
Sx + NC + Exam Sx: self-reported pain and/or paresthesia
NC: < 42 msec 2)+ normal f-test and/or delay of > 4.2 sec
Not clear > 90 %
Andersen (2003) [23]
1. Sx + Exam
2. Sx only
Baseline Sx: tingling/numbness > 1 per week in last 3 months; Sx at night
Follow-up Sx: Tingling/numbness in right hand >1/week in last 3 months
Yes 70 to 79 %
Anton (2002) [27]
1. Sx + NC
2. Sx only
Sx: numbness, burning, tingling or aching, and 2/4 fingers of median nerve distribu-tion of either hand
NC: median-ulnar difference ≥ 0.5 msec or median motor latency ≥ 4.4 msec.
No > 90 %
Atroshi (1999) [9]
Sx + NC Sx: Nocturnal and/or activity-related pain, numbness, tingling in 2/4 fingers
NC: Median ulnar sensory latency difference ≥ 0.8 msec
Yes 80 to 89 %
Bekkelund* 2001) [39]
NC only Vibratory, warm-cold and heat-pain detection thresholds
Yes Not stated
Budak* (2001) [40]
NC only Median sensory latency > 3.7 msec, median motor latency > 4.4 msec
No Not stated
Cosgrove* (2002) [41]
NC only Motor median-ulnar difference > 1.2 msec
Sensory median-ulnar difference > 0.6 msec
Mid-palmar median-ulnar difference > 0.4 msec
No > 90 %
Davis (2001) [35]
Worker’s Compen-sation Claim or physician diagnosis
Not applicable Yes Database study
Diaz* (2001) [42]
Sx + Exam or history of CT release
Sx: Nocturnal hand pain, hand pain diagram
Exam: Positive Tinel's sign and Phalen's test
Yes < 70 %
Dryson (2001) [37]
Physician diagnosis Not specified Not applicable > 90 %
BGIA-Report 2/2005e 68

7 Annex: Tables
Table 3 (continued):
First author (Year)
Case definition(s) 1)
Details Investigator blinded?
Participation rate
Frost (1998) [17]
Sx + NC or
prior CT release
Sx: ≥ 1 night per week, ≥ 3 fingers
NC: Distal-motor latency ≥ 4.3 msec or conduction velocity < 50 msec for at least 1 of sensory median finger nerves and sensory conduction velocity ≥ 50 msec in ulnar nerve
Yes 70 to 79 %
Gorsche (1999) [25]
Sx + Exam Sx: Pain/numbness lasting > 1 week and positive Tinel's or Phalen's sign
No 70 to 79 %
Hamann (2001) [10]
Sx + NC NC: Median latency ≥ 0.5 msec or 0.8 msec
Sx: Numbness, tingling or pain
No Not stated
Hess* (1997) [43]
Sx only Numbness/tingling/pain in fingers, hands, wrists or arms and decreased hand strength and upper back pain and neck and/or shoulder pain
Yes < 70 %
Kutluhan (2001) [30]
NC only Mild: Normal sensory conduction, but > 0.5 msec distal latency difference, median-ulnar sensory nerve
Moderate: Slowing of median sensory conduction
Severe: Slowing of median sensory conduc-tion and delayed motor distal latency.
No Not stated
Lalumandier (2000) [28]
Sx only ≥ 3 of: Pain at night, tingling, clumsiness, activity-induced symptoms, and swelling
No 80 to 89 %
Lalumandier (2001) [29]
Sx only ≥ 3 of: Pain at night, tingling, clumsiness, activity-induced symptoms, and swelling
No > 90 %
Latko (1999) [18]
1. Sx only 2. NC only 3. Combination
Sx: Hand diagram
NC: Ulnar-median nerve latency difference ≥ 0.5 msec
Yes Not stated
Leclerc (1998) [32]
Exam or previous NC Exam: Positive Tinel's sign or Phalen's test
No Not stated
Leclerc (2001) [33]
Exam Sx: Not specified
Exam: Positive Tinel's sign or Phalen's test
No 80 to 89 %
Liu (2003) [31]
NC only Median digit II and ulnar digit V sensory latency must differ by greater than 0.4 ms; median distal motor latency must be greater than 4.0 ms; median sensory velocity must be less than 40 m/sec
No Not stated
BGIA-Report 2/2005e 69

7 Annex: Tables
Table 3 (continued):
First author (Year)
Case definition(s) 1)
Details Investigator blinded?
Participation rate
Nathan (2002) [20]
Sx + NC
OR prior CT release
Sx: Presence of hand/wrist symptoms, undefined
NC: Not specified
No < 70 %
Roquelaure (1997) [16]
≥3 of: Sx, NC,
Exam, prior CT release
Sx: ≥3 of tingling, pain/numbness, worse at night ≥ 20 times or lasting ≥ 3 weeks
Exam: Positive Tinel's and Phalen's or hypoesthesia
NC: Sensory or motor conduction velocity < 40 msec
Yes Not stated
Roquelaure (2001) [26]
Sx and/or Exam Sx: Paresthesia, pain, or numbness ≥ 1 week or ≥ 10 times during the last year
Exam: Tinel's or Phalen's or diminished sensation
Not stated 80 to 89 %
Rosecrance (2002) [21]
Sx + NC Sx: Numbness, tingling, pain and/or burning
NC: Median mononeuropathy latency difference ≥ 0.5 msec
Yes 80 to 90 %
Rossignol (1997) [36]
Surgery for CTS release
Not applicable No < 70 %
Silverstein (1998) [34]
Worker’s Compensation claim
Not applicable Not applicable Database study
Stevens (2001) [11]
1. NC only
2. Sx + NC
Sx: Awakened by paresthesia; hand goes to sleep; relieved by shaking
NC: Median mid-palmar latency > 2.2 msec or median-ulnar palmar latency difference > 0.4 msec
Yes 80 to 89 %
Thomsen (2002) [22]
Sx + NC
Sx only
Sx: Tingling, “CTS symptoms reported”
NC: Sensory conduction velocity < 50 msec or abnormal median-distal motor latency vs. controls
Yes 70 to 79 %
Werner (1997) [14]
Sx + NC Sx: Pain, numbness, tingling, or burning in the hand or fingers > 1 week or 3+ times since initial screening
NC: Median sensory latency ≥ 0.5 msec or ≥ 0.8 msec
Unclear 70 to 79 %
Werner (1998) [24]
Sx + NC Sx: Not specified
NC: Median sensory evoked response ≥ 0.5 msec or ≥ 0.8 msec
Unclear Not stated
BGIA-Report 2/2005e 70

7 Annex: Tables
Table 3 (continued):
First author (Year)
Case definition(s) 1)
Details Investigator blinded?
Participation rate
Werner (2002) [13]
Sx + NC Sx: Numbness, tingling, or pain; hand diagram
NC: Median sensory latency ≥ 0.5 msec or > 0.8 msec
No Not stated
Yagev* (2001) [44]
NC Only Median sensory latency ≥ 3.9 msec or motor latency ≥ 4.5 msec
Yes Not stated
Zetterberg* (1999) [45]
Sx + Exam Sx: Numbness
Exam: Tinel's or Phalen's test
No < 70 %
1: Sx = Median nerve symptoms; NC = Nerve conduction; Exam = clinical examination, possibly including Tinel's sign or Phalen's test. Case definitions described, not necessarily reported in analyses.
2: msec = milliseconds
* Study was rated inadequate for inclusion in critical review.
BGIA-Report 2/2005e 71

7 Annex: Tables
Table 4: Exposure assessments used in 34 studies of occupation and carpal tunnel syndrome (CTS)
Exposure First author (Year) Classi-
fication Assessment method Metrics
Comment
Abbas (2001) [19]
Qualitative 1. Observation, job task analysis
2. Industrial Hygiene – ergonomic measurement at the individual level
1. Likelihood of exposure based on group level measurement
2. Ranking based on individual measurements
Jobs were characterized according to weight lifted, pace, and grip type needed. Work stations were measured for each person. Years of work also used as an exposure measure.
Andersen (2003) [23]
Quantitative Self-report via questionnaire/interview
Time in task Tasks included overall computer use and mouse and keyboard use sepa-rately.
Anton (2002) [27]
Semi-quantitative
Self-report via questionnaire/interview
Time in task Clinical practice variables included years of work as dental hygienist, days worked per week, patients per day. Time spent doing specific dental procedures (probing, scaling, flossing, etc.) was also quantified.
Atroshi (1999) [9]
Semi-quantitative
Self-report via questionnaire/interview
Job category (white- or blue-collar) and job task descriptors
Job task descriptors were use of excessive hand force, excessive wrist flexion/ extension, repetitive hand or wrist motion, and vibra-tory tool use.
Bekkelund* (2001) [39]
Qualitative Cleaners compared to secretaries
Years at work Both cleaners and secre-taries worked at least 19 hours/week for 3 or more consecutive years.
Budak* (2001) [40]
Qualitative Weavers compared to non-weavers
Mean years worked by weavers was 8.4 years.
Cosgrove* (2002) [41]
Semi-quantitative
Self-report via questionnaire/interview
Likelihood of exposure based on group level measurement
Used the Silverstein method to classify jobs into force/repetition categories.
Davis (2001) [35]
Qualitative Industry sector and occupational category
Classification of industry and occupation based on information in physician case reports and workers’ compensation records.
BGIA-Report 2/2005e 72

7 Annex: Tables
Table 4 (continued):
Exposure First author (Year) Classi-
fication Assessment method Metrics
Comment
Diaz* (2001) [42]
Qualitative Self-report via questionnaire/interview
Likelihood of exposure based on group level measurement
Nurse anaesthetists vs. operating room nurses
Dryson (2001) [37]
Qualitative Occupational group Occupational groups were managers, professionals, technicians, clerical, sales/service, agriculture, trades, plant/machine operators, and labourers.
Frost (1998) [17]
Qualitative 1. Self-report via questionnaire/interview
2. Observation, job task analysis
1. Likelihood of exposure based on group level measurement
2. Frequency of wrist movements out of neutral position
Slaughterhouse vs. chemical factory employees
Gorsche (1999) [25]
Qualitative Self-report via questionnaire/interview
Likelihood of exposure based on group level measurement
Unclear: exposure assess-ment might have been based on job title. These included production workers, supervisors, and administrative staff.
Hamann (2001)
Semi-quantitative
Self-report via questionnaire/interview
Time in task Hours worked per week and weeks worked per year
Hess* (1997) [43]
Semi-quantitative
Self-report via questionnaire/interview
Mean perceived stress score (PSS) and percep-tion of having ergonomi-cally correct work station (Likert scale).
Other variables were perceived knowledge of prevention of repetitive strain injuries and whether was action taken to improve workstation.
Kutluhan (2001) [30]
Semi-quantitative
1. Occupational group
2. Self-report via questionnaire/interview
Employment duration, amount produced per year, and began work
Carpet weavers vs. housewives
Laluman-dier (2000) [28]
Qualitative 1. Occupational group
2. Self-report via questionnaire/interview
1. Dental subspecialties
2. Job characteristics
Job characteristics included number of patients with heavy calculus, job satisfac-tion, and time in practice.
Lalumandier (2001) [29]
- Qualitative Self-report via questionnaire/interview
Likelihood of exposure based on group level measurement
BGIA-Report 2/2005e 73
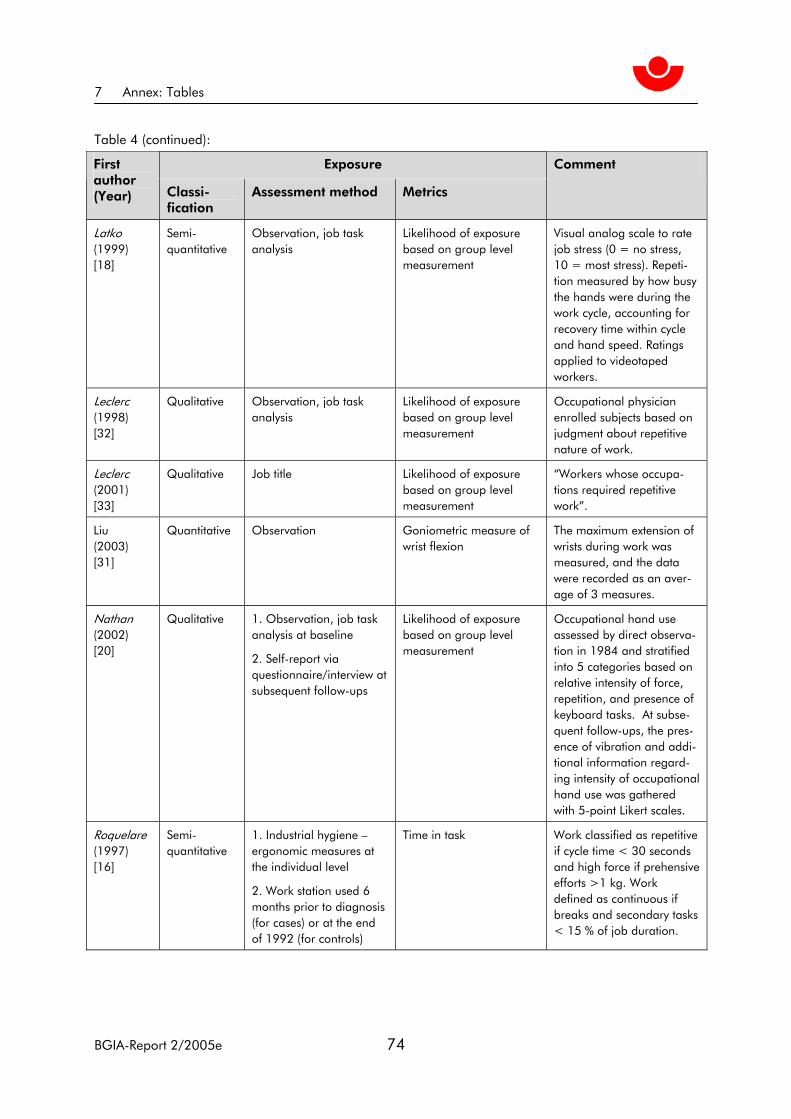
7 Annex: Tables
Table 4 (continued):
Exposure First author (Year) Classi-
fication Assessment method Metrics
Comment
Latko (1999) [18]
Semi-quantitative
Observation, job task analysis
Likelihood of exposure based on group level measurement
Visual analog scale to rate job stress (0 = no stress, 10 = most stress). Repeti-tion measured by how busy the hands were during the work cycle, accounting for recovery time within cycle and hand speed. Ratings applied to videotaped workers.
Leclerc (1998) [32]
Qualitative Observation, job task analysis
Likelihood of exposure based on group level measurement
Occupational physician enrolled subjects based on judgment about repetitive nature of work.
Leclerc (2001) [33]
Qualitative Job title Likelihood of exposure based on group level measurement
“Workers whose occupa-tions required repetitive work”.
Liu(2003) [31]
Quantitative Observation Goniometric measure of wrist flexion
The maximum extension of wrists during work was measured, and the data were recorded as an aver-age of 3 measures.
Nathan (2002) [20]
Qualitative 1. Observation, job task analysis at baseline
2. Self-report via questionnaire/interview at subsequent follow-ups
Likelihood of exposure based on group level measurement
Occupational hand use assessed by direct observa-tion in 1984 and stratified into 5 categories based on relative intensity of force, repetition, and presence of keyboard tasks. At subse-quent follow-ups, the pres-ence of vibration and addi-tional information regard-ing intensity of occupational hand use was gathered with 5-point Likert scales.
Roquelare (1997) [16]
Semi-quantitative
1. Industrial hygiene – ergonomic measures at the individual level
2. Work station used 6 months prior to diagnosis (for cases) or at the end of 1992 (for controls)
Time in task Work classified as repetitive if cycle time < 30 seconds and high force if prehensive efforts >1 kg. Work defined as continuous if breaks and secondary tasks < 15 % of job duration.
BGIA-Report 2/2005e 74

7 Annex: Tables
Table 4 (continued):
Exposure First author (Year) Classi-
fication Assessment method Metrics
Comment
Roquelare (2001) [26]
Semi-Quantitative
1. Self-report via questionnaire/interview
2. Industrial hygiene – ergonomic measures at the individual level
Ranking based on indi-vidual measurements
Ergonomic factors included job rotation, work cycle time, repetitive movement patterns, rapid trigger movements, hand vibra-tion, and wrist flexion/ extension.
Rosecrance (2002) [21]
Qualitative 1. Job title
2. Self-report via questionnaire/interview
1.Likelihood of exposure based on group level measurement
2. Perceived contribution of 15 job factors to musculoskeletal injury (0-10 scale)
Main comparison across the following apprentice trades: electricians, sheet metal workers, operating engineers, and plumbers.
Rossingnol (1997) [36]
Qualitative Self-report via questionnaire/interview
Likelihood of exposure based on group level measurement
Classified case occupation via interview. Denominators for each occupation from Canadian Census.
Silverstein (1998) [34]
Qualitative Occupation and industry as reported by physician
Likelihood of exposure based on group level measurement
Denominators for each occupation from Washing-ton State Department of Labor and Industries.
Stevens (2001) [11]
Semi-quantitative
Self-report via questionnaire/interview
Time in task Occupational variables included hours/day, years using keyboard and type-writer, and frequency of mouse use.
Thomsen (2002) [22]
Semi-quantitative
1. Self-report via questionnaire/interview
2. Observation, job task analysis
Likelihood of exposure based on group level measurement
Jobs at one bank and two postal centers classified as repetitive, forceful, repeti-tive and forceful, or varied.
Werner (1997) [14]
Semi-quantitative
Industrial hygiene – ergo-nomic measurement at the group level
Likelihood of exposure based on group level measurement
Employees in jobs meant to represent the range of tasks within each industry were recruited into the study. The jobs were videotaped and the tapes assessed by an Industrial hygiene team for levels of repetition.
BGIA-Report 2/2005e 75

7 Annex: Tables
Table 4 (continued):
Exposure First author (Year) Classi-
fication Assessment method Metrics
Comment
Werner (1998) [24]
Qualitative 1. Industrial hygiene – ergonomic measurement at the group level
2. Self-report via questionnaire/interview
Likelihood of exposure based on group level measurement
Industrial engineers and hygienists rated repetition, hand force, wrist/forearm posture, and contact stress after viewing videotape of each job category. Ratings were made on a visual analog scale.
Werner (2002) [13]
Qualitative Self-report via questionnaire/interview
Time in task Years as hygienist, hours/week and weeks/year worked.
Yagev* (2001) [44]
Qualitative Self-report via questionnaire/interview
Likelihood of exposure based on group level measurement
Jobs were categorized as high/low force and high/ low repetition. The criteria for categorization was not detailed.
Zetterberg* (1999) [45]
Qualitative 1. Self-report via questionnaire/interview
2. Observation, job task analysis
Likelihood of exposure based on group level measurement
Details of the job/ergo-nomic factors assessed were not provided.
* Study was rated inadequate for inclusion in critical review.
BGIA-Report 2/2005e 76

7 Annex: Tables
Table 5: Covariate data collected by the authors of 34 studies of occupation and carpal tunnel syndrome (CTS)
Covariates collected1 First author (Year)
Ag
e
Gen
der
BMI2
Med
ical
fact
ors
3
Exp
osu
re
leve
l
Task
Du
ratio
n o
f em
plo
ymen
t
Oth
er4
Abbas (2001) [19]
√ √ √ √ √ Marital status, job satisfaction, posture, amount of production
Andersen (2003) [23]
√ √ √ √ √ √ Psychosocial factors, leisure activities, smoking
Anton (2002) [27]
√ √ √ √ √ √ √ Psychosocial factors at work, handedness, hobbies, leisure activities, ergonomic factors; restricted to women
Atroshi (1999) [9]
√ √ √ √ Handedness, social status, education, exercise, smoking, employment activities
Bekkelund* (2001) [39]
√ √ Skin temperature at testing, alcohol consumption, hand grip strength; restricted to women
Budak* (2001) [40]
√ Restricted to women with no pre-existing medical conditions
Cosgrove* (2001) [41]
√ √ √ √ √ Grip strength, leisure activities
Davis (2001) [35]
√ √ Industry sector, occupation
Diaz* (2001) [42]
√ √ √ √ Restricted to non-obese women, no endocrine disorders
Dryson (2001) [37]
√ Occupation
Frost (1998) [17]
√ √ √ √ √ √ √ Smoking, handedness
Gorsche (1999) [25]
√ √ √ √ √ √ Alcohol, pregnancy, handed-ness, ethnicity, leisure activities
Hamann (2001) [10]
√ √ √ √ √ √ Hours worked per week and year
Hess* (1997) [43]
√ √ Ethnicity, education, and dependents
BGIA-Report 2/2005e 77

7 Annex: Tables
Table 5 (continued):
Covariates collected1 First author (Year)
Ag
e
Gen
der
BMI2
Med
ical
fact
ors
3
Exp
osu
re
leve
l
Task
Du
ratio
n o
f em
plo
ymen
t
Oth
er4
Kutluhan (2001) [30]
√ √ √ Restricted to women, amount of work produced per year
Lalumandier (2000) [28]
√ √ √ √ √ Ethnicity, civilian vs. military status
Lalumandier (2001) [29]
√ √ √ Civilian vs. military status
Latko (1999) [18]
√ √ √ √ √ √ Race, education, tobacco use, ratio of wrist depth to width, history of acute injury
Leclerc (1998) [32]
√ √ √ √ √ √ Education, psychosocial work factors
Leclerc (2001) [33]
√ √ √ √ √ √ √ Smoking, psychological symptoms, psychosocial work factors, posture
Liu (2003) [31]
√ √ √ √ Dominant hand
Nathan (2002) [20]
√ √ √ √ √ √ Leisure activity, exercise habit, smoking, race
Roquelaure (1997) [16]
√ √ √ √ √ √ √ Smoking, education, number children in household, alcohol, handedness, non-occupational activities
Roquelaure (2001) [26]
√ √ √ √ √ √ √ Psychosocial, ergonomic factors, leisure activity
Rosecrance (2002) [21]
√ √ √ √ √ √ √ Trade, apprentice level, education, work history
Rossignol (1997) [36]
√ √ Occupational category
Silverstein (1998) [34]
√ √ Industrial classification
Stevens (2001) [11]
√ √ √ √ Occupation, handedness
Thomsen (2002) [22]
√ √ √ √ √ √ Hours worked per week
Werner (1997) [14]
√ √ √ √ √ Handedness, duration of follow-up
BGIA-Report 2/2005e 78
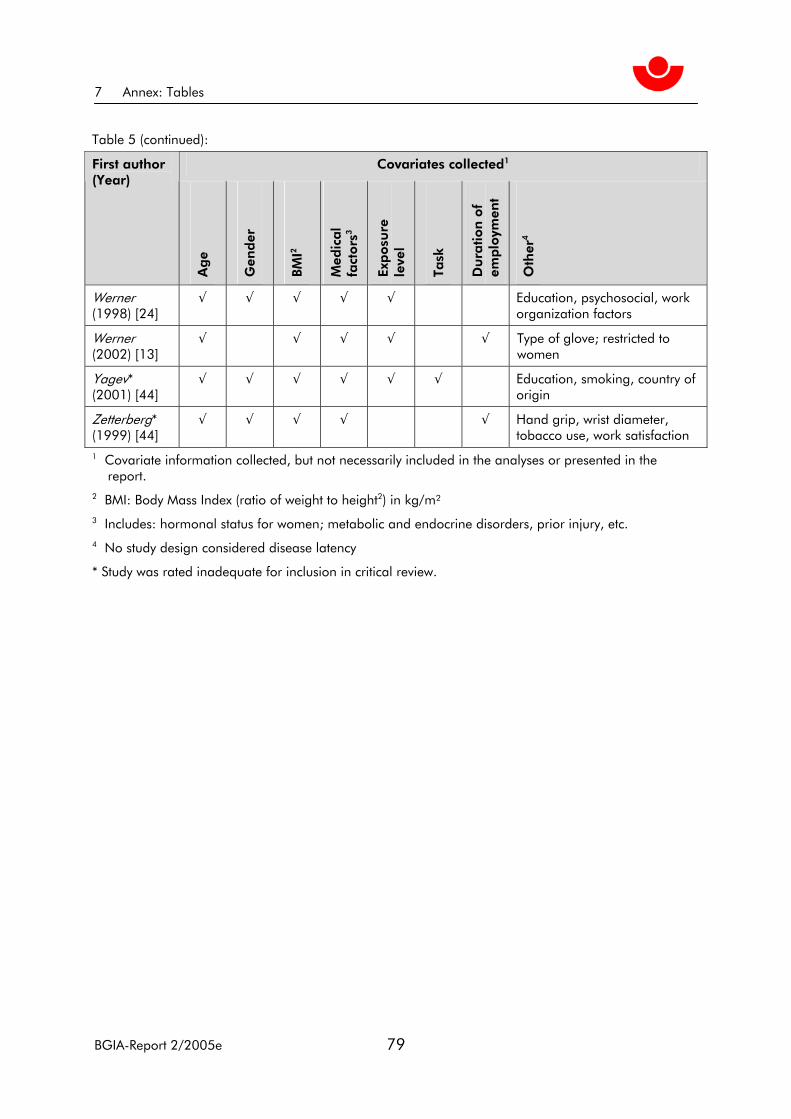
7 Annex: Tables
Table 5 (continued):
Covariates collected1 First author (Year)
Ag
e
Gen
der
BMI2
Med
ical
fact
ors
3
Exp
osu
re
leve
l
Task
Du
ratio
n o
f em
plo
ymen
t
Oth
er4
Werner (1998) [24]
√ √ √ √ √ Education, psychosocial, work organization factors
Werner (2002) [13]
√ √ √ √ √ Type of glove; restricted to women
Yagev* (2001) [44]
√ √ √ √ √ √ Education, smoking, country of origin
Zetterberg* (1999) [44]
√ √ √ √ √ Hand grip, wrist diameter, tobacco use, work satisfaction
1 Covariate information collected, but not necessarily included in the analyses or presented in the report. 2 BMI: Body Mass Index (ratio of weight to height2) in kg/m² 3 Includes: hormonal status for women; metabolic and endocrine disorders, prior injury, etc. 4 No study design considered disease latency
* Study was rated inadequate for inclusion in critical review.
BGIA-Report 2/2005e 79

7 Annex: Tables
Table 6: Overall quality assessment of 34 studies of occupation and carpal tunnel syndrome (CTS)
Ascertain-ment of 1)
Likelihood of bias First author (Year)
Case
s
Exp
osu
re
Selection Information Residual confounding
Overall quality
Abbas (2001) [19]
A A Possible: High participation by all invited, but no information about selection for invita-tion
Unlikely Possible: Gender included in the model, but too few men in the analysis group
Adequate
Andersen (2003) [23]
L A Possible: Subjects without symptoms at baseline most likely to be lost to follow-up
Possible: Recall bias, if those with symptoms report computer and mouse use more than those without.
Unlikely Adequate
Anton (2002) [27]
L A Possible: Partici-pants recruited at a conference on ergonomics
Possible: Conference was about ergonom-ics
Likely: No multi-variate analyses presented.
Limited: Small number of cases, no control or assess-ment of confound-ing.
Atroshi (1999) [9]
A L Unlikely Unlikely Possible: Mainly presented unad-justed results
Limited: Exposure assessment limited to blue-/white-collar job. No adjusted results presented.
Bekkelund* (2001) [39]
L L Possible: No data on participation rates
Unlikely Likely: Differences in tests not adjusted for age, BMI, temperature, or wrist biometrics
Inadequate: Out-come was nerve function, not CTS.
Budak* (2001) [40]
A L Possible: Authors did not describe how participants were identified or selected.
Unlikely Inadequate: no consideration of confounding in the analysis
Inadequate: Out-come was not CTS. Control group was not described.
BGIA-Report 2/2005e 80

7 Annex: Tables
Table 6 (continued):
Ascertain-ment of 1)
Likelihood of bias First author (Year)
Case
s
Exp
osu
re
Selection Information Residual confounding
Overall quality
Cosgrove* (2002) [41]
I A Unlikely Possible: Signifi-cant measure-ment problems including: large hands, tempera-ture variations, rough/calloused hands
Possible: Information on possible confounders not available
Inadequate: Sig-nificant measure-ment problems and all subjects were claimants for Worker’s Compen-sation.
Davis (2001) [35]
L L Possible: Cases likely to be severe, requiring special care or > 5 days lost from work.
Unlikely Unlikely Limited: Descriptive analysis only
Diaz* (2001) [42]
L I Possible: Non-responder bias possible. There is no information on participation rate.
Possible: Study initiated in response to CTS cluster
Likely: no con-founders consid-ered in analysis
Inadequate: Cross-sectional study, unclear why or nurses selected as comparison group. No consideration of confounding and incorrect calculations.
Dryson (2001) [37]
L A Unlikely Possible: Sub-jects identified in an occupational clinic.
Likely: No adjust-ment attempted, no information on potential con-founders or effect modifiers.
Limited: Exploratory research that exam-ined the distribution of broad industry groups among patients in an occu-pational clinic.
Frost (1998) [17]
A A Possible: Fairly low response rate, differential by group
Possible: No formal assess-ment of work exposures among compari-son group
Possible: Com-parison group was older and had longer employ-ment history.
Adequate
BGIA-Report 2/2005e 81

7 Annex: Tables
Table 6 (continued):
Ascertain-ment of 1)
Likelihood of bias First author (Year)
Case
s
Exp
osu
re
Selection Information Residual confounding
Overall quality
Gorsche (1999) [25]
L L Possible: Differen-tial participation by exposure status. Significant loss to follow-up may be more likely to include injured workers.
Unlikely Unlikely Limited: Potential for bias and con-founding limit confi-dence in findings; errors in quantifying the study population and methods
Hamann (2001) [10]
A A Unlikely Unlikely Likely: only bivariate analyses conducted
Limited: External validity question-able; no multivariate analysis conducted
Hess* (1997) [43]
L I Likely: poor res-ponse rate (44 %)
Unlikely Unlikely Inadequate: Flawed study with poor case definition
Kutluhan (2001) [30]
A L Possible: response rate for carpet workers and source and re-sponse rate of controls unknown
Possible: Subjec-tive CTS measu-rement
Likely: Not clear when covariates adjusted and to what effect
Limited: Did not use physical exam findings and control of confounders not adequately described
Lalumandier (2000) [28]
L L Unlikely Unlikely Likely: descriptive analysis only
Limited: No consid-eration of confound-ing in analysis, though covariate data were collected
Lalumandier (2001) [29]
L L Unlikely Unlikely Likely: descriptive analysis only
Limited: Exposure assessed by job title: case ascertainment by symptom count
Latko (1999) [18]
A A Possible: Participa-tion limited to those with 6+ months work which could im-pose survivor bias
Unlikely Unlikely Adequate
BGIA-Report 2/2005e 82

7 Annex: Tables
Table 6 (continued):
Ascertain-ment of 1)
Likelihood of bias First author (Year)
Case
s
Exp
osu
re
Selection Information Residual confounding
Overall quality
Leclerc (1998) [32]
A A Possible: Occupa-tional physician chose cases and controls based on estimated work repetitiveness.
Possible: The same physician who recruited subjects per-formed the exam and interview.
Possible: Only bivariate analysis presented
Adequate
Leclerc (2001) [33]
L A Unlikely Unlikely Possible: Only bivariate analysis presented
Adequate
Liu (2003) [31]
A A Unlikely Possible: The same physician who recruited subjects per-formed the measures.
Possible: Only bivariate analysis presented
Limited: No consid-eration of confound-ing in analysis, though covariate data were collected
Nathan (2002) [20]
L A Possible: Differen-tial loss to follow-up
Unlikely Possible: Small number of cases suggests the analyses were underpowered.
Adequate
Roquelaure (1997) [16]
A A Unlikely Unlikely Unlikely Adequate
Roquelaure (2001) [26]
A L Possible: Average time on the job was > 20 years, possible survivor bias
Unlikely Possible: Only bivariate analyses presented
Limited: Excellent exposure measures but little variability in population
Rosecrance (2002) [21]
A L Unlikely Unlikely Unlikely Adequate
Rossignol (1997) [36]
L A Unlikely Unlikely Possible: Exposure category based on broad job catego-ries, not tasks.
Adequate
BGIA-Report 2/2005e 83

7 Annex: Tables
Table 6 (continued):
Ascertain-ment of 1)
Likelihood of bias First author (Year)
Case
s
Exp
osu
re
Selection Information Residual confounding
Overall quality
Silverstein (1998) [34]
L A Unlikely Unlikely Likely: No con-trolled analyses presented
Limited: Provides unbiased estimate of the number of Worker’s Compen-sation claims
Stevens (2001) [11]
L L Possible: Exclusion criteria not well-explained
Possible: Unlike-ly explanation for results
Likely: No control of potential con-founders
Limited: No con-trolled analyses, prevalence esti-mates only; poor choice of compari-son group
Thomsen (2002) [22]
A A Unlikely Unlikely Possible: Adequate for prevalent cases but not for incident cases
Adequate
Werner (1997) [14]
A L Possible: Follow-up rates differen-tial by site and higher if abnormal NC observed at baseline; follow-up symptoms were self-reported.
Unlikely Likely: Analyses were mainly uni-variate and the model was uncon-ditional in spite of matched design.
Limited: Analyses and sample size were inadequate and follow-up may have been too short for some subjects (range 10 to 24 months).
Werner (1998) [24]
A A Possible: Volunteer rate was 45 to 89 % by site. Unclear how recruitment was handled.
Unlikely Likely: Description of modeling un-clear and unable to determine how covariates were coded
Limited: Description of modeling unclear and unable to de-termine how covari-ates were coded
Werner (2002) [13]
A L Possible: Unknown participation rate or criteria
Possible: Tests conducted in dominant hand only – could underestimate CTS.
Likely: Unadjusted prevalence esti-mates only.
Limited: Under-powered, no ad-justed or stratified analyses; attempted logistic regression on only 9 cases
BGIA-Report 2/2005e 84
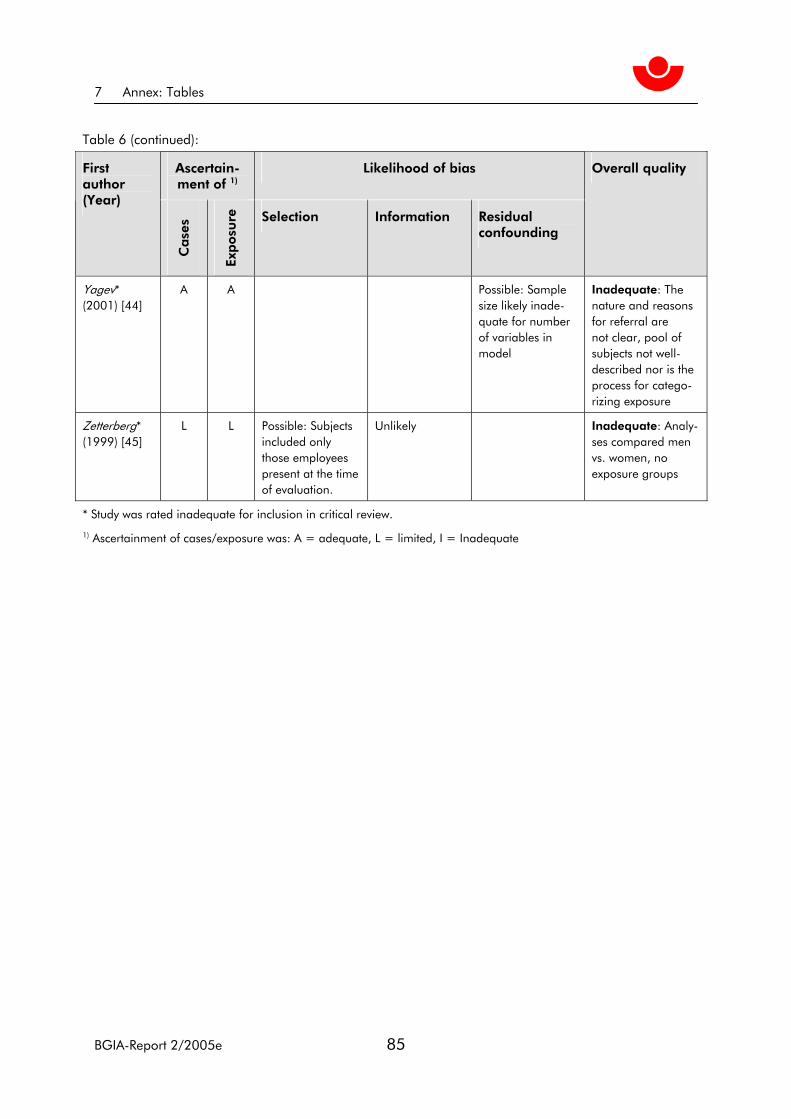
7 Annex: Tables
Table 6 (continued):
Ascertain-ment of 1)
Likelihood of bias First author (Year)
Case
s
Exp
osu
re
Selection Information Residual confounding
Overall quality
Yagev* (2001) [44]
A A Possible: Sample size likely inade-quate for number of variables in model
Inadequate: The nature and reasons for referral are not clear, pool of subjects not well-described nor is the process for catego-rizing exposure
Zetterberg* (1999) [45]
L L Possible: Subjects included only those employees present at the time of evaluation.
Unlikely Inadequate: Analy-ses compared men vs. women, no exposure groups
* Study was rated inadequate for inclusion in critical review.
1) Ascertainment of cases/exposure was: A = adequate, L = limited, I = Inadequate
BGIA-Report 2/2005e 85

7 Annex: Tables
Table 7: Summary of adjusted estimates of effect of work exposures from 11 studies rated as “adequate”
Exposure First author (Year)
Design Size1 Case definition2
Comparison Effect estimate
Force
> 1 kg Roquelaure (1997) [16]
Case-control
130 (65 cases)
Sx+(NC or exam) < 1 kg OR = 9.0 (CI: 2.4, 33.4)
Consistency rating 1 to 5
Nathan (2002) [20]
Prospective (11 years)
471 Sx+NC Increment per rating unit
OR = 0.75 (CI: 0.21, 2.72)
Hours/week Thomsen (2002) [22]
Prospective (6 to 10 months)
731 Sx+NC+Exam Symptoms
Increment per 10 hours/week
OR = 1.41 (CI: 0.86, 2.30)
OR = 1.28 (CI: 1.08, 1.52)
Repetition
Operation ≤ 10 seconds
Roquelaure (1997) [16]
Case-control
130 (65 cases)
Sx+(NC or exam) Operation > 10 seconds
OR = 8.8 (CI: 1.8, 44.4)
Cycle 30 to 59 sec
Cycle 10 to 29 sec
Cycle < 10 sec
LeClerc (1998) [32]
Cross-sectional
1,210 Exam Cycle ≥ 1 min OR = 1.03 (CI: 0.56, 1.89)
OR = 1.33 (CI: 1.75, 2.37)
OR = 1.90 (CI: 1.04, 3.48)
10-point rating scale
Latko (1999) [18]
Cross-sectional
352 Sx+NC Symptoms NC
Increment per rating unit
OR = 1.22 (CI: 0.98, 1.53)
OR = 1.16 (CI: 1.00, 1.34)
Not associated
Consistency rating 1 to 5
Nathan (2002) [20]
Prospective (11 years)
471 Sx+NC Increment per rating unit
OR = 1.14 (CI: 0.59, 2.20)
No variability Hours/week
Thomsen (2002) [22]
Prospective (6 to 10 months)
731 Sx+NC+Exam
Varied work
Increment per 10 hours/week
OR = 1.84 (CI: 1.06, 3.19)
OR = 1.21 (CI: 1.01, 1.46)
Moderate-major problem
Rosecrance (2002) [21]
Cross-sectional
1,115 Sx+NC No or minor problem
OR = 1.54 (0.92, 2.56)
Vibration
None Nathan (2002) [20]
Prospective (11 years)
471 Sx+NC Any OR = 3.73 (CI: 1.04, 13.33)
BGIA-Report 2/2005e 86

7 Annex: Tables
Table 7 (continued):
Exposure First author (Year)
Design Size1 Case definition2
Comparison Effect estimate
Tighten with force
Any LeClerc (2001) [33]
Prospective (3 years)
598 Exam None OR = 4.09 (CI: 1.43, 11.7) Men only
Grip type
Precision Intermediate
Abbas (2001) [19]
Cross-sectional
104 Sx+NC+Exam Power grip OR = 6.52 (CI: 1.08, 39)
OR = 1.98 (CI: 0.32, 11.91)
Changes in activity
< 15 % of work-time
Roquelaure (1997) [16]
Case-control
130 (65 cases)
Sx+(NC or exam) ≥15 % of work-time
OR = 6.0 (CI: 1.8, 20.2)
Job rotation
None Roquelaure (1997) [16]
Case-control
130 (65 cases)
Sx+(NC or exam) Any OR = 6.3 (CI: 2.1, 21.2)
Manual workstation supply
Yes Roquelaure (1997) [16]
Case-control
130 (65 cases)
Sx+(NC or exam) No OR = 5.0 (CI:2.2, 21.2)
Job control
Low LeClerc (1998) [32]
Cross-sectional
1,210 Exam High OR = 1.43 (CI: 0.92, 2.23)
Press with hand
Yes LeClerc (1998) [32]
Cross-sectional
1,210 Exam No OR = 1.41 (CI: 0.92, 2.15)
Yes LeClerc (2001) [33]
Prospective (3 years)
598 Exam No OR = 0.28 (CI: 0.09, 0.82), Men only
Hold in position
Yes LeClerc (2001) [33]
Prospective (3 years)
598 Exam No OR = 3.59 (1.06, 12.1) Men only
BGIA-Report 2/2005e 87

7 Annex: Tables
Table 7 (continued):
Exposure First author (Year)
Design Size1 Case definition2
Comparison Effect estimate
Mouse use
2.5 to 4 hours/week
5 to 9 hours/week
10 to 19 hours/week
20 to 24 hours/week
25 to 29 hours/week
30 to 34 hours/week
> 30 hours/ week
Andersen (2003) [23]
Prospective (1 year)
173 Sx+Exam 0 to 2.4 hours/week
OR = 0.7 (CI: 0.3, 1.9)
OR = 1.9 (CI: 0.9, 1.9)
OR = 1.6 (CI: 0.8, 3.3)
OR = 2.0 (CI: 0.9, 4.2)
OR = 2.6 (CI: 1.2, 5.5)
OR = 3.2 (CI: 1.3, 7.9)
OR = 2.7 (CI: 1.2, 7.6)
Keyboard use
Consistency rating 1 to 5
Nathan (2002) [20]
Prospective (11 years)
471 Sx+NC Increment per rating unit
OR = 0.88 (CI: 0.52, 1.47)
2.5 to 4 hours/week
5 to 9 hours/week
10 to 14 hours/week
15 to 19 hours/week
> 20 hours/week
Andersen (2003) [23]
Prospective (1 year)
173 Sx+Exam 0 to 2.4 hours/week
OR = 0.9 (CI: 0.4, 1.8)
OR = 0.8 (CI: 0.4, 1.5)
OR = 1.2 (CI: 1.6, 2.5)
OR = 0.8 (CI: 0.4, 1.5)
OR = 1.4 (CI: 0.5, 4.3)
Slaughterhouse work
Any Frost (1998) [17]
Cross-sectional
1,141 Sx+(NC or Dx) Chemical workers
OR = 4.24 (CI: 1.77, 10.13)
De-boning OR = 5.53 (CI: 2.20, 13.90)
1 Total sample size
2 Case definitions: Sx+(NC or exam) = median nerve symptoms and either positive nerve conduction test or clinical exam. Sx+NC = median nerve symptoms plus positive nerve conduction test. Sx+NC+Exam = median nerve symp-toms plus positive nerve conduction test plus positive clinical exam. Symptoms = median nerve symptoms, only. Exam = positive clinical exam, only. NC = positive nerve conduction tests, only.
BGIA-Report 2/2005e 88

7 Annex: Tables
Table 8: Conclusions regarding potential risk factors for CTS (identified by the 1977 NIOSH panel [5])
Potential risk factor
Number of studies included
in review1
Case identification technique(s)
Conclusion
Repetition 6 Symptoms, clinical diagno-sis, combination techniques
Consistent, small, positive association
Force 3 Combination techniques Weak positive association, questionable validity
Vibration 1 Combination techniques Insufficient evidence
Posture 1 Symptoms, combination techniques
Insufficient evidence
1 Number of studies rated “adequate” that considered each of the potential occupational risk factors for CTS identified by the 1997 NIOSH review panel.
BGIA-Report 2/2005e 89