bhakra nangal project is something tremendous,narmada.org/misc/bhakra11.pdf“bhakra nangal project...
TRANSCRIPT


“Bhakra Nangal Project is something tremendous, something stupendous, something which shakes you up when you see it. Bhakra, the new temple of resurgent India, is the symbol of India's progress.”
Pandit Jawaharlal Nehru, during the dedication of the
Bhakra dam to the nation. 22 October 1963
“The time has come”, the Walrus said, “To talk of many things:…
The Walrus and the Carpenter, Through the Looking Glass and
What Alice Found There

This page is intentionally blank.

UNRAVELLING B H A K R A
ASSESSING THE TEMPLE OF RESURGENT INDIA
Report of a Study by Manthan Adhyayan Kendra
Badwani (M.P.)
Study Team Shripad Dharmadhikary Swathi Sheshadri Rehmat
Unravelling Bhakra: Assessing the Temple of Resurgent India
Report of a Study of the Bhakra Nangal Project
Published By: Manthan Adhyayan Kendra, Dashera Maidan Road, Badwani (M.P.) 451 551 Ph: 07290-222 857 Email: [email protected]
Study Team: Shripad Dharmadhikary Swathi Sheshadri Rehmat Layout & Maps: Rehmat Photographs: BBMB, Government of Rajasthan, Rehmat, Mukesh Jat, Alok Agrawal, Shripad Dharmadhikary and several others. Production Support: Eklavya, Bhopal
April 2005: 1000 Copies Suggested Contribution: Individuals: Rs. 150.00 Institutions: Rs. 300.00 Printed at Adarsh Printers and Publishers, Bhopal, INDIA Phone: 2555442
UNRAVELLING BHAKRA Assessing the Temple of Resurgent India
TABLE OF CONTENTS
Preface Evaluating a Legend
vii
Overview A Journey into the Realm of Bhakra
xv
Chapter 1 The Indus Basin, Irrigation Development and Bhakra Project
1
Chapter 2 Planning the Bhakra Project
15
Chapter 3 Bhakra Project: The Final Project Design and Related
Developments
33
Chapter 4 Bhakra Project: An Analysis of the Command
41
Chapter 5 Food Production, Food Security and Bhakra 1950-1966 57
Annexure I to Chapter 5
87
Chapter 6 Food Production and Bhakra Phase II - The Green Revolution
89
Chapter 7 Role of Bhakra in Food Production
101
Chapter 8 Groundwater - the Real Driving Force 111
Additional Note to Chapter 8 127 Annexure I to Chapter 8
131
ii Unravelling Bhakra
Chapter 9 Without Bhakra!
133
Chapter 10 A Dream Turns to Nightmare: Crisis in Punjab and Haryana
Agriculture
149
Chapter 11 Waterlogging and Salinisation
169
Chapter 12 Environmental Impacts 191
Additional Note to Chapter 12
206
Chapter 13 Displacement, Uprootment, Rehabilitation
The Forgotten People
207
Chapter 14 In Conclusion: Behind Bhakra, Beyond Bhakra
227
REFERENCES
References: Main 239 References from the Net 265 References: Journals 271
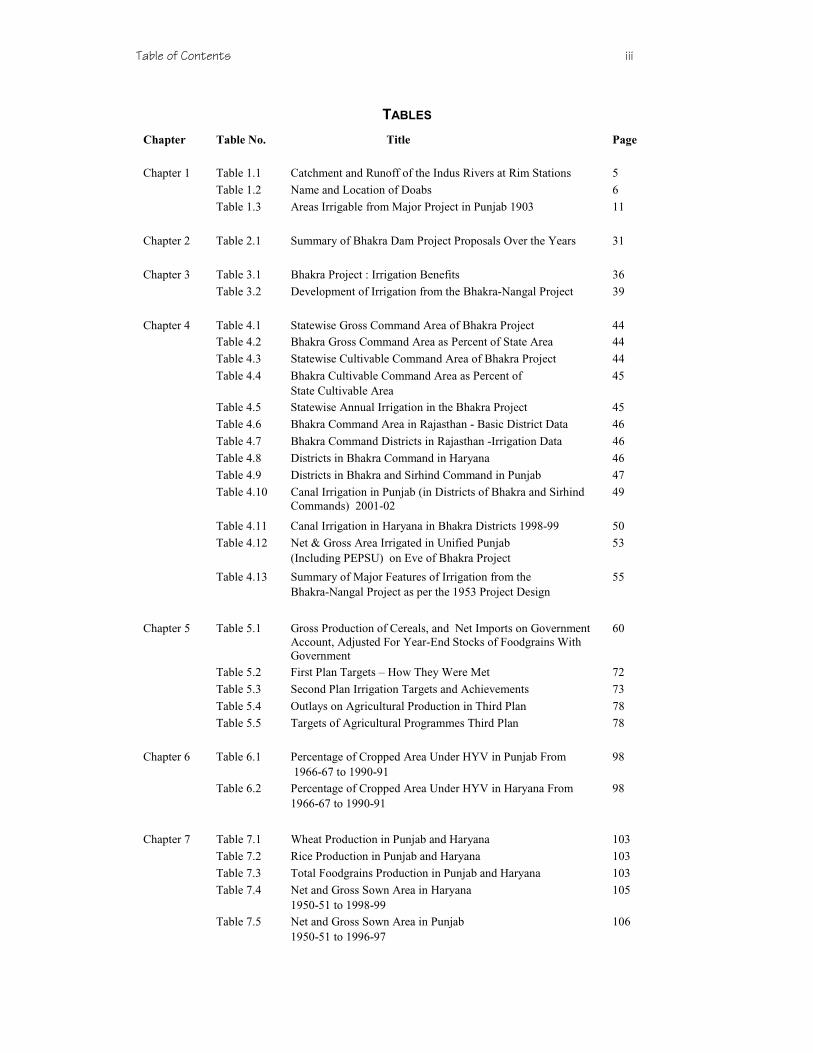
Table of Contents iii
TABLES
Chapter Table No. Title Page
Chapter 1 Table 1.1 Catchment and Runoff of the Indus Rivers at Rim Stations 5
Table 1.2 Name and Location of Doabs 6
Table 1.3 Areas Irrigable from Major Project in Punjab 1903 11
Chapter 2 Table 2.1 Summary of Bhakra Dam Project Proposals Over the Years 31
Chapter 3 Table 3.1 Bhakra Project : Irrigation Benefits 36
Table 3.2 Development of Irrigation from the Bhakra-Nangal Project 39
Chapter 4 Table 4.1 Statewise Gross Command Area of Bhakra Project 44 Table 4.2 Bhakra Gross Command Area as Percent of State Area 44
Table 4.3 Statewise Cultivable Command Area of Bhakra Project 44
Table 4.4 Bhakra Cultivable Command Area as Percent of State Cultivable Area
45
Table 4.5 Statewise Annual Irrigation in the Bhakra Project 45
Table 4.6 Bhakra Command Area in Rajasthan - Basic District Data 46
Table 4.7 Bhakra Command Districts in Rajasthan -Irrigation Data 46
Table 4.8 Districts in Bhakra Command in Haryana 46
Table 4.9 Districts in Bhakra and Sirhind Command in Punjab 47
Table 4.10 Canal Irrigation in Punjab (in Districts of Bhakra and Sirhind Commands) 2001-02
49
Table 4.11 Canal Irrigation in Haryana in Bhakra Districts 1998-99 50
Table 4.12 Net & Gross Area Irrigated in Unified Punjab (Including PEPSU) on Eve of Bhakra Project
53
Table 4.13 Summary of Major Features of Irrigation from the Bhakra-Nangal Project as per the 1953 Project Design
55
Chapter 5 Table 5.1 Gross Production of Cereals, and Net Imports on Government Account, Adjusted For Year-End Stocks of Foodgrains With Government
60
Table 5.2 First Plan Targets – How They Were Met 72
Table 5.3 Second Plan Irrigation Targets and Achievements 73
Table 5.4 Outlays on Agricultural Production in Third Plan 78
Table 5.5 Targets of Agricultural Programmes Third Plan 78
Chapter 6 Table 6.1 Percentage of Cropped Area Under HYV in Punjab From
1966-67 to 1990-91 98
Table 6.2 Percentage of Cropped Area Under HYV in Haryana From 1966-67 to 1990-91
98
Chapter 7 Table 7.1 Wheat Production in Punjab and Haryana 103
Table 7.2 Rice Production in Punjab and Haryana 103
Table 7.3 Total Foodgrains Production in Punjab and Haryana 103
Table 7.4 Net and Gross Sown Area in Haryana 1950-51 to 1998-99
105
Table 7.5 Net and Gross Sown Area in Punjab 1950-51 to 1996-97
106
iv Unravelling Bhakra
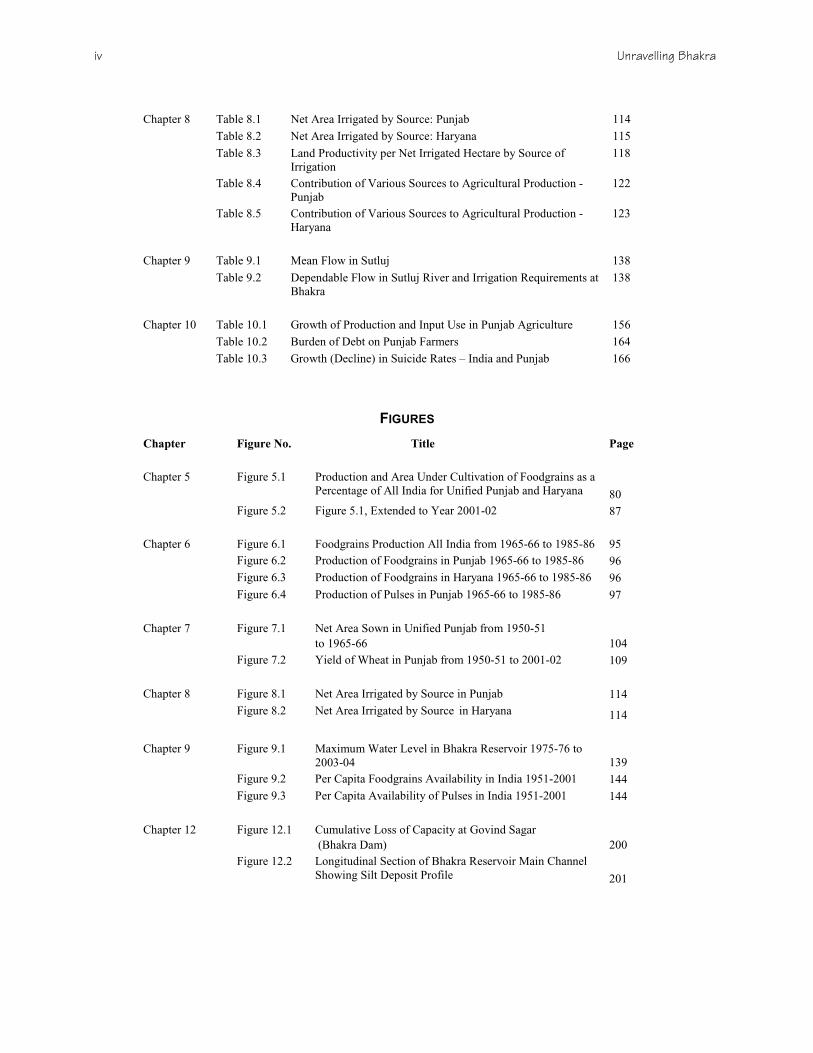
Chapter 8 Table 8.1 Net Area Irrigated by Source: Punjab 114
Table 8.2 Net Area Irrigated by Source: Haryana 115
Table 8.3 Land Productivity per Net Irrigated Hectare by Source of Irrigation
118
Table 8.4 Contribution of Various Sources to Agricultural Production - Punjab
122
Table 8.5 Contribution of Various Sources to Agricultural Production - Haryana
123
Chapter 9 Table 9.1 Mean Flow in Sutluj 138
Table 9.2 Dependable Flow in Sutluj River and Irrigation Requirements at Bhakra
138
Chapter 10 Table 10.1 Growth of Production and Input Use in Punjab Agriculture 156
Table 10.2 Burden of Debt on Punjab Farmers 164
Table 10.3 Growth (Decline) in Suicide Rates – India and Punjab 166
FIGURES
Chapter Figure No. Title Page
Chapter 5 Figure 5.1 Production and Area Under Cultivation of Foodgrains as a
Percentage of All India for Unified Punjab and Haryana 80 Figure 5.2 Figure 5.1, Extended to Year 2001-02 87 Chapter 6 Figure 6.1 Foodgrains Production All India from 1965-66 to 1985-86 95 Figure 6.2 Production of Foodgrains in Punjab 1965-66 to 1985-86 96 Figure 6.3 Production of Foodgrains in Haryana 1965-66 to 1985-86 96 Figure 6.4 Production of Pulses in Punjab 1965-66 to 1985-86 97 Chapter 7 Figure 7.1 Net Area Sown in Unified Punjab from 1950-51
to 1965-66 104 Figure 7.2 Yield of Wheat in Punjab from 1950-51 to 2001-02 109 Chapter 8 Figure 8.1 Net Area Irrigated by Source in Punjab 114 Figure 8.2 Net Area Irrigated by Source in Haryana 114 Chapter 9 Figure 9.1 Maximum Water Level in Bhakra Reservoir 1975-76 to
2003-04 139 Figure 9.2 Per Capita Foodgrains Availability in India 1951-2001 144 Figure 9.3 Per Capita Availability of Pulses in India 1951-2001 144 Chapter 12 Figure 12.1 Cumulative Loss of Capacity at Govind Sagar
(Bhakra Dam) 200
Figure 12.2 Longitudinal Section of Bhakra Reservoir Main Channel Showing Silt Deposit Profile 201
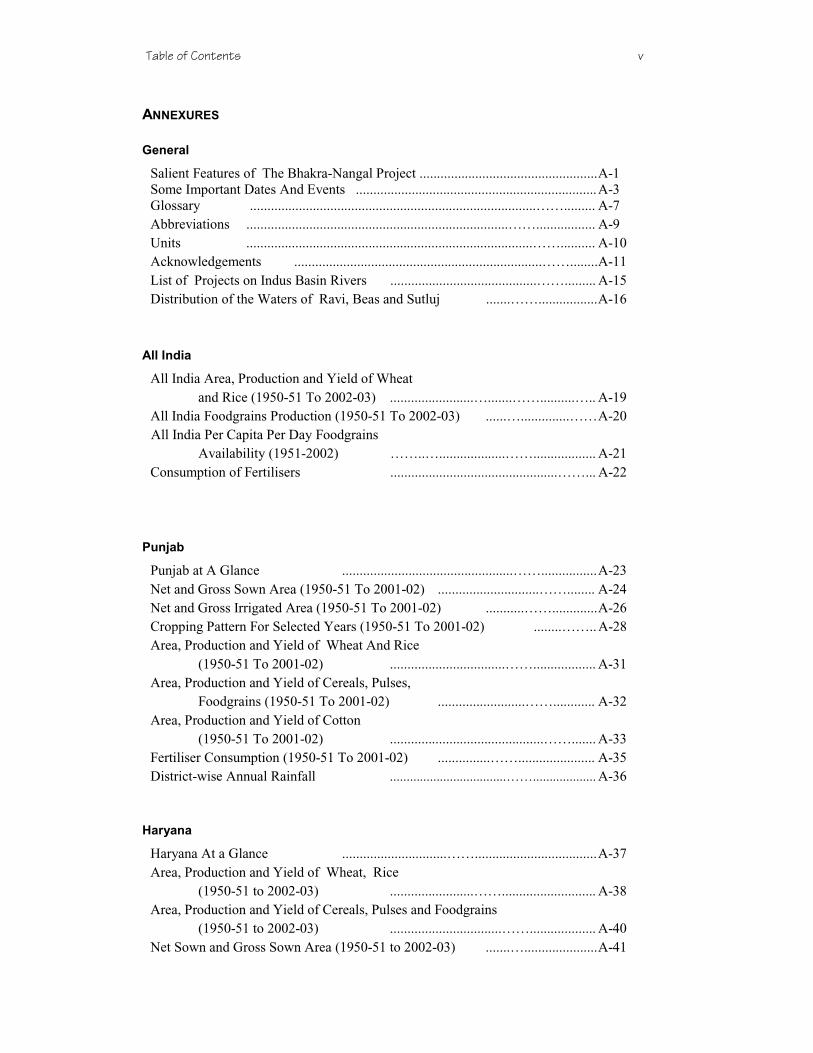
Table of Contents v
ANNEXURES
General
Salient Features of The Bhakra-Nangal Project ................................................... A-1 Some Important Dates And Events ..................................................................... A-3 Glossary ..................................................................................……......... A-7 Abbreviations ...........................................................................……................. A-9 Units ..................................................................................…….......... A-10 Acknowledgements .......................................................................……........ A-11 List of Projects on Indus Basin Rivers ..........................................……......... A-15 Distribution of the Waters of Ravi, Beas and Sutluj .......……................. A-16
All India
All India Area, Production and Yield of Wheat and Rice (1950-51 To 2002-03) ........................….......……..........….. A-19 All India Foodgrains Production (1950-51 To 2002-03) ......…..............…… A-20 All India Per Capita Per Day Foodgrains Availability (1951-2002) ……..…...................…….................. A-21 Consumption of Fertilisers ................................................……... A-22
Punjab
Punjab at A Glance .................................................……................ A-23 Net and Gross Sown Area (1950-51 To 2001-02) .............................……........ A-24 Net and Gross Irrigated Area (1950-51 To 2001-02) ...........……............. A-26 Cropping Pattern For Selected Years (1950-51 To 2001-02) ........…….. A-28 Area, Production and Yield of Wheat And Rice (1950-51 To 2001-02) .................................……..................
A-31
Area, Production and Yield of Cereals, Pulses, Foodgrains (1950-51 To 2001-02) .........................……............
A-32
Area, Production and Yield of Cotton (1950-51 To 2001-02) ............................................…….......
A-33
Fertiliser Consumption (1950-51 To 2001-02) ...............……...................... A-35 District-wise Annual Rainfall ...................................……................... A-36
Haryana
Haryana At a Glance ..............................……................................... A-37 Area, Production and Yield of Wheat, Rice (1950-51 to 2002-03) ........................……...........................
A-38
Area, Production and Yield of Cereals, Pulses and Foodgrains (1950-51 to 2002-03) ................................……...................
A-40
Net Sown and Gross Sown Area (1950-51 to 2002-03) .......…..................... A-41
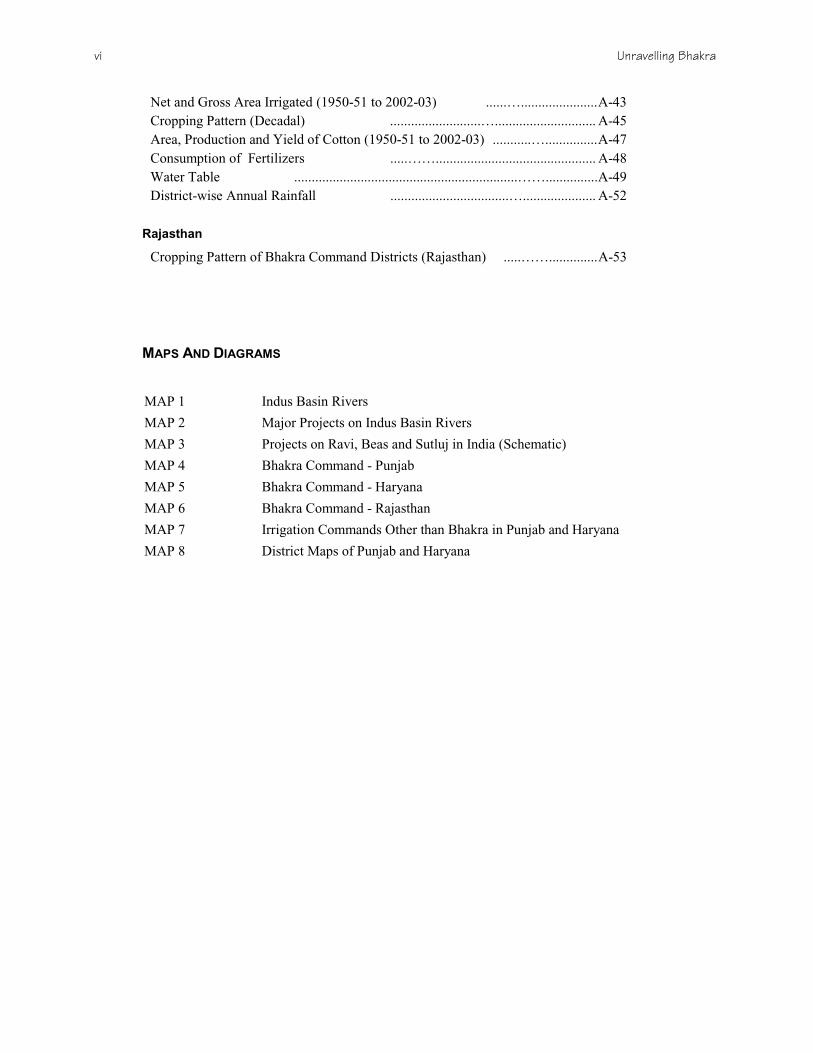
vi Unravelling Bhakra
Net and Gross Area Irrigated (1950-51 to 2002-03) ......…...................... A-43 Cropping Pattern (Decadal) ..........................…............................. A-45 Area, Production and Yield of Cotton (1950-51 to 2002-03) ...........…............... A-47 Consumption of Fertilizers .....…….............................................. A-48 Water Table ................................................................……............... A-49 District-wise Annual Rainfall ..................................…..................... A-52
Rajasthan
Cropping Pattern of Bhakra Command Districts (Rajasthan) .....…….............. A-53
MAPS AND DIAGRAMS
MAP 1 Indus Basin Rivers
MAP 2 Major Projects on Indus Basin Rivers
MAP 3 Projects on Ravi, Beas and Sutluj in India (Schematic)
MAP 4 Bhakra Command - Punjab
MAP 5 Bhakra Command - Haryana
MAP 6 Bhakra Command - Rajasthan
MAP 7 Irrigation Commands Other than Bhakra in Punjab and Haryana
MAP 8 District Maps of Punjab and Haryana

PREFACE
Evaluating a Legend
Legend n. 1. A popular story handed downfrom earlier times which may or may not betrue.
Collins Dictionary

Preface: Evaluating a Legend ix
Preface
Evaluating a Legend
THE BHAKRA PROJECT IS A LEGEND IN INDIA. PAEANS HAVE BEEN COMPOSED to it. People, from ordinary citizens to engineers, to the media, to the judges of the Supreme Court eulogies it. Prime Minister Jawaharlal Nehru reportedly accorded to it the status of a temple of secular and modern India. Indeed, the Bhakra project has become an icon in the developmental history of independent India.
How does one look at a legend? Why does one look at a legend?
Bhakra project is accorded overwhelming, at times the sole credit for rescuing India from hunger and famine, and more importantly, helping her regain self-respect, to get out of the demeaning position of having to accept rotten wheat as food aid under the PL 480 program.
Punjab and Haryana are commonly called the granaries of the nation and it is said that the Bhakra project has single-handedly been responsible for this.
The prosperity of Punjab, the huge production of foodgrains in Punjab and Haryana, the surplus food produced by these states that provides support to the rest of the country, are all repeatedly cited as testimony to great benefits of the Bhakra project. So entrenched is this perception of the Bhakra project that Bhakra and Punjab (and to some extent Haryana) are virtually synonymous in the public mind.
Not surprisingly, the Bhakra project is used as the last word in any debate or discussion related to the impacts, benefits and desirability of large dams in the country.
A number of people's struggles, intellectuals, academics, administrators have raised serious and fundamental issues about the impacts, benefits and the desirability of large dams. Bhakra has been used as an unqualified answer to all this.
For a project that is ascribed an icon like status, there is surprisingly little awareness about the actual facts and figures. When someone talks about how the Bhakra project has turned Punjab and Haryana into the granaries of the nation, there are few figures given in support of this. Indeed, there is often little need felt to give such figures. The contribution of Bhakra is considered self-evident.
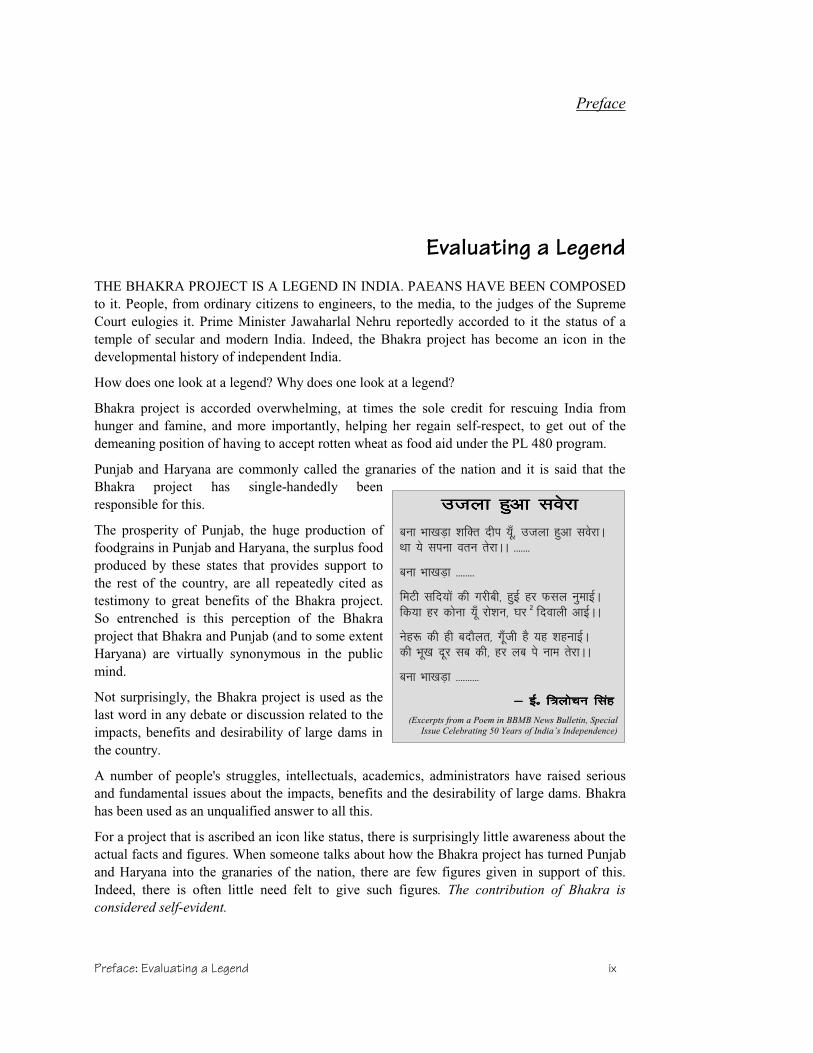
mtyk gqvk losjkmtyk gqvk losjkmtyk gqvk losjkmtyk gqvk losjk
cuk Hkk[kM+k 'kfDr nhi ;w¡] mtyk gqvk losjkA Fkk ;s liuk oru rsjkAA -------
cuk Hkk[kM+k --------
feVh lfn;ksa dh xjhch] gqbZ gj Qly uqekbZA fd;k gj dksuk ;w¡ jks'ku] ?kj 2 fnokyh vkbZAA
usg: dh gh cnkSyr] xw¡th gS ;g 'kgukbZA dh Hkw[k nwj lc dh] gj yc is uke rsjkAA
cuk Hkk[kM+k ----------
& bZñ & bZñ & bZñ & bZñ f=ykspu flagf=ykspu flagf=ykspu flagf=ykspu flag (Excerpts from a Poem in BBMB News Bulletin, Special
Issue Celebrating 50 Years of India’s Independence)
x Unravelling Bhakra
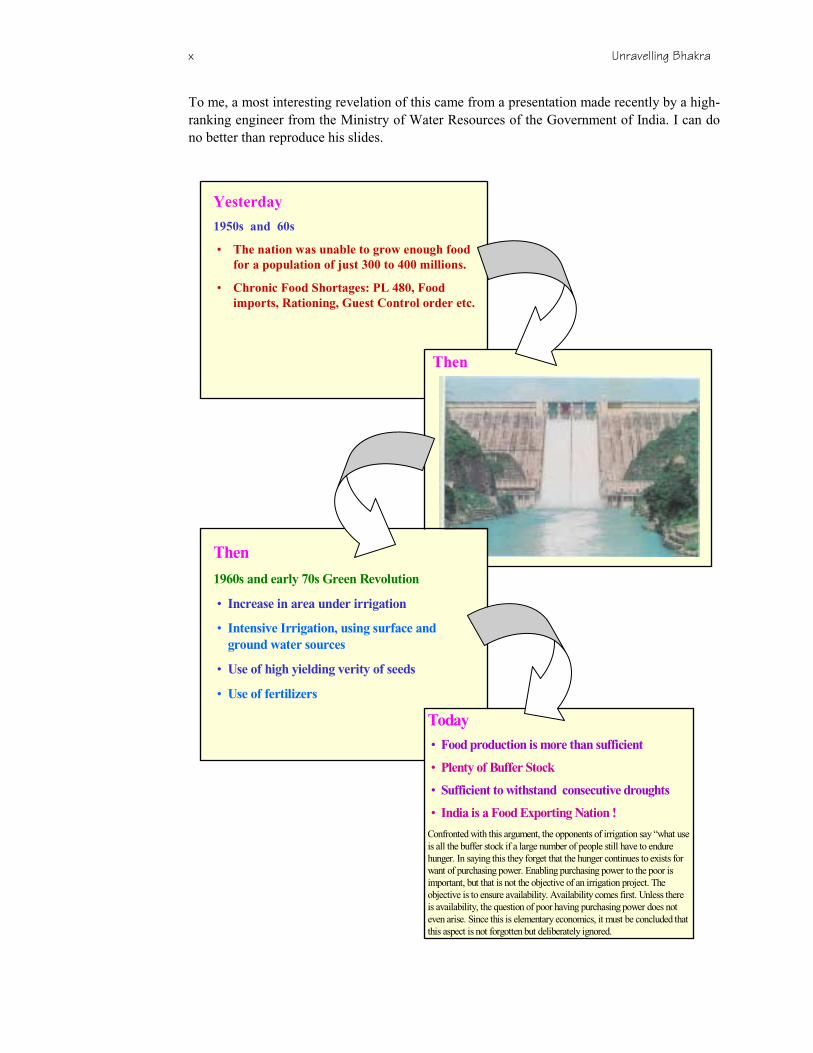
Yesterday
1950s and 60s
• The nation was unable to grow enough food
for a population of just 300 to 400 millions.
• Chronic Food Shortages: PL 480, Food
imports, Rationing, Guest Control order etc.
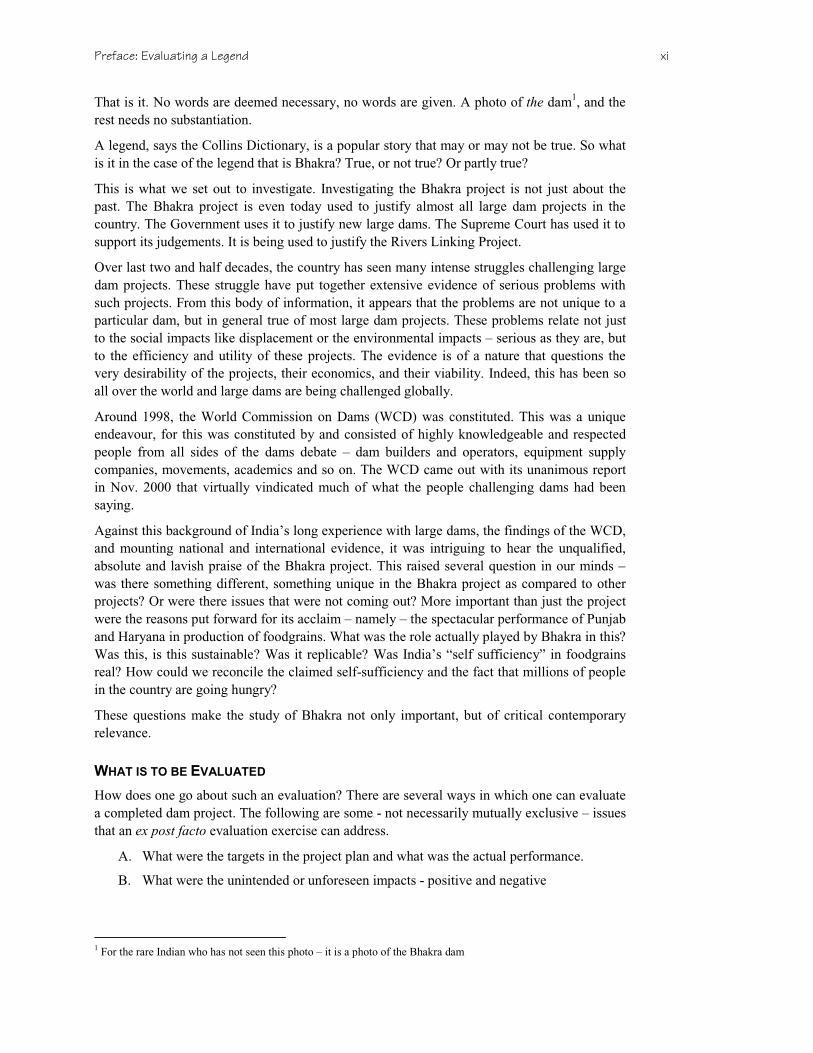
To me, a most interesting revelation of this came from a presentation made recently by a high-ranking engineer from the Ministry of Water Resources of the Government of India. I can do no better than reproduce his slides.
Then
Then
1960s and early 70s Green Revolution
• Increase in area under irrigation
• Intensive Irrigation, using surface and
ground water sources
• Use of high yielding verity of seeds
• Use of fertilizers
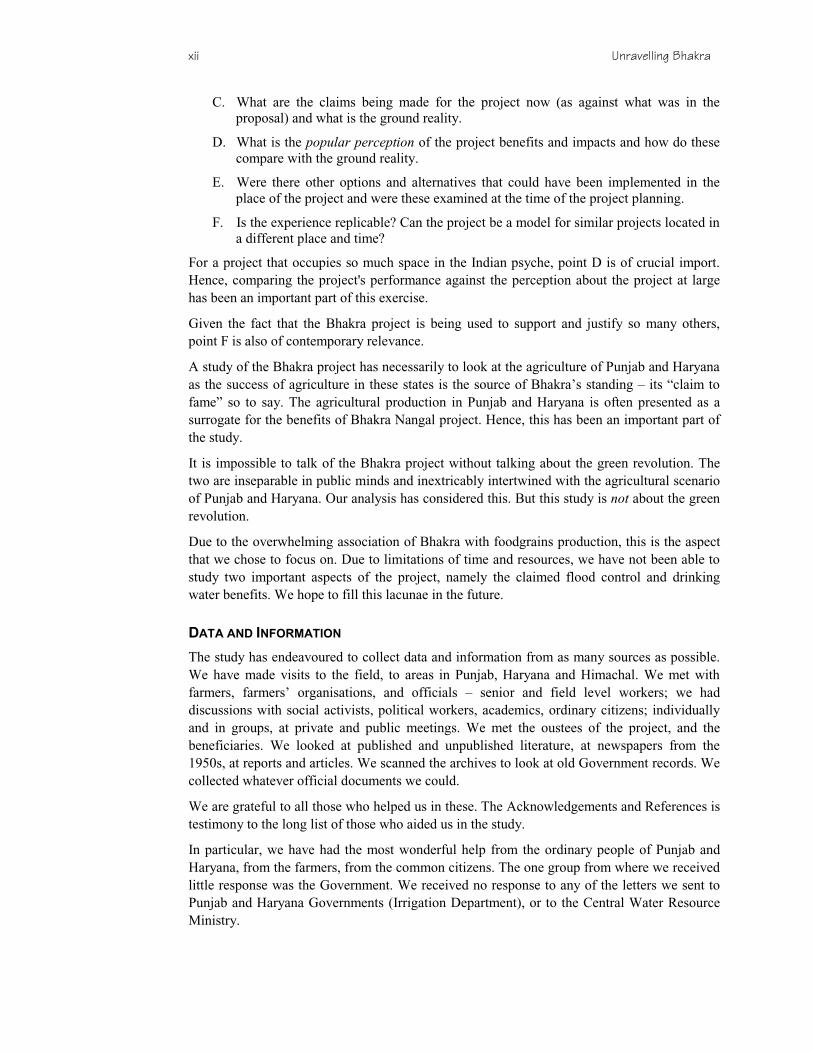
Today
• Food production is more than sufficient
• Plenty of Buffer Stock
• Sufficient to withstand consecutive droughts
• India is a Food Exporting Nation !
Confronted with this argument, the opponents of irrigation say “what use is all the buffer stock if a large number of people still have to endure hunger. In saying this they forget that the hunger continues to exists for want of purchasing power. Enabling purchasing power to the poor is important, but that is not the objective of an irrigation project. The objective is to ensure availability. Availability comes first. Unless there is availability, the question of poor having purchasing power does not even arise. Since this is elementary economics, it must be concluded that this aspect is not forgotten but deliberately ignored.
Preface: Evaluating a Legend xi
That is it. No words are deemed necessary, no words are given. A photo of the dam1, and the rest needs no substantiation.
A legend, says the Collins Dictionary, is a popular story that may or may not be true. So what is it in the case of the legend that is Bhakra? True, or not true? Or partly true?
This is what we set out to investigate. Investigating the Bhakra project is not just about the past. The Bhakra project is even today used to justify almost all large dam projects in the country. The Government uses it to justify new large dams. The Supreme Court has used it to support its judgements. It is being used to justify the Rivers Linking Project.
Over last two and half decades, the country has seen many intense struggles challenging large dam projects. These struggle have put together extensive evidence of serious problems with such projects. From this body of information, it appears that the problems are not unique to a particular dam, but in general true of most large dam projects. These problems relate not just to the social impacts like displacement or the environmental impacts – serious as they are, but to the efficiency and utility of these projects. The evidence is of a nature that questions the very desirability of the projects, their economics, and their viability. Indeed, this has been so all over the world and large dams are being challenged globally.
Around 1998, the World Commission on Dams (WCD) was constituted. This was a unique endeavour, for this was constituted by and consisted of highly knowledgeable and respected people from all sides of the dams debate – dam builders and operators, equipment supply companies, movements, academics and so on. The WCD came out with its unanimous report in Nov. 2000 that virtually vindicated much of what the people challenging dams had been saying.
Against this background of India’s long experience with large dams, the findings of the WCD, and mounting national and international evidence, it was intriguing to hear the unqualified, absolute and lavish praise of the Bhakra project. This raised several question in our minds – was there something different, something unique in the Bhakra project as compared to other projects? Or were there issues that were not coming out? More important than just the project were the reasons put forward for its acclaim – namely – the spectacular performance of Punjab and Haryana in production of foodgrains. What was the role actually played by Bhakra in this? Was this, is this sustainable? Was it replicable? Was India’s “self sufficiency” in foodgrains real? How could we reconcile the claimed self-sufficiency and the fact that millions of people in the country are going hungry?
These questions make the study of Bhakra not only important, but of critical contemporary relevance.
WHAT IS TO BE EVALUATED
How does one go about such an evaluation? There are several ways in which one can evaluate a completed dam project. The following are some - not necessarily mutually exclusive – issues that an ex post facto evaluation exercise can address.
A. What were the targets in the project plan and what was the actual performance.
B. What were the unintended or unforeseen impacts - positive and negative
1 For the rare Indian who has not seen this photo – it is a photo of the Bhakra dam
xii Unravelling Bhakra
C. What are the claims being made for the project now (as against what was in the proposal) and what is the ground reality.
D. What is the popular perception of the project benefits and impacts and how do these compare with the ground reality.
E. Were there other options and alternatives that could have been implemented in the place of the project and were these examined at the time of the project planning.
F. Is the experience replicable? Can the project be a model for similar projects located in a different place and time?
For a project that occupies so much space in the Indian psyche, point D is of crucial import. Hence, comparing the project's performance against the perception about the project at large has been an important part of this exercise.
Given the fact that the Bhakra project is being used to support and justify so many others, point F is also of contemporary relevance.
A study of the Bhakra project has necessarily to look at the agriculture of Punjab and Haryana as the success of agriculture in these states is the source of Bhakra’s standing – its “claim to fame” so to say. The agricultural production in Punjab and Haryana is often presented as a surrogate for the benefits of Bhakra Nangal project. Hence, this has been an important part of the study.
It is impossible to talk of the Bhakra project without talking about the green revolution. The two are inseparable in public minds and inextricably intertwined with the agricultural scenario of Punjab and Haryana. Our analysis has considered this. But this study is not about the green revolution.
Due to the overwhelming association of Bhakra with foodgrains production, this is the aspect that we chose to focus on. Due to limitations of time and resources, we have not been able to study two important aspects of the project, namely the claimed flood control and drinking water benefits. We hope to fill this lacunae in the future.
DATA AND INFORMATION
The study has endeavoured to collect data and information from as many sources as possible. We have made visits to the field, to areas in Punjab, Haryana and Himachal. We met with farmers, farmers’ organisations, and officials – senior and field level workers; we had discussions with social activists, political workers, academics, ordinary citizens; individually and in groups, at private and public meetings. We met the oustees of the project, and the beneficiaries. We looked at published and unpublished literature, at newspapers from the 1950s, at reports and articles. We scanned the archives to look at old Government records. We collected whatever official documents we could.
We are grateful to all those who helped us in these. The Acknowledgements and References is testimony to the long list of those who aided us in the study.
In particular, we have had the most wonderful help from the ordinary people of Punjab and Haryana, from the farmers, from the common citizens. The one group from where we received little response was the Government. We received no response to any of the letters we sent to Punjab and Haryana Governments (Irrigation Department), or to the Central Water Resource Ministry.

Preface: Evaluating a Legend xiii
We must however, put on record our appreciation of the Bhakra Beas Management Board (BBMB) who gave us some useful information on our personal visit. We believe that they could have given us much more, but still, BBMB gave us the most that we got from any official source. The Punjab and Haryana irrigation departments never responded to our letters, but on personal visits, were very welcoming and hospitable. They were quite miserly with the information though; and in both the states, the reason given for this was the ongoing dispute related to the Sutluj Yamuna Link. There was a palpable distrust and some apprehension in sharing any information about water resources, command areas, irrigation, flows and so on. This point-blank refusal to share even what is the most basic information was very frustrating.
This does not mean that we did not have access to official information – but this was limited to what we obtained unofficially! We would like to strongly protest this situation and would like to go on record saying that it will not harm the government any if it is more open with information and data; it will certainly benefit the citizens immensely.
It is rather an absurdity that the same Government that so zealously “protects” its data and information responds to public scrutiny with an argument that goes along the lines of “but you have ignored this fact” or “you have not looked at this data”.
With all the limitations of access to official data, we would like to stress that we still had sufficient and necessary information and basis on which to draw our conclusions.
Our study has also raised certain questions and issues that we have not been able to go into, or could address only to a limited extent. This is essentially due to the limitation of data, time and resources. We hope that some of these will be taken up by others to investigate.
WITHOUT WHOM….
This introduction would be incomplete without an acknowledgement of the role of the people without whom this study would have remained incomplete – or never happened.
First and foremost is Arundhati Roy. Her unstinting contribution of resources made possible not only this study, but indeed the setting up and running of the Manthan Adhyayan Kendra itself. But her support goes much beyond that - a friend and comrade in the journey of Manthan.
Secondly, I would like to acknowledge our friends in Haryana – Ashok Garg, Ramesh Singhla, Jagdeep Singh, Jai Bhagwan, Rishi Dangi and others, who went out of their way to organise trips for us during the visits to Haryana and Punjab, who spent days with us, sharing their knowledge and our quest, and who remain committed to working for social change.
Thirdly, I would like to acknowledge Prashant Bhushan, Peter Bosshard, Smita Gupta, Ashish Gupta, Ramaswamy Iyer, L.C. Jain, Sanjay Kak, Ashish Kothari, Patrick McCully, Apoorva Oza, Nandini Oza, Arundhati Roy, Himanshu Thakkar, and Dr. A. Vaidyanathan for taking the time and trouble to review and comment on the draft of this report. Their comments have added considerable value to the study. Needless to add, their taking the trouble to review this report does not construe an endorsement (or rejection) of any part or all of it.
I would like to particularly thank Himanshu Thakkar for his meticulous scrutiny of the draft(s) and the series of lengthy discussion on the same that I had the benefit of, as well as his efforts in digging up important references, figures and information for this study.
I also wish to thank Alok Agrawal and Chittaroopa Palit for their encouragement to me during the study.
xiv Unravelling Bhakra
The production of this report would have been impossible without the guidance and help of Tultul, Rajesh Khindri, Rakesh Khatri and Sushil Joshi.
I would also like to place on record the excellent work by the research team – Swathi Sheshadri and Rehmat. The contribution of Himanshu Upadhyaya for some important research input and of Nilesh Sanothiya and Manish Vyas in managing the documentation and data is also acknowledged. Mukesh Jat, who was a part of Manthan team also contributed to this research.
Last, but not the least, is Nandini, my wife and friend, especially for taking care of “everything else” in those last three hectic months when I was racing against time to finish the report. Lest it be overshadowed by these remarks, I would also like to highlight her contribution to the study itself.
Needless to add, I alone remain responsible for the interpretations, conclusions and errors in the report.
With these words, I put in your hands this report.
(Shripad Dharmadhikary)
Manthan Adhyayan Kendra

OVERVIEW
A Journey Into theRealm of Bhakra
“As we travel from Panipat to Hansi via Jind,I am riveted at the sight outside. The stunningverdant carpet spread out on both sides of theroad - for miles and miles and miles. It isunending. The fresh, half feet tall wheat of acolour that is unbelievably green; the tall lushsugarcane in patches; the bright yellow-toppedsarson that suddenly, dazzlingly breaks thesheer monotony of green – it is all the Haryanathat we have always heard of - just as all thepictures one has always seen – and more. Formiles the land stretches flat on both sides ofthe road. No colour other than green is seen….Not a single inch of land is vacant. Numeroustractors cross us – laden heavily withagricultural produce. We pass open godownswhich are chock-full of bags of grain. Even tomy eyes, used to the lush, fertile areas of theNarmada belt, the sight is breathtaking andunique.”
From the Author’s diary during visit to
Haryana and Punjab in Dec. 2001

A Journey into the Realm of Bhakra xvii
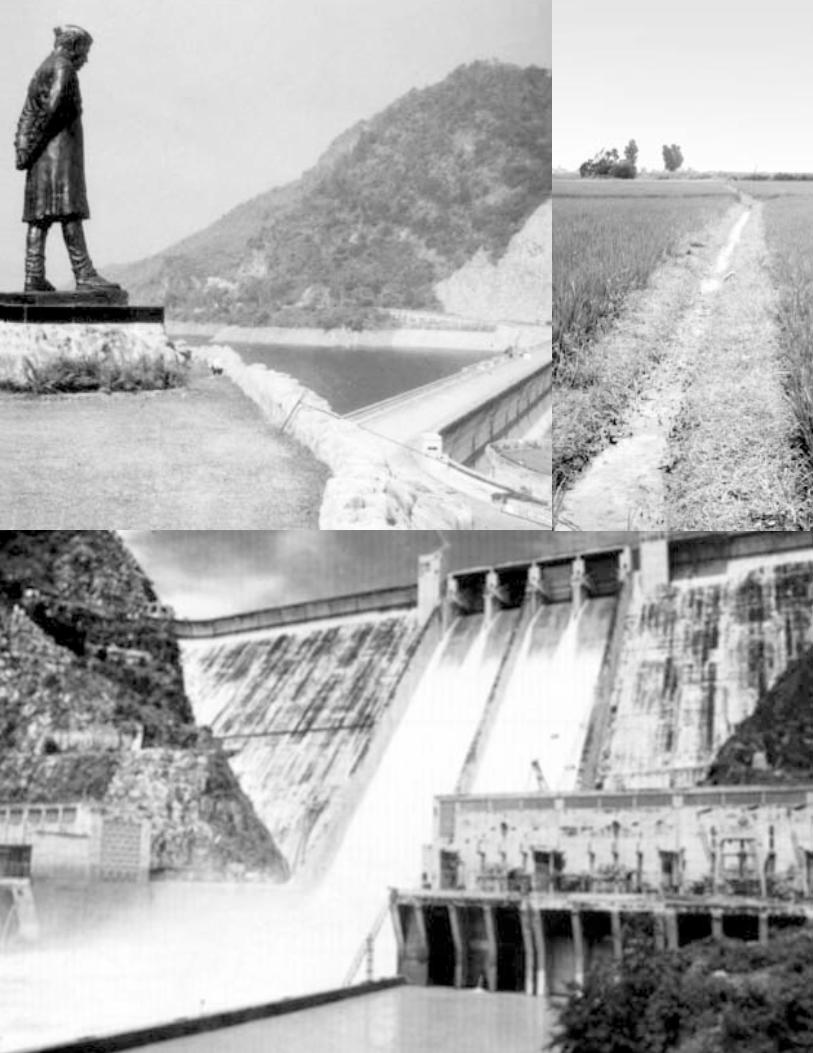
A Journey Into the Realm of Bhakra OUR JOURNEY INTO THE BHAKRA-LAND BEGAN WITH THIS AWESOME DISPLAY of the green revolution in its full visual glory. As we travelled through Haryana, and then Punjab, this sight was to be repeated day after day. As we moved through the country, we heard stories of how the waters had transformed virtual deserts into lush green fields. We saw the big pucca houses in villages, the large number of tractors – and not a single bullock cart. We crossed numerous small and big canals as we drove on the excellent road network. The most spectacular sight of the journey was our first view of the Bhakra dam. It was nothing short of stunning. Seen coming up the mountain from the downstream side in the late evening, the wall of the dam rises up steeply, suddenly from the depths of the gorge to a sheer 200 meters, the lights at the top illuminating it. As an engineer, I could only marvel at this testimony to the skills of our profession. We saw at the dam site exhibition the photos of visiting dignitaries like Ho-Chi-Minh, Bulganin, Khruschev – images from the heydays of “socialist” India.
Our physical journey was paralleled by another, a metaphorical, journey – a journey through the facts and figures, through the documents, through the history, geography, science, politics of the project. A journey through the minds and memories of people, a tour that accompanied the people on their experiences of the dam, of the agriculture of the two states. This journey was equally, if not more, fascinating as the physical journey.
The mesmerising display of the green revolution in the fields of Haryana and Punjab is matched by the spectacular statistics of agricultural growth. In Punjab, the foodgrains production went up from 3.389 million tons (m tons) in 1965-66 to 17.221 m tons in 1985-86 – an increase of five times in 20 years, or an annual compounded growth of 8.47% for 20 years running! In 1999-2000 it stood at 25.197 million tons, 12.1% of the all India production. In Haryana, in the same period, foodgrains production increased from 1.985 m tons to 8.147 m tons, a four times increase. In 1999-2000,it stood at 13.065 million tons, or 6.2% of All India.
There is an old saying – I believe it exists in some form or the other in every language – which states “Appearances can be deceptive”. Our journey, our fascinating journey into the realm of Bhakra was to prove the truth of this saying many times over, in many different ways. Our journey was a discovery of this, of how long held popular beliefs and perceptions were mostly just that – beliefs. It was also a revelation of the hidden, or not so hidden, but often swept-under-the-carpet side of the story.
The first revelation came with our very first visual encounter with Haryana described above. As we soon found, the lush green fields from Panipat to Hansi had little to do with Bhakra1. This area, along with other large areas in Haryana receive waters from the Western Jamuna Canal (WJC) and have been doing so since over 100 years.2 The WJC is a diversion canal taking off from the Yamuna river near Tajewala. This diversion is from a weir and not a
1 Throughout this report, unless the context so indicates, or it is specified otherwise, the term “Bhakra” or “Bhakra
project” will refer to the entire Bhakra-Nangal project. 2 The WJC was irrigating small areas as early as the 16th Century – during the rule of Akbar. In 1832 it was
remodelled for extensive irrigation.
xviii Unravelling Bhakra
storage dam. In fact, the gross command area of Bhakra in Haryana is about 30% of the state geographical area. In Punjab, the gross commanded area of Bhakra is about 18.6% of the state area. Punjab and Haryana are much more than Bhakra.3
It is often said that before Bhakra, Punjab (and Haryana) were just semi-arid, dry regions with little irrigation and / or highly problematic agriculture. We found this to be far from the truth.
As we traced the history of irrigation in the two states, we had to go back to pre-partition India, the pre-partition Punjab. Pre-partition Punjab included not only the Pakistan part of Punjab, but also today’s Indian states of Punjab and Haryana. Punj (Five) Aab (Waters) – the land of the five rivers – Sutluj, Beas, Ravi, Chenab, Jhelum - and of course the mighty Indus whose tributaries these five are – forms an area endowed with the most lavish water resources. While irrigation was being used in the Indus basin since the days of Harappa and Mohen-ja-daro, it really developed during the 19th Century and by the early 1900s, Punjab4 had an extensive, highly developed irrigation system based on diversions from the major rivers.
A large part of this system was in what is today Pakistan. But the irrigation developed in the Indian part was not small or insignificant. The Western Jamuna Canal,5 we have seen, was serving large parts in today’s state of Haryana. The Upper Bari Doab system from Ravi that serves much of Amritsar and Gurudaspur districts in Punjab was opened in 1859.
The Sirhind Canal, taking off from the Sutluj at Ropar in Punjab, was opened in 1882. It was irrigating, and still does, large areas of Punjab. Apart from these, there was significant irrigation from wells.
Overall, the situation in Punjab (including Haryana6) around 1950 - before the Bhakra project - was as follows.
In percentage terms, in 1949-1950, Punjab7 had 35.3% of its sown area irrigated and the figure for PEPSU (Patiala and East Punjab States Union)8 was 42.6%. This was the highest in the whole country! Together, PEPSU and Punjab accounted for 13% of the country's irrigated area, while it had 5.89% of the country's total sown area9. Thus, it was way ahead in irrigation as compared to the rest of the country – even after losing the lion's share to Pakistan. In absolute terms, the areas irrigated were 4.9 million acres in Punjab and 2.04 m acres in PEPSU.
Similarly, Punjab at that time was the leading producer of wheat, maize and gram in the country.
Against this background, the decision to build Bhakra was a very interesting one. As we explored the planning and decision making process around Bhakra project, we found that the
3 Note that the gross command area gives the maximum possible reach of the project. 4 Punjab here means the Pre-partition Punjab. The readers will do well to keep in mind the following. The British
Province of Punjab included much of what is today Indian Punjab, Indian Haryana, small part of Indian Himachal and the Pakistan Punjab. Some areas that are in Punjab or Haryana today were not in the British province of Punjab but were princely states. These included Patiala, Jind, Bhatinda, Faridkot etc. and went by the name PEPSU – Patiala and East Punjab States Union. In 1947, the partition created West Punjab (in Pakistan) and East Punjab (in India) – later called simply Punjab. This Indian Punjab (of 1947) included parts of today’s Punjab, today’s Haryana and some parts of Himachal. In 1956, PEPSU merged with Indian Punjab. In 1966, this combined Punjab was reorganised into Haryana and Punjab, with a few districts going to Himachal. We will use the following terminology. Pre-partition Punjab for before 1947, Unified Punjab for Punjab between 1947 and 1966 and simply Punjab for post 1966. However, we will use these qualifications only when the context does not make it clear which Punjab we are referring to.
5 Though not a part of the Indus basin 6 See footnote 4 on what constituted Punjab during various periods. 7 Punjab at this time also included Shimla and Kangra districts of Himachal, but these had very limited amount of
irrigation. 8 See footnote 4 9 R.L. Anand; Punjab Agriculture Facts and Figures; Economic and Statistical Adviser to Government of Punjab;
1956 Page 57 Table 20
A Journey into the Realm of Bhakra xix
real reasons behind advocating the project had much more to do with the interstate disputes of the (then British) provinces of Sind and Punjab and later India-Pakistan, than the interests of taking water to dry areas.
We learnt that the Bhakra dam was an over designed dam. Even after the Sutluj flows were augmented by the transfer of Beas water to the Bhakra reservoir, the reservoir has not filled up in most of the years.
We found that as in most other dam projects, the figures put forward for areas to be irrigated by the Bhakra project were highly exaggerated. Indeed, even the areas that it could ultimately service, it was able to do so by virtually drying up the river and cutting off areas previously irrigated. The startling finding was that Bhakra did not add any new areas under irrigation – it only transferred or shifted the irrigation from one set of areas to another - from areas that were already irrigated to other areas.
The Bhakra project did not produce any dramatic impact on the country's foodgrain situation. Irrigation from the Bhakra-Nangal project began in 1954, increased rapidly, and reached close to its full potential by 1963. Yet, India’s foodgrain position had continued to deteriorate, and food imports reached an all time high in 1966. While imports fell subsequently, they rose sharply again and in 1975 touched a high once more.
20 years after irrigation deliveries started from a project that is supposed to have brought food self-sufficiency to India, we were still importing huge quantities of food.
One of the more absorbing and educative part of our journey has been the history of food policy and programs in India.
Independent India’s quest for feeding its millions began with a conflict of approaches. In the late 40s and early 50s, there was a lot of focus on land reforms10 as a necessary component of addressing the food problem. Further, there was emphasis on minor irrigation and the community was seen as both, the vehicle of implementing programs on the ground and as a basis for planning. The sum total was a central place for a decentralised approach. The First Five Year Plan (1951-56) was deemed a success with respect to food production. Rationing, control on interstate movement of foodgrains and all such restraints were removed.
The Second Plan (1956-61) shifted the focus from agriculture to industry and was a disaster in terms of foodgrains production. From the Second to Third Plan and beyond, the focus also was shifting away from the decentralised approach, towards large-scale schemes. Land reforms were not going ahead beyond the abolition of zamindari. The strategy of concentrating inputs and resources on selected areas to attain higher production was coming into prominence.
One of the important reasons for this shift was the bias towards interpreting the food problem in terms of “market deficits”. The market deficit – the shortfall of market supply over market demand - has little role to play for the millions who are not connected to the market for their food needs. Even for those who depend on the market for food needs, it needs to be emphasised that market demand, and hence “deficit” also depends on the price of foodgrains and purchasing power of the millions. If people do not have purchasing power, their need to fill their stomachs would not be translated into market demand and hence the deficit would be less. The focus on market deficit led to an emphasis on increasing the “procurable surplus” from the farmer to meet the market needs. This approach meant the food problem was defined in terms of the “visible” demand of those who could pay. A corollary was that the approach shifted to an “intensive” and “selective” one, where better endowed areas would produce
10 The term Land Reforms encompasses a range of measures from abolition of zamindari, land to the tiller and land
to the tenant, land ceiling and redistribution of land, to the security of tenancy and ensuring reasonable conditions for tenancy etc. It is also used sometimes to include land consolidation.

xx Unravelling Bhakra
higher “surpluses” which could be procured for the market,11 since it was easier to produce and procure more surplus from smaller, better endowed areas. This meant that inputs would have to be concentrated there.
However, there was another approach. In this, it was argued that the real solution was (1) For the producers – increase the security of and access to land (land reforms) and increase the productivity of such lands (2) For the millions of “non-producers” increase their purchasing power through sustainable employment. It was also realised and argued that the only way in which the purchasing power of the millions spread all over the country could be increased, and increased in a non-inflationary manner was if the investments used for (1) were also supporting (2). In other words, a massive, decentralised program that would make use of the country’s huge human resources to create infrastructure that would increase the productivity of vast areas of lands.
In today’s discourse, this is essentially a wide-spread, decentralised rainwater-harvesting, watershed management, soil-water conservation, groundwater recharge program.
It is often said that if India has to feed its millions, there is no alternative but to build huge dams to “harness” the waters of the rivers. Considerable evidence has now accumulated that a decentralised rain-water harvesting program can improve dramatically the productivity of land even in the most scanty rainfall areas. It is argued that this evidence is now available, but at the time of independence, the efficacy of such an approach was not established and hence this was not an option at all.
One of the important things we discovered during the course of our study was that such watershed management, rainwater harvesting programs were not only being carried out in the country, but that impressive results from these had been noted and proposals to implement these country wide had been forcefully put forward. For example, the report of the All India Congress Agrarian Reforms Committee of 1949 had noted the results of the soil-water conservation works in Bijapur and its objectives, which were to “ keep all the rain-water that fell on the land as near the place at which it fell” and that such a program “could well be expanded to all of India.”
Further, from time to time, various experts had proposed precisely the kind of schemes that today are being undertaken for decentralised rainwater harvesting and watershed management – to be implemented all over the country. Significantly, a very important advantage presented for these schemes was that of generating employment on a huge scale and using India’s wealth of human resources.
However, for a number of reasons, including the reasons of vested interests in large schemes and the blocking of land reforms by the rural elite, the policies shifted decisively towards the strategy of large projects, selectivity and intensification. But we discovered an important thing – that there were very concrete alternatives being proposed to the large projects-based-strategy even in the early years of Independence.
Around 1967 came the Green Revolution (GR). It must be understood that while the GR strengthened the intensification, the strategy of intensification and the advent of GR were two separate phenomena. The GR itself was a virtually unforeseen development. The GR took place primarily with the advent of a new variety of seeds, called High Yielding Varieties (HYV). However, they should more appropriately be called High Response Seeds, since their basic quality was that they could take up and withstand much higher levels of fertilisers than even the “improved” seeds in use till then.
The HYV demanded, and got, huge increases in the inputs. These included not only chemical fertilisers, pesticides, but also machinery, cheap credit, minimum support prices and 11 The Public Distribution System was to be the means for addressing the issue of distribution, especially the needs
of the poor.

A Journey into the Realm of Bhakra xxi
procurement, extension services and of course water. It should be emphasised that the performance of the HYV was critically dependent on this whole package. All this involved huge public subsidies, the cost of which was borne by the nation12.
The spectacular growth in the foodgrains production in Punjab and Haryana came with the advent of the HYV. It is sometimes argued, conceding that the Bhakra project by itself may not have increased production in a dramatic manner, that it was the key in enabling the Green Revolution. It is also said that the Bhakra project helped increase production by allowing hitherto wasteland being brought into cultivation.
We found the ground realities to be quite different. The only substantial increase in the areas cultivated brought about by the Bhakra project lie in the dry belt of Haryana – in the Hissar tracts. But the contribution of this to the foodgrains production was limited. Against this, we need to see the costs – financial, social, ecological and economic – of the project. Further, the agriculture of these very areas now faces serious problems – ecological and economic.
Irrigation was a crucial component of the green revolution. But Bhakra itself has played a limited role. We have already seen that Bhakra commanded areas form less than a third of the area of Haryana and less than a fifth in Punjab. The rest of the canal irrigation in these states is from projects that are over a century old and are based only on diversion structures.
However, far far more important than the canal irrigation – whether from Bhakra or anywhere else – has been the role of groundwater. There is not an iota of doubt that it is the explosive growth in the groundwater use – especially with tubewells, that has been the real driving force behind the green revolution and agricultural production in these two states.
The HYV seeds are highly sensitive to the timing and quantity of watering. It is the tubewells that allowed the farmer to achieve this control. Tubewell productivity is documented to be more than one and half times canal productivity.
The number of tubewells in Punjab jumped from 20,066 to over 450,000 from 1965-66 to 1975-76. In 1997-98, this figure was 910,000. In Haryana, the number of tubewells jumped from 25,311 in 1965-66 to 204,736 in 1975-76, and in year 2000 stood at 583,705.
The areas irrigated by wells/tubewells also increased dramatically. By the late 60s, tubewell irrigated areas equalled and soon outstripped canal irrigated areas in Punjab. In Haryana too, tubewell irrigation grew rapidly till it now equals canal irrigation. This enormous growth in tubewell irrigation is the major factor behind the agricultural production in the two states.
It is often argued that the tubewell irrigation in the two states was made possible by the canals. It is argued that the waters that the tubewells are lifting are essentially the waters that have seeped in from the canal and this is given as a major contribution of Bhakra. But this is widely off the mark. Large part of the water being drawn out by the tubewells in the two states is actually water that is being mined – in other words, water that is not being recharged. This is water that has accumulated over generations or even centuries and is being taken out in a matter of years. Obviously, this is highly unsustainable.
Our calculations show that in Punjab 43-46% of all agricultural production is based on unsustainably mined groundwater. For Haryana, the figure is 35%.13 This is the production of the two states that has nothing to do with any canal seepage, has nothing to do with canal irrigation and has nothing to do with groundwater recharged normally through rain. In other words, a sizable part of the “miracle” of Punjab and Haryana is purely and eminently unsustainable. And on the verge of collapse as groundwater levels are falling rapidly.
12 The point is not about subsidies per se. This author at least believes that subsidies will be necessary for agriculture.
The issue here was the concentration of the subsidies in limited areas of the country. 13 Haryana figures for the Year 1998-1999. Punjab figures are for year 1989-90.

xxii Unravelling Bhakra
It may be added that the figures for Punjab above are for the year 1989-90, when the canal irrigated area was 1.467 m ha and tubewell irrigated area 2.44 m ha. By 2001-02, the canal irrigated area in Punjab had fallen sharply to 0.987 m ha – that is, even less than what it was in 1954 before the Bhakra project - and tubewell area gone up to 3.068 m ha. This means that the percentage of production dependent on the mined groundwater should be even higher today.
This is the shocking reality of the miracle of Punjab and Haryana’s agriculture.
What is the contribution of Bhakra? The same calculations show that the production that can be attributable to canal irrigation is about 43% in Punjab- this includes the recharge of groundwater through canals (17%)14. For Haryana, the figure is 48%.
An analysis of the Command area shows that in Punjab, the areas irrigated by Bhakra are very limited and the even the figure we saw earlier of the GCA (Gross Commanded Area) for Bhakra is misleading. The areas that were proposed to be irrigated by Bhakra were either areas that were already irrigated, or were well-endowed areas. Even these planned areas are irrigated not so much by canal as by tubewells. Most of the canal irrigated areas in Punjab are in the Sirhind area or the UBDC area. Out of the 43% of Punjab’s production attributed to canals, we find that about 11% is due to Bhakra canals15. In Haryana, since Bhakra canals service about 50% of the total canal irrigated areas, we find that Bhakra is responsible for about 24% of Haryana’s production. These are conservative calculations.
What is equally important to note is that Haryana is the senior partner as far as Bhakra is concerned (it has much more area irrigated from Bhakra than Punjab), but in terms of food production Punjab is the senior partner. Punjab’s foodgrains production is double that of Haryana, even though the cultivable area of the two states is comparable.
In other words, in the best analysis, contribution of Bhakra to India’s foodgrains production and Punjab / Haryana’s agricultural prosperity has been limited, and nowhere near what is the perception. Bhakra happened to be in the right place, at the right time, and has been given the credit for things it never did.
However limited the production from Bhakra, the question can be asked – was there any other way to achieve this? In particular, the areas of Hissar tracts in Haryana, which were dry and semi-arid area, with much of the groundwater of poor quality – and today boast of lush green fields – is there any other way that these areas could have been served?
We found that the answers are an emphatic yes – and also that the answers have several dimensions.
There are two ways the question could be posed – was taking the waters of Sutluj to Hissar, Sirsa, Fatehbad, Jind, Kaithal etc. districts in Haryana the only, or even the most optimal, way to meet India’s food needs? This is from the point of view of the country. From the point of view of these areas themselves the question is whether there was any other way to meet their developmental needs.
About the needs of the areas themselves: purely in technical terms, we found that it would have been possible for these areas to be irrigated with Sutluj water even without the Bhakra dam. Indeed, such a scheme had also been proposed in the late 19th Century. In fact, many parts of these areas were already being irrigated with the WJC.
14 To elaborate – the production attributable to the canal irrigated areas is 26%. This is the direct contribution of
canals. However, about 60% of the recharged groundwater in Punjab is said to come from the recharge due to canals. We have included this as the indirect contribution of the canals and this works out to be 17% of production. Hence, total contribution of canals – direct and indirect is 43%.
15 Due to the non-cooperation of the Government, we were not given the exact areas irrigated in each of the systems. We have worked out these figures from the district-wise irrigation data.

A Journey into the Realm of Bhakra xxiii
There is a larger issue here. What is the appropriate (agricultural) development for this area? From the Second Irrigation Commission (1972) to the new National Water Policy, planners espouse that development of an area should be appropriate to its eco-climatic conditions. But the practice has been to implement the same agricultural model in all zones – growing sugarcane even in deserts16, so to say. So long as sugarcane cultivation pays much more than say a livestock based economy (which may be more suited to such zones), there is little doubt that the people will demand water to grow sugarcane. The discussion on this issue is crucial to the agricultural strategy in the country, but it is clearly beyond the scope of our work. We would only like to state that in our undertaking, we found ample evidence of the desirability of tailoring development strategies to the eco-climatic and local conditions.
As for the first question – was the Bhakra (or similar projects) the only and optimal strategy to meet the country’s foodgrains needs – it was clear that there were real and tangible alternatives, alternatives that could have served the country better. These were the decentralised wide-spread schemes that were being proposed, which would have spread the inputs, resources, investments and the outputs – and put purchasing power in the hands of the people. Such alternatives had been proposed, we found, but had been ignored.
Choosing these alternatives could have also meant avoiding many of the serious social, environmental, financial costs and impacts of the Bhakra project. In evaluating the limited benefits of the Bhakra project, we must not forget this other side of the balance sheet.
One of the most serious issues has been the waterlogging and salinisation in the Bhakra command. What is important is that much of the area in Bhakra command that is in Haryana (and this is the main irrigated area of the project) is underlain with saline and bad quality waters. It is virtually impossible to control waterlogging and salinisation in this situation, unlike in areas with good quality water where pumping can help. The twin dangers of waterlogging and salinisation of the lands lead to sharp decline in productivity, even making the lands totally uncultivable. When we visited the areas affected by waterlogging and salinisation, we were shocked by the impacts. Farmers told us stories of lands going out of production and farmers migrating from the village. We saw costly experiments trying to recover salinised lands which are meeting with only limited success. We saw the Master Plan prepared by the Haryana Government to address the problem of waterlogging- the cost – Rs. 2000 crores.
Waterlogging has also badly affected the infrastructure. A number of houses have fallen, buildings have been affected due to differential sinking of foundations. Long stretches of a National Highway have had to be lifted for the same reason.
All evidence available to us shows that the problem of waterlogging and salinisation will continue to become more serious. This is a classic example of short-term benefits and long-term disastrous impacts.
There have been severe impacts of the dam itself. The river downstream of the dam has become virtually dry. We have not been able to estimate the impacts of this since it is almost 50 years since this has happened and getting baseline data has been very difficult. But meticulous research will be able to get this, and we feel that this will be a very important area for researchers to explore.
There have been no detailed studies of the environmental impacts of the dam except possibly the issue of waterlogging. We feel that these would have been important and should have been done since Bhakra has been projected so much as a model. But we came across many pieces of information which indicate that there have been serious impacts of the project. Diversion of most of the water at Nangal and Ropar has meant serious consequences downstream. Similar
16 In Kutch, Gujarat, for example, sugarcane is growing in the semi- arid areas, while neighbouring villages have
serious problem of even drinking water.
xxiv Unravelling Bhakra
impacts are also seen below Pandoh in Beas basin. The traditional, much sought after fish, masheer has virtually disappeared from the reservoir, being replaced by the silver carp which is a low valued fish. There have been several health impacts of the project especially in the reservoir area. About 10% of the live capacity of the reservoir has been lost to siltation and a hump formation in the reservoir is preventing the silt from going into the dead storage. Given the importance attached to the project, it is very important that these be thoroughly investigated.
By far the most poignant moments for us have been when we met the oustees of the project. Almost fifty years have gone by after their displacement. And yet, they have not been fully settled. The communities living on the periphery of the reservoir – literally a reservoir of water – do not have proper supply of drinking water. Those who were settled in the command area of the project, in district of Hissar far away from their homes and culture, were allotted bad quality lands, overgrown with bushes and undergrowth. An entire generation spent its life in backbreaking work to try and make these lands cultivable. Fifty years after displacement their lives are not yet back on track, and they are still fighting to get themselves properly established. Many of them have not got titles to their lands or house plots. Many of the house plots are still under the encroachment of local people. The oustees do not find political representation as they are in the minority, and their grievances are not properly heard for the same reasons. They find themselves cut off from their relatives and culture, and feel like aliens in a strange land even after so many years. They are still dersogatorily called bilaspuriyas (as they came from Bilaspur district) by the locals. Since large number of them have small land holdings, they are hard hit by the worsening economy of agriculture.
Their voices still convey the pride they had felt, in the days when the country was just independent, that they had been called on to serve the country through giving their lands and watan (homeland). This has been replaced by a deep sense of being betrayed by the nation.
Now there is another set of people who are being pushed headlong towards displacement – economic displacement. These are the farmers of Punjab and Haryana. And therein lies one of the biggest tragedies of this chronicle.
Wherever we went in Haryana or Punjab, we hardly heard exuberant voices extolling the virtues of the project. In Punjab this was understandable since the Bhakra project has little in terms of contribution to the state. In Haryana, we went across the command area of the project. At places people told us about the transformation brought about by the project. Yet, the voices were weighed down by distress; the eyes were full of apprehension about the future. Everywhere we went, people told us that after the first 15-20 years of progress, the problems began. They pointed out to us that much of what is being seen around (the houses, the tractors, the prosperity) is the gift of those early years. And things are crumbling now. There is little doubt about it – there is a deep crisis in the agriculture in the two states.
Ironically, the roots of the crisis lie in the same factors that brought in the much envied, much referred to prosperity.
The groundwater that has been the real driving force behind the agriculture growth is declining rapidly. Farmers with 5 H.P. motors have had to shift to 10 and then 20 H.P. motors, and now have to go for submersible pumps. Canal irrigation is leading to large-scale problems of waterlogging and salinity. Prolonged use of fertilisers and chemicals has dramatically reduced the fertility of the soil, and higher and higher levels of inputs are needed to get the same output. The yields have stagnated, and in some cases – like rice – are going down. Pests have increased, and crops like cotton have been devastated. The two states have been locked into virtual mono-cropping of rice and wheat. Attempts to change the cropping pattern are not working due to a combination of economic, ecological and political reasons. The farmer is caught in a pincer as the costs of inputs are mounting, and the price of the output is not keeping pace. Indebtedness is rising among the farmers and the small farmers are hardest hit.
A Journey into the Realm of Bhakra xxv
There is pressure on the Government to cut the subsidies that manage to support much of the system. The crisis is so serious that number of farmers in Punjab have resorted to committing suicide. Suicides of farmers in the state where farming is supposed to be most prosperous in the country is an indicator of the gravity of the situation and an omen.
At one village, we asked to talk to the landless families. We were again and again brought to people with lands. When we repeated our request – we were told that these people have only 1-2 acres of land, and hence are as good as landless. To us, there could be no bigger indicators of the crisis of agriculture than the suicides of farmers and this.
One would have thought that in states considered to be the pinnacle of agricultural achievement and prosperity, in the land of Bhakra, agriculture would be so rich that 1-2 acres would be enough for a person to live well. But it is not so.
There is little doubt that the agriculture and the farmers of the two states are paying a high price for the short burst of prosperity. Agriculture in the state has lost the resilience to take on new challenges. Both the economic, and ecological foundations of the agriculture have become shaky. The system has become highly vulnerable to outside shocks. Ecological shocks are already being felt, as are economic. And the WTO is waiting in the wings to administer blows which will be impossible for this system to take. In both states, farmers, analysts and social activists expressed grave fears that if the minimum support prices were withdrawn under the pressure of WTO, and they were forced to sell at market price, lakhs of farmers would be rendered bankrupt.
This of course, is a part of the larger crisis of agriculture. Punjab and Haryana are the furthest down this path to agricultural “prosperity”, and hence have reached the end of the path earliest. Others on the same path can but reach the same end. But if the “magnificent” Bhakra project has not protected the two states against this, then this is food for thought. Our study has shown that in this model, there will be a short-lived burst of prosperity, followed by long-term, permanent devastation. Somewhat like a supernova.
Unfortunately, at the official level, there seems to be little understanding of, or willingness to address the root causes. The Punjab Government set up a committee to address the agricultural crisis in the state which gave its report in the year 2002. It is known after its Chair as the Johl Committee. The main thrust of the report is that the problem of Punjab is that of plenty. It is locked into the wheat-rice cycle and produces such abundance that it is difficult to find a market for it. The proposed solution? State subsidy to the farmers to stop growing wheat and rice on about 1 million ha – to be given even if they do not grow anything.
The report exposes one of the most important dimensions of the food problem in India. It reveals the reason behind the fact that even as we trumpet that we are now self-sufficient in food, that we now export food, millions still go hungry in the country. We quote:
“India has accumulated huge stocks of foodgrains that are not finding market and are proving to be a heavy drain on the state exchequer and the government is obliged to purchase substantial new arrivals at higher and higher prices every season under the system of Minimum Support Prices. Although as per the nutritional requirements of the Indian population, these stocks may not be considered in excess, yet due to the lack of purchasing power with the poor, supply exceeds demand….”
This lack of the purchasing power is the main reason for the perversity of huge food stocks, of exports at subsidised prices even as millions go hungry. And the roots of the lack of purchasing power go deep to the strategy of selectivity, intensification and centralisation. The roots go back to the strategy of the separation of the means to achieve the two objectives of increasing production and the subsequent equitable distribution- the strategy of concentrating inputs, resources and investments in small areas to increase production and then hope that the rest can buy this production. But buy with what? since this approach creates purchasing
xxvi Unravelling Bhakra
capacity only in pockets. Big dams like Bhakra exemplify the unfolding of this strategy on the ground, as they concentrate benefits in selected areas.
Unfortunately, we are not learning from these developments in Punjab; a similar situation is rapidly developing in the economy in the other sectors. Under the policies of globalisation, liberalisation and privatisation, we are having high rates of growth – but without growth in employment. The same mistake – of jobless growth; we should be ready for the same results.
Fortunately, we also found a number of people in Punjab and Haryana thinking along more fundamental lines. And therein lies hope. We found groups worrying about the impacts of the large-scale use of chemicals and pesticides. We found people who are concerned about the soil degradation due to excessive chemical input and are trying to create a shift to organic agriculture. We found people trying to document and revive traditional water resources, tanks and ponds. Villages like Sukho Majri show how local water harvesting, diversity of cropping and use of organic inputs can lead to high yields and minimum debts for the farmers.
When we travelled in Punjab and Haryana, we heard the desperation in the people’s voices. Some farmers also told us – when the country needed us, we were there to help the country produce food. Now that we are in trouble – will the country not help us? Even if our report just leads to an answer in affirmative to this question, we will feel that our efforts have not been in vain.
It would be incomplete to end the tale of this journey without a word about the other discoveries we made – almost as a sort of a by product but probably equally valuable.
The first thing we came across, and something that was a constant all along the way has been the wonderful, warm and generous hospitality of the people of Punjab, Haryana and Himachal. And this is not just our friends but everyone. Complete strangers welcomed us into their homes, fed us superbly, and shared their life experiences with us. The latter especially has been a privilege.
We discovered why the simple traditional meal of makke-ki-roti sarson-da-saag ranks among the most wonderful food in the world – even though the makka may no longer be growing so much, replaced by wheat and rice. We realised the true meaning of the lassi and paratha – and that what we called by these names back home were poor country cousins.
We found out that music in Punjab is much more than “balle balle” or the more recent “Tunuk Tunuk” as we were introduced to the mellifluous songs of Asa Singh Mastana, Surinder Kaur and others.
We also came across some not so pleasant facts – the low female: male ratio in Punjab to name one. Or, the striking absence of women in the markets of the small towns of Haryana – an indicator of their role and status.
We found the obsession with “foreign” in the Doab region to be just as the stories have it. Almost every family from this region of Punjab seems to have a member abroad. It was also later given to us as a reason why the farming families are able to make ends meet here.
Two stops on our journey are particularly memorable. One was at Khatkad Kalan – a brief stop on the way from Ludhiana to Bhakra, to pay a visit to the birth place and home of Shahid Bhagat Singh. The other was at the Gurudwara at Anandpur Sahib, where, apart from other things, the lunch at the langaar reminded us that the generosity and hospitality of the Sikhs is not restricted to individuals but extends to the community.
All these not only made our journey so much more enjoyable and pleasant, it also offered to us insights into famous entrepreneurial spirit of the Punjab (and Haryana) farmer, and the culture and society in which the subject of our study is placed.

A Journey into the Realm of Bhakra xxvii
Yet, we have come away with a sense of despondency. The crisis we saw in the agriculture is very real, and deep. And it is not just going to be restricted to the two states, but is likely to engulf much of the country. No farmer we met was untouched by it, and no one could refrain from referring to it. Before we embark on the details of this journey of ours in the next chapters, as a reminder of our mission, of what we found, we can do no better than end with two quotes – one, from an official, the other from a farmer.
Report of the S.S. Johl Committee, Government of Punjab, Oct. 2002:
“On the other side, continuous production of wheat and rice in annual rotation in the irrigated areas of Punjab is having a deleterious effect on soil, water, environment and social fabric of the state. Soils of Punjab have become virtually a laboratory culture that requires higher and higher doses of fertilisers, micronutrients, insecticides and pesticides to produce same level of wheat and /or rice. This has resulted in declining total factor productivity. The situation is becoming very serious day by day which can very soon proved to be economically disastrous, socially untenable and politically unsustainable, which can turn into man-made national calamity if not dealt with judiciously.”
Sardar Gurmail Singh, Village Bada, District Ropar:
“All that you can see around in Punjab [the prosperity] all that you have heard about it, please do not believe it. Things are not what they seem. Punjab is on the brink…”

This page is intentionally blank.
1The Indus Basin,
Irrigation Developmentand the Bhakra Project
“The Indus Plains offered to man a set ofnearly homogeneous physical geographicconditions that eventually allowed him todevelop there the largest contiguous irrigationsystem in the world......Nowhere else on earth had nature providedsuch lavish quantities of water that could betapped without reservoir storage for gravitydistribution.”
Alloys Arthur Michel,The Indus Rivers: A Study of Effects of Partition
The Indus Basin 3
The Indus Basin, Irrigation Development and the Bhakra Project
THE STUDY OF DEVELOPMENT OF IRRIGATION IN THE INDUS BASIN IS fascinating – to the historian, to the engineer, to the geographer, indeed, to the student of human civilisation. To trace the history of irrigation in the basin is to follow the intricate and rich course of human civilisation on the march – with all its greatness and pettiness, with all its grandeur and simplicity, with all its achievements and all its follies.
Unfortunately, the scope of this study does not allow us too much time and space to lay out for the reader this captivating endeavour in its entirety. However, it does demand an understanding of the Indus Basin and the developments in irrigation on and around the mighty Indus rivers. For Bhakra is squarely and firmly set within this larger framework. We can only hope that this brief introduction will entice the reader into undertaking this journey on her own, a journey that we found so fascinating and enriching.
THE INDUS BASIN
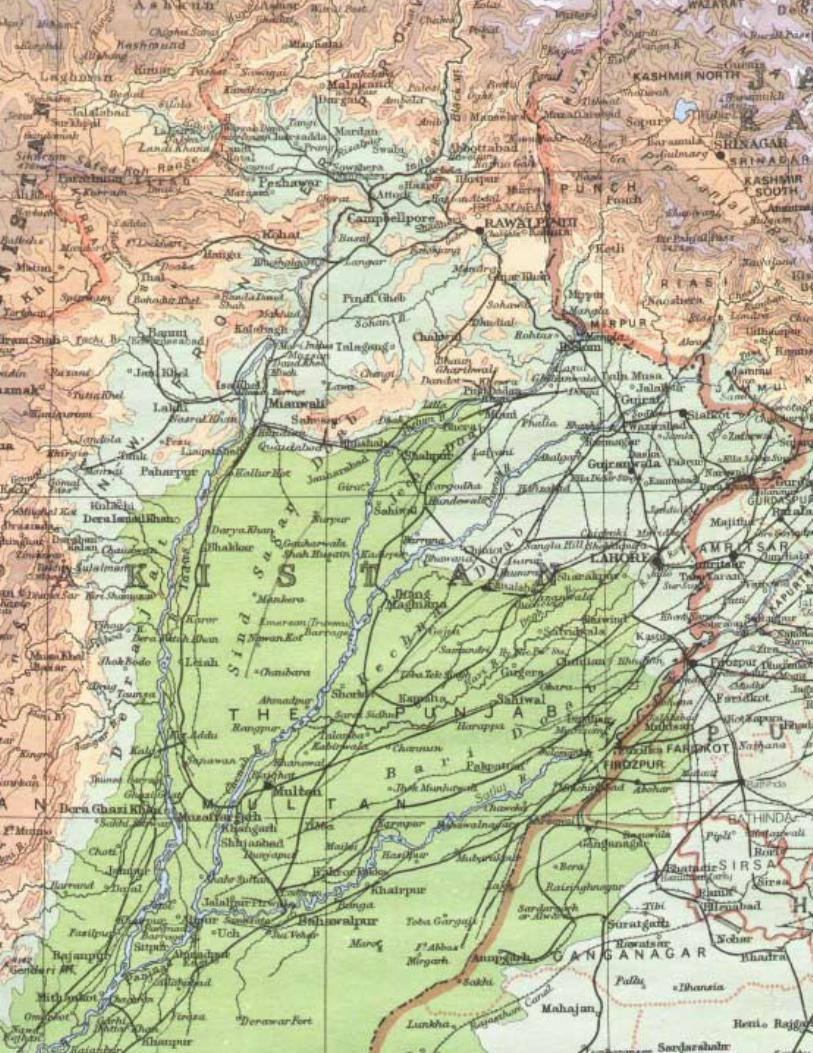
The Indus Basin is roughly 944568 sq. km in area. Out of the total area, about 415434 sq. kms lie in the highlands of Tibet, India, Afghanistan and Pakistan. The rest comprises the Indus plains, one of the most homogenous physiographic regions in the world1. The depth of the alluvial deposits in the plains is believed to average a mile or more!
The Indus system ranks among the mightiest river systems in the world. It comprises of the five major left bank tributaries and one major right bank tributary - Kabul. The left bank tributaries are (in order from the South, counterclockwise) Sutluj, Beas, Ravi, Chenab and Jhelum. Before Partition, all these five rivers flowed through Punjab2, giving it its name – punj meaning five and aab meaning water.
Some people argue that the Ghaggar (sometimes identified as the ancient river Saraswati –originating in Himachal Pradesh and flowing through Punjab and Haryana before meeting the Hakra in Pakistan) is also a part of the Indus basin, but opinion is divided on this. However, in our study, two rivers other than the Indus rivers play an important part – the Ghagghar and the Jamuna – even though they are not in the Indus basin, and we shall also have a look at these along with the Indus rivers.
THE INDUS RIVERS
Map 1 shows the major rivers of the Indus basin. It would be useful to refer to this as the reader goes through the following text. Since we will be dealing with period before and after Partition, we will indicate, where the context does not make it clear, which areas are in India.
1 Michel 1967. For this chapter on the irrigation developments in the Indus Basin, we have primarily relied upon
Michel 1967, Dhillon 1980, Dhillon 1985, Govt. of Rajasthan 2002c and some other references. 2 The reader may recollect that the pre-partition Punjab included today’s Indian and Pakistani Punjab.
4 Unravelling Bhakra
The Indus
The Indus rises near the Mansarovar in Tibet, it flows through Ladakh, Kashmir, the N.W. Frontier Province, the Punjab (Pakistan) and finally through the Sindh region of Pakistan into the Arabian Sea. At Attock, in Pakistan (NWFP), when it has travelled 1448 kms from the source, the river Kabul meets it from the right. Indus enters the plains here.
From Attock, it flows south, and at Mithankot, about 805 kms from the sea, it receives the Punjnad – the combined waters of the five eastern tributaries – Sutluj, Beas, Ravi, Jhelum and Chenab. The river empties into the Arabian sea through several mouths near Karachi. The total length of the river from source to sea is 2880 kms out of which 1114 kms are in India.
From Mithankot to the sea - the Indus flows a lone “exotic stream” like the Nile below the Atbara junction – that is, it has no perennial tributaries.3
The drainage basin of the Indus is estimated to 264178 sq. kms out of which 168335 is in India.
Jhelum
The Jhelum has its origin in Kashmir. In Kashmir, it receives the waters of Lidder, Sind and Poonch. The Wular lake is a sort of delta for the river. From Kashmir, the river flows into Pakistan. It enters the plains of Pakistan near the city of Helium in the Punjab province. About 320 kms down, it joins the Chenab at Trimmu. The river has a total length of 724 kms out of which 402 kms is in India.
Chenab
The Chenab rises in Lahual in Himachal Pradesh. It starts as 2 streams, the Chandra and the Bhaga. These 2 streams meet after traversing 115 miles and 85 miles respectively, and are then called the Chenab. The united stream flows into Kashmir. It flows for 250 kms between steep cliffs and 40 more kilometers before entering Pakistan. It enters Punjab (Pakistan) at Sialkot, near the Marala barrage and flows in the southern direction and is met by the Jhelum at Trimmu. It continues to flow in the southern direction. It later is met by the Ravi and then the Sutluj. After its confluence with Sutluj, which itself has received the Beas by then, the combined river is called Punjnad. The Punjnad itself flows a short distance before meeting the Indus. Its total length is 965 kms out of which 378 is in India.
Ravi
The Ravi rises near the Rohtang pass in the Kulu district of Himachal Pradesh in India. It then enters Punjab (India) near Madhopur, the site of one of the earliest diversion schemes in the Indus basin, flows through Gurudaspur district, to the region between Sialkot and Amritsar districts, forming the international boundary between India and Pakistan. It then enters the Lahore district, Multan district and meets the Chenab at Sidhnai. The river flows a course of about 1100 kms out of which 370 is in India.
Beas
The Beas is shortest of the 5 left bank tributaries of the Indus. It rises near the Rohtang pass of the Kulu district of Himachal Pradesh in India, traverses the Mandi district and then enters the Kangra district. The river meets the Shiwalik hills in the Hoshiarpur district. It enters the plains near Talwara. It then takes a turn in the southern direction, forming the boundary between the Hoshiarpur and Gurdaspur districts of Punjab, India. After this, it forms the boundary between Kapurthala and Amritsar districts of Punjab, India. It then flows in a south-
3 Michel 1967: Page 36
The Indus Basin 5
westerly direction. In the lower reaches, the river moves shifting from year to year through the alluvial valley and meets the Sutluj at Harike in Ferozepur district. Its chief tributaries are the Black (Siyaah) Bein and White (Safed) Bein. The Beas has a total length of 460 kms, all of it in India. It is the only one out of the major tributaries of Indus to flow entirely in India.
The Beas used to flow all the way to the Chenab above the Panjnad but was captured late in the eighteenth century by the Sutluj near Harike.4
Sutlej
The Sutluj rises from the Mansarovar lake in Tibet. It has a very long course through the mountain ranges. It passes through Himachal Pradesh. From the Bilaspur district of Himachal, it enters Punjab (India) in Hoshiarpur district and then on to Ropar. Here it forms the divider between the Jullundhar doab and the Sirhind plateau. From here it flows in a south-westerly direction through Ferozepur where it receives the Beas at Harike. It then crosses into Pakistan. It flows on to receive the Chenab waters at Madwaala and joins the Indus at Mithankot in Muzaffargarh district. The total length of the river is 900 miles or 1448 kms, out of which the length from Mansarovar to the Indo-Pakistan border is 1078 kms. Thus, it flows on for about 370 kms in Pakistan before meeting the Chenab, after which the river is called Punjnad.
Their are strong indications that the main channel of the Sutluj has been shifting westwards. It is reported that around 1000 A.D., the Sutluj did not join the Indus system but was a tributary of the river Hakra, and then flowed into the eastern Nara. By 1245 AD, the river shifted towards the North resulting in the drying up of the Hakra river system. Further shifts towards the west occurred during 1593 and 1796.5
Table 1.1 summarises the catchment areas and flows of the main Indus rivers.
Table 1.1: Catchment and Runoff of the Indus Rivers at Rim Stations6
River Gauging
Station
Catchment
Area
(Sq. Km)
Average Annual
Run-off 1922-61 (Million Acre Feet)
Sutluj Ropar 48044 14.0Beas Mandi Plain 16834 13.0Ravi Madhopur 8028 7.0Chenab Marala 29525 26.0Jhelum Mangala 33410 23.0Kabul Warsak 67339 17.4Indus Attock 264178 93.0
It appears that the figures for Kabul are included in the Indus figures.
To put it in perspective, it may be mentioned that the aggregate mean annual flow of the Indus River and its tributaries, when they emerge from the Himalayan foothills, is about twice that of the Nile and three times that of the Tigris and Euphrates combined.7
Ghaggar
As mentioned earlier, the Ghaggar is sometimes identified as the ancient Saraswati, once flowing into the Hakra. The Ghaggar has its origins in the Shimla district in Himachal Pradesh, entering Haryana near Kalka. The river criss-crosses the Punjab-Haryana boundary
4 Michel 1967: Page 32 5 Government of Rajasthan 2002c: Page 10 6 Michel 1967: Page 33 7 Gulhati 1973 : Page 18
6 Unravelling Bhakra
several times. It also cuts across the Bhakra Main Line and then the Ghagghar branch of the Bhakra system. The river is tapped at the Ottu Headworks (weir). The river ultimately disappears into the sand of the Thar desert. There are signs of rejuvenation of the river in the last few decades. It is not a perennial river but has extensive floods in monsoon.
Yamuna
The Yamuna (Jamuna) originates from the Champasar Glacier at an altitude of 4421 m in the state of Uttaranchal. Some say the source of the river is the Saptarishi Kund, a glacial lake. There is a sacred shrine of Yamunotri or Yamnotri, near this source at an altitude of 3235 m.
From Uttaranchal, the river flows into the state of Himachal Pradesh. After passing Paonta Sahib, Yamuna flows along the boundary of Haryana and Uttar Pradesh and after exiting Haryana it enters Delhi, and then Uttar Pradesh again, and continues to flow till it merges with the river Ganga (Ganges) at Sangam or Prayag in Allahbad (Uttar Pradesh). The total length of the river is 1,370 km. Its major tributaries are the Chambal and Betwa rivers.
Yamuna river forms the eastern boundary of Haryana with Uttar Pradesh. Yamuna enters Haryana near the Kalesar forest in Yamunanagar district. It flows south along the districts of Yamunanagar, Karnal, Panipat, Sonipat, and exits Haryana near Hasanpur in district Faridabad. At Tajewala barrage in district Yamunanagar, the waters of the river Yamuna are caught and diverted in the Western Yamuna (Jamuna) Canal for irrigation. The world famous Taj Mahal is situated on the banks of this river in Agra, Uttar Pradesh. This river is also called Yamna, Jamna and Jamuna in different Hindi dialects.8
The river, though not a part of the Indus basin, is important because this is one of the major rivers to flow thorough the unified Punjab (The Haryana portion). The Western Jamuna canal (WJC) taking off from the river was one of the earliest such canals and irrigated and still irrigates substantial parts of Haryana. Parts of the WJC areas have been now transferred to the Bhakra system and form part of the Bhakra command.
THE DOABS
The doabs are regions that lie between two rivers. The word comes from do – meaning two and aab, meaning water. As per custom, the names of the doabs have been derived from the names of the two concerned rivers. With six major rivers, the Punjab has five doabs. They are given below.
Table 1.2: Name and Location of Doabs
Sr. No. Name of Doab Location
1 Bist Doab The region between the rivers Beas and the Sutlej covering the districts of Kapurthala, Hoshiarpur, Jullundhar, Nawan Shahr of present day Punjab
2 Bari Doab The region between the rivers Beas and Ravi covering the districts of Gurdaspur, Amritsar, Lahore and Montgomery. (Gurdaspur and Amritsar are in present day Punjab and Lahore and Montgomery are in Pakistan).
3 Rechna Doab The region between the rivers Chenab and Ravi. 4 Chaj Doab (Earlier works
refer to this as Jech Doab) The region between the rivers Jhelum and Chenab.
5 Sind Sagar Doab. Also known as the Thal Doab
The region between the rivers Indus and Jhelum.
8 Govt of Haryana website http://www.haryana-online.com/yamuna.htm
Accessed on Nov. 9, 2004
The Indus Basin 7
IRRIGATION IN THE INDUS BASIN
The mighty Indus has been the cradle of the earliest and one of the most advanced of the ancient human settlements. The use of the river and its water to enrich agriculture has been known to the earliest civilisation, and indeed, has been one of the basis of its development.
The history of irrigation development in the basin is a fascinating subject. Here we will restrict the discussion to briefly describing the phases, focussing mainly on developments in the regions that are in India, and developments in regions in Pakistan that have an important bearing on Bhakra.
The irrigation development in the basin can be broadly identified into the following phases:
1. Indus Valley Civilisation phase 2. Aryan Period 3. Early Muslim rulers (Arab, Turks, Afghans), Moghul and Sikh rule 4. British Rule (1819 to 1947) 5. Since 1947 Independent India and Pakistan
INDUS VALLEY CIVILISATION PHASE During the Indus Valley civilisation, the annual inundation of the flood plain of the river provided enough moisture and silt deposits to raise the crops required by the settlements. This form of irrigation was termed sailaba. Sailaab literally means flood. Irrigation from wells was in use since the ancient times in the Indus valley where water of good quality was found. There is some difference of opinion as to whether canals were used to take water to lands some distance away from the river.
Excavations at Harrappa, Mohen-jo-daro and other places have established the presence of an advanced civilisation flourishing on the banks of the Indus. These people grew food crops, cotton and kept herds. It is highly likely that such an advanced civilisation that could design and construct well graded drains, as those found at Mohen-jo-daro would, at some point, build some kind of inundation canals to take waters to lands some distance away from the river.
Several well known archaeologists have endorsed the view that the Indus Valley civilisation practised some form of flow irrigation.
Several types of bunds used either as storage or deflection structures have also been discovered from this period in the excavations. Evidence has also been found of the use of the simple (but highly effective) water lifting device Shaduf 9in this period.
ARYAN PERIOD The abandonment of the Mohen-jo-daro and Harrappa started around 1500 B.C. with a shifting of the population to Kathiawar, Eastern Punjab and Northern Rajasthan. Around this time, a distinct and important change in the agricultural practice had occurred – the sowing of two crops in a year. There is also evidence that settlements started occurring at considerable distances from the river.
The inundation canals also came to be recorded around the time of the Greek invasion as it is mentioned that the invading army was thrilled to see such canals. Inundation canals of large capacity and considerable length with efficient distribution systems were evolved.10
The technique of inundation canals was in a way taught to human beings by the river itself. In the plains, the sediment laden streams usually flow in beds higher than the level of their 9 The shaduf consisted of two poles, one which is stationery and erect, and the other, hinged on it is allowed to move
in the vertical plain. A bucket is suspended at one end of this and at the other end counter balancing weight is suspended. A single person can pull down the empty bucket into the well and then the bucket is lifted by the counter-weight.
10 Dhillon 1985: Page 13

8 Unravelling Bhakra
floodplains. This results from the fact that each time they overflow their banks they deposit the heavier and coarser sediments first, carrying only the finer sands and silts to any distance. By breaching the banks, or the natural levees, and providing shallow channels to direct the floods, it was possible to water the fields on the lower lying portions of the flood plains. Clearly, this was possible only during the high-water periods11.
An important development of this period is the emergence of tanks as a means of irrigation, though well irrigation remained more common. The construction of tanks came to be considered a meritorious deed. Construction of large size masonry dams was an additional development.
THE ARAB, MUGHAL AND SIKH PERIOD (8TH CENTURY TO 1819 AD)
Irrigation was clearly an established practise by the 8th Century, for the Arab conquerors of Sind differentiated between the irrigated and un-irrigated tracts for levying land tax.
An important step in the development was the firming up of the inundation canal supply by constructing a “headwork”. This would be some kind of construction at right angles to the flow of water, which would be strong enough to resist the force of the floods. In the lean season, these headworks would lift the water level to the level of the canal and hence the irrigation could take place in the lean season also. Such a system was called perennial system, for obvious reasons. It must be emphasised that these headworks need not extend all the way across the rivers – even building the head works across a part of the river, or of one of the channels could be enough. Neither were these in any way storage dams. These allowed the floods to pass over their crests.
While perennial irrigation of this manner probably started as early as 300 AD in India with the Grand Anicut in the south, it was to take another 1000 years in the Indus plains.12 In all probability, the reason was that it was not required.
The Western Jamuna Canal
In 1355, a canal was constructed to off take from the Jamuna with a aim to provide water to the hunting estate of the Emporer Feroz Shah Tughlak in Hissar (in present day Haryana). After his death the canal fell into disuse. In 1568 AD the great Mughal Emperor Akbar decided to restore this canal and even allowed the waters to be used for irrigation. In 1647 AD during the reign of Shah Jehan, the canal was extended to irrigate lands South-West of Delhi and also to supply water to the Red Fort. With the end of the Mughal dynasty, this fell into disuse during the early eighteenth century.13 This canal is important as this was again revived in the British period for irrigating large parts of Haryana.
The Hansli Canal
Jehangir (ruled 1605-1623) built a 80 km long canal off-taking from the river Ravi to take water to his fortress and hunting ground near Sheikhpura, where he had built a garden and a reservoir at Hiran Minar. This was the first perennial canal on any of the Indus rivers.14
Later around 1633, Ali Mardan Khan, celebrated engineer of Shah Jehan, built another canal known as Hansli, off-taking from the left bank of Ravi and this canal carried water to the Shalimar Garden at Lahore. It irrigated a part of the Bari Doab in the process. During the Sikh rule (1763-1849) a branch of this canal was constructed to carry water to the Golden Temple at
11 Michel 1967: Page 46 12 Michel 1967: Page 49 13 Dhillon 1985 Page 14 14 Michel 1967: Page 49
The Indus Basin 9
Amritsar.15 This was the precursor of the Upper Bari Doab Canal, now irrigating much of Amritsar and Gurudaspur districts.
Other Canals
Similarly, a large number of other canals were built during this phase on the other Indus rivers. On the Beas, the Shah Nehar, an inundation canal, was built around 1744 AD. This was built by private enterprise. It irrigated the area around Mukerian.
On the Sutluj, a number of canals were constructed including Khanwali inundation canal (date unknown), Upper Sohag canal (1827), Lower Sohag Canal (1816 and 1831), Lower Sutluj Inundation Canal (1831). All of these were in the area that is now in Pakistan.
Similarly, a system of inundation canals was constructed on the Chenab taking off from the left bank below its confluence with the Ravi. At one time there were 13 canals in operation but gradually they were amalgamated to four.
On the Indus itself, there was a system of 14 inundation canals.
It is during this period that the use of the Persian wheel and cattle power for lifting water from the wells became important.
THE BRITISH PERIOD 1819-1947
The British entry into the Indus Basin may be dated from 1819 when the Government of India accepted the allegiance of the Sihk rulers, extending the British rule to the tract between Jamuna and Sutluj. Annexation of Sind came in 1843 and it was attached with the Bombay Province. After the death of Maharaja Ranjit Singh in 1839 Punjab was plunged into chaos. In 1846, the Sikhs had to concede the territories between Sutluj and Beas to the British. By 1849, Punjab was formally annexed into the British empire. With this, except for some of the princely states the most fertile and best watered region had come under the British rule.
The development of irrigation in the British times can be seen in terms of two phases. Phase 1 involved the renovation and remodelling of the old canals with some new constructions. Phase 2 involved the construction of new projects. While the works undertaken were huge in range and scale, we will look only at works that are important from our point of view. (See MAP 2).
Phase I
The traces of the earlier canals systems like Jamuna, Hansli and Khanwah were the starting points for this.
Improvement of the Western Jamuna Canal
In 1817, G.R. Blane of the Bengal Engineers was entrusted with the task of restoring the Western Jamuna canal which had stopped in about 1705. The canal was restored by 1821. The enlargement and modification of the canal was taken up in 1832-33. Further remodelling with the construction of a permanent weir at Tajewala was taken up in 1873 and completed in 1879. The Sirsa branch of the canal was constructed in 1889-95. This is an important development with respect to our study as the Sirsa branch irrigated areas which were later transferred to the Bhakra command. The WJC was remodelled again in 1940-43 and irrigation extended. The WJC today commands an area of about 1.084 million ha in Haryana. Recently, the old weir at Tajewala has been replaced by a barrage at Hathnikund.
15 Dhillon 1985 Page 14
10 Unravelling Bhakra
Upper Bari Doab Canal
After the occupation of Lahore in 1849, the improvement of the Hansli canal was taken up. However, on detailed investigations it was decided to drop the old alignments and a new canal was built. This canal was the Upper Bari Doab canal (UBDC) which now irrigates large areas of Amritsar and Gurudaspur districts. It was opened in 1859. The permanent headworks at Madhopur were completed in 1879.
Grey Canals in Ferozpur District
This system of inundation canals taking off from the Sutluj was built in 1875-76. There were 11 canals and later 2 more were added. Many decades later, the Bhakra project, by drying up the Sutluj was to cut off the supply to some of these canals.
Other Canals
Apart from these, a large number of canals were either build or repaired or remodelled on all the Indus rivers. Some of these included the Upper Sutluj Inundation Canals like Katora, Khanwah, Upper Sohag and Lower Sohag, the Lower Sutluj Inundation Canals, the Chenab Inundation canals, the Indus Inundation Canals, Canals in the Sind area like Desert Canal, Begari Canal, Sukkur Canal, Garh Canal, Western and Eastern Nara canals and so on.
Canal Colonies
In 1886, the first experiment of the so called Canal Colonies came up in the Sohag canal areas.16 In this, the Britishers brought in farmers from outside the area to settle crown waste lands which could be made arable due to the canals and established colonies. No doubt, there had been earlier such attempts. In 1818, at the end of the Pindari campaign, the British tried to resettle disbanded regiments in Rohtak and Hissar. But these were not canal colonies as there were no canals. This is probably an important reason for their failure. In the UBDC, the decisive motivation was to settle the sepoys of the defeated Sikh army by giving them grants of land.17 But the major canal colonies were to come after 1883 with the Sidhnai project and others that followed (see below). With the Lower Chenab Canal, the colonisation process was firmly established. Several new towns came to founded, named after the respective Settlement Officers at that time like Lyallpur, Montgomery etc.
Phase II
The Second Phase of the British period involves the construction of new projects.
Sirhind Canal Project
This is a project on the Sutluj river with a headwork at Ropar. This is a very important project from our point of view as all of the area irrigated by the Project is in the Indian Punjab. This project commands a large area in Punjab even today.
This was the first project to be conceived independently of an existing inundation canal. The scheme involved a treaty between the party States (princely states) of Patiala, Nabha, Jind, Faridkot, Kalsia and Malerkotla, and work was started in 1869 and completed in 1882. The project initially ran into lot of problems due to faulty design but this was later corrected. The major branches of the Sirhind Canal are Abohar, Bhatinda, Kotla, Ghaghhar and Patiala branch. Much later, the Sidhwan branch was added to compensate for the loss of Grey canals due to the Bhakra project.
16 Government of Rajasthan 2002c: Page 26 17 Michel 1967: Page 66
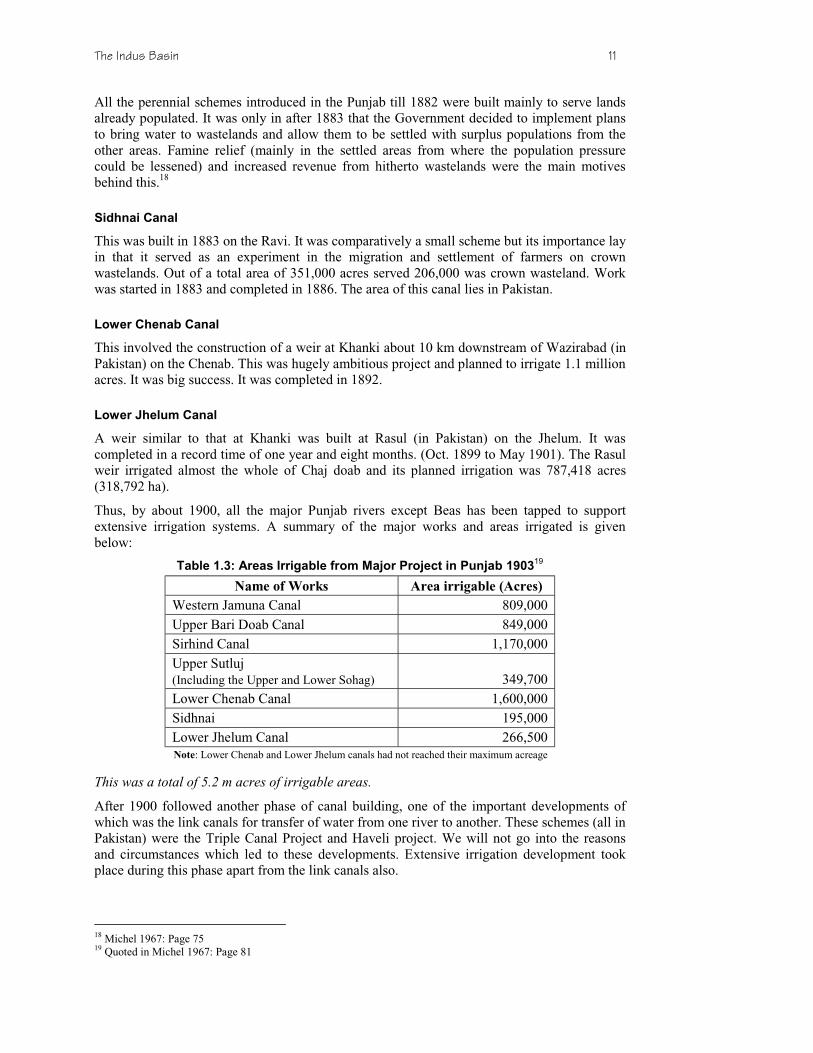
The Indus Basin 11
All the perennial schemes introduced in the Punjab till 1882 were built mainly to serve lands already populated. It was only in after 1883 that the Government decided to implement plans to bring water to wastelands and allow them to be settled with surplus populations from the other areas. Famine relief (mainly in the settled areas from where the population pressure could be lessened) and increased revenue from hitherto wastelands were the main motives behind this.18
Sidhnai Canal
This was built in 1883 on the Ravi. It was comparatively a small scheme but its importance lay in that it served as an experiment in the migration and settlement of farmers on crown wastelands. Out of a total area of 351,000 acres served 206,000 was crown wasteland. Work was started in 1883 and completed in 1886. The area of this canal lies in Pakistan.
Lower Chenab Canal
This involved the construction of a weir at Khanki about 10 km downstream of Wazirabad (in Pakistan) on the Chenab. This was hugely ambitious project and planned to irrigate 1.1 million acres. It was big success. It was completed in 1892.
Lower Jhelum Canal
A weir similar to that at Khanki was built at Rasul (in Pakistan) on the Jhelum. It was completed in a record time of one year and eight months. (Oct. 1899 to May 1901). The Rasul weir irrigated almost the whole of Chaj doab and its planned irrigation was 787,418 acres (318,792 ha).
Thus, by about 1900, all the major Punjab rivers except Beas has been tapped to support extensive irrigation systems. A summary of the major works and areas irrigated is given below:
Table 1.3: Areas Irrigable from Major Project in Punjab 190319
Name of Works Area irrigable (Acres)
Western Jamuna Canal 809,000Upper Bari Doab Canal 849,000Sirhind Canal 1,170,000Upper Sutluj (Including the Upper and Lower Sohag) 349,700Lower Chenab Canal 1,600,000Sidhnai 195,000Lower Jhelum Canal 266,500Note: Lower Chenab and Lower Jhelum canals had not reached their maximum acreage
This was a total of 5.2 m acres of irrigable areas.
After 1900 followed another phase of canal building, one of the important developments of which was the link canals for transfer of water from one river to another. These schemes (all in Pakistan) were the Triple Canal Project and Haveli project. We will not go into the reasons and circumstances which led to these developments. Extensive irrigation development took place during this phase apart from the link canals also.
18 Michel 1967: Page 75 19 Quoted in Michel 1967: Page 81

12 Unravelling Bhakra
However, we will look at two major projects in this period which are of significance to us. These are the Sukkur project on the Indus in Sind (in Pakistan), and the Sutluj Valley Project in Punjab. (both Pakistan and Indian Punjab).
The Sutluj Valley Project
The Sutluj Valley Project (SVP) was a grand scheme consisting of four new barrages on the Sutluj. It was proposed in the early 1900s but had to await an agreement between the parties concerned – the Government of India, Punjab Government and the States of Bahawalpur and Bikaner. This agreement took place in 1919 and the project was sanctioned in 1921. It was built over the next several years.
The Sutluj Valley Project (SVP) consisted of four barrages and number of canals taking off from these. All the four barrages were downstream of Harike, where the Beas has already been received by the Sutluj. In brief, these were:
1. Hussainiwala Barrage (Ferozpur): The only barrage in territories now in India. Canals included Dipalpur (right bank) going to Pakistan, and the two left bank canals serving areas now in India - Bikaner canal serving Bikaner State (also called Gang Canal) and the Eastern Canal (in Ferozpur) which replaced large part of the Grey canal areas.
2. Suleimanki Barrage: Three canals
3. Islam: Three canals
4. Punjnad: (This was below the confluence of Sutluj and Chenab, which means that the water of all the five rivers was included in this.) Two canals off take from this.
The Culturable command area of the SVP was a huge 7.46 million acres or 3.02 million ha. (Most of it, except as indicated above was in areas that are now in Pakistan)20
Sukkur Barrage
The other project of our direct interest is the Sukkur project in Sind, then a part of the Bombay province. This project was sanctioned in 1923. It provided for a barrage to be located 3.2 kms downstream of the Sukkur Gorge. Three canals were to take off from the right bank and four from the left bank. The Culturable Command Area was 523,160 acres or 211,723 ha. (All in Pakistan)21
An important development during the early 1900s was the setting up of the Irrigation Commission (1901-1903). What was noteworthy was that the work of the Irrigation Commission for the first time represented an attempt to plan on a basin wide basis, with an effort to try and understand the impacts of various projects on others. One direct fallout of this was the coming to fore of the Sind-Punjab water disputes.
Sind is downstream of Punjab and all the waters of the Sind came through Punjab. Sind does not have any of the five major tributary rivers flowing through it – only the Indus. But since the flow of Indus includes the flow of all its tributaries by the time it enters Sind, any abstractions of the flows of these rivers was bound to affect Sind. “To the [Irrigation] Commission were presented the misgivings of Sind, then a part of the Bombay Government, that withdrawals in the Punjab would prejudice existing inundation works and proposed perennial systems along the lower Indus”.22
20 Government of Rajasthan 2002c: 31-33 21 Government of Rajasthan 2002c: 33 22 Michel 1967: Page 93

The Indus Basin 13
As we shall see in detail later on, the Sind Punjab disputes were to profoundly affect Bhakra project and have a significant bearing on our understanding of the project.
By the early 1940s, the Indus basin system was probably the largest contiguous irrigation system in the world. At the time of Partition, area within the command of the Indus system was 10.5 million ha (26 million acres) – and all of it without any storage dams.23, 24 Apart from this, another 1.91 million ha (4.73 million acres) was irrigated solely from wells. 0.88 million ha (2.17 million acres) was being cultivated under sailab irrigation.25 This was the vast system against the background of which the Bhakra project came up.
THE BHAKRA-NANGAL PROJECT
We will discuss the details of the planning of the Bhakra Nangal project in a separate chapter. However, we will place before readers the Bhakra project as it stands today, so as to be familiar with its main feature. (See the layout diagram MAP 3)
The Bhakra Nangal project is a complex system of several dams, reservoirs, inter-basin transfer linkages, powerhouses and a vast canal network. Meshed with this (in part of the areas) is the canal network of the Western Jamuna Canal (WJC) in Haryana, and large number of shallow and deep tubewells in the command. The system is complex and has numerous inter-linkages with the Beas and the Jamuna system. It is also integrated with the much older Sirhind system in Punjab which too takes off from the Sutluj. The two systems are supposed to share the deficits or surpluses in the river.
The towering Bhakra dam is built on the river Sutluj near the Bhakra village in Himachal Pradesh, just before it enters into Punjab. The height of the dam from the deepest foundation is 740 feet. A huge storage reservoir, the Govind Sagar stretches out behind it. The reservoir area is 168.35 sq. km. The inflow into the reservoir consists partly of snowmelt, partly of rainfall run-off and partly from the waters of the Beas diverted into the Sutluj.26 The Bhakra dam has a catchment of 56,980 sq. km. It is not clear if this catchment includes the catchment of Beas from where the waters are diverted into Bhakra. The maximum Reservoir Level is 1680 feet, and at this level the reservoir has a Gross storage of 9340 m cum (7.57 MAF) and a live Storage of 6911 m cum (5.60 MAF)
27. Sometimes one may read the maximum Reservoir Level given as 1685 feet. The last 5 feet are now used to cushion the floods28.
The Pandoh dam on the Beas river, (called Beas Unit I) diverts 3.82 MAF of Beas waters annually into the Sutluj. This is the Beas Sutluj Link or the BSL. The dam is at Pandoh which is 21 kms upstream of Mandi and 113 kms upstream of the Pong dam on Beas (called Beas Unit II) at Talwara. Diversions are through an open channel and 2 tunnels with a combined length of 25 kms. The diversions empty into the Govind Sagar / Sutluj river at Dehar, on the right bank of Sutluj near the Slapper bridge, where a powerhouse is built to take advantage of the 150 m fall in the path from Pandoh to Dehar. The Dehar powerhouse has an installed capacity of 990 MW.29
The Bhakra dam has two powerhouses, namely the Right Bank and Left Bank. These have an installed capacity of 660 MW30 and 540 MW respectively.31 Water released through these powerhouses flows down the Sutluj for about 13 kms to the Nangal barrage at Nangal. Two
23 Gulhati 1973: Page 39 24 Out of this 8.5 m ha went to Pakistan and 2.1 m ha came to India. (Gulhati 1973: 59) 25 Gulhati 1973: Page 43 26 This diversion was implemented in 1977 with the construction of the Pandoh dam on the Beas 27 Display at Bhakra Dam Site and BBMB 2002a 28 Duggal and Garg 2002: Page 68 29 http://www.rajirrigation.gov.in/4bhakhra.htm#link visited 10 Oct 2004 30 This figure according to the BBMB website is 785 MW. In fact, different sources give slightly different figures for
the capacities of various power stations. This is due to the ongoing uprating etc. 31 CEA 1997: Page 4, and Display at Bhakra Dam Site

14 Unravelling Bhakra
channels take off from the Nangal dam. One is the Nangal Hydel Channel which goes on for 65 kms up to Ropar, from where it is called the Bhakra Main Line. Two power stations are located on the NHC namely, at Ganguwal (77.65 MW installed) and then at Kotla (77.65 MW)32. The other channel taking off from the Nangal dam is the Anandpur Sahib hydel channel.
The Bhakra Main Line takes off at Ropar, and then, through several branches serves areas in Punjab, Haryana and Rajasthan. Some parts of the Bhakra command are serviced via the Sirhind system in Punjab. Another canal takes off from Ropar to the North of the Sutluj serving the areas of the Bist Doab.
In Haryana, the Bhakra canal has replaced / supplemented in parts the irrigation already in place from the Sirsa Branch of the WJC.
According to the display at the Bhakra dam site, the project benefits include 28.8 lakh ha in new areas irrigated and improvement of irrigation in another 9 lakh ha. It also mentions an annual generation of 6500 Million Units (MU) of electric energy.
About 113 kms downstream of the Pandoh dam on the Beas is the Pong dam. From Pong, the river travels down to meet the Sutluj at Harike Patan. A barrage was constructed at Harike in 1952. The Indira Gandhi Nahar (or the Rajasthan or Raj Canal as it is called) takes off from here, along with the Sirhind feeder. The Raj Canal, as the name suggests goes to Rajasthan. The construction of the Raj Canal cut off several areas at the tail end of the Sirhind system (including some areas that were to be in the Bhakra command). The Sirhind Feeder was constructed to serve these areas from the Harike Barrage. It opened in 1958.
This, in brief is the outline of the Bhakra project. We will examine several of these components in detail in the chapters that follow.
32 CEA 1997: Page 9

2Planning The
Bhakra Project
“Bhakra Dam Project, which has a longhistory dating as far back as 1908 when theidea was dimly first conceived, remained anunrealised dream for about 40 years. Duringthis period the project was investigated andreshaped a number of times, and with eachsuccessive proposal its scope was considerablywidened by providing a higher dam with largerstorage…”
History of Bhakra Nangal Project, BBMB

INTER-DOMINION AGREEMENT BETWEEN THE GOVERNMENT OF INDIA AND THE GOVERNMENT OF
PAKISTAN, ON THE CANAL WATER DISPUTE BETWEEN EAST AND WEST PUNJAB
Signed at New Delhi, 4 May 1948
. A dispute has arisen between the East and West Punjab Government regarding the supply by East Punjab of water to the Central Bari
Doab and the Depalpur canals in West Punjab. The contention of the East Punjab Government is that under the Punjab Partition
pportionment of Assets and liabilities) Order, 1947, and the Arbitral Award the proprietary rights in the waters of the rivers in East Punjab
est wholly in the East Punjab Government and that the West Punjab Government cannot claim any share of these waters as a right. The
est Punjab Government disputes this contention, its view being that the point has conclusively been decided in its favour by implication by
e Arbitral Award and that in accordance with international law and equity, West Punjab has a right to the waters of the East Punjab rivers.
The East Punjab Government has revived the flow of water into these canals on certain conditions of which two are disputed by West
jab. One, which arises out of the contention in paragraph 1, is the right to the levey of seigniorage charges for water and the other is the
stion of the capital cost of the Madhopur Head Works and carrier channels to be taken into account.
he East and West Punjab Governments are anxious that this question should be settled in a spirit of goodwill and friendship. Without
udice to its legal rights in the matter the East Punjab Government assured the West Punjab Government that it has no intention to
hold water from West Punjab without giving it time to tap alternative sources. The West Punjab Government on its part recognize the
al anxiety of the East Punjab Government to discharge the obligations to develop areas where water is scarce and which were under-
oped in relation to parts of West Punjab.
The Indus Waters Treaty
September 19, 1960
(Karachi)
The Government of India and the Government of Pakistan, being equally desirous of attaining the most complete and
satisfactory utilisation of the waters of the Indus system of rivers and recognising the need, therefore, of fixing and delineating,
in a spirit of goodwill and friendship, the rights and obligations of each in relation to the other concerning the use of these
waters and of making provision for the settlement, in a cooperative spirit, of all such questions as may hereafter arise in regard
to the interpretation or application of the provisions agreed upon herein, have resolved to conclude a Treaty in furtherance of
these objectives, and for this purpose have named as their plenipotentiaries:
The Government of India: Shri Jawaharlal Nehru, Prime Minister of India, and The Government of Pakistan: Field Marshal
Mohammad Ayub Khan, H.P., H.J., President of Pakistan, who, having communicated to each other their respective Full
Powers and having found them in good and due form, have agreed upon the following Articles and An
Article II
Provisions Regarding Eastern Rivers
Planning the Bhakra Project 17
Planning the Bhakra Project IT IS NOT CLEAR WHEN EXACTLY THE IDEA TO HAVE A STORAGE STRUCTURE on the Sutluj was first mooted. It is even less clear as to whether this was in response to any specific need, or was a part of the general progression of irrigation development in the valley.
The earliest reference to the Bhakra project – or rather, the idea of a storage reservoir on the Sutluj – which we have come across, is of 1908. Sir Louis Dane is stated to have mentioned the idea of a storage reservoir on the Sutluj in a note dated 8 November 1908, after a tour from Shimla down the Sutluj from Suni to Bilaspur and over the hills to Nallagadh and Ropar. The idea was elaborated in a note dated Nov 29, 1909 by Mr. Gordon, then Chief Engineer, Punjab Irrigation, who considered a site three kilometres downstream of the present location as more promising.1But these references do not mention the reasons advanced by Dane or Gordon. The historical references indicate more that it was a matter of “have a site, will build a dam”. Indeed, for many decades after Independence, and even till date, the surveys of river valleys for “development” have consisted essentially of locating good sites to build dams.
A detailed report “on the site”2 was prepared in March 1910. Note that the report itself seems to be essentially on the site of the project, including mostly the feasibility of the dam, geology of the site, and the design and estimates for the dams. The cost of the project was considered prohibitive compared to its benefits and further investigations on the site were stopped.
The proposal was revived in 1915. The then Chief Engineer, Mr. F.E. Gwyther prepared a note on 20 February 1915 and concluded that the revenue earning possibilities had been greatly underestimated and were needlessly pessimistic. On the basis of this note, a Project Division was opened in October 1915 and the first detailed and comprehensive project report for a high dam at Bhakra was prepared in 1919. As per this report, the project was to consist of:
1. Bhakra Dam 2. Upper Sirhind Canal 3. Lower Sirhind Canal 4. Western Yamuna Canal Extension
It may be recollected that the Sirhind canal was already in operation since 1882.
The height of the dam at this point was to be 120.40 m (395 ft) and storage was to be 2.58 MAF (3182.38 MCM).3 The reservoir level was to be 1500 feet4 (compared to the 1685 feet as built). It was to be purely an irrigation project. According to the BBMB5:
“The project report for the first time, highlighted the devastation caused by the famine in the areas covered by it and urged taking up the project even at the risk of reduced revenues and less remuneration”. (Emphasis added)
1 Government of Rajasthan 2002c: Page 116 2 ibid; Page 116 3 Compared to what it is today – height 740 feet, storage 7.57 MAF 4 Handa and Chadha 1953 5 BBMB 2002a : Page 5
18 Unravelling Bhakra
Around this point of time began the phase of the inter-provincial dispute between Punjab and Sind on the waters of the Indus rivers. As we saw in the last chapter, Sind had expressed to the Irrigation Commission in 1901 its concern about the diversions and proposed projects of Punjab and their implications for projects of Sind. By the 1910s, this had reached the level of a dispute. This dispute was to have far-reaching impacts on the Bhakra project, both, in terms of delaying the project, and in terms of enlarging its scope and capacity. The dispute is also important in understanding the various developments all the way to post-independence. Hence, we will go into some detail of this dispute.
The Punjab Province was ruled from Lahore, and Sind at that time was part of the Bombay Province. While the 5 major tributaries of Indus flow through Punjab, the Indus flows through Punjab and into Sind. Thus the collective waters of the six rivers flow through Sind before it meets the sea. As Punjab was planning projects on the Indus and tributaries, Sind region was increasingly feeling cheated of its waters as it felt that these projects would withdraw waters from the rivers to its detriment.6 By the 1900s, Sind started raising objections to construction of weirs and canals in the Punjab region and also proposed a project of its own on the Indus at Sukkur in 1920.
Among the important projects proposed by Punjab were the Sutluj Valley Project (SVP), the Trimmu and the Thal, and of course, Bhakra. The idea of utilising the waters of the Sutluj below Harike was mooted as early as 1854, and in 1903, the First Irrigation Commission recommended a set of weirs on the Sutluj. This was the SVP.7, 8
The Sind Government had raised the dispute that Punjab’s upstream diversions would affect it adversely. The SVP especially was seen as a major problem by Sind. Punjab, on the other hand argued that the Sukkur project would create rights in favour of Sind and these would jeopardize its own projects.
It may be inferred from various documents that Sind’s arguments were acknowledged by the Government of India. The Government of India agreed that prima facie, Sind has a case; but also said that data on the flows of the Indus and tributaries was inadequate. In 1920, in what appeared to be an attempt at balancing the two sides, it said that SVP and Sukkur both could go ahead. It also called for proper measurements of the flows of the Indus rivers.
In a note prepared on 10 Dec. 1920, Sir Thomas Ward, the then Inspector General of Irrigation9
“..urged the importance of a full investigation into the supplies of the Indus and its tributaries. ‘Prima facie’, he stated, ‘it is logical to assume that the abstraction of water from the tributaries of the Indus must necessarily diminish the volume passing Sukkur, but it is quite possible that this diminution is to some extent compensated by the seepage back into the river......Unfortunately, the data available are too meagre to permit of definite conclusions.....”
However, Sir Thomas also said that the records as they exist had been examined and the Government of India was satisfied that the SVP could be taken up without prejudicing the irrigation at Sukkur. With this, the Government of India submitted the Sukkur Barrage Project for sanction to the Secretary of State in 1920, noting that10:
6 This of course is the perpetual and universal concern of a downstream area vis-a-vis the upstream. 7 Dhillon 1980: Page 54 8We have seen in Chapter 1 that the Sutluj Valley Project (SVP) as approved in 1921 consisted of four weirs and an
extensive canal system. The weirs were at Hussainiwala near Ferozpur, Sulemanki, Jamlera (Islam) and Punjnad, the last being below the junction of the Sutluj with Chenab
It may be recollected that all these projects are downstream of the confluence of Sutluj and Beas and hence Sutluj here includes the flow of both these rivers. The Sutluj is called Punjnad after its confluence with Chenab.
9 Quoted in Michel 1967: Page 118 10 ibid

Planning the Bhakra Project 19
“The data available are insufficient to enable an accurate determination to be made of the effect on the discharge of Indus at Sukkur of the withdrawals proposed by the Sutluj Valley Projects...but... the shortage at Sukkur was not likely to be greater than could be surmounted by care and economy in distribution. ‘We consider, therefore, that both the Sukkur and Sutluj Valley schemes can be safely constructed at the same time....’”
However, this position only appeared to be a balanced one, as in the process, Sir Thomas also stated, what was of course a logical conclusion11:
“It will obviously be necessary, once construction commences on the Sukkur scheme, for any future projects put forward by the Punjab to be very carefully examined in relation to the possible effects of further withdrawal from the tributaries of Indus upon the rights to irrigation from the Sukkur canals...”
One of the Punjab projects was of course Bhakra, and we will come back to the implication of Sir Thomas’s rider further on.
Interestingly, the SVP itself was a subject of dispute between Punjab and the State12 of Bahawalpur on sharing of the Sutluj waters. In 1906, the State of Bikaner, a non-riparian state also staked its claim for a share of the water. These disputes held up the SVP till 1919 though a number of projects were proposed in the interim. Ultimately, the SVP was sanctioned on 15 Dec. 1921, after an accord had been signed among the various parties in 1920.13
While Sind was concerned about the impact of Punjab’s projects on Sukkur, what is far more relevant to our discussion is the impact that the proposed abstractions at Bhakra would have had on the SVP. Remember that the Bhakra was upstream of SVP. As both the Bhakra and the SVP were projects of the same Government (Punjab), this matter did not become a “dispute”, though clearly, there was to be a significant impact.
A note was prepared by W.F. Holms, Chief Engineer, Irrigation Works, Punjab on the Sutluj Valley Projects in 1917. Among other things, the note says: 14
“13. Since the 1913 Sutluj Valley Project was prepared, the prospects of a Dam15 on Sutluj have become bright and a preliminary project is now being drawn up, which contemplates the irrigation of large tracts south of the present irrigation limits of the Sirhind and Western Jumna Canals.
“The proposals are for the storage of about 2,500,000 foot acres ......
“The distribution of Sutluj cum Beas water between Sutluj Valley and Bhakra systems will be doubtless later on form the subject of considerable discussion, and if the latter project is ever carried out the supplies available for the Sutluj Valley Canals will be to some extent modified, but not to such an extent as to vitiate any of the proposals now made” (Emphasis added)
The note then goes on to propose the restrictions on withdrawals and storages at Bhakra so as not to jeopardize the SVP. A few important points need to be noted here. One, that while the note stated that the Bhakra would not “vitiate” the SVP, it clearly talked about an impact. Second, this note talked about the impact of Bhakra on the SVP (or vice versa) in a very polite tone since both the projects were under the same Government. Sind of course was to take 11 ibid 12 In accordance with the customary usage, we shall refer the British ruled provinces as Provinces and the princely
states as States. 13 Dhillon 1985: Page 28 14 Government of Punjab 1917: ‘Sutluj Valley Project – Note dated 21 May 1917 by W.F. Holms, Chief Engineer,
Irrigation Works, Punjab on the Sutluj Valley Projects’, Public Works Department, Irrigation Branch, Punjab, Lahore
15 Dam with a “D” capital in the original!

20 Unravelling Bhakra
much stronger note of the Bhakra and voice its opinion in a far more strident tone. Third, the Bhakra project as was proposed then was much smaller in scope than present, and hence, the impact of the current project on the SVP would have been far more. Fourth, the states of Bahawalpur and Bikaner were to take much stronger note of impact of Bhakra on SVP.
So we had three projects - Bhakra, SVP, and Sukkur – in order as we go down the Sutluj. The upstream withdrawals could jeopardise or affect the downstream projects; on the other hand, if the downstream projects were built earlier, they could create rights in favour of the downstream so as to restrict the upstream development. Sanctioning of Sukkur had already done this, as we saw.
Let us go back to events in the 1920s. As recommended by the Government of India, both the Sukkur and SVP were sanctioned at this time. Punjab decided to shelve the 1919 Bhakra project in favour of the SVP. While we are not able to ascertain the precise reasons why Punjab chose to push for SVP rather than the Bharka, it seems that the objections of Sind were most important in this. The SVP was sanctioned on 15 December 1921. Sukkur Project was sanctioned in April 1923 and construction was completed in 1932.
Learning of the sanction of the Sukkur Project in April 1923, Punjab saw it as a victory for Sind, feeling that this would create rights for Sind and hence restrict its own future withdrawals.16 As Michel says: 17
“Punjab apparently concluded that Sind had won the first round. At any rate, it wanted to stake its claim in no uncertain manner, and therefore entered a protest to the restriction of further withdrawals from both, the Indus and the upstream tributaries.
“The Government of Bombay, on the other hand, strongly objected to this attitude on the part of the Punjab Government. They laid stress upon the statement of Sir Thomas Ward that all future Punjab schemes would have to be examined carefully in relation to the possible effects at Sukkur. They complained that they had not been consulted when the Sutluj Valley Project was under consideration....”
This phase is a very critical phase as the dispute heated up and affected the design of several projects. When Sukkur was sanctioned in 1923,
“(S)evere limitations were placed on the withdrawals upstream. Consequently, the 1924 [Thal Canal Project of Punjab] was revised to lower the capacity of the off-taking canals to 191.1 cumecs from 454.3......
“Punjab Government was forced, mainly by pressures by Zamindars to repeal, in 1929, the Sind Sagar Coloniszation Act of 1901 and the land was handed back to the original owners.”18
Such developments are sure to have affected Punjab’s strategy vis-a-vis Sind, and as is the response in such a case, Punjab seems to have reacted by increasing the scope and capacities of its proposed project. For example, the Irrigation Commission of 1901-03 had considered the Thal project unpromising. So Punjab had put it aside. In 1919, it was again submitted, and clearly the motivation seems to be stake a claim on the Indus waters above Sukkur. From 1923 onwards, Punjab was using three of its proposed projects in this endeavour to claim rights on the water over Sind – Bhakra, Thal and Trimmu.
16 It may be noted that since Sukkur was on the Indus at a point after all the five tributaries have been received by the
Indus, withdrawals on any of the five rivers or the Indus itself by Punjab could be objected to by Sind as impacting Sukkur.
17 Michel 1967: Page 119. A significant part of our description of the Sind-Punjab disputes and the subsequent events relies on the excellent narrative given by Alloy Arthur Michel.
18 Dhillon 1985: Page 31
Planning the Bhakra Project 21
As Michel points out for this period19:
“From 1923 on, then, the Punjab Government was in effect attacking Sind on three fronts, Bhakra, Thal and Trimmu, whichever seemed the most promising at the moment...”
One way of “attacking” was to enlarge the scope of its proposed projects, so as to try and show that it had much more need of the water, that it could command much more area, and hence its share should be higher.
This practise of inflating storage capacities and proposed commanded areas, or even proposing entirely new projects and massive “requirements” so as to strengthen one’s case in a water dispute is a regular and well known practice– even though this means that the project design is governed by criteria other than the rationale of irrigation needs and possibilities.
For example, in the dispute between M.P. and Gujarat on the Narmada waters, each state greatly exaggerated its needs and the areas it could command. In the post-partition dispute with India on the Indus basin rivers, Pakistan’s preliminary outline plan submitted to the World Bank entailed a demand for 506 MAF of water – almost three times the total supply of the Indus system.20 Such tactics were used on the Indian side as well. Paul Singh Dhillon, formerly Chief Engineer, Irrigation works, Punjab, writes about it thus21:
“The hypothesis of Ghagghar basin being a part of the Indus basin, a pet child of Gulhati, had to be adopted in the national interest in the context of negotiations with Pakistan for the division of waters of the Indus system so as to magnify the Indian part of the Indus basin and thereby prop up what, at that time, appeared to be our sagging requirements of these waters. This was necessary to strengthen our bargaining position in the said negotiations.”22
Gulhati himself summarises the prevalence of this practice, talking about the post-partition dispute over the Indus water between India and Pakistan23:
“The fight over the Indus waters was conducted on several fronts, only one but the most important of these was negotiations… Each side engaged itself, within its own border, in the construction of new works of development from the Indus and its tributaries. Some of these works had been planned before partition, others were embarked upon in attempts to secure prior right of use, to intimidate the other party, to counteract the likely effect of new works undertaken by the other party or to thwart proposals of schemes of the other party by confronting it with a fait accompli.”
Clearly, such practises did not originate with the partition, but were part and parcel of the tactics used by planners from much earlier on. The (upward) revisions in the Bhakra project undertaken by Punjab after the first scheme seem clearly to be a part of this “attack” or tactics - more to stake its claims on the waters of the Sutluj vis-a-vis Sind than on reasons of merits.
Even though the Bhakra scheme had been shelved in 1919, a series of investigations were continued at the site, focussing mainly on the geological aspects. In 1927, a Committee was formed to report on the proposed Bhakra site and this Committee recommended a 500 ft (152.40 m) high dam, as against the 1919 proposal of 395 feet. The Committee is reported to have “brought to the notice the advantages of a 152.4 m high dam over the previously
19 Michel 1967: Page 121 20 Government of Rajasthan 2002c: Page 113 21 Dhillon 1983: Page 6 22 This has now come to haunt the state of Punjab as this is now being used by Rajasthan and Haryana to claim that
they are Indus basin states, and Punjab is asserting that the former are not Indus basin states and hence cannot claim any share of the Indus rivers.
23 Gulhati 1973: 12

22 Unravelling Bhakra
proposed 120.4 m.... contemplated in the 1919 project.”24 The storage with the new proposed height was to be 4.75 MAF, up from about 2.5 MAF of the 1919 project.25
This is how a modern day politician from Pakistan describes the developments of this period26:
“In the meantime the (undivided) Punjab authorities who seem to have made mass manufacture of schemes and projects for taking away as much water from the Indus system as possible their permanent occupation or rather an eternal passion, which continues till to-day and promises to continue as long as there is even a single cusec of water left in the system, for going down-stream to the lower riparian, produced yet another massive project for the purpose, the Bhakra Dam project.”27
Clearly, Punjab was engaging Sind with the Bhakra project. Michel reports thus about the 1927 Committee Recommendations28:
“In its 1929 report, the Indus Discharge Commission agreed that the data were still insufficient to draw any conclusions about the Thal project, but suggested that a limited [supply] might be made available for Trimmu. Not content with this small gain, Punjab again resumed the offensive on the Bhakra front. The committee of experts to which the Bhakra scheme had been referred had ....greatly enlarged the scheme to encompass a 500 foot high dam. Confronted with this sizable attack, Sind....” (Emphasis added)
These events point clearly to the up-scaling of the Bhakra project not for any merits, but to create grounds for negotiations with Sind on the water disputes. Lest the issue of dates be raised (Committee’s report came in 1927 and the Indus Discharge Commission in 1929), it should be pointed out that these processes were going on simultaneously and the enlargement of the projects was not in response to any specific committee’s report but represented a pre-emptive measure in response to the broad trend of events.
It may be pointed out that the impacts of the increase in storage and height of the Bhakra on the SVP (as against on the Sukkur project) do not seem to figure in the discussions. Again, this is presumably because the projects belonged to the same state. There are indications, however, that by 1935 the State of Bahawalpur and indeed Punjab itself too felt the need to allocate waters from the (proposed) Bhakra dam for the SVP. It may be recalled that the stated purpose and justification of Bhakra was to take waters to tracts South of Sirhind and above the Western Jamuna areas.
Coming back to the late 1920s, in reaction to the “sizable attack” of a 500 foot high dam, Sind argued that the high Bhakra dam (of 500 feet), by reducing the volume of water in the annual floods of the Sutluj-Panjanad-Indus, would lead to higher deposits of silt in the Mithankot-Sukkur stretch, raise the level of bed of Indus and silt or cut-off inundation canals. It also argued that even if the Bhakra dam did not reduce the volume of water available at Sukkur, it would lower the flood in the Sutluj-Panjanad-Indus, and have a deleterious effect upon the canals in its areas. 29
24 BBMB 2002a: Page 5 25 Michel 1967: Page 122 26 Rasul Bux Palijo, undated: ‘The Sindh-Punjab Water Dispute - 1859-2002’, South Asia Centre for Peace and
Human Development. Palijo is a well known writer and scholar, politician and lawyer of Supreme Court of Pakistan and the president of Awami Tehreek – a political party. Article made available to this author by a researcher.
27 It may be pointed out that the Sind-Punjab dispute of those days never really ended with the partition but has carried on till today as a dispute between the two provinces of Pakistan. The dispute even today raises intense passions and much of Sind politics hovers around water and Punjab. So strong are the feelings that even academics use strong and emotive language when dealing with this. The feelings of being an injured and maltreated party are strong and there are obvious deep scars and unhealed wounds in the minds of people of Sind.
28 Michel 1967: Page 122 29 Michel 1967: Page 122
Planning the Bhakra Project 23
Unfortunately for Sind, these arguments were mutually contradictory, and when they were submitted to the two engineers H.W. Nicholson (From Punjab) and W.L.C. Trench (from Sind) by the Indus Discharge Commission,
“.....they were forced to agree that the inundation canals above Sukkur would not be adversely affected........ [As we shall later see, this did not mean that Sukkur itself would not be affected and it is not clear to us why Sind did not hold out the argument of impact on Sukkur in addition to the argument of impact on the canals above Sukkur]......After some further argument, the Government of Bombay withdrew its objections to the Bhakra project on March 27, 1934. But instead of proceeding with the construction at once, Punjab proceeded to redesign Bhakra once again and meanwhile to press the Thal and Trimmu projects!”30
Michel does not explain this action of Punjab in not proceeding with Bhakra. But a logical interpretation is that Bhakra (and especially an inflated Bhakra) was not really what Punjab wanted. This would be the case if Bhakra were inflated mainly to help Punjab negotiate the water-sharing dispute with Sind. Gulhati (1973: 37) says that the Bhakra project, as then conceived with a live storage of 4.75 MAF, was not proceeded with even though there was an agreement between Bombay and Punjab in 1934 because the reservoir would submerge lands in Bilaspur, an independent princely State at that time, and it had not been possible to secure the agreement of the ruler of the State for this. This, in fact, bolsters the interpretation that Punjab was increasing the height and scope of Bhakra mainly as a negotiating tool – for otherwise how could it design, and also put up for an agreement with Sind (Bombay) this higher dam without securing the clearance from the Raja of Bilaspur? Whatever may be the reasons, Bhakra was put aside at that point, and Punjab pressed for Thal and Trimmu.
However, Thal and Trimmu too became (already were) embroiled in the water disputes with Sind, and finally the Government of India appointed a committee in 1935 on the “Distribution of Waters of the Indus” to recommend an allocation that be “acceptable and equitable to all parties”. This committee was called “The Indus Committee 1935”, or the “Anderson Committee”, after the name of the Chair. The findings of this Committee represented a compromise in which all parties got something. Punjab got the final authorisation to proceed with the Thal and Trimmu project.31
We have seen that in 1934 Punjab chose not to proceed with Bhakra even though Sind (Government of Bombay) had withdrawn its objections. At this point, we have two contradictory sets of information. Michel says that in 1939, Punjab redesigned the Bhakra project for a third time, this time calling for a smaller reservoir (4 MAF) but more use of Sutluj waters for the SVP. 32, 33
BBMB on the other hand, says that investigations on the 1927 recommendations for the Bhakra project were started in 1932. In 1939, a Detailed Project Report was taken up by Dr. A.N.Khosla, then Superintending Engineer. This proposed a dam of height 500 ft, with storage of 4.75 MAF (5859 MCM) and a maximum reservoir level of 1600 ft.34 Provision was made for generating hydropower.35
30 Michel 1967: Page 123 31 Michel 1967 Page 124 32 Michel 1967 Page 129 33 It may be recollected that we had pointed out above that there had been murmurs from 1935 onwards of allowing
more waters for SVP as against being diverted to the proposed Bhakra areas. 34 It is not clear how Khosla prepared the DPR for 1600 feet reservoir level. If the project had not been able to
proceed earlier due to the objections of the Raja of Bilaspur, these would have remained valid even for this particular design. Handa (1953) points out that the Reservoir level had to be restrained at 1580 feet due to objections of the Raja.
35 BBMB 2002a: Page 6

24 Unravelling Bhakra
It is also mentioned by IGNB36 that the Punjab Government was to start construction on the Bhakra project in 1939 but this had to be abandoned due to the start of the Second World War. Michel however presents a different picture.
According to Michel37, Sind once again raised the dispute with regards to Bhakra. Sind could argue that even though it had agreed to the project in 1934, Punjab had not acted on it, and with the Anderson Committee’s report and the revision of the project once again, Sind was in its rights to re-open the dispute.
Whatever may have been the progression of events, what is certain is that the dispute reared its head once again. In October 1939, Sind requested the Governor-General to appoint a Commission under the provisions of the new Government of India Act, essentially reiterating that Punjab's projects would adversely affect its own irrigation.38
By this time, there were several important developments. In 1935, the Government of India Act had been passed and became effective in 1937. Under this act, water, irrigation, drainage, storage all came under the direct control of the Provincial Government (as against the Government of India). Secondly, the Government of Sind had come into being in 1937 and Sind was now a province by itself. Thus, with Sind and Punjab being independent provinces, both with direct control and authority over their water resources, the complaint could not be referred merely to a committee. Instead, a special, quasi-judicial commission called the Indus Commission was convened in September 1941, under the chairmanship of Jst. B.N. Rau with two engineers as members. 39 Bhakra was one of the major points of complaint by Sind. The Commission in particular noted Sind's complaint that the Bhakra project, now with a smaller storage of 4 MAF, would still burden Sind's inundation canals, and in conjunction with other projects would affect Sukkur also.
The Commission submitted its report in July 1942.
Of particular interest to us is the Commission's noting that Punjab had assigned priority to the Sutluj Valley Projects for water from Bhakra.40 Thus, the Bhakra project was being proposed and justified on the grounds of supply to the arid and semi-arid areas of Sirsa and Hissar, but in operational terms, the priority was to be given to areas already being served by SVP. Indeed, this point is reinforced by the remarks of Gulhati, who says that while in 1920s, the Sutluj waters surplus over Sirhind system's requirements had been wholly reserved for Bhakra project, in 1942, the Punjab Government altered this to the advantage of the Sutluj Valley Canals.41
To compensate Sind for the impacts of Bhakra on its projects, the Commission recommended that two new barrages would need to be built in Sind at Kotri and Gudu and Punjab should pay for the same.42
Neither Punjab nor Sind accepted the recommendations of the Commission and both appealed to the Government of India against them. For us, the relevant point is that it was eminently clear from the proceedings of the Commission that the Bhakra project would have significant impact on the downstream projects – the SVP, the inundation canals in Sind and the Sukkur project. In other words, irrigation in significant parts of the new areas to be commanded by the Bhakra would have been transfer of areas already irrigated. Or, if this existing irrigation were to be maintained, then Bhakra would not perform to the level of claims made by it.
36 Government of Rajasthan 2002c: Page 95 37 Michel 1967 Page 129 38 Gulhati 1973: 38 39 This was the precursor of today’s water dispute tribunals. 40 Michel 1967: Page 131 41 Gulhati 1973: 68. Also see Page 357 which states that “...Bhakra-Nangal project...had earlier been formulated
giving first priorities on the available river supplies to the Sutluj Valley Canals..” 42 Michel 1967: Page 132; Also Dhillon 1985 Page 35
Planning the Bhakra Project 25
Ultimately it is the former that happened, as we shall see.
While the matter was referred to the Government of India and to London, a draft agreement was prepared between the Chief Engineers of Sind and Punjab. But political events rapidly overtook them. The War was ending, and the winds of Independence had started blowing with greater and greater certainty. Partition was also looming ahead.
PARTITION
On the eve of Partition, the Indus basin had one of the most extensive and complex irrigation systems in the world. It consisted of a large number of canals taking off from weirs, barrages or just inundation canals, and lakhs of hectares of irrigated areas. Well irrigation was also present in significant areas. This system cut across boundaries of provinces and States, of language, and religion. It was as tightly knit together as it was complex.
A detailed look at the history of the events that led to the Partition shows that the irrigation system was not a very significant consideration in deciding the dividing line. In the western side of the country, i.e. in the Punjab, the partition sliced through the irrigation system, rupturing it, leading ultimately to a massive disruption that was to change its very face and nature.
While the systems of irrigation from the three so called “western rivers” – Indus, Jhelum and Chenab remained more or less intact, some systems of the three “eastern rivers” – Sutluj, Beas and Ravi were badly split up, with some headworks remaining in one country and the commands in another; with command areas themselves being split and so on.
In particular, the Ferozpur Headworks on the Sutluj (the first of the SVP) remained in India, while its right bank irrigation system served through the Dipalpur canal went to Pakistan. More important, while other headworks of the SVP went to Pakistan, India being the upstream state was now in a position to control the Sutluj river if it so wished.43
The haste with which Partition was carried out, and the terrible events surrounding it, left little time for a proper division of assets between the two new countries. The mechanisms that were set up during the partition for this, namely the Partition Council and the Arbitral Tribunal, were to continue to function till March 31, 1948. This date was to be the terminal date of the “Standstill Agreement” signed on Dec. 18, 1947, which provided, among other things, that the Pre-Partition allocation of waters in the irrigation system would be maintained. There was provision to negotiate, before the terminal date, an agreement for periods beyond it.
POST PARTITION EVENTS
On 1 April 1948, East Punjab (Indian Punjab) shut off supplies to the Pakistan portions of the Lahore and Main branches of the UBDC on the Ravi.44 Why India took such a step at this time is not really relevant to our enquiry. Michel45 speculates on some reasons – the export duty imposed by Pakistan on jute leaving East Bengal was one possible reason. The looming shadow of Pakistan's actions in Kashmir was another one. Whatever may be the reasons, it is certain that the step was an inevitable one; it was only a matter of time before India would have done this.46 That it was done immediately on the day after the Standstill Agreement
43 Of course at the time of Partition it did not have the physical armamentarium to do so. This is where Bhakra
became important. 44 The Dipalpur canal from Ferozpur Headworks was already closed, being non-perennial, but it appears that this too
was “shut off”. 45 Michel 1967: Page 196 46 Indeed, Michel states that “perhaps, most directly, the canal closures of April 1948 were an assertion of India's
claim to all the water in all the rivers that flow through her territory.” This statement is certainly a logical one and subsequent events support it.
26 Unravelling Bhakra
ended did imply some (serious) immediate consequences for Pakistan47, which could possibly have been avoided had the step been taken through a more negotiated route; but the long-term unfolding of events was unlikely to have been different, given the geo-politics of the region and the events leading to the creation of the state of Pakistan.
East Punjab's action triggered off another water dispute – this time between India and Pakistan, encompassing all the tributaries of the Indus, but especially the Ravi, Beas and Sutluj. This dispute came to be popularly known as the “Canal Water Dispute”. While the scope of the India-Pakistan dispute was huge, its sum was that India was the upstream state and in a position to control – divert for own use or disrupt, withhold as it wanted – supplies to large parts of areas served by the current and proposed irrigation systems in Pakistan – especially on the “eastern rivers” but if it came to that, also on the Chenab and even Jhelum. (To re-iterate our earlier remark, India had only limited physical capacity to so immediately, but had now got to a position where over the years it could create this physical capacity). Pakistan was hardly in such a position with respect to any of the rivers.48 The action at UBDC was merely a hint of what could lie ahead for Pakistan.
Apparently this step was taken by the East Punjab Government on its own, and Prime Minister Nehru was livid on hearing of it. Subsequently, the canal supplies were restored49 but the action of the East Punjab Government triggered off a full-blown dispute that was to occupy centre stage in Indo-Pak relations, and took over 12 years to settle.
This dispute was to re-play many of the arguments we have already seen in the case of the Sind-Punjab dispute of the pre-partition era. This is not surprising, for we can see that the Indian Punjab inherited a part of the case of the Punjab province, and Pakistan landed with part of the case of Punjab, and all of the case of Bahawalpur and Sind. In particular, by controlling the Sutluj (and Beas) possibly at Bhakra , India was in a position to affect both, the SVP and the Sukkur project. As Gulhati says50:
“West Punjab and Pakistan saw the danger signal [of the April 1948 closure], and even after water supplies had been restored to these canals and the two Dominion Governments has worked out a mutually satisfactory agreement, at least for the time being, Pakistan was highly suspicious of Indian intentions. ....Not only West Punjab but Bahawalpur and Sind were also seriously concerned.......The fact that the Indian part of the Indus basin was water-thirsty only increased Pakistan's fears. East Punjab was going ahead with the Bhakra Nangal Project and, unless the operation of the new canals of this system, when ready, was severely regulated, the canals taking off the Sutluj River lower down in West Punjab and Bahawalpur might not get adequate supply.”
Thus, a new dimension in the old Sind-Punjab water dispute was opened up by Partition. Till then, the dispute was between Sukkur/Sind and the projects of Punjab. With Partition, the SVP was pitted against Bhakra directly for the first time.
47 For e.g., the city of Lahore was deprived of the main source of municipal waters. About 5.5% of Pakistan's sown
area was also affected. (Michel 1967:196) 48 There were some minor exceptions – for example, five miles upstream of Ferozpur, the Radcliffe Award had
specified the Lahore District boundary rather than the Sutluj river as the partition line, and this gave Pakistan control of both the sides of the Sutluj here. This was one of the reasons for India to later build the Harike Barrage.
49 Through an agreement first signed on 18th April 1948 between the Chief Engineers of the two states, to come into effect when subsequently ratified as an Inter Dominion Agreement signed by India and Pakistan on 4 May 1948. This agreement later was to become highly controversial.
50 Gulhati 1973: 60
Planning the Bhakra Project 27
The Indo-Pak dispute was to go on for a long time. The course of the dispute makes for a fascinating study; but not all of it is relevant here.51 What are important are the conditions of the resolution of the dispute. The dispute was ultimately resolved with the “good offices” of the World Bank, and a not too small “helping hand” from the USA, with the signing of the Indus Water Treaty in 1960. The important provisions of the treaty were:
1. All the waters of the Eastern Rivers [Ravi, Beas, Sutluj] shall be available for the unrestricted use of India
2. There was to be a transition period of ten years –upto 31 March 1970 – when India was to release waters of the Eastern rivers for use in Pakistan. This provision was essentially to allow Pakistan time to create replacement for the waters of Eastern rivers that was being used in Pakistan. There was provision to extend the period by another three years, but then Pakistan would be subject to water charges for the water released by India.
3. Pakistan was to have unrestricted use of all the waters of the western rivers [Indus, Jhelum, Chenab], with some exceptions (India was allowed to develop hydropower on these – essentially a non-consumptive use - plus some consumptive use also)
4. Both the countries were obligated to let flow unhindered and not permit any interference with “each others” rivers.
5. Pakistan was to construct and bring into operation with due regard to expedition and economy, that part of a system of work which will accomplish the replacement, from the Western Rivers and other sources, of water supplies for irrigation canals in Pakistan which, on 15th August 1947, were dependent on water supplies from the Eastern Rivers.
6. India was to pay a fixed sum of Pound Sterling 62,060,000 (US $ 175 million)to be paid in ten annual instalments towards the cost of the replacement system in Pakistan detailed above.
Apart from the formal provisions of the Treaty there were several other formal and informal sets of understandings between Pakistan and the World Bank, Pakistan and the USA, and so on. In these, the Bank and several countries undertook to support financially the construction of the “replacement” work. Pakistan had argued that the “replacement” should not be limited to replacing only the actual uses existing at the time of Partition, but should also cover "allocations" that were not being used till then, and “development” i.e. new allocations of water. India of course did not accept this and hence the Indus Treaty covered only the actual uses. The agreements with the Bank and other countries covered the rest52. The Treaty with India was, of course, not conditional on the other agreements.
The Treaty was more or less an acknowledgment of the ground realities. Indeed, a general agreement on the broad contours of the treaty including the division of the rivers had been reached much before the Treaty itself was signed. The principle too had been clearly laid down in the Inter Dominion agreement of 4 May 1948, which had been reached pursuant to the canal closure in April 1948. It was under this agreement that the canals had been subsequently opened.53 It is unlikely that the final shape of the Indus treaty could have been anything substantially different that what it was. For one, Pakistan was hardly likely to trust India to
51 For an extremely fascinating, detailed and eminently readable account of the dispute, see Gulhati 1973. Gulhati, a
senior experienced irrigation engineer, was a key member of the Indian delegation during the dispute from 1948 till its resolution in 1960. He also headed the Indian side for much of the time.
52 This was signed as the Indus Basin Development Fund agreement between Pakistan and several others countries and the World Bank immediately after the Indus Basin Treaty was signed.
53 Interestingly, though the canals were opened as a result of this agreement, Pakistan refused to accept this as an agreement and kept calling it a “Document”.

28 Unravelling Bhakra
deliver to it supplies from the Eastern rivers on a long term basis. Not only that, it was not likely to allow India to have the power to threaten it with closure of supplies.54, 55 India too was unlikely to let go of the waters of the rivers that were flowing through its territory, especially as a large part of the Western rivers were more or less lost to her.
India itself appears to have been acting according to this belief – and the principle enunciated in the 14 May 1948 Agreement - at least as far as Sutluj was concerned. We have seen how it stopped the flow at Madhopur into the UBDC and Ferozpur into the Diplapur canals in April 1948. In the same year56, India started work on the Harike barrage at the confluence of the Sutluj and Beas.57 This was the point where India could wield full control on the waters of the two rivers, as there was no point above this where the rivers passed through Pakistan. On the Bhakra, as we will see below, India went in for another revision of the project, increasing the storage greatly.58
We are now ready with all the background to understand the developments at Bhakra after 1939.
Developments were taking place on the Bhakra project through the period even as other negotiations, the Rau Commission, the partition were happening.
We have already mentioned the DPR taken up by A.N. Khosla in 1939 which put the height of the dam at 500 feet, (Maximum Reservoir Level) MRL at 1600 feet and storage at 4.75 MAF. In 1944, the Chief Engineer of the US Bureau of Reclamation was requested by the Punjab Government to examine the site and report on the feasibility of the construction of such a high dam. BBMB also mentions a 1945-46 Project report with the maximum reservoir elevation of 1580 feet. The limitation on the MRL was imposed by the Draft Agreement of 1945 between the Punjab Government and the Raja of Bilaspur.59
In 1947 came the partition, and it completely changed the Bhakra project. Well before the Indus Treaty was signed in 1960, it seemed that India had already decided to take over the full flow of the Sutluj. Independence and the merging of the princely state of Bilaspur into India removed the restriction imposed by the agreement with the Raja. The Bhakra dam was redesigned once again in 1948 with a MRL of 1680 feet, later on raised further to 1685 feet.60 In one year, the proposed reservoir level of the dam was raised by 105 feet and the storage increased 1.6 times. The restraint imposed by the Raja of Bilaspur was removed and Bilaspur town also came under the submergence zone.61
54 This having been said, we should also point out that there are instances in International arena where international
rivers have been shared with the upstream state respecting the rights of the downstream state. 55 It may be noted, however, that through much of the dispute, Pakistan fought aggressively to continue to gets its
share of the eastern rivers. 56 There is some confusion on the date. Gulhati mentions that decision to construct this barrage was taken by Dec.
1949. Michel says work was started in 1948 and completed in 1952. However, which date is correct is not material to our arguments and makes little difference in the understanding of the situation.
57 One of the triggers apparently also was that West Punjab (Pakistan) had started to dig a new supply channel on the right bank of Sutluj, above Ferozpur Headworks, in its territory in 1948. Pakistan called this a precautionary measure. India replied that it too would then have to take “precautionary measures” and would have to tap the Sutluj further upstream. See also footnote 48.
58 It must be mentioned here, though, that the actual course of the dispute was very difficult, long drawn out, and a bitterly contested battle. It was by no means sure that India would indeed get the full waters of the Sutluj, let alone the Eastern rivers. Yet, she went ahead unabated spending crores of rupees on all the construction in preparation for the use of Sutluj. She could have landed in a rather tricky situation if, after having spent all this money, the Treaty had left her without the rights to some of the waters. Clearly, this was either a gamble, or she was prepared to defy the international pressures if such a situation arose. More likely, it was like a self-fulfilling prophecy – by constructing all these works, India made her claim on these rivers stronger – or rather, more and more difficult to reject.
59 Meanwhile, work had already started on the Nangal barrage in 1946. 60 BBMB 2002a: Page 7. 61 Apparently, the decision to increase the height of the Bhakra dam was not entirely unanimous. A note prepared by
Himanshu Thakker, SANDRP says that “The ministry of Finance then opined that due to the uncertainty about

Planning the Bhakra Project 29
As finally built, the Bhakra dam is 740 feet high above the deepest foundation, with the maximum Reservoir Level of 1680 feet62. The gross storage is 7.57 MAF and the live storage 5.60 MAF.
In forty years, from the first proposal to the time the project finally got built, the capacity of the dam went up three times from 2.5 MAF to 7.57 MAF.
What do all these changes in the Bhakra project and the events from 1920s to partition signify? Three very important conclusions can be drawn. All three are hallmarks of planning of large dams, and we see that Bhakra has not been different.
Firstly, Bhakra project was used by the (then) Punjab Government in its fight with Sind for the water rights. In the process, the scope and the storage of the Bharka project was increased mainly to enable Punjab to gain negotiating strength rather than on grounds of need of irrigation.
Secondly, the project was proposed and justified on the basis of the need to irrigate semi-arid areas (of Sirsa and Hissar), but the priority actually was to provide waters to areas already well irrigated, namely those of the SVP.
Last and not the least, the irrigation by Bhakra has been made possible essentially by transferring irrigation from lands downstream that were already being irrigated – and being irrigated without the dam. In other words, if the Bhakra project had to meet its obligations to the areas downstream - like the SVP– then the scope and areas covered by it would have been significantly smaller. This was true of the smaller Bhakra project (of 1939 with storage of 4.75 MAF) and even truer of the current Bhakra (with its storage of 7.57 MAF)63.
The numbers make this crystal clear. The Cultivable Command Area of the SVP was 3.02 million ha. If we exclude from this the area of the Bikaner canal (which was irrigating in India) and the areas irrigated from Punjnad headworks which also received Chenab waters, the CCA of the SVP in Pakistan was 2.21 m ha.64 This area eventually was completely cut off after the partition. The proposed CCA of the Bhakra project was 2.37 m ha. It is almost an exact transfer.
If we recollect the discussions, then it is clear that the Bhakra project of 1939 was to impact the SVP, the Sukkur project and other inundation canals before Sukkur. We can do no better than to quote Michel65:
“..the pre-Partition Punjab would hardly have been allowed to proceed with the Bhakra project without paying to Sind at least some of the costs of one or two new barrages (at Gudu and Kotri-Hyderabad) on the lower Indus.[Recollect that the Indus Commission had ordered this]. Pre-partition Punjab would have been subject to limitations on the size of Bhakra and on its operation – limits reflecting the
India’s share in Sutlej waters and the interests of Sutlej Valley, investment of such a huge amount on the [Bhakra] project was not advisable. NV Gadgil was then India’s Union Minister for Works, Mines and Power. ………Sain claims that though the Finance representative wanted to defer the project, it was due to his and AN Khosla’s presence at the meeting that the government decided “to continue the works on the Project”.” (Thakker, Himanshu (2005): Bhakra Project: Who, When, Where, Why, How? - Many questions, few answers, draft note, Work in Progress. Used with permission.)
62 The Maximum Reservoir Level is 1685 feet, but now the last 5 feet are left for absorbing floods and so for the storage purposes, the Maximum Level is 1680 feet. Storage at 1685 feet is 7.80 MAF
63 It is important to note that today’s Bhakra would have had a much bigger impact on the SVP and Sukkur than envisaged in 1947, for two reasons. One of course is that the storage at Bhakra today is much more than that proposed in 1939 project (7.57 MAF against 4.75 MAF). Thus, Bhakra would deprive the downstream projects of more of Sutluj waters. But it would also deprive the downstream projects of the Beas waters, since about 3.82 MAF of Beas waters is diverted into Bhakra reservoir from Pandoh. Remember that the SVP, Sukkur etc. were dependent on both the Sutluj and Beas since they were downstream of the confluence of the two rivers.
64 Government of Rajasthan 2002c : Page 31-32 65 Michel 1967 Page 200
30 Unravelling Bhakra
requirements not only of Sind but of the Sutluj Valley Project below Ferozpur. After Partition, East Punjab was relieved of any of these requirements…..”
As we have seen, this is exactly what happened. Much of the irrigation at Bhakra today is irrigation transferred from areas downstream depriving them of their then existing water use and their future water rights. It may be noted that all of these existing water uses were being carried out without a storage dam. Thus, the dam was needed not so much to create new irrigation, but more to transfer the existing irrigation from one area to another.66
It is argued that the dam became necessary, even in pre-Partition days, because the diversions without storage dams were leading to shortages in rabi and late kharif at the SVP. Hence, the dam was necessary to carry over excess monsoon waters to the winter season. This is the justification given for many large dams. We will deal with this aspect later on. However, one aspect of this argument is important to understand. This argument is a part of the belief that any water of the river that is not “extracted” out or “diverted” from it for human use is water going “waste”. Indeed, dam building in India has been governed by this basic attitude; even today, this is used as the strongest argument to support construction of large dams. Bhakra was no exception.
During the post partition Indo-Pak water dispute on the Indus, the first and one of the most important inputs had come from David Lilienthal, the (once) Chairman and member of the famous Tennessee Valley Authority, the same TVA that was an inspiration and a model for dam builders in India. Included as a part of his suggestions is this piece67:
“The urgent problem is how to store up now wasted waters, so that they can be fed down and distributed by engineering works and canals, and used by both countries, rather than permitted to flow to the sea unused.”
The post-partition changes in Bhakra represent an even more extreme expression of this philosophy. It stretched this argument to the limit, increasing the size of the project not only to prevent the waters from flowing “waste” to the sea, but to prevent the water from flowing down into Pakistan, into a legitimate part of the river itself68.
One could argue of course, that the political situation at that point (and even today) did not leave any option. There is some merit in the argument, as also the fact that the ultimate agreement gave all of Sutluj waters to India. Moreover, it would indeed be too much to expect India to honour the rights of Pakistan downstream when this is not done for people in our own country in other river valley projects.69
But is it crucial to understand that much of today’s irrigation from Bhakra is possible only by depriving a large part of the riverine community of their water rights. It is akin to say stopping completely the flow of Ganga at Patna, or diverting away all of the Narmada at Hoshangabad, leaving the rest of the downstream “without a river”, so to say. When Bhakra project is held up as a model in this country, and used to justify other large dam projects, we would do well to recollect this peculiar nature of the Bharka Project.
66 It is not our intention here to pass judgement over India or her position before or during the Treaty negotiations.
We are only trying to show what happened in physical terms. Indeed, if our narrative gives a picture of India as the more aggressive party in the negotiations, engaging in belligerent takeover tactics, it is a false picture, and possible due to the fact that we have not presented the entire events of the treaty negotiations. In reality, Pakistan appears to be the more stubborn and difficult party, deliberately not keeping its part of the agreements (related to the transition arrangements). India, on the other hand was the more reasonable party, and could even be characterised sometimes as being too reasonable. It may well do here to recollect that in terms of the final agreement, Pakistan got about 140 MAF water while India got 34 MAF.
67 Quoted in Michel 1967: Page 222 68 Not that the sea is an illegitimate body for the river to flow in, even though the arguments of those pushing large
dams make it appear so. 69 Nor for that matter, has Pakistan itself seem to have honoured the downstream rights in the course of its own river
development schemes.
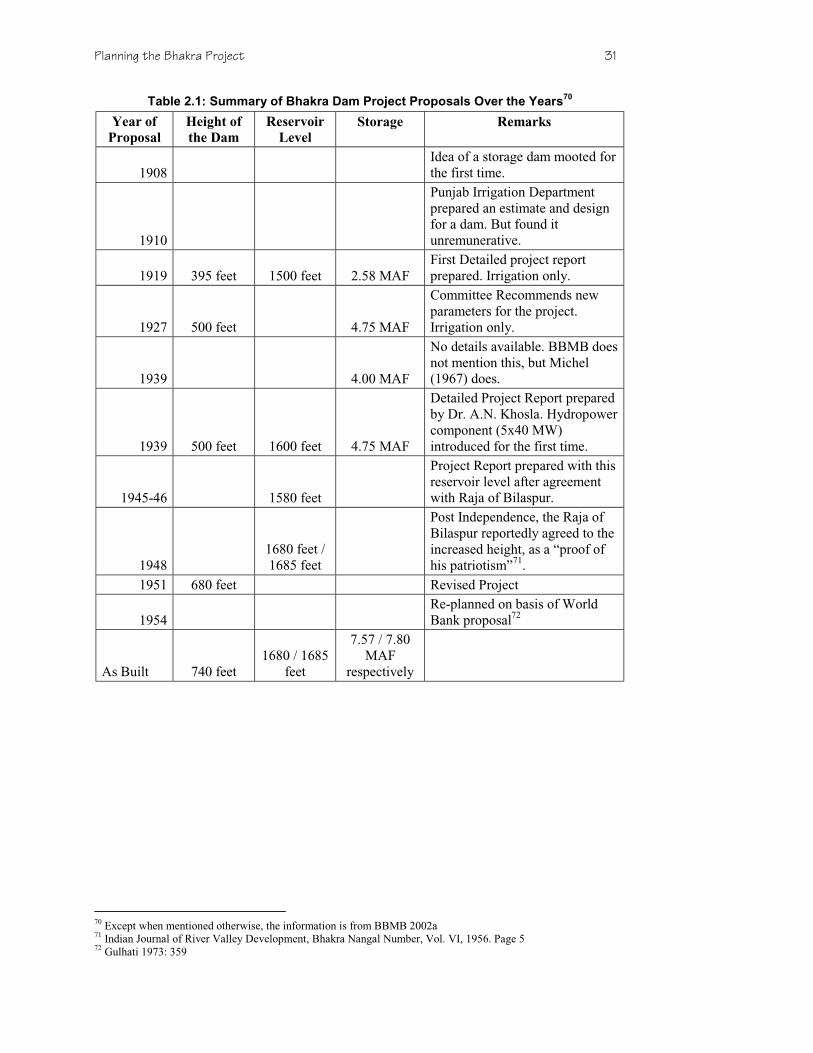
Planning the Bhakra Project 31
Table 2.1: Summary of Bhakra Dam Project Proposals Over the Years70
Year of
Proposal
Height of
the Dam
Reservoir
Level
Storage Remarks
1908 Idea of a storage dam mooted for the first time.
1910
Punjab Irrigation Department prepared an estimate and design for a dam. But found it unremunerative.
1919 395 feet 1500 feet 2.58 MAF First Detailed project report prepared. Irrigation only.
1927 500 feet 4.75 MAF
Committee Recommends new parameters for the project. Irrigation only.
1939 4.00 MAF
No details available. BBMB does not mention this, but Michel (1967) does.
1939 500 feet 1600 feet 4.75 MAF
Detailed Project Report prepared by Dr. A.N. Khosla. Hydropower component (5x40 MW) introduced for the first time.
1945-46 1580 feet
Project Report prepared with this reservoir level after agreement with Raja of Bilaspur.
1948 1680 feet / 1685 feet
Post Independence, the Raja of Bilaspur reportedly agreed to the increased height, as a “proof of his patriotism”71.
1951 680 feet Revised Project
1954 Re-planned on basis of World Bank proposal72
As Built 740 feet 1680 / 1685
feet
7.57 / 7.80 MAF
respectively
70 Except when mentioned otherwise, the information is from BBMB 2002a 71 Indian Journal of River Valley Development, Bhakra Nangal Number, Vol. VI, 1956. Page 5 72 Gulhati 1973: 359

This page is intentionally blank.
3Bhakra Nangal Project:
The Final Project Designand Related
Developments
“The Bhakra Nangal project was the largestsingle investment scheme in the First Five YearPlan......
“The investment on the project is not only largerelatively to the rate of total investment in theeconomy, but is also seemingly capitalintensive.....
“In the case of the Bhakra Nangal project,several aspects of it would strike one, even at afirst glance, as raising issues of considerableimportance from the economic point of view.For instance.... the outlay on the project is largeand the period of construction long (even bythe standards of other comparable “overhead”investments); the reliance on machinery issimilarly very great, and the scope for use ofmanpower relatively limited.....”
K.N. Raj,
Some Economic Aspects of the Bhakra NangalProject, 1960
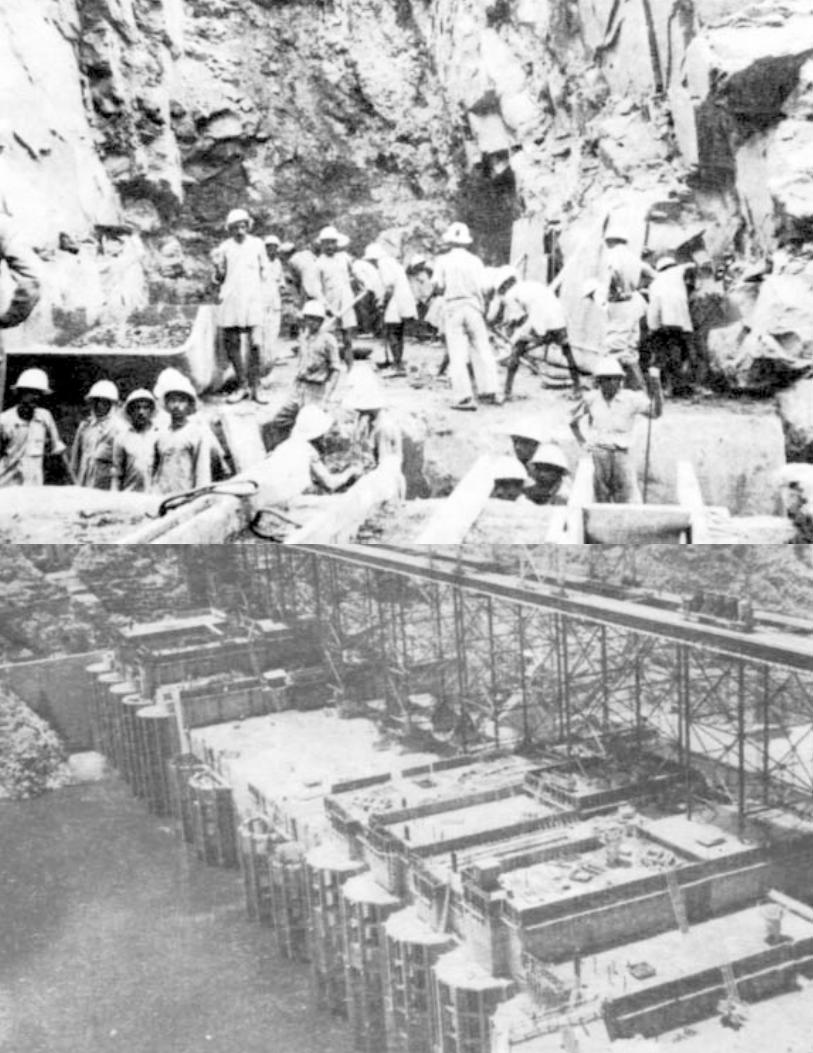

Bhakra Nangal The Final Project Design 35
Bhakra Nangal Project The Final Project Design and Related Developments
IN THE LAST CHAPTER, WE LOOKED AT THE HISTORICAL EVOLUTION OF THE Bhakra project and the implications of the events shaping it. We saw that immediately after partition, the project was reworked, substantially increasing its storage capacity and height. One of the reasons for this was the increased availability of water (which India had assumed). Certain other justifications for the project were also added. Earlier, the project was essentially being justified on the grounds of taking water to the semi-arid areas. To this were added the following important reasons1:
1. In the Partition of Punjab, about 80% of the irrigation system of pre-partition Punjab went to Pakistan, together with some of the most fertile agricultural areas of the country. This needed some remedial measures given the situation with food and raw materials.
2. Punjab was faced with the problem of resettling of about 5 million people displaced as a result of the partition.
Let us now look at the final project that emerged in more detail.2
The Project that emerged in 1951 was a much enlarged one as compared to the original proposal. Investigations and changes in the project continued even beyond 1951 and the final project emerged in 1953. Work however, had already begun on the project from 1946 at the Nangal barrage. One of the important decisions taken was that the canal system would be built ahead of the dam itself, so that irrigation could commence at the earliest.
The main features of the project now were (See MAP 3 for a schematic layout of the project):
1. The Bhakra Dam and Govind Sagar Reservoir
2. The Right Bank and Left Bank Power houses at the dam
3. The Nangal Barrage 12.9 km3 downstream of the Dam
4. The Nangal Hydel Channel (NHC)–taking off from the Nangal Barrage. This hydel channel continues for 65.3 kms till Ropar from where it becomes the Bhakra Main Line, the main delivery canal for areas in Haryana.
5. The power houses on the NHC at Ganguwal and Kotla
6. The Canal System – Old System Refurbished and Renovated for the Project
a. Remodelling of the Ropar Headworks b. Remodelling of the Sirhind Canal
1 Raj 1960: Page 48 2 Our information about the final project design is taken mostly from Raj 1960, BBMB 1988, BBMB 2002a, and
Indian Journal of Power and River Valley Development, Special Issues on Bhakra 1953 and 1956 3 Some mention this as 16 km, some as 20!
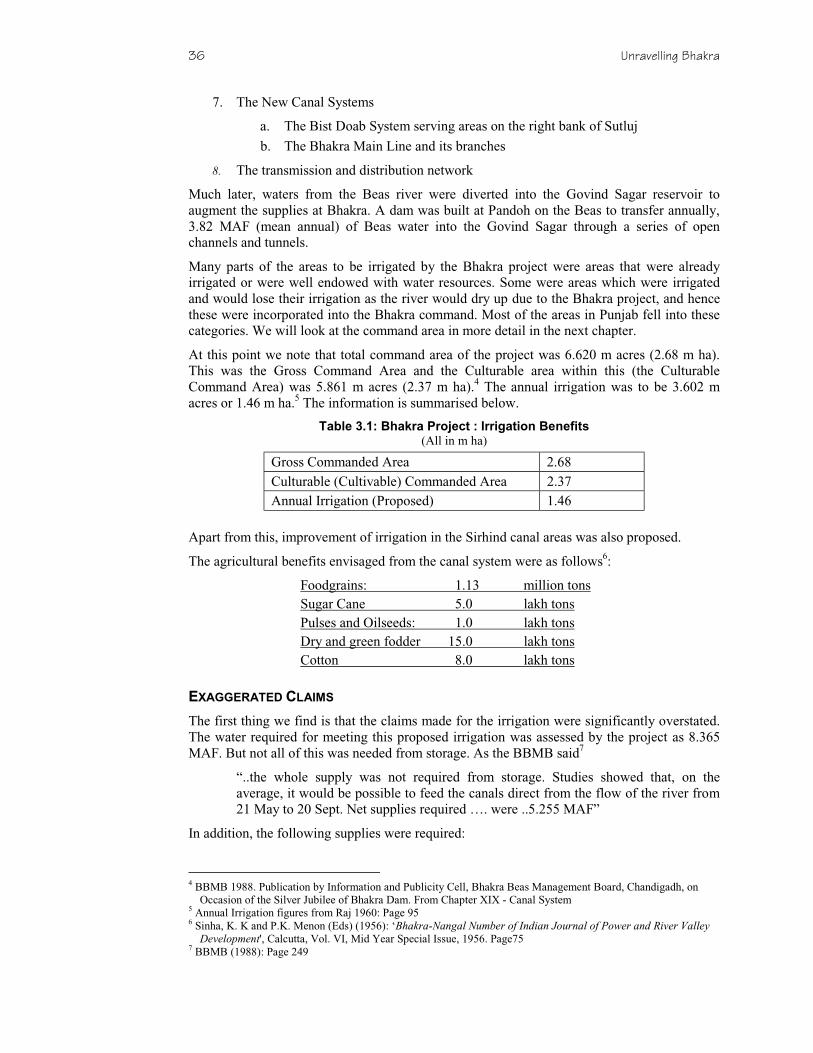
36 Unravelling Bhakra
7. The New Canal Systems
a. The Bist Doab System serving areas on the right bank of Sutluj
b. The Bhakra Main Line and its branches
8. The transmission and distribution network
Much later, waters from the Beas river were diverted into the Govind Sagar reservoir to augment the supplies at Bhakra. A dam was built at Pandoh on the Beas to transfer annually, 3.82 MAF (mean annual) of Beas water into the Govind Sagar through a series of open channels and tunnels.
Many parts of the areas to be irrigated by the Bhakra project were areas that were already irrigated or were well endowed with water resources. Some were areas which were irrigated and would lose their irrigation as the river would dry up due to the Bhakra project, and hence these were incorporated into the Bhakra command. Most of the areas in Punjab fell into these categories. We will look at the command area in more detail in the next chapter.
At this point we note that total command area of the project was 6.620 m acres (2.68 m ha). This was the Gross Command Area and the Culturable area within this (the Culturable Command Area) was 5.861 m acres (2.37 m ha).4 The annual irrigation was to be 3.602 m acres or 1.46 m ha.5 The information is summarised below.
Table 3.1: Bhakra Project : Irrigation Benefits (All in m ha)
Gross Commanded Area 2.68 Culturable (Cultivable) Commanded Area 2.37 Annual Irrigation (Proposed) 1.46
Apart from this, improvement of irrigation in the Sirhind canal areas was also proposed.
The agricultural benefits envisaged from the canal system were as follows6:
Foodgrains: 1.13 million tons Sugar Cane 5.0 lakh tons Pulses and Oilseeds: 1.0 lakh tons Dry and green fodder 15.0 lakh tons Cotton 8.0 lakh tons
EXAGGERATED CLAIMS
The first thing we find is that the claims made for the irrigation were significantly overstated. The water required for meeting this proposed irrigation was assessed by the project as 8.365 MAF. But not all of this was needed from storage. As the BBMB said7
“..the whole supply was not required from storage. Studies showed that, on the average, it would be possible to feed the canals direct from the flow of the river from 21 May to 20 Sept. Net supplies required …. were ..5.255 MAF”
In addition, the following supplies were required:
4 BBMB 1988. Publication by Information and Publicity Cell, Bhakra Beas Management Board, Chandigadh, on
Occasion of the Silver Jubilee of Bhakra Dam. From Chapter XIX - Canal System 5 Annual Irrigation figures from Raj 1960: Page 95 6 Sinha, K. K and P.K. Menon (Eds) (1956): ‘Bhakra-Nangal Number of Indian Journal of Power and River Valley
Development', Calcutta, Vol. VI, Mid Year Special Issue, 1956. Page75 7 BBMB (1988): Page 249
Bhakra Nangal The Final Project Design 37
Supplies for improving irrigation on Sirhind areas : 0.825 MAF
Supplies for improving capacity factors in Sirhind areas: 0.127 MAF
All this totalled to 6.207 MAF. Thus, to meet the total water requirement of 8.365 MAF per annum storage needed was 6.2 MAF.
But here was a major flaw in the project design. The project report itself admitted that even when the Bhakra reservoir would be full to its normal full level of 1680 feet, net utilisable storage would be 5.625 MAF8. Thus, even at complete filling, there would be a shortage of 0.582 MAF – 9.4%. However, the reservoir was not expected to fill in every year, and according to the BBMB:
“… the mean storage available from Bhakra reservoir was calculated to be 4.631 MAF against a requirement of 6.207 MAF resulting in a shortage of about 25.4 %”9
In other words, there would be an average annual shortfall of 25%!
As K.N. Raj states it 10:
“….it has been estimated by the project designer, from records that are available of rainfall and of the river discharges at Bhakra since 1909, that only in a few years will the water available be adequate to fill the reservoir to full capacity and that, over a period, the mean storage available is likely to be only around 4.6 million acre feet. This means that, compared to the requirements, there will be a shortage of 9 percent even in years when the reservoir is full, and about 25 percent on an average over a longer period. (Emphasis in the original)
“This was recognised even at the time the amended project design was drawn up in 1953. It was clearly stated then that “too large an area” had been included in the project. In years of low rainfall, the shortage might be as high as 53 percent and this, it was said would cause “distress” conditions. To save the irrigation side of the project from consequences of a failure of rains, the proposal then made…was that supplies made available from Bhakra reservoir should be supplemented by diversions of supplies from the Ravi and Beas…..[thus] the irrigation facilities which have been promised appear to be in excess of what can actually be provided.” (Emphasis in the original)
In short – there simply wasn’t enough water to provide for the claimed benefits – a fact known to the planners.
Thus, the Bhakra project was not immune from another of the hallmarks of large dam projects – claimed project benefits being highly exaggerated, even beyond what is technically feasible, and this being done knowingly11. It may also be pointed that though the designers had proposed at the design stage itself the need to supplement the Bhakra waters with Ravi and Beas waters, there was no provision made in the project for the investment necessary.
In his conclusions, Raj says that: 12
“The extension of the project beyond what was technically feasible raises the possibility of large variations in the supplies provided by the irrigation system, with the further likely consequences… It would seem, therefore, that it might have been more worthwhile to provide assured supplies of water to smaller area …..”
8 BBMB (1988): Page 249 9 BBMB (1988): Page 249 10 Raj 1960: Page 53-54 11 For example the water availability in the Narmada river is about 18% less than that assumed as a basis for
planning the large dam projects in the basin. 12 Raj 1960: Page 128

38 Unravelling Bhakra
Of course, this would have meant less political support for the dam and would have marred its appeal. It would have impacted the economic analysis of the project too, if one had been carried out. Indeed, this is a characteristic of most large dam projects that they promise benefits in excess of the technical possibilities to make the project acceptable economically and politically.
A QUESTION OF THE DEVELOPMENT PARADIGM
Before we go further into the developments at the project, we will digress a little to look at another important aspect of the project – the resources used– or, to use the words that K.N. Raj uses – the social costs of the project.
An important feature of the project was that it used large amounts of critically short foreign exchange, there was extensive use of machinery and lesser use of labour, especially unskilled labour.
The total cost estimated in the project report was 150.9 crores rupees – a sizable sum of money in those days. K.N. Raj analyses the components of this13:
“…machinery and equipment, as well as construction materials….accounted for the larger part of the estimated cost of investment….The scope for employment of labour on any significant scale, particularly of unskilled labour, was confined mainly to the …investment on distribution of water for irrigation.
“…in case of the Bhakra dam…the scope for utilisation of unskilled manpower is almost negligible..
“The entire expenditure on labour, skilled and unskilled, in the project may, there be placed at somewhere around 45 crores. It must be remembered, however, that nearly 40% of this goes …to supervisory and foreign technical personnel.”
Pointing out that the expenditure on unskilled labour was only one-seventh of the total project expenditure, while expenditure which requires foreign exchange (a very precious commodity then) was 40-45%, he states:
“Thus, the construction of the project calls to a large extent for resources which are relatively scarce in the economy, involving by implication higher social cost, and offers limited scope for the use of manpower which the economy has in greater abundance”.
This has been one of the most persistent and strong criticisms not only of India’s dam building program, but also of the overall development paradigm – that it is capital intensive in a capital short economy and makes relatively far lesser use of the massive human resources. Even today, this remains a very important issue, with the argument that a watershed management, rainwater harvesting program working on a vastly decentralised scale makes much better social sense, since it will use resources that are (even today) relatively abundant as compared to capital, machinery and money.
What is important about the conclusion presented by K.N. Raj above is that it is not merely an issue of the Bhakra project – it was an issue of how to proceed with India’s (irrigation) development. No doubt – it could be argued, rightly, that to build a dam like Bhakra, one would need huge amount of machinery as compared to labour. But that precisely was the point. Should irrigation development be based on such projects that need resources that are critically short in the economy (even today and certainly at that time) – or should it be based on the use of resources that we have an abundance of – namely, human resources?
13 Raj 1960: Page 36-47

Bhakra Nangal The Final Project Design 39
While K.N. Raj limited his comments to the “social costs” of the Bhakra project14 – others were talking, and were to raise issues about the social cost of this entire approach.
They were suggesting an approach based on the massive human resources that the country had. They were proposing a massive deployment of our human resources all over the country to create minor irrigation schemes, rainwater harvesting schemes, improving productivity of the soil – and thus increasing food output. A key point about this approach was that such an approach, with deployment of massive human resources would lead to huge employment generation and would put purchasing power in the hands of millions of people. We will see the significance of this in more detail later as we investigate the food security implications of the Bhakra project.
At this point, it is important to note that these issues were being raised even in the early days following independence.
DEVELOPMENTS AT THE PROJECT
Having looked at the final project report and some of its implications, we now go back to the chronology. Work at the Nangal site had already started in 1946. Work had started on the diversion tunnels in 1948. In 1952, the Nangal dam and the head regulator were completed.
In 1954 the Nangal hydel channel and the network of Bhakra canals was declared open and irrigation from the Bhakra-Nangal project started. This is an important date for us as this will be useful when we look at the contribution made by the project in meeting India’s food production needs.
Note that at this time, work on the dam was still going on, and the impoundment at Bhakra started in 1958.15 However, the project had given priority to the canal network and irrigation developed rapidly. The dam was completed in 1963 and was dedicated to the Nation by the then Prime Minister Shri Jawaharlal Nehru on 22 October 1963. According to the BBMB16, “The irrigation and power demands had fully developed by the time Bhakra dam was completed in 1963”.
Table 3.2 shows the development of irrigation from the Bhakra project from inception to 1963-64.17
Table 3.2: Development of Irrigation from the Bhakra-Nangal Project
Year Area Irrigated Year Area Irrigated
Acres Ha Acres Ha
1951-52 16170 6547 1958-59 1712020 693126
1952-53 46320 18753 1959-60 1818000 736032
1953-54 46320 18753 1960-61 1700000 688259
1954-55 868890 351777 1961-62 1909000 772874
1955-56 1033411 418385 1962-63 2321000 939676
1957-58 1303000 527530 1963-64 2480000 1004049
14 In fact, says “…the real social costs are very high in the case of this project – higher perhaps, relatively to the
output, than in any other similar irrigation-cum- power project – undertaken recently in India.” (Page 126) 15 BBMB 2002a: Page 10-14 16 BBMB 1988: Page 1 17 Personal communication by Dr. G.S. Dhillon, from his forthcoming publication. Govt. of Punjab 1959 also gives
the same figures, but of course it deals with data only till 1958. It should be noted that till 1958, there was no storage at Bhakra and irrigation till then essentially was in kharif.

40 Unravelling Bhakra
If we compare with the project report, we see that the total irrigation planned from the project was 3.602 m acres or 1.46 m ha. So in 1963-64 about 68% of the planned irrigation had been achieved. Given the overestimation of the areas to be irrigated in the project report, it was not likely that irrigation would increase much beyond this, except through diversions from Beas and Ravi. Thus, by 1963-64 irrigation from the project was virtually fully developed. Again this is an important date for us when we look at the food production.
We have seen that in 1948 the construction of a barrage at Harike was started. It was completed in 1952. The irrigation in the Indian part of the SVP – namely the Gang canal (Bikaner canal taking water to Rajasthan) and the Eastern canals (in Ferozpur) was shifted to Harike. A new canal called the Ferozpur feeder was constructed to take the water from the new barrage at Harike to these canals. For these canals, this did not represent any change of source of water.
In 1958, the work on Indira Gandhi Nahar (IGNP) or the Raj canal (for Rajasthan) was also started. The IGNP also takes off from Harike. The alignment of the IGNP was such that it cut through the tail ends of the Sirhind system. Due to this, and to relieve the shortage of the waters in the Bhakra command (a natural consequence of exaggeration of the promised irrigation), it was proposed to transfer areas cut off by the Raj canal to Harike. A separate feeder canal was constructed from Harike to supply water to these areas of the Sirhind system. This canal, called the Sirhind Feeder was opened in 1958. Since Harike is just downstream of the confluence of the Beas and Sutluj, what this meant was that these areas were effectively shifted from Sutluj to Beas waters18.
Thus, part of the areas that were to be irrigated from the Bhakra project (and some being irrigated by Sutluj waters from the Sirhind system earlier) were transferred to the Harike, and Beas.19
Meanwhile, there was another proposal also being mooted to use the Beas waters to cover the shortage at Bhakra - to divert the Beas directly into the Sutluj above the Bhakra reservoir. This was the Beas Project Unit –I with a diversion of 3.82 MAF of water from the Beas at Pandoh into the Govind Sagar reservoir.
The concept of the Beas- Sutluj Link (BSL) for diverting some portion of Beas into Sutluj was conceived by Dr. A.N. Khosla. The preliminary investigation for the BSL was started in 1956. The project went through several investigations and changes. Interestingly, one of the proposals (1957) that would have needed a large storage dam at Suketi was objected to by the Himachal Government as it would submerge the Balh valley and hence it had to be abandoned.20 The construction work on the BSL started in 1965 and the first diversion into Sutluj took place in 1977 – on a rather charming date - 7 July 1977 or 7-7-77.
With the BSL we are in 1977 and the long progression of additions / developments at the Bhakra project have come to an end. 21 We will now look at the command area of the project in detail in the next Chapter.
18 And also to the Ravi waters to the extent these were made available from the Madhopur Beas link later on. 19 Apparently, what triggered the push for going ahead with the Sirhind feeder was not just the water shortages due
to excessive initial promises, but that the power requirements from the project too went up much more than initially estimated and this necessitated changing the pattern of reservoir releases to meet these needs. This had a direct adverse impact on the irrigation releases. Apparently, this is what triggered the decision to go for the Sirhind Feeder, even though proposals to supplement Bhakra with Ravi and Beas were made initially to offset the excessive promises of the project. (Raj 1960 : Page 61-66) It may be pointed out that in a multi-purpose project, there is a significant trade-off between the power and irrigation benefits.
20 BBMB 2002a: Pages 30-31 21 We have not gone in to the Ravi, its interconnections with the Beas system and the entire Ravi-Beas water dispute
as its direct significance to our enquiry is limited.
4Bhakra Project: An
Analysis of theCommand
“The Bhakra Canal system was planned tocater the irrigation requirements of the aridand dry areas in Hissar district and adjoiningareas of Rohtak and Karnal districts andBikaner State which are proverbially faminestricken.”
Indian Journal of Power and River Valley
Development
Bhakra Nangal Special Issue, 1956


Bhakra Project Analysis of the Command 43
Bhakra Project An Analysis of the Command
A BOARD OVERLOOKING THE DEEP AND BREATHTAKING GORGE JUST BELOW the imposing Bhakra dam states, under the title “Benefits”:
New Areas Irrigated 28.8 lakh ha Area Where Irrigation Improved 9.0 lakh ha Energy 6500.0 MU/Year
It does not state if this is the annual irrigation, or the gross command area or the cultivable command area.
BBMB1 gives similar figures but puts the new areas at 26 lakh ha instead of 28.8.
There are three important elements in understanding the command. The first is the “Gross” or “Geographical” command area – the GCA. This includes all the areas where the canals reach. These areas will include roads, settlements, uncultivable areas and so on. Hence, another important term is the Cultivable Command Area - CCA. As the name suggests, this includes the cultivable areas within the GCA. Clearly, in terms of agriculture, this is the more relevant parameter. This does not mean that every year all of this area would be irrigated. Normally, only a part of the CCA is irrigated every year. The ratio of the area actually irrigated annually by the project to the CCA is called the Intensity of Irrigation.
Obviously, the Irrigation Intensity could vary from year to year, depending on the water available in the river in the given year. More generally, the Intensity of Irrigation is determined as part of the project goals. Many times, the goal is to spread the benefits across as wide an area as possible, and hence a much larger area than can be annually irrigated in a average year is included in the GCA/CCA.
The 1953 Project Report fixed the following for Bhakra Project2:
Gross Commanded Area: 26.8 lakh ha Cultivable Commanded Area: 23.7 lakh ha Annual Irrigation3: 14.6 lakh ha
The Bhakra Command area was divided into 3 zones. The project had fixed relatively low irrigation intensities for all the three zones. The justification was that there was need to spread the benefits as much as possible; hence, irrigation was to be protective in nature and not intensive.
We now look at the state-wise figures for the GCA, CCA and Annual Irrigation4. 1 BBMB 2002a: Page 50 2 BBMB (1988) and also Raj 1960 3 Figure of annual Irrigation is as quoted by K.N. Raj in Raj 1960. This figure appears to be on the higher side;
calculations show that the irrigation intensities that lead to this figure are higher than what the project had provided, quoted in the same reference.

44 Unravelling Bhakra
GROSS COMMAND AREA
The state-wise figures for the GCA are as follows5:
Table 4.1: Statewise Gross Command Area of Bhakra Project
State
GCA
(million ha)
% of total
Bhakra GCA
in State
Rajasthan 0.438 16% Haryana 1.309 49% Punjab 0.934 35% Total 2.680
Thus, we see that Rajasthan has only a limited area of the Bhakra command, while Punjab and Haryana together have about 84% of the Bhakra GCA.
Looking within the state - the GCA of Bhakra as percentage of state area - we have the following figures:
Table 4.2: Bhakra Gross Command Area as Percent of State Area
State
Geographical
Area (m Ha)
Bhakra
GCA (m Ha)
Bhakra GCA as %
to State Area
Haryana 4.421 1.309 29.6% Punjab 5.033 0.934 18.6%
The Bhakra gross command forms only 30% of the total area of Haryana and in Punjab it is 18.6%. This gives the maximum reach of the project in the two states. Clearly, Punjab and Haryana are much more than Bhakra. Note that this is the Gross Commanded Area and not the cultivable commanded area or the annual irrigation. Thus, the actual area benefited by the project will be a smaller portion of this.
CULTIVABLE COMMAND AREA
Again, none of the documents that we have had access to give the break up of the CCA statewise. The closest is BBMB 1988 that gives us the disaggregating in terms of Rajasthan, Punjab and PEPSU. We have however, used the details of the canal systems and other information to derive the best estimates as follows.
The state wise distribution of the CCA is as follows6:
Table 4.3: Statewise Cultivable Command Area of Bhakra Project
State
CCA
(Million ha) % of Bhakra CCA
in state
Rajasthan 0.372 16%
Haryana 1.160 49%
Punjab 0.840 35%
Total 2.373
4 It is amazing that for a project that is so much a pubic icon, it has been difficult to get even some of these basic figures. Published documents do not give all the figures. For example, the BBMB document (BBMB 1988) gives the GCA and CCA, but divided into Rajasthan, Punjab and PEPSU. Also, it does not give annual irrigation figures. Government authorities refused to give figures to us. Due to such problems, we have had to calculate some of the figures from the details of the canal systems and maps.
5 Figure for Rajasthan and Total from BBMB 1988, for Punjab and Haryana derived by us as explained above. 6 Figures for Rajasthan and Total from BBMB 1988 and for Haryana and Punjab derived by us.
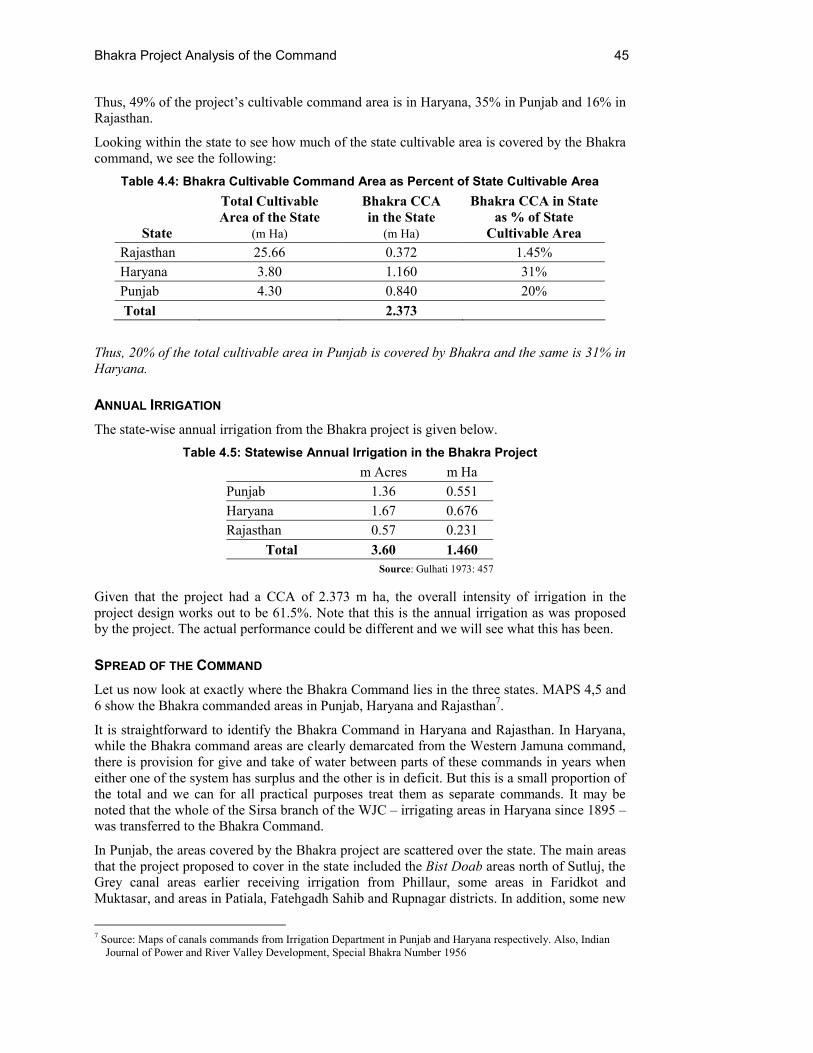
Bhakra Project Analysis of the Command 45
Thus, 49% of the project’s cultivable command area is in Haryana, 35% in Punjab and 16% in Rajasthan.
Looking within the state to see how much of the state cultivable area is covered by the Bhakra command, we see the following:
Table 4.4: Bhakra Cultivable Command Area as Percent of State Cultivable Area
State
Total Cultivable Area of the State
(m Ha)
Bhakra CCA in the State
(m Ha)
Bhakra CCA in State as % of State
Cultivable Area Rajasthan 25.66 0.372 1.45% Haryana 3.80 1.160 31% Punjab 4.30 0.840 20% Total 2.373
Thus, 20% of the total cultivable area in Punjab is covered by Bhakra and the same is 31% in Haryana.
ANNUAL IRRIGATION The state-wise annual irrigation from the Bhakra project is given below.
Table 4.5: Statewise Annual Irrigation in the Bhakra Project m Acres m Ha Punjab 1.36 0.551 Haryana 1.67 0.676 Rajasthan 0.57 0.231
Total 3.60 1.460 Source: Gulhati 1973: 457
Given that the project had a CCA of 2.373 m ha, the overall intensity of irrigation in the project design works out to be 61.5%. Note that this is the annual irrigation as was proposed by the project. The actual performance could be different and we will see what this has been.
SPREAD OF THE COMMAND Let us now look at exactly where the Bhakra Command lies in the three states. MAPS 4,5 and 6 show the Bhakra commanded areas in Punjab, Haryana and Rajasthan7.
It is straightforward to identify the Bhakra Command in Haryana and Rajasthan. In Haryana, while the Bhakra command areas are clearly demarcated from the Western Jamuna command, there is provision for give and take of water between parts of these commands in years when either one of the system has surplus and the other is in deficit. But this is a small proportion of the total and we can for all practical purposes treat them as separate commands. It may be noted that the whole of the Sirsa branch of the WJC – irrigating areas in Haryana since 1895 – was transferred to the Bhakra Command.
In Punjab, the areas covered by the Bhakra project are scattered over the state. The main areas that the project proposed to cover in the state included the Bist Doab areas north of Sutluj, the Grey canal areas earlier receiving irrigation from Phillaur, some areas in Faridkot and Muktasar, and areas in Patiala, Fatehgadh Sahib and Rupnagar districts. In addition, some new
7 Source: Maps of canals commands from Irrigation Department in Punjab and Haryana respectively. Also, Indian
Journal of Power and River Valley Development, Special Bhakra Number 1956

46 Unravelling Bhakra
areas were added in the Sirhind canal system as a part of the project. There was provision for improvement to irrigation in the Sirhind system but these areas are not included in the above figures of new areas irrigated.
Let us now look at the command areas in terms of districts.
Rajasthan
The Bhakra command in Rajasthan is limited to two districts – namely, Ganganagar and Hanumangadh. The basic data for these districts is as follows (Figures pertain to year 2000-01):
Table 4.6: Bhakra Command Area in Rajasthan - Basic District Data (Area In Ha)
G
eo
gra
ph
i
-ca
l A
rea
Cu
ltiv
ab
le
Area
Net
Sown
Area
Gross
Sown
Area
% Net
Irrigated to
Net Sown
Area
% Gross
Irrigated to
Gross Sown
Area
Ganganagar 1092960 962773 666010 906759 82.15% 86.78%
Hanumangadh 970315 897483 647185 882697 49.39% 62.29% Source: Agricultural Statistics 2000-01, Government of Rajasthan. (Government of Rajasthan 2002b)
Table 4.7: Bhakra Command Districts in Rajasthan -Irrigation Data Gross Irrigated area In Ha
Area
Served By
Bhakra
Canal
Total
Canal
Irrigated
Area
Total
Tubewell
Irrigated
Area
Total
Irrigated
Area
Bhakra
Irrigated
Area as
% of
Total Canal Area
Bhakra
Irrigated Area
as % of Total
Irrigated Ganganagar 113105 785514 1345 786859 14.40% 14.37%
Hanumangadh 395577 541879 7666 549853 73.00% 71.94% Source: Agricultural Statistics 2000-01, Government of Rajasthan. (Government of Rajasthan 2002b)
Punjab and Haryana
Since district wise distribution of the command area was not available to us for these two states, we have estimated it from the detailed maps of the irrigation departments of the two states that we had obtained, co-relating it with other information we had.
Haryana
Table 4.8: Districts in Bhakra Command in Haryana
Sr.No. District
Area of the District
in Bhakra
Command8
Remaining Area of District
Served By (If Served By any other Canal)
1 Sirsa Full 2 Fatehabad Full 3 Kaithal Full 4 Hisar 60% Western Yamuna Canal 5 Jind 50% Western Yamuna Canal
8 Estimated by us from various maps and other information. Command here means Gross Command.

Bhakra Project Analysis of the Command 47
Sr.No. District
Area of the District in Bhakra
Command8
Remaining Area of District Served By
(If Served By any other Canal) 6 Kurukshetra 50% Uncommanded 7 Karnal 5% Western Yamuna Canal 8 Ambala 5% Uncommanded 9 Bhiwani 2% Lift Commands from WJC
Districts out of Bhakra Command in Haryana
1. Panchkula 6. Jhajjar 2. Yamunanagar 7. Gurgaon 3. Sonipat 8. Faridabad 4 Panipat 9. Mahendragadh 5. Rohtak 10. Rewari
Punjab
In Punjab, it has been difficult to estimate the Bhakra areas in each district, as we do not have requisite detailed maps. We give below the areas for combined Bhakra and Sirhind systems in Punjab. Since both are served from the Sutluj, and are supposed to operate as one system, it also makes some sense to look at these together.
Table 4.9 : Districts in Bhakra and Sirhind Command in Punjab Sr. No. District Area of District in Bhakra or
Sirhind Command Remaining Area of District Served By (If Served By any other Canal)
1 Moga Full 2 Bhatinda Full 3 Sangrur Full 4 Mansa Full 5 Fatehgarh Sahib Full 6 Patiala 85% 7 Muktsar 40% Harike - Sirhind Feeder 8 Faridkot 66% Harike - Sirhind Feeder
9 Firozepur 25% Harike - Sirhind Feeder & Ferozpur Feeder
10 Ludhiana Full 11 Nawashashr Full
12 Kapurthala
Phagwara tehsil + 20% of Remaining Kapurthala (Hence 29.2% of the total district)
13 Jullundhar 66% 14 Rupnagar 33%
Maps show that out of the above 14 districts, Bhatinda and Mansa are completely out of Bhakra command. The remaining districts (other than Bhatinda and Mansa) are severed partly by Sirhind and partly by Bhakra.

48 Unravelling Bhakra
Punjab Districts Not in Either the Bhakra or Sirhind Command
1. Amritsar 2. Gurdaspur 3. Hoshiarpur
ACTUAL IRRIGATION
Let us look at the actual irrigation as against the planned irrigation in the Bhakra command.
Punjab
The detailed time series giving annual irrigation in the command was not available to us9. However, available figures show that in case of Punjab, the annual irrigation from Bhakra has been much lesser than the planned irrigation. Over the years, the canals have come to play a very limited role in the Bharka irrigated districts. In most of these districts, groundwater is the major contributor to irrigation.
As late as in 1975 (that is, 20 years after irrigation from Bhakra-Nangal had started), the Comptroller and Auditor General (CAG) of India in his report had noted that in Punjab the actual utilisation of irrigation in the Bhakra command was on average 285 thousand ha as against the planned 433 thousand Ha. The CAG report further states the “main reason for non-utilisation …was reported to be the installation of a large number of private tubewells.”10 Over the years, it appears that this has fallen further!11
According to the figures obtained by us from Punjab irrigation department, the total (canal) irrigation in the Bist Doab and Bhakra Main Line systems in Punjab in year 2001 was 169 thousand ha – i.e. about 30% of the CCA.
Table 4.10 gives figures for the total net area irrigated and net area irrigated by canals in the state for the year 2001-02, for those districts that are either in the Bhakra or Sirhind command.
This table shows that in Punjab, within the Bhakra and Sirhind areas, canal irrigation is significant mainly in districts Bhatinda, Mansa, Sangrur and Ferozpur – all served essentially from either Sirhind or Harike. It is important to note that all these districts were already irrigated by the Sirhind and Eastern canal (in case of Firozpur) many decades prior to Bharka project. In the districts having Bhakra command, like Patiala, Fatehgadh Sahib, Jullundhar, Kapurthala the percent net area irrigated from canals ranges from 1.5% to about 19% .
Indeed the Bhakra project had only limited benefits to Punjab. This is also because most of the irrigation from the Bhakra in Punjab went to areas that were already irrigated or were-endowed.
When we spoke to a senior retired Chief Engineer from the Punjab Irrigation Dept., he told us that Punjab had hardly benefited from the Bharka project. Only 5% of the water in the Bharka system went to Punjab – rest all to Haryana.12 The figures also bear this out. The Net Area Irrigated by canals (which would indicate new areas coming under canal irrigation) hardly showed any change in Punjab from 1953-54 (1.397 m ha) to 1978-79 (1.388 m Ha). Even after
9 Irrigation figures given in the Statistical Abstracts are reported district-wise and not project wise. 10 CAG 1977: Page 108. Supplementary Report of the CAG General of India for 1975-76. Figures of irrigation are
for 5 years average 1971-72 to 1975-76 11 Indeed, the net area irrigated by canals in Punjab has declined sharply from a high of 1.576 m ha in 1990-91 to just
987,000 ha in 2001-2002 – this is even less than the canal irrigated area in Punjab in 1953-54 which was 1.4 m ha. 12 That is – 5% of the BML. The Sirhind system was already receiving waters of the Sutluj since decades. He did not
indicate how much water went to the Bist-Doab areas.
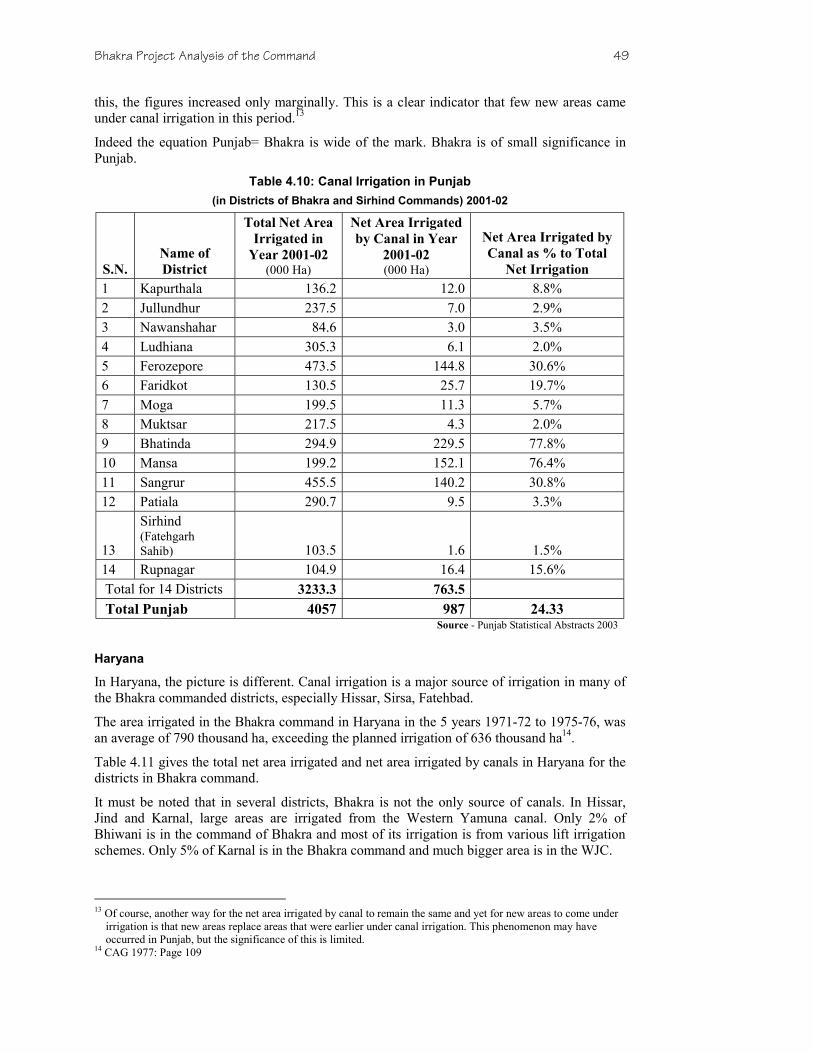
Bhakra Project Analysis of the Command 49
this, the figures increased only marginally. This is a clear indicator that few new areas came under canal irrigation in this period.13
Indeed the equation Punjab= Bhakra is wide of the mark. Bhakra is of small significance in Punjab.
Table 4.10: Canal Irrigation in Punjab (in Districts of Bhakra and Sirhind Commands) 2001-02
S.N. Name of District
Total Net Area Irrigated in
Year 2001-02 (000 Ha)
Net Area Irrigated by Canal in Year
2001-02 (000 Ha)
Net Area Irrigated by Canal as % to Total
Net Irrigation 1 Kapurthala 136.2 12.0 8.8% 2 Jullundhur 237.5 7.0 2.9% 3 Nawanshahar 84.6 3.0 3.5% 4 Ludhiana 305.3 6.1 2.0% 5 Ferozepore 473.5 144.8 30.6% 6 Faridkot 130.5 25.7 19.7% 7 Moga 199.5 11.3 5.7% 8 Muktsar 217.5 4.3 2.0% 9 Bhatinda 294.9 229.5 77.8% 10 Mansa 199.2 152.1 76.4% 11 Sangrur 455.5 140.2 30.8% 12 Patiala 290.7 9.5 3.3%
13
Sirhind (Fatehgarh Sahib) 103.5 1.6 1.5%
14 Rupnagar 104.9 16.4 15.6% Total for 14 Districts 3233.3 763.5 Total Punjab 4057 987 24.33
Source - Punjab Statistical Abstracts 2003
Haryana
In Haryana, the picture is different. Canal irrigation is a major source of irrigation in many of the Bhakra commanded districts, especially Hissar, Sirsa, Fatehbad.
The area irrigated in the Bhakra command in Haryana in the 5 years 1971-72 to 1975-76, was an average of 790 thousand ha, exceeding the planned irrigation of 636 thousand ha14.
Table 4.11 gives the total net area irrigated and net area irrigated by canals in Haryana for the districts in Bhakra command.
It must be noted that in several districts, Bhakra is not the only source of canals. In Hissar, Jind and Karnal, large areas are irrigated from the Western Yamuna canal. Only 2% of Bhiwani is in the command of Bhakra and most of its irrigation is from various lift irrigation schemes. Only 5% of Karnal is in the Bhakra command and much bigger area is in the WJC.
13 Of course, another way for the net area irrigated by canal to remain the same and yet for new areas to come under
irrigation is that new areas replace areas that were earlier under canal irrigation. This phenomenon may have occurred in Punjab, but the significance of this is limited.
14 CAG 1977: Page 109

50 Unravelling Bhakra
Table 4.11: Canal Irrigation in Haryana in Bhakra Districts 1998-99 Important Note: Last three columns refer to areas irrigated by all sources and all canal systems, not just Bhakra.
S.N.
Name of
District
% of
District in
Bhakra
Command
Total Net
Area
Irrigated in
Year 1998-
99 (000 Ha)
Net Area
Irrigated by
Canal in
Year 1998-
99 (000 Ha)
Net Area
Irrigated by
Canal as %
to Total Net
Irrigation
1 Hissar 60% 252 243 96.43 2 Bhiwani 2% 212 129 60.85 3 Sirsa 100% 309 262 84.79 4 Fatehabad 100% 196 136 69.39 5 Karnal 5% 206 42 20.39 6 Kurukshetra 50% 148 8 5.41 7 Kaithal 100% 197 100 50.76 8 Ambala 5% 94 14 14.89 9 Jind 50% 217 129 59.45
Total 9
Districts 1831.0 1063.0 Total Haryana 2842 1433 50.42
Source - Haryana Statistical Abstract 1999-2000 Note: Column 3 – “% of District in Bhakra Command” estimated by the author from maps and other data.
The areas that have significant irrigation from the Bhakra project are the districts of Hissar, Sirsa and Fatehbad and to some extent Kaithal and Jind. The three districts of Hissar, Sirsa and Fatehbad carry about 543,000 ha of the net area irrigated by Bharka in Haryana. We estimate that the net area irrigated by Bhakra canals in Haryana is about 717,680 ha15. Thus, the share of these three districts is 75% in the total Bhakra irrigated area in Haryana.16
Rajasthan
In Rajasthan, the annual irrigation expected from the project was 231 thousand ha and according to the CAG report17, this was exceeded in the years 1971-72 to 1975-76, though it does not mention by how much. In 1993-94, the actual achievement was “of an order of 300,000 ha at 80% intensity” as against the planned 230,931 ha at 62% intensity18.
GEO-CLIMATIC FEATURES OF THE COMMAND
Let us now look at the nature of the command area. The Bhakra Command was divided into three zones – I, II and III. The characteristics of these zones were as follows19:
Zone I: This zone consisted of areas “which lie(s) near the hills and receive(s) good rainfall during the monsoons as well as during the winter months”. The areas are Bist Doab areas (north of Sutluj) and areas South of Patiala.
15 Estimated on a pro rata basis as per % of district area in command. This is for the year 1998-1999. 16 We may mention here that while the above figures pertain to a particular year, the broad picture does not change
much over the years. 17 CAG 1977: Page 110 18 Government of Rajasthan 2002c: Page 120. At least part of this excess coverage appears to have been achieved by
lowering the delta, i.e. the amount of water delivered per hectare. (op cit Page 134) 19 From BBMB 1988: Page 245 and Raj 1960: Page 49
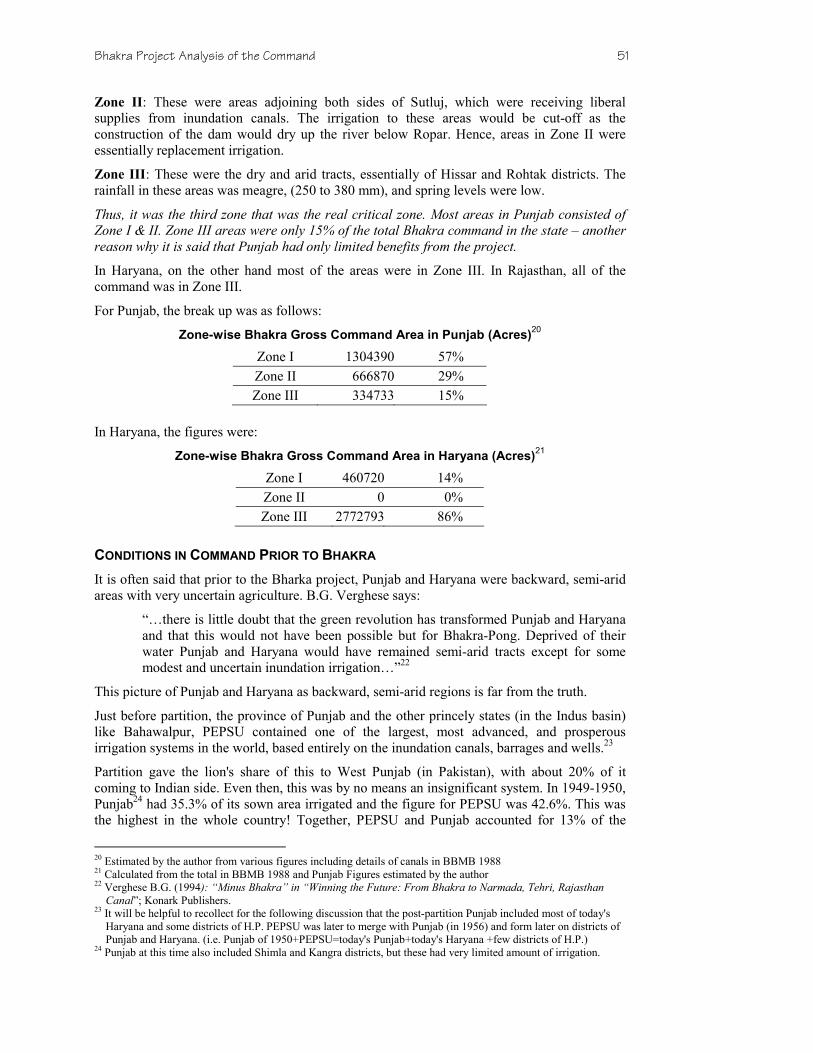
Bhakra Project Analysis of the Command 51
Zone II: These were areas adjoining both sides of Sutluj, which were receiving liberal supplies from inundation canals. The irrigation to these areas would be cut-off as the construction of the dam would dry up the river below Ropar. Hence, areas in Zone II were essentially replacement irrigation.
Zone III: These were the dry and arid tracts, essentially of Hissar and Rohtak districts. The rainfall in these areas was meagre, (250 to 380 mm), and spring levels were low.
Thus, it was the third zone that was the real critical zone. Most areas in Punjab consisted of Zone I & II. Zone III areas were only 15% of the total Bhakra command in the state – another reason why it is said that Punjab had only limited benefits from the project.
In Haryana, on the other hand most of the areas were in Zone III. In Rajasthan, all of the command was in Zone III.
For Punjab, the break up was as follows:
Zone-wise Bhakra Gross Command Area in Punjab (Acres)20
Zone I 1304390 57% Zone II 666870 29% Zone III 334733 15%
In Haryana, the figures were:
Zone-wise Bhakra Gross Command Area in Haryana (Acres)21
Zone I 460720 14% Zone II 0 0% Zone III 2772793 86%
CONDITIONS IN COMMAND PRIOR TO BHAKRA It is often said that prior to the Bharka project, Punjab and Haryana were backward, semi-arid areas with very uncertain agriculture. B.G. Verghese says:
“…there is little doubt that the green revolution has transformed Punjab and Haryana and that this would not have been possible but for Bhakra-Pong. Deprived of their water Punjab and Haryana would have remained semi-arid tracts except for some modest and uncertain inundation irrigation…”22
This picture of Punjab and Haryana as backward, semi-arid regions is far from the truth.
Just before partition, the province of Punjab and the other princely states (in the Indus basin) like Bahawalpur, PEPSU contained one of the largest, most advanced, and prosperous irrigation systems in the world, based entirely on the inundation canals, barrages and wells.23
Partition gave the lion's share of this to West Punjab (in Pakistan), with about 20% of it coming to Indian side. Even then, this was by no means an insignificant system. In 1949-1950, Punjab24 had 35.3% of its sown area irrigated and the figure for PEPSU was 42.6%. This was the highest in the whole country! Together, PEPSU and Punjab accounted for 13% of the
20 Estimated by the author from various figures including details of canals in BBMB 1988 21 Calculated from the total in BBMB 1988 and Punjab Figures estimated by the author 22 Verghese B.G. (1994): “Minus Bhakra” in “Winning the Future: From Bhakra to Narmada, Tehri, Rajasthan
Canal”; Konark Publishers. 23 It will be helpful to recollect for the following discussion that the post-partition Punjab included most of today's
Haryana and some districts of H.P. PEPSU was later to merge with Punjab (in 1956) and form later on districts of Punjab and Haryana. (i.e. Punjab of 1950+PEPSU=today's Punjab+today's Haryana +few districts of H.P.)
24 Punjab at this time also included Shimla and Kangra districts, but these had very limited amount of irrigation.

52 Unravelling Bhakra
country's irrigated area, while it had 5.89% of the country's total sown area25. Thus, it was way ahead of irrigation as compared to the rest of the country – even after losing the lion's share to Pakistan. In absolute terms, the areas irrigated were 4.9 million acres in Punjab and 2.04 m acres in PEPSU.
By 1953-54, the year in which irrigation from Bhakra began, the irrigated area in Punjab (including PEPSU and Haryana areas) had gone up to 7.47 m acres26.
Table 4.12 gives the areas already irrigated in 1953-54 in various districts of Punjab (including Haryana and PEPSU) on the eve of the Bhakra project. From this, let us look at the irrigation status in 1953-54 of some of the Bhakra command areas in (today’s) Punjab.
• Bist Doab - About 61.5% of the Net Sown Area was under irrigation in the Bist Doab areas – districts of Jullandar and Nawanshahar – all of it by wells.
• For the Patiala and Fatehgadh Sahib areas, the same figure was 45.5 %. The then Patiala district had an area of 327000 acres under irrigation.
• Ferozpur, which included areas of Faridkot and Muktasar districts, was the most heavily irrigated with about 74.8% of the Net Area Sown under irrigation.
We have already seen that the Zone II areas were all in Punjab, and consisted of areas already well irrigated. It is seen from the table that even much of the Zone I area in Punjab, like Bist Doab, Patiala etc. was well irrigated even before the project.
From the same table, let us now look at Haryana. As far as Haryana was concerned, even the semi-arid districts of Haryana, namely Hissar tracts, the area irrigated was 566000 acres – 20.8% of the Net Area Sown. In fact, in Haryana, significant areas in these tracts were being irrigated by the Sirsa branch of the Western Jamuna canal. These areas were completely transferred to the Bhakra command.27
Thus, even before the Bhakra irrigation began, many of the areas in the command were irrigated. Certainly, there were parts (for e.g.in the Hissar tract) which were still semi-arid and without irrigation. But these formed limited part of the whole of Punjab and Haryana and it is a gross exaggeration to say that all of Punjab and Haryana was essentially semi-arid with uncertain irrigation prior to Bhakra.
This is also reflected in the agricultural production and performance of the two states.
In terms of the agriculture, it is difficult to call Punjab of 1950s backward as compared to the rest of the country. Apart from the irrigated areas we have seen above, net sown area of Punjab in 1949-50 was 51.4% of its total geographical area. For PEPSU, this figure was 64.1%. While the PEPSU figure was the highest for any state in the country, Punjab figure too compared well with other states.28 Area sown more than once for Punjab was 2.1 m acres for the same year.
25 R.L. Anand; Punjab Agriculture Facts and Figures; Economic and Statistical Adviser to Government of Punjab;
1956 Page 57 Table 20 (Anand 1956) 26 Statistical Abstract Punjab 1960 27 A GCA of about 800,000 acres at least. 28 Anand 1956: Page 31 Table 1
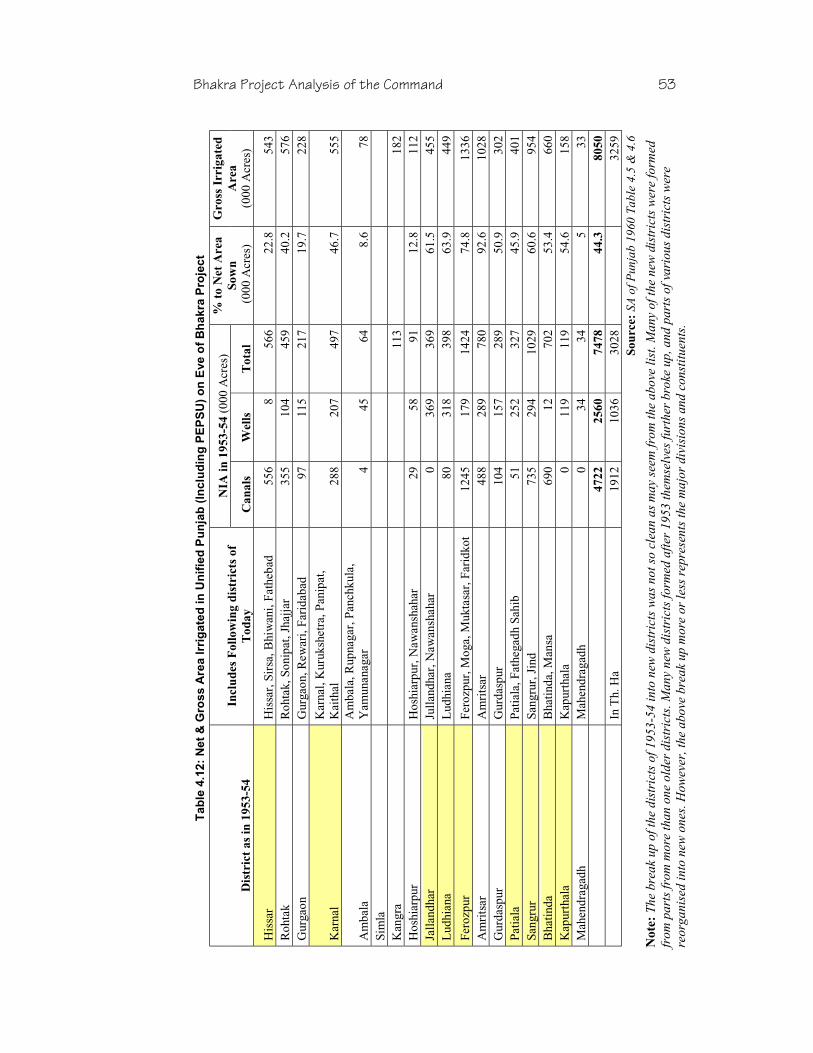
Bhak
ra P
roje
ct A
naly
sis
of t
he C
omm
and
53
Bhakra Project Analysis of the Command 53
Tab
le 4
.12:
Net
& G
ross
Are
a Ir
rig
ated
in U
nif
ied
Pu
nja
b (
Incl
ud
ing
PE
PS
U)
on
Eve
of
Bh
akra
Pro
ject
NIA
in
19
53
-54
(00
0 A
cres
)
Dis
tric
t a
s in
19
53
-54
In
clu
des
Fo
llo
win
g d
istr
icts
of
To
da
y
Ca
na
ls
Well
s T
ota
l
% t
o N
et
Area
So
wn
(00
0 A
cres
)
Gro
ss I
rrig
ate
d
Area
(000
Acr
es)
His
sar
His
sar,
Sir
sa, B
hiw
ani,
Fath
ebad
55
6 8
566
22.8
543
Roh
tak
Roh
tak,
Son
ipat
, Jha
jjar
35
5 10
445
940
.257
6G
urga
on
Gur
gaon
, Rew
ari,
Fari
daba
d 97
11
521
719
.722
8
Kar
nal
Kar
nal,
Kur
uksh
etra
, Pan
ipat
, K
aith
al
288
207
497
46.7
555
Am
bala
A
mba
la, R
upna
gar,
Pan
chku
la,
Yam
unan
agar
4
4564
8.6
78Si
mla
K
angr
a
113
18
2H
oshi
arpu
r H
oshi
arpu
r, N
awan
shah
ar
29
5891
12.8
112
Jalla
ndha
r Ju
lland
har,
Naw
ansh
ahar
0
369
369
61.5
455
Lud
hian
a L
udhi
ana
80
318
398
63.9
449
Fero
zpur
Fe
rozp
ur, M
oga,
Muk
tasa
r, F
arid
kot
1245
17
914
2474
.813
36A
mri
tsar
A
mri
tsar
48
8 28
978
092
.610
28G
urda
spur
G
urda
spur
10
4 15
728
950
.930
2Pa
tiala
Pa
tiala
, Fat
hega
dh S
ahib
51
25
232
745
.940
1Sa
ngru
r Sa
ngru
r, J
ind
735
294
1029
60.6
954
Bha
tinda
B
hatin
da, M
ansa
69
0 12
702
53.4
660
Kap
urth
ala
Kap
urth
ala
0 11
911
954
.615
8M
ahen
drag
adh
Mah
endr
agad
h 0
3434
533
47
22
2
56
07
47
84
4.3
80
50
In
Th.
Ha
1912
10
3630
28
3259
So
urce:
SA o
f Pun
jab
1960
Tab
le 4
.5 &
4.6
No
te:
The
brea
k up
of t
he d
istr
icts
of 1
953-
54 in
to n
ew d
istr
icts
was
not
so
clea
n as
may
see
m fr
om th
e ab
ove
list.
Man
y of
the
new
dis
tric
ts w
ere
form
ed
from
par
ts fr
om m
ore
than
one
old
er d
istr
icts
. Man
y ne
w d
istr
icts
form
ed a
fter
1953
them
selv
es fu
rthe
r br
oke
up, a
nd p
arts
of v
ario
us d
istr
icts
wer
e re
orga
nise
d in
to n
ew o
nes.
How
ever
, the
abo
ve b
reak
up
mor
e or
less
rep
rese
nts
the
maj
or d
ivis
ions
and
con
stitu
ents
.

54 Unravelling Bhakra
The figures of agricultural production also show that Punjab could be by no means considered backward. Wheat was the most important crop of the state. In 1953-54, Punjab had 13.6 percent of the wheat area of India, second only to U.P. Meanwhile, its production was about 20% of the country's production - 1.299 m tons. Similarly, in 1951-52 Maize area in Punjab was 9.1% of total maize area in India. The production in the same year was 13% of all India production.29 As far as gram was concerned, Punjab had 13.6% of the country’s area, while its production was 20.5% of the All India.30
This is not to say that there was no scope for improvement – or for concern. In the Hissar district, for example, crops had failed in 35.3% of the sown area between 1949-5431. But it is to point out that the picture that is presented, that before Bhakra, Punjab was dry, backward area is far from true. Compared to the rest of the country, Punjab (and PEPSU) had quite high proportion of irrigated areas, high proportion of geographical area cultivated, higher yields than national average, and contributed substantially to the national food grain production.
Like other states, Punjab too had areas that were scarcity prone that had less rainfall, were arid or semi-arid. That did not make the whole state dry and backward.
Hissar was the main scarcity prone district. Hissar of 1950s, comprising of today's Hissar, Bhiwani, Sira and Fathebad districts – is described as follows32:
“Situated ….on the fringe of Rajasthan, it partakes of the features of a desert; dry hot weather, dust-storms, and shifting monsoon sand-dunes. The normal annual rainfall is 14 inches of which 11 inches occurs in the monsoon months….
“Agriculture in Hissar has been described very aptly as ‘gamble in rains’……”
This was the Hissar in 1950s. Large parts of it (today’s Hissar, Sirsa and Fathebad district) are in the Bhakra command. It is this part of the Bhakra command that had some areas that were desert like, with sand dunes or brush like vegetation; these are the areas that may be responsible for the picture of Bhakra “transforming deserts into granary”. But the picture portrayed is that of whole of Punjab (of the 50s) being backward, dry and a desert.
Even this Hissar, with its low rainfall and low irrigation at that time was still the second largest producer of food grains in all the districts of Punjab, next only to Ferozpur33.
An interesting insight into the vegetation and ecology of the then Hissar area can be had for this comment:
“Around 1888 lions were hunted by the then rulers in Hisar. Record to this effect is available.”34
This is the picture of the Bhakra command. The most striking fact to emerge from the examination is that contrary to public perception, Bhakra has had a very limited role to play in Punjab. In the public minds, the equation “Punjab=Bhakra” is firmly entrenched; yet, the facts on the grounds are entirely different.
It’s main irrigation can be said to be in Haryana especially in the districts of Hissar, Sirsa, Fatehbad. What this means in terms of food production and agricultural prosperity is what we will examine in the subsequent chapters.
29 Anand 1956: Page 68, 70. Note that these figures are for Punjab that does not include PEPSU. 30 Source Anand 1956 for Punjab and Ministry of Agriculture, Govt. of India for All India figures. 31 Anand 1956: Page 51. The failure rate was the highest in Hissar in the whole state of unified Punjab. 32 Anand 1956: Page 4-5 33 Anand 1956 Page 71 34 Haryana State Biodiversity Strategy and Action Plan Year 2001; Chapter on Wildlife and Animal Life Para 4.3;
URL: http://www.w3.org/TR/REC-html40 Visited 13 June 2002
Bhakra Project Analysis of the Command 55
Table 4.13: Summary of Major Features of Irrigation from the Bhakra-Nangal Project As Per the 1953 Project Design35
Region I Region II Region III
Areas
Bist Doab, Samarala-
Rajpura, Patiala and Kaithal-
Pehowa
Adjoining the Sutluj on both sides of the river;
Mainly Grey canals through the new
Sidhwan Branch; also in Sirhind areas
The dry arid areas of Hissar, and Rohtak
districts and areas on the borders of
Rajasthan; Faridkot; Rajasthan all areas;
Type of Irrigation
Restricted Perennial (Rabi
only)
Non-Perennial (April to October) Perennial
Gross Commanded
Area (acres) 17,65,110 6,66,870 41,88,782
Cultivable
Commanded Area
(acres) 15,88,599 6,00,183 36,72,798
Annual Irrigation
(million acres) 0.715 0.21 2.67736
Intensity of
Irrigation 45% 35% 62%
Water Allowance
(Cusecs / 1000 acres) 2.25 3.750 2.75
Total Water
Required (MAF) 1.534 0.683 6.148
35 From Raj 1960, BBMB 1988, CAG 1977, Indian Journal of Power & River Valley Development 1956 36 This figure seems to be on the higher side; the given irrigation intensity of 62% and the CCA for this zone gives
the annual irrigation at 2.277 m acres and not 2.677. But the total annual irrigation figures from Raj match the figures given by Anand 1956: Page 52

This page is intentionally blank.
5Food Production, Food
Security and Bhakra:1950-1966
“Punjab, Haryana and Andhra Pradesh haveemerged as the granaries of the nation growingmore than two-thirds of the total rice crop ofthe country as a result of the irrigation benefitsreaped from the Bhakra Nangal and theNagarjun Sagar Dam.
“Dams built in Punjab and Haryana turnedthese states into the food baskets of the countryand have helped make India self sufficient infoodgrain production.
Facts on the Sardar Sarovar Project
Issued by the Shree Delhi Gujarati Samaj in July1999, under the heading “THE TRUTH”.
“Complex problems require complexsolutions.”
Vishwanath Pratap Singh,taking charge as India’s Prime Minister in 1989

Food Production, Food Security and Bhakra 1950-66 59
Food Production, Food Security and Bhakra 1950-1966
THERE ARE SOME VERY SIMPLISTIC BELIEFS PREVALENT IN INDIA ABOUT THE food problem. The most common theme is that India was a virtual beggar, depending on alms and imports for meeting its food needs; then came the large dams, food production increased dramatically, and India is now self-sufficient in food.
In this simplistic view, Punjab, Haryana and Bhakra have a central place. The equation is rather uncomplicated. India’s food problem has been solved mainly due to Punjab and Haryana – which have now become the granaries of the nation – and Punjab and Haryana have been able to achieve this due to Bhakra. In other words
Food Self-Sufficiency = Punjab & Haryana = Bhakra.
Another argument made persistently - which is a sort of generalisation of the above - is that to address its food problem, India has no options other than large dams. It had never had any other options and it does not have any other options.
The reality of food production in India is vastly more complex than this one-dimensional analysis, if it may be at all called as such. Many many other projects, programs and factors have played a part in the struggle to feed India’s people than just Bhakra. The claim of self-sufficiency itself is highly questionable. Before we look at all these, let us start with a quick look at the Bhakra project and some of the events in the first decade and half after independence.
For a project that is today projected as the saviour of the nation from the food crisis, for a project credited with converting Punjab into a granary of the nation, it is astonishing how cursorily the food production aspect was treated in the project development. According to K.N. Raj1:
“In the various project reports of the Bhakra Nangal, there are no precise or detailed estimates of the likely increases in agricultural production on account of the project. In general terms it has been stated (in the Project Report of 1953) that about 60 per cent of the area brought under irrigation (i.e. about 2.05 million acres) was likely to be put under food crops and that…..it would be possible to produce 15 maunds per acre making a total of 1.13 million tons of foodgrains per year.” (Emphasis added)
Note that this is not 1.13 m tons of additional production but a total of 1.13 m tons from the areas to be irrigated. To estimate the contribution of the project, we will need to subtract the production before the project in these areas from 1.13 m tons.
This should not be too surprising of course, to those now familiar with the history of the project’s planning and with what the real factors were behind the project.
1 Raj 1960: Page 90

60 Unravelling Bhakra
In 1948, India’s first Prime Minister had urged for food self-sufficiency by 1951 for the country.2
The irrigation from the Bhakra-Nangal project began in 1953-54, when about 46,000 acres were irrigated. In 1955-56, the last year of the First Plan, the irrigation from the project was about 1 million acres. (418,000 ha). By the time the second plan ended (in 1960-61) Bhakra was irrigating 1.7 m acres and by 1963-64 this had reached 2.48 m acres. For all practical purposes, this was the full development of the irrigation from the project.
Yet, throughout this period, the country was importing foodgrains (See Table 5.1) Indeed, the controls on food, which had been removed during the course of the First Plan – essentially before the project irrigation deliveries began - were back during the Second Plan. The imports also went up sharply. Table 5.1 shows the imports of cereals from 1951 to 1972. The figures are self-explanatory. What this shows is that even in 1972, 18 years after irrigation from Bhakra-Nangal had commenced, India was miles away from food self-sufficiency
Table 5.1 : Gross Production Of Cereals, And Net Imports On Government Account, Adjusted For Year-End Stocks Of Foodgrains With Government
Year
Gross Production of
Cereals (’000 tons)
Net Imports Adjusted for Changes in Govt Stocks of Foodgrains
(’000 Tons)
Imports as % of Total Production
1951 45,814 4212 9.2 1952 46,480 3308 7.1 1953 51,950 2518 4.8 1954 61,204 632 1.0 1955 59,091 1342 2.3 1956 57,630 1991 3.5 1957 60,306 2770 4.6 1958 56,524 3485 6.2 1959 65,586 3366 5.1 1960 65,253 3724 5.7 1961 69,592 3658 5.3 1962 70,687 3994 5.7 1963 68,789 4573 6.6 1964 70,615 7506 10.6 1965 76,954 6384 8.3 1966 62,403 10,199 16.3 1967 65,884 8925 13.5 1968 82,950 3652 4.4 1969 83,595 3384 4.0 1970 87,810 2457 2.8 1971 96,604 -541 -0.6 1972 93,598 4986 5.3
Source: Shenoy 1974: Page 148
The gap was huge. Shenoy3 estimates the food deficit in 1972 at 20.3% of the (net) domestic production for the year for cereals, and the same for pulses is estimated at 52.7%. He adds “this figure is a gross understatement of the actual deficit if it is viewed independent of the presumption regarding the availability of other items of food.”
2 Shenoy, B.R 1974: ‘PL 480 and India’s Food Problem’, Affiliated East-West Press, New Delhi: Para 5.65 Page
168 3 Shenoy 1974: Page 155
Food Production, Food Security and Bhakra 1950-66 61
For a project claimed as liberator of India from food dependency, it is a telling commentary that foodgrains imports and deficits remained high even with 18 years of project operation.
It may be mentioned here that imports are only one measure of food scarcity or of food self-sufficiency. Food prices are another measure. But both these pertain to essentially those who meet their food needs from the market. Absence of imports does not mean self-sufficiency.
There is another interesting sidelight to this discussion. It is often said that India was facing the ignominy of accepting aid from the USA under PL 480 and Bhakra Nangal rescued us from the same. It may come as a surprise to many people that PL 480 was not even in existence when work on the Bhakra project had started. The US Agricultural Trade Development And Assistance Act, 1954, being the 480th Public Law enacted by the 83rd Congress, is commonly referred to as PL 480- short for Public Law 480 4. As is obvious, it only came into existence in 1954 – when even the irrigation from Bhakra had already commenced. India initiated imports under PL 480 in 1956-57 – and continued to import foodgrains under PL 480 for the next 15 years – till 1972. The PL 480 imports were stopped in 1972 but it was clear that this was a premature step and India was not anywhere near self-sufficiency5.
Again, it may be noted that for a project that is said to have rescued us from the humiliation of the PL 480 – PL 480 imports started after the project had commenced and continued for 15 years into the life of the project.
With these few statements, we now look at the first decade and a half in some detail. In the first 15 years after Independence, foodgrains production in the country went up from 50.82 m tons in 1950-51 to 72.35 m tons in 1965-66. What were the factors behind this growth? What attempts were made to address the food question in this period? What were the policies of food and agriculture and how did they evolve?
A FEW WORDS ABOUT THE TERMINOLOGY AND ISSUES
India's food problem is a vast and extremely complicated issue; and many of the strands that were present in the debates around the 1940s-50s remain unresolved even till date - as does the problem of food. Millions even today go hungry to bed. It is an issue that has been intensely discussed, debated, argued since decades. It is not our intention to present this debate here in detail. However, it is important to try and understand the issues, concerns and options that existed in the early years.
There is little doubt that the 40s and 50s were times of serious food problem in the country. The nature and details of this problem were complex – there were issues of production, of availability, of foreign exchange, of distribution and equity. The 1940s were a time of shortages, rationing, and controls. It must be remembered that these were the times of war – the World War II had begun in 1939. Food controls and rationing was in place even in the land of the Colonial masters6. The mid-40s brought in the winds of independence, the trauma of partition and finally freedom. These were times of changing political boundaries – partition on one hand, amalgamation of the princely states on the other. Statistics, figures were prominent by their absence. It is no wonder that when India’s First Five Year Plan was formulated, there was little idea of the precise magnitude of the food problem.
One indication of this magnitude is the so-called food deficit. The deficit, as a layperson would understand – is the difference between the (per capita) requirement of the population and the actual (per capita) availability. This is sometimes termed as the “nutritional deficit”.
4 Shenoy 1974: Page 1 5 Shenoy 1974: Page 256-257 6 Indeed, in England, this rationing included not only food but cloth, sugar and so on.
62 Unravelling Bhakra
The “requirement” is itself very difficult to measure, given the vast diversity in the consumption patterns of population in India. The range of foods that constitute the food basket in the country - various kinds of cereals, pulses, meat, dairy products, other food items, makes it very difficult to reduce them to a “standard” requirement.
Availability is more than just production: it is production and net imports, adjusted for wastage, seed requirement, stock and so on. Moreover, to calculate per capita availability the population figures are converted into effective population to adjust for different consumption levels of different age groups. (Children eat less than adults and so on). The per capita availability is then calculated from these figures.
Of course, the per capita availability thus calculated is only an average, notional figure and hides the gross inequities in the distribution of the available food.
Thus, while conceptually the notion of food deficit is simple, in practice it is very difficult to measure it.
Another indicator often used for the food deficit is the level of food imports – signifying what is called the “market deficit”. The market deficit measures the shortage of market supply over market demand. There are several important issues here.
The market demand is strongly related to the price of foodgrains in the market. Or, to put it the other way round, to the purchasing power of the people. In other words, if the prices of food are very high in the market, there may be lesser “demand” for it, even though people may actually need the food. This is because they are not able to buy the food at the prices prevailing. Thus, the market demand can be quite different from the physical need for food.
It is possible that the domestic supply to the market may not be sufficient to meet the market demand. One way of meeting this is imports. Thus, the level of imports can be an important indicator of market deficit.
It should be pointed out that the market deficit relates essentially to those who obtain their requirement from the markets. This is the group of non-producers (of food). There is another category - that of food producers, farmers, for example - who do not depend on the market.7 Hence, their needs are not translated into market demands. However, if the production is not enough to meet these needs, there will be a deficit. Since they are not participating in the market, this deficit is not translated into a market deficit. Especially in the times when data and statistics on food production were hard to come by, the production, consumption and deficit of the producers were difficult to estimate. In a way, this deficit is an “invisible” deficit. In contrast, since market demand is a “visible” demand. It should be noted that needs of even some of those who depend on the market may be “invisible” as the high prices push them out of the market and their needs are not expressed as market demands.
There is a related concept of “marketable surplus”. The producers who grow more than their own needs will then sell their produce. This is broadly their marketable surplus – the “surplus” of production over their requirements. It is this marketable surplus that will feed the requirement of the market demand. Much of India’s food policy has focussed on increasing this marketable surplus so that the demand of the non-producers can be met without resorting to imports. It may be pointed out that the marketable surplus is a complex function of many factors. For example, if the farmer has had to raise loans to meet his working expenses, loans that need to be paid back immediately on harvest, it is possible that he may be forced to sell more of his produce, and may not be able to meet his own needs fully. In this case, the “surplus” that comes to the market is not a real surplus.
7 At least, not largely or totally. For example, marginal farmers may have to depend on the market for some part of
the year, so the division of the groups is not always black and white.
Food Production, Food Security and Bhakra 1950-66 63
Lastly, and this can’t be emphasised enough – adequate food “availability” or absence of imports (as expressed at the national level) does not imply that everyone has equal access to this food. Thus, there is the issue of the distribution and access to food, or food security.
This is what the First Plan document states, and it is worth quoting it at some length8:
“4. A major question that arises in this context is as to the precise measure of the 'deficit' in foodgrains the country must provide for. For this purpose, it is necessary to assess the trends in production and to see how they compare with requirements. We have given careful consideration to this question, but we find that on the basis of available data, it is not possible to reach any definite conclusions on this point.
“…. it is clear that an estimate of the ' deficit' arrived at on the basis of an average norm of requirements for the entire country is apt to prove wide of the mark.
“5. Apart from the fact that it is not possible from available data to say how much precisely is the total food production in the country, there is also some doubt whether these data could safely be used for framing a judgment as to whether or at what rate food production in the country has been increasing. There is a view that foodgrains production is, in fact, significantly larger than is indicated by official figures……
“(T)he aim of policy must be to increase domestic production, to secure an increase in the marketable surplus, to distribute the same as equitably as possible, and to eliminate by the end of the Plan period the need to import foodgrains. It might be well to stress in this connection that the need to import from abroad is related more directly to the marketable surplus available for meeting the requirements of non-food producers than to total production, and that the problem is not merely one of increasing production but also of mobilising more effectively the surpluses which become available with the producers.” (Emphasis added)
The last words on the “policy” throw light on the complexity of the issue. As the planning commission states, the “deficit” was practically impossible to estimate. Various discussions of that time show that imports were taken as an important indicator of the deficit in foodgrains; but imports relate mainly to the market deficit, which is an entirely different notion than that of food deficit. Moreover, it is, as the Planning Commission says, a measure that is mainly applicable to non-food producers. In a country like India, where even today, millions produce for self-consumption and not for the market, the market deficit is a notion that is not so relevant for these people. In the 50s, this was even more so.
Further, considering that millions of non-food producers were the poor, the price of food grains was an important parameter in terms of whether their need of food was actually expressed in terms of the market demand.
What does this mean for food security? Firstly, to address the food needs of the “producers” it was necessary to put into their hands the resources for producing food, and improve /develop resources they already had – for example, to improve productivity of their lands - so that they were not driven to the market for food. A key component of this would be land reforms. Access to land, and this means access with security of tenure, is the critical objective of a land reforms program. Unless this is in place, producers would not only hesitate to invest in land improvement, but would be driven to join the class of non-producers.
The second important conclusion was that for non-producers, increasing food production in concentrated pockets without increasing the capacity of people to purchase the same would not alleviate the food problem. Unfortunately, the country ultimately chose to follow a program of
8 Chapter 11: Food Policy for the Plan; First Five Year Plan, 1951-1956 Downloaded from the website of Planning
Commission, Government of India: URL: http://planningcommission.nic.in/plans/planrel/fiveyr/1st/1planch11.html , Accessed: Nov 25, 2002
64 Unravelling Bhakra
high capital, technology driven agricultural expansion which expanded the production in selected areas, without spreading the purchasing power in the hands of millions. We shall come back to this when we examine the various options that were presented to address the food problem.
Here is an issue that has been of key importance in the food (and water) policy debates in the country. India’s food policy at times has urged for concentration of inputs in selected parts of the country. The idea is to obtain large increases in production by intensification of inputs in better off areas. This means that the farmers in these areas will be in a position to provide more marketable surplus. On the other hand is the policy of spreading the inputs extensively so that there is small or reasonable increase in the production, which will enable the farmers to fulfil their own and local needs much better, but may not necessarily yield large marketable surpluses. Various words have been used to describe this – centralisation vs. decentralisation, selectivity, concentration, intensification9 and so on. We will see this debate in detail in the discussions that follow.
In spite of all the difficulties with the data, the First Plan did put a number to the food deficit - around 6-7% or, at best 5% of the production. It also stated, “For the immediate future, relative scarcity of foodgrains has to be regarded as a datum”. We can accept this and look at what was being done to address this, keeping in mind, however, that foodgrains production is only one aspect of the problem of food access.
As Ian Stone states10, drawing from the work of A.K. Sen11:
“(T)he evidence is clear that neither foodgrain production nor food availability is the key determinant of famine, as studies of the 1943 Bengal famine plainly show…
“The food supply in 1943 was around 5% lower than the average of the preceding five years and an estimated 13% higher than in 1941, when there was no famine”
Famine is an extreme form or manifestation of lack of food security. The complex relationship between food production, access to means of production, and other factors that actually define food security and the occurrence or not of famine have been extensively analysed by many experts. What we would like to stress here is that food production is only one determinant in whether people actually get to eat or not. How the food is produced, who produces it and where, at what costs, and who owns or controls the means of productions are as crucial parameters as the actual production itself.
Keeping this important qualification in mind, we come back to the late 1940s when newly independent India was grappling with its policy choices. Because of the nature of our enquiry, we will be focussing our discussion on the aspects related to water and irrigation and their role/contribution in food production and food security.
What were / are the means of increasing foodgrains production?
There are three main strategies to increasing foodgrains production.
1. Bringing in more area under cultivation. In other words, increasing the Net Area Sown (or Cultivated). As area not yet under cultivation is brought under the plough, this can increase the agricultural production. Of course, if the same area was being used for something else (for example if it was forest land, or grazing land), then one loses the benefits from the earlier use.
9 As such, intensification would mean increasing the inputs used, and this need not imply concentration of resources
in pockets. However, in a situation where the resources are limited, intensification would necessarily also mean concentration.
10 Stone, Ian. 1984: ‘Canal Irrigation in British India: Perspectives On Technological Change In A Peasant Economy’, Cambridge University Press, Cambridge
11 Sen, A. K. 1977: 'Starvation and Exchange Entitlements: A General Approach and Its Application to the Great Bengal Famine', Cambridge Journal of Economics, 1: 1, Pp. 33-59. (Quoted in Stone 1984 as above)

Food Production, Food Security and Bhakra 1950-66 65
2. Multiple cropping – in other words, increasing the Gross Sown Area. By taking more than one crop a year where only one crop grew, the agricultural production can be increased.
3. Increasing the yield of the crops.
There are many factors that play a vital role in all the three. Water is a crucial input for all these – though it may not always be the one that is the bottleneck. There are a number of ways in which water can be provided to increase areas under cultivation, or for multiple cropping or to increase yields. However, many times this is ignored and it is made out that only large dams and storage structures with canal irrigation can provide this water.
It is said that if we are to provide sufficient food for our (increasing) population, we have no option but to build large dams to store and divert all the flows of the rivers that are going “waste” to the sea. Linking of rivers to draw away “excess” from some rivers to feed the “deficits” of others is being justified on the same grounds. This TINA12 factor is repeatedly emphasised in debates. This argument is made even more forcefully for the period just after Independence. It is said that for the country confronted with the huge problems of poverty and hunger, there was little choice but to go for large dams like the Bhakra. There were no alternatives.
This picture is far from the truth.
It is remarkable that in the 40s and 50s, when planners were confronted with the same type of problems as far as food security was concerned, the TINA factor was notable by its absence. It is significant that the various options suggested then to address the food problem included, in substantial measure, decentralised, community based plans and projects, land reforms, minor irrigation and so on. While major and medium schemes were also there, there was great emphasis on the decentralised and small works.
Indeed, the ideological as well as the practical base of planning at that time revolved around “cooperation” and “community”, with the community as both, the vehicle of development as well as the unit of planning. This meant decentralisation. Emphasis was placed on land reforms, minor irrigation, and community development programs as the major strategies for food production.
Of course, there was strong opposition to this too; from people who genuinely believed that other strategies were necessary, but more importantly from strong vested interests. To give one example, the land reforms program met with strong resistance from the landed elites. Over the years, these conflicts were to play out in policy and implementation arena. Ultimately, the focus and policies decisively shifted towards large-scale centralisation.
As we trace out these processes in this chapter, several major reasons appear responsible for this shift. These include – strong opposition to land reforms, the difficulties of trying to implement a decentralised program, the unwillingness of the bureaucracy to “let go”, the bias towards “market deficit”, higher possibilities of “pay-offs” in large projects etc. Eventually, the programs moved to large scale projects and high capital input and technology based agriculture rather than strong land reforms, community water management and productivity improvement schemes.
Which of the strategies prevailed certainly has had a vital impact on what followed. But what is equally important is that there were other strategies. There were other approaches, other alternatives offered, proposed and even attempted right from in the early years. To us, this aspect is very important as it challenges directly the propaganda that there was, and is no alternative, that Indian policy makers had no choice. With these introductory remarks, we now look at the actual plans, policies and programs.
12 There Is No Alternative
66 Unravelling Bhakra
THE PRE-PLAN YEARS
In 1943 the Government of India launched the Grow More Food program.
The Grow More Food (GMF) program came out of the First Food Production Conference13 of all the States and Provinces of India, held on 6 April 1942. This conference made a recommendation for increasing food production and this became the basis for the GMF campaign14.
What did this campaign consist of? Between 1943-47, this campaign focussed on
(a) Switch from cash crops, mainly cotton, to food. (b) Intensive cultivation through irrigation, better seeds, manure etc. (c) Extensive cultivation by expanding cultivated area.
There were no specific targets.15 From our point of view, we should note that irrigation formed an important part of the GMF. But irrigation did not mean only large projects.
The Report of the Foodgrains Policy Committee, headed by Sir Theodore Gregory, set up by the Government of India in 1944, had some interesting comments on the irrigation aspects16:
“Committee recognises that major irrigation projects are not possible of execution under the present emergency conditions but they were impressed by the evidence of Sir William Stampe, Irrigation Advisor to GoI, who pointed out that apart from major projects, it was practicable to improve and extend irrigation facilities to increase production within a short time. Amongst such projects may be mentioned .. tubewells, and pumping of water from river beds…Then there are such projects as the sinking of open percolation wells, excavation of tanks and regulation of the flow of water in small streams and nallas ….They would not only add materially to the immediate needs of the increased production, but they would confer a permanent benefit on agriculture…”
However, implementation attempts during this time were confined largely to enacting legislation and taking executive action to transfer lands from cash crops to food crops and carrying propaganda for the adoption of more intensive methods of cultivation.17
1943 was the year of the terrible Bengal famine. Tragic as it was, the Bengal Famine is also often mis-represented in arguing for large dams and irrigation projects - as an example of the possible consequences of not building large dams18. In reality, the Bengal Famine is an important example of how factors other than the food production can have dramatic impact on food security and access.
In 1941 Burma came under the war, and imports of rice from Burma to India stopped. The production of rice in 1942-43 was 7 m tonnes, as against normal of 8.1 m tonnes. 135,000 tonnes used to be imported, (but due to war in Burma) this was not possible. So the shortfall was 1.2 m tons or 15%. Yet, the impacts were far out of proportion to the 15% shortfall. What were the factors that resulted in this aggravation?
13 Government of India 1944a 14 Report of the Grow More Food Enquiry Committee (V.T. Krishnamachari Committee)1952: Page 9 (Government
of India 1952) 15 Government of India 1952: Page 9 16 Government of India 1944a: Page 23 17 Foodgrains Enquiry Committee Report, 1957 Page 26 (Government of India 1957a) 18 See for example this presentation made to the World Commission on Dams : “If we are compelled to stop storage
projects for water resources development, the present scenario of self sufficiency in food production would evaporate soon and the problem of meeting the food and fibre needs would overtake us. We may, God forbid, have another Bengal Famine, which has faded into memory. We may have to go with a begging bowl all over the World for giving us just 2-3 million tonnes wheat again, as happened in 1960s.” (Visvanathan 2000)

Food Production, Food Security and Bhakra 1950-66 67
First was the so called “denial policy” of the Government. This was a war time strategy to prevent food stocks from falling into enemy hands. Under this, food stocks were removed from the area. This was further exacerbated by the withdrawal of boats from the area, again as a part of the war strategy. This was compounded by hoarding and black marketing, and the price of rice shot up to 10 times the pre-war level. It was all this taken together that resulted in the terrible Bengal Famine.19
The Report of the Foodgrains Policy Committee, headed by Sir Theodore Gregory set up of the Government of India in 1944 had similar conclusions20:
“We are forced to the conclusion, therefore that certain specific areas apart, the food crisis in India does not derive from an absolute decline in the volume of internal, physical production….”
We have dwelt on this at length to emphasise that access to food (which is what really counts in the end) is much more than mere production of food.
In 1947 came the Partition. Apart from the horrendous human tragedy, of particularly serious long term impact was the loss of foodgrains producing land of Punjab. India received 82% of the pre-partition population, but only 75% of the cereal production.21
In September 1947, the Government of India appointed the Foodgrains Policy Committee under the Chairmanship of Purushottamdas Thakurdas. The broad recommendations of this committee were22:
(a) Greater attention to minor irrigation works, development of local manurial resource, improved seeds etc
(b) Production of fertilisers (c) Survey of groundwater resources (d) Reclamation of cultivable waste
The Committee also suggested an organisational set up based on village panchayats and co-operative societies. The Committee made the important point that the data regarding requirement and production of food grains were very sketchy.23 It suggested a target of 10 m tonnes additional production in 5 years. As a part of this, in 1947-48, the GMF program was extended by 5 years. A target of additional 4 m tonnes of food was introduced.
In 1948, the Government invited Lord Boyd Orr to help in this matter. He called for a new objective of self-sufficiency by 1952 and put the target date deficit at 4.8 m tonnes of foodgrains.24 (Over 1947-48). What would surprise, possibly also delight the votaries of people's participation in development is that one of the key suggestions at this time was that “non-official” committees be also set up. Some committees were set up, like krushi samiti, irrigation committee etc. but “no systematic attempts have been made to rouse local initiative”.25
In 1949 came the report of the Congress Agrarian Reforms Committee.26 This recommended very strongly complete and comprehensive land reforms as a pre-requisite for improvement in
19 Speech of Food Member, Governor General’s Council and Other Papers, Presented by Secretary of State for India
to Parliament by Command of His Majesty Oct. 1943 (His Majesty’s Government 1943: Page 28). 20 Government of India 1944a: Page 10 21 Government of India 1952: Page 5 . The figures for wheat and rice were 65% and 68% respectively. 22 As recounted in Government of India 1952: Page 9 23 Interim Report – Foodgrains Policy Committee (Purushottamdas Thakurdas Committee) (Government of India
1947) 24 Government of India 1952: Page 10 25 Government of India 1952: Page 14 26 AICC 1949: ‘Report of the Congress Agrarian Reforms Committee’, All India Congress Committee, New Delhi,
68 Unravelling Bhakra
agricultural production and efficiency. It advocated radical measures to go far beyond mere abolition of the zamindari system and said “land must belong to the tiller”27.
The AICC Committee also quoted (and adopted) the recommendations of the Foodgrains Policy Committee that the country must aim to increase annual production of foodgrains by 10 m tonnes.
“Out of these 10 million tons, 4 million could be raised from the areas to be irrigated by the multi-purpose projects which would begin to operate within a period of 10-15 years. 3 million tons could be raised within the next five years through intensive cultivation, better manuring, use of improved seeds etc. The balance 3 million tons, according to the committee should come from the culturable waste lands to be reclaimed within a certain period.”28
Thus, out of 10 m tons, only 40% was expected to come from multi-purpose projects, that too over 10-15 years.
What is more interesting is that the AICC committee made it a point to note the report of one Dr. Schuhart on the soil and water conservation works of Bijapur, and stressed on his important findings, which the committee quotes verbatim in its report. We cite the same here29:
“The objective of the programme of soil and water conservation was to keep all the rain-water that fell on the land as near the place at which it fell as was possible to do and then to conduct excess rain-water into a farm pond which could be used for fish production, for stocking water and in some instances for the irrigation of farm gardens….all these plans were worked out with the farmer himself.
“With some modifications dictated by rainfall, erosiveness of soil and other local factor, the soil and water conservations programme as started at Bijapur could well be expanded to all of India…”30
This is effectively the same rainwater harvesting, watershed management program that is now proving so effective in countering drought and is emerging rapidly as an alternative approach to water management. We will find that suggestions for large-scale implementation of such programs have been repeatedly made from the 40s onwards. For example, the Grow More Food Enquiry Committee of 1952 also noted the work at Bijapur and reports the “valuable work ..being done on such [contour bunding] schemes in Sholapur and Bijapur districts of Bombay State” and notes that they have “special importance in the country”.31
In the “Minute of Dissent” two of the AICC Committee members also note that32
“It is bad economy to over-develop irrigational facilities in any area and trust to the ability of modern transport facilities to provide food-stuffs at famine prices to famine stricken areas….it serves both strategic purposes and uniform development of country to develop and pursue regionally balanced scheme of irrigational … projects……”
In 1948, the target of food self-sufficiency by 1951 was placed before the country. The Grow More Food campaign received a fresh impetus due to this. According to the Report of the Foodgrains Enquiry Committee:
27 It also recommended series of measures on agricultural credit, abolishing of money lending, on the issue of
landless labourers and so on. 28 AICC 1949: Page 155 29 AICC 1949: Page 158-159 30 The report describes the program in more detail. 31 Government of India 1952: Page 32 32 AICC 1949: Page 188; the two members were Shri O.P. R. Reddiar, Ex Premier Madras and N.G. Ranga,
President, All-India Kisan Congress

Food Production, Food Security and Bhakra 1950-66 69
“The main steps taken for achieving the target were the undertaking of permanent works and recurring supply schemes e.g. minor irrigation works, land reclamation and the supply of fertilisers, manures and improved seeds.”33
The Foodgrains Enquiry Committee report continues34,
“These programmes for extensive and intensive cultivation, however, tended at first to be rather thinly spread all over the country as there was a general demand from all localities for schemes. Thus, even when the programmes were implemented effectively, and yielded benefits in the shape of additional production, these did not make a contribution to the solution of the food problem by increasing marketed surplus substantially.....” (Emphasis added)
This part of the report is very revealing because this shows the clear and even excessive focus on the marketable surplus rather than the production of food. The benefits of “additional production” “did not make a contribution to the solution of the food problem”. Was this bias to shape the food and agricultural policy over the years? Subsequent events show that this was what happened. What does this indicate? The requirements and needs of the “producers” or the “local consumption” are not visible; the marketed surpluses on the other hand, were very visible. When one looks at the section of the society that is primarily catered to by the “market surplus” and the class of producers, the reasons for this bias become clearer, as do its implications.
This “limitation” of the spread-out nature of the Grow More Food (GMF) program led the Government to introduce an important change in the campaign.
In 1950-51, just as the First Plan was to begin, the GMF was reviewed and some important changes were made.. These included35:
(a) Concentration of seeds and manures in areas of assured rainfall/ irrigation (b) Selection of compact areas considered suitable for increasing minor irrigation, land
improvements (c) Construction of tubewells
Interestingly, the states objected, saying that over insistence on concentration of the GMF program was likely to lead to discontent in areas left out. This led to some dilution of the concentration. This debate over concentration or de-centralisation was one of the important themes over the years in the processes around India's food (and irrigation) policy.
In the event, in 1950-51 attempts were made to concentrate GMF efforts in compact areas called “intensive cultivation areas”. The primary aim was to augment the marketed surplus. 36
Around the same time as the intensive cultivation scheme was being formulated, the difficulties of importing cotton and jute from Pakistan led the Government to formulate the Grow More Jute and Grow More Cotton program and the three programs were integrated into an “Integrated Production Program” announced in 1950.37
The Report of the Foodgrains Enquiry Committee on this aspect again highlights the bias towards market and the implicit defining of “self sufficiency” in terms of adequate “procurement”. It states38:
“The experience of implementing the integrated production programme, however, showed that even the ideal of relative food self-sufficiency was in itself not capable of
33 Government of India 1957a: Page 26 34 Government of India 1957a: Page 26 35 Govt. of India 1952: 19 36 Government of India 1957a: Page 26-27 37 Government of India 1957a: Page 27 38 op cit Page 28

70 Unravelling Bhakra
easy achievement because in practice it turned out to be “moving target” in a country where the masses of the population where under-fed and even a small increase of production and of income led to a substantial increase in consumption. The basic assumption of fairly stable level of food consumption which was implicit in the earlier self-sufficiency scheme was itself not valid because it was not possible even in a regime of rationing as it obtained at that time to control the consumption of large sections of the population especially the millions of producer-consumers in the country…… Even the additional production achieved was not reflected in actual procurement as it was dispersed over large areas. The dependence on imports, therefore, continued. Moreover, the actual quantum of physical resources e.g., fertilisers and improved seeds which are distributed under the campaign was not large enough to cover more than a small portion of the total cultivated area under foodgrains.”
In a way, the producer-consumer was blamed for not allowing the marketable surplus to increase – as he was consuming much of the increased production. Clearly, the increase in the consumption of the producer was not seen as much of a contribution to “self-sufficiency” or a national gain. The non-availability of inputs in sufficient quantities was also a bottleneck.
The Government of India, therefore, set up in February 1952 the Grow More Food Enquiry Committee headed by V.T. Krishnamachari to examine the working of the Grow More Food campaign. The committee, which submitted its report in June 1952 came to the conclusion that, on the whole, the Grow More Food campaign had not achieved results expected of it. It had not aroused expected enthusiasm or effect in the countryside. The committee observed: “The problem of food production was a much wider one than the mere elimination of food imports….”39
Among the more important recommendations of the Committee were (a) setting up of a country wide extension organisation (b) the acceleration of the minor irrigation programme and (c) the provision of adequate rural credit.
It is significant that the main recommendations focussed on minor irrigation and extension service. Indeed, what clearly emerges from the analysis of the policies and plans of these years is the central place given to minor irrigation and small schemes. Certainly, there was a role envisaged for the large projects, but this was limited. One possible reason could be the immediate term nature of the planning in the GMF and related programs. The Report of the Grow More Food Policy Committee of the Government of Bombay notes:
“As the object of the GMF was to add to production of food within a period of 5 years ending 1951-52, none of the new major irrigation schemes were considered part of the GMF campaign.”40
Yet, this was only part of the explanation. The discussions show that land reforms, minor irrigation, community based programs, cooperation and host of other small schemes formed a major plank of the approach to address the food problem. This was clear from the programs undertaken in the Five Year Plans also.
THE FIRST PLAN 1951-56
The recommendations of the GMF Enquiry Committee were incorporated into the First Plan.
The Government of India launched it’s “most ambitious attempts to come to grips with her agrarian problems”41 in the form of the Community Development Program in 1952. This model pilot program covering comprehensive development of agriculture, animal husbandry,
39 Government of India 1957a: Page 27 40 Government of Bombay 1952: Page 59
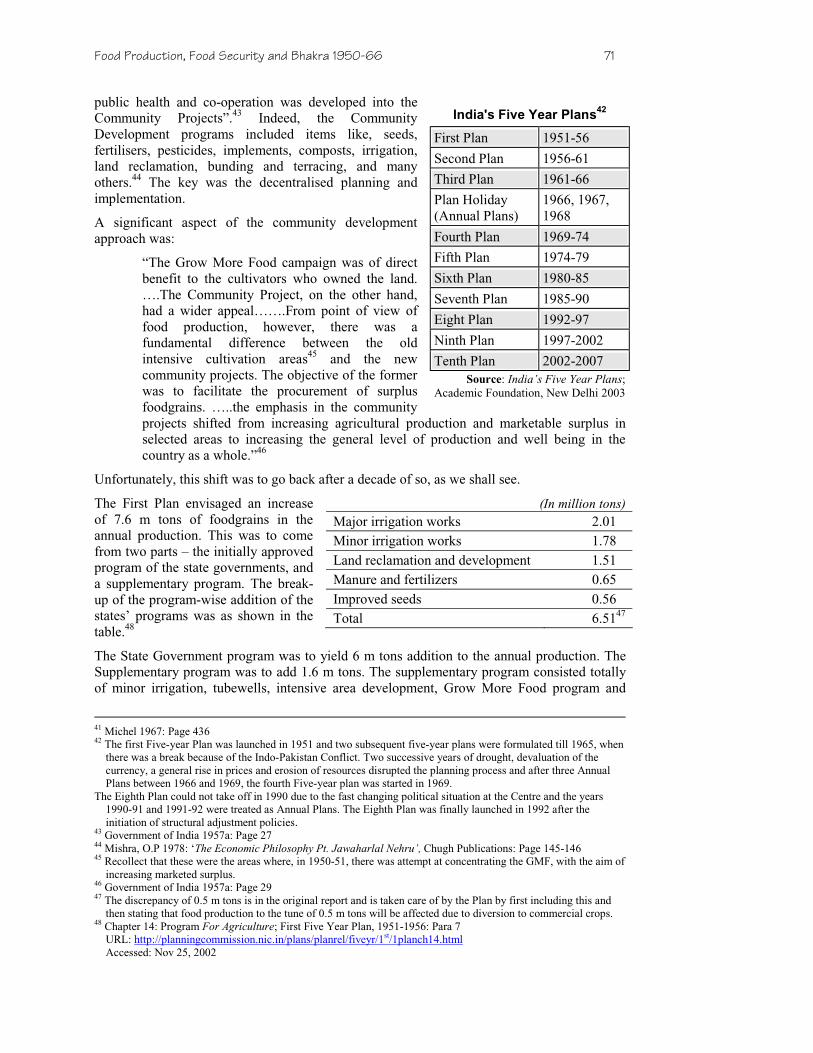
Food Production, Food Security and Bhakra 1950-66 71
public health and co-operation was developed into the Community Projects”.43 Indeed, the Community Development programs included items like, seeds, fertilisers, pesticides, implements, composts, irrigation, land reclamation, bunding and terracing, and many others.44 The key was the decentralised planning and implementation.
A significant aspect of the community development approach was:
“The Grow More Food campaign was of direct benefit to the cultivators who owned the land. ….The Community Project, on the other hand, had a wider appeal…….From point of view of food production, however, there was a fundamental difference between the old intensive cultivation areas45 and the new community projects. The objective of the former was to facilitate the procurement of surplus foodgrains. …..the emphasis in the community projects shifted from increasing agricultural production and marketable surplus in selected areas to increasing the general level of production and well being in the country as a whole.”46
Unfortunately, this shift was to go back after a decade of so, as we shall see.
The First Plan envisaged an increase of 7.6 m tons of foodgrains in the annual production. This was to come from two parts – the initially approved program of the state governments, and a supplementary program. The break-up of the program-wise addition of the states’ programs was as shown in the table.48
The State Government program was to yield 6 m tons addition to the annual production. The Supplementary program was to add 1.6 m tons. The supplementary program consisted totally of minor irrigation, tubewells, intensive area development, Grow More Food program and
41 Michel 1967: Page 436 42 The first Five-year Plan was launched in 1951 and two subsequent five-year plans were formulated till 1965, when
there was a break because of the Indo-Pakistan Conflict. Two successive years of drought, devaluation of the currency, a general rise in prices and erosion of resources disrupted the planning process and after three Annual Plans between 1966 and 1969, the fourth Five-year plan was started in 1969.
The Eighth Plan could not take off in 1990 due to the fast changing political situation at the Centre and the years 1990-91 and 1991-92 were treated as Annual Plans. The Eighth Plan was finally launched in 1992 after the initiation of structural adjustment policies.
43 Government of India 1957a: Page 27 44 Mishra, O.P 1978: ‘The Economic Philosophy Pt. Jawaharlal Nehru’, Chugh Publications: Page 145-146 45 Recollect that these were the areas where, in 1950-51, there was attempt at concentrating the GMF, with the aim of
increasing marketed surplus. 46 Government of India 1957a: Page 29 47 The discrepancy of 0.5 m tons is in the original report and is taken care of by the Plan by first including this and
then stating that food production to the tune of 0.5 m tons will be affected due to diversion to commercial crops. 48 Chapter 14: Program For Agriculture; First Five Year Plan, 1951-1956: Para 7
URL: http://planningcommission.nic.in/plans/planrel/fiveyr/1st/1planch14.html Accessed: Nov 25, 2002
India's Five Year Plans42
First Plan 1951-56
Second Plan 1956-61
Third Plan 1961-66
Plan Holiday (Annual Plans)
1966, 1967, 1968
Fourth Plan 1969-74
Fifth Plan 1974-79
Sixth Plan 1980-85
Seventh Plan 1985-90
Eight Plan 1992-97
Ninth Plan 1997-2002
Tenth Plan 2002-2007 Source: India’s Five Year Plans;
Academic Foundation, New Delhi 2003
(In million tons) Major irrigation works 2.01 Minor irrigation works 1.78 Land reclamation and development 1.51 Manure and fertilizers 0.65 Improved seeds 0.56 Total 6.5147
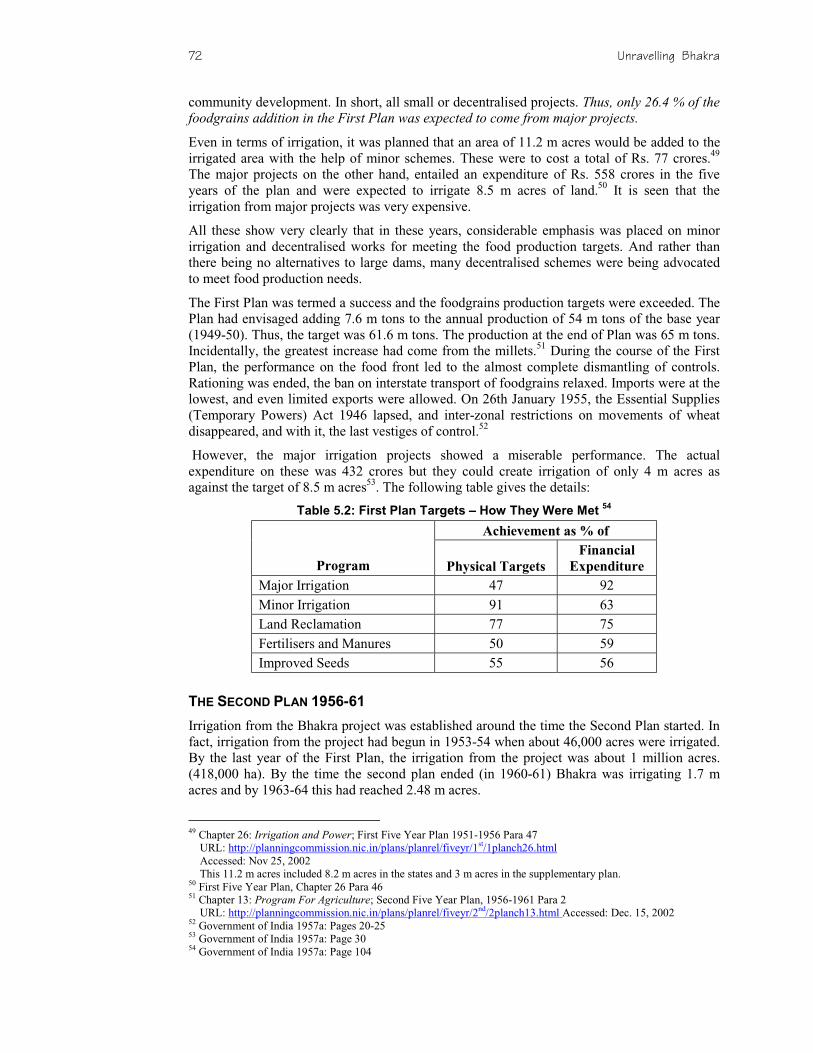
72 Unravelling Bhakra
community development. In short, all small or decentralised projects. Thus, only 26.4 % of the foodgrains addition in the First Plan was expected to come from major projects.
Even in terms of irrigation, it was planned that an area of 11.2 m acres would be added to the irrigated area with the help of minor schemes. These were to cost a total of Rs. 77 crores.49 The major projects on the other hand, entailed an expenditure of Rs. 558 crores in the five years of the plan and were expected to irrigate 8.5 m acres of land.50 It is seen that the irrigation from major projects was very expensive.
All these show very clearly that in these years, considerable emphasis was placed on minor irrigation and decentralised works for meeting the food production targets. And rather than there being no alternatives to large dams, many decentralised schemes were being advocated to meet food production needs.
The First Plan was termed a success and the foodgrains production targets were exceeded. The Plan had envisaged adding 7.6 m tons to the annual production of 54 m tons of the base year (1949-50). Thus, the target was 61.6 m tons. The production at the end of Plan was 65 m tons. Incidentally, the greatest increase had come from the millets.51 During the course of the First Plan, the performance on the food front led to the almost complete dismantling of controls. Rationing was ended, the ban on interstate transport of foodgrains relaxed. Imports were at the lowest, and even limited exports were allowed. On 26th January 1955, the Essential Supplies (Temporary Powers) Act 1946 lapsed, and inter-zonal restrictions on movements of wheat disappeared, and with it, the last vestiges of control.52
However, the major irrigation projects showed a miserable performance. The actual expenditure on these was 432 crores but they could create irrigation of only 4 m acres as against the target of 8.5 m acres53. The following table gives the details:
Table 5.2: First Plan Targets – How They Were Met 54
Achievement as % of
Program Physical Targets
Financial
Expenditure
Major Irrigation 47 92 Minor Irrigation 91 63 Land Reclamation 77 75 Fertilisers and Manures 50 59 Improved Seeds 55 56
THE SECOND PLAN 1956-61
Irrigation from the Bhakra project was established around the time the Second Plan started. In fact, irrigation from the project had begun in 1953-54 when about 46,000 acres were irrigated. By the last year of the First Plan, the irrigation from the project was about 1 million acres. (418,000 ha). By the time the second plan ended (in 1960-61) Bhakra was irrigating 1.7 m acres and by 1963-64 this had reached 2.48 m acres.
49 Chapter 26: Irrigation and Power; First Five Year Plan 1951-1956 Para 47
URL: http://planningcommission.nic.in/plans/planrel/fiveyr/1st/1planch26.html Accessed: Nov 25, 2002 This 11.2 m acres included 8.2 m acres in the states and 3 m acres in the supplementary plan.
50 First Five Year Plan, Chapter 26 Para 46 51 Chapter 13: Program For Agriculture; Second Five Year Plan, 1956-1961 Para 2
URL: http://planningcommission.nic.in/plans/planrel/fiveyr/2nd/2planch13.html Accessed: Dec. 15, 2002 52 Government of India 1957a: Pages 20-25 53 Government of India 1957a: Page 30 54 Government of India 1957a: Page 104
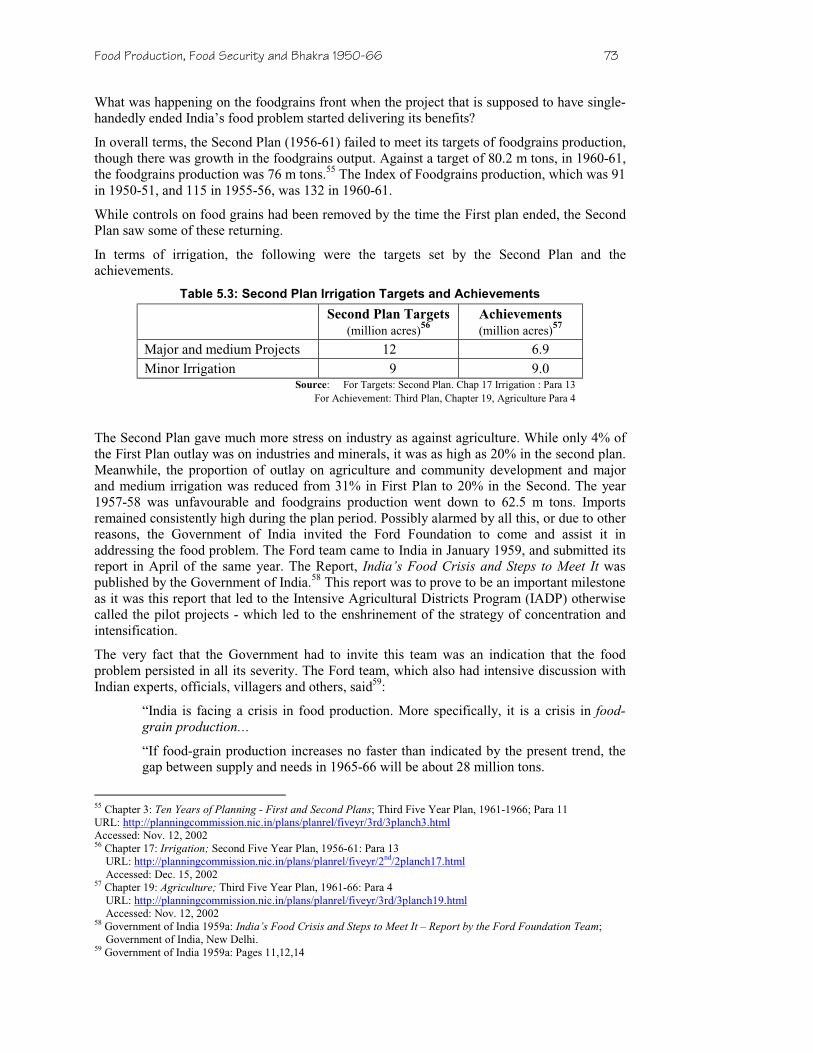
Food Production, Food Security and Bhakra 1950-66 73
What was happening on the foodgrains front when the project that is supposed to have single-handedly ended India’s food problem started delivering its benefits?
In overall terms, the Second Plan (1956-61) failed to meet its targets of foodgrains production, though there was growth in the foodgrains output. Against a target of 80.2 m tons, in 1960-61, the foodgrains production was 76 m tons.55 The Index of Foodgrains production, which was 91 in 1950-51, and 115 in 1955-56, was 132 in 1960-61.
While controls on food grains had been removed by the time the First plan ended, the Second Plan saw some of these returning.
In terms of irrigation, the following were the targets set by the Second Plan and the achievements.
Table 5.3: Second Plan Irrigation Targets and Achievements
Second Plan Targets
(million acres)56
Achievements
(million acres)57
Major and medium Projects 12 6.9 Minor Irrigation 9 9.0
Source: For Targets: Second Plan. Chap 17 Irrigation : Para 13 For Achievement: Third Plan, Chapter 19, Agriculture Para 4
The Second Plan gave much more stress on industry as against agriculture. While only 4% of the First Plan outlay was on industries and minerals, it was as high as 20% in the second plan. Meanwhile, the proportion of outlay on agriculture and community development and major and medium irrigation was reduced from 31% in First Plan to 20% in the Second. The year 1957-58 was unfavourable and foodgrains production went down to 62.5 m tons. Imports remained consistently high during the plan period. Possibly alarmed by all this, or due to other reasons, the Government of India invited the Ford Foundation to come and assist it in addressing the food problem. The Ford team came to India in January 1959, and submitted its report in April of the same year. The Report, India’s Food Crisis and Steps to Meet It was published by the Government of India.58 This report was to prove to be an important milestone as it was this report that led to the Intensive Agricultural Districts Program (IADP) otherwise called the pilot projects - which led to the enshrinement of the strategy of concentration and intensification.
The very fact that the Government had to invite this team was an indication that the food problem persisted in all its severity. The Ford team, which also had intensive discussion with Indian experts, officials, villagers and others, said59:
“India is facing a crisis in food production. More specifically, it is a crisis in food-grain production…
“If food-grain production increases no faster than indicated by the present trend, the gap between supply and needs in 1965-66 will be about 28 million tons.
55 Chapter 3: Ten Years of Planning - First and Second Plans; Third Five Year Plan, 1961-1966; Para 11 URL: http://planningcommission.nic.in/plans/planrel/fiveyr/3rd/3planch3.html Accessed: Nov. 12, 2002 56 Chapter 17: Irrigation; Second Five Year Plan, 1956-61: Para 13
URL: http://planningcommission.nic.in/plans/planrel/fiveyr/2nd/2planch17.html Accessed: Dec. 15, 2002
57 Chapter 19: Agriculture; Third Five Year Plan, 1961-66: Para 4 URL: http://planningcommission.nic.in/plans/planrel/fiveyr/3rd/3planch19.html Accessed: Nov. 12, 2002
58 Government of India 1959a: India’s Food Crisis and Steps to Meet It – Report by the Ford Foundation Team; Government of India, New Delhi.
59 Government of India 1959a: Pages 11,12,14

74 Unravelling Bhakra
“ ‘Business as usual’ will not achieve the food production targets. The steps necessary to mobilize the nation for action must be clearly outlined”. (Emphasis as in the original, throughout).
The team was obviously aware of the projects like Bhakra which were already functioning, and yet was clear that the present trends of food-grain production would not suffice to bridge the gap between the demand and supply. In other words, by themselves, projects like Bhakra were not going to be able to meet the goals of food-self sufficiency.
The team came out with very comprehensive recommendations in its 259-page report. What is interesting is that the team was not enamoured by the large-scale projects that were going on, and were indeed gaining currency with the Indian planners. Taken together, the package proposed by the team was nothing short of a completely different paradigm of agricultural growth – one that was to be based on decentralised, local schemes. The team, no doubt out of deference to the Indian planners, did not rule out large projects; but as we shall see, its emphasis was quite different.
The recommendations of the team are important for two reasons. Firstly, they show that to achieve growth in food production requires a large variety of measures – not just dams or irrigation; and that these measures in combination are critical in tackling the food problem. Secondly, while it is projected that India had no option but to go for large dams if it was to meet the food needs of its population, the report shows that there was indeed a comprehensive alternative (approach), which was better in several respects.
So what were the main recommendations of the team? The team highlighted the following proposals in its note titled “The Crucial Decisions” right at the front of the report. We quote (Emphasis as in original, through out)60:
“3. The Need for Emergency Action:…. A 110 m ton target, however, can be realised only if an all out emergency food production program is undertaken. Food production must be given the highest priority.
“4. The Need for Stabilisation of Farm Prices: Unless the cultivator is assured of a floor price for his food grains, he will be unwilling to invest in fertilisers, better implements, improved seeds…..
Recommended are:
(a) A guaranteed minimum price announced in advance… (b) A market within bullock-cart distance that will pay the guaranteed
price… (c) Suitable local storage….
“5. A Public Works Program for Increasing Food Production and Village
Employment: The unemployed and underemployed in the villages represent a waste of resources that should be used to produce more food. ….The team recommends a public works programme for projects requiring primarily hand labour, such a contour bunding, land levelling, surface drainage, irrigation wells and tanks. Such work will contribute directly to increasing food production, provide income for needy people and will not be inflationary.”
We pause here for a moment to understand the implications of this recommendation. This recommendation is nothing short of a massive program of watershed management, decentralised rainwater harvesting, soil water conservation that is now being talked about so much. It should be pointed out that the team had recognised the three most crucial benefits of such a program – one, that it would meet the needs of food-production, two, that it would
60 Government of India 1959a: Pages 3-7

Food Production, Food Security and Bhakra 1950-66 75
provide massive employment, and three, it would put purchasing power in the hands of the millions. The last is very important, as it is the lack of purchasing power in the hands of people that has resulted in the gross perversity of packed godowns and hungry people.
Coming back to the recommendations:
“6. Priorities for Chemical Fertilisers: Fuller use of manures, composts, and green manures is recommended. But at the very best, these can substitute only a small fraction of chemical fertilisers needed to meet the Third Plan food targets…
“7. Intensified Irrigation and Drainage Programme: India is using only a small portion of its potential water supply, which is one of the largest in the world…… Better water management is needed.
The Team believes that India can make greater and more immediate gains in food production by intensifying expenditure of time and effort on water management than by constructing large scale irrigation projects which take years to develop. The Team recommends that the Third Plan allocate substantial fund for technical assistance to aid cultivators in making better use of available water. Provision must also be made for more comprehensive approach with coordination of all relevant departments. The Team also recommends that more emphasis be placed on irrigation projects which will yield rapid returns in food production, such as tube wells and shallow masonry wells.
Millions of acres could be reclaimed and made more productive by drainage improvement. …..”
This recommendation also clearly brought out not just the method favoured by the team vis-à-vis irrigation, but also showed that there was a comprehensive alternative approach being presented.
“8. Selection of Certain Crops and Certain Areas for More intensive Efforts: …The Team recommends that those selected crops and those selected areas in each State should be chosen which have the greatest increase potentialities…… Attention to other areas should not be reduced. But, in the national interest, the Team believes that increased effort should be immediately directed to the most responsive areas.”
This recommendation was to lead to the Intensive Agricultural District Program.
“9. Security of Land Tenure and Land Consolidation: Assurance of stability of tenure can contribute substantially to food production. The Teams recommendation is that land ceilings and other land reforms should be settled as quickly as possible…..Firm plans should be developed immediately to schedule the completion of consolidation of fragmented holding….
“10. Immediate Large-Scale Credit Through Cooperatives: The present marketing, supply and credit services are major deterrents to increasing food production. Eighty five percent of credit is now supplied by money lenders and other individuals…Strong cooperatives can break these bonds….
“11. Progressive Reduction of Cattle Numbers: The excessive animal population competes with people for the products of the land. The Team recognises the limitations imposed by beliefs concerning cattle slaughter. Other ways of dealing with the problem are possible.”
What is repeatedly emphasised in the report is not only the “hardware” aspects – water and soil conservation, seeds, fertilisers, but also the “software” aspects – community mobilisation, credit and support prices, employment, coordination in works, training and so on. Another
76 Unravelling Bhakra
important aspect that is stressed is that it is only a combination of all these factors that will yield the best and optimum result. This highlights that it is not just one factor like irrigation or dams that can address the food problem.61
Let us look in more detail at the report and the issue at hand, namely, Bhakra and projects like it. The Team, as mentioned earlier, has placed great emphasis on decentralised works. No doubt, it has mentioned storage projects, but a overall reading of the report clearly shows that the focus of the team was on the community based works; For example, it says62 that “continued emphasis, therefore should be given to development of irrigation water supply through storage reservoirs and direct diversion from rivers and streams….”, but after this mention, it spends the next three pages discussing implementation of wells, tanks, improvement of conveyance, proper water management bunding and terracing and so on. In the Chapter on Water Supply too, it says that63 “In a country such as India, where much of the river flow is seasonal this requires storage either above ground or below the ground ....” .The recommendation of storage below the ground is an important indicator of its emphasis on soil water conservations schemes.
It is instructive to look at some of the recommendations of the team in detail, as it further exemplifies a decentralised approach.
“Contour bunding and terracing offer an immediate way to make possible tremendous increases in food production on many crores64 of acres of non-irrigated arable soils.”65 (Emphasis in original)
The report continues(Emphasis in original, throughout):
“Although land is relatively scarce, the labour supply is abundant, and there are great potentialities for increasing production per acre…
“There are many ways in which labour can be combined with relatively small capital outlays for fertilizers, pesticides, minor irrigation works, drainage and improved equipment. From the effective combination of all these resources will come the increased food supply which India needs. 66
“Sufficient capital must also be provided to permit the most effective use of the abundant labour resources. Chemical fertilizers, pesticides, improved seeds and other materials will have to be made available…Investments will have to be made in fertilizer plants, in tubewells and other minor irrigation works ….In this connection, it is important to note that the ratio of capital expenditure to added output will be much less in food production than in most other enterprises, and that the increase in output will generally come more quickly from investments in food production than from investments in heavy industry or very large irrigation projects.” 67
61 Certainly, the Team had its critics. Eminent economist Daniel Thorner wrote a scathing response to the Team
Report in the Economic Weekly. (“Ploughing the Plan Under – Ford Team Report on Food ‘Crisis’ EW Special Number July 1959.) The main thrust of his criticism is that the Ford team created an artificial food “crisis” in turn creating a panic scenario – a “statistically contrived food crisis”. This, he says, was the only way the Team could push for a complete turnaround of India’s Plan thrust on industry back to agriculture – what he terms “Lathes into Ploughshares”. His questioning of Ford’s projections of foodgrains requirements and other figures appear to be on strong grounds. As far as we are concerned, however, what is important is that he had nowhere rejected the approach that the Team has suggested for meeting food targets. He takes issue at the targets, and the resultant shift in the focus of planning.
62 Government of India 1959a: Page 46 63 Government of India 1959a: Page 142 64 On a different note, it is interesting to see the use of the term “crore” in an American Report. A possible
explanation could be that the team worked closely with Indian officials. 65 Government of India 1959a: Page 49 66 Government of India 1959a: Page 16 67 Government of India 1959a: Page 17
Food Production, Food Security and Bhakra 1950-66 77
“Equally important, improvement programmes should be tailored to fit the conditions faced by individual cultivators, village by village, block by block, and area by area……”68
Against this background, it is very instructive to note the views propagated by the irrigation establishment in the country. While the GMF program, the five years plans, the government policies all gave minor irrigation a significant, even equal place in addressing the food problem, the irrigation establishment was asserting that only large dams and storage projects could address India’s food problems. We will digress a little to look at this important aspect.
In 1958, Kanwar Sain, often called the doyen of irrigation engineering in the country, presented a “Master Plan for Integrated Water Development” in the country. (Sain 1958). Sain, who was then the Chairman of the Central Water & Power Commission and the President of the Institution of Engineers (India), had made this presentation in larger context of the food problem of the country. Indeed, Sain had been engaged with this problem for the previous decade at least, for he refers to his presentations of 1947 on the same issue also.
This Master Plan makes no mention whatsoever of any means other than large dams to meet the food production needs. Nothing else is even on its horizon. Indeed, the whole Master Plan is nothing but a plan trying to show how only large dams can solve India's food problem.
The presentation says69:
“In 1947, the author...emphasised the need for growing more food more quickly. Two big hurdles were mentioned by him in the effective utilisation of water potential i.e. – the need for expensive storage reservoirs and ...difficulties of financing them.
“Due to mal-distribution of water and seasonal variations, construction of storage reservoirs was the only solution to evolve a satisfactory method of utilising flood waters.”
Several such quotes reflect the approach that the only way to address the food problem in the country and to harness its water resources is large scale dams and storages.
When the Five Year Plans, the GMF program, the Ford foundation Report – all were not just talking about but also giving a central place to minor irrigation and other means of meeting food production targets, it is remarkable that Sain's plan for integrated water development – made specifically for increasing food production - should find no mention of these. One can understand that he may have felt these to be secondary. But what can account for their complete absence? One can only speculate on this – but this speculation may not be without a basis.
Large dams have huge costs and impacts. Many of these impacts were recognised even 50 years ago. Given all these costs and impacts, large dams would need very very strong reasons to justify their being built. Indeed, even if there was some indication that alternatives existed, it was possible that large dams would not be given preference. Hence, apart from downplaying the impacts, one important thing that large dam proponents needed to do was to somehow project their inevitability – assert that large dams and only large dams could solve India's food problem. It would have been difficult to push large dams without this aura of TINA. This seems to be the most plausible explanation of why Sain does not even mention any of the other measures for addressing water and food problems. It may be pointed out that such an attitude still persists in large sections of the irrigation establishment.
After these developments towards the end of the Second Plan, we come to the Third Plan.
68 Government of India 1959a: Page 18 69 Sain 1958: Page 605

78 Unravelling Bhakra
THE THIRD PLAN (1961-66)
The Third Plan (1961-66) did incorporate many of the recommendations of the Ford Team, at least in terms of stating them as a part of the agricultural strategy.70 However, in terms of the allocations, out of a total allocation of Rs. 1281 crores for agriculture, about Rs. 599 crores was allocated to major and medium schemes, thus, effectively rejecting the core theme of the Ford team recommendations. The vast decentralised works suggested by the Team were also not included.
One of the recommendations of the Ford team that was adopted was the “selection of certain crops and certain areas for more intensive efforts”. This was incorporated into the Third Plan as the Intensive Agricultural Districts Program (IADP). This program was important as this was to seed the decisive shift towards the policy of intensification and concentration of inputs and resource. We will come to the developments on this soon.
Tables 5.4 and 5.5 give the Third Plan outlays on agricultural production and targets for irrigation respectively.
Table 5.4: Outlays on Agricultural Production in Third Plan (Rs. crores)
Agricultural Production 226 .07 Minor Irrigation 176.76 Soil Conservation 72.73 Cooperation 80.10 Community Development (Agricultural Programmes) .
126.00
Major And Medium Irrigation 599 .34 Total 1281 .00
Source: Para 7 Chapter 19 Agriculture, Third Plan
Table 5.5: Targets of Agricultural Programmes Third Plan Programme Target
Irrigation (in million acres): 1. Major and Medium Irrigation (gross) . 12.8 2. Minor Irrigation (gross) . 12.8 (a) Agriculture 9.5 (b) Community Development . 3.3 Total 25.6
Source: Para 10 Chapter 19 Agriculture, Third Plan
Let us look at what happened on the food front during this period. The second plan foodgrains targets had not been met, and imports of foodgrains were high. The Third Plan was to prove
70 For example, the Approach to the Third Plan noted: “The Third Plan envisages concentrated effort in agriculture
on a scale calling for the participation of millions of peasant families of agricultural workers in village production plans and in large scale programmes of irrigation, soil conservation, dry farming, afforestation and the development of local manurial resources…” Chapter 4, Approach to the Third Five Year Plan, Third Five Year Plan:Para 4 URL: http://planningcommission.nic.in/plans/planrel/fiveyr/3rd/3planch4.html Accessed: Nov. 12, 2002
Food Production, Food Security and Bhakra 1950-66 79
even more of a disaster as far as foodgrains was concerned. The Third Plan had set a target of foodgrains production of 100 m tons by 1965-66, starting from a base of 76 m tons in 1960-61.71 However, except for years 1964-65, the production remained consistently below that achieved in the last year of the second plan. At the end of the Third Plan (1965-66), the foodgrains production was 72.35 m tons72. Foodgrains (cereals) imports reached sky-high to 10 m tons in 1966.
This is how the Fourth Plan document describes it73:
“7.10. Agricultural production has followed an erratic trend. After relative stagnation in the first three years of the Third Plan, there was a marked increase in 1964-65 when the output of practically crops (sic) reached new record levels. The aggregate index of production in this year was 159.4 (1949-50= 100) about 12 per cent higher than in 1960-61. The subsequent two years witnessed a precipitous fall of production on account of unprecedented drought, in 1965-66 food grains production fell by 20 per cent.”
This then was broadly the picture at the national level from the First to the Third Plan.
DEVELOPMENTS IN PUNJAB AND HARYANA
Let us now briefly digress to look at what was happening in Punjab and Haryana during this period.
Figure 5.1 shows the area under cultivation of foodgrains and production of foodgrains for unified Punjab74 (today’s Punjab and Haryana) as a percentage of all India during 1950-51 to 1962-63.
In 1950-51, unified Punjab had about 6.13% of India’s area under foodgrains and it was producing 6.85% of the country’s foodgrains output. What is interesting is all through the next 12 years this ratio remained more or less constant or increased marginally. What this means is that the food production in Punjab and Haryana showed no extraordinary increase over the all India performance. Thus, 10 years after Bhakra-Nangal project had become operational, agriculture in Punjab and Haryana had not shown any exceptional performance. Bhakra had not done anything dramatic in 10 years.
In terms of actual production, the production of foodgrains in (unified) Punjab increased from 3.483 m tons to 5.932 m tons from 1950-51 to 1962-63. The area under foodgrains in Punjab during this period went up from 5.96 m ha to 7.27 m ha. Thus, while the area increased 1.217 times, the foodgrains production increased 1.7 times. The same figures for all India were 1.21 and 1.57.
71 Chapter 19: Agriculture, Third Five Year Plan: Para 33
URL: http://planningcommission.nic.in/plans/planrel/fiveyr/3rd/3planch19.html Accessed: Nov. 12, 2002
72 Figures from Statistics At a Glance, Ministry of Agriculture, Government of India; at http://agricoop.nic.in/statistics2003/chap4a.htm#chap45a Accessed on Oct. 7, 2004.
73 Chapter 7: Agriculture, Fourth Five Year Plan: Para 7.10 URL: http://planningcommission.nic.in/plans/planrel/fiveyr/4th/4planch7.html Accessed: Dec. 17, 2003
74 This includes Haryana, Punjab and PEPSU territories

80 Unravelling Bhakra
Figure 5.1: Production and Area Under Cultivation of Foodgrains as a Percentage of All India for Unified Punjab and Haryana
6.13 6.115.50
6.176.036.23
5.41 5.52
6.36 6.34 6.39 6.42 6.21
7.407.807.53
8.248.448.00
7.347.177.57
6.306.85 7.77
7.39
0
1
2
3
4
5
6
7
8
9
1950
-51
1951
-52
1952
-53
1953
-54
1954
-55
1955
-56
1956
-57
1957
-58
1958
-59
1959
-60
1960
-61
1961
-62
1962
-63
Year
Percen
tag
e
Area Under Culitvation
Production
Source: Statistical Abstract of Punjab 1962-63
The rather ordinary performance of the two states in this period is seen clearly when we look at the contribution in the later years. Figure 5.2 at Annexure I to this Chapter presents the graph 5.1 extended to year 2001.
The Third Plan introduced the Intensive Agricultural District Program (IADP) in 1961 at the recommendation of the Ford team. One district was to be chosen in each state – districts “which have the greatest increase potentialities”.75
These meant the districts most highly endowed in natural resources – including “assured water supply”76 and most highly developed infrastructure.
It was started in three districts and eventually extended to another thirteen. As mentioned earlier, this program was to provide the seed for the new strategy.77
While many a times the proponents and advocates who herald Green Revolution proposes a link between mega irrigation projects and green revolution, a closer scrutiny will reveal that while selecting areas for implementing Intensive Agricultural District Programme, it was kept in mind that the area should have well developed assured water supply, it didn't specifically meant that the area should have been under the command of mega irrigation projects.
75 Chapter 19 Agriculture, Third Five Year Plan: Para 32 76 Government of India (undated); Report on the Intensive Agricultural District Programme 1961-63; Expert
Committee on Assessment and Evaluation, Ministry of Food and Agriculture, Government of India. Page 6 [Year of Publication appears to be 1964]
77 The IADP is many times thought of as the pre-cursor of the Green Revolution. This is not accurate, for, though the Green Revolution built on and demanded the strategy of intensification, this strategy itself had evolved independently and before the Green Revolution, of which the IADP was an important milestone. Possibly because the IADP was started in Ludhiana, a district that was at the forefront of the Green Revolution, and because the start of Green Revolution dovetailed into the final years of the IADP, it seemed to be a natural evolution. This was an incorrect picture, though both shared the strategy of intensification and concentration. We will talk of this more in the next Chapter.

Food Production, Food Security and Bhakra 1950-66 81
The district chosen in Punjab was Ludhiana. While Ludhiana was in the command of Sirhind / Bhakra, actual irrigation in the district was overwhelmingly from wells and tubewells. (Still is) In 1962-63, Ludhiana had a 49% of its net sown area irrigated – a total of 332000 acres. Out of these, 271000 were irrigated by wells and only 61000 by canals78 (18.37%).
THE STRATEGY SHIFT: SOME REASONS
The IADP was to be an important point of divergence for Indian’s food and agricultural policy. On one hand, the policy was claiming to be based on community development as the key to agricultural development. On the other hand, the basic logic of IADP was to focus on the areas well-endowed – in terms of water, soil, infrastructure, and within these well-endowed areas on the better off farmers. In general it represented a more technology driven approach.
Dasgupta (1977: 247) says
“The cornerstone of the new agricultural strategy of 1963, was its selective approach: selective of areas endowed with a favourable infrastructure, and within these areas the selection of 'progressive farmers' (who were usually larger farmers) for the distribution of inputs... The selective approach of the new agricultural strategy stood counter to the declared objectives of the community development or co-operative movement of involving the masses in rural development. It presented a technical solution to the country's food problem and bypassed the institutional issues. Rather than smashing or even weakening the village power structures through land reforms and other measures, attempt was made to enlist their support to the exclusion of the rest of the village population.”
Indeed, it seems that by the time the Third Plan was over, Indian planners and implementers had almost given up on the community and co-operative based approach. The absence of land reforms, the bureaucratic machinery and lack of political will to implement the community based model amounted to a virtual renegation of the vision of the early years of Independence - a vision focussed on the community driven development.
The problems of a bureaucracy implementing the community development were seen early on.
The Congress Agrarian Committee (1951: 44) had remarked while emphasising the role of village community in ensuring the agricultural development and food security:
“Indian agriculture will remain spread out, manned by millions of persons, and to make the social will effectively felt by the people in distant parts, the village community is the one and only instrument. The intimacy of touch, without which no reform or no legislation can produce any effect, can be secured only through village community... The present food scarcity in spite of 'Grow More Food Campaign', in spite of committees and commissions, and our wandering about with a begging bowl have proved to the hilt the complete failure of the centralised bureaucratic method.”
The Grow More Food Enquiry Committee in 1952 reported that the program “had not aroused expected enthusiasm or effect in the countryside.”79
One of the greatest political satires of Hindi literature, the brilliant, hard hitting and side-splittingly funny classic Raag Durbari brings this out in its own inimitable style. This excerpt talks about how the Grow More Food campaign was undertaken in Shivpalgunj, the village in which the novel is set.80
78 Statistical Abstract of Punjab 1962-63 79 Government of India 1957a: Page 28 80 Shukla, Srilal 1968: ‘Raag Darbari’, Rajkamal Prakashan, New Delhi: Page 57-58

82 Unravelling Bhakra
^^mu fnuksa xkao esa ysDpj dk eq[; fo"k; [ksrh FkkA bldk ;g vFkZ dnkfi ugha fd igys dqN vkSj FkkA okLro esa fiNys dbZ lkyksa ls xk¡o okyksa dks Qqlykdj crk;k tk jgk Fkk fd Hkkjro"kZ ,d [ksfrgj ns'k gSaA xk¡ookys bl ckr dk fojks/k ugha djrs Fks] ij izR;sd oDrk 'kq: ls gh ;g ekudj pyrk Fkk fd xk¡ookys bl ckr dk fojks/k djsaxsA blfy, os ,d ds ckn nwljk rdZ <w¡<dj ykrs Fks vkSj ;g lkfcr djus esa yxs jgrs Fks fd Hkkjro"kZ ,d [ksfrgj ns'k gSA blds ckn os ;g crkrs Fks fd [ksrh dh mUufr gh ns'k dh mUufr gSA fQj vkxs dh ckr
crkus ds igys gh izk;% nksigj ds [kkus dk oDr gks tkrk……dHkh&dHkh dqN oDrkx.k vkxs dh ckr Hkh crk ys tkrs Fks vkSj rc ekywe gksrk fd mudh vkxs dh vkSj ihNs dh ckr esa dksbZ Q+dZ ugha Fkk] D;ksafd ?kwe&fQjdj ckr ;gh jgrh Fkh fd Hkkjr ,d [ksfrgj ns'k gS] rqe [ksfrgj gks rqedks vPNh [ksrh djuh pkfg,] vf/kd vUu mitkuk pkfg,A izR;sd oDrk blh lUnsg esa fxj¶+rkj jgrk Fkk fd dk'rdkj vf/kd vUu ugha iSnk djuk pkgrsA**
^^ysDpjksa dh deh foKkiuksa ls iwjh dh tkrh Fkh vkSj ,d rjg ls f'koikyxat esa nhokjksa ij fpids ;k fy[ks gq, foKkiu ogk¡ dh leL;kvksa vkSj muds lek/kkuksa dk lPpk ifjp; nsrs FksA felky ds fy,] leL;k Fkh fd Hkkjro"kZ ,d [ksfrgj ns'k gS vkSj fdlku cnek'kh ds dkj.k vf/kd vUu ugha mitkrsA bldk lek/kku ;g Fkk fd fdlkuksa ds vkxs ysDpj fn;k tk;s vkSj mUgsa vPNh&vPNh rLohjsa fn[kk;h tk;saA muds }kjk mUgsa crk;k tk; fd rqe vxj vius fy, vUu ugha iSnk djuk pkgrs rks ns'k ds fy, djksA blh ls txg&txg iksLVj fpids gq, Fks tks dk'rdkjksa ls ns'k ds fy, vf/kd vUu iSnk djkuk pkgrs FksA ysDpjksa vkSj rLohjksa dk feyk&tqyk vlj dk'rdkjksa ij cM+s t+ksj ls iM+rk Fkk vkSj Hkksys&ls&Hkksyk dk'rdkj Hkh ekuus yxrk Fkk fd gks&u&gks] blds ihNs Hkh dksbZ pky gSA**
^^f'koikyxat esa mu fnuksa ,d ,slk foKkiu [kklrkSj ls e'kgwj gks jgk Fkk ftlesa ,d ranq:Lr dk'rdkj flj ij vaxksNk ck¡/ks] dkuksa esa ckfy;k¡ yVdk;s vkSj cnu ij fetZbZ igus xsgw¡ dh Å¡ph Qly dks g¡fl, ls dkV jgk FkkA ,d vkSjr mlds ihNs [kM+h gqbZ] vius&vkils cgqr [kq'k] d`f"k&foHkkx ds vQ+ljksaokyh g¡lh g¡l jgh FkhA uhps vkSj Åij vaxzsth vkSj fganh v{kjksa esa fy[kk Fkk] ^^vf/kd vUu mitkvksA** fetZbZ vkSj ckyh okys dk'rdkjksa esa tks vaxzsth ds fo}ku Fks] mUgsa vaxzsth bckjr ls vkSj tks fgUnh ds fo}ku Fks] mUgsa fgUnh ls ijkLr djus dh ckr lksph x;h Fkh] vkSj tks nks esa ls ,d Hkh Hkk"kk ugha tkurs Fks] os Hkh de&ls&de vkneh vkSj vkSjr dh rLohj ns[krs gh os mldh vksj ihB Qsjdj nhokuksa dh rjg vf/kd vUu mitkuk 'kq: dj nsaxsA**
Writing about the Indian efforts to implement its food and agricultural programs, Michel observed that81:
“India’s most ambitious attempts to come to grips with her agrarian problems took the form of the community development program which was inaugurated in October 1952…….
“(It)… was launched with a great deal of enthusiasm…But even by 1957 it had become apparent that all was not going well. ….the program was becoming a top-down or super-imposed affair. Too many village level workers were assuming the role of managers or even petty dictators….”
It was then attempted to put in place the Panchayati Raj system with the village panchayats as the primary vehicles of development. The Third Plan documents states82:
81 Michel 1967: Page 436-439 82 Chapter 4 Approach to the Third Five Year Plan, Third Plan : Para 4
Food Production, Food Security and Bhakra 1950-66 83
“With the establishment of democratic institutions at the district, block and village levels, responsibility and initiative in economic and social development in rural areas will rest increasingly with popular organisations—with Zila Parishads, Panchayat Samitis and Village Panchayats and with co-operatives. In the pattern of rural development, service cooperatives are to be organised on the basis of the village community as the primary unit. …
“The Third Plan envisages concentrated effort in agriculture on a scale calling for the participation of millions of peasant families of agricultural workers in village production plans and in large scale programmes of irrigation, soil conservation, dry farming, afforestation ….”
While this was stated on one hand, on the other side, it seems that the ground was also being laid to move away from this. The Third Plan document says83:
“The principal advantages of minor irrigation works are that they can be executed quickly, entail small outlays and there is only a short lag between their completion and the realisation of benefits. Moreover, they can be undertaken at the initiative of individuals and small groups and offer scope for participation by the community. Yet, it has been observed that minor irrigation programmes are tending increasingly to develop as programmes for small-scale irrigation works executed by Government agencies with little voluntary labour or participation by the people. It is of the utmost importance that for the greater part minor irrigation should be developed in all States as essentially a community programme in which local contributions in money and labour are specially stressed. When the scale of the minor irrigation programme becomes large, it involves problems of organisation, investigation and utilisation which may in some ways be even more difficult than those which arise in the case of larger irrigation works.” (Emphasis added)
Given the hugely complicated logistics, planning and management of the decentralised approach, the contradictions inherent in the centralised management of a decentralised program, not to say the problems of taking harsh decisions like land reforms that would upset the elites – it is hardly surprising that the Government started finding it easier to implement the large-scale projects than the community driven decentralised ones. This was true in general not just of the minor irrigation schemes, but also of the whole community based/ driven programs.
Further, the bias towards marketable surplus – inherent in many ways in the nature of the Indian ruling class - also was driving the food policy away from the community based to one that would enhance the “visible” component of the food production. This was an important reason for the shift towards projects that concentrated efforts in limited areas through technology and capital intensive programs.
It was not only the huge logistics, or the focus towards market, or a bureaucracy that was not able / willing to be “servant of the people” or too many interests preventing full land reforms; the larger projects offered huge possibilities for corruption. The deterioration in the system was rapid84.
83 Chapter 19 Agriculture, Third Five Year Plan: Para 12 84 When we spoke to the oustees of the Bhakra project who faced displacement in the late 40s and early 50s, they
told us forcefully that there was no corruption in the payment of compensation – whatever the other problems there may have been. Yet, corruption was to grow to be a huge menace in public life and public work in a big way soon. Well known theatre personality Gursharan Singh described the downfall with great feeling and frustration to us in Chandigadh. He was a cement technologist and was in the research laboratory at Bhakra from 1951 to 1962. He talked about how there was great enthusiasm and feeling of national pride at that time. But this, he said was till about 1958-59- after that, the corruption increased hugely, and the wave of national pride also subsided.

84 Unravelling Bhakra
Both, the push and pull factors were against the community and decentralised approach. Thus, in spite of the strong and numerous recommendations in favour of decentralised, community drive approach, the Third plan did not adopt the same, choosing to focus instead on large-scale projects.85
1961 - THE PACKAGE PROGRAM AND NEW AGRICULTURAL STRATEGY
We have seen above that the IADP was introduced in selected districts of the country in 1960-61 as a part of the recommendation of the Ford Team.
The Recommendation of the Agricultural Production Team (Ford Team) to focus on selected districts was considered by a high-level Inter-Ministries Committee of the Government of India in June 1959 and was accepted in principle. To give precise shape to the recommendations, a second team of agricultural experts, sponsored by the Ford Foundation visited India in October 1959. This team, in consultation with the experts of the Central and State governments outlined a program for the intensive and coordinated approach to agricultural production in their report titled “Suggestions for 10 Point Pilot Programme to Increase Food Production”.86
The Intensive Agricultural District Programme, popularly know as the “Package Program” was developed from this.
“It envisages the selection of favourable areas with maximum irrigation facilities and minimum of natural hazards, providing simultaneously all the essential elements, such as full supplies, credit etc. needed to increase agricultural production…..
“In the districts selected…all the elements required for increasing production are to be simultaneously provided….
“The means through which production increases are sought to be achieved.. …include many of the known methods and practises. What is new in the programme is the collective application of these in optimum doses, backed by adequate technical guidance and financial resources….”87 (Emphasis added)
Ford Foundation agreed to fund parts of the scheme provided it was taken up in one district each in seven states – four predominantly rice growing, two wheat growing and one millet growing. The outline scheme was considered at a meeting of the Agricultural Secretaries of these states held on 27th October 1959 and was generally accepted for implementation. The Government of India approved it on 11 June 1960. It was made a part of the Third Plan.
This program - formulated as a Five Year project - was initially started in 7 districts in the country and then extended to a total of 15 – one in each state.
85 It may however, be mentioned that unlike popular belief, small and minor irrigation continued to play a major role
in the country, and even today the position is the same. In 1950-51, total area irrigated (net) in the country was 51.5 m acres, out of which 29.5 was by minor and 22 from major irrigation. For 1960-61, the figures were total 70 m acres, minor 39 m acres and major 31 m acres. (Third Plan, Chapter 24, Irrigation). However, increasingly minor irrigation has come to mean tubewell extraction based on groundwater. The wide spread community driven water harvesting schemes that included soil, water and vegetation management did not get the kind of place suggested. In 1990-91, tubewells accounted for 30% of the irrigation in the country, and along with wells for 51%. (http://planningcommission.nic.in/data/stat/statistics3.pdf Accessed on Nov.10, 2004)
86 Government of India (undated); Report on the Intensive Agricultural District Programme 1961-63; Expert Committee on Assessment and Evaluation, Ministry of Food and Agriculture, Government of India. Page 2
87 Government of India (undated); Report on the Intensive Agricultural District Programme 1961-63; Expert Committee on Assessment and Evaluation, Ministry of Food and Agriculture, Government of India. Page 3-4 The same document later describes this “package concept” as the “distinctive feature” of the IADP (Page 197)
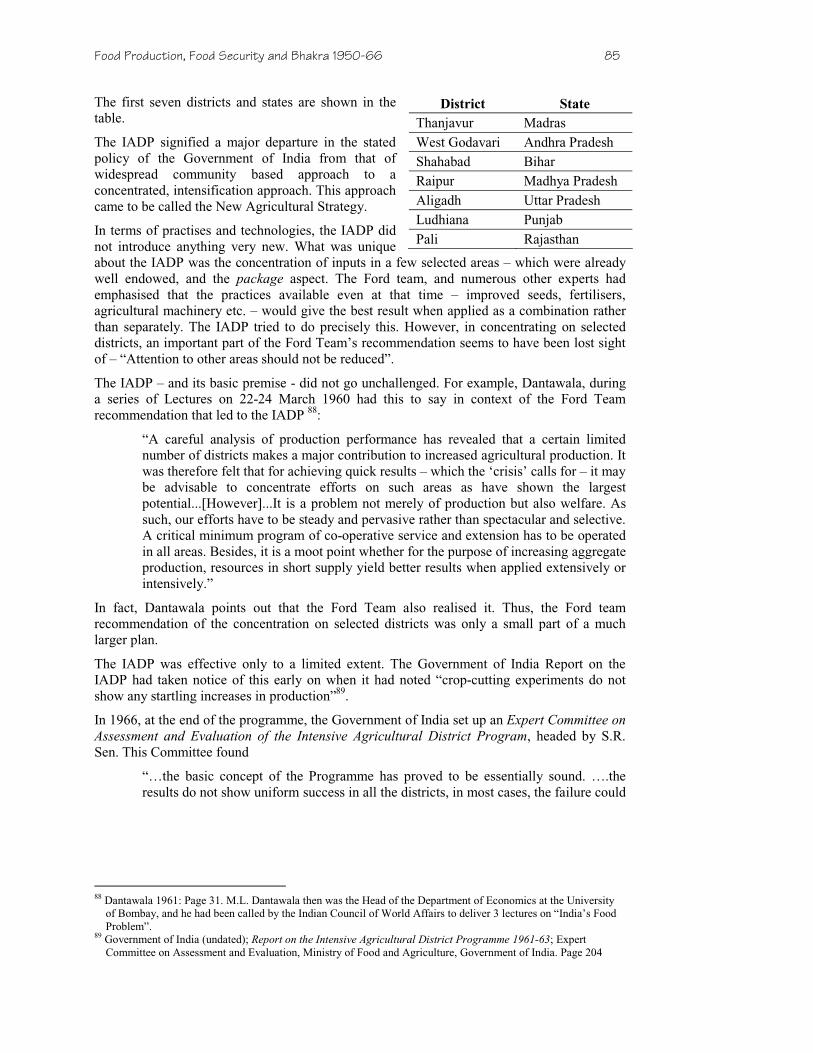
Food Production, Food Security and Bhakra 1950-66 85
The first seven districts and states are shown in the table.
The IADP signified a major departure in the stated policy of the Government of India from that of widespread community based approach to a concentrated, intensification approach. This approach came to be called the New Agricultural Strategy.
In terms of practises and technologies, the IADP did not introduce anything very new. What was unique about the IADP was the concentration of inputs in a few selected areas – which were already well endowed, and the package aspect. The Ford team, and numerous other experts had emphasised that the practices available even at that time – improved seeds, fertilisers, agricultural machinery etc. – would give the best result when applied as a combination rather than separately. The IADP tried to do precisely this. However, in concentrating on selected districts, an important part of the Ford Team’s recommendation seems to have been lost sight of – “Attention to other areas should not be reduced”.
The IADP – and its basic premise - did not go unchallenged. For example, Dantawala, during a series of Lectures on 22-24 March 1960 had this to say in context of the Ford Team recommendation that led to the IADP 88:
“A careful analysis of production performance has revealed that a certain limited number of districts makes a major contribution to increased agricultural production. It was therefore felt that for achieving quick results – which the ‘crisis’ calls for – it may be advisable to concentrate efforts on such areas as have shown the largest potential...[However]...It is a problem not merely of production but also welfare. As such, our efforts have to be steady and pervasive rather than spectacular and selective. A critical minimum program of co-operative service and extension has to be operated in all areas. Besides, it is a moot point whether for the purpose of increasing aggregate production, resources in short supply yield better results when applied extensively or intensively.”
In fact, Dantawala points out that the Ford Team also realised it. Thus, the Ford team recommendation of the concentration on selected districts was only a small part of a much larger plan.
The IADP was effective only to a limited extent. The Government of India Report on the IADP had taken notice of this early on when it had noted “crop-cutting experiments do not show any startling increases in production”89.
In 1966, at the end of the programme, the Government of India set up an Expert Committee on Assessment and Evaluation of the Intensive Agricultural District Program, headed by S.R. Sen. This Committee found
“…the basic concept of the Programme has proved to be essentially sound. ….the results do not show uniform success in all the districts, in most cases, the failure could
88 Dantawala 1961: Page 31. M.L. Dantawala then was the Head of the Department of Economics at the University
of Bombay, and he had been called by the Indian Council of World Affairs to deliver 3 lectures on “India’s Food Problem”.
89 Government of India (undated); Report on the Intensive Agricultural District Programme 1961-63; Expert Committee on Assessment and Evaluation, Ministry of Food and Agriculture, Government of India. Page 204
District State
Thanjavur Madras West Godavari Andhra Pradesh Shahabad Bihar Raipur Madhya Pradesh Aligadh Uttar Pradesh Ludhiana Punjab Pali Rajasthan
86 Unravelling Bhakra
be attributed to the shortcomings of the administrative system and inadequate supply of the essential inputs.” 90
In more detail:
“…the Programme has been able to achieve substantial increase in agricultural production in almost all the districts [but]…..an analysis of the per unit yield obtained for the important food crops in the IADP districts shows that only in three districts, the yields have gone up appreciably while in the remaining districts they are more or less static. …… the performance of many of the control blocks (selected for the comparative assessment of the impact of the Programme) has turned out to be better compared to the yields obtained in the IADP districts.”91
Ludhiana was one of the districts that performed better than the control district, especially in wheat.
In spite of the mixed results of the program and the criticism of the selective approach, the Government decided to extend the program.
The Fourth Plan Document Notes92:
“7.2. The first stage of the new strategy pertained to the Intensive Agricultural District Programme. It was started in 1960-61 in three districts and was subsequently extended by stages to another thirteen. While the performance varied, it clearly demonstrated both, the value of the “package” approach and the advantage of concentrating effort in specific areas. In 1964-65 and subsequent years, a modified version of the same approach was extended to several other parts of the country in the form of the Intensive Agricultural Area Programme.” (Emphasis added)
The IADP was extended to more than a 100 districts in the form of the IAAP, with a proposed selection of 32 million acres (13 m ha) under foodgrains in these districts for special attention along the lines of the package program.
With the IADP, we come to the end of an important phase in India’s agricultural and foodgrains production. These first 15 years of planned development saw many ups and downs in the production of food grains. The First Plan raised hopes that food self-sufficiency was around the corner; the Second and Third plan periods dashed the hopes to ground. The stated policy included community based and community development approach, land reforms, minor irrigation and so on, but the political will behind this and its implementation on the ground left much to be desired. The Third Plan period saw a shift of the policy towards selectivity, and a beginning of an increasing reliance on high technology, high capital approach to increasing food production.
Food production did increase over this period, though in a manner fluctuating between highs and lows. Food imports reached their peak in 1966. In over 10 years of functioning, the Bhakra project had done little that it is now attributed with. There was nothing dramatic about the performance of the foodgrains production – nothing revolutionary. Indeed, that there was nothing remarkable about this period is signalled by the term that came to be commonly used for the next phase – the Green Revolution. Collins dictionary defines “revolution” as “far reaching and drastic change”. We look at what this entailed, in the next chapter.
90 Anon 1966b: ‘IADP: What Holds it Down Official Paper – Report of the Expert Committee on Assessment and
Evaluation of the Intensive Agricultural District Programme, Government of India, 1966’, in Economic and Political Weekly, Sept. 17, 1966
91 Anon 1966b 92Chapter 7 Agriculture, Fourth Five Year Plan, 1969-74: Para 7.2
URL: http://planningcommission.nic.in/plans/planrel/fiveyr/4th/4planch7.html Accessed: Dec. 17, 2003
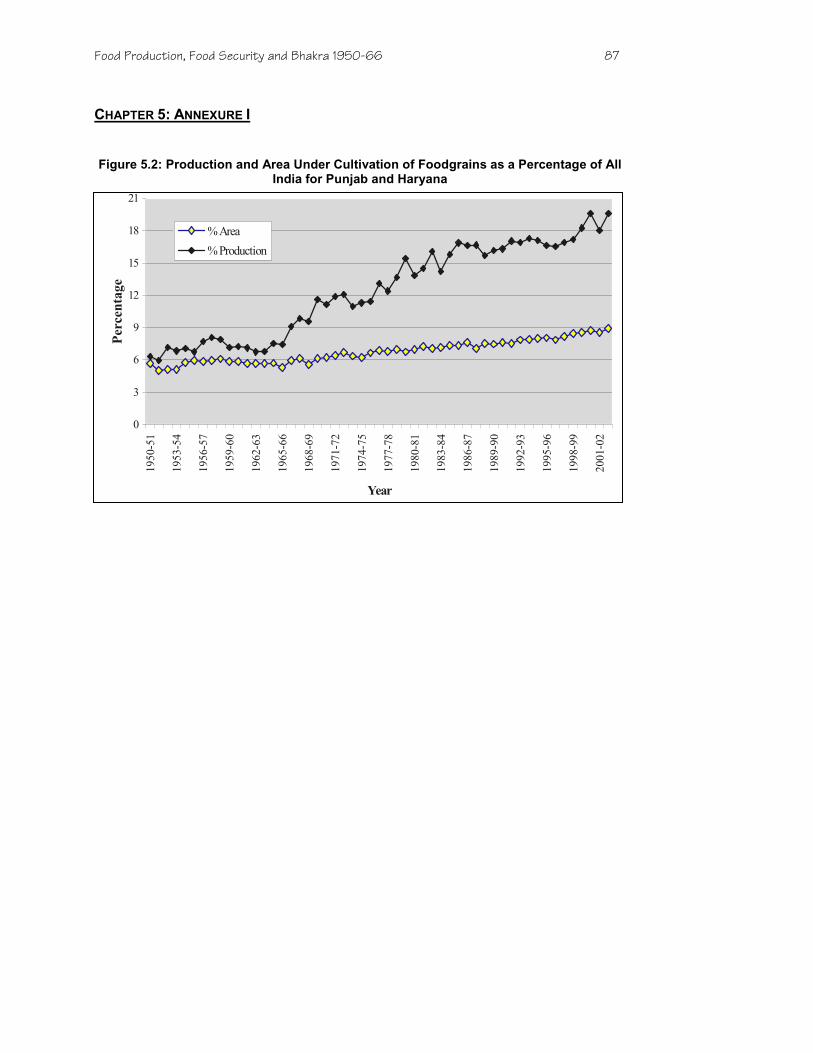
Food Production, Food Security and Bhakra 1950-66 87
CHAPTER 5: ANNEXURE I
Figure 5.2: Production and Area Under Cultivation of Foodgrains as a Percentage of All India for Punjab and Haryana
0
3
6
9
12
15
18
21
1950
-51
1953
-54
1956
-57
1959
-60
1962
-63
1965
-66
1968
-69
1971
-72
1974
-75
1977
-78
1980
-81
1983
-84
1986
-87
1989
-90
1992
-93
1995
-96
1998
-99
2001
-02
Year
Percen
tage
% Area
% Production

This page is intentionally blank.
6Food Production andBhakra Phase II – The
Green Revolution
“Until the early sixties no social scientist hadsuspected the possibility of a Green Revolution;…the Green Revolution in India not only tookplace rapidly but also came in quiteunexpectedly.”
Pratap Aggarwal
The Green Revolution and Rural Labour, 1973

Food Production and Bhakra – The Green Revolution 91
Food Production and Bhakra Phase II – The Green Revolution
1966 AND BEYOND
THIS PHASE BEGAN WITH A DECISION TO EXTEND THE IADP TO OTHER PARTS of the country. We have already seen that the IADP itself gave mixed results. There was little reason to believe that the extension would produce anything different. Indeed, there was apprehension that the extension to other districts would result in decline in the performance, since the best and most well endowed districts had already been selected in the First Phase – the IADP. Further, one of the key factors identified for the mixed performance of the IADP was the shortage of inputs. With the extension, this shortage was likely to worsen.
However, the next few years brought something else. There was a rapid increase in the foodgrains production from the low of 72.35 m tons in 1965-66 to a bumper, never before harvest of 108.42 m tons in 1970-71. Imports declined to 2 m tons in 1971.
So dramatic was this increase that a new term entered the lexicon – the Green Revolution.
It is crucial to understand this period and the factors that resulted in this “green revolution”, for the Bhakra project is overwhelmingly credited, or associated with the Green Revolution. Yet, we see that the Green Revolution came into being around 12 years after the irrigation from the Bhakra Nangal project had begun.
At the core of the Green Revolution was a new breed of seeds. Improved and better seeds had always been a part of the attempt to increase agricultural productivity and production in India. However, in 1965, new varieties of seeds imported from Mexico were launched in India. So dramatic was the performance of these seeds – popularly known as High Yielding Varieties (HYV) that they were widely called the “miracle seeds”.1
These seeds can more accurately be described as High Response Seeds. The traditional seeds had a problem – they responded poorly to chemical fertilisers. In response to high doses, they grew rapidly beyond the desired height and tended to lodge easily. Thus, they could accept only limited doses of fertilisers and this limited their yield. The new dwarf varieties got around this problem, and hence could take up much higher levels of fertilisers. This high responsiveness of the seeds to fertilisers was responsible for their “miraculously” high yields.
The yields were dramatic indeed. The following illustrates this.
“In 1966-67, the average yield of local wheat varieties was 2,108 pounds per acre, a little less than 10 quintals. During the same year, those farmers who adopted the Mexican varieties…achieved an average yield of 4,235 pounds per acres, about 20 quintals or exactly twice the first amount. …On the average, therefore, Ludhiana farmers who adopted the high-yielding varieties in 1966-67 doubled their output, and
1 The seeds were introduced in some areas a little earlier.
92 Unravelling Bhakra
in one swoop, increased their net income by over 70 percent.”2 [Since the input costs also went up]
So powerful was this phenomenon and the associated demonstration effect that in Ludhiana, between 1966-67 and 1967-68, the area growing the Mexican variety of wheat jumped from 18,000 acres to 245,000 acres and in the next year covered virtually all the wheat growing area – 420,000 acres out of 450,000 acres.3
The Fourth Plan Document notes this development:
“7.3. While both the Intensive Agricultural District and Intensive Agricultural Area Programmes were concerned with the promotion of intensive agriculture, they operated within the limitations set by existing crop varieties which had relatively low response to fertilisers. A major change occurred with the introduction of the high-yielding varieties. …. Hybrid seeds began to be widely adopted by 1963…… On the eve of the Fourth Plan4, the coverage estimated was 9.2 million hectares.
7.4. The high yielding varieties programme has so far been taken up for five crops, namely, wheat, paddy, bajra, maize and jowar. Among these crops, the most striking success has been achieved in wheat. In some of the dwarf varieties, a yield of 5 tonnes per hectare has been recorded in farmers' fields as against a normal yield of about 2 tonnes in irrigated areas………”5
The HYV seeds brought in a whole new set of practices along with them – rather they demanded it, for these were pre-requisites to their productivity and performance. First of all, these seeds required very high inputs of fertilisers – for this was the key to higher yield. Secondly, since these varieties were more susceptible to pests they needed much higher levels of pesticides and plant protection measures. The high inputs meant that the farmer needed more money to purchase the same – and hence there was need for much higher agricultural credit. The higher investment also meant increased risks for the farmers, and to help the farmer avoid this risk, the mechanism of minimum support price and full assured procurement had to be put in place.
Another important development took place with these seeds. Many of these seeds were developed with shorter growing period. This was a key to allow multiple cropping. Sometimes, it is believed that water was the only constraint to allow double cropping (i.e. two crops a year). However, in many cases, the bottleneck has been that the first crop is of long duration and this does not leave time for the next crop to grow. The new seeds with shorter growing periods allowed multiple cropping to take place. This, however, also brought in demands like need to rapidly harvest and clear fields for the second sowing. This was part of the reason for agriculture machinery.
Last, but not the least – was water. The new varieties were highly sensitive to water and needed water at critical times. The quantity (too less or too much both were bad) and the timing were crucial. We will analyse this factor in detail later on.
Thus, the HYV, to perform to its fullest, need a package of measures – chemical fertilisers, pesticides, machinery, assured and controlled water, credit, MSP, procurement etc.
With the coming of HYV, there was considerable optimism in the country and it was felt that at last the goal of food self-sufficiency was in sight. However, the HYV program was not
2 Frankel R. F 1971: ‘India’s Green Revolution: Economic Gains and Political Costs’, Princeton University Press,
Princeton, New Jersey : Page 24 3 Frankel 1971: Page 24 4 i.e. 1968 5 Chapter 7 Agriculture, Fourth Five Year Plan; Planning Commission of India 1969
URL: http://planningcommission.nic.in/plans/planrel/fiveyr/4th/4planch7.html Accessed: Dec. 17, 2003
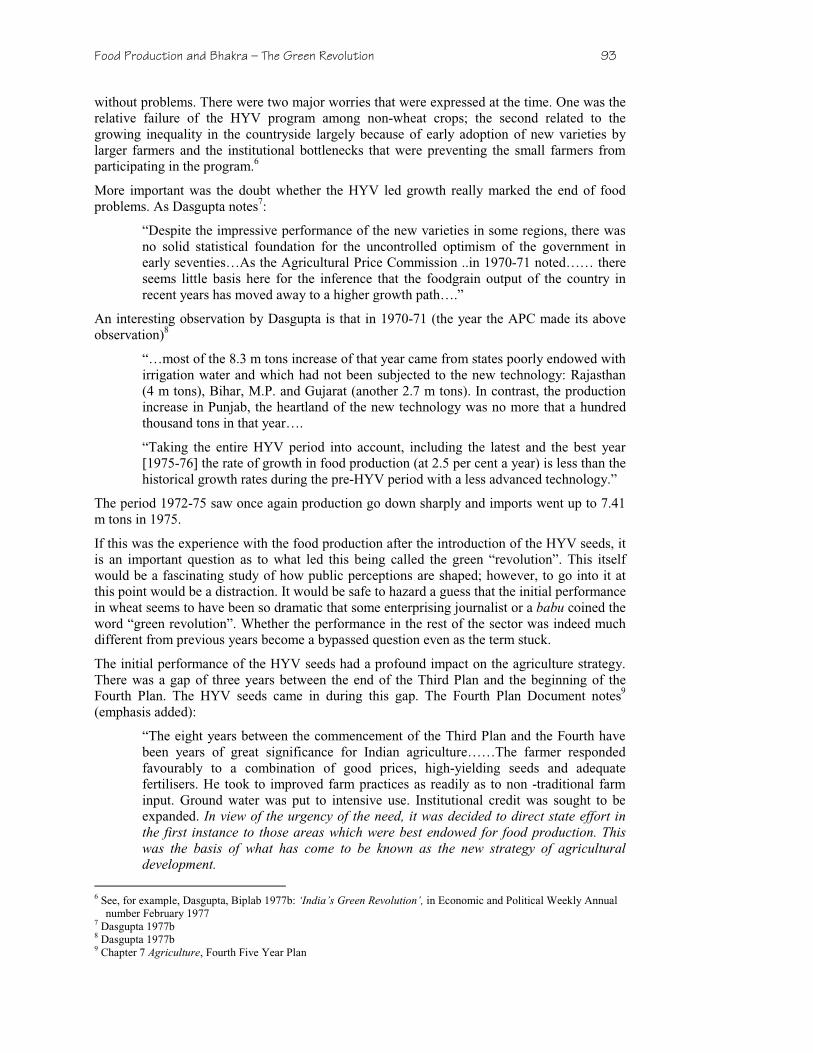
Food Production and Bhakra – The Green Revolution 93
without problems. There were two major worries that were expressed at the time. One was the relative failure of the HYV program among non-wheat crops; the second related to the growing inequality in the countryside largely because of early adoption of new varieties by larger farmers and the institutional bottlenecks that were preventing the small farmers from participating in the program.6
More important was the doubt whether the HYV led growth really marked the end of food problems. As Dasgupta notes7:
“Despite the impressive performance of the new varieties in some regions, there was no solid statistical foundation for the uncontrolled optimism of the government in early seventies…As the Agricultural Price Commission ..in 1970-71 noted…… there seems little basis here for the inference that the foodgrain output of the country in recent years has moved away to a higher growth path….”
An interesting observation by Dasgupta is that in 1970-71 (the year the APC made its above observation)8
“…most of the 8.3 m tons increase of that year came from states poorly endowed with irrigation water and which had not been subjected to the new technology: Rajasthan (4 m tons), Bihar, M.P. and Gujarat (another 2.7 m tons). In contrast, the production increase in Punjab, the heartland of the new technology was no more that a hundred thousand tons in that year….
“Taking the entire HYV period into account, including the latest and the best year [1975-76] the rate of growth in food production (at 2.5 per cent a year) is less than the historical growth rates during the pre-HYV period with a less advanced technology.”
The period 1972-75 saw once again production go down sharply and imports went up to 7.41 m tons in 1975.
If this was the experience with the food production after the introduction of the HYV seeds, it is an important question as to what led this being called the green “revolution”. This itself would be a fascinating study of how public perceptions are shaped; however, to go into it at this point would be a distraction. It would be safe to hazard a guess that the initial performance in wheat seems to have been so dramatic that some enterprising journalist or a babu coined the word “green revolution”. Whether the performance in the rest of the sector was indeed much different from previous years become a bypassed question even as the term stuck.
The initial performance of the HYV seeds had a profound impact on the agriculture strategy. There was a gap of three years between the end of the Third Plan and the beginning of the Fourth Plan. The HYV seeds came in during this gap. The Fourth Plan Document notes9 (emphasis added):
“The eight years between the commencement of the Third Plan and the Fourth have been years of great significance for Indian agriculture……The farmer responded favourably to a combination of good prices, high-yielding seeds and adequate fertilisers. He took to improved farm practices as readily as to non -traditional farm input. Ground water was put to intensive use. Institutional credit was sought to be expanded. In view of the urgency of the need, it was decided to direct state effort in the first instance to those areas which were best endowed for food production. This was the basis of what has come to be known as the new strategy of agricultural development.
6 See, for example, Dasgupta, Biplab 1977b: ‘India’s Green Revolution’, in Economic and Political Weekly Annual
number February 1977 7 Dasgupta 1977b 8 Dasgupta 1977b 9 Chapter 7 Agriculture, Fourth Five Year Plan
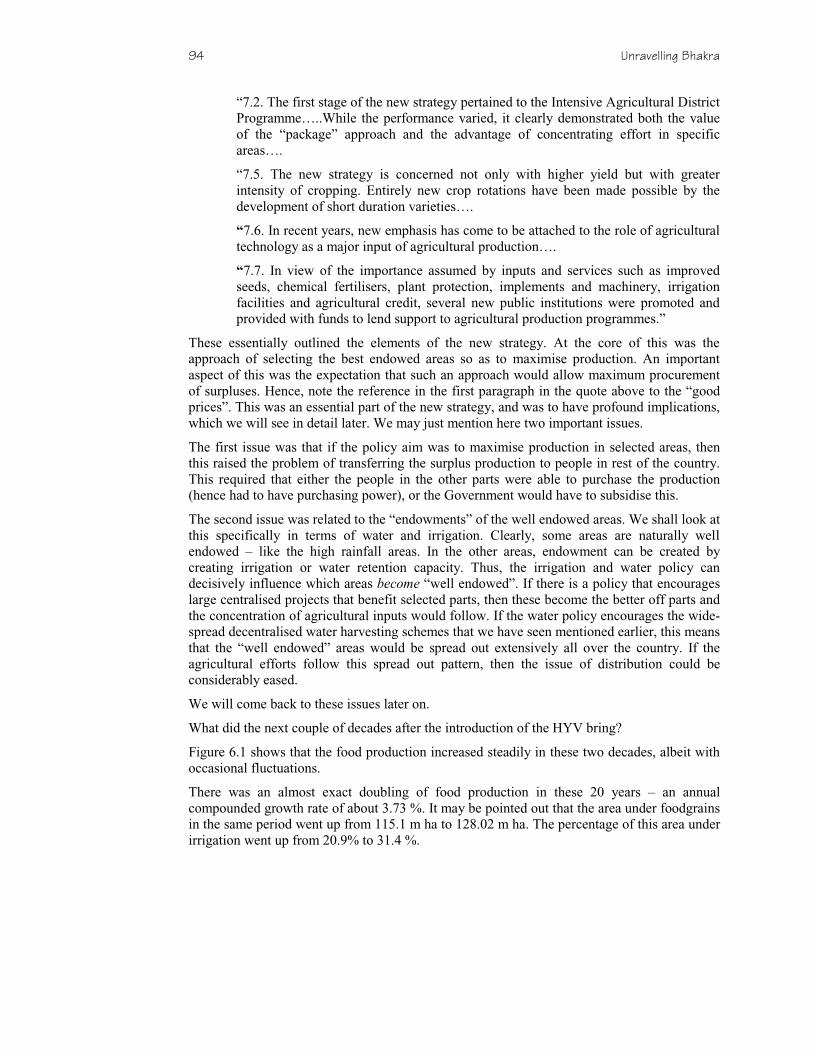
94 Unravelling Bhakra
“7.2. The first stage of the new strategy pertained to the Intensive Agricultural District Programme…..While the performance varied, it clearly demonstrated both the value of the “package” approach and the advantage of concentrating effort in specific areas….
“7.5. The new strategy is concerned not only with higher yield but with greater intensity of cropping. Entirely new crop rotations have been made possible by the development of short duration varieties….
“7.6. In recent years, new emphasis has come to be attached to the role of agricultural technology as a major input of agricultural production….
“7.7. In view of the importance assumed by inputs and services such as improved seeds, chemical fertilisers, plant protection, implements and machinery, irrigation facilities and agricultural credit, several new public institutions were promoted and provided with funds to lend support to agricultural production programmes.”
These essentially outlined the elements of the new strategy. At the core of this was the approach of selecting the best endowed areas so as to maximise production. An important aspect of this was the expectation that such an approach would allow maximum procurement of surpluses. Hence, note the reference in the first paragraph in the quote above to the “good prices”. This was an essential part of the new strategy, and was to have profound implications, which we will see in detail later. We may just mention here two important issues.
The first issue was that if the policy aim was to maximise production in selected areas, then this raised the problem of transferring the surplus production to people in rest of the country. This required that either the people in the other parts were able to purchase the production (hence had to have purchasing power), or the Government would have to subsidise this.
The second issue was related to the “endowments” of the well endowed areas. We shall look at this specifically in terms of water and irrigation. Clearly, some areas are naturally well endowed – like the high rainfall areas. In the other areas, endowment can be created by creating irrigation or water retention capacity. Thus, the irrigation and water policy can decisively influence which areas become “well endowed”. If there is a policy that encourages large centralised projects that benefit selected parts, then these become the better off parts and the concentration of agricultural inputs would follow. If the water policy encourages the wide-spread decentralised water harvesting schemes that we have seen mentioned earlier, this means that the “well endowed” areas would be spread out extensively all over the country. If the agricultural efforts follow this spread out pattern, then the issue of distribution could be considerably eased.
We will come back to these issues later on.
What did the next couple of decades after the introduction of the HYV bring?
Figure 6.1 shows that the food production increased steadily in these two decades, albeit with occasional fluctuations.
There was an almost exact doubling of food production in these 20 years – an annual compounded growth rate of about 3.73 %. It may be pointed out that the area under foodgrains in the same period went up from 115.1 m ha to 128.02 m ha. The percentage of this area under irrigation went up from 20.9% to 31.4 %.
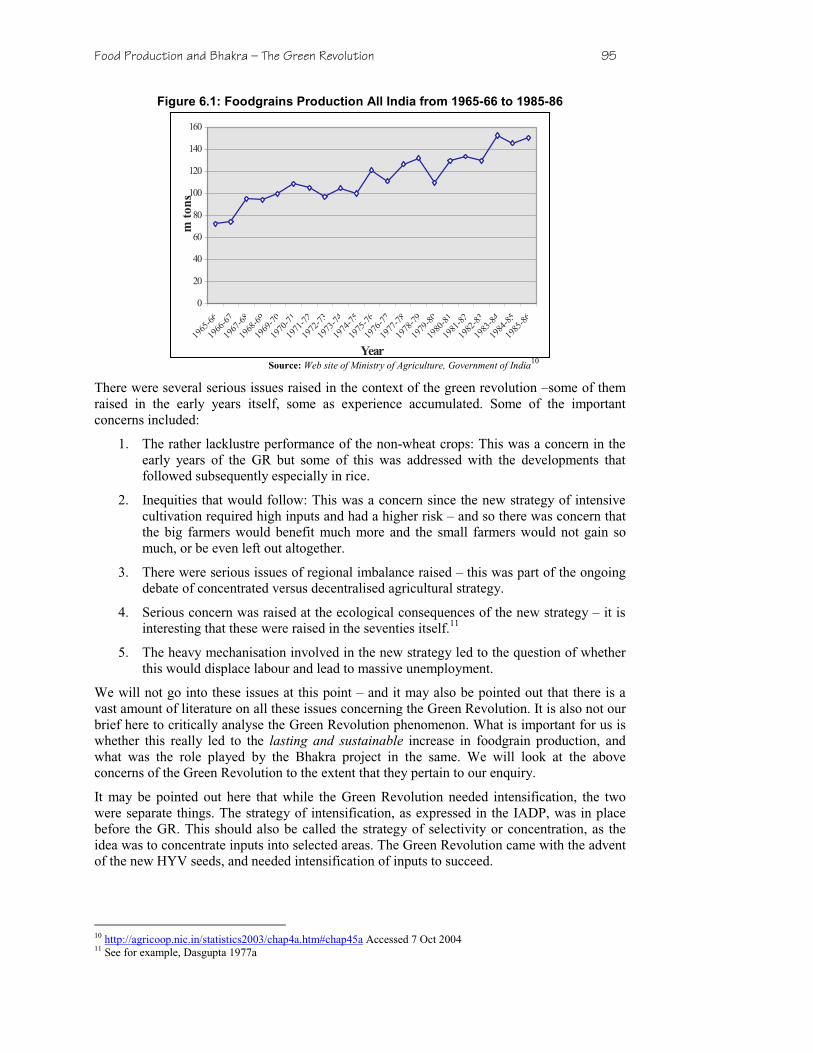
Food Production and Bhakra – The Green Revolution 95
Figure 6.1: Foodgrains Production All India from 1965-66 to 1985-86
Source: Web site of Ministry of Agriculture, Government of India10
There were several serious issues raised in the context of the green revolution –some of them raised in the early years itself, some as experience accumulated. Some of the important concerns included:
1. The rather lacklustre performance of the non-wheat crops: This was a concern in the early years of the GR but some of this was addressed with the developments that followed subsequently especially in rice.
2. Inequities that would follow: This was a concern since the new strategy of intensive cultivation required high inputs and had a higher risk – and so there was concern that the big farmers would benefit much more and the small farmers would not gain so much, or be even left out altogether.
3. There were serious issues of regional imbalance raised – this was part of the ongoing debate of concentrated versus decentralised agricultural strategy.
4. Serious concern was raised at the ecological consequences of the new strategy – it is interesting that these were raised in the seventies itself.11
5. The heavy mechanisation involved in the new strategy led to the question of whether this would displace labour and lead to massive unemployment.
We will not go into these issues at this point – and it may also be pointed out that there is a vast amount of literature on all these issues concerning the Green Revolution. It is also not our brief here to critically analyse the Green Revolution phenomenon. What is important for us is whether this really led to the lasting and sustainable increase in foodgrain production, and what was the role played by the Bhakra project in the same. We will look at the above concerns of the Green Revolution to the extent that they pertain to our enquiry.
It may be pointed out here that while the Green Revolution needed intensification, the two were separate things. The strategy of intensification, as expressed in the IADP, was in place before the GR. This should also be called the strategy of selectivity or concentration, as the idea was to concentrate inputs into selected areas. The Green Revolution came with the advent of the new HYV seeds, and needed intensification of inputs to succeed.
10 http://agricoop.nic.in/statistics2003/chap4a.htm#chap45a Accessed 7 Oct 2004 11 See for example, Dasgupta 1977a
0
20
40
60
80
100
120
140
160
1965
-66
1966
-67
1967
-68
1968
-69
1969
-70
1970
-71
1971
-72
1972
-73
1973
-74
1974
-75
1975
-76
1976
-77
1977
-78
1978
-79
1979
-80
1980
-81
1981
-82
1982
-83
1983
-84
1984
-85
1985
-86
Year
m t
on
s
96 Unravelling Bhakra
PUNJAB AND HARYANA
Let us shift our attention now to Punjab and Haryana. What was the performance in Punjab and Haryana in the same period? The Figures 6.2 and 6.3 illustrate the same.
Figure 6.2: Production of Foodgrains in Punjab 1965-66 to 1985-86
Source: Various Statistical Abstracts Punjab
In Punjab, the foodgrains production went up from 3.389 million tons (m tons) in 1965-66 to 17.221 m tons in 1985-86 – an increase of five times in 20 years, or an annual compounded growth of 8.47% for 20 years running! Thus, production grew at a much faster rate than All-India. Here certainly were signs of a “revolutionary” change.
Figure 6.3: Production of Foodgrains in Haryana 1965-66 to 1985-86
0
1
2
3
4
5
6
7
8
9
1665
-66
1967
-68
1969
-70
1971
-72
1973
-74
1975
-76
1977
-78
1979
-80
1981
-82
1983
-84
1985
-86
Year
m t
on
s
Source: Various Season and Crop Reports of Haryana
As can be seen, the trend in Haryana is somewhat uneven, yet, over the period there is a substantial increase. In Haryana, in the same period (1965-66 to 1985-86), foodgrains production increased from 1.985 m tons to 8.147 m tons, a four times increase. The area under foodgrains increased in this period from 3.52 m ha to 4.0434 m ha.
In the year 1985-86, Punjab and Haryana produced about 25 m tons of foodgrains – roughly about 16% of the all India production. At this time, the area under foodgrains for the two states was 9.4304 m ha – roughly about 7.4 % of the All India area under foodgrains.
0
2
4
6
8
10
12
14
16
18
20
1965
-66
1967
-68
1969
-70
1971
-72
1973
-74
1975
-76
1977
-78
1979
-80
1981
-82
1983
-84
1985
-86
Year
m t
on
s
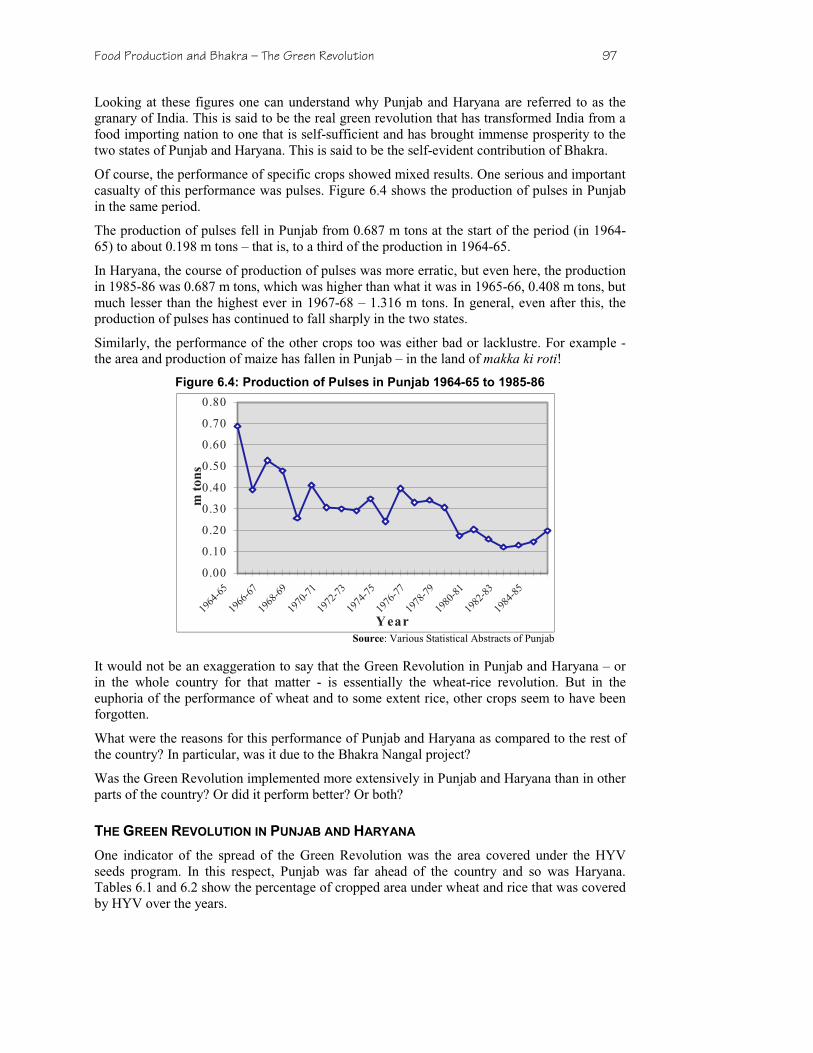
Food Production and Bhakra – The Green Revolution 97
Looking at these figures one can understand why Punjab and Haryana are referred to as the granary of India. This is said to be the real green revolution that has transformed India from a food importing nation to one that is self-sufficient and has brought immense prosperity to the two states of Punjab and Haryana. This is said to be the self-evident contribution of Bhakra.
Of course, the performance of specific crops showed mixed results. One serious and important casualty of this performance was pulses. Figure 6.4 shows the production of pulses in Punjab in the same period.
The production of pulses fell in Punjab from 0.687 m tons at the start of the period (in 1964-65) to about 0.198 m tons – that is, to a third of the production in 1964-65.
In Haryana, the course of production of pulses was more erratic, but even here, the production in 1985-86 was 0.687 m tons, which was higher than what it was in 1965-66, 0.408 m tons, but much lesser than the highest ever in 1967-68 – 1.316 m tons. In general, even after this, the production of pulses has continued to fall sharply in the two states.
Similarly, the performance of the other crops too was either bad or lacklustre. For example - the area and production of maize has fallen in Punjab – in the land of makka ki roti!
Figure 6.4: Production of Pulses in Punjab 1964-65 to 1985-86
0.00
0.10
0.20
0.30
0.40
0.50
0.60
0.70
0.80
1964
-65
1966
-67
1968
-69
1970
-71
1972
-73
1974
-75
1976
-77
1978
-79
1980
-81
1982
-83
1984
-85
Year
m t
on
s
Source: Various Statistical Abstracts of Punjab
It would not be an exaggeration to say that the Green Revolution in Punjab and Haryana – or in the whole country for that matter - is essentially the wheat-rice revolution. But in the euphoria of the performance of wheat and to some extent rice, other crops seem to have been forgotten.
What were the reasons for this performance of Punjab and Haryana as compared to the rest of the country? In particular, was it due to the Bhakra Nangal project?
Was the Green Revolution implemented more extensively in Punjab and Haryana than in other parts of the country? Or did it perform better? Or both?
THE GREEN REVOLUTION IN PUNJAB AND HARYANA
One indicator of the spread of the Green Revolution was the area covered under the HYV seeds program. In this respect, Punjab was far ahead of the country and so was Haryana. Tables 6.1 and 6.2 show the percentage of cropped area under wheat and rice that was covered by HYV over the years.

98 Unravelling Bhakra
Table 6.1 Percentage of Cropped Area Under HYV in Punjab (From 1966-67 to 1990-9112)
Rice Wheat
Year All India Punjab All India Punjab
1966-67 3% 4%
1967-68 5% 35%
1970-71 15% 33% 36% 69%
1980-81 45% 93% 72% 98%
1985-86 57% 83%
1990-91 64% 95% 87% 100% The comparison of Punjab with the All India figures brings out the difference starkly. By the second or third year after the introduction of the HYV seeds for wheat, over 35% of Punjab's wheat area was covered by it, as compared to 4% for the whole country. By 1970-71 the same figures were 69% and 36%. Similar was the story in rice, especially when we account for the late developments of the rice HYV seeds.13
Table 6.2: Percentage of Cropped Area Under HYV in Haryana (From 1966-67 to 1990-91
14)
Rice Wheat
Year All India Haryana All India Haryana
1966-67 3% 4%
1967-68 1.8% 11.9%
1970-71 15% 11.1% 36% 55.8%
1980-81 45% 85.6% 72% 92.0%
1985-86 57% 84.8% 83% 94.8%
1990-91 64% 72.5% 87% 98.9%
Similarly, if we look at the consumption of fertilisers, in 1965-66, Punjab was using about 6% of total fertilisers consumed in the country. This increased to 10.2% in 1975-76 and by 1980-81 it was 13.8%.
The two states seemed to have been the selected ones in the new agricultural strategy of selectivity. The Green Revolution was implemented more extensively in Punjab and Haryana as compared to the other parts of the country. It also seems to have delivered better results as compared to other parts of the country.
Part of the reasons lie in the social, human, infrastructural and geographical factors. Aggrawal15 discusses some of these important factors which he says have led directly or indirectly to the transformation in the State of Punjab. While his research is located in the
12 Source: For all India HYV areas - http://planningcommission.nic.in/data/stat/statistics3.pdf,
For All India Sown area, Ministry of Agriculture http://agricoop.nic.in/statistics2003/chap4a.htm#chap45a, and for Punjab data, various statistical abstracts of Punjab.
13 A word about why we have compared only rice and wheat and not other crops may be in order here. The entire Green Revolution has been essentially about wheat and rice. For all-India, wheat and rice acreage under HYV has been about 75% of the total area under HYV for all major crops put together. This figure has remained more or less constant right from 1966-67 to 1995-96.
14 Source: All India figures, same as for Punjab. Haryana figures from various statistical abstracts of Haryana. 15 Aggarwal, Pratap C. (1973b): ‘The Green Revolution and Rural Labour’, Shri Ram Centre for Industrial Relations
and Human Resources, New Delhi. Page 103 - 120

Food Production and Bhakra – The Green Revolution 99
Ludhiana district, many of the factors are identified by him as relevant for the entire state (and some even for Haryana). Some of these crucial antecedents, as he calls them include:
1. Better facilities of roads and transport
2. Higher availability of electricity – in fact, Maharashtra and West Bengal had higher per capita availability, but the electricity in Punjab was “more evenly distributed”.
3. Land Reforms
a. A (comparatively) more even distribution of land. In this, like other states too, there were problems of enforcing the land ceiling, but “considerable degree of levelling in size holdings has been achieved by taking advantage of the dislocations caused by the partition”.
b. Elimination to considerable degree the intermediaries between the state and the cultivators, giving of ownership rights to many tenants and making tenancy more secure.
c. Consolidation of holdings – Punjab and Haryana had quite early on achieved almost complete consolidation of holdings.
4. A very favourable land-person ration compared to other parts of the country.
Before we go on to other factors, it needs to be mentioned that land reforms is a very important key to better productivity. As Hanumantha Rao16 states:
“The Farm Management Studies conducted in various parts of the country have shown that output per acre is generally higher among the smaller farms and that it shows a significant decline with the increase in farm size. That this should be so is understandable in view of the prevailing labour intensive techniques and when there is an abundance of labour among smaller farms. Also, large farmers encounter supervisory and managerial bottlenecks as they have to operate with a large number of paid labourers. The logical implication of these findings is that output and productivity can be maximised if ceilings on land holdings are imposed at a sufficiently low level and surplus land distributed….”
What he does not mention here is the impact of such a measure on the distribution of income, which is a crucial aspect of equitable development.
Rao does recognise that smaller farms may “lag behind the larger ones in regard to the application of technologically new seeds and insecticides etc., due to their low investible surplus” but adds that “Since smallness of size as such does not offer any technical hindrance to the application of modern inputs, the provision of credit to the smaller farmers ..should meet the ends of growth.”
Coming back to the factors affecting the growth in Punjab analysed by Aggarwal:
5. Indigenisation of technology – Aggarwal points out that the existence of a thriving small scale industry in Ludhiana led to a much better assimilation and indigenisation of technology and led to a much faster spread of agricultural machinery.
6. Social and human factors, including the highly entrepreneurial nature of the farmers.
7. The implementation of the IADP before the GR phase in Ludhiana district.
The last, but in no manner the least, was of course, irrigation. We have taken note earlier that water is a crucial input for all the three strategies for increasing food production – namely,
16 Rao Hanumantha C.H. 1965: ‘Agricultural Growth and Stagnation in India’; in Economic and Political Weekly
February 27, 1965

100 Unravelling Bhakra
bringing in new areas under cultivation, multiple cropping, and increasing yields. For the new HYV seeds, assured supply of water was even more crucial.
Bhakra is often presented as the main factor behind the dramatic growth of agriculture in Punjab and Haryana by facilitatating – indeed, making possible, all the above three.
Readers may do well to remember in this context that neither irrigation nor the Green Revolution came to Punjab (and Haryana) with the Bhakra project. The GR came 12 years after the irrigation from Bhakra project started. If irrigation is said to have enabled the Green Revolution, then we must recollect that irrigation in large areas had already come to Punjab and Haryana many decades before the Bhakra.
We now look at the role of irrigation in general and Bhakra in particular in the Green Revolution and food production in Punjab and Haryana in the next chapter.