biffa plc - cdn.ca.emap.com
TRANSCRIPT

1
Biffa plc
FY22 HALF YEAR RESULTS
STRONG FIRST HALF PERFORMANCE
REVENUE AND ADJUSTED OPERATING PROFIT RESTORED TO FY20 LEVELS,
FULL YEAR EXPECTATIONS REAFFIRMED AND DIVIDEND REINSTATED
18 November 2021 Biffa plc (‘Biffa’, ‘the Group’ or ‘the Company’) (LSE: BIFF), the UK's leading sustainable waste management company, announces its half year results for the 26 weeks ended 24 September 2021.
Michael Topham, Chief Executive of Biffa, said:
“During the first half of the year we have successfully restored Biffa’s adjusted operating profit to FY20 levels, managed the impact of the supply chain challenges that are affecting the entire economy, and continued to make good progress in delivering our strategic priorities.
“The rebound in business performance, with volumes and pricing across most areas of the business at or above FY20 levels, is testament to the resilient characteristics of our business model and the commitment of our team. Whilst like all businesses we are currently experiencing some cost inflation, most of our business has a level of pricing flexibility meaning we are well placed to mitigate these pressures. “Our significant investment programme across circular economy infrastructure projects has continued at pace, including commissioning our new plastics recycling facilities, integrating recent collections acquisitions, opening new surplus redistribution outlets and continuing construction of our energy recovery facilities. Together these investments will provide the UK with essential green economy infrastructure and services, whilst giving Biffa a solid platform for sustainable growth.
“We remain pleased with Biffa’s performance and prospects and our expectations for the full year remain unchanged. As a result, we are pleased to have reintroduced the payment of a progressive dividend.”
Financial Summary
H1 FY22 £m
H1 FY211
£m
Change FY22 v FY21
H1 FY201
£m
Change FY22 v FY20
Statutory Revenue 671.2 482.5 39.1% 588.9 14.0%
Net Revenue² 632.8 458.8 37.9% 555.1 14.0%
Adjusted EBITDA 91.3 58.3 56.6% 86.8 5.2%
Statutory Operating Profit (16.7) (45.0) n/a 33.9 n/a
Adjusted Operating Profit3 45.4 9.7 368.0% 45.7 (0.7%)
Dividend (pence) 2.20 - n/a 2.47 n/a
Reported leverage ratio4 3.4 2.1 n/a 2.8 n/a

2
• Strong financial results: Adjusted Operating Profit has recovered to FY20 levels with Group revenues in the first half 14.0% higher than during the equivalent period two years ago (H1 FY20) (2.5% excluding acquisitions). When comparing Adjusted Operating Profit in H1 FY22 with H1 FY20, a strong performance in Collections and Recycling has been offset by the expected declining contribution from Inerts and Landfill Gas. Profitability is set to further improve during H2, in line with market guidance.
• Successfully managing supply chain challenges and inflationary pressures: Decisive steps taken to mitigate the impact of supply chain disruptions and HGV driver shortages. The business has significant pricing flexibility to enable mitigation of cost inflation.
• Continued progress on strategic priorities: £340.8m has been invested since the September 2019 Capital Markets Day across circular economy infrastructure projects within our four strategic areas: Reduce, Recycle, Recover and Collect. £151.6m of this was incurred in the period, including £123.7m on acquiring the Viridor Collections business and certain recycling assets and integration is on track.
• Adjusting items: Totalled £62.1m in the period (H1 FY20: £11.8m). The main items contributing to this were the impairment of Company Shop Group’s (“CSG’s”) goodwill (£25.0m) as a result of short term underperformance, acquisition related costs (£5.9m); the decrease in the real discount rate on landfill provisions (£16.8m); and the charge for amortisation of acquired intangible assets (£13.1m). Statutory Operating loss for the period is £16.7m (FY21 H1: 45.0m).
• Cash performance and Net Debt ahead of expectations: Cash management has been better than expected in the period, resulting in leverage being lower than forecast at the time of the Viridor announcement. The Group’s sources of funds were also broadened with the issuance of £150m of private placement notes and we have now converted our revolving credit facility (“RCF“) to a sustainability linked instrument.
• Sustainability Strategy delivery: Key progress areas include improving our methane capture rate in our Landfill Gas business to an industry-leading 85% ahead of the recent COP26 commitments around methane reduction; opening a rail hub for inert waste in East London to further reduce the adverse impacts of road based transportation; retrofitting older trucks with software which will reduce Biffa’s CO2 emissions by up to 1,500 tonnes per annum; and increasing Board diversity with the appointment for our third female Board member, Linda Morant.
• Full year expectations reaffirmed and dividend reinstated: The Board is pleased with Biffa’s strong performance and the outlook for Adjusted Operating Profit for the full year remains positive and in line with the Board’s expectations. As a result, we are pleased to be reintroducing the interim dividend at 2.20p, (FY21:nil, FY20:2.47p) and are committed to paying a progressive dividend moving forward.
PRESENTATION OF RESULTS
We will be presenting these results to investors, analysts and banks at 08:00am today. The webcast and associated materials will be
available on Biffa’s website – www.biffa.co.uk/investors.
ENQUIRIES:
Investors & Analysts
Michael Topham, Chief Executive Officer or Richard Pike, Chief Financial Officer
Media
Houston
0204 529 0549
CAUTIONARY STATEMENT REGARDING FORWARD-LOOKING STATEMENTS This announcement contains certain forward-looking statements that are subject to the usual risk factors and uncertainties associated with the Company’s business. Whilst the Company believes the expectations reflected herein to be reasonable considering the information
available to them at this time, the actual outcome may be materially different owing to factors beyond the Company ’s control or within the Company’s control where, for example, the Company decides on a change of plan or strategy. Accordingly, no reliance may be placed on the figures contained in such forward-looking statements.
The forward-looking statements contained in this document speak only as of the date of this announcement, and Biffa does not undertake to update any forward-looking statement to reflect events or circumstances after the date hereof or to reflect the occurrence of
unanticipated events.

3
NOTES: Activities excluding Adjusting items and a number of other terms and performance measures used in this document are not defined within accounting standards and may be applied differently by other organisations. See notes to the consolidated financial statements for basis
of preparation and definitions of all non-statutory measures:
1 The 26-week period ended 25 September 2020 and 27 September 2019 has been restated to reflect the Group’s reorganisation into three divisions: Specialist Services (incorporating Hazardous Waste, Integrated Resource Management ( ‘‘IRM’’), Biffpack and CSG), Collections (incorporating I&C and Municipal), and R&E
2 Statutory revenue net of landfill tax
3 Profit before depreciation and amortisation, Adjusting items, impact of real discount rate changes to landfill provisions, finance costs and taxation 4 Reported leverage ratio compares the Reported Net Debt against Adjusted EBITDA

4
CHIEF EXECUTIVE’S REVIEW
A strong first half with good momentum for H2
Trading Performance and Outlook
We are very pleased with the performance of the Group in the period. Trading performance in the first half recovered well following the easing of lockdown restrictions. In Q1, I&C volumes recovered to 97% of the same period two years ago (FY20), and following further recovery in Q2, we exited the first half at 103% of levels experienced two years ago. We have also benefitted from higher commodity and energy prices, albeit the impact has been limited due to our well-established strategy to de-risk and hedge against these exposures. Offsetting these upsides, were the expected lower contributions from Inerts and Landfill Gas as well as our recent investments in Seaham and CSG being behind our expectations. We are encouraged by this rebound in our performance and are pleased with the progress we have made in the first half. We have secured flagship customers wins in the period, both with new local authority contracts and corporate clients, and are pleased with the early trading performance of the assets acquired from Viridor on 31 August. Like most businesses, we have been affected by supply chain challenges impacting the UK economy, including shortages of HGV drivers, vehicles, fuel and waste containers. We responded decisively to the challenges in the driver market by offering increased pay, amongst other measures. We have seen signs of stabilisation in recent weeks, but we will continue to monitor the situation closely. Most areas of our business have a level of pricing flexibility, meaning we are well placed to mitigate the cost inflation we are experiencing through price increases that will be implemented in H2. The Board is pleased with Biffa’s strong performance and the outlook for the full year remains positive and in line with the Board’s expectations.
Collections
The Collections division comprises the Industrial & Commercial (I&C) and Municipal businesses. It provides sustainable waste and recycling collections and related services to industrial, commercial, public sector and local authority customers. The division’s overall Net Revenues in H1 were 4.6% higher than the comparable period two years ago (H1 FY20) at £412.7m. Operating margins have improved over the same period from 7.8% to 8.5%, principally due to improved underlying performance in I&C.
H1 FY22 £m
H1 FY211
£m
Change H1 FY20 1
£m
Change
I&C 323.4 222.5 45.3% 307.5 5.2%
Municipal 89.3 91.6 (2.5%) 86.8 2.9%
Revenue 412.7 314.1 31.4% 394.3 4.7%
Adjusted EBITDA 61.1 38.4 59.1% 56.5 8.1%
Adjusted Operating Profit 34.9 8.2 325.6% 30.8 13.3%
Adjusted Operating Profit Margin 8.5% 2.6% n/a 7.8% n/a
1The 26-week period ended 25 September 2020 and 27 September 2019 has been restated to reflect the Group’s reorganisation into
three divisions: Specialist Services (incorporating Hazardous Waste, IRM, Biffpack and CSG), Collections (incorporating I&C and
Municipal), and R&E.
I&C
• During Q1, I&C volumes recovered back to 97% of the same period two years ago (FY20). Volumes continued to recover in Q2 and we exited the first half at 103% of the levels experienced two years ago. This underpinned a 5.2% increase in revenues (at £323.4m).
• I&C has been affected by the supply chain challenges impacting the UK economy, including HGV driver, vehicle, fuel and container shortages. Service standards have been affected, to some

5
extent, but overwhelmingly customers have remained understanding and there has been no discernible impact on customer churn (SME churn c7% annualised, versus c9% in FY20). We have seen signs of stabilisation in recent weeks, but close and ongoing management of these issues continues.
• We have had another strong period of growth, with new corporate clients including Centrica, David Lloyd Leisure, Caffè Nero, the National Exhibition Centre (NEC), B&M Retail, Nationwide Building Society and the second phase of Barratt Developments PLC’s estate.
• Key customer renewals in the period included Mitchells & Butlers, Travelodge, BP Retail and AAH/Lloyd’s pharmacy.
• As previously reported, we have been trialling a carbon mapping tool with customers enabling them to map the carbon footprint of their waste. Following its success, the tool has been rolled out across our customer base to support them in delivering their own sustainability agendas.
• The acquisition of Viridor’s Collections business is a key step in our consolidation of the highly fragmented I&C collections market, adding c.£85m revenue (FY20), c.21,000 customers, 15 depots and c.270 vehicles to Biffa. Synergies of at least £10m are expected to be delivered within 12-18 months. Following completion of the acquisition on 31 August, the integration of the business is on track and this, together with the integration of Simply Waste, remains our main priority.
Municipal
• The Municipal business has managed the same supply chain challenges as the I&C business. In a small number of cases, some services were temporarily suspended with the agreement of our municipal customers, but we have worked closely with them to mitigate the impact wherever possible. We have seen signs of stabilisation in recent weeks, but close and ongoing management of these issues continues.
•
During the period we secured a new contract with Stratford-upon-Avon and Warwick Councils, which will commence in August 2022. We have also signed a three-year contract extension with South Staffordshire.
•
The roll-out of the UK’s largest fully electric refuse collection fleet in Manchester is well underway. Councils are looking to decarbonise their fleets by switching to electric vehicles and alternative fuels, which also forms a key area of Biffa’s Sustainability Strategy.
•
The Viridor acquisition added two household waste recycling centre contracts ('HWRC') to the Municipal business. These contracts generated c.£11m of revenue in FY20 and have performed as expected since the acquisition.
•
Looking ahead, the division is well-placed to support our local government customers in meeting their new obligations including Extended Producer Responsibility for Packaging and segregated food waste collection.
Specialist Services
As previously announced, the Specialist Services business was separated from the Collections division, from the onset of FY22, to create a new division of the Group for external reporting purposes. The division provides bespoke solutions to customers who have more complex waste requirements such as manufacturing and distribution businesses. The acquisition of CSG in February 2021, added redistribution capabilities to Biffa’s range of sustainable waste management solutions and enables us to support customers in moving surplus products further up the waste hierarchy.
The division’s overall Net Revenues in the period were £81.5m. The 86.9% increase versus FY20 is mainly
attributable to the acquisitions of CSG and Viridor. Viridor added c.£7m of annualised revenue to this division, added three depots and one wastewater treatment plant, which expands our liquid waste collection and treatment coverage and capabilities. The reduction in operating margins in the business is wholly attributable to CSG, where we have experienced lower footfall and associated customer spend during the period than expected.

6
H1 FY22 £m
H1 FY211
£m
Change H1 FY20 £m
Change
Industrial Services1 47.7 40.7 17.2% 43.6 9.4%
Company Shop Group2 33.8 - n/a - n/a
Revenue 81.5 40.7 100.2% 43.6 86.9%
Adjusted EBITDA 7.3 4.4 65.9% 4.7 55.3%
Adjusted Operating Profit 4.4 2.9 51.7% 3.9 12.8%
Adjusted Operating Profit Margin 5.4% 7.1% n/a 8.9% n/a
1 The 26-week period ended 25 September 2020 and 27 September 2019 has been restated to reflect the Group’s reorganisation into three divisions: Specialist Services (incorporating Hazardous Waste, IRM, Biffpack and CSG), Collections (incorporating I&C and Municipal), and R&E.
2 CSG was acquired by Biffa on 25 February 2021, therefore there is no revenue disclosed for H1 FY21 or H1 FY20.
Industrial Services
• Industrial Services refers to the legacy Biffa operations of the Specialist Services division, with the Company Shop Group element summarised separately below. It includes Hazardous Waste collection and treatment, IRM and Biffpack, our producer responsibility packaging compliance scheme.
• The business has continued to perform strongly, with an increase in revenue of 9.4% on FY20 revenues as a result of new business wins and existing contract extensions.
• A notable contract win is Pilgrim’s Pride where we provide a total waste management service, including dry waste, hazardous waste, tanker and commodity services at Pilgrim Pride’s 14 sites across the UK.
Company Shop Group
• CSG performance in the period has been impacted by lower footfall and basket spend especially at stores opened immediately prior to and during the pandemic (stores opened since 2019) where the performance has been below expectations. In response to this, management introduced various measures to seek to generate revenue growth including changing buying patterns and discounting initiatives which have reduced the gross margin compared to historic levels across all stores, both established and those opened since 2019. We have seen some improvement in various areas of the portfolio over the last quarter and expect this trajectory to continue as customers return to more normalised shopping trends.
• We have continued with our store roll out plan, opening a new Company Shop store in Southampton and a new Community Shop in Beechwood. We will shortly be opening a Company Shop store in South Yardley, Birmingham.
• We are also working with Biffa’s existing food manufacturing and e-commerce customers to capitalise on bringing these businesses together by adding redistribution of surplus produce to Biffa’s leading offering in waste management and recycling.
• Since the acquisition, our confidence in the potential of the business has been confirmed. However due to the current trading underperformance, we have booked an impairment charge of £25m under IAS 36 based on our assessment of value in use. This excludes any additional value which may be generated by future store roll-outs.
Resources & Energy (“R&E”)
The division comprises the Recycling, Organics, Inerts and Landfill Gas businesses, and focuses on the sustainable treatment, recycling, energy recovery and ultimate disposal of waste. The division’s overall Net Revenues for the period to September 2021 of £138.6m were 18.4% higher than the comparable period two years ago (H1 FY20), reflecting the ongoing expansion of our Recycling business as well as a strong recovery in recent months. Operating margins over this period dropped from 12.8% to 10.1% as a result of the expected reduced contribution from the higher margin Inerts and Landfill Gas sub-divisions.

7
H1 FY22 £m
H1 FY21 £m
Change H1 FY20 £m
Change
Recycling 59.5 36.8 61.7% 40.2 48.0%
Organics 31.4 27.3 15.0% 29.8 5.4%
Inerts 66.6 45.0 48.0% 60.4 10.3%
Landfill Gas 19.5 18.6 4.8% 20.5 (4.9)%
Revenue 177.0 127.7 38.6% 150.9 17.3%
Recycling 59.5 36.8 61.7% 40.2 48.0%
Organics 31.4 27.3 15.0% 29.8 5.4%
Inerts 28.2 21.3 32.4% 26.6 6.0%
Landfill Gas 19.5 18.6 4.8% 20.5 (4.9)%
Net Revenue 138.6 104.0 33.3% 117.1 18.4%
Adjusted EBITDA 32.5 19.3 68.4% 32.1 1.2%
Adjusted Operating Profit 17.9 4.4 306.8% 19.3 (7.3)%
Adjusted Operating Profit Margin 10.1% 3.5% n/a 12.8% n/a
Recycling
• Our new facilities at Seaham and Washington have completed their commissioning and at Seaham we are now moving through customer acceptance phases. This process is taking slightly longer than expected, and therefore we have sold less rPET pellet than anticipated, but we anticipate full acceptances in the near term ahead of the implementation of the new plastics tax in April 2022.
• We had a good performance at our Material Recycling Facilities (‘‘MRFs’’) due to strong operational performance coupled with improved commodity prices. Three MRFs have been added to the Recycling business through the acquisition of Viridor and these have traded in line with expectations.
• The division added a plastics recycling facility in Scotland as a result of the Green Circle acquisition completed in June 2021.
• The acquisition of certain recycling assets from Viridor now positions us as the largest operator of MRFs and plastic recycling facilities (‘‘PRFs’’) across the UK and together with Green Circle, significantly strengthens the raw material supply chain into our Polymers business.
• In July 2021, the Environment Agency was successful in its case against Biffa regarding the export of wastepaper to India and Indonesia in 2018. There are no outstanding costs associated with the case and we do not expect ongoing exposure as prior to the conviction we had ceased exporting mixed wastepaper outside the OECD.
Organics
• The Organics business includes Biffa’s existing anaerobic digestion, composting and residual waste treatment assets together with the West Sussex (‘WSCC’) contract (a long-term local authority integrated resource treatment contract), three composting sites and one anaerobic digestion plant that were acquired from Viridor.
• The business’ Net Revenues are up 5.4% on H1 FY20 levels, mainly as a result of one month of acquired revenues from Viridor.
Inerts
• The Inerts business saw Net Revenues up by 6% on the comparable period two years ago (H1 FY20) due to ongoing improvements in pricing. Volumes were only c2% lower than two years ago, despite the closure of the large Westmill landfill site north of London, which was substantially mitigated through the opening of our East London rail hub, as well as growth in tonnages from other rail hubs and in commercial waste volumes, due to reduced availability of RDF export outlets.

8
• In the first half of FY22, our inputs to landfill by rail were up three percentage points to 23% overall due to the recovery of the construction sector and the opening of our third rail hub in Barking in May 2021. Since 2018, over 1.4m tonnes of inert waste has been transported by rail instead of road, saving 16,500 tonnes of CO2 emissions in line with our sustainability strategy targets.
Landfill Gas
• We have improved our methane capture rate to 85%, which is industry-leading and supports the objectives of COP26 in reducing harmful methane emissions in the atmosphere. The 4.5% year on year volume decline is in line with expectations.
• Export power prices are 100% hedged through FY22 H2 fixed @ £61.00 per MwH.
Energy Recovery
• Solid progress is being made on the construction of our two energy recovery facilities, both of which are being developed in partnership with Covanta Green. The Newhurst facility remains on track to be delivered in 2023, with the most recent milestones including the installation of the waste grate system and boiler. The Protos facility, which broke ground earlier this year, remains on schedule for 2024 and recently began the installation of its steel framework.
Strategy Update
Biffa’s business model is aligned with the waste hierarchy and underpinned by the direction of evolving UK Government policy through the Resources and Waste Strategy. The Government’s recently approved Environment Bill further underpins Biffa’s future aspirations with particular focus on areas such as extending producer responsibility to make producers pay for the cost of collection and recycling of packaging, greater consistency of recycling collections in England and charges for single use plastics and restricting exports of waste outside the OECD countries.
Our capital allocation is currently focused on four key areas which are aligned with the circular economy: Reduce, Recycle, Recover and Collect.
Reduce
• Investment incurred since Capital Markets Day (CMD) in September 2019: £90.9m
• The acquisition of CSG in February 2021 establishes Biffa as the leading enabler of the circular economy for the food manufacturing, retail and fast-moving consumer goods (FMCG) and e-commerce sectors in the UK.
• There is considerable opportunity for CSG to innovate and grow. During the period we have experienced lower profitability, with footfall not yet recovered to FY20 levels. Nevertheless, we remain extremely confident in the potential of the business, and we were pleased to open a new Company Shop store in Southampton and a new Community Shop in Beechwood. We will also shortly be opening a new Company Shop store in South Yardley, Birmingham.
Recycle
• Investment incurred since CMD in September 2019: £46.0m
• Biffa has a market leading position in closed loop, food-grade plastic recycling which is in high demand. We have increased our capacity from 63,000 tonnes to c141,000 tonnes since 2019, through investments at Seaham and Washington.
• We are progressing the development of our third HDPE line for food-grade recycled material. This new line will add an additional 14,000 tonnes of capacity and is expected to come online in Q1 FY24. This is slightly later than originally planned as we took the opportunity to locate it at Redcar, adjacent to our existing HDPE operations.
• We benefit from control of feedstocks with c.90% expected to be sourced from our own facilities by November 2022, following the acquisition of Viridor’s Recycling assets and Green Circle.

9
Recover
• Investment incurred since CMD in September 2019: £33.6m
• Energy recovery remains the best option for waste that cannot be avoided, reduced or recycled and is a better environmental alternative to landfill.
• We have two energy recovery facilities at Newhurst and Protos currently in the build phase, which will deliver long-term, reliable, cost-effective and low-carbon disposal for 750,000 tonnes of our customers’ waste that cannot be recycled. Both build projects are on schedule and are expected to be completed during 2023 for Newhurst and 2024 for Protos.
• We are pleased with the progress made to date with these projects and see potential upsides, including a more favourable energy market, strong demand for capacity from third party waste providers and the potential to increase the consented operational capacity of the facilities, with no associated capex required.
Collect
• Investment incurred since CMD in September 2019: £170.3m
• Biffa continues to consolidate the fragmented UK I&C market, with 25 acquisitions having been completed since our IPO in 2016, investing in total £260m, which includes cash consideration of £122.1m in the period for the entire Viridor acquisition, which completed on 31 August 2021.
• We are continuing to invest in our digital capabilities including our e-commerce platforms, providing additional customer features on our self-serve web portals, and introducing further digital products to market.
• The development of non-scheduled services, such as skip hire and van collections, continues to be a focus for growth. Our digital platform enables a seamless approach to booking skips, and we continue to trial this service with our customers.
• Our £0.6m seed funding in LoveJunk, (a waste collection and reuse digital marketplace), will be used to support its development and rollout across the UK.
• We have a secure foundation to grow, taking advantage of the opportunities in alternative fuels and the deployment of electric vehicles, that the Resources and Waste Strategy in England and
Environment Bill will present.
Sustainability Strategy Update
Biffa’s ambitious Sustainability Strategy ‘Resourceful, Responsible’, which closely aligns to the United Nation’s Sustainable Development Goals, is built around three core pillars: building a circular economy, tackling climate change and caring for our people, supporting our communities.
Delivery progressed at pace during H1 with highlights including:
• Improving our methane capture rate in our Landfill Gas business to an industry-leading 85% in line with the recent COP26 commitment to methane reduction by 30% by 2030
• Opening a new rail hub in East London that will enable 250,000 tonnes of inert waste to be transported out of the capital by rail, helping to reduce traffic congestion and carbon emissions and improve air quality
• Commissioning the UK’s largest retrofit of ‘Fuelsense 2.0’ to older trucks which will reduce Biffa’s CO2 emissions by up to 1,500 tonnes per annum, and
• Increasing the diversity within our Board composition, with the appointment for our third female Board member, Linda Morant. As a result, the ratio of female to male board members has increased to 43%.
We have a highly deliverable plan to reduce our Scope 1 & 2 carbon emissions by 50% from 2020 to 2030 (having already reduced them by 70% since 2002), and a credible route to Net Zero by no later than 2050.

10
FINANCIAL REVIEW
The Group has recovered strongly from the impact of the pandemic, with Adjusted Operating Profit having
recovered to FY20 levels. Group revenues in the first half were 14.0% higher than the equivalent period two
years ago (H1 FY20) (2.5% excluding acquisitions). When comparing Adjusted Operating Profit in H1 FY22
with H1 FY20, a strong performance in Collections and Recycling has been offset by the expected declining
contribution from Inerts and Landfill. Profitability is set to further improve during H2, in line with previous
guidance.
We have generated a statutory loss after tax of £26.8m as a result a range of Adjusting items in the period
including an impairment charge in relation to CSG as a result of short term underperformance, acquisition
costs in relation to Viridor, increased intangible amortisation costs and a material adjustment to landfill
provisions resulting from movements in the discount rate.
Biffa has remained well funded, with strong cash management in the period and leverage remains well inside
the level forecast at the time of the Viridor announcement. Our source of funds was broadened with the
issuance of £150m of private placement notes. We have also converted our RCF to a sustainability linked
instrument and amended our forward covenant measures such that they will be tested on a post IFRS16 basis.
We therefore remain well positioned to deliver our growth strategy across our four investment areas: Reduce,
Recycle, Recover and Collect.
Our financial performance is detailed below:
Group £m (unless stated) H1 FY22
H1 FY21
H1 FY20
Revenue 671.2 482.5 588.9
Net Revenue 632.8 458.8 555.1
Operating Profit (16.7) (45.0)
33.9
Finance income 1.6 2.0 1.3
Finance charges (10.2) (9.1) (10.7)
Share of joint venture profit before tax (0.3) (0.4)
-
Profit before tax (25.6) (52.5) 25.6
Tax charge (1.2) 9.3 (5.0)
Profit after tax (26.8) (43.2) 20.6
Operating Profit (16.7) (45.0)
33.9
Depreciation and amortisation 45.9 48.6
41.1
EBITDA 29.2 3.6
75.0
Adjusting items 62.1 54.7
11.8
Adjusted EBITDA 91.3 58.3
86.8
Operating Profit (16.7) (45.0) 33.9
Onerous contracts (0.1) 12.3 (2.0)

11
Strategy related costs 1.4 0.9 2.5
Acquisition related costs 5.9 0.2 0.4
Asset Impairment 25.0
14.0
-
Amortisation of acquisition intangibles
13.1 13.9 8.5
Impact of changes in real discount rate on landfill provisions
16.8 13.4 2.4
Adjusted Operating Profit 45.4 9.7 45.7
Results
• Biffa has shown a strong recovery in the first half with Group revenues up 14.0% to £671.2m and Net
Revenue also increasing 14.0% to £632.8m compared to H1 FY20.
• Adjusted Operating Profit was at £45.4m compared with £45.7m to H1 FY20. The Adjusted Operating
Profit margin has decreased to 6.8% from 7.8% from H1 FY20 mainly as a result of declining
contribution from the Inerts and Landfill Gas businesses.
• Profit after tax fell by £47.4m from £20.6m in H1 FY20 to a loss after tax of £26.8m; primarily due to an
increase in asset impairment provisions, acquisition related costs, amortisation of intangibles and the
change in the real discount rates on landfill provisions.
Finance Income
• Finance income increased from £1.3m to £1.6m on H1 FY20 primarily driven by returns on pension
assets.
Finance Charges
• Finance charges includes interest charges on the Group’s borrowings, bond premiums and discount
unwind on landfill provisions.
• Finance charges decreased from £10.7m to £10.2m on H1 FY20 due to lower gearing as a result of
the equity raise which took place in June 2020.
Adjusting Items
To enable additional clarity of business performance, certain items are excluded when calculating the Group’s
Adjusting measures of performance. See section entitled ‘Basis of Preparation’ within the notes to the financial
statements.
Adjusting items are fully explained in Note 4 to the condensed consolidated financial statements and include
Adjusting items, amortisation of acquisition intangibles and material impacts from changes in real discount
rates on landfill provisions. Before tax, these charges totalled £62.1m in the period (H1 FY20: £11.8m). The
main items contributing to this total were the impairment of CSG’s goodwill (£25.0m), acquisition related costs
(£5.9m); the decrease in the real discount rate on landfill provisions (£16.8m); and the charge for amortisation
of acquired intangible assets (£15.6m).
Taxation
The effective tax rate on Adjusted profit before tax was 21% (H1 FY20: 18.2%), due to the impact of usual
non-deductible tax items. The effective tax rate on statutory losses was 20% (H1 FY20: 19.5%).
Dividend
As previously reported, there was no final dividend declared for FY21 due to the impacts of the pandemic. We are pleased to be reintroducing the interim dividend at 2.20p, (HY21:nil, HY20:2.47p) and expect to pay a

12
progressive dividend moving forward.
Earnings per Share
Earnings have been spread over a closing share capital balance of 302.5m shares. Total statutory earnings per share improved to a loss of 8.9 pence per share (‘‘pps’’) from a loss of 15.1pps in HY21.
Adjusted Earnings per share increased from 0.4pps in HY21 to 11.0pps.
Capital Allocation
A core part of the Group’s strategy is to selectively invest in businesses and infrastructure where it has a
structural advantage and can generate attractive returns, as well as paying a progressive dividend.
• Reduce: Company Shop was acquired in February, and this provides us with a strategic springboard
into the area of waste avoidance.
• Recycle: Investment in food grade plastic recycling continues with our Seaham and Washington
facilities now going through commissioning. We acquired the trade and assets of Green Circle
Polymers Limited, which is Scotland’s only postconsumer plastics recycling facility, for a total
consideration of £8.9m. We also acquired certain recycling assets from Viridor which now positions
us as the largest operator of MRFs and PRFs across the UK and together with Green Circle,
significantly strengthens the raw material supply chain into our Polymers business.
• Recover: Progress on the construction of both Newhurst and Protos energy recovery facilities
continues on track.
• Collect: Consolidating the I&C market is a core part of this and the acquisition of Viridor’s collections
business enabled us to make a substantive step forward in this regard.
Retirement Benefits
The Group operates a defined benefit pension scheme for certain employees, which is closed to new entrants, and which closed to future accrual for the majority of its members as at 1 November 2013. At 24 September 2021, the net retirement benefit surplus was £139.0m compared to a surplus of £112.1m at 26 March 2021.
The aggregate surplus has increased since the FY21 year-end. The main reasons for this improvement are positive returns on the Schemes’ assets and the deficit contribution of circa £4.3m paid into the Biffa Defined Benefit Pension Scheme over the half-year period. These positive impacts have been partially offset by a fall in corporate bond yields over the period, which led to a lower discount rate and so a higher value placed on the liabilities, as well as a rise in expectations of future inflation over the period, which further increased the value of liabilities. In addition to being in surplus on an accounting basis, the scheme is also in surplus when assessed under actuarial technical provisions. As a result, plans are being pursued to move to a self-sufficiency position over the next few years.
Return on Capital
Group Return on Capital Employed (see Basis of Preparation and Definitions) increased to 4.3% from 1.9%.
Group Return on Operating Assets (see Basis of Preparation and Definitions) increased from 11.9% to 16.1% which is consistent with FY20 levels. This has been driven by the increase in Adjusted Operating Profit.
Cash Flow
A summary of the Group’s Cash Flow is shown below:
H1 FY22 (£m)
H1 FY21
(£m)
H1 FY20 £m
Adjusted EBITDA 91.3 58.3 86.8

13
Working capital (10.0) 17.6 (14.9)
Net capital expenditure (28.3) (20.7) (26.1)
Net interest paid
(7.8) (7.2)
(8.3)
Finance lease principal payments (27.3) (16.6) (23.5)
Pension deficit payments (4.3) (4.2) (4.1)
Purchase of own shares (0.6) 0.4 (6.0)
Tax paid (0.2)
-
-
Adjusted Free Cash Flow 12.8 27.6 3.9
Adjusting items (5.5) (1.6) (3.2)
Acquisitions (net of cash acquired) (114.7) (2.1) (2.5)
Investment in associates (10.0) (2.1)
-
Dividends paid - -
(12.2)
Loans to joint ventures
(4.3) -
-
Changes in net borrowings 150.5 (102.4) (3.0)
Equity Raise - 97.7
-
Movement in financial assets 0.8 (3.7) 3.0
Net cash flow 29.6 13.4 (14.0)
Adjusted Free Cash Flow of £12.8m compares to £3.9m in H1 FY20, as a result of improved EBITDA and ongoing progress in working capital management.
A cash consideration of £122.1m was paid for Viridor and an initial consideration of £5.8m was paid for Green Circle. The total cash outflow for acquisitions presented above is net of cash acquired and the combined deferred consideration on both deals is currently estimated at £13.4m.
The Group undertook a private placement raising £150m in order to maintain adequate funding headroom following the acquisition of Viridor.
As a consequence, net cash flow improved from an outflow of £14.0m in the first half of FY20 to an inflow of £29.6m for the first half of this year.
A statutory group cash flow summary is set out below:
H1 FY22 (£m)
H1 FY21 (£m)
H1 FY20 £m
Net cash from operating activities 72.1 66.7 67.0
Net cash used in investing activities (157.3) (25.0) (27.9)
Net cash flow used in financing activities 114.8 (28.3) (53.1)
Net increase/(decrease) in cash and cash equivalents
29.6 13.4 (14.0)
Reported Net Debt and Borrowings
Group Reported Net Debt is £579.3m (H1 FY21: £310.3m), representing 3.4x Adjusted EBITDA (H1 FY21: 2.1x). When looked at on a pre-IFRS16 basis for bank covenant testing, net debt: EBITDA at the half year was 2.4x (H1 FY21:1.3x). This is ahead of the forecast position of 2.6-2.7x that we expected when we completed the Viridor acquisition.
Of the EVP preference liability, £6.3m has been included within Reported Net Debt as it will be payable to EVP Preference Shareholders irrespective of the outcome of the EVP dispute. The remainder of (£41.3m) has been

14
excluded on the basis that it will only become payable subject to the outcome of the EVP dispute and will be funded by recovery of funds from HMRC.
We have now agreed with our banking syndicate to move our covenants to a post-IFRS 16 basis so that it aligns with current accounting principles. This adds 1.0x to our various covenanted metrics.
The funds from the private placement issuance in July 2021 were used to fund the acquisition of the Viridor
business.
H1 FY22 (£m)
H1 FY21 (£m)
H1 FY20 £m
Cash 60.4 101.2 52.2
Loans (348.4) (147.1) (245.2)
Finance leases (285.0) (258.1) (250.5)
EVP preference liability (6.3) (6.3) (6.3)
Reported Net Debt (579.3) (310.3) (449.8)
In order to align our funding strategy with our sustainability strategy, we have established a Sustainability-Linked Finance Framework linked to two KPIs:
1. Biffa’s scope 1 and 2 GHG emissions
2. Biffa Polymers plastics recycling capacity
The interest rate margin under our RCF will be adjusted based on performance against sustainability targets linked to the above KPI’s. We will report our progress on these targets annually within the Annual and Sustainability Reports.
Our sustainability-linked finance framework will be published on the Biffa investor website in December: www.biffa.co.uk/investors
Landfill Tax Matters
The Group is currently engaged in the following disputes with HMRC: • EVP: The Group is engaged in a dispute with HMRC concerning historical landfill tax. Biffa was unsuccessful
in its Court of Appeal hearing held in March 2021 and is seeking leave to appeal to the Supreme Court.
• Hazardous Waste: As previously disclosed, HMRC assessed Biffa for £8.5m of landfill tax relating to the period 2012 to 2016. Biffa paid these monies to HMRC in December 2019 and is appealing the assessment. The cash payment is held on the balance sheet within prepayments as we expect to successfully defend this case.
Reporting Periods
The Group reported full year results for the 52 weeks to 26 March 2021. The prior year comparisons are in relation to the 52 weeks ended 27 March 2020.
Risks & Uncertainties
The principal risks and uncertainties affecting the business activities of Biffa and the industry in which it operates remain those detailed in the Annual Report and Accounts and which are summarised as follows:
• Biffa operates in a highly regulated industry and changing regulatory requirements and standards could have an adverse impact on the Group’s operations and results.
• Economic conditions in the United Kingdom may have an adverse impact on Biffa’s operating performance, revenues and results.
• Despite pricing flexibility is most areas, Biffa is exposed to risks inherent in certain long-term fixed-
price contracts, in particular in its Municipal and related operations.
• Fluctuations in electricity, fuel and other commodity prices could affect Biffa’s operating results.

15
• Competition in the waste management industry could reduce Biffa’s revenues and net income.
• Biffa faces risks arising from its acquisition strategy including the successful recovery of CSG’s performance.
• A significant disruption to Biffa’s information technology system, or delay during its migration to new
systems, could adversely affect the Company’s performance.
• A cyber security incident could negatively impact Biffa’s business and its relationships with customers.
• Biffa may fail to identify strategic developments and may be unsuccessful in developing new
technologies, or its current technological capabilities may become obsolete.
• Biffa’s operations expose it to the risk of material health and safety liabilities.
• Biffa is subject to risks arising from its bonding and other financial security arrangements.
• Biffa may be subject to litigation, disputes or other legal proceedings.
• Biffa is dependent on the availability of labour.
Statement of Directors’ Responsibilities
Biffa’s half year financial information is the responsibility of and has been approved by the Directors. The Directors are responsible for preparing the half year report in accordance with the Disclosure and Transparency Rules (DTR) of the United Kingdom’s Financial Conduct Authority
We confirm that to the best of our knowledge:
a) The condensed set of financial statements has been prepared in accordance with IAS 34‘Interim Financial Reporting’ as issued by the International Accounting Standards Board and adopted by the European Union;
b) The interim management report includes a fair review of the information required by DTR 4.2.7R (indication of important events during the first six months and description of principal risks and uncertainties for the remaining six months of the year); and
c) The interim management report includes a fair review of the information required by DTR 4.2.8R (disclosure of related parties’ transactions and changes therein).
By Order of the Board
Richard Pike
Chief Financial Officer
17 November 2021
16
INDEPENDENT REVIEW REPORT TO BIFFA PLC
We have been engaged by the company to review the condensed set of financial statements in the half-yearly financial report for 26 weeks ended 24 September 2021 which comprises the Condensed Consolidated Interim Income Statement, the Condensed Consolidated Interim Statement of Comprehensive Income, the Condensed Consolidated Interim Statement of Financial Position, the Condensed consolidated Statement of Changes in Equity, the Condensed Consolidated Statement of Cash Flows and related notes 1 to 16. We have read the other information contained in the half-yearly financial report and considered whether it contains any apparent misstatements or material inconsistencies with the information in the condensed set of financial statements. Directors’ responsibilities The half-yearly financial report is the responsibility of, and has been approved by, the directors. The directors are responsible for preparing the half-yearly financial report in accordance with the Disclosure Guidance and Transparency Rules of the United Kingdom’s Financial Conduct Authority. As disclosed in note 1, the annual financial statements of the group will be prepared in accordance with the IFRSs as adopted by the United Kingdom. The condensed set of financial statements included in this half-yearly financial report has been prepared in accordance with United Kingdom adopted International Accounting Standard 34, “Interim Financial Reporting”. Our responsibility Our responsibility is to express to the Company a conclusion on the condensed set of financial statements in the half-yearly financial report based on our review. Scope of review We conducted our review in accordance with International Standard on Review Engagements (UK and Ireland) 2410 “Review of Interim Financial Information Performed by the Independent Auditor of the Entity” issued by the Financial Reporting Council for use in the United Kingdom. A review of interim financial information consists of making inquiries, primarily of persons responsible for financial and accounting matters, and applying analytical and other review procedures. A review is substantially less in scope than an audit conducted in accordance with International Standards on Auditing (UK) and consequently does not enable us to obtain assurance that we would become aware of all significant matters that might be identified in an audit. Accordingly, we do not express an audit opinion. Conclusion Based on our review, nothing has come to our attention that causes us to believe that the condensed set of financial statements in the half-yearly financial report for the 26 weeks period ended 24 September 2021 is not prepared, in all material respects, in accordance with United Kingdom adopted International Accounting Standard 34 and the Disclosure Guidance and Transparency Rules of the United Kingdom’s Financial Conduct Authority. Use of our report This report is made solely to the company in accordance with International Standard on Review Engagements (UK and Ireland) 2410 “Review of Interim Financial Information Performed by the Independent Auditor of the Entity” issued by the Financial Reporting Council. Our work has been undertaken so that we might state to the company those matters we are required to state to it in an independent review report and for no other purpose. To the fullest extent permitted by law, we do not accept or assume responsibility to anyone other than the company, for our review work, for this report, or for the conclusions we have formed. Deloitte LLP Statutory Auditor Birmingham, United Kingdom 17 November 2021

17
HALF YEAR RESULTS FOR THE 26 WEEKS ENDED 24 SEPTEMBER 2021
Condensed Consolidated Interim Income Statement
For the half year ended 24 September 2021
26 weeks to
24 September 2021 (unaudited)
26 weeks to
25 September 2020 (unaudited)
52 weeks to
26 March 2021 (audited)
Notes
Activities¹
excluding
Adjusting
items
£m
Adjusting Items
£m
(note 4)
Total
£m
Activities¹
excluding
Adjusting
items
£m
Adjusting Items
£m
(note 4)
Total
£m
Activities¹
excluding
Adjusting
items
£m
Adjusting Items
£m
(note 4)
Total
£m
Continuing operations:
Revenue 3 671.2 - 671.2 482.5 - 482.5 1,042.0 - 1,042.0
Cost of sales (591.8) (60.7) (652.5) (446.6) (39.6) (486.2) (940.4) (68.1) (1,008.5)
Gross profit/(loss) 79.4 (60.7) 18.7 35.9 (39.6) (3.7) 101.6 (68.1) 33.5
Operating costs (34.0) (1.4) (35.4) (24.4) (15.1) (39.5) (57.4) (13.7) (71.1)
Expected credit loss recognised (1.8) - (1.8) - - -
Operating profit/(loss) 3 45.4 (62.1) (16.7) 9.7 (54.7) (45.0) 44.2 (81.8) (37.6)
Finance income 1.6 - 1.6 2.0 - 2.0 3.2 - 3.2
Finance charges (10.2) - (10.2) (9.1) - (9.1) (17.6) - (17.6) Share of results in joint venture
(0.3) - (0.3) (0.4) - (0.4) (0.8) - (0.8)
Profit/(loss) before taxation 36.5 (62.1) (25.6) 2.2 (54.7) (52.5) 29.0 (81.8) (52.8)
Taxation 5 (3.3) 2.1 (1.2) (1.0) 10.3 9.3 (6.4) 18.7 12.3
Profit/(loss) for the period
33.2 (60.0) (26.8) 1.2 (44.4) (43.2) 22.6 (63.1) (40.5)
Profit/(Loss) attributable to shareholders of the parent Company
(26.8) (43.2) (40.5)
Basic earnings/(loss) per share in pence
6 (8.9) (15.1) (13.7)

18
Diluted earnings/(loss) per share in pence
6 (8.6) (14.7) (13.4)
1 Activities excluding Adjusting items excludes other items which are outlined in Note 4.

19
Condensed Consolidated Interim Statement of Comprehensive Income
For the half year ended 24 September 2021
Notes
26 weeks ended
24 September
2021 £m
(unaudited)
26 weeks ended
25 September
2020 £m
(unaudited)
52 weeks Ended
26 March
2021 £m
(audited)
Loss for the period (26.8) (43.2) (40.5)
Other comprehensive (expense)/income
Items that will not be reclassified subsequently to income:
Actuarial gain/(loss) on defined benefit pension scheme
22.1 (44.5) (21.6)
Tax relating to items that will not be reclassified subsequently
(8.0) 8.6 4.1
14.1 (35.9) (17.5)
Items that may be reclassified subsequently to income:
Fair value gain/(loss) on hedging instruments arising during the period
2.3 (5.6) (2.6)
Fair value loss on cash flow hedge in joint venture arising during the period
(1.8) - (1.0)
0.5 (5.6) (3.6)
Other comprehensive gain/(expense) for the period, net of income tax
14.6 (41.5) (21.1)
Total comprehensive income/(expense) for the period
(12.2) (84.7) (61.6)
Attributable to shareholders of the parent company
(12.2) (84.7) (61.6)

20
Condensed Consolidated Interim Statement of Financial Position
As at 24 September 2021
Notes
As at
24
September
2021
£m
(unaudited)
As at
25
September
2020
£m
(unaudited)
As at
26
March
2021
£m
(audited)
Assets
Non-current assets
Goodwill 7 274.7 134.2 224.3
Other intangible assets 170.2 179.2 182.5 Property, plant and equipment 9 613.2 504.3 562.2 Investment in joint venture 17.5 4.7 9.6 Long term receivables 65.8 68.9 65.8
Deferred tax assets -
0.4 -
Loan to joint ventures 10.7
- 6.0
Retirement benefit surplus 13 139.0 85.6 112.1
1,291.1 977.3 1,162.5
Current assets
Inventories 32.9 18.6 22.3 Trade and other receivables 207.8 170.0 141.3 Contract assets 70.5 46.0 50.6 Derivatives - 0.3 0.3 Financial assets 42.8 10.7 12.8 Cash and cash equivalents 60.4 101.2 30.8
Current tax assets 0.2 - -
414.6 346.8 258.1
Current liabilities
Borrowings (56.3) (53.4) (54.7) Derivatives 10 - (0.1) (3.0) Trade and other payables (346.3) (281.8) (257.5) Deferred and contingent consideration (13.2) - (9.4) Contract liabilities (20.3) (18.9) (19.6) Current tax liabilities - (0.1) (0.3) Provisions 11 (24.6) (27.2) (16.1)
Total current liabilities (460.7) (381.5) (360.6)
Net current liabilities (46.1) (34.7) (102.5)
Non-current liabilities
Borrowings (624.9) (399.4) (474.2) Derivatives (1.1) (6.7) (0.9) Trade and other payables (22.2) (13.0) (14.6)
Deferred and contingent consideration (3.0) - -
Contract liabilities - (0.6) - Provisions 11 (119.8) (91.9) (101.3) Deferred tax liabilities (27.6) - (11.1)
Total non-current liabilities (798.6) (511.6) (602.1)
Net assets 446.4 431.0 457.9
Equity
Called up share capital 3.1 3.0 3.1 Share premium 247.4 245.9 247.0 Hedging reserve (5.9) (8.4) (6.4) Merger reserve 170.3 170.3 170.3
Retained earnings 31.5 20.2 43.9

21
Total equity surplus attributable to
shareholders of the parent company 446.4 431.0 457.9

22
Condensed consolidated Statement of Changes in Equity
For the half year ended 24 September 2021
Called up share
capital
£m
Share premium
£m
Merger reserve
£m
Hedging and other reserves
£m
Retained earnings
£m
Total equity
£m
As at 26 March 2021 3.1 247.0 170.3 (6.4) 43.9 457.9
Profit for the period - - - - (26.8)
(26.8)
Gain on cash flow hedges - - - 0.5 - 0.5
Other comprehensive income
for the period - - - - 14.1 14.1
Total comprehensive loss for the period
- - - 0.5 (12.7) (12.2)
Transactions with owners: - - -
- - - -
Issue of share capital - - - - - -
Repurchase of own shares - - - - - -
Exercise of share options - 0.4 - - - 0.4 Shares purchased by employee benefit trust
- - (1.0) (1.0)
Value of employee service in respect of share option schemes
- - - - 1.3 1.3
As at 24 September 2021
(unaudited) 3.1 247.4 170.3 (5.9) 31.5 446.4
Called up share
capital
£m
Share premium
£m
Merger reserve
£m
Hedging and other reserves
£m
Retained earnings
£m
Total equity
£m
As at 30 March 2020 2.5 235.3 74.4 (2.8) 101.6 411.0
Loss for the period - - - - (43.2) (43.2)
Loss of cash flow hedges - - - (5.6) - (5.6)
Other comprehensive income
for the period
-
-
-
-
(35.9) (35.9)
Total comprehensive
loss for the period - - - (5.6) (79.1) (84.7)
Transactions with owners:
Equity raise** 0.5 1.3 95.9 - - 97.7
Issue of share capital - 9.3 - - - 9.3
Shares purchased by employee benefit trust
- - - - (9.0) (9.0)
Share allotment for employee share option schemes***
- - - - 5.6 5.6
Value of employee service in respect of share option schemes
- - - - 1.1 1.1
As at 25 September 2020
(unaudited) 3.0 245.9 170.3 (8.4) 20.2 431.0

23
Called up share
capital
£m
Share premium
£m
Merger reserve
£m
Hedging and other reserves
£m
Retained (deficit)/
earnings
£m
Total equity
£m
As at 27 March 2020 (audited)
2.5 235.3 74.4 (2.8) 101.6 411.0
Profit for the period - - - - (40.5) (40.5)
Other comprehensive (loss)/income
- - - (3.6) (17.5) (21.1)
Total comprehensive (loss)/income
for the period
- - - (3.6) (58.0) (61.6)
Equity raise** 0.5 1.3 95.9 - - 97.7
Issue of share capital 0.1 10.4 - - - 10.5
Shares purchased by employee benefit trust - - - - (4.4) (4.4)
Value of employee service in respect of share option schemes
- - - - 3.2 3.2
Deferred tax on share based payments
- - - - 1.5 1.5
As at 26 March 2021
(audited) 3.1 247.0 170.3 (6.4) 43.9 457.9
**During the period, Biffa plc secured 100% of the shares of Project Mozzarella (Jersey) Ltd. The transactions satisfied all required conditions under section 612 of the UK Company Act 2006 to obtain merger relief and therefore allowed for the premium on the allotment of equity shares in Biffa Plc to be recorded in the merger reserve rather than share premium.
***During the period, the Group settled its FY20 bonus payments using share options. A share allotment of 3m shares was issued to partially cover this payment.

24
Condensed Consolidated Statement of Cash Flows
Notes
26 weeks ended
24 September
2021 £m
(unaudited)
26 weeks ended
25 September
2020 £m
(unaudited)
52 weeks ended
26 March
2021 £m
(audited) Cash flows from operating activities
Cash generated from operations 12 77.8 68.3 134.5
Adjusting costs (5.5) (1.6) (11.0)
Net cash from operating activities 72.3 66.7 123.5
Taxation received/(paid) (0.2) - (0.6)
Net cash inflow from operating activities 72.1 66.7 122.9
Cash flows from investing activities
Purchases of property, plant and
equipment (27.6) (19.3) (45.0)
Funds on long term deposit - - (0.1)
Purchases of intangible assets (1.5) (1.9) (3.9)
Compensation - - -
Purchase of business (128.9) (2.1) (119.1)
Cash acquired from business combinations 14.2 - 16.0
Investment in joint ventures (10.0) (2.1) (8.4)
Sale of rights to share in joint venture - - 2.8
Proceeds from the sale of property, plant
and equipment 0.8 0.3 0.8
Loan to joint ventures (4.3) - (3.6)
Interest received - 0.1 0.1
Net cash used in investing activities (157.3) (25.0) (160.4)
Cash flows from financing activities
Interest paid (7.8) (7.4) (14.6)
Employee share scheme purchase (0.6) 0.4 (4.5)
Exercise of share options - - 4.9
Equity Raise - 97.7 97.7
Repayment of borrowings (117.5) (102.4) (128.6)
Finance lease principal payments* (27.3) (16.6) (43.4)
Drawdown of new borrowings 268.0 - 70.0
Fees payable on 1 year extension of RCF - - (0.6)
Cash flow on settlement of derivatives - (0.4)
Dividends paid - - -
Net cash flow used in financing
activities 114.8 (28.3) (19.5)
Net increase/(decrease) in cash and
cash equivalents 29.6 13.4 (57.0)
Cash and cash equivalents at the
beginning of the period 30.8 87.8 87.8
Cash and cash equivalents at the end
of the period 60.4 101.2 30.8

25
Notes to the Condensed Interim Financial Information
1. Basis of Preparation
This condensed consolidated interim financial information for 26 weeks ended 24 September 2021 has been
prepared in accordance with the Disclosure and Transparency Rules of the Financial Conduct Authority and
with United Kingdom adopted International Accounting Standard 34, “Interim Financial Reporting”. The
condensed consolidated interim financial information should be read in conjunction with the annual report
dated 10 June 2021, which is available on the Company website, and has been prepared in accordance with
the IFRSs as adopted by the United Kingdom.
The condensed consolidated interim financial information does not comprise statutory accounts within the
meaning of Section 434 of the Companies Act 2006. Statutory financial statements for the 52 weeks ended 26
March 2021 were approved by the Board of Directors on 10 June 2021 and delivered to the Registrar of
Companies. The independent auditor’s report on those accounts was unqualified, did not contain an emphasis
of matter paragraph and did not contain a statement under Section 498(2) or (3) of the Companies Act 2006.
The Group’s income statement and segmental analysis separately identify financial results before Adjusting
and other items. The Directors believe that the presentation of the results in this way is relevant to an
understanding of the Group’s financial performance. Presenting financial results before Adjusting and other
items is consistent with the way that the financial performance is measured by management and reported to
the Board and aids the comparability of reported results from year to year in this context.
This condensed consolidated interim financial information has been reviewed, not audited. The condensed
group financial statements have been prepared on the basis of the accounting policies set out in the statutory
financial statements. H1 FY22 represents the 26 weeks ended 24 September 2021; H1 FY21 represents the
26 weeks ended 25 September 2020; H1 FY20 represents the 26 weeks ended 27 September 2019; FY21
represents the 52 weeks ended 26 March 2021
The Group’s income statement and segmental analysis separately identify financial results before Adjusting
and other items. The Directors believe that the presentation of the results in this way is relevant to an
understanding of the Group’s financial performance. Presenting financial results before Adjusting and other
items is consistent with the way that the financial performance is measured by management and reported to
the Board and aids the comparability of reported results from year to year in this context. The Group’s income
statement and segmental analysis separately identify a number of Alternative Performance Measures (APMs)
in addition to those reported under IFRS. The Directors believe that the presentation of the results in this way,
which is not meant to be a substitute for or superior to IFRS measures, is relevant to an understanding of the
Group’s underlying trends, financial performance and position. These APMs are also used to enhance the
comparability of information between reporting periods and the Group’s divisions, by Adjusting for non-
recurring or uncontrollable factors which affect IFRS measures, to aid the user in understanding the
performance excluding Adjusting items. Our APMs and KPIs are aligned to our strategy and together form the
basis of the performance measures for remuneration. Consequently, APMs are consistent with how the
business performance is planned and reported internally to the Board and Operating Committees to aid their
decision making. Additionally, some of these measures are used for the purpose of setting remuneration
targets.
APMS Closest equivalent statutory measure
Definition and reconciliation
Net Revenue Revenue • Statutory revenue excluding landfill tax, unless stated otherwise, ‘revenue’ refers to statutory revenue.
• Landfill tax is excluded as the rate is outside the Group’s control.
• See note 3 for reconciliation.
Organic Net
Revenue
Growth
Revenue • The increase/(decrease) in Net Revenue in the period excluding Net Revenue from acquisitions completed in the period and Net Revenue from acquisitions completed in the prior period up to the anniversary of the relevant acquisition date, to the extent such Net Revenue falls in the current period. Where comparative periods differ in duration, the KPI is adjusted on a pro-rata basis.

26
• Organic Net Revenue growth can be expressed both as an absolute financial value and as a percentage of prior period revenue.
• Organic Net Revenue Growth is presented to demonstrate to users of the financial statements the growth attributed to organic growth rather than as a result of acquisition.
• See note 3 for reconciliation.
Acquisition
Net Revenue
Growth
Revenue • Acquisition Net Revenue Growth in any period represents the Net Revenue Growth in the relevant period from (i) acquisitions completed in the relevant period and (ii) any acquisitions completed in the 12 months prior to the relevant period up to the 12-month anniversary of the relevant acquisition date (to the extent such Net Revenue falls in the current period). Acquisition Revenue Growth is calculated on the same basis, using revenue in place of Net Revenue.
• Acquisition net revenue growth is presented to demonstrate the level of growth achieved as a direct result of the Group’s acquisition strategy.
• See note 3 for reconciliation.
Acquisition
Net Revenue
Growth Rate
None • Acquisition Net Revenue Growth Rate in any period represents the
Acquisition Net Revenue Growth for the period expressed as a
percentage of the prior period’s Net Revenue. Acquisition Revenue
Growth Rate is calculated on the same basis, using revenue in place
of Net Revenue.
Adjusted EBITDA
Operating Profit • Profit before depreciation and amortisation, Adjusting items, changes
to landfill provisions, finance costs and taxation.
• Adjusted Divisional EBITDA is stated after allocation of shared services costs.
• Adjusted EBITDA is presented because it is widely used by analysts and investors to evaluate the profitability of companies. EBITDA eliminates potential differences in performance caused by variations in capital structures, tax positions, the cost and age of tangible assets and the extent to which intangible assets are identifiable.
• See note 3 for reconciliation.
Adjusted
Operating
Profit
Operating Profit • Profit before Adjusting items, amortisation of acquisition intangibles,
impact of real discount rate changes to landfill provisions, finance
costs and taxation.
• Adjusted Divisional Operating Profit is stated after allocation of shared service costs.
• See Consolidated Income Statement for reconciliation.
Reported Net Debt
Net Debt • Net debt excluding contingent balances relating to EVP preference shares.
£41.3m of the EVP debt has been excluded on the basis that it
will only become payable subject to the outcome of the EVP
dispute and will be funded by recovery of funds from HMRC.
• See note 12 for reconciliation.
Adjusted Free Cash Flow
Net cash from operating activities
• Net increase/(decrease) in cash and cash equivalents excluding dividends, restructuring and Adjusting items, acquisitions, movement in financial assets and movements in borrowings or share capital (but including finance lease principal payments).
• This measure reflects the cash generated in the period excluding Adjusting items and forms part of management incentives.
• See note 12 for reconciliation.
Other measures
Return on Capital
• Adjusted Operating Profit less amortisation of acquisition intangibles divided by the average of opening and closing shareholders’ equity,

27
Employed (ROCE)
Net Debt (including lease liabilities), pensions and environmental provisions.
Return on Operating Assets (ROOA)
• Adjusted Operating Profit divided by average of opening and closing Property, Plant & Equipment, plus net working capital.
1.1 Going Concern Basis
Since reporting of the Group’s full year results for year ending 26 March 2021, Covid-19 continues to have had
some impact on the Group’s financial and operational performance. Latest forecasts suggest that the Group
will return back to FY20 Adjusted EBITDA levels during FY22, providing we do not encounter further
lockdowns.
The Group meets its daily working capital requirements through its bank facilities. Forecast and projections for
the Group, taking into account reasonable fluctuations in trading performance, show that the Group are
expected to operate within the current levels of the facility. The Group has significant financial resources
including unutilised bank facilities of £149m and cash and cash equivalents of £60.4m as at 24 September
2021.Latest forecasts suggest that the Group will return back to FY20 Adjusted EBITDA levels during FY22,
providing we don’t encounter further lockdowns. These forecasts, when overlaid with sensitivity analysis taking
into account different scenarios for fluctuations in trading performance, show that the Group are expected to
be able to comfortably operate within the current levels of the facility over the next twelve months.
Management has also performed a sensitivity analysis which supports this view by modelling a reasonable
worst-case scenario. The worst-case scenario assumes a reduction in volumes in line with the experience of
the first lockdown restrictions in Q1 FY21. The Group’s profitability, liquidity and financial headroom have all
been assessed and incorporated within this scenario analysis.
Based on the above, the Directors have concluded the Group is well placed to manage its financing and other
business risks satisfactorily and have a reasonable expectation that the Group will have adequate resources
to continue in operation for at least twelve months from the signing date of these Consolidated Financial
Statements. They therefore consider it appropriate to adopt the going concern basis of accounting in preparing
the Financial Statements.
2. Accounting Policies
Except as described below, the accounting policies and key assumptions and sources of estimation uncertainty
applied are consistent with those as described in the annual report for the year ending 26 March 2021.
The significant financial judgements considered in relation to the Half Year Report and Accounts are detailed
below:
Environmental and
aftercare
commitments
The Group operates a number of landfill sites in the UK. A significant cost of owning and operating a landfill site in the UK arises after the land filling operation ceases due to the constructive and legal obligation to restore sites and then to care for them until it can be demonstrated that they present no ongoing risk to the environment. A provision is made for the costs associated with restoring and maintaining its landfill sites and controlling leachate and methane emissions from the sites. A number of estimate uncertainties affect the calculation, including the impact of regulation, climate change, accuracy of site surveys, transportation costs and changes in the real discount rate. The provisions incorporate our best estimates of the financial effects of these uncertainties, but future changes in any of these estimates could materially impact the calculation of the provision. The associated outflows are estimated to arise over a period of up to 60 years depending on the date of each site closure. In determining the provision, the estimates for future expenditure required to settle the obligation are inflated using longer term inflation rates and discounted using the nominal discount rate. The rates utilised reflect the period of the obligation on a site by site basis which varies between 10 and 60 years. At FY21 year end the 5 year discount rate was 1.0% and the 60 year discount rate was 2.0%. Since then, discount rates have changed to 1.2% and 1.7% respectively.

28
The long term inflation rate has also increased as disclosed in note 11. This has had a material impact on the landfill aftercare provisions. An increase of 1% in the nominal discount rate (at current cost) would result in a decrease of environmental provisions of approximately £21.6m. An increase of 1% in the inflation rate (at current cost) would result in an increase of environmental provisions of approximately £31.9m.
Retirement Benefit
Accounting
The Group operates several defined benefit pension schemes which are accounted for under IAS 19 (“Employment Benefits”). Pension accounting is a specialist area requiring the exercise of significant management judgement and the use of technical expertise to determine the surplus or deficit of the scheme in accordance with generally accepted actuarial practices. The assumptions used in valuing the defined benefit pension liabilities including the discount rate, yield curves, mortality assumption, inflation level, pension increase and measures of longevity are complex and changes to the assumptions can have a material impact on the value of pension liabilities. As at the end of the financial period the Group recognised a retirement benefit surplus of £139.0m. Fund valuations were performed for 26 March 2021 year end and also performed for 24 September 2021 interim reporting to mitigate risk of fluctuations in valuations.
Asset Impairment
Review
The Group carries different classes of intangible assets including, gas reserves, brand name and customer contracts. The Group also has classes of tangible assets in property, landfill gas and plant, vehicles and machinery. The carrying value of these is dependent on future cash flows and if these cash flows do not meet the Group’s expectations there is risk that the assets will be impaired. The impairment reviews performed by the Group contain a number of significant estimates:
• forecast energy prices including the impact of climate change to these prices
• the ROCs recycle benefit rights
• forecast gate fees, tonnage prices and gas yield projections; and
• discount rates Management relies on a number of third party experts to value a number of these key estimates. Changes in these assumptions can have a significant impact on the headroom available in the impairment calculations. Changes in these assumptions can have a significant impact on the headroom available in the impairment calculations.
Company Shop
Group Goodwill
The Group recognised Goodwill on completion of the acquisition of Company
Shop Group Limited. The carrying value of the Goodwill is dependant on future
cashflows and if these cashflows do not meet the Group’s expectations there is
a risk that the assets will be impaired. The impairment review performed by the
Group contains a number of significant estimates
• customer footfall
• basket spend per customer
• cost of inventory
• discount rate
Changes in these assumptions can have a significant impact on the estimated
value in use. As a result of the impairment review performed by the Group an
impairment of £25m has been recognised.
Further detail in note 7.
Onerous Contract
Provision
Certain group’s contracts are onerous and long-term in nature. These contracts
can be complex and contain key performance indicator clauses where penalties
may be incurred in the event of non-compliance. The group is therefore required
to make operational and financial assumptions to estimate future losses over
periods that can extend beyond seven years.
Variability of contract penalties, delivery costs, commodity prices applied and

29
customer claims or disputes can put additional pressure on margins and on
future contract profitability, giving rise to onerous contract provisions.
The prediction of future events including the ability to pass additional costs to
customers over extended periods contains inherent risk and the outcome of
customer and subcontractor claims is uncertain and involves a high degree of
management estimation. On the Mid-Kent provision a 5% increase in future
cash outflows would increase the provision by £0.5m and on the Leicester
provision a 5% increase in future cash outflows would increase the provision by
£1.7m.
Corporation tax calculations
Taxes on income in the interim periods are accrued using the full year effective tax rate that would be
applicable to expected total annual profit or loss.
New and amended IFRS Standards that are effective for the current year
At the date of authorisation of these Financial Statements, the below Standards and amendments are effective for reporting periods beginning after 1 January 2020 but have not impacted on the Group’s reporting. - Amendments to IFRS 9, IAS 39 and IFRS 7: Interest Rate Benchmark Reform - Amendments to References to the Conceptual Framework in IFRS Standards - IFRS 16 Leases: Amendment to provide lessees with an exemption from assessing whether a Covid-19-related
rent concession is a lease modification - IAS 1 Presentation of Financial Statements: Amendments regarding the definition of material - Amendments to IFRS 3 Definition of a business – The Group has adopted the amendments to IFRS 3 for the
first time in the current year. The amendments clarify that while businesses usually have outputs, outputs are not required for an integrated set of activities and assets to qualify as a business. To be considered a business an acquired set of activities and assets must include, at a minimum, an input and a substantive process that together significantly contribute to the ability to create outputs. The amendments remove the assessment of whether market participants are capable of replacing any missing inputs or processes and continuing to produce outputs. The amendments also introduce additional guidance that helps to determine whether a substantive process has been acquired. The amendments introduce an optional concentration test that permits a simplified assessment of whether an acquired set of activities and assets is not a business. Under the optional concentration test, the acquired set of activities and assets is not a business if substantially all of the fair value of the gross assets acquired is concentrated in a single identifiable asset or Group of similar assets.
- Amendments to IAS 1 and IAS 8 Definition of material – The Group has adopted the amendments to IAS 1 and IAS 8 for the first time in the current year. The amendments make the definition of material in IAS 1 easier to understand and are not intended to alter the underlying concept of materiality in IFRS Standards. The concept of ‘obscuring’ material information with immaterial information has been included as part of the new definition. The threshold for materiality influencing users has been changed from ‘could influence’ to ‘could reasonably be expected to influence’. The definition of material in IAS 8 has been replaced by a reference to the definition of material in IAS 1. In addition, the IASB amended other Standards and the Conceptual Framework that contain a definition of ‘material’ or refer to the term ‘material’ to ensure consistency.
The adoption of the standards listed above did not have a material impact on the financial statements of the
Group.
New standards and interpretations not yet adopted
At the date of authorisation of these financial statements, the Group has not applied the following new and revised IFRSs that have been issued but are not yet effective and had not yet been adopted: - IBOR Phase 2 (effective for reporting periods starting after 1 January 2021) - Property, Plant and Equipment: Proceeds before intended use – Amendments to IAS 16 (effective for reporting
periods starting after 1 January 2022) - IFRS 17 Insurance Contracts At the date of authorisation of these financial statements, there is expected to be no material impact to the Group’s financial statements from IFRSs, IFRICs or other standards or interpretations that have been issued but which are not yet effective.
There are no other IFRSs or IFRIC Interpretations that are not yet effective that would be expected to have a
material impact on the Group.

30
3. Segmental Information
The Group is managed by type of business and is organised into two operating divisions. These divisions represent the business segments in which the Group reports its primary segment information. All trading activity and operations are in the United Kingdom and there is therefore no secondary reporting format by geographical segment. Revenue within segments is eliminated on consolidation.
The Group’s segmental results are as follows:
26 weeks ended
24 September
2021 £m
(unaudited)
26 weeks ended
25 September
2020 £m
(unaudited)
52 weeks Ended
26 March 2021
£m (unaudited)
Revenue
Collections1 412.7 314.1 677.6
Specialist Services1 81.5 40.7 92.4
Resources & Energy 177.0 127.7 272.0
671.2 482.5 1,042.0
1 The 26-week period ended 25 September 2020 and 52 weeks ended 26 March 2021 has been restated to reflect the Group’s
reorganisation into three divisions: Specialist Services (incorporating Hazardous Waste, IRM, Biffpack and CSG), Collections
(incorporating I&C and Municipal), and R&E.
26 weeks ended
24 September
2021 £m
(unaudited)
26 weeks ended
25 September
2020 £m
(unaudited)
52 weeks Ended
26 March 2021
£m (audited)
Revenue reconciliation
Statutory Revenue 671.2 482.5 1,042.0
Landfill tax (38.4) (23.7) (53.9)
Net Revenue 632.8 458.8 988.1
26 weeks ended
24 September
2021 £m
(unaudited)
26 weeks ended
25 September
2020 £m
(unaudited)
52 weeks Ended
26 March 2021
£m (audited)
Net Revenue in prior period 458.8 560.8 1,102.8
Acquisition Revenue growth 56.9 1.4 13.3
Organic Revenue (decline)/growth 117.1 (103.4) (128.0)
Net Revenue 632.8 458.8 988.1
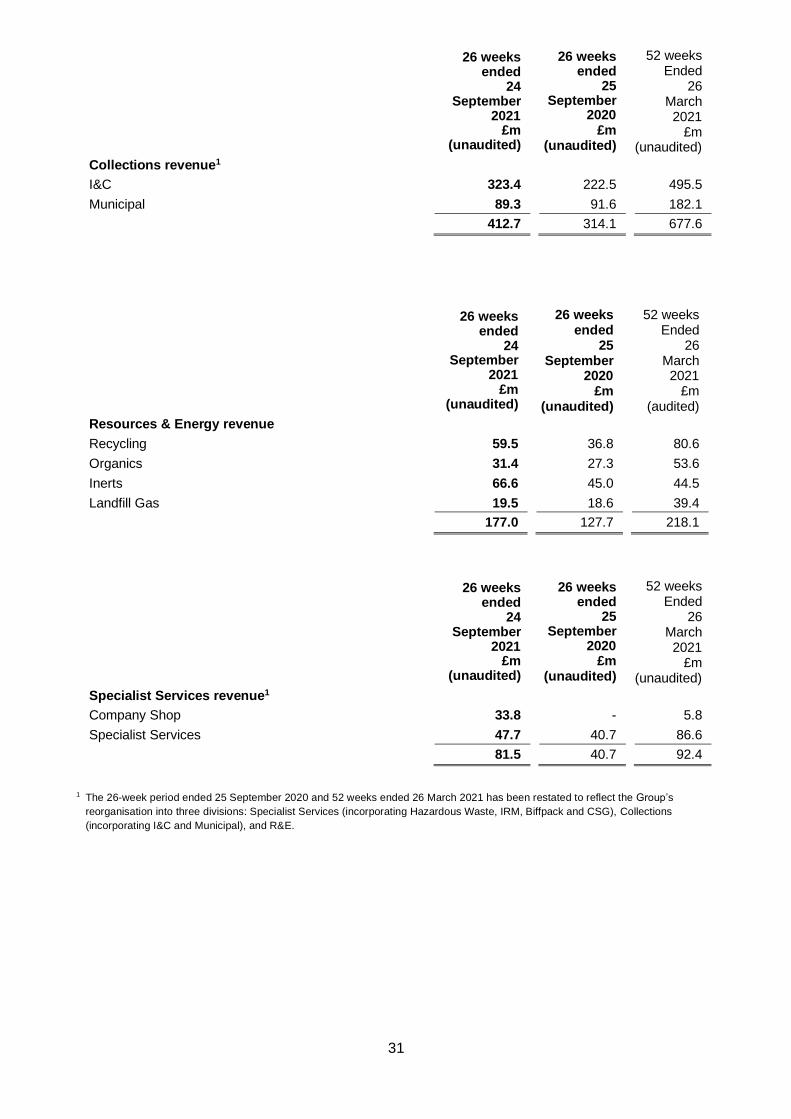
31
26 weeks ended
24 September
2021 £m
(unaudited)
26 weeks ended
25 September
2020 £m
(unaudited)
52 weeks Ended
26 March 2021
£m (unaudited)
Collections revenue1
I&C 323.4 222.5 495.5
Municipal 89.3 91.6 182.1
412.7 314.1 677.6
26 weeks ended
24 September
2021 £m
(unaudited)
26 weeks ended
25 September
2020 £m
(unaudited)
52 weeks Ended
26 March 2021
£m (audited)
Resources & Energy revenue
Recycling 59.5 36.8 80.6
Organics 31.4 27.3 53.6
Inerts 66.6 45.0 44.5
Landfill Gas 19.5 18.6 39.4
177.0 127.7 218.1
26 weeks ended
24 September
2021 £m
(unaudited)
26 weeks ended
25 September
2020 £m
(unaudited)
52 weeks Ended
26 March 2021
£m (unaudited)
Specialist Services revenue1
Company Shop 33.8 - 5.8
Specialist Services 47.7 40.7 86.6
81.5 40.7 92.4
1 The 26-week period ended 25 September 2020 and 52 weeks ended 26 March 2021 has been restated to reflect the Group’s
reorganisation into three divisions: Specialist Services (incorporating Hazardous Waste, IRM, Biffpack and CSG), Collections
(incorporating I&C and Municipal), and R&E.

32
All revenue is with external third parties. There is no single customer that accounts for more than 10% of Group revenue (26 weeks to 25 September 2020: none, 52 weeks to 26 March 2021: none).
26 weeks ended
24 September
2021 £m
(unaudited)
26 weeks ended
25 September
2020 £m
(unaudited)
52 weeks Ended
26 March 2021
£m (unaudited)
Adjusted EBITDA¹
Collections2 61.1 38.4 98.5
Resources & Energy 32.5 19.3 40.7
Specialist Services2 7.3 4.4 11.3
Group costs (9.6) (3.8) (12.3)
Adjusted EBITDA 91.3 58.3 138.2
Depreciation and amortisation (45.9) (48.6) (87.2)
Other impairments - - (6.8)
Adjusted Operating Profit² 45.4 9.7 44.2
Adjusting items (note 4) (32.2) (27.4) (33.8)
Impact of real discount rate changes to landfill provisions (16.8) (13.4) (20.6)
Amortisation of acquisition intangibles (13.1) (13.9) (27.4)
Operating Loss (16.7) (45.0) (37.6)
Finance income 1.6 2.0 3.2
Finance charges (10.2) (9.1) (17.6)
Share of results in joint venture (0.3) (0.4) (0.8)
Loss before taxation (25.6) (52.5) (52.8)
1 Adjusted EBITDA earnings before allocation of the share of depreciation and amortisation, Adjusting items, finance costs, material impacts
of changes in real discount rate applied to the Group’s long-term provisions and income tax expense.
2 The 26-week period ended 25 September 2020 and 52 weeks ended 26 March 2021 has been restated to reflect the Group’s
reorganisation into three divisions: Specialist Services (incorporating Hazardous Waste, IRM, Biffpack and CSG), Collections
(incorporating I&C and Municipal), and R&E.
.

33
26 weeks
26 weeks
52 weeks
ended ended ended
24 25 26
September September March
2021 2020 2021
£m £m £m
(unaudited) (unaudited) (unaudited)
Adjusted Operating Profit
Collections1 34.9 8.2 40.9
Resources & Energy 17.9 4.4 11.8
Specialist Services 1 4.4 2.9 8.2
Group costs (11.8) (5.8) (16.7)
45.4 9.7 44.2
1 The 26-week period ended 25 September 2020 and 52 weeks ended 26 March 2021 has been restated to reflect the Group’s
reorganisation into three divisions: Specialist Services (incorporating Hazardous Waste, IRM, Biffpack and CSG), Collections
(incorporating I&C and Municipal), and R&E.
Segment Adjusted EBITDA represents the profit excluding Adjusting items earned by each segment without allocation of the share of depreciation and amortisation, Adjusting items, the impact of real discount rate changes to landfill provisions, finance costs and income tax expense. Adjusted Operating Profit recognises the impact of depreciation and amortisation excluding the amortisation of acquisition intangibles. These measures are both reported to the Board for the purpose of resource allocation and assessment of segment performance.
As at
24 September
2021 £m
(unaudited)
As at 25
September 2020
£m (unaudited)
As at 26
March 2021
£m (unaudited)
Tangible and other intangible assets
Collections1 341.0 295.0 278.9
Resources & Energy 1 300.6 294.5 296.1
Specialist Services1 54.4 10.9 44.0
Shared services and corporate 87.4 83.1 125.7
783.4 683.5 744.7
1 The 26-week period ended 25 September 2020 and 52 weeks ended 26 March 2021 has been restated to reflect the Group’s
reorganisation into three divisions: Specialist Services (incorporating Hazardous Waste, IRM, Biffpack and CSG), Collections
(incorporating I&C and Municipal), and R&E. As the assets acquired as part of the Viridor transaction have not yet been allocated
internally for the purposes of this report £48.8m of assets have been allocated to Collections division which will be allocated between
Collections and Resources & Energy on completion of the Purchase Price allocation assessment.
26 weeks 26 weeks 52 weeks
ended ended Ended
25 25 26
September September March
2020 2020 2021
£m £m £m
(unaudited) (unaudited) (unaudited)
Capital expenditure
Collections1 19.4 10.0 57.3
Resources & Energy 17.7 7.2 64.1
Specialist Services1 3.4 2.6 47.6
Shared services and corporate 4.5 3.1 9.6
45.0 22.9 178.6

34
1 The 26-week period ended 25 September 2020 and 52 weeks ended 26 March 2021 has been restated to reflect the Group’s
reorganisation into three divisions: Specialist Services (incorporating Hazardous Waste, IRM, Biffpack and CSG), Collections
(incorporating I&C and Municipal), and R&E.
Capital expenditure comprises additions to intangible assets and property, plant and equipment.
26 weeks ended
24 September
2021 £m
(unaudited)
26 weeks ended
25 September
2020 £m
(unaudited)
52 weeks ended
26 March 2021
£m (unaudited)
Depreciation and amortisation
Collections1 26.2 30.2 51.3
Resources & Energy 14.6 14.8 28.9
Specialist Services1 2.9 1.5 2.6
Shared services and corporate 2.2 2.1 4.4
45.9 48.6 87.2
Amortisation of acquisition intangibles 13.1 13.9 27.4
Total 59.0 62.6 114.6
1 The 26-week period ended 25 September 2020 and 52 weeks ended 26 March 2021 has been restated to reflect the Group’s
reorganisation into three divisions: Specialist Services (incorporating Hazardous Waste, IRM, Biffpack and CSG), Collections
(incorporating I&C and Municipal), and R&E.
Depreciation and amortisation relate to the write down of both intangible and tangible fixed assets over their
estimated useful economic lives. Amortisation of acquisition intangibles is disclosed separately in line with the
segmental Adjusted Operating Profit.

35
4. Adjusting Items
26 weeks ended
24 September
2021 £m
(unaudited)
26 weeks ended
25 September
2020 £m
(unaudited)
52 weeks ended
27 March 2021
£m (audited)
Adjusting items:
Acquisition related costs 5.9 0.2 2.0
Onerous contracts (0.1) 12.3 10.3
Asset Impairment 25.0 14.0 21.9
Strategy related costs 1.4 0.9 (0.4)
32.2 27.4 33.8
Impact of real discount rate changes to landfill
provisions 16.8 13.4 20.6
Amortisation of acquisition intangibles 13.1 13.9 27.4
62.1 54.7 81.8
Taxation impact of other items (2.1) (10.3) (18.7)
Depreciation and amortisation relate to the write down of both intangible and tangible fixed assets over their estimated useful economic lives. Amortisation of acquisition intangibles is disclosed separately in line with the divisional Business Adjusted Operating Profit. The Group’s financial performance is analysed into two components, “Adjusted business performance” and “Adjusting items”. Adjusted Business performance is used by management to monitor financial performance as it is considered it aids comparability of the reported financial performance year to year. The Group’s income statement and segmental analysis separately identify a number of Alternative Performance Measures (APMs) in addition to those reported under IFRS. The Directors believe that the presentation of the results in this way, which is not meant to be a substitute for or superior to IFRS measures, is relevant to an understanding of the Group’s business performance trends, financial performance and position. These APMs are also used to enhance the comparability of information between reporting periods and the Group’s divisions, to aid the user in understanding the performance of the business. Our APMs and KPIs are aligned to our strategy and together form the basis of the performance measures for remuneration. Consequently, APMs are consistent with how the business performance is planned and reported internally to the Board and Operating Committees to aid their decision making. Additionally, some of these measures are used for the purpose of setting remuneration targets. The Group’s policy is to exclude items that are considered significant in nature and/or value, not in the normal course of business or are consistent with items that were separately disclosed in prior periods. Treatment as an Adjusting item provides users of the accounts with additional useful information to assess the year-on-year trading performance of the Group. Management utilises an exceptional item framework that has been approved by the Board. This follows a three step process which considers the nature of the event, the financial materiality involved and the particular facts and circumstances. Items of income and expense that are considered by management for designation as Adjusting items include items such as significant corporate restructuring costs, acquisition-related costs, write downs or impairments of non-current assets, movements on onerous contract provisions and strategy-related and restructuring costs. As results excluding adjusted items include the benefits of acquisitions but exclude significant costs (such as significant legal and transaction items) and the amortisation of acquisition related intangibles, they should not be regarded as a complete picture of the Group’s financial performance, which is presented in its total results. The exclusion of other Adjusting items may result in Adjusted Profit after Tax being materially higher or lower than Statutory Profit after tax. In particular, when significant impairments, acquisition and strategy related costs are excluded, Adjusted earnings will be higher than Total earnings. Acquisition related costs Acquisition related costs of £5.9m were incurred in the period to 24 September 2021. Of the £5.9m, £5.1m relates to the acquisition of Syracuse Waste Limited and £0.2m relates to the acquisition of Green Circle (Polymers).

36
Acquisition related costs were immaterial in HY21 as a direct result of the pandemic and the strategic decision to cease all acquisition related activity.
Onerous contracts
Onerous contract costs reflect all movements on 2 historical onerous service contract provisions. The Group
continues to have the below onerous contracts and associated provisions:
Mid-Kent Swale - £6.3m
The contracts with the Mid-Kent Partnership (being Swale, Maidstone & Ashford) have been running at a loss
since delivery began in 2013 and are expected to do so for the remainder of the term (FY24).
Leicester - £14.1m
The 25-year contract with Leicester City Council is expected to be loss-making for the remainder of the contract
term (FY29).
Asset Impairment
The £25m impairment in FY22 relates to the CSG acquisition, see note 7 for further detail. FY21 H1 consisted
of an £8.2m impairment of the Poplars AD plant and £5.8m relating to Project Fusion, the Group’s system
replacement Programme.
Strategy-related costs
Strategy-related costs arise from Group-wide initiatives to reduce the ongoing cost base and improve efficiency
in the business. These costs are substantial in scope and impact, and do not form part of recurring operational
or management activities that the Directors would consider part of our performance excluding Adjusting items.
Adjusting for these charges provides a measure of operating profitability that is comparable over time.
The strategy related costs in HY22 relate to the IT transformation project. In FY21 the programme formerly
known as Project Fusion experienced significant delays as a result of Covid-19 causing previously capitalised
work to become obsolete. Management also reviewed the scope and requirements of the project and a
strategic decision was made to cease the full project and the capitalised costs were written off in the year.
The requirement remains for a full system replacement due to the obsolescence of the current systems. The
costs incurred in HY22 relate to the scoping and planning for the full system replacement programme to
recommence. Board approval exists to complete the project, and the detailed timescale and budgeted costs
will be finalised in H2.
Amortisation of acquisition intangibles
Amortisation of acquisition intangibles represents the amount amortised by the Group in each period in respect
of intangibles from prior acquisitions, the amounts for which are reported separately from the Group’s
depreciation and amortisation charges.
Impact of real discount rate changes to landfill provisions
Impact of real discount rate changes to landfill provisions reflects the impact on provisions which arises wholly
due to the change in discount rate on landfill provisions as this is not reflective of operational performance.
The tax impact of other items is calculated as 19% (19%: 2020) of the expenses allowable in calculating the
taxable profit.

37
26 weeks ended
24 September
2021 £m
(unaudited)
26 weeks ended
25 September
2020 £m
(unaudited)
52 weeks ended
26 March 2021
£m (audited)
Segmental Adjusting items:
Collections1 2.4 7.7 12.0
Resources & Energy 0.1 12.8 55.7
Specialist Services1 25.0
- 1.1
Group costs 4.7 6.9 13.0
32.2 27.4 81.8
1 The 26-week period ended 25 September 2020 and 52 weeks ended 26 March 2021 has been restated to reflect the Group’s
reorganisation into three divisions: Specialist Services (incorporating Hazardous Waste, IRM, Biffpack and CSG), Collections
(incorporating I&C and Municipal), and R&E.
Operating costs excluding Adjusting items have been split into distribution and administration costs as detailed
below:
26 weeks ended
24 September
2021 £m
(unaudited)
26 weeks ended
25 September
2020 £m
(unaudited)
52 weeks ended
26 March 2021
£m (audited)
Operating costs
Distribution costs 12.3 10.1 18.8
Administrative expenses 21.7 14.3 38.6
34.0 24.4 57.4
Administration costs have increased as a result of a return to FY20 operations and the reinstatement of Group bonuses. The HY20 costs reflect the reduction in non essential costs and bonuses as a reaction to Covid-19.
In addition to the Other items disclosed above, the Group uses Return on Operating Assets and return on
capital employed as performance measures. These are aligned to the strategy and are reported internally to
the Board and Operating Committees to aid their decision making. These are calculated as below:
26 weeks ended
24 September
2021 £m
(unaudited)
26 weeks ended
25 September
2020 £m
(unaudited)
52 weeks ended
27 March 2021
£m (audited)
Return on Operating Assets
Adjusted Operating Profit1 79.9 54.5 44.2
Average of Property, Plant and Equipment2 558.5 503.7 545.0
Net working capital3 (60.8) (44.2) (58.8)
Total average of Property, Plant and Equipment plus net working capital
497.7 459.5 486.2
Return on Operating Assets4 16.1% 11.9% 9.1%
1 Profit/(loss) excluding Adjusting items, finance costs and taxation.
2 Average of opening and closing net book value of property, plant and equipment.
3 Average balance in HY22 and HY21 of the closing net of inventories, trade and other receivables, trade and other payables, contract assets and contract liabilities.
4 Return on Operating Assets is determined by Adjusted Operating Profit/(Loss) divided by the average of opening and closing PP&E plus net working capital.
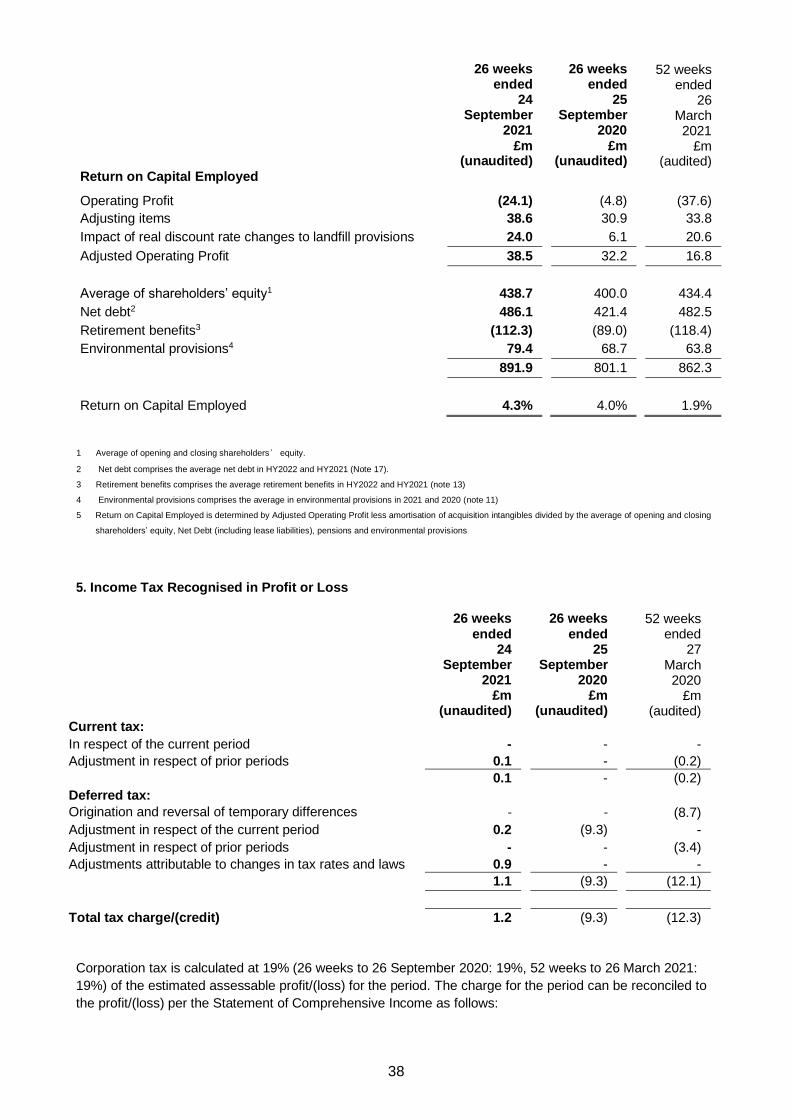
38
26 weeks
ended 24
September 2021
£m (unaudited)
26 weeks ended
25 September
2020 £m
(unaudited)
52 weeks ended
26 March 2021
£m (audited)
Return on Capital Employed
Operating Profit (24.1) (4.8) (37.6)
Adjusting items 38.6 30.9 33.8
Impact of real discount rate changes to landfill provisions 24.0 6.1 20.6
Adjusted Operating Profit 38.5 32.2 16.8
Average of shareholders’ equity1 438.7 400.0 434.4
Net debt2 486.1 421.4 482.5
Retirement benefits3 (112.3) (89.0) (118.4)
Environmental provisions4 79.4 68.7 63.8
891.9 801.1 862.3
Return on Capital Employed 4.3% 4.0% 1.9%
1 Average of opening and closing shareholders’ equity.
2 Net debt comprises the average net debt in HY2022 and HY2021 (Note 17).
3 Retirement benefits comprises the average retirement benefits in HY2022 and HY2021 (note 13)
4 Environmental provisions comprises the average in environmental provisions in 2021 and 2020 (note 11)
5 Return on Capital Employed is determined by Adjusted Operating Profit less amortisation of acquisition intangibles divided by the average of opening and closing
shareholders’ equity, Net Debt (including lease liabilities), pensions and environmental provisions
5. Income Tax Recognised in Profit or Loss
26 weeks ended
24 September
2021 £m
(unaudited)
26 weeks ended
25 September
2020 £m
(unaudited)
52 weeks ended
27 March 2020
£m (audited)
Current tax:
In respect of the current period - - -
Adjustment in respect of prior periods 0.1 - (0.2)
0.1 - (0.2)
Deferred tax:
Origination and reversal of temporary differences - - (8.7)
Adjustment in respect of the current period 0.2 (9.3) -
Adjustment in respect of prior periods - - (3.4)
Adjustments attributable to changes in tax rates and laws 0.9 - -
1.1 (9.3) (12.1)
Total tax charge/(credit) 1.2 (9.3) (12.3)
Corporation tax is calculated at 19% (26 weeks to 26 September 2020: 19%, 52 weeks to 26 March 2021:
19%) of the estimated assessable profit/(loss) for the period. The charge for the period can be reconciled to
the profit/(loss) per the Statement of Comprehensive Income as follows:

39
26 weeks ended
24 September
2021 £m
(unaudited)
26 weeks ended
25 September
2020 £m
(unaudited)
52 weeks Ended
26 March 2021
£m (audited)
(Loss)/Profit on ordinary activities before tax (25.6) (52.5) (52.8)
Profit on ordinary activities before tax multiplied by the
standard rate of corporation tax in the UK of 19% (4.9)
(10.0)
(10.0)
Over provision in respect of prior years - - (3.6)
Expenses not deductible for tax purposes 5.2 0.7 1.4
Non-taxable income - - (0.1)
Adjustments attributable to changes in tax rates
and laws 0.9 - -
Total tax charge/(credit) 1.2 (9.3) (12.3)
Finance Bill 2021 introduced legislation to increase the main rate of UK corporation from 19% to 25%, effective 1 April 2023. As deferred tax assets and liabilities are measured at the rates expected to apply in the period of reversal, the deferred tax balances have been calculated at 25%.
As the Group’s presence is mainly in the UK, we do not envisage a significant impact on the Group following
the decision of the UK Government to invoke Article 50 to leave the EU.
The UK have introduced various stimulus/reliefs for businesses to cope with the impact of CV 19 pandemic.
We will monitor as the details become available for any that may materially impact our future tax charges.

40
6. Earnings per Share
From continuing and discontinued operations
The calculation of the basic and diluted earnings per share is based on the following data:
Earnings
26 weeks ended
24 September
2021 £m
(unaudited)
26 weeks ended
25 September
2020 £m
(unaudited)
52 weeks ended
26 March 2021
£m (audited)
Earnings for the purposes of basic earnings per share
being net profit attributable to owners (26.8) (43.2) (40.5)
Earnings for the purposes of diluted earnings per share (26.8) (43.2) (40.5)
Number of shares
Weighted average number of ordinary shares for the purposes of basic earnings per share
302,486,465 286,242,902 294,645,659
Weighted average number of ordinary shares for the
purposes of diluted earnings per share 310,082,314 294,490,074 301,778,918
Basic earnings per share (pence) (8.9) (15.1) (13.7)
Diluted earnings per share (pence) (8.6) (14.7) (13.4)
From continuing operations
26 weeks
26 weeks
52 weeks
Ended ended Ended 24 25 26
September September March 2021 2020 2021
£m £m £m
(unaudited) (unaudited) (audited)
Net (loss)/profit attributable to equity holders of the parent (26.8) (43.2) (40.5)
(Loss)/Earnings from continuing operations for the purpose
of basic earnings per share excluding discontinued
operations
(26.8) (43.2) (40.5)
(Loss)/Earnings from continuing operations for the
purpose of diluted earnings per share excluding
discontinued operations
(26.8) (43.2) (40.5)

41
7. Goodwill
Total
£m
Goodwill
As at 26 March 2021 224.8
Adjustment to prior period acquisitions (6.3)
Additions (see below) 81.7
As at 24 September 2021 300.2
Accumulated impairment:
As at 26 March 2021 (0.5)
Impairment Charge (25.0)
As at 24 September 2021 (25.5)
Net book amount:
As at 24 September 2021 274.7
As at 26 March 2021 224.3
The adjustment to prior period acquisitions reflects measurement period adjustments in relation to the acquisition of Company Shop Group Limited. This includes an increase in the value of the freehold property of £1.4m and an adjustment to contingent consideration of £5.0m as a result of the post acquisition performance. In addition there is a further measurement period adjustment of £0.1m in relation to the acquisition of the trade and assets of Donald Ward Limited and Camo Ltd (which trades under the name of Simply Waste) which were completed on 1 September 2020 and 8 October 2020 respectively.
Due to the current trading under-performance of Company Shop Group in the Specialist Services division, we have booked an impairment charge of £25m under IAS 36. The CSG value in use model is based upon the following key assumptions. The growth in revenue at stores opened since 2019 is forecasted at higher levels due to the expectation of growing footfall and basket sizes consistent with the levels seen at established stores.
Key growth assumption Sensitivity
Established 6 stores will grow revenue by 10% in FY23
Each 1% of growth not achieved to perpetuity will reduce the value in use by £2.0m
Stores opened since 2019 impacted by the pandemic will grow revenue by 30% in FY23 and a further 7% in FY24
Each 5% of growth not achieved to perpetuity will reduce the value in use by £6.4m
Gross margin will improve by 6 basis points through to FY26
Each 1% of gross margin improvement not achieved to perpetuity will reduce the value in use by £8.3m
When calculating the value in use a discount rate of 8.25% has been applied. An increase in the WACC of 1% would reduce the value in use by £9.9m
8. Acquisitions
On the 25 June 2021, the Group acquired the trade and assets of Green Circle (Polymers) Limited this included a 50,000 tonne capacity Plastics recycling facility (PRF) at Grangemouth in Scotland. This helps to secure feed stock for our Seaham, Redcar and Washington Polymers plants. The intangible factor of goodwill of £6.0m arising from the acquisition of Green Circle (Polymers) reflects the secured feed stock as well as being the only plastics recycling facility in Scotland making it in an ideal position to process the materials collected through Scotland's Deposit Return Scheme (DRS) which comes into force in 2022.
On 31 August 2021, the Group acquired 100% of the share capital of Syracuse Waste Limited and its
subsidiaries. Syracuse Waste Limited is a specially created entity into which Viridor hived down its collections

42
business and certain recycling assets in order to enable the sale. The deal involves the transfer of
approximately 21,000 existing Viridor business waste customers alongside a network of 15 depots across the
UK. The acquisition is in line with the Group's growth strategy and complements the current operations across
the Collections and Resources & Energy divisions.
The intangible factor of goodwill of £66.1m arising from the acquisition of Syracuse Waste Limited reflects the additional national scale of the collections business, in line with the group’s strategy to consolidate the highly fragmented UK I&C collections market and become the leading UK-based integrated waste management business.
The preliminary amounts recognised in respect of the identifiable assets acquired and liabilities assumed are
as set out in the table below.
Green Circle
Syracuse Waste
Preliminary
total
£m £m £m
Property, plant and equipment 3.5 49.3 52.8
Customer lists - - -
Inventory 0.1 0.6 0.7
Financial asset - 30.6 30.6
Trade and other receivables - 17.9 17.9
Trade and other payables - (26.1) (26.1)
Cash 14.2 14.2
Borrowings (0.3) (15.4) (15.7)
Deferred tax liability (0.4) (7.0) (7.4)
Provisions - (8.1) (8.1)
Retirement benefit obligations - - -
Total net assets 2.9 56.0 58.9
Goodwill 6.0 75.7 81.7
Satisfied by:
Cash 5.6 122.1 127.7
Deferred consideration 3.3 9.6 12.9
Contingent cash consideration* - - -
Total consideration 8.9 131.7 140.6
Net cash outflow arising on acquisition:
Cash consideration 5.6 122.1 127.7
Less: cash and cash equivalent balances acquired - (14.2) (14.2)
5.6 107.9 113.5
Given the proximity of the acquisition to the period end, the Group has not yet completed the purchase price allocation exercise for Syracuse Waste Limited. As permitted by IFRS 3 Business Combinations, the fair value of acquired identifiable assets and liabilities have been presented on a provisional basis. The fair value adjustments will be finalised within 12 months of the acquisition date, principally in relation to the valuation of tangible and intangible assets, defined benefit pension schemes and provisions acquired. The cash paid represents the amount paid at 31 August 2021, this is an agreed amount which is expected to be revised based on the effective date balance sheet. The final amount to be paid is due to be agreed by both parties by mid December 2021.
Trade and other receivables had a fair value and a gross contracted value of £17.9m. The best estimate at acquisition date of the contractual cash flows not to be collected was £0.4m. The provisions acquired relate to an existing onerous contract with a long term customer and ongoing legal disputes in relation to an existing customer contract. Due to the nature of these provisions there remains some uncertainty about the amount and timing of these cashflows.
Since acquisition to 24 September 2021, the trade and assets of Green Circle (Polymers) Limited has generated revenues of £1.8m and a loss before tax of £0.1m. Management estimates that the Group’s revenue for HY22 would have been £1.8m higher and the Group’s loss would have been £0.1m greater if the acquisition had taken place on the first day of the financial year.
Since acquisition to 24 September 2021, Syracuse Waste Limited has generated revenues of £10.3m and a profit before tax of £0.6m. Management estimates that the Group’s revenue for HY22 would have been £51.5m higher

43
and the Group’s loss would have been £3.0m lower if the acquisition had taken place on the first day of the financial year. There is no contingent consideration included in the above. On 24 February 2021, the Group acquired 100% of the share capital of Company Shop Limited (CSG). CSG is the UK’s leading and largest re-distributor of surplus food and household products. It prevents waste by identifying surplus produce and then collecting, processing and redistributing it for sale through its unique network of membership-based outlets. Surplus produce includes production overruns, trial products, or produce that has been incorrectly labelled or packaged, which without intervention would be destined to become waste. The Group remains in the measurement period and as permitted by IFRS 3 Business Combinations the fair value of acquired assets and liabilities have been included on a provisional basis. Management are continuing to finalise the purchase price allocation but have reflected an increase in the value of the freehold property of £1.4m and an adjustment to decrease contingent consideration payable of £5.0m as a result of the post acquisition performance. The purchase price allocation exercise will have been completed by 23 February 2022.
Due to the current trading under-performance, we have booked an impairment charge of £25m under IAS 36. This standard does not allow us to take account of future store roll outs in assessing the impairment position on a value in use basis, nor does it distinguish between whether the impairment is considered to be permanent or temporary.
Transaction costs of £5.9m were incurred in the period to 24 September 2021 (25 September 2020: Acquisition-related costs were immaterial). Of the £5.9m, £5.1m relates to the acquisition of Syracuse Waste Limited and £0.2m relates to the acquisition of Green Circle (Polymers). The costs have been reflected in cost of sales Adjusting items as disclosed in note 4.
9. Property, Plant and Equipment
During the 26 weeks ended 24 September 2021, the Group acquired property, plant and equipment including
leased assets, but excluding property, plant and equipment acquired through business combinations, with a
cost of £40.1 million (25 September 2020: £29.9 million).
Assets with a net book value of £0.4 million were disposed of by the Group during the 26 weeks ended 24
September 2021 (25 September 2020: £0.2 million) resulting in an immaterial net profit.
The Group’s capital commitments at 24 September 2021 were £12.7 million (25 September 2020: £28.8
million).
10. Financial Risk Management and Financial Instruments
The Group's activities expose it to a variety of financial risks: market risk (including capital risk management,
cash flow interest rate risk and price risk), credit risk and liquidity risk. The Group’s overall risk management
programmes focus on the unpredictability of financial markets and seek to minimise potential adverse effects
on the Group’s financial performance.
The condensed interim financial statements do not include all financial risk management information and
disclosures set out in the annual report and hence they should be read in conjunction with the Group’s annual
report. There have been no changes in the risk management policies since the year end.
Liquidity risk
The table below analyses financial instruments carried at fair value, by valuation method. The different levels
have been defined as follows:
• Level 1 – Quoted prices (unadjusted) in active markets for identical assets or liabilities
• Level 2 – Inputs other than quoted prices included within level 1 that are observable for the asset or liability,
either directly (that is, as prices) or indirectly (that is, derived from prices)
• Level 3 – Inputs for the asset or liability that are not based on observable market data
There have been no transfers between these categories in either the current or preceding period.
The following table presents the Group’s derivative financial assets and liabilities at fair value at 24 September 2021:

44
Level 1 £m
(unaudited)
Level 2 £m
(unaudited)
Level 3 £m
(unaudited)
Total £m
(unaudited)
Assets/Liabilities)
Derivatives -
(1.1)
-
(1.1)
-
(1.1)
-
(1.1)
The following table presents the Group’s financial assets and liabilities at fair value at 25 September 2020:
Level 1 £m
(unaudited)
Level 2 £m
(unaudited)
Level 3 £m
(unaudited)
Total £m
(unaudited)
Assets/(Liabilities)
Derivatives - (6.5) - (6.5)
- (6.5) - (6.5)
The following table presents the Group’s financial assets and liabilities at fair value at 26 March 2021:
Level 1 £m
(unaudited)
Level 2 £m
(unaudited)
Level 3 £m
(unaudited)
Total £m
(unaudited)
Assets/(Liabilities)
Derivatives - (3.6) - (3.6)
- (3.6) - (3.6)
Fair value measurement
In accordance with IFRS 13, disclosure is required for financial instruments that are measured in the Group
balance sheet at fair value. The fair value of trade and other receivables, cash and cash equivalents,
borrowings and trade and other payables approximates to their carrying amounts.
Valuation techniques and assumptions applied in determining fair values of each class of asset or liability are
consistent with those used as at 26 March 2021 and reflect the current economic environment. The fair value
measurements of the derivatives are classified as Level 2 in the fair value hierarchy as defined by IFRS 13.
11. Provisions
Landfill
restoration &
aftercare £m
Insurance £m
Onerous contract
provisions £m
Other
£m
Total £m
As at 26 March 2021 71.0 10.4 20.5 15.5 117.4
Utilised (2.6) (3.2) (2.0) (0.8) (8.6)
Acquired - - 2.2 6.1 8.3
Impact of change in real discount rate charged to profit and loss account
16.8 - - - 16.8
Charged to profit and loss account 2.1 (0.3) 1.9 1.7 5.4
Unwinding of discount 1.0 - - - 1.0
Transfers from fixed/other assets 2.0 2.1 - - 4.1
As at 24 September 2021 90.3 9.0 22.6 22.5 144.4

45
Provisions have been analysed between current and non-current as follows:
As at 24
September 2021
£m (unaudited)
Current 24.6
Non-current 119.8
144.4
Landfill restoration and aftercare As part of its normal activities, the Group undertakes to restore its landfill sites and to maintain the sites and control leachate and methane emissions from the sites. Provision is made for these anticipated costs. A number of estimate uncertainties affect the calculation, including the impact of regulation, climate change, accuracy of site surveys, transportation costs, and changes in the real discount rate. The provisions incorporate our best estimates of the financial effects of these uncertainties, but future changes in any of these estimates could materially impact the calculation of the provision. Restoration costs are incurred as each site is filled and in the period immediately after its closure. The provision incorporates the best estimate of the financial effect of these uncertainties, but future changes in any of the assumptions could materially impact the calculation of the provision. Maintenance and leachate and methane control costs are incurred as each site is filled and for a number of years post closure. Aftercare costs are incurred as each site is filled and for a number of years post closure. This period can vary significantly from site to site, depending upon the types of waste landfilled and the speed at which it decomposes, the way the site is engineered and the regulatory requirements specific to the site. Changes in the provision arising from revised estimates or discount rates or changes in the expected timing of expenditures that relate to property, plant and equipment are recorded as adjustments to their carrying value and depreciated prospectively over their remaining useful economic lives; otherwise such changes are recognised within the income statement. The associated outflows are estimated to arise over a period of up to 60 years depending on the date of each site closure. In determining the provision, the estimates for future expenditure required to settle the obligation are inflated using longer-term inflation rates, and discounted using the nominal discount rate.
The rates utilised reflect the period of the obligation on a site by site basis which varies between 10 and 60 years.
Long-term aftercare provisions included in landfill restoration and aftercare provisions have been inflated and discounted using the below nominal rates:
Inflation rate Discount rate
Period of obligation As at 24 September
2021
As at 26 March 2021
As at 24 September
2021
As at 26 March 2021
5 years 2.8% 2.1% 1.2% 1.0%
10 years 3.0% 2.4% 1.6% 1.6%
20 years 3.4% 2.8% 2.0% 2.1%
30 years 3.3% 2.7% 2.0% 2.2%
60 years 3.2% 2.7% 1.8% 2.0%

46
Insurance
The associated outflows are estimated to arise over a period of up to five years from the Balance Sheet date.
Dilapidations and Onerous Contracts
Provision for dilapidations was £9.9 million (52 weeks ended 26 March 2021: £8.8 million, 26 weeks ended
26 September 2020: £12.7 million) and £22.6 million (52 weeks ended 26 March 2021: £20.5 million, 26
weeks ended 25 September 2020: £27.7 million) relating to onerous contracts. The associated outflows are
estimated to arise over a period of up to 20 years from the Balance Sheet date

47
12. Cash Flows from Operations
26 weeks ended
24 September
2021 £m
(unaudited)
26 weeks ended
25 September
2020 £m
(unaudited)
52 weeks ended
26 March 2021
£m (audited)
(Loss)/Profit for the period (26.8) (43.2) (40.5)
Adjustments for:
Finance income (1.6) (2.0) (3.2)
Finance charges 10.2 9.1 17.6
Share in joint ventures 0.3 0.4 0.8
Taxation 1.2 (9.3) (12.3)
Operating (loss)/profit (16.7) (45.0) (37.6)
Share based payments - 1.1 3.8
Adjusting items 1.8 - -
Onerous contract provisions 5.4 12.3 33.8
Impairment of assets 25.0 15.1 6.8
Amortisation of intangibles 13.8 18.9 28.6
Pension deficit payments - - (4.0)
Depreciation of property, plant and equipment 45.1 43.6 87.2
Loss/(Profit) on disposal of fixed assets (0.3) 0.2 0.3
Increase in inventories (9.9) (2.5) (2.4)
Decrease/(Increase) in debtors (63.7) 2.1 36.7
Increase in creditors 63.6 16.2 (43.2)
Increase in contingent and deferred consideration - - 9.4
(Increase)/Decrease in financial asset 0.8 (3.7) (5.5)
Increase/(Decrease) in provisions 13.0 10.0 20.6
Total cash generated from operations 77.8 68.3 134.5
Reconciliation of net cash flow to movement in debt
26 weeks
26 weeks
52 weeks
ended Ended ended 24 25 26
September September March 2021 2020 2021
£m £m £m
(unaudited) (unaudited) (audited)
Net (decrease)/increase in cash and cash equivalents 29.6 13.4 (57.0)
Net decrease/(increase) in borrowings (150.8) 101.8 51.4
Net decrease/(increase) in lease liabilities (1.3) - (25.7)
Movement in net debt in the period (122.5) 115.2 (31.3)
Net debt at start of period (498.1) (466.8) (466.8)
Net debt at end of period 620.6 (351.6) (498.1)
Of the EVP preference liability, £6.3m has been included within Adjusted Net Debt as it will be payable to
EVP Preference Shareholders irrespective of the outcome of the EVP dispute. The remainder of £41.3m has
been excluded on the basis that it will only become payable subject to the outcome of the EVP dispute and
will be funded by recovery of funds from HMRC.

48
26 weeks ended
24 September
2021 £m
(unaudited)
26 weeks ended
25 September
2020 £m
(unaudited)
52 weeks Ended
26 March 2021
£m (audited)
Cash and cash equivalents 60.4 101.2 30.8
Finance leases (285.0) (258.1) (283.7)
Bank loans (348.4) (147.1) (197.6)
EVP preference liability (6.3) (6.3) (6.3)
Reported net debt (579.3) (310.3) (456.8)
EVP preference liability (41.3) (41.3) (41.3)
Net debt (620.6) (351.6) (498.1)
Reconciliation of net debt to net debt per banking covenants
26 weeks
26 weeks
52 weeks
ended ended ended 24 25 26
September September March 2021 2020 2021
£m £m £m
(unaudited) (unaudited) (audited)
Net debt (620.6) (351.6) (498.1)
Amortised legal fees (2.6) (2.9) (2.4)
Bray financial asset 7.4 6.7 8.7
Pre-IFRS 16 finance leases 169.6 142.3 171.5
EVP preference liability 47.6 47.6 47.6
(398.6) (157.9) (272.7)
13. Pension and Post Retirement Benefits
Defined benefit schemes
The amounts recognised in the balance sheet are determined as follows:
As at
As at 24 September 26 March
2021 2021 £m £m
(unaudited) (audited)
Present value of funded defined benefit obligation (562.6) (525.8)
Fair value of funded plan assets 684.7 621.6
Adjustment for the restriction in asset benefit (1.1) (1.1)
Adjustment in respect of GMPF Admission agreement 18.0 17.4
Net asset arising from defined benefit obligation 139.0 112.1

49
Reconciliation of opening and closing balances of the present value of the defined benefit obligation
As at 24 September
2021 £m
(unaudited)
Benefit obligation at beginning of period (525.7)
Service cost (1.2)
Interest cost (5.2)
Contributions by plan participants (0.2)
Net remeasurement gains - financial (38.4)
Benefits paid 8.1
Benefit obligation at end of period (562.6)
Reconciliation of opening and closing balances of the fair value of plan assets
As at 24 September
2021 £m
(unaudited)
Fair value of plan assets at beginning of period 621.7
Interest income on scheme assets 6.1
Return on assets, excluding interest income 60.4
Contributions by employers 5.0
Contributions by plan participants 0.2
Benefits paid (8.1)
Scheme administrative cost (0.6)
Fair value of plan assets at end of period 684.7
14. Related Party Transactions
The nature of related parties as disclosed in the consolidated financial statements for the Group as at and for
the 52 weeks ended 26 March 2021 has not changed. Further, there have been no related party transactions
in the 26 weeks to 24 September 2021.
15. Contingent Liabilities
The Group must satisfy the financial security requirements of environmental agencies in order to ensure that
it is able to discharge the obligations in the licences or permits that the Group holds for its landfill sites. The
Group satisfies these financial security requirements by providing financial security bonds. The amount of
financial security which is required is determined in conjunction with the regulatory agencies, as is the method
by which assurance is provided. The Group has existing bond arrangements in England and Wales of
approximately £83.5 million outstanding at 24 September 2021 (26 March 2021: £82.9 million, 25 September
2020: £85.8 million) in respect of the Group's permitted waste activities where the Group has obligations under
the Environment Agency's "fit and proper person" test to make adequate financial provision in order to
undertake those activities. Additionally, the Group has bonds to a value of £15.9 million (26 March 2021: £14.6
million, 25 September 2020: £14.9 million) in connection with security for performance of local authority
contracts and the shipment of waste under the trans-frontier shipment of waste regulations. No liability is
expected to arise in respect of these bonds.
The Group is engaged in a dispute with HMRC in relation to the landfill tax treatment of certain materials used
in the engineering of landfill sites from September 2009 to May 2012, which is fully explained in Note 16.
The Group is also engaged in a dispute with HMRC in relation to the landfill tax treatment of sub-soils with low levels of contamination from asbestos. At the date of signing of the accounts the outcome is not certain, however the Group has received a protective assessment of £8.5m, which has been paid and is included in
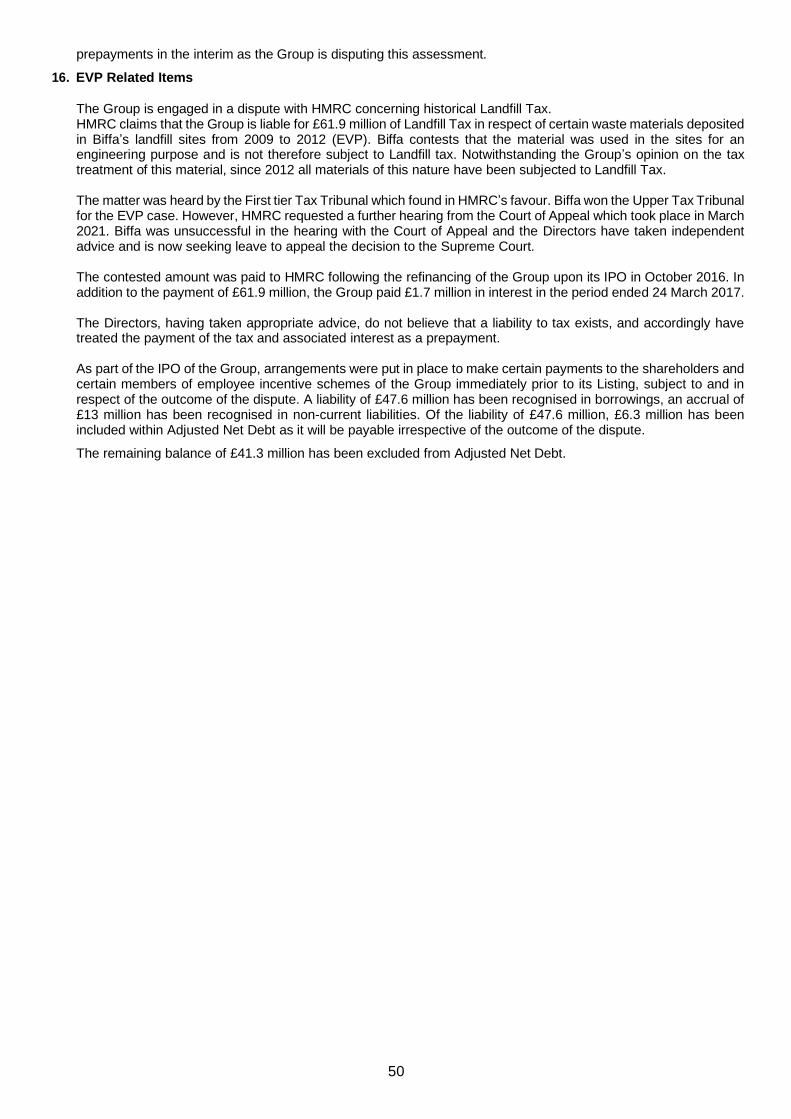
50
prepayments in the interim as the Group is disputing this assessment.
16. EVP Related Items
The Group is engaged in a dispute with HMRC concerning historical Landfill Tax. HMRC claims that the Group is liable for £61.9 million of Landfill Tax in respect of certain waste materials deposited in Biffa’s landfill sites from 2009 to 2012 (EVP). Biffa contests that the material was used in the sites for an engineering purpose and is not therefore subject to Landfill tax. Notwithstanding the Group’s opinion on the tax treatment of this material, since 2012 all materials of this nature have been subjected to Landfill Tax. The matter was heard by the First tier Tax Tribunal which found in HMRC’s favour. Biffa won the Upper Tax Tribunal for the EVP case. However, HMRC requested a further hearing from the Court of Appeal which took place in March 2021. Biffa was unsuccessful in the hearing with the Court of Appeal and the Directors have taken independent advice and is now seeking leave to appeal the decision to the Supreme Court. The contested amount was paid to HMRC following the refinancing of the Group upon its IPO in October 2016. In addition to the payment of £61.9 million, the Group paid £1.7 million in interest in the period ended 24 March 2017. The Directors, having taken appropriate advice, do not believe that a liability to tax exists, and accordingly have treated the payment of the tax and associated interest as a prepayment. As part of the IPO of the Group, arrangements were put in place to make certain payments to the shareholders and certain members of employee incentive schemes of the Group immediately prior to its Listing, subject to and in respect of the outcome of the dispute. A liability of £47.6 million has been recognised in borrowings, an accrual of £13 million has been recognised in non-current liabilities. Of the liability of £47.6 million, £6.3 million has been included within Adjusted Net Debt as it will be payable irrespective of the outcome of the dispute.
The remaining balance of £41.3 million has been excluded from Adjusted Net Debt.