big data in power systems: a statistical approach on
TRANSCRIPT

BIG DATA IN POWER SYSTEMS: A STATISTICAL APPROACH ON
SYNCHROPHASOR APPLICATION
BY
KENTA KIRIHARA
THESIS
Submitted in partial fulfillment of the requirements
for the degree of Master of Science in Electrical and Computer Engineering
in the Graduate College of the
University of Illinois at Urbana-Champaign, 2015
Urbana, Illinois
Adviser:
Professor Peter W. Sauer

ii
ABSTRACT
Phasor Measurement Units (PMUs) are regarded as one of the most valuable device on the power system.
PMUs, being devices that are found on buses of the power system, are capable of supplying both detailed
and broad situational information.
The data produced by PMUs, which are synchronized by GPS timing, are referred to as synchrophasor
data, and have plethora of information about the power system that has traditionally not been observed.
The general trend in the use of synchrophasor data is offline, such as model validation and post-event
analysis.
This thesis aims to provide a significantly different approach in the synchrophasor usage. Rather than
considering synchrophasor data as extra sensor data that allows for enhancement of models, this thesis
treats synchrophasor data as a type of big data, and utilizes statistical methods to find solutions and
insight to synchrophasor data. The chapters of this thesis start with applying statistical methods to offline
usage, and continue to consider statistical methods in real-time application.

iii
ACKNOWLEDGMENTS
I would like to acknowledge many people for making this research possible. It was in June 2012 that
PhD student, and retired Army Colonel, Karl Reinhard brought me into the synchrophasor effort
sponsored by Professor Peter W. Sauer and TCIPG. Words are not sufficient to express my gratitude to
Karl, as he is the one who let me start this endeaver and develop all the engineering intuition I have right
now. I also greatly appreciate Professor Sauer for his support and the degree of freedom in studying the
research he has provided me throughout both of my degrees. From TCIPG, I would like to thank Tim
Yardley and Jeremy Jones for providing me with the necessary research resources, and Al Valdes for
providing me with some insight on statistical methods.
There are many others I would like to thank from industry. I thank Jim Kleitsch from American
Transmission Company for providing the data for this research as well as giving me in for an internship
during my undergraduate degree; Brett Amidan for allowing me to use his application for the beginning
part of my research and providing support for statistics concepts; and Dr. Yutaka Kokai for allowing me
to intern at Hitachi America Big Data Labs where I was able to develop a wider view on the issue.
Lastly, I would like to thank my family for their support while I worked toward earning this degree.

iv
CONTENTS
CHAPTER 1: INTRODUCTION ................................................................................................................. 1
1.1 Background ......................................................................................................................................... 1
1.2 Thesis Overview ................................................................................................................................. 4
CHAPTER 2: SYNCHROPHASOR DATA AND RESOURCES ............................................................... 5
2.1 Synchrophasor Data Description ........................................................................................................ 5
2.2 Resources ............................................................................................................................................ 7
2.2.1 ATC Synchrophasor Data Archive .............................................................................................. 7
2.2.2 Windows Machines ..................................................................................................................... 8
2.2.3 26-Node Hadoop Cluster ............................................................................................................. 9
CHAPTER 3: PRELIMINARY SIGNATURE DETECTION ................................................................... 10
3.1 Baselining Approach ......................................................................................................................... 11
3.2 High-Performance Clustering Technique ......................................................................................... 13
3.3 Drawbacks......................................................................................................................................... 16
CHAPTER 4: SYNCHROPHASOR VISUALIZER .................................................................................. 17
4.1 SPV Overview .................................................................................................................................. 17
4.2 SPV Data Retrieval ........................................................................................................................... 18
4.3 SPV Data Processing ........................................................................................................................ 19
4.3.1 Fast Fourier Transform ............................................................................................................. 19
4.3.2 Moving Distribution-based Anomaly Detection (MDAD) ....................................................... 19
4.4 SPV Visualization ............................................................................................................................. 21
CHAPTER 5: EXTENDED WORK ........................................................................................................... 25
5.1 Data Quality Issues ........................................................................................................................... 25
5.1.1 Pair-Wise Correlation in the PMU Data .................................................................................... 25
5.1.2 Data Re-Creation from Multi-Variate Model ............................................................................ 27
5.1.3 PMU Security and Data Correction ........................................................................................... 30
5.2 Future Work ...................................................................................................................................... 30
CHAPTER 6: CONCLUSION.................................................................................................................... 32
REFERENCES ........................................................................................................................................... 33

1
CHAPTER 1: INTRODUCTION
1.1 Background
The U.S. Power System is perhaps one of the most robust and interconnected system in the world. With
3092 generators interconnected through many iterations of transmission lines and transformers [1], each
having an embedded control and multiple centralized control per subsystem, the complexity, resources,
time, and man-power exerted on the system is unarguably one of the most significant systems built by
humans. The reliability provided by this system is far beyond that of any other everyday social
infrastructure utilized: one expects a loss of signal in a mobile device; one expects a loss of
communication in internet usage; one expects a delay in transportation; however, one does not expect a
loss of electricity. Electricity service provided by the U.S. Power System is developed to a point at which
the quality of the service became a social norm: no other infrastructure has achieved this state of
operation in the span of a century.
The fundamental challenge in the power system is due to this developed social norm for the reliability.
Electricity supply is reliable at this point; however, changes in methods of generation and increase in load
make it difficult to maintain this reliability to the social norm. The social demand for renewable energy
adds variability to system stability [2]. Meanwhile, the demand for electricity continues to increase over
the years [3]. In parallel to all of these factors, the aging of components in the power system also adds to
the complexity of this challenge. These factors combined propose the challenge to this issue.
The task is how to overcome this fundamental challenge of the system. One method is to add extra modes
of controllability to the system. This however, is not often the issue in the modern power grid, as many
devices are controllable. The concern exists in the observability of the system, both in wide area and
single point granularity. Together, these are referred to as wide area situational awareness (WASA) in the
power system [4]. The lack of WASA, as a matter of fact, is one of the primary causes of the Northeast
blackout of 2003 [5]; the state estimator did not provide sufficient and correct information about the
power grid, and thus caused a chain reaction to occur throughout the grid [6]. The affected region can be
seen in Figure 1.1.

2
Figure 1.1: Affected region for Northeast blackout [6]
Devices and systems that allow WASA are referred to as the Wide Area Measurement System (WAMS).
One of the most critical devices within WAMS is a Phasor Measurement Unit (PMU). PMU is a device
that measures and creates phasor representation of the voltage and current on an AC system with a
synchronized timestamp at 30 to 60 Hz [7]. The data created is often referred as synchrophasor data. The
benefits that PMUs bring about are the following: (1) the synchronized timestamp allows the exact
observation at each observation point at a given time and (2) high-frequency reporting of phasor data
allows for granularity of information and allows behavior that have traditionally been unobservable to be
seen. As a result, many entitites have installed PMUs into their systems, as shown in Figure 1.2.
However, with benefits, PMUs bring about challenges related to data. According to calculations done by
Hitachi, each PMU in a system produces a minimum of 80 GB of synchrophasor data per year [9]. Given
a system with 100 PMUs, the data produced is over 8 TB per year. Along with the 30 Hz reporting rate,
the analysis of the synchrophasor data is definitely a type of big data analysis. With the bandwidth of
synchrophasor data and the static nature of the power system, seeking meaningful data out of the stream is
no elementary task. To accomplish such a feat requires significant resources, manpower, and knowledge
in several fields such as, but not limiting to, power system dynamics, statistics, and computer science.

3
Figure 1.2: PMU deployment in North American power grid [8]
The limiting reagent causing deferment in the advancement of synchrophasor analysis is the
disconnection between the above factors. Power system experts, such as operations engineers, often lack
the time and computational resources preferable to advance analysis of the synchrophasor data. Since
PMU data is only a segment of the operations engineer’s duties and responsibilities, difficulty exists in
dedicating time into cost-inefficient modes of analysis. Meanwhile, those with computational resources
and duties dedicated for data analysis, often lack the accesss to the data itself due to the proprietarity of
the data in power systems.
In order to investigate effective and meaningful ways to utilize synchrophasor data, the University of
Illinois at Urbana-Champaign (UIUC), through the funding of Trust-worthy Cyber Infrastructure for
Power Grid (TCIPG), has signed a NDA with American Transmission Company (ATC) for usage of ATC
archive synchrophasor data. The thesis overviews the major efforts made in identifying the challenges and
solutions in synchrophasor usage from a statistical perspective.

4
1.2 Thesis Overview
In this thesis, statistical techniques will be applied to synchrophasor Big Data to seek a way to overcome
some of the challenges in usage of the data. First and foremost, background on data structure and
resources available for this research is discussed in Chapter 2. In Chapter 3, preliminary signature
detection is presented. Chapter 4 presents a specific Java application of synchrophasor. Chapter 5
discusses the extended work that foresees developments beyond the other chapters. Finally, Chapter 6
provides a conclusion.

5
CHAPTER 2: SYNCHROPHASOR DATA AND RESOURCES
2.1 Synchrophasor Data Description
Before further discussion is made, it is important to understand the concept of synchrophasors. As briefly
mentioned in the introduction, synchrophasor data is a time-synchronized form of voltage and current
measurements. What this entails is shown in Figure 2.1.
Figure 2.1: Phasor representation [10]
In the respective figure, the sinusoidal waveform (left) is representative of the raw voltage (or current)
measurement sampled at a very high frequency for a 30th of a second. From this waveform of the length
of a 30th of a second, the magnitude of the waveform and a phase of the waveform with respect to a 60 Hz
signal is calculated. The resultant operation creates a phasor representation of the waveform during this
time window shown on the right. Along with this operation, the frequency of the waveform is calculated
by processing the waveform to a Fourier domain. The respective phasors for voltage and current as well
as frequency are timestamped by the end of the 30th of a second. The operation is repeated for each phase.
In the end, each synchrophasor contains the metrics shown in Table 2.1.

6
Table 2.1: All metrics to each synchrophasor
Voltage
Magnitude
Voltage
Angle
Current
Magnitude
Current
Angle
Frequency Timestamp
Phase A ----- ----- ----- -----
-----
----- Phase B ----- ----- ----- -----
Phase C ----- ----- ----- -----
These 17 metrics, together are referred as one synchrophasor at a given location and time. Due to the time
window being a 30th of a second, naturally, these synchrophasors are generated at 30 times per second at a
particular location by a PMU.
How this synchrophasor data flows throughout the network is shown in Figure 2.2. First, synchrophasors
are generated at each PMU. The synchrophasors from several PMUs are then reported to a Phasor Data
Concentrator (PDC), and then to the control center and archives. Finally, the synchrophasor is reported to
the regional entitity’s PDC. The whole process is done in a continuous stream to provide a real-time
informatic of the system from each PMU location.
Figure 2.2: Synchrophasor flow map
Regional PDC (Super PDC)
Control Center/Archive
1
PDC
PMU PMU PMU
PDC
Control Center/Archive
2

7
2.2 Resources
To conduct this research, appropriate resources are necessary. The resources available for research are the
following:
20 TB of ATC Synchrophasor Data Full Archive
2 Intel i7 Quad-Core Windows Machines
1 Intel i7 Dual-Core OSX Machine
26-Node Hadoop Cluster
The description of each resource will be discussed individually in detail.
2.2.1 ATC Synchrophasor Data Archive
As the primary resource to this project, 20 TB of ATC synchrophasor data archive is located on an
OSIsoft PI server. The OSIsoft PI server is a SQL-based relational database [11]. Since synchrophasor
data is a high-frequency time series data, it is likely stored in either one long table, or many long tables.
One possible storage mode of these data in the server itself is shown in Table 2.1.
Table 2.2: Possible table for synchrophasor storage
Timestamp Metric Value PMU Location
Time A Voltage Magnitude Phase B ----- Somewhereville
Time A Voltage Magnitude Phase C ----- Somewhereville
Time A Voltage Magnitude Phase A ----- Hereville
Time A Voltage Magnitude Phase B ----- Hereville
Time A Voltage Magnitude Phase C ----- Hereville
Time A Frequency ----- Hereville
Essentially, for each new timestamp, synchrophasor data is divided into 17 different rows, and stored
individually. As this is a basic structure for a relational database, it is highly plausible that the data is
organized in this fashion or similar to where each PMU location can be a different long table. However,
8
unlike open-source databases, such as mySQL, the PI server does not reveal the physical—in this case
physical in a digital sense—structure of the database. To avoid the possible uncertainty of the database
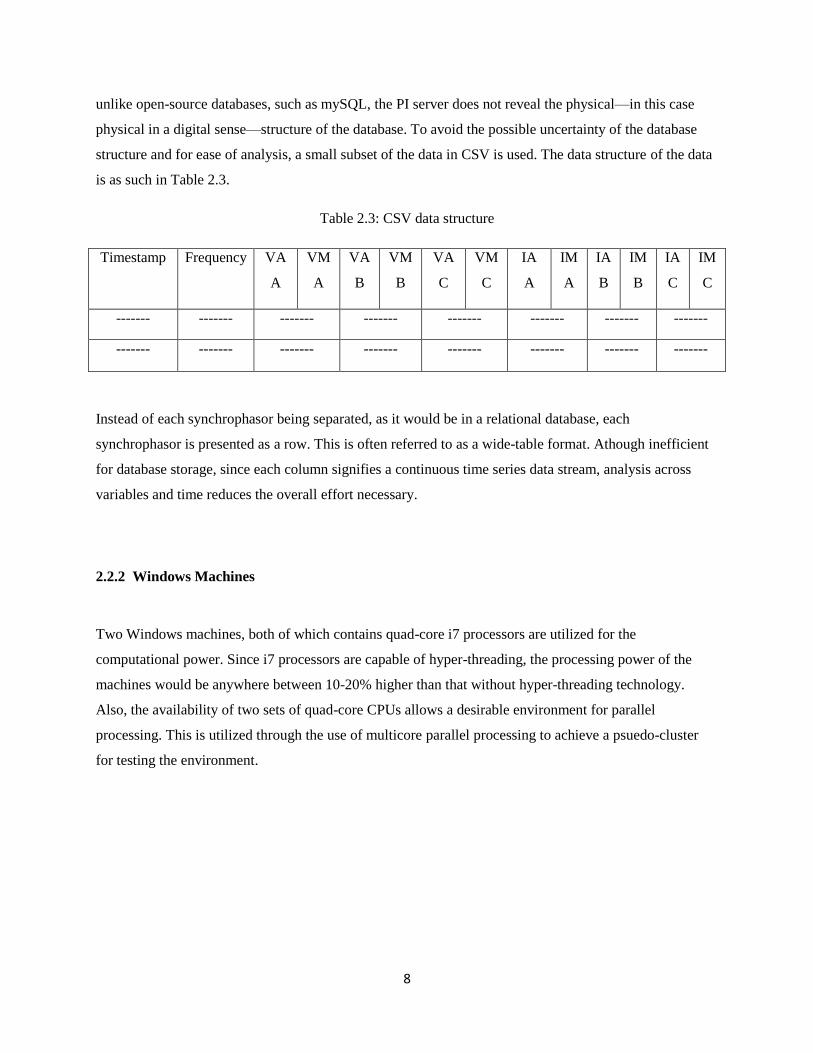
structure and for ease of analysis, a small subset of the data in CSV is used. The data structure of the data
is as such in Table 2.3.
Table 2.3: CSV data structure
Timestamp Frequency VA
A
VM
A
VA
B
VM
B
VA
C
VM
C
IA
A
IM
A
IA
B
IM
B
IA
C
IM
C
------- ------- ------- ------- ------- ------- ------- -------
------- ------- ------- ------- ------- ------- ------- -------
Instead of each synchrophasor being separated, as it would be in a relational database, each
synchrophasor is presented as a row. This is often referred to as a wide-table format. Athough inefficient
for database storage, since each column signifies a continuous time series data stream, analysis across
variables and time reduces the overall effort necessary.
2.2.2 Windows Machines
Two Windows machines, both of which contains quad-core i7 processors are utilized for the
computational power. Since i7 processors are capable of hyper-threading, the processing power of the
machines would be anywhere between 10-20% higher than that without hyper-threading technology.
Also, the availability of two sets of quad-core CPUs allows a desirable environment for parallel
processing. This is utilized through the use of multicore parallel processing to achieve a psuedo-cluster
for testing the environment.

9
2.2.3 26-Node Hadoop Cluster
As a precaution and preparation for when more computational power is necessary, access to a 26-node
Hadoop cluster was granted from TCIPG. However, due to the simplicity of the task that can be done on
Hadoop, which is marginally more complex than a SQL command, the platform was available mainly as a
final effort for processing data.

10
CHAPTER 3: PRELIMINARY SIGNATURE DETECTION
One of the most promising functionalities of synchrophasor data is the time series signature that can be
generated. Unlike the traditional SCADA system, the higher reporting rate of the system allows for
“patterns” to be recognized in the system. Figure 3.1 shows one example of such a pattern that was
observed on the Dominian system. SCADA system was able to identify an issue with the power output
out of the generator, however, was unable to identify the full “picture.” Such a phenomenon is caused by
the SCADA system’s reporting frequency, which is far below that of the power system event frequency;
meanwhile, synchrophasors are capable of reporting much higher than the Nyquist frequency of known
system events, so these “signatures” can be observed.
Figure 3.1: Twelve-minute oscillation at a nuclear power plant [12]
The work presented in this chapter is adapted from “Investigating Synchrophasor Data Quality Issues”
from IEEE Xplore publication presented at Power and Energy Conference at Illinois 2014 at Champaign,
IL authored by Kenta Kirihara, Karl E. Reinhard, Andy K. Yoon, and Peter W. Sauer [13].

11
This chapter puts emphasis on finding signatures from the large scale of synchrophasor data using
preliminary and advanced analysis in the R-project statistical analysis program (R). R is an open-source
program optimized for statistical application. Due to R being a direct successor to the S-language, which
is C-based, a wide range of analysis can be done. If necessary, additional packages can be downloaded or
scripted with C, C++, or Fortran to extend the functionality. R is chosen over other programming
languages such as Python, C++, or Java in this analysis due to the flexibility that is available.
As a guideline to this search for signature detection, ATC proposed several possible events analysis
categories:
Unit trips and/or loss of significant loads
System fault
Capacitor bank failures
Predecessor events to trips
Imbalanced line phase angle differences
By searching for these signatures in the synchrophasor data, the validity of using a data-driven approach
is confirmed. Signatures are confirmed with ATC archive information to link the signature.
3.1 Baselining Approach
As a way to understand the baseline behavior of the system, principal statistical values of the time-series
data are computed. Since computation time is non-linear, a particularly small section is used. Shown in
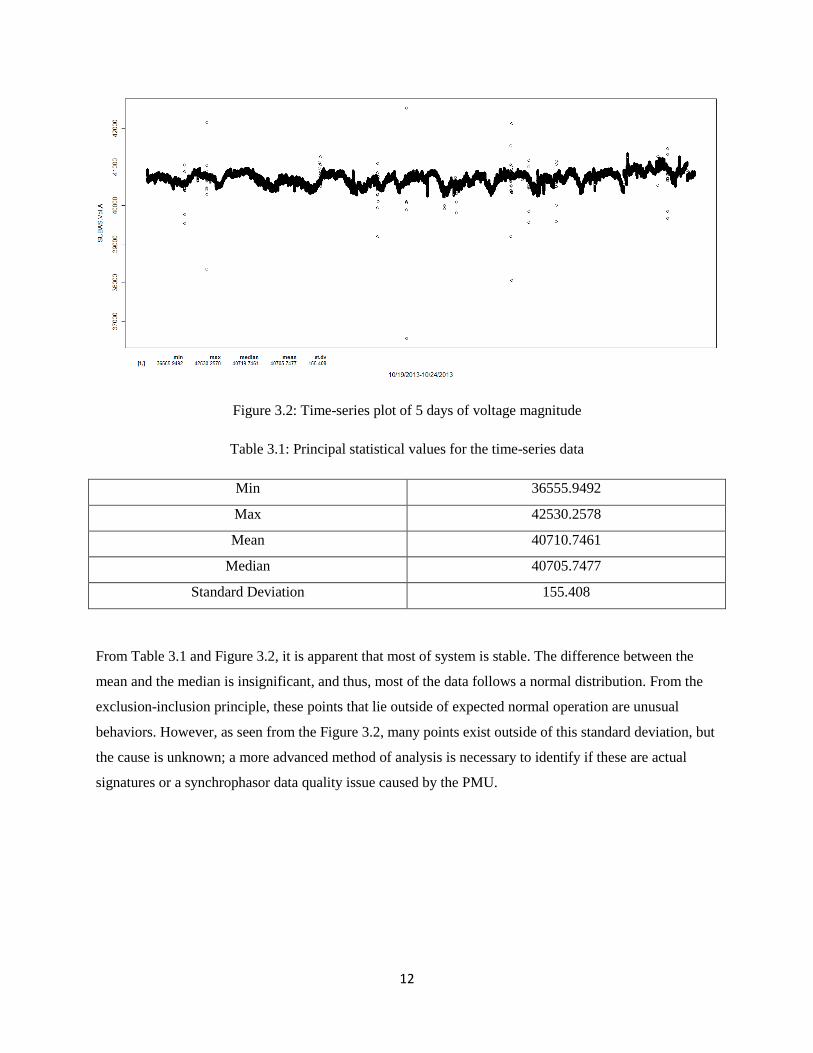
Figure 3.2 is an extraction of 5 days of phase voltage magnitude for a particular substation. The principal
statistical values are shown in Table 3.1.
12
Figure 3.2: Time-series plot of 5 days of voltage magnitude
Table 3.1: Principal statistical values for the time-series data
Min 36555.9492
Max 42530.2578
Mean 40710.7461
Median 40705.7477
Standard Deviation 155.408
From Table 3.1 and Figure 3.2, it is apparent that most of system is stable. The difference between the
mean and the median is insignificant, and thus, most of the data follows a normal distribution. From the
exclusion-inclusion principle, these points that lie outside of expected normal operation are unusual
behaviors. However, as seen from the Figure 3.2, many points exist outside of this standard deviation, but
the cause is unknown; a more advanced method of analysis is necessary to identify if these are actual
signatures or a synchrophasor data quality issue caused by the PMU.

13
3.2 High-Performance Clustering Technique
Situational Awareness and Alerting Report (SitAAR) is a big data analysis tool develped by Brett Amidan
at Pacific Northwest National Laboratory (PNNL). Using k-means clustering methods, and other
preprocessing to clean the data, the tool allows signatures to be clustered together and outliers to be found
[14]. In other words, the tool allows a separation of system events by comparing them to different modes
of system operation.
In detail, SitAAR first divides the time series into one-minute intervals and adds a quadratic model to the
interval. The one-minute interval, which equates to 1800 PMU data points assuming a 30 Hz-reporting
rate, allows for robust analysis. As of October 2013, ATC system has 92% of the PMUs delivering 99.9%
reliable data with a 99.9% success rate [15]. Using this data and averaging all of the PMUs, the expected
value of reliable data per PMU is 1600 data points per minute: an accurate quadratic regression can be
made with this number of points. This allows the tool to recognize the pattern of the interval such as
gradual change or sudden changes in the reported value, in quadratic model parameters. The parameters
of each model is used to signify a point on an n-dimensional space to determine which cluster the interval
belongs to.
Since most of the power system is rather static, with AVR applying a gradual change in voltage, the
number of clusters the analysis needs is rather arbitrary. In practice, when considered different modes of
operation, the following cases can be considered:
1. System is operating within the standard deviation
2. System is operating at peak capacity or on low demand
3. System is shifting from one operating to another or in transience
Taking into consideration these cases, it is trivial that case 3 is the one that would fall into an outlier. To
account for several different modes of case 1 and 2, the number of clusters SitARR would generate was
set to 30.
Figure 3.3 shows one of the results that SitAAR was able to capture in the data. This particular instance, a
line trip was found through the current magnitude data. The event is captured due to the high atypicality
score of the interval.

14
Figure 3.3: Found signature (left) and atypicality score (right)
Similarly, SitAAR was able to identify several other types of signatures in the system as shown in Figures
3.4, 3.5, and 3.6. In Figures 3.4 and 3.5, the same event is captured through different metrics in the data:
one being current magnitude and other being frequency. Since current flow is interrupted on a line during
a line trip, when the line is restored, the current flow is also restored. This sudden change in behavior has
been detected through the current flow changing across the system and frequency of the system at the
point of measurement to alter.
Figure 3.4: Another example of a line trip

15
Figure 3.5: SitAAR detecting frequency disturbance in the same event as Figure 3.4
Figure 3.6: Voltage magnitude capturing another line trip
Figure 3.6, shows the voltage magnitude data capturing another line trip. From pattern recognition or the
signature detection use case, which SitAAR is responsible for, finding signatures through the use of
voltage magnitude, current magnitude, and frequency measurements indicate that the use of voltage and
current magnitudes are the more reliable ways of finding faults.

16
3.3 Drawbacks
The use of SitAAR was effective in finding signatures in the system. However, major drawbacks exist in
extending to a more dynamic use case. It is undeniable that the k-means clustering technique is effective
in finding the signatures in a system when used in an offline case. The problem exists in the physical
limitation in computation. With a data size of 20 GB, which was approximately the size of the data that
was used for the preliminary test, the time necessary for computation was approximately 12 hours with
one i-7 Windows machine. To process 20 TB of the data using the same exact hardware would take a
minimum of 1000 times, or 18 months assuming a linear processing time.
First, having a program executing for 18 months is an implausible task, and it is apparent from common
experience that most operating systems are incapable of being able to run for such an extent without
resetting. Second, the amount of RAM necessary to keep the clustered data would quickly deplete, and
virtual RAM will be required. The memory swapping necessary will impact the CPU overhead, and thus,
cause a larger process to complete at a nonlinear time.
Using the exact same method online, as in clustering streaming data, would again lead to the same issues
regarding physical hardware. The k-means centroid would be fairly static, but the overhead necessary to
keep track of these centroid maybe expensive. For a practical usecase, such as online usage or large-scale
analysis of the whole archive data, a more efficient and dynamic algorithm for signature detection is
necessary.
17
CHAPTER 4: SYNCHROPHASOR VISUALIZER1
Online usage, otherwise referred to as “real-time” usage, is one of the two end goals of synchrophasor
technology. The October 2014 North American Synchro Phasor Initiative (NASPI) identified the status of
the synchrophasor development in North America. Out of the 13 entities listed in the NASPI Recovery
Act Smart Grid Investments Synchrophasor Project Status, WECC is the only entity which has
successfully implemented all of the applications of synchrophasors, both in real-time and study mode
application as of the summer of 2014 [16]. Many of the projects are still in research stage, and have yet to
be implemented. As mentioned in the introduction, the fundamental challenge with the synchrophasor
effort is the lack of designated engineers solely working on the synchrophasor task. Oftentimes, these
engineers are expert engineers from both operations and system planning, but the problem lies in the
possible time commitment of these engineers. Though Smart Grid Initiative funds and their efforts in
terms of resources, the human resources necessary for the tasks are vastly lacking.
To remedy this challenge and to simulate an environment where statistical methods can be implemented,
a baseline application in which entities can build upon is proposed. Synchrophasor Visualizer (SPV) is a
Java-based application that covers the essential functionality of the synchrophasor network. Akthough
called “Synchrophasor Visualizer”, to experiment with statistical methods, SPV puts more emphasis on
the data processing than the visualization.
4.1 SPV Overview
Figure 4.1 shows the functional design of the SPV. Data is fed in through two sources, either from a live
stream or through a database; however, the functionality of SPV does not differ between the two modes of
operation: archived data is played back as if the data is streamed. Once the data is secured in the program,
the data is utilized in two ways: visualization of raw information and event detection. The two sections
work independently and are displayed upon user control.
The work presented in this chapter is adapted from “Synchrophasor visualizer” from IEEE Xplore
publication presented at Power and Energy Conference at Illinois 2015 at Champaign, IL authored by
Kenta Kirihara, Karl E. Reinhard, Yang Liu, and Peter W. Sauer [17].

18
Figure 4.1: SPV functional design
In Figure 4.1, the program design of SPV is shown. In SPV, the most essential task is to visualize data
continuously. That is, data should be processed in such a way that the continuous stream of information is
uninterrupted. To accomplish this, the program is divided into four different processes:
Data retrieval
Data processing
Data visualization
User control
The concept is elementary in modular programming. Creating independent sections allows for multiple
tasks to be processed independently of each other. However, increase in the number of parallel processing
brings about challenges when handling data stream of synchrophasors. In the process of building SPV, it
is essential to understand the nature of threads in general. Any task that requires a query will benefit from
having more threads and opposed to computation to require less threads. SPV is a combination of these
two types of operations and thus utilizes both a task requiring more threads and another that requires
fewer threads through the use of Java programming.
4.2 SPV Data Retrieval
As with any program, data retrieval is an essential functionality in bringing data into the system. In the
data retrieval block of the SPV, two modes of operation are present: one where data is streamed from a

19
PDC and one where data is queried from a database and played back. The switching between the two
modes is user controlled.
4.3 SPV Data Processing
In this process, data processing and computation is executed. Data processing takes on two roles: one is to
stream the data into the section and the other is to analyze the data to send the result to the visualization
block. There are two separate types of computation that are executed in parallel. One is a Fast Fourier
Transform (FFT) and another is an anomaly detection through a variation of one-dimensional moving
distribution. Both are tasks that require less thread and more dedicated CPU core.
4.3.1 Fast Fourier Transform
FFT is an algorithm in which time-series data can be converted into a Fourier domain. Conceptually, from
a Big Data perspective, the transformation from time-series domain to Fourier domain is similar to
quadratic regression. The algorithm is relatively computationally inexpensive, and is suited for running in
real-time. FFT is utilized to capture an oscillation that may occur in the power system: as this is a fairly
common method of detecting oscillation, this feature is left in the back-end. Since oscillation is fairly
uncommon in a power system, except for the case of wind farms [18], this feature will not be used as
heavily.
In SPV, 3000 data points of synchrophasor voltage magnitude for one phase are collected and an FFT is
performed after zero-padding. The advantage of using this many points is that it allows a detection of
slower frequency oscillation by having many data points to reference. If an oscillation were to be
detected, a signal is sent to the visualization process.
4.3.2 Moving Distribution-based Anomaly Detection (MDAD)
The core of the processing in the synchrophasor data is in moving distribution-based anomaly detection
(MDAD). This process is a one-dimensional version of k-means clustering detection through the
20
combination of rule-based statistical methods. First, the latest 3000 points, or 100 seconds of
synchrophasor voltage measurement data is collected. The mean and the standard deviation of the data
points are calculated. The calculation is repeated for every new data point that enters the system. If more
than three latest data points lie beyond four standard deviations from the mean, then an alarm is triggered.
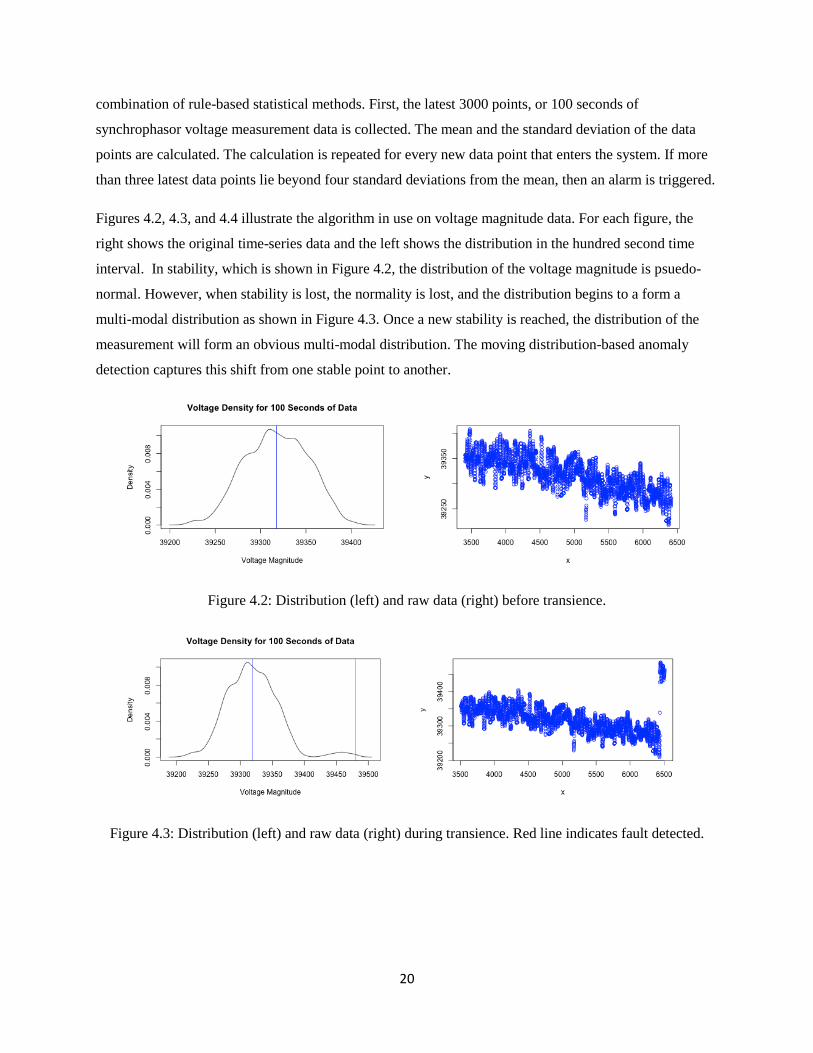
Figures 4.2, 4.3, and 4.4 illustrate the algorithm in use on voltage magnitude data. For each figure, the
right shows the original time-series data and the left shows the distribution in the hundred second time
interval. In stability, which is shown in Figure 4.2, the distribution of the voltage magnitude is psuedo-
normal. However, when stability is lost, the normality is lost, and the distribution begins to a form a
multi-modal distribution as shown in Figure 4.3. Once a new stability is reached, the distribution of the
measurement will form an obvious multi-modal distribution. The moving distribution-based anomaly
detection captures this shift from one stable point to another.
Figure 4.2: Distribution (left) and raw data (right) before transience.
Figure 4.3: Distribution (left) and raw data (right) during transience. Red line indicates fault detected.

21
Figure 4.4: Distribution (left) and raw data (right) after transience.
The advantage of this algorithm is the computational efficiency that is brought along. As opposed to an
FFT, which is in itself light, MDAD only computes low-level operations that can be processed in simple
programs. For instance, computing the result for one hour of data in Excel consumes less than half a
minute.
Testing of this algorithm’s effectiveness was performed on several cases identified beforehand through
SitAAR. As mentioned in the previous section, SitAAR is very effective in identifying events, and
suitable for comparison. Table 4.1 summarizes the type of event and the effectiveness of the MDAD
compared to SitAAR. As shown, MDAD yields effectiveness, which matches the k-means clustering
method to find an outlier or system event.
4.4 SPV Visualization
By default, data is visualized as shown in Figure 4.5. On top of a Google Map API, PMU locations are
added. Each circle on the map represents a PMU location. Selecting a PMU will reveal the real-time
measurements of voltage magnitude and angle.
When an overview is necessary, using the buttons on the upper-right corner, the user is able to choose
whether the voltage magnitude or voltage angle is mapped out using a gradient map for immediate wide-
area system awareness as in Figure 4.6. Like with the concept of one-line diagrams, the voltage
magnitude at each point is normalized to a per-unit convention. By doing such operation, the operator is
able to observe the relative voltage levels at each section of the map instantaneously. Also, when a system
event is found through the data processing section, the event is displayed as in Figure 4.7 to signify the
user where the fault is located.

22
The visualization is mapped out and refreshed at a rate of 10 Hz. There are two reasons why this is done.
First, since opinions from operators revealed that excess information are non-preferable, the refresh rate is
set lower to accommodate such demands [19]. Second is to reduce the computational stress on the
machine so more threads can be utilized for analysis.
Table 4.1: Effectiveness of MDAD
Substation Time Measurement
Type
Suspected Cause MDAD
Effectiveness
SUBA 0013-06-03 12:59 PA-IM Load Change Effective
SUBA 0013-06-03 12:59 PB-IM Load Change Effective
SUBA 0013-06-03 12:59 PC-IM Load Change Effective
SUBA 0013-06-03 14:16 FR Unknown Effective
SUBA 0013-06-03 14:16 PA-IM Line Trip Effective
SUBA 0013-06-03 14:16 PB-IM Line Trip Effective
SUBA 0013-06-03 14:16 PC-IM Line Trip Effective
SUBA 0013-06-03 14:16 PA-VM Line Trip Effective
SUBA 0013-06-03 14:16 PB-VM Line Trip Effective
SUBA 0013-06-03 14:16 PC-VM Line Trip Effective
SUBA 0013-06-04 02:16 PA-VM Line Trip Effective
SUBA 0013-06-04 02:16 PB-VM Line Trip Effective
SUBA 0013-06-04 02:16 PC-VM Line Trip Effective
SUBAY 0013-10-31 06:08 PA-VM Double Capacitor Switching Effective
SUBBJ 0013-10-31 21:08 PA-VM Capacitor Bank Switching In & Out Effective

23
Figure 4.5: SPV default page
Figure 4.6: SPV gradient

24
Figure 4.7: SPV detecting fault

25
CHAPTER 5: EXTENDED WORK
The ultimate goal of synchrophasor usage is to combine all aspects, both online usage and offline usage
into an application such as SPV. When considering real-usage, there will be edge cases that come about
that must be considered. Furthermore, the capabilities of the application may need to be extended. This
chapter will discuss the next step of synchrophasor usage, considering the edge cases not discussed in the
previous chapters.
5.1 Data Quality Issues
In the previous chapter, where real-time usage was discussed, the issue with data quality was not
considered. With regards to data quality, several cases must be considered:
Case 1: Data is correct and available.
Case 2: Data is incorrect and available.
Case 3: Data is unavailable.
Case 1 is an ideal case, and further processing or handling of the data is unnecessary. Case 2 is when data
is faulty due to measurement, networking, or vulnerability issues. Case 3 is a special case of case 2.
When considering cases 2 and 3, several actions can be taken. One action is to omit the faulty data for
analysis; another is to correct the data; and the last action is to recover data. Depending on the situation,
different combinations of the method can be used. From a data usage standpoint, however, the three
methods are fundamentally equal, and can be derived from the correlation of the data.
5.1.1 Pair-Wise Correlation in the PMU Data
When events are captured on a synchrophasor data, it is extremely rare for one PMU only to capture the
event. This is due to the inherent correlation that exists in the synchrophasor data. Figures 5.1 to 5.3 show
the pair-wise correlation of each metric for 7 PMUs.

26
Figure 5.1: Pair-wise correlation of synchrophasor data (voltage magnitude)
Figure 5.2: Pair-wise correlation of synchrophasor data (voltage angle)

27
Figure 5.3: Pair-wise correlation of synchrophasor data (frequency)
The pair-wise correlation listed in Figures 5.1-5.3 show an important aspect in synchrophasor data. Those
with high correlation form a linear relationship with each data. For example from this specific sample
dataset, it is apparent that PMU locations x1r to x3r and x5r are highly correlated, and others are not.
Conceptually, these PMUs observe the same location in the power system and are semi-redundant.
In a paper presented by Wang, Chow, et al., method of data recovery is discussed using a singular value
decomposition and matrix re-creation [20]. For ease of discussion, this will be referred to as the RPI
method for data re-creation in this thesis. However, instead of using singular value decomposition, the
pair-wise correlation from the previous figures show that the use of multivariate linear models is another
valid method for re-creating data. Using a combination of MDAD and the use of correlation models, an
alternate approach to correcting and re-creating missing data is proposed.
5.1.2 Data Re-Creation from Multi-Variate Model
As one method of data re-creation, a multi-variate statistical model is utilized. The concept between the
RPI method and the multi-variate model is similar. The RPI method essentially uses matrix
transformation to solve for a system of differential equation, and recover the missing data based on

28
present surrounding data. The multi-variate model approach is very similar to the RPI method; with
difference being the way the relationship between the data is described.
Consider the case where data from one or more PMUs are lost due to some error or fault in the
communication system. Surrounding PMUs in the system are still available and assumed to be correct. In
a multi-variate model, the missing PMU parameters are expressed as a linear model of other PMU
parameters.
The specific steps taken to re-create the missing data are as follows:
1. A multi-variate linear model for each parameter is created based on pre-data loss relationship.
2. A model is reduced using the Akaike Information Criterion (AIC).
3. A multi-variate model is utilized to re-create missing data.
To test this method, a set non-defective synchrophasor data from seven different locations were utilized.
Masking and removing certain sections of data, the residual data was used to conduct the above method.
Figures 5.4, 5.5, and 5.6 show a sample re-creation of missing data.
Figure 5.4: Voltage magnitude data re-creation (line indicates re-created data, points indicate simulated
missing data) with 0.01957% average residual error

29
Figure 5.5: Frequency data re-creation (line indicates re-created data, points indicate simulated missing
data) with 0.000327% average residual error
Figure 5.6: Phase data re-creation (line indicates re-created data, points indicate simulated missing data)
with 0.0232% average residual error
The respective error for each metric is as shown in the figures. As shown in the Figures 5.1 to 5.3, those
with relatively high correlation yield a lower residual error. The question still remains whether the
residual error is more accurate than the state estimation or RPI method.
30
The multi-variate model method does propose a few benefits over the RPI method. As opposed to the RPI
method, data can be processed linearly and in real-time. Since the statistical model has to be created
before the re-creation of the data, there is an initial cost to the computation. However, every consecutive
loss in data can be recovered with the same amount of time as the previous ones since it is a one-way
function. When recovering larger amounts of data, the linear computation time definitely brings about
benefits compared to the RPI method.
5.1.3 PMU Security and Data Correction
Using the combination of the statistical methods in this thesis; correlation, MDAD, and multi-variate
model, it is plausible to detect and correct faulty or spoofed PMU measurement data.
Consider the following case. A PMU on a particular system has been injected with significant false data
to attack the system. This can be either spoofing the GPS as presented in [21] or simply modifying
measurement with some other form of cyber-attack to the PMU. Such action is taken to jeopordize the
validation of security based on PMU measurements [22] or simply to disturb wide-area situational
awareness. Regardless of the intention, PMU location is assumed to be under a cyber-attack, and is
assumed to be inaccurate.
Under this situation, the pair-wise correlation and MDAD can be observed to determine whether the data
has been tampered with. When MDAD observes an anomaly, but only in one PMU; other highly
correlated PMU does not detect within a reasonable propagation delay; it can be assumed that the data at
that point has been tampered with. To correct this data, the multi-variate model can be utilized.
5.2 Future Work
Although available, one tool that was not utilized during the research was the 26-node Hadoop cluster.
This is due to the fact that Hadoop has certain drawbacks that make it difficult to perform complex
analysis. In other words, leveraging the clustering method presented in Chapter 3 directly is a difficult
task that cannot be performed with ease.

31
However, the next step that is done would be to utilize MDAD and k-means clustering to characterize
power system behavior into signatures through the use of the historical archive. Specifically, what must
be done is to use MDAD on Hadoop to filter static behavior of the synchrophasor data, and categorize
different signatures to each power system event using the k-means clustering.
The roadmap to extend the work presented in this thesis is as follows:
1. Categorize synchrophasor signatures.
2. Embed the functionalities of Chapter 5.1 and synchrophasor signature categorization to SPV.
3. Extend UI capabilities of SPV.
4. Develop an adaptive algorithm to further enhance all features presented in this thesis.
Following this roadmap and creating a more feature-rich version of the SPV is the immediate future work
that is necessary.

32
CHAPTER 6: CONCLUSION
With over a decade of synchrophasor technology available to the industry, time is quickly approaching for
synchrophasor applications to reach the control room. Whether the method is centralized or distributed,
utilizing the myriad of synchrophasor data is a feature that is necessary in the further advancement of
synchrophasor deployment. Upon doing so, the use of statistical methods is favorable. Since statistics is
one of the methods to emulate the way of a human mind, while organizing data in a mathematical way, it
is beneficial in aiding the operation of the present power system.
There are two forms of synchrophasor applications that can be developed. One that acts as a replacement
to the current SCADA software and another that is stand-alone which enhances the operation done by
SCADA presently. The work presented here in the paper is a basis of the latter which uses a data-driven
approach rather than a physical model based approach, which has been traditionally used in the industry.
Production of an application, which would essentially be the ultimate form for SPV, would be such
application that defines uniqueness in an industry that is model based.
The work presented in this thesis should ideally give insight to implementing these statistical methods to
actual systems. Beginning with the elementary methods to look at the data structure, advanced statistical
methods and real-time usage scenarios were considered to propose the computational and functional
challenges of implementing statistics into synchrophasor application. Due to reasons that are not
discussed naturally when considering synchrophasor usage, statistical methods in synchrophasor
application is a challenge that still needs more effort to make reality.
Although work has been done in this paper, further work can also be implemented to investigate a more
complete form of such application. Such include, but not limited to, the more efficient use of
computational cores and distributed platform, research on an artificial intelligence, more efficient
detection algorithm, and perhaps more advanced ways to visualize material leveraging different statistical
methods.

33
REFERENCES
[1] U.S. Energy Information Association, "Electric Power Annual 2013," Washington, D.C., 2015.
[2] National Renewable Energy Laboratory, "NREL: Transmission Grid Integration - Frequency
Response," 2014. [Online]. Available:
http://www.nrel.gov/electricity/transmission/frequency_response.html
[3] U.S. Energy Information Association, "Electricity data browser," 2015. [Online]. Available:
http://www.eia.gov/electricity/data/browser
[4] S. Matsumoto, et al., "Wide-area situational awareness (WASA) system based upon international
standards," Developments in Power Systems Protection, DPSP 2012. 11th International
Conference on, pp. 1, 6, April 23-26 2012.
[5] J. E. Chadwick, "How a smarter grid could have prevented the 2003 U.S. cascading blackout,"
Power and Energy Conference at Illinois (PECI), 2013 IEEE, pp. 65, 71, Feb. 22-23 2013
[6] NERC Steering Group, "Technical Analysis of the August 14, 2003, Blackout: What Happened,
Why, and What Did We Learn?," North American Electric Reliability Council, Princeton, NJ,
2015.
[7] A. Phadke, “Synchronized phasor measurements in power systems,” Computer Applications in
Power, IEEE, vol. 6, no. 2, pp. 10–15, April 1993.
[8] North American Synchro Phasor Initiative, "Phasor measurement units and synchrophasor data
flows in the North American power grid" presented at March 2015, North American Synchro
Phasor Initiative Work Group Meeting, 2015.
[9] Hitachi Ltd., "Realization of big data platform for PMU to improve control center," presented at
March 2015, North American Synchro Phasor Initiative Work Group Meeting, 2015.
[10] Consortium for Electric Reliability Technology, "Phasor Advanced FAQ," 2015. [Online].
Available: http://www.phasor-rtdms.com/phaserconcepts/phasor_adv_faq.html.
[11] Osisoft. "PI Data Access," 2015. [Online]. Available: http://www.osisoft.com/software-
support/products/PI_Data_Access.aspx
[12] A. Silverstein, K. Thomas, J. Kleitsch, "Using synchrophasor data to diagnose equipment mis-
operations and health," presented at October 2014, North American Synchro-Phasor Initiative
(NASPI) Work Group Meeting, Houston, Texas, Oct. 22, 2014 [Online]:
https://www.naspi.org/site/Module/Meeting/Forms/Export/ExportAttachments.aspx?meetingid=3
27
[13] K. Kirihara, K. E. Reinhard, A. K. Yoon, P. W. Sauer, "Investigating synchrophasor data quality
issues," in Power and Energy Conference at Illinois (PECI), 2014, pp. 1, 4, Feb. 28-March 1
2014.

34
[14] A. Brett. "Baselining studies and analyses," presented at 2013 Transmission Reliability Program
Peer Review, Washington, D.C., 27 June 2013 [Online]. Available:
http://energy.gov/sites/prod/files/2013/07/f2/2013TRR-2Amidan.pdf
[15] J. Kleitsch, "Smart grid investment grant update," presented at October 2013, North American
Synchro Phasor Initiative Work Group Meeting, Rosemont, IL, Oct 22-24 2013. [Online].
Available: https://www.naspi.org/File.aspx?fileID=1177
[16] K. Kirihara, K. E. Reinhard, Y. Liu; P. W. Sauer, "Synchrophasor visualizer," in Power and
Energy Conference at Illinois (PECI), 2015 IEEE , pp. 1, 4, Feb. 20-21, 2015
[17] North American Synchro Phasor Initiative, "Recovery act smart grid investments synchrophasor
project status," June 2014 [Online]. Available:
https://www.smartgrid.gov/sites/default/files/synchrophasor project status 061014-1.pdf
[18] Y. Wan, "Synchronized phasor data for analyzing wind power plant dynamic behavior and model
validation," U.S. Department of Energy, Oakridge, TN, 2013. [Online]. Available:
http://www.nrel.gov/docs/ fy13osti/57342.pdf
[19] J. Obradovich, "NASPI phasor tools visualization workshop: A quick summary," Atlanta, 2012.
[Online]. Available: http://www.nerc.com/pa/rrm/hp/
2012%20Human%20Performance%20Conference/NASPI%20Viz% 20Workshop%20Summary
NERC%20HP JHObradovich.pdf
[20] M. Wang, J. H. Chow, et al., "A low-rank matrix approach for the analysis of large amounts of
power system synchrophasor data," System Sciences (HICSS), 2015 48th Hawaii International
Conference on, pp. 2637, 2644, 5-8 Jan. 2015.
[21] X. Jiang, J. Zhang, B. J. Harding, J.J. Makela, A. D. Dominguez-Garcia, "Spoofing GPS receiver
clock offset of phasor measurement units," Power Systems, IEEE Transactions on, vol. 28, no. 3,
pp. 3253, 3262, Aug. 2013.
[22] Y. V. Makarov, et al., "PMU-based wide-area security assessment: Concept, method, and
implementation," Smart Grid, IEEE Transactions on, vol. 3, no. 3, pp. 1325, 1332, Sept. 2012.