big data is not about the data! - harvard...
TRANSCRIPT

Big Data is Not About the Data!
Gary King1
Institute for Quantitative Social ScienceHarvard University
(Talk at Golden Seeds Boston 6/20/2013)
1GaryKing.org1 / 12
The Data In Big Data (about people)
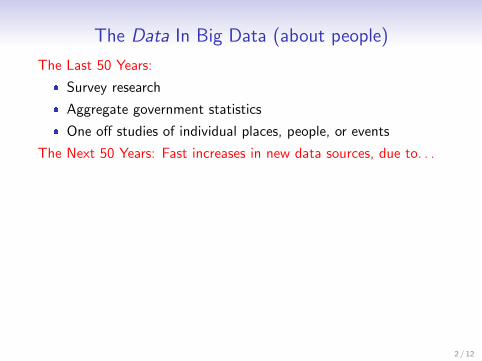
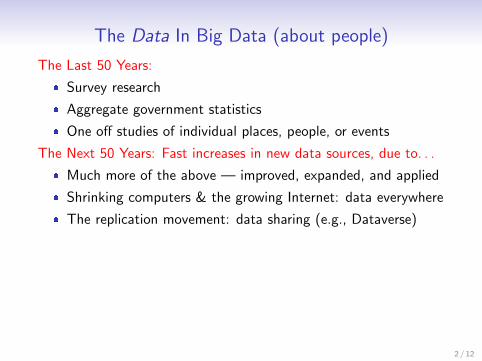
The Last 50 Years:
� Survey research
� Aggregate government statistics
� One off studies of individual places, people, or events
The Next 50 Years: Fast increases in new data sources, due to. . .
� Much more of the above — improved, expanded, and applied
� Shrinking computers & the growing Internet: data everywhere
� The replication movement: data sharing (e.g., Dataverse)
� Governments encouraging data collection & experimentation
� Advances in statistical methods, informatics, & software
� The march of quantification: through academia, professions,government, & commerce (SuperCrunchers, The Numerati,MoneyBall)
2 / 12

The Data In Big Data (about people)
The Last 50 Years:
� Survey research
� Aggregate government statistics
� One off studies of individual places, people, or events
The Next 50 Years: Fast increases in new data sources, due to. . .
� Much more of the above — improved, expanded, and applied
� Shrinking computers & the growing Internet: data everywhere
� The replication movement: data sharing (e.g., Dataverse)
� Governments encouraging data collection & experimentation
� Advances in statistical methods, informatics, & software
� The march of quantification: through academia, professions,government, & commerce (SuperCrunchers, The Numerati,MoneyBall)
2 / 12

The Data in Big Data: Examples
1. Unstructured text: emails, speeches, reports, social mediaupdates, web pages, newspapers, scholarly literature, productreviews
2. Commerce: credit cards, sales, real estate transactions, RFIDs
3. Geographic location: cell phones, Fastlane, garage cameras
4. Health information: digital medical records, hospitaladmittances, accelerometers & other devices in cell phones
5. Biological sciences: genomics, proteomics, metabolomics,imaging producing numerous person-level variables
6. Satellite imagery: increasing in scope & resolution
7. Electoral activity: ballot images, precinct-level results,individual-level registration, primary participation, campaigncontributions
8. Web surfing artifacts: clicks, searches, and advertisingclickthroughs, multiplayer games, virtual worlds
9. > 90% of all data ever created was created last year
3 / 12
The Data in Big Data: Examples1. Unstructured text: emails, speeches, reports, social media
updates, web pages, newspapers, scholarly literature, productreviews
2. Commerce: credit cards, sales, real estate transactions, RFIDs
3. Geographic location: cell phones, Fastlane, garage cameras
4. Health information: digital medical records, hospitaladmittances, accelerometers & other devices in cell phones
5. Biological sciences: genomics, proteomics, metabolomics,imaging producing numerous person-level variables
6. Satellite imagery: increasing in scope & resolution
7. Electoral activity: ballot images, precinct-level results,individual-level registration, primary participation, campaigncontributions
8. Web surfing artifacts: clicks, searches, and advertisingclickthroughs, multiplayer games, virtual worlds
9. > 90% of all data ever created was created last year
3 / 12

The Data in Big Data: Examples1. Unstructured text: emails, speeches, reports, social media
updates, web pages, newspapers, scholarly literature, productreviews
2. Commerce: credit cards, sales, real estate transactions, RFIDs
3. Geographic location: cell phones, Fastlane, garage cameras
4. Health information: digital medical records, hospitaladmittances, accelerometers & other devices in cell phones
5. Biological sciences: genomics, proteomics, metabolomics,imaging producing numerous person-level variables
6. Satellite imagery: increasing in scope & resolution
7. Electoral activity: ballot images, precinct-level results,individual-level registration, primary participation, campaigncontributions
8. Web surfing artifacts: clicks, searches, and advertisingclickthroughs, multiplayer games, virtual worlds
9. > 90% of all data ever created was created last year3 / 12

The Value in Big Data: the Analytics
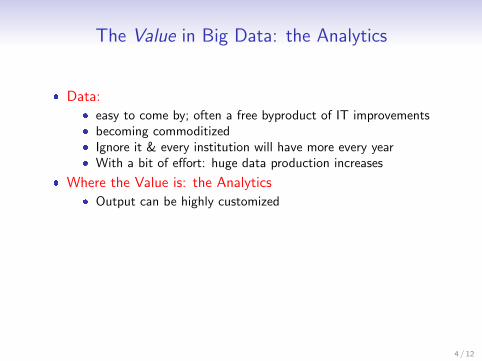
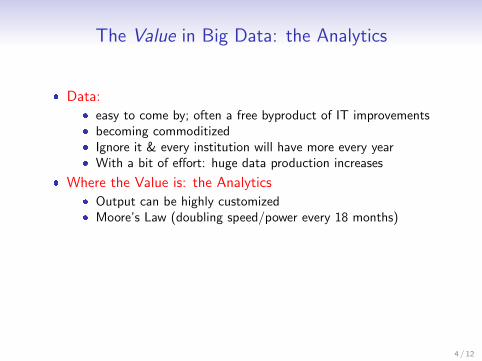
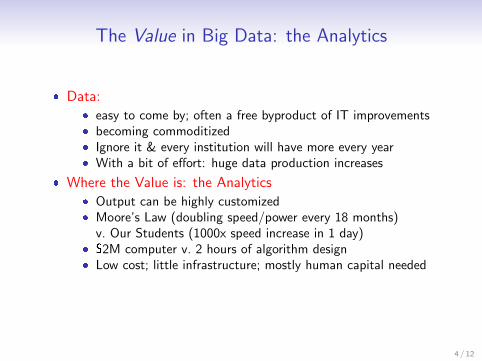
� Data:
� easy to come by; often a free byproduct of IT improvements� becoming commoditized� Ignore it & every institution will have more every year� With a bit of effort: huge data production increases
� Where the Value is: the Analytics
� Output can be highly customized� Moore’s Law (doubling speed/power every 18 months)
v. Our Students (1000x speed increase in 1 day)
� $2M computer v. 2 hours of algorithm design� Low cost; little infrastructure; mostly human capital needed� Innovative analytics: enormously better than off-the-shelf
4 / 12

The Value in Big Data: the Analytics
� Data:� easy to come by; often a free byproduct of IT improvements
� becoming commoditized� Ignore it & every institution will have more every year� With a bit of effort: huge data production increases
� Where the Value is: the Analytics
� Output can be highly customized� Moore’s Law (doubling speed/power every 18 months)
v. Our Students (1000x speed increase in 1 day)
� $2M computer v. 2 hours of algorithm design� Low cost; little infrastructure; mostly human capital needed� Innovative analytics: enormously better than off-the-shelf
4 / 12

The Value in Big Data: the Analytics
� Data:� easy to come by; often a free byproduct of IT improvements� becoming commoditized
� Ignore it & every institution will have more every year� With a bit of effort: huge data production increases
� Where the Value is: the Analytics
� Output can be highly customized� Moore’s Law (doubling speed/power every 18 months)
v. Our Students (1000x speed increase in 1 day)
� $2M computer v. 2 hours of algorithm design� Low cost; little infrastructure; mostly human capital needed� Innovative analytics: enormously better than off-the-shelf
4 / 12

The Value in Big Data: the Analytics
� Data:� easy to come by; often a free byproduct of IT improvements� becoming commoditized� Ignore it & every institution will have more every year
� With a bit of effort: huge data production increases
� Where the Value is: the Analytics
� Output can be highly customized� Moore’s Law (doubling speed/power every 18 months)
v. Our Students (1000x speed increase in 1 day)
� $2M computer v. 2 hours of algorithm design� Low cost; little infrastructure; mostly human capital needed� Innovative analytics: enormously better than off-the-shelf
4 / 12

The Value in Big Data: the Analytics
� Data:� easy to come by; often a free byproduct of IT improvements� becoming commoditized� Ignore it & every institution will have more every year� With a bit of effort: huge data production increases
� Where the Value is: the Analytics
� Output can be highly customized� Moore’s Law (doubling speed/power every 18 months)
v. Our Students (1000x speed increase in 1 day)
� $2M computer v. 2 hours of algorithm design� Low cost; little infrastructure; mostly human capital needed� Innovative analytics: enormously better than off-the-shelf
4 / 12
The Value in Big Data: the Analytics
� Data:� easy to come by; often a free byproduct of IT improvements� becoming commoditized� Ignore it & every institution will have more every year� With a bit of effort: huge data production increases
� Where the Value is: the Analytics� Output can be highly customized
� Moore’s Law (doubling speed/power every 18 months)
v. Our Students (1000x speed increase in 1 day)
� $2M computer v. 2 hours of algorithm design� Low cost; little infrastructure; mostly human capital needed� Innovative analytics: enormously better than off-the-shelf
4 / 12
The Value in Big Data: the Analytics
� Data:� easy to come by; often a free byproduct of IT improvements� becoming commoditized� Ignore it & every institution will have more every year� With a bit of effort: huge data production increases
� Where the Value is: the Analytics� Output can be highly customized� Moore’s Law (doubling speed/power every 18 months)
v. Our Students (1000x speed increase in 1 day)� $2M computer v. 2 hours of algorithm design� Low cost; little infrastructure; mostly human capital needed� Innovative analytics: enormously better than off-the-shelf
4 / 12

The Value in Big Data: the Analytics
� Data:� easy to come by; often a free byproduct of IT improvements� becoming commoditized� Ignore it & every institution will have more every year� With a bit of effort: huge data production increases
� Where the Value is: the Analytics� Output can be highly customized� Moore’s Law (doubling speed/power every 18 months)
v. Our Students (1000x speed increase in 1 day)
� $2M computer v. 2 hours of algorithm design� Low cost; little infrastructure; mostly human capital needed� Innovative analytics: enormously better than off-the-shelf
4 / 12

The Value in Big Data: the Analytics
� Data:� easy to come by; often a free byproduct of IT improvements� becoming commoditized� Ignore it & every institution will have more every year� With a bit of effort: huge data production increases
� Where the Value is: the Analytics� Output can be highly customized� Moore’s Law (doubling speed/power every 18 months)
v. Our Students (1000x speed increase in 1 day)� $2M computer v. 2 hours of algorithm design
� Low cost; little infrastructure; mostly human capital needed� Innovative analytics: enormously better than off-the-shelf
4 / 12
The Value in Big Data: the Analytics
� Data:� easy to come by; often a free byproduct of IT improvements� becoming commoditized� Ignore it & every institution will have more every year� With a bit of effort: huge data production increases
� Where the Value is: the Analytics� Output can be highly customized� Moore’s Law (doubling speed/power every 18 months)
v. Our Students (1000x speed increase in 1 day)� $2M computer v. 2 hours of algorithm design� Low cost; little infrastructure; mostly human capital needed
� Innovative analytics: enormously better than off-the-shelf
4 / 12

The Value in Big Data: the Analytics
� Data:� easy to come by; often a free byproduct of IT improvements� becoming commoditized� Ignore it & every institution will have more every year� With a bit of effort: huge data production increases
� Where the Value is: the Analytics� Output can be highly customized� Moore’s Law (doubling speed/power every 18 months)
v. Our Students (1000x speed increase in 1 day)� $2M computer v. 2 hours of algorithm design� Low cost; little infrastructure; mostly human capital needed� Innovative analytics: enormously better than off-the-shelf
4 / 12

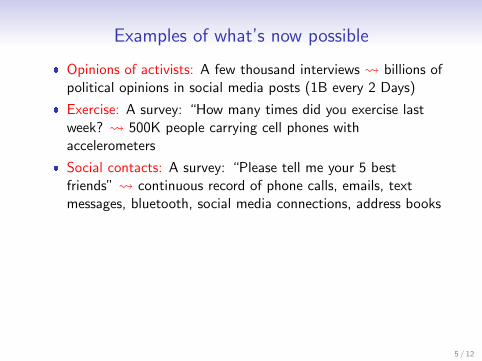
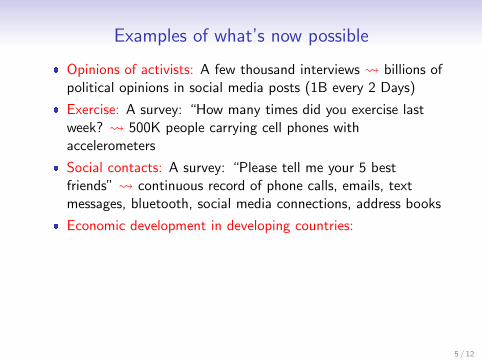
Examples of what’s now possible
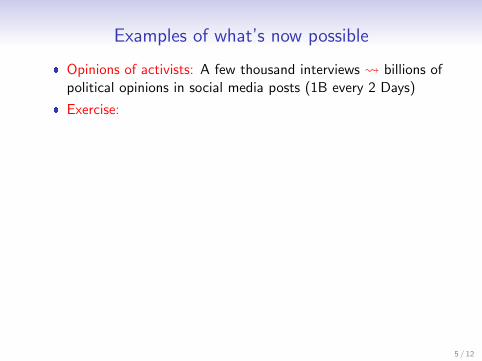
� Opinions of activists:
A few thousand interviews billions ofpolitical opinions in social media posts (1B every 2 Days)
� Exercise:
A survey: “How many times did you exercise lastweek? 500K people carrying cell phones withaccelerometers
� Social contacts:
A survey: “Please tell me your 5 bestfriends” continuous record of phone calls, emails, textmessages, bluetooth, social media connections, address books
� Economic development in developing countries:
Dubious ornonexistent governmental statistics satellite images ofhuman-generated light at night, road networks, otherinfrastructure
� Many, many, more. . .
� In each: without new analytics, the data are useless
5 / 12

Examples of what’s now possible
� Opinions of activists: A few thousand interviews
billions ofpolitical opinions in social media posts (1B every 2 Days)
� Exercise:
A survey: “How many times did you exercise lastweek? 500K people carrying cell phones withaccelerometers
� Social contacts:
A survey: “Please tell me your 5 bestfriends” continuous record of phone calls, emails, textmessages, bluetooth, social media connections, address books
� Economic development in developing countries:
Dubious ornonexistent governmental statistics satellite images ofhuman-generated light at night, road networks, otherinfrastructure
� Many, many, more. . .
� In each: without new analytics, the data are useless
5 / 12

Examples of what’s now possible
� Opinions of activists: A few thousand interviews billions ofpolitical opinions in social media posts (1B every 2 Days)
� Exercise:
A survey: “How many times did you exercise lastweek? 500K people carrying cell phones withaccelerometers
� Social contacts:
A survey: “Please tell me your 5 bestfriends” continuous record of phone calls, emails, textmessages, bluetooth, social media connections, address books
� Economic development in developing countries:
Dubious ornonexistent governmental statistics satellite images ofhuman-generated light at night, road networks, otherinfrastructure
� Many, many, more. . .
� In each: without new analytics, the data are useless
5 / 12

Examples of what’s now possible
� Opinions of activists: A few thousand interviews billions ofpolitical opinions in social media posts (1B every 2 Days)
� Exercise: A survey: “How many times did you exercise lastweek?
500K people carrying cell phones withaccelerometers
� Social contacts:
A survey: “Please tell me your 5 bestfriends” continuous record of phone calls, emails, textmessages, bluetooth, social media connections, address books
� Economic development in developing countries:
Dubious ornonexistent governmental statistics satellite images ofhuman-generated light at night, road networks, otherinfrastructure
� Many, many, more. . .
� In each: without new analytics, the data are useless
5 / 12

Examples of what’s now possible
� Opinions of activists: A few thousand interviews billions ofpolitical opinions in social media posts (1B every 2 Days)
� Exercise: A survey: “How many times did you exercise lastweek? 500K people carrying cell phones withaccelerometers
� Social contacts: A survey: “Please tell me your 5 bestfriends”
continuous record of phone calls, emails, textmessages, bluetooth, social media connections, address books
� Economic development in developing countries:
Dubious ornonexistent governmental statistics satellite images ofhuman-generated light at night, road networks, otherinfrastructure
� Many, many, more. . .
� In each: without new analytics, the data are useless
5 / 12
Examples of what’s now possible
� Opinions of activists: A few thousand interviews billions ofpolitical opinions in social media posts (1B every 2 Days)
� Exercise: A survey: “How many times did you exercise lastweek? 500K people carrying cell phones withaccelerometers
� Social contacts: A survey: “Please tell me your 5 bestfriends” continuous record of phone calls, emails, textmessages, bluetooth, social media connections, address books
� Economic development in developing countries:
Dubious ornonexistent governmental statistics satellite images ofhuman-generated light at night, road networks, otherinfrastructure
� Many, many, more. . .
� In each: without new analytics, the data are useless
5 / 12

Examples of what’s now possible
� Opinions of activists: A few thousand interviews billions ofpolitical opinions in social media posts (1B every 2 Days)
� Exercise: A survey: “How many times did you exercise lastweek? 500K people carrying cell phones withaccelerometers
� Social contacts: A survey: “Please tell me your 5 bestfriends” continuous record of phone calls, emails, textmessages, bluetooth, social media connections, address books
� Economic development in developing countries: Dubious ornonexistent governmental statistics
satellite images ofhuman-generated light at night, road networks, otherinfrastructure
� Many, many, more. . .
� In each: without new analytics, the data are useless
5 / 12

Examples of what’s now possible
� Opinions of activists: A few thousand interviews billions ofpolitical opinions in social media posts (1B every 2 Days)
� Exercise: A survey: “How many times did you exercise lastweek? 500K people carrying cell phones withaccelerometers
� Social contacts: A survey: “Please tell me your 5 bestfriends” continuous record of phone calls, emails, textmessages, bluetooth, social media connections, address books
� Economic development in developing countries: Dubious ornonexistent governmental statistics satellite images ofhuman-generated light at night, road networks, otherinfrastructure
� Many, many, more. . .
� In each: without new analytics, the data are useless
5 / 12

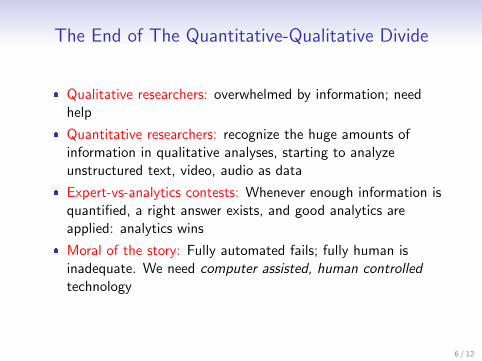
The End of The Quantitative-Qualitative Divide
� Qualitative researchers: overwhelmed by information; needhelp
� Quantitative researchers: recognize the huge amounts ofinformation in qualitative analyses, starting to analyzeunstructured text, video, audio as data
� Expert-vs-analytics contests: Whenever enough information isquantified, a right answer exists, and good analytics areapplied: analytics wins
� Moral of the story: Fully automated fails; fully human isinadequate. We need computer assisted, human controlledtechnology
6 / 12

How to Read a Billion Blog Posts& Classify Deaths without Physicians
� Examples of Bad Analytics:
� Physicians’ “Verbal Autopsy” analysis� Sentiment analysis via word counts
� Different problems, Same Analytics Solution:
� Key to both methods: classifying (deaths, social media posts)� Key to both goals: estimating %’s
� Modern Data Analytics: New method led to:
1.
2. Worldwide cause-of-death estimates for
7 / 12

How to Read a Billion Blog Posts& Classify Deaths without Physicians
� Examples of Bad Analytics:� Physicians’ “Verbal Autopsy” analysis
� Sentiment analysis via word counts
� Different problems, Same Analytics Solution:
� Key to both methods: classifying (deaths, social media posts)� Key to both goals: estimating %’s
� Modern Data Analytics: New method led to:
1.
2. Worldwide cause-of-death estimates for
7 / 12

How to Read a Billion Blog Posts& Classify Deaths without Physicians
� Examples of Bad Analytics:� Physicians’ “Verbal Autopsy” analysis� Sentiment analysis via word counts
� Different problems, Same Analytics Solution:
� Key to both methods: classifying (deaths, social media posts)� Key to both goals: estimating %’s
� Modern Data Analytics: New method led to:
1.
2. Worldwide cause-of-death estimates for
7 / 12
How to Read a Billion Blog Posts& Classify Deaths without Physicians
� Examples of Bad Analytics:� Physicians’ “Verbal Autopsy” analysis� Sentiment analysis via word counts
� Different problems, Same Analytics Solution:� Key to both methods: classifying (deaths, social media posts)
� Key to both goals: estimating %’s
� Modern Data Analytics: New method led to:
1.
2. Worldwide cause-of-death estimates for
7 / 12
How to Read a Billion Blog Posts& Classify Deaths without Physicians
� Examples of Bad Analytics:� Physicians’ “Verbal Autopsy” analysis� Sentiment analysis via word counts
� Different problems, Same Analytics Solution:� Key to both methods: classifying (deaths, social media posts)� Key to both goals: estimating %’s
� Modern Data Analytics: New method led to:
1.
2. Worldwide cause-of-death estimates for
7 / 12

How to Read a Billion Blog Posts& Classify Deaths without Physicians
� Examples of Bad Analytics:� Physicians’ “Verbal Autopsy” analysis� Sentiment analysis via word counts
� Different problems, Same Analytics Solution:� Key to both methods: classifying (deaths, social media posts)� Key to both goals: estimating %’s
� Modern Data Analytics: New method led to:1.
2. Worldwide cause-of-death estimates for
7 / 12

The Solvency of Social Security
� Successful: single largest government program; lifted a wholegeneration out of poverty; extremely popular
� Solvency: depends on mortality forecasts:
If retirees receivebenefits longer than expected, the Trust Fund runs out
� SSA data: little change other than updates for 75 years
� SSA analytics:
� Few statistical improvements for 75 years� Ignore risk factors (smoking, obesity)� Mostly informal (subject to error & political influence)� Forecasts: inaccurate, inconsistent, overly optimistic
� New customized analytics we developed:
� Logical consistency (e.g., older people have higher mortality)� More accurate forecasts� Trust fund needs ≈ $1 trillion more than SSA thought� Other applications to insurance industry, public health, etc.
8 / 12

The Solvency of Social Security
� Successful: single largest government program; lifted a wholegeneration out of poverty; extremely popular
� Solvency: depends on mortality forecasts: If retirees receivebenefits longer than expected, the Trust Fund runs out
� SSA data: little change other than updates for 75 years
� SSA analytics:
� Few statistical improvements for 75 years� Ignore risk factors (smoking, obesity)� Mostly informal (subject to error & political influence)� Forecasts: inaccurate, inconsistent, overly optimistic
� New customized analytics we developed:
� Logical consistency (e.g., older people have higher mortality)� More accurate forecasts� Trust fund needs ≈ $1 trillion more than SSA thought� Other applications to insurance industry, public health, etc.
8 / 12
The Solvency of Social Security
� Successful: single largest government program; lifted a wholegeneration out of poverty; extremely popular
� Solvency: depends on mortality forecasts: If retirees receivebenefits longer than expected, the Trust Fund runs out
� SSA data: little change other than updates for 75 years
� SSA analytics:� Few statistical improvements for 75 years
� Ignore risk factors (smoking, obesity)� Mostly informal (subject to error & political influence)� Forecasts: inaccurate, inconsistent, overly optimistic
� New customized analytics we developed:
� Logical consistency (e.g., older people have higher mortality)� More accurate forecasts� Trust fund needs ≈ $1 trillion more than SSA thought� Other applications to insurance industry, public health, etc.
8 / 12

The Solvency of Social Security
� Successful: single largest government program; lifted a wholegeneration out of poverty; extremely popular
� Solvency: depends on mortality forecasts: If retirees receivebenefits longer than expected, the Trust Fund runs out
� SSA data: little change other than updates for 75 years
� SSA analytics:� Few statistical improvements for 75 years� Ignore risk factors (smoking, obesity)
� Mostly informal (subject to error & political influence)� Forecasts: inaccurate, inconsistent, overly optimistic
� New customized analytics we developed:
� Logical consistency (e.g., older people have higher mortality)� More accurate forecasts� Trust fund needs ≈ $1 trillion more than SSA thought� Other applications to insurance industry, public health, etc.
8 / 12

The Solvency of Social Security
� Successful: single largest government program; lifted a wholegeneration out of poverty; extremely popular
� Solvency: depends on mortality forecasts: If retirees receivebenefits longer than expected, the Trust Fund runs out
� SSA data: little change other than updates for 75 years
� SSA analytics:� Few statistical improvements for 75 years� Ignore risk factors (smoking, obesity)� Mostly informal (subject to error & political influence)
� Forecasts: inaccurate, inconsistent, overly optimistic
� New customized analytics we developed:
� Logical consistency (e.g., older people have higher mortality)� More accurate forecasts� Trust fund needs ≈ $1 trillion more than SSA thought� Other applications to insurance industry, public health, etc.
8 / 12
The Solvency of Social Security
� Successful: single largest government program; lifted a wholegeneration out of poverty; extremely popular
� Solvency: depends on mortality forecasts: If retirees receivebenefits longer than expected, the Trust Fund runs out
� SSA data: little change other than updates for 75 years
� SSA analytics:� Few statistical improvements for 75 years� Ignore risk factors (smoking, obesity)� Mostly informal (subject to error & political influence)� Forecasts: inaccurate, inconsistent, overly optimistic
� New customized analytics we developed:
� Logical consistency (e.g., older people have higher mortality)� More accurate forecasts� Trust fund needs ≈ $1 trillion more than SSA thought� Other applications to insurance industry, public health, etc.
8 / 12
The Solvency of Social Security
� Successful: single largest government program; lifted a wholegeneration out of poverty; extremely popular
� Solvency: depends on mortality forecasts: If retirees receivebenefits longer than expected, the Trust Fund runs out
� SSA data: little change other than updates for 75 years
� SSA analytics:� Few statistical improvements for 75 years� Ignore risk factors (smoking, obesity)� Mostly informal (subject to error & political influence)� Forecasts: inaccurate, inconsistent, overly optimistic
� New customized analytics we developed:� Logical consistency (e.g., older people have higher mortality)
� More accurate forecasts� Trust fund needs ≈ $1 trillion more than SSA thought� Other applications to insurance industry, public health, etc.
8 / 12

The Solvency of Social Security
� Successful: single largest government program; lifted a wholegeneration out of poverty; extremely popular
� Solvency: depends on mortality forecasts: If retirees receivebenefits longer than expected, the Trust Fund runs out
� SSA data: little change other than updates for 75 years
� SSA analytics:� Few statistical improvements for 75 years� Ignore risk factors (smoking, obesity)� Mostly informal (subject to error & political influence)� Forecasts: inaccurate, inconsistent, overly optimistic
� New customized analytics we developed:� Logical consistency (e.g., older people have higher mortality)� More accurate forecasts
� Trust fund needs ≈ $1 trillion more than SSA thought� Other applications to insurance industry, public health, etc.
8 / 12

The Solvency of Social Security
� Successful: single largest government program; lifted a wholegeneration out of poverty; extremely popular
� Solvency: depends on mortality forecasts: If retirees receivebenefits longer than expected, the Trust Fund runs out
� SSA data: little change other than updates for 75 years
� SSA analytics:� Few statistical improvements for 75 years� Ignore risk factors (smoking, obesity)� Mostly informal (subject to error & political influence)� Forecasts: inaccurate, inconsistent, overly optimistic
� New customized analytics we developed:� Logical consistency (e.g., older people have higher mortality)� More accurate forecasts� Trust fund needs ≈ $1 trillion more than SSA thought
� Other applications to insurance industry, public health, etc.
8 / 12

The Solvency of Social Security
� Successful: single largest government program; lifted a wholegeneration out of poverty; extremely popular
� Solvency: depends on mortality forecasts: If retirees receivebenefits longer than expected, the Trust Fund runs out
� SSA data: little change other than updates for 75 years
� SSA analytics:� Few statistical improvements for 75 years� Ignore risk factors (smoking, obesity)� Mostly informal (subject to error & political influence)� Forecasts: inaccurate, inconsistent, overly optimistic
� New customized analytics we developed:� Logical consistency (e.g., older people have higher mortality)� More accurate forecasts� Trust fund needs ≈ $1 trillion more than SSA thought� Other applications to insurance industry, public health, etc.
8 / 12

Reading and Writing Technology
� Writing Technology: Big changes
� Then: Quill tip pen & expensive paper� Now: Microsoft Word, Google docs, etc
� Reading Technology: Little change (ripe for disruption)
� Then: 50, 100, 300 years ago: Get book; read cover to cover� Now:
� How often do you read a book cover-to-cover for work?� We collect 100s of documents, read a few, delude ourselves
into thinking we understand them all� Goal: understanding from unstructured data (hardest part of
big data)� More data isn’t helpful! Novel analytics needed.
9 / 12

Reading and Writing Technology
� Writing Technology: Big changes� Then: Quill tip pen & expensive paper
� Now: Microsoft Word, Google docs, etc
� Reading Technology: Little change (ripe for disruption)
� Then: 50, 100, 300 years ago: Get book; read cover to cover� Now:
� How often do you read a book cover-to-cover for work?� We collect 100s of documents, read a few, delude ourselves
into thinking we understand them all� Goal: understanding from unstructured data (hardest part of
big data)� More data isn’t helpful! Novel analytics needed.
9 / 12

Reading and Writing Technology
� Writing Technology: Big changes� Then: Quill tip pen & expensive paper� Now: Microsoft Word, Google docs, etc
� Reading Technology: Little change (ripe for disruption)� Then: 50, 100, 300 years ago: Get book; read cover to cover
� Now:
� How often do you read a book cover-to-cover for work?� We collect 100s of documents, read a few, delude ourselves
into thinking we understand them all� Goal: understanding from unstructured data (hardest part of
big data)� More data isn’t helpful! Novel analytics needed.
9 / 12

Reading and Writing Technology
� Writing Technology: Big changes� Then: Quill tip pen & expensive paper� Now: Microsoft Word, Google docs, etc
� Reading Technology: Little change (ripe for disruption)� Then: 50, 100, 300 years ago: Get book; read cover to cover� Now:
� How often do you read a book cover-to-cover for work?
� We collect 100s of documents, read a few, delude ourselvesinto thinking we understand them all
� Goal: understanding from unstructured data (hardest part ofbig data)
� More data isn’t helpful! Novel analytics needed.
9 / 12

Reading and Writing Technology
� Writing Technology: Big changes� Then: Quill tip pen & expensive paper� Now: Microsoft Word, Google docs, etc
� Reading Technology: Little change (ripe for disruption)� Then: 50, 100, 300 years ago: Get book; read cover to cover� Now:
� How often do you read a book cover-to-cover for work?� We collect 100s of documents, read a few, delude ourselves
into thinking we understand them all
� Goal: understanding from unstructured data (hardest part ofbig data)
� More data isn’t helpful! Novel analytics needed.
9 / 12
Reading and Writing Technology
� Writing Technology: Big changes� Then: Quill tip pen & expensive paper� Now: Microsoft Word, Google docs, etc
� Reading Technology: Little change (ripe for disruption)� Then: 50, 100, 300 years ago: Get book; read cover to cover� Now:
� How often do you read a book cover-to-cover for work?� We collect 100s of documents, read a few, delude ourselves
into thinking we understand them all� Goal: understanding from unstructured data (hardest part of
big data)
� More data isn’t helpful! Novel analytics needed.
9 / 12

Reading and Writing Technology
� Writing Technology: Big changes� Then: Quill tip pen & expensive paper� Now: Microsoft Word, Google docs, etc
� Reading Technology: Little change (ripe for disruption)� Then: 50, 100, 300 years ago: Get book; read cover to cover� Now:
� How often do you read a book cover-to-cover for work?� We collect 100s of documents, read a few, delude ourselves
into thinking we understand them all� Goal: understanding from unstructured data (hardest part of
big data)� More data isn’t helpful! Novel analytics needed.
9 / 12

Computer-Assisted Reading (Consilience)
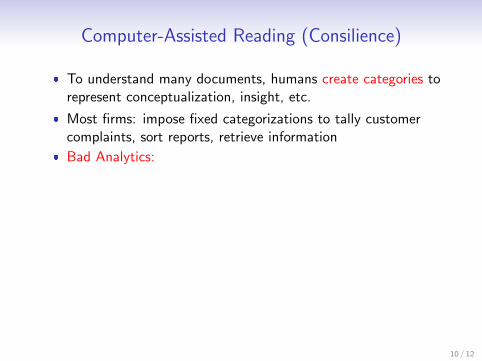
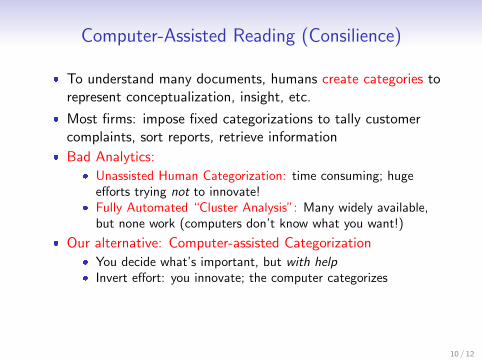
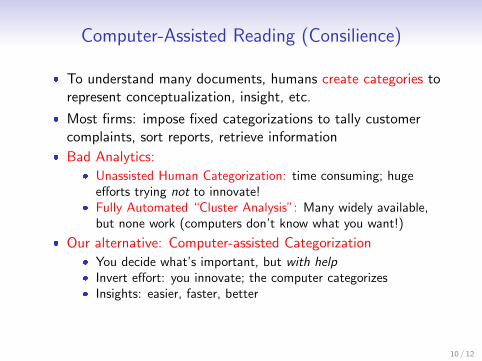
� To understand many documents, humans create categories torepresent conceptualization, insight, etc.
� Most firms: impose fixed categorizations to tally customercomplaints, sort reports, retrieve information
� Bad Analytics:
� Unassisted Human Categorization: time consuming; hugeefforts trying not to innovate!
� Fully Automated “Cluster Analysis”: Many widely available,but none work (computers don’t know what you want!)
� Our alternative: Computer-assisted Categorization
� You decide what’s important, but with help� Invert effort: you innovate; the computer categorizes� Insights: easier, faster, better� (Lots of technology, but it’s behind the scenes)
10 / 12

Computer-Assisted Reading (Consilience)
� To understand many documents, humans create categories torepresent conceptualization, insight, etc.
� Most firms: impose fixed categorizations to tally customercomplaints, sort reports, retrieve information
� Bad Analytics:
� Unassisted Human Categorization: time consuming; hugeefforts trying not to innovate!
� Fully Automated “Cluster Analysis”: Many widely available,but none work (computers don’t know what you want!)
� Our alternative: Computer-assisted Categorization
� You decide what’s important, but with help� Invert effort: you innovate; the computer categorizes� Insights: easier, faster, better� (Lots of technology, but it’s behind the scenes)
10 / 12

Computer-Assisted Reading (Consilience)
� To understand many documents, humans create categories torepresent conceptualization, insight, etc.
� Most firms: impose fixed categorizations to tally customercomplaints, sort reports, retrieve information
� Bad Analytics:� Unassisted Human Categorization: time consuming; huge
efforts trying not to innovate!
� Fully Automated “Cluster Analysis”: Many widely available,but none work (computers don’t know what you want!)
� Our alternative: Computer-assisted Categorization
� You decide what’s important, but with help� Invert effort: you innovate; the computer categorizes� Insights: easier, faster, better� (Lots of technology, but it’s behind the scenes)
10 / 12

Computer-Assisted Reading (Consilience)
� To understand many documents, humans create categories torepresent conceptualization, insight, etc.
� Most firms: impose fixed categorizations to tally customercomplaints, sort reports, retrieve information
� Bad Analytics:� Unassisted Human Categorization: time consuming; huge
efforts trying not to innovate!� Fully Automated “Cluster Analysis”: Many widely available,
but none work (computers don’t know what you want!)
� Our alternative: Computer-assisted Categorization� You decide what’s important, but with help
� Invert effort: you innovate; the computer categorizes� Insights: easier, faster, better� (Lots of technology, but it’s behind the scenes)
10 / 12
Computer-Assisted Reading (Consilience)
� To understand many documents, humans create categories torepresent conceptualization, insight, etc.
� Most firms: impose fixed categorizations to tally customercomplaints, sort reports, retrieve information
� Bad Analytics:� Unassisted Human Categorization: time consuming; huge
efforts trying not to innovate!� Fully Automated “Cluster Analysis”: Many widely available,
but none work (computers don’t know what you want!)
� Our alternative: Computer-assisted Categorization� You decide what’s important, but with help� Invert effort: you innovate; the computer categorizes
� Insights: easier, faster, better� (Lots of technology, but it’s behind the scenes)
10 / 12
Computer-Assisted Reading (Consilience)
� To understand many documents, humans create categories torepresent conceptualization, insight, etc.
� Most firms: impose fixed categorizations to tally customercomplaints, sort reports, retrieve information
� Bad Analytics:� Unassisted Human Categorization: time consuming; huge
efforts trying not to innovate!� Fully Automated “Cluster Analysis”: Many widely available,
but none work (computers don’t know what you want!)
� Our alternative: Computer-assisted Categorization� You decide what’s important, but with help� Invert effort: you innovate; the computer categorizes� Insights: easier, faster, better
� (Lots of technology, but it’s behind the scenes)
10 / 12

Computer-Assisted Reading (Consilience)
� To understand many documents, humans create categories torepresent conceptualization, insight, etc.
� Most firms: impose fixed categorizations to tally customercomplaints, sort reports, retrieve information
� Bad Analytics:� Unassisted Human Categorization: time consuming; huge
efforts trying not to innovate!� Fully Automated “Cluster Analysis”: Many widely available,
but none work (computers don’t know what you want!)
� Our alternative: Computer-assisted Categorization� You decide what’s important, but with help� Invert effort: you innovate; the computer categorizes� Insights: easier, faster, better� (Lots of technology, but it’s behind the scenes)
10 / 12
Example Insights from Computer-Assisted Reading
1. What Members of Congress Do
� Data: 64,000 Senators’ press releases� Categorization: (1) advertising, (2) position taking, (3) credit
claiming� New Insight: partisan taunting
� Joe Wilson during Obama’s State of the Union: “You lie!”� “Senator Lautenberg Blasts Republicans as ‘Chicken Hawks’ ”
� How common is it?
27% of all Senatorial press releases!
2. What is the Chinese Government Censoring?
� Previous approach: manual effort to see what is taken down� Data: We get posts before the Chinese censor them� We analyzed 11 million posts, about 13% censored� Previous understanding: they censor criticisms of the
government� Results:
� Uncensored: criticism of the government� Censored: attempts at collective action
11 / 12
Example Insights from Computer-Assisted Reading
1. What Members of Congress Do� Data: 64,000 Senators’ press releases
� Categorization: (1) advertising, (2) position taking, (3) creditclaiming
� New Insight: partisan taunting
� Joe Wilson during Obama’s State of the Union: “You lie!”� “Senator Lautenberg Blasts Republicans as ‘Chicken Hawks’ ”
� How common is it?
27% of all Senatorial press releases!
2. What is the Chinese Government Censoring?
� Previous approach: manual effort to see what is taken down� Data: We get posts before the Chinese censor them� We analyzed 11 million posts, about 13% censored� Previous understanding: they censor criticisms of the
government� Results:
� Uncensored: criticism of the government� Censored: attempts at collective action
11 / 12

Example Insights from Computer-Assisted Reading
1. What Members of Congress Do� Data: 64,000 Senators’ press releases� Categorization: (1) advertising, (2) position taking, (3) credit
claiming
� New Insight: partisan taunting
� Joe Wilson during Obama’s State of the Union: “You lie!”� “Senator Lautenberg Blasts Republicans as ‘Chicken Hawks’ ”
� How common is it?
27% of all Senatorial press releases!
2. What is the Chinese Government Censoring?
� Previous approach: manual effort to see what is taken down� Data: We get posts before the Chinese censor them� We analyzed 11 million posts, about 13% censored� Previous understanding: they censor criticisms of the
government� Results:
� Uncensored: criticism of the government� Censored: attempts at collective action
11 / 12
Example Insights from Computer-Assisted Reading
1. What Members of Congress Do� Data: 64,000 Senators’ press releases� Categorization: (1) advertising, (2) position taking, (3) credit
claiming� New Insight: partisan taunting
� Joe Wilson during Obama’s State of the Union: “You lie!”� “Senator Lautenberg Blasts Republicans as ‘Chicken Hawks’ ”
� How common is it?
27% of all Senatorial press releases!
2. What is the Chinese Government Censoring?
� Previous approach: manual effort to see what is taken down� Data: We get posts before the Chinese censor them� We analyzed 11 million posts, about 13% censored� Previous understanding: they censor criticisms of the
government� Results:
� Uncensored: criticism of the government� Censored: attempts at collective action
11 / 12

Example Insights from Computer-Assisted Reading
1. What Members of Congress Do� Data: 64,000 Senators’ press releases� Categorization: (1) advertising, (2) position taking, (3) credit
claiming� New Insight: partisan taunting
� Joe Wilson during Obama’s State of the Union: “You lie!”
� “Senator Lautenberg Blasts Republicans as ‘Chicken Hawks’ ”
� How common is it?
27% of all Senatorial press releases!
2. What is the Chinese Government Censoring?
� Previous approach: manual effort to see what is taken down� Data: We get posts before the Chinese censor them� We analyzed 11 million posts, about 13% censored� Previous understanding: they censor criticisms of the
government� Results:
� Uncensored: criticism of the government� Censored: attempts at collective action
11 / 12
Example Insights from Computer-Assisted Reading
1. What Members of Congress Do� Data: 64,000 Senators’ press releases� Categorization: (1) advertising, (2) position taking, (3) credit
claiming� New Insight: partisan taunting
� Joe Wilson during Obama’s State of the Union: “You lie!”� “Senator Lautenberg Blasts Republicans as ‘Chicken Hawks’ ”
� How common is it?
27% of all Senatorial press releases!
2. What is the Chinese Government Censoring?
� Previous approach: manual effort to see what is taken down� Data: We get posts before the Chinese censor them� We analyzed 11 million posts, about 13% censored� Previous understanding: they censor criticisms of the
government� Results:
� Uncensored: criticism of the government� Censored: attempts at collective action
11 / 12

Example Insights from Computer-Assisted Reading
1. What Members of Congress Do� Data: 64,000 Senators’ press releases� Categorization: (1) advertising, (2) position taking, (3) credit
claiming� New Insight: partisan taunting
� Joe Wilson during Obama’s State of the Union: “You lie!”� “Senator Lautenberg Blasts Republicans as ‘Chicken Hawks’ ”
� How common is it? 27% of all Senatorial press releases!
2. What is the Chinese Government Censoring?
� Previous approach: manual effort to see what is taken down� Data: We get posts before the Chinese censor them� We analyzed 11 million posts, about 13% censored� Previous understanding: they censor criticisms of the
government� Results:
� Uncensored: criticism of the government� Censored: attempts at collective action
11 / 12
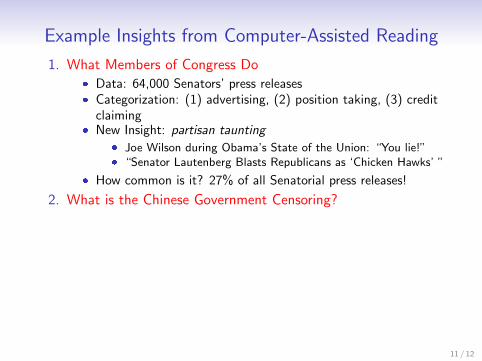
Example Insights from Computer-Assisted Reading
1. What Members of Congress Do� Data: 64,000 Senators’ press releases� Categorization: (1) advertising, (2) position taking, (3) credit
claiming� New Insight: partisan taunting
� Joe Wilson during Obama’s State of the Union: “You lie!”� “Senator Lautenberg Blasts Republicans as ‘Chicken Hawks’ ”
� How common is it? 27% of all Senatorial press releases!
2. What is the Chinese Government Censoring?� Previous approach: manual effort to see what is taken down
� Data: We get posts before the Chinese censor them� We analyzed 11 million posts, about 13% censored� Previous understanding: they censor criticisms of the
government� Results:
� Uncensored: criticism of the government� Censored: attempts at collective action
11 / 12

Example Insights from Computer-Assisted Reading
1. What Members of Congress Do� Data: 64,000 Senators’ press releases� Categorization: (1) advertising, (2) position taking, (3) credit
claiming� New Insight: partisan taunting
� Joe Wilson during Obama’s State of the Union: “You lie!”� “Senator Lautenberg Blasts Republicans as ‘Chicken Hawks’ ”
� How common is it? 27% of all Senatorial press releases!
2. What is the Chinese Government Censoring?� Previous approach: manual effort to see what is taken down� Data: We get posts before the Chinese censor them
� We analyzed 11 million posts, about 13% censored� Previous understanding: they censor criticisms of the
government� Results:
� Uncensored: criticism of the government� Censored: attempts at collective action
11 / 12

Example Insights from Computer-Assisted Reading
1. What Members of Congress Do� Data: 64,000 Senators’ press releases� Categorization: (1) advertising, (2) position taking, (3) credit
claiming� New Insight: partisan taunting
� Joe Wilson during Obama’s State of the Union: “You lie!”� “Senator Lautenberg Blasts Republicans as ‘Chicken Hawks’ ”
� How common is it? 27% of all Senatorial press releases!
2. What is the Chinese Government Censoring?� Previous approach: manual effort to see what is taken down� Data: We get posts before the Chinese censor them� We analyzed 11 million posts, about 13% censored
� Previous understanding: they censor criticisms of thegovernment
� Results:
� Uncensored: criticism of the government� Censored: attempts at collective action
11 / 12

Example Insights from Computer-Assisted Reading
1. What Members of Congress Do� Data: 64,000 Senators’ press releases� Categorization: (1) advertising, (2) position taking, (3) credit
claiming� New Insight: partisan taunting
� Joe Wilson during Obama’s State of the Union: “You lie!”� “Senator Lautenberg Blasts Republicans as ‘Chicken Hawks’ ”
� How common is it? 27% of all Senatorial press releases!
2. What is the Chinese Government Censoring?� Previous approach: manual effort to see what is taken down� Data: We get posts before the Chinese censor them� We analyzed 11 million posts, about 13% censored� Previous understanding: they censor criticisms of the
government
� Results:
� Uncensored: criticism of the government� Censored: attempts at collective action
11 / 12
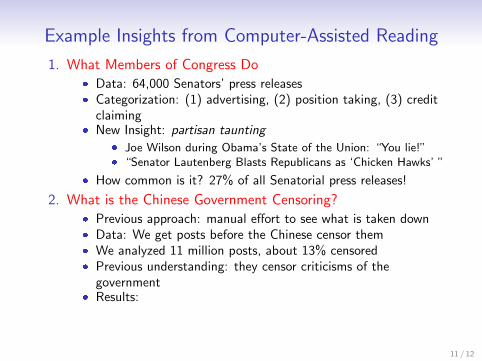
Example Insights from Computer-Assisted Reading
1. What Members of Congress Do� Data: 64,000 Senators’ press releases� Categorization: (1) advertising, (2) position taking, (3) credit
claiming� New Insight: partisan taunting
� Joe Wilson during Obama’s State of the Union: “You lie!”� “Senator Lautenberg Blasts Republicans as ‘Chicken Hawks’ ”
� How common is it? 27% of all Senatorial press releases!
2. What is the Chinese Government Censoring?� Previous approach: manual effort to see what is taken down� Data: We get posts before the Chinese censor them� We analyzed 11 million posts, about 13% censored� Previous understanding: they censor criticisms of the
government� Results:
� Uncensored: criticism of the government� Censored: attempts at collective action
11 / 12

Example Insights from Computer-Assisted Reading
1. What Members of Congress Do� Data: 64,000 Senators’ press releases� Categorization: (1) advertising, (2) position taking, (3) credit
claiming� New Insight: partisan taunting
� Joe Wilson during Obama’s State of the Union: “You lie!”� “Senator Lautenberg Blasts Republicans as ‘Chicken Hawks’ ”
� How common is it? 27% of all Senatorial press releases!
2. What is the Chinese Government Censoring?� Previous approach: manual effort to see what is taken down� Data: We get posts before the Chinese censor them� We analyzed 11 million posts, about 13% censored� Previous understanding: they censor criticisms of the
government� Results:
� Uncensored: criticism of the government
� Censored: attempts at collective action
11 / 12

Example Insights from Computer-Assisted Reading
1. What Members of Congress Do� Data: 64,000 Senators’ press releases� Categorization: (1) advertising, (2) position taking, (3) credit
claiming� New Insight: partisan taunting
� Joe Wilson during Obama’s State of the Union: “You lie!”� “Senator Lautenberg Blasts Republicans as ‘Chicken Hawks’ ”
� How common is it? 27% of all Senatorial press releases!
2. What is the Chinese Government Censoring?� Previous approach: manual effort to see what is taken down� Data: We get posts before the Chinese censor them� We analyzed 11 million posts, about 13% censored� Previous understanding: they censor criticisms of the
government� Results:
� Uncensored: criticism of the government� Censored: attempts at collective action
11 / 12
