big data, smart data, fast data – a paradigm shift · • i am a member of the ibm watson health...
TRANSCRIPT
Big Data, Smart Data, Fast Data – a paradigm shift
Andrew Bate Senior Director, Epidemiology Group Lead, Analytics
Keynote ISOP annual conference, Agra 16 October 2016
Disclosures
• I am a full time employee of Pfizer and hold stocks and stock options
• I am a member of the IBM Watson Health Advisory Council – non exclusivity, unfunded
• The company 23andme has partnered with Pfizer for some funded Big Data projects that are mentioned in this presentation
Overview
• Traditional Pharmacovigilance – And the wider usage of longitudinal observational
databases • Changes in the type of data, access models and
analytic approaches • Examples of the use of ‘Big Data’
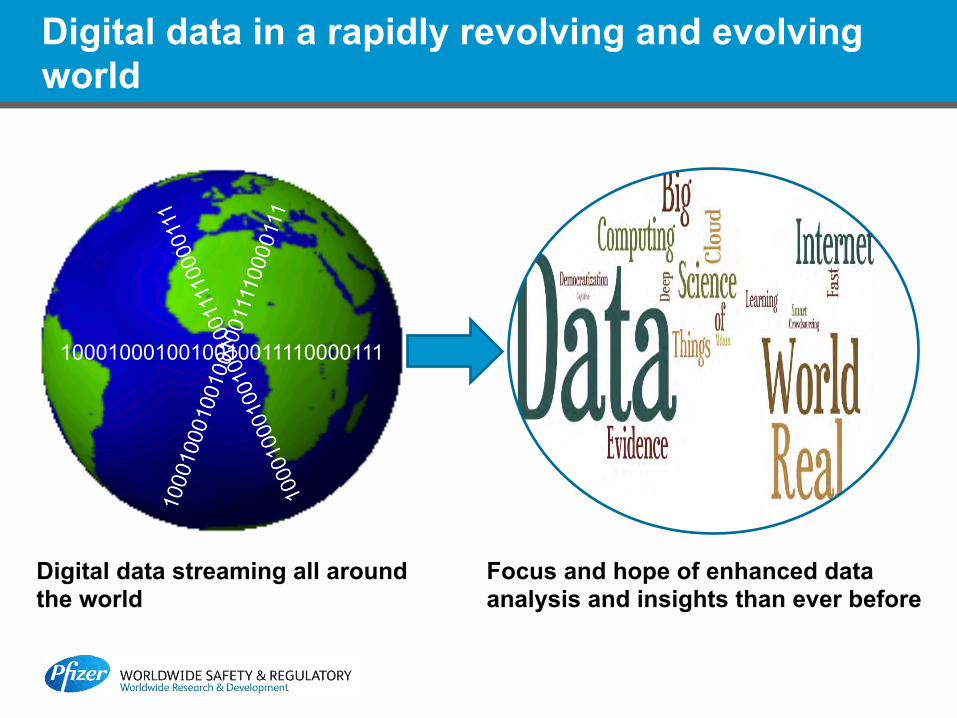
Digital data in a rapidly revolving and evolving world
1000100010010010011110000111
Digital data streaming all around the world
Focus and hope of enhanced data analysis and insights than ever before
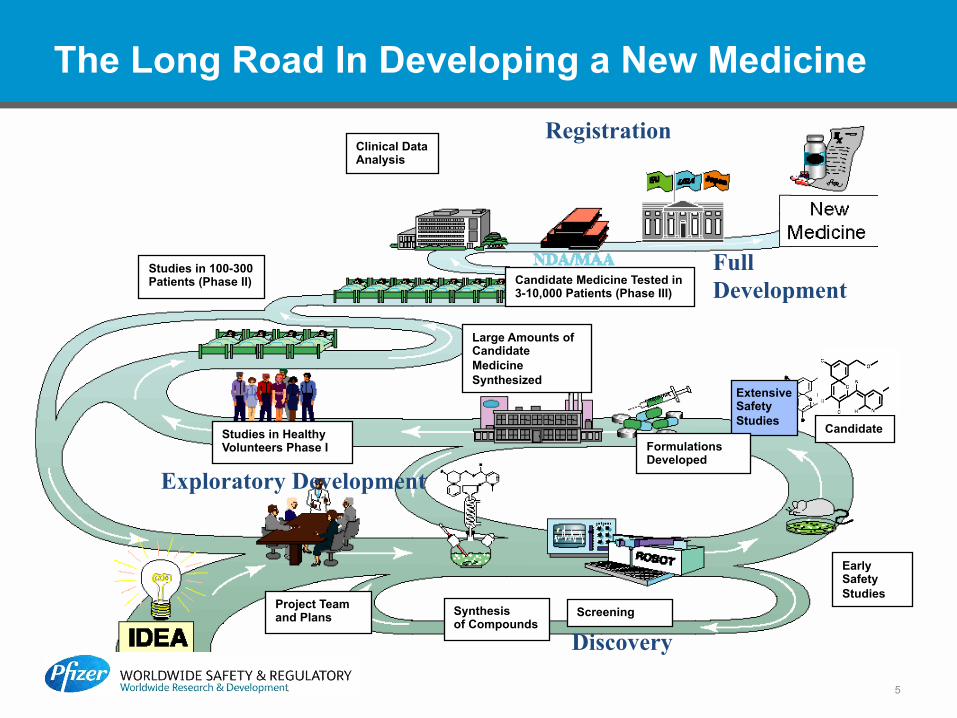
The Long Road In Developing a New Medicine
Discovery
Exploratory Development
Full Development
Registration
Large Amounts of Candidate Medicine Synthesized
Project Team and Plans Synthesis
of Compounds
Early Safety Studies
Candidate Formulations Developed
Extensive Safety Studies
Screening
Studies in Healthy Volunteers Phase I
Candidate Medicine Tested in 3-10,000 Patients (Phase III)
Studies in 100-300 Patients (Phase II)
Clinical Data Analysis
5
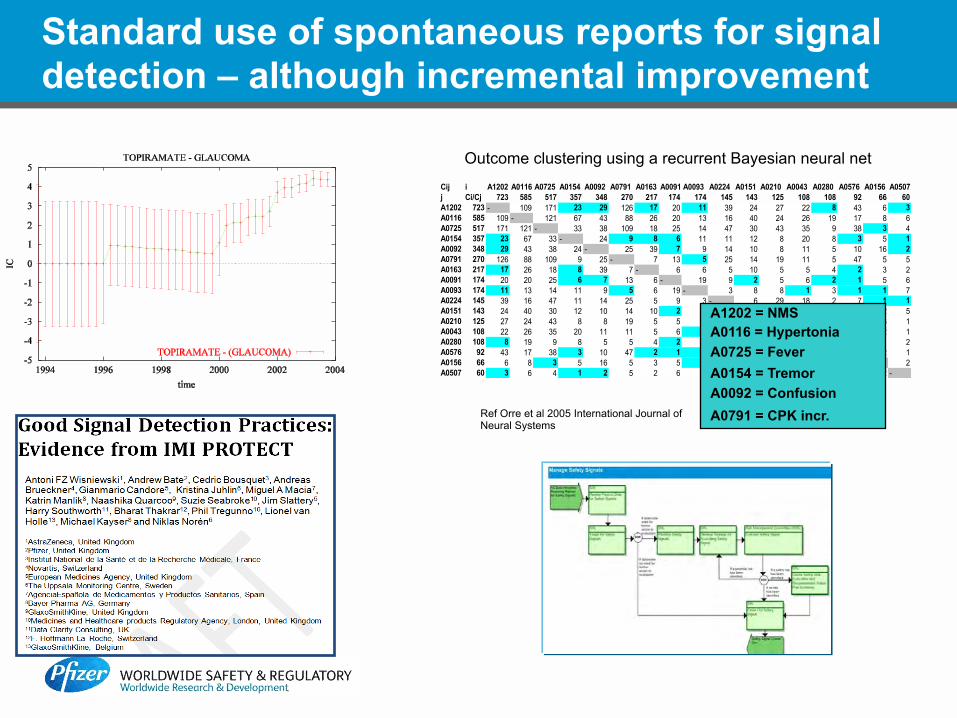
Standard use of spontaneous reports for signal detection – although incremental improvement
Cij i A1202 A0116 A0725 A0154 A0092 A0791 A0163 A0091 A0093 A0224 A0151 A0210 A0043 A0280 A0576 A0156 A0507j Ci/Cj 723 585 517 357 348 270 217 174 174 145 143 125 108 108 92 66 60A1202 723 - 109 171 23 29 126 17 20 11 39 24 27 22 8 43 6 3A0116 585 109 - 121 67 43 88 26 20 13 16 40 24 26 19 17 8 6A0725 517 171 121 - 33 38 109 18 25 14 47 30 43 35 9 38 3 4A0154 357 23 67 33 - 24 9 8 6 11 11 12 8 20 8 3 5 1A0092 348 29 43 38 24 - 25 39 7 9 14 10 8 11 5 10 16 2A0791 270 126 88 109 9 25 - 7 13 5 25 14 19 11 5 47 5 5A0163 217 17 26 18 8 39 7 - 6 6 5 10 5 5 4 2 3 2A0091 174 20 20 25 6 7 13 6 - 19 9 2 5 6 2 1 5 6A0093 174 11 13 14 11 9 5 6 19 - 3 8 8 1 3 1 1 7A0224 145 39 16 47 11 14 25 5 9 3 - 6 29 18 2 7 1 1A0151 143 24 40 30 12 10 14 10 2 8 6 - 1 5 4 3 2 5A0210 125 27 24 43 8 8 19 5 5 8 29 1 - 4 2 6 3 1A0043 108 22 26 35 20 11 11 5 6 1 18 5 4 - 5 3 2 1A0280 108 8 19 9 8 5 5 4 2 3 2 4 2 5 - 1 1 2A0576 92 43 17 38 3 10 47 2 1 1 7 3 6 3 1 - 2 1A0156 66 6 8 3 5 16 5 3 5 1 1 2 3 2 1 2 - 2A0507 60 3 6 4 1 2 5 2 6 7 1 5 1 1 2 1 2 -
A1202 = NMS A0116 = Hypertonia A0725 = Fever A0154 = Tremor A0092 = Confusion A0791 = CPK incr. Ref Orre et al 2005 International Journal of
Neural Systems
Outcome clustering using a recurrent Bayesian neural net
7
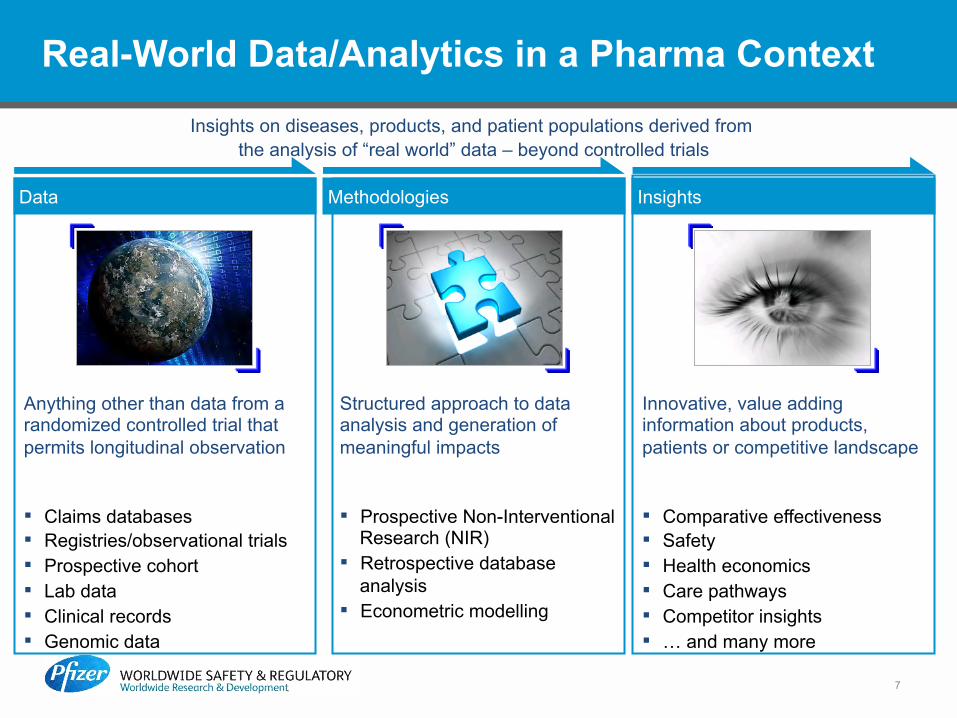
Real-World Data/Analytics in a Pharma Context
Insights on diseases, products, and patient populations derived from the analysis of “real world” data – beyond controlled trials
Data Methodologies Insights
Anything other than data from a randomized controlled trial that permits longitudinal observation
Structured approach to data analysis and generation of meaningful impacts
Innovative, value adding information about products, patients or competitive landscape
▪ Claims databases ▪ Registries/observational trials ▪ Prospective cohort ▪ Lab data ▪ Clinical records ▪ Genomic data
▪ Prospective Non-Interventional Research (NIR)
▪ Retrospective database analysis
▪ Econometric modelling
▪ Comparative effectiveness ▪ Safety ▪ Health economics ▪ Care pathways ▪ Competitor insights ▪ … and many more
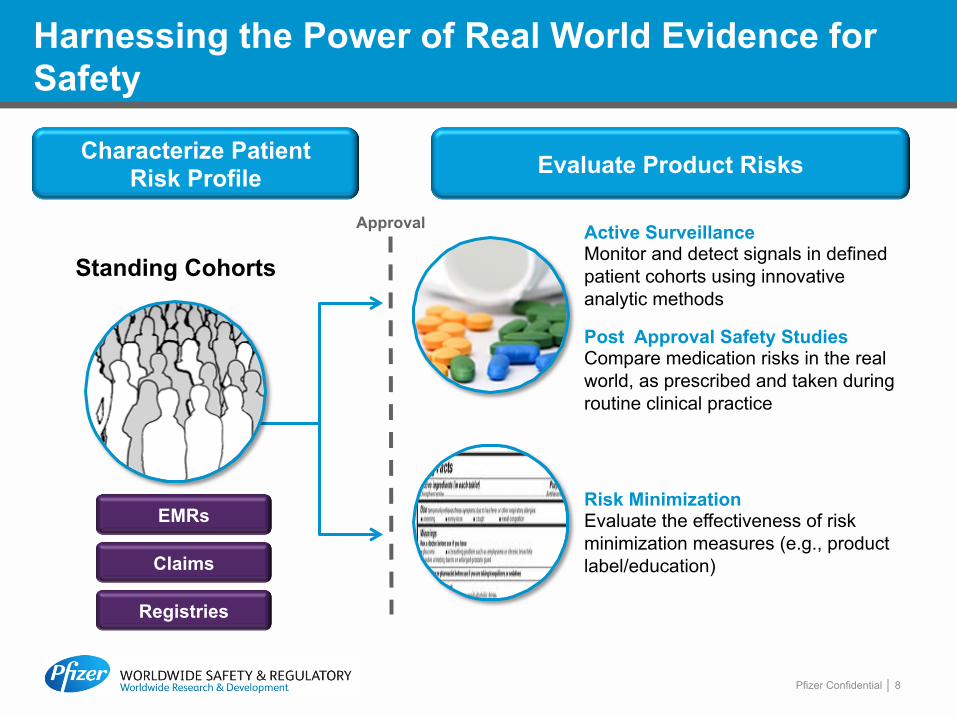
Evaluate Product Risks
Pfizer Confidential │ 8
Approval Active Surveillance Monitor and detect signals in defined patient cohorts using innovative analytic methods
Risk Minimization Evaluate the effectiveness of risk minimization measures (e.g., product label/education)
Standing Cohorts
Characterize Patient Risk Profile
EMRs
Claims
Registries
Harnessing the Power of Real World Evidence for Safety
Post Approval Safety Studies Compare medication risks in the real world, as prescribed and taken during routine clinical practice
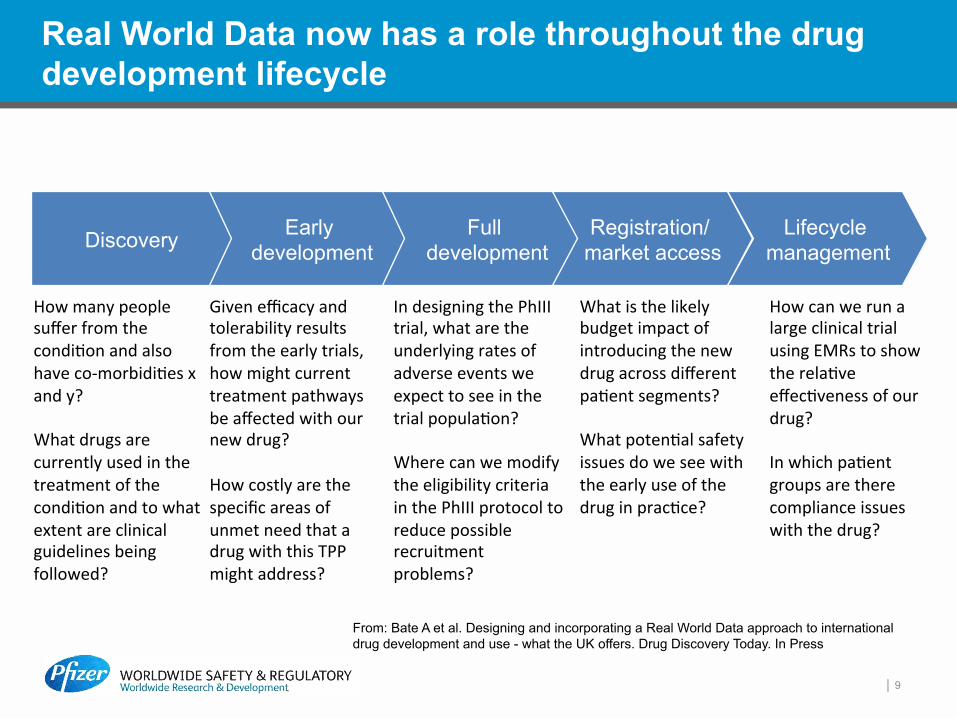
Real World Data now has a role throughout the drug development lifecycle
│ 9
Early development
Full development Discovery Lifecycle
management
How many people suffer from the condi6on and also have co-‐morbidi6es x and y? What drugs are currently used in the treatment of the condi6on and to what extent are clinical guidelines being followed?
Given efficacy and tolerability results from the early trials, how might current treatment pathways be affected with our new drug? How costly are the specific areas of unmet need that a drug with this TPP might address?
Registration/ market access
In designing the PhIII trial, what are the underlying rates of adverse events we expect to see in the trial popula6on? Where can we modify the eligibility criteria in the PhIII protocol to reduce possible recruitment problems?
What is the likely budget impact of introducing the new drug across different pa6ent segments? What poten6al safety issues do we see with the early use of the drug in prac6ce?
How can we run a large clinical trial using EMRs to show the rela6ve effec6veness of our drug? In which pa6ent groups are there compliance issues with the drug?
From: Bate A et al. Designing and incorporating a Real World Data approach to international drug development and use - what the UK offers. Drug Discovery Today. In Press
PROTECT received support from the Innovative Medicine Initiative (IMI) Joint Undertaking
(www.imi.europa.eu), resources of which are composed of financial contribution from the
European Union's Seventh Framework Programme (FP7/2007-2013) and EFPIA
companies’ in kind contribution.
10
11
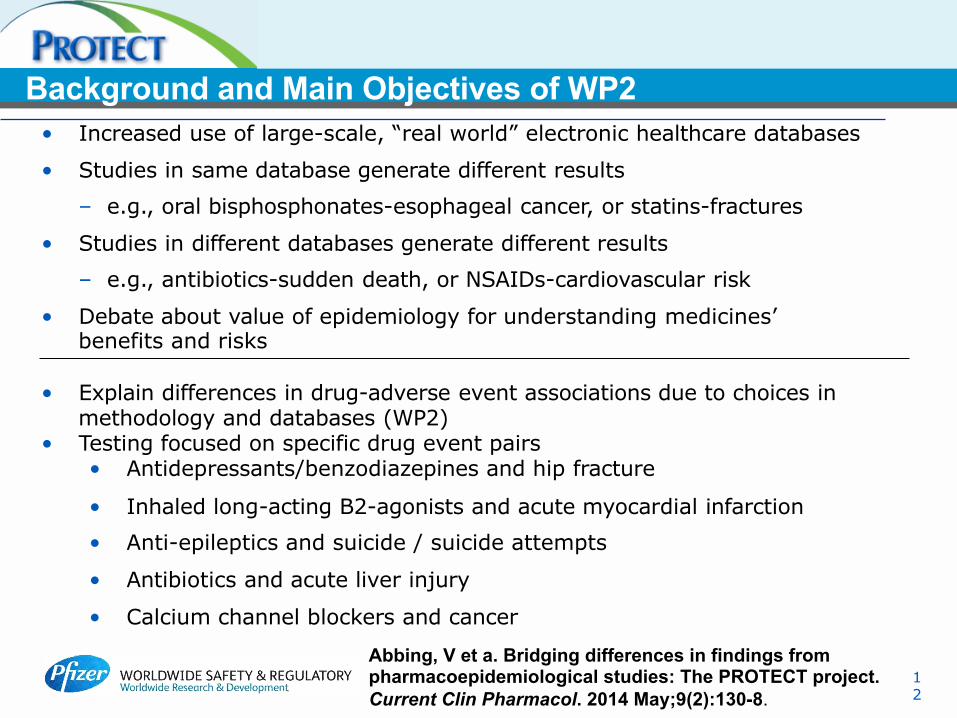
Background and Main Objectives of WP2
12
• Increased use of large-scale, “real world” electronic healthcare databases
• Studies in same database generate different results
– e.g., oral bisphosphonates-esophageal cancer, or statins-fractures
• Studies in different databases generate different results
– e.g., antibiotics-sudden death, or NSAIDs-cardiovascular risk
• Debate about value of epidemiology for understanding medicines’ benefits and risks
• Explain differences in drug-adverse event associations due to choices in methodology and databases (WP2)
• Testing focused on specific drug event pairs • Antidepressants/benzodiazepines and hip fracture
• Inhaled long-acting B2-agonists and acute myocardial infarction • Anti-epileptics and suicide / suicide attempts
• Antibiotics and acute liver injury
• Calcium channel blockers and cancer
Abbing, V et a. Bridging differences in findings from pharmacoepidemiological studies: The PROTECT project. Current Clin Pharmacol. 2014 May;9(2):130-8.
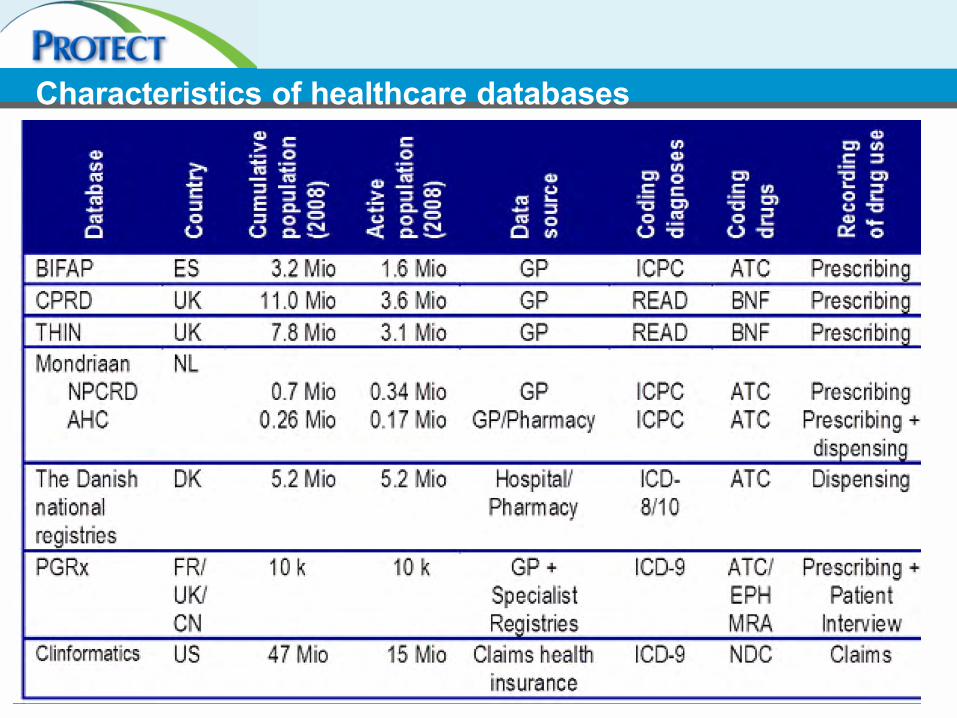
Characteristics of healthcare databases
13
Data
base
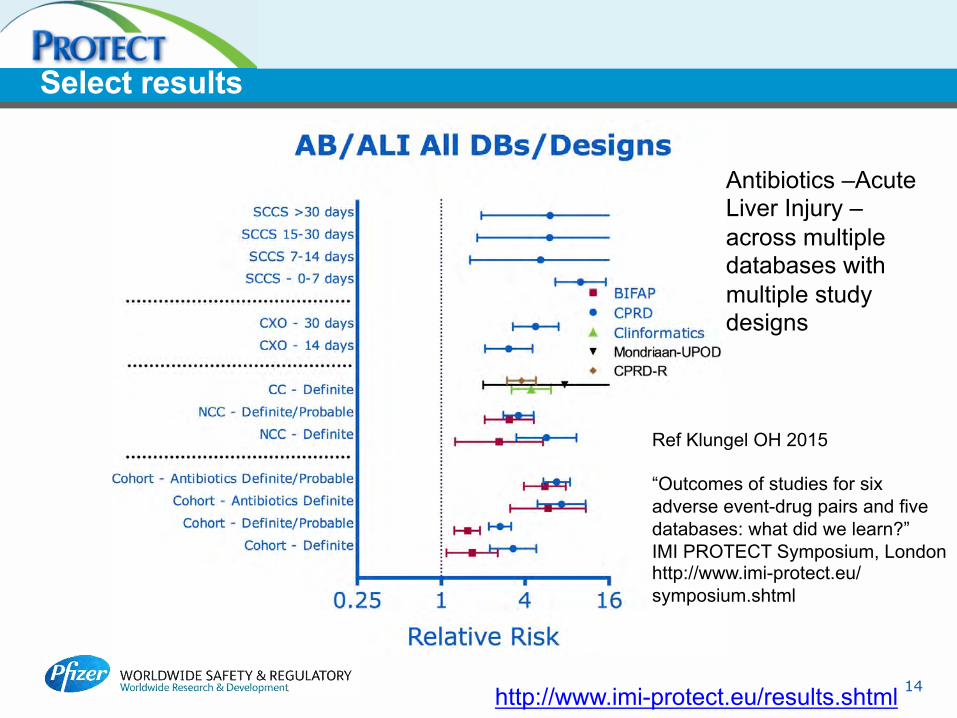
Select results
14 http://www.imi-protect.eu/results.shtml
Ref Klungel OH 2015 “Outcomes of studies for six adverse event-drug pairs and five databases: what did we learn?” IMI PROTECT Symposium, London http://www.imi-protect.eu/symposium.shtml
Antibiotics –Acute Liver Injury – across multiple databases with multiple study designs
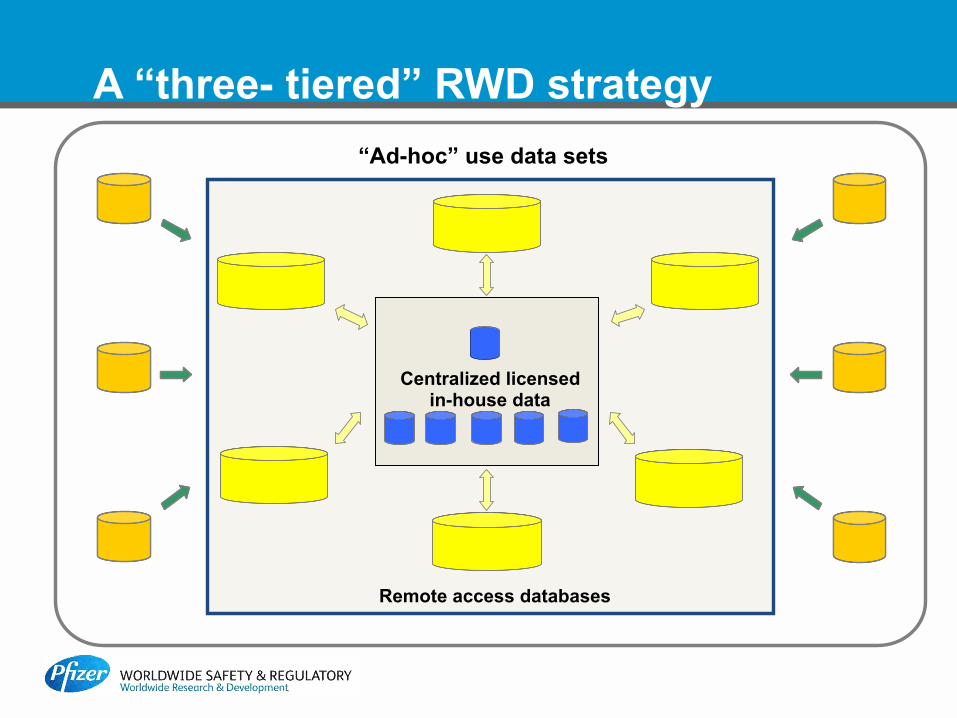
A “three- tiered” RWD strategy “Ad-hoc” use data sets
Remote access databases
Centralized licensed in-house data
16
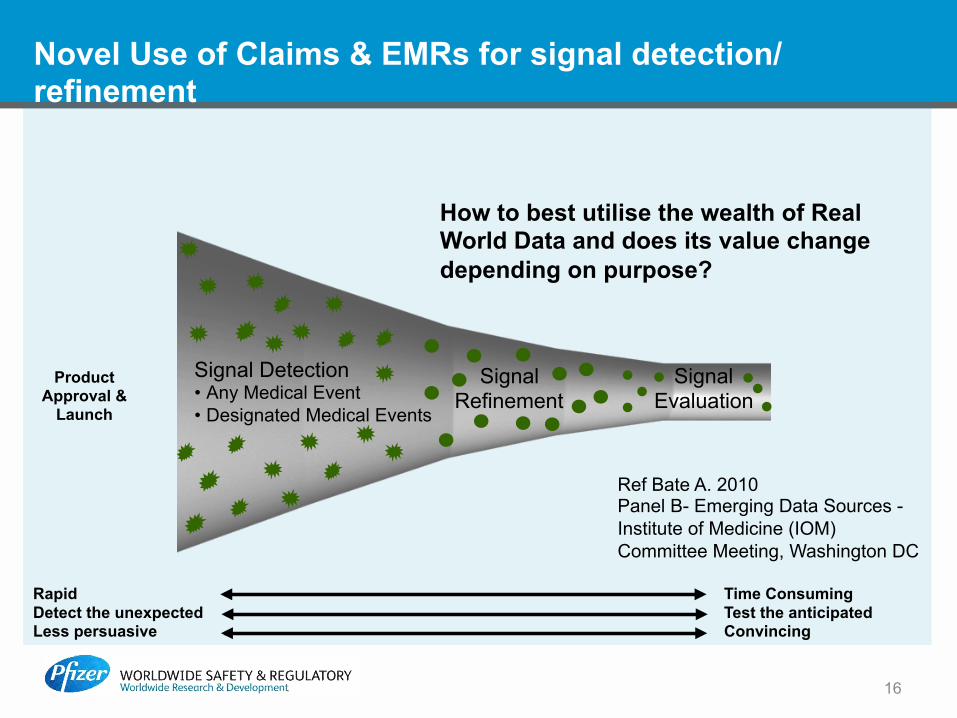
Novel Use of Claims & EMRs for signal detection/refinement
Signal Detection • Any Medical Event • Designated Medical Events
Signal Refinement
Signal Evaluation
Rapid Detect the unexpected Less persuasive
Time Consuming Test the anticipated Convincing
Product Approval &
Launch
How to best utilise the wealth of Real World Data and does its value change depending on purpose?
Ref Bate A. 2010 Panel B- Emerging Data Sources -Institute of Medicine (IOM) Committee Meeting, Washington DC
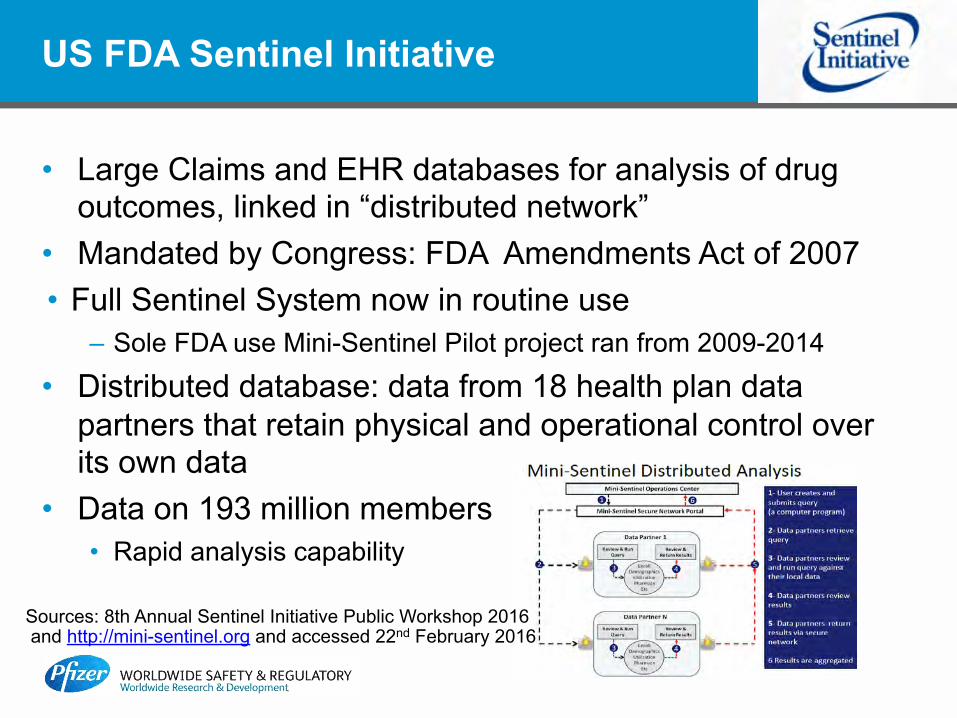
US FDA Sentinel Initiative
• Large Claims and EHR databases for analysis of drug outcomes, linked in “distributed network”
• Mandated by Congress: FDA Amendments Act of 2007 • Full Sentinel System now in routine use
– Sole FDA use Mini-Sentinel Pilot project ran from 2009-2014
• Distributed database: data from 18 health plan data partners that retain physical and operational control over its own data
• Data on 193 million members • Rapid analysis capability
Sources: 8th Annual Sentinel Initiative Public Workshop 2016 and http://mini-sentinel.org and accessed 22nd February 2016
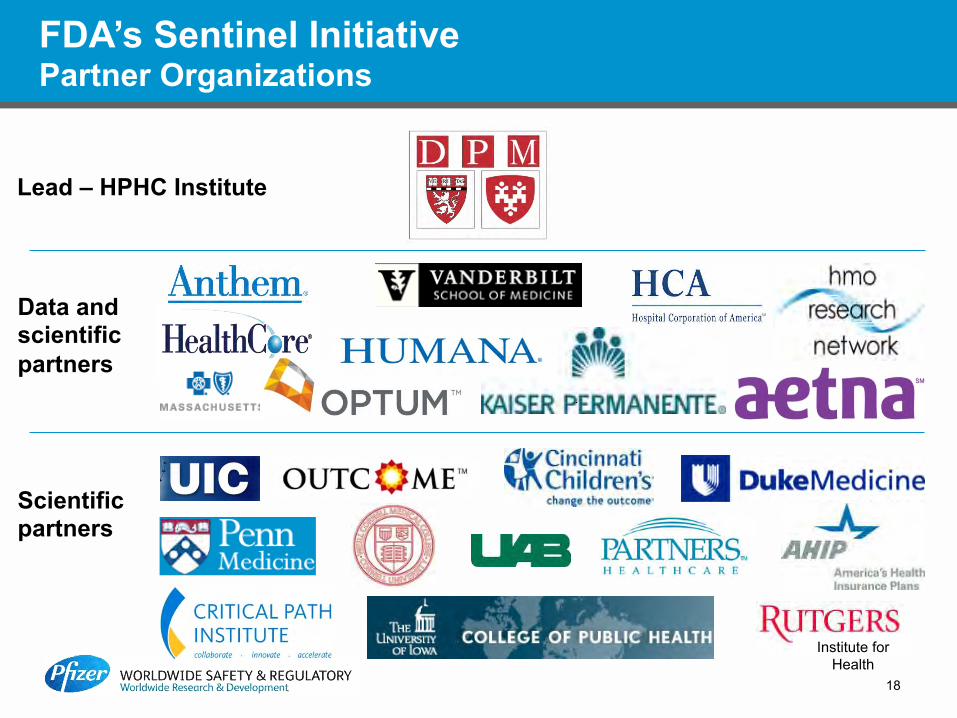
FDA’s Sentinel Initiative Partner Organizations
Institute for Health
Lead – HPHC Institute
Data and scientific partners
Scientific partners
18

Common data model role in distributed network- the OMOP model
Source 1 Source 2 Source 3
OMOP Analysis results
Analysis method
Transformation to OMOP common data model
Diagram reference: OMOP
Use of a Common Data Model facilitates fast analysis of multiple databases, and allows analyses across a distributed network. Use of data converted to common denominator can be problematic
The work of the US public private partnership OMOP has now transitioned to IMEDS

Innovation in Medical Development and Surveillance (IMEDS)
• IMEDS is a program within the Reagan-Udall Foundation for the US FDA and is a public private partnership created to build upon the significance progress made of research methodology by FDA’s Sentinel Initiative and the Observational Medicines Outcomes Partnership (OMOP)
• Primary objective is to advance the science and tolls necessary to support post-market evidence generation on regulated products, including safety surveillance and evaluations, to facilitate utilization of a robust electronic healthcare data platform for generating better evidence on regulated products in the post-market settings
• See: imeds.reaganudall.org
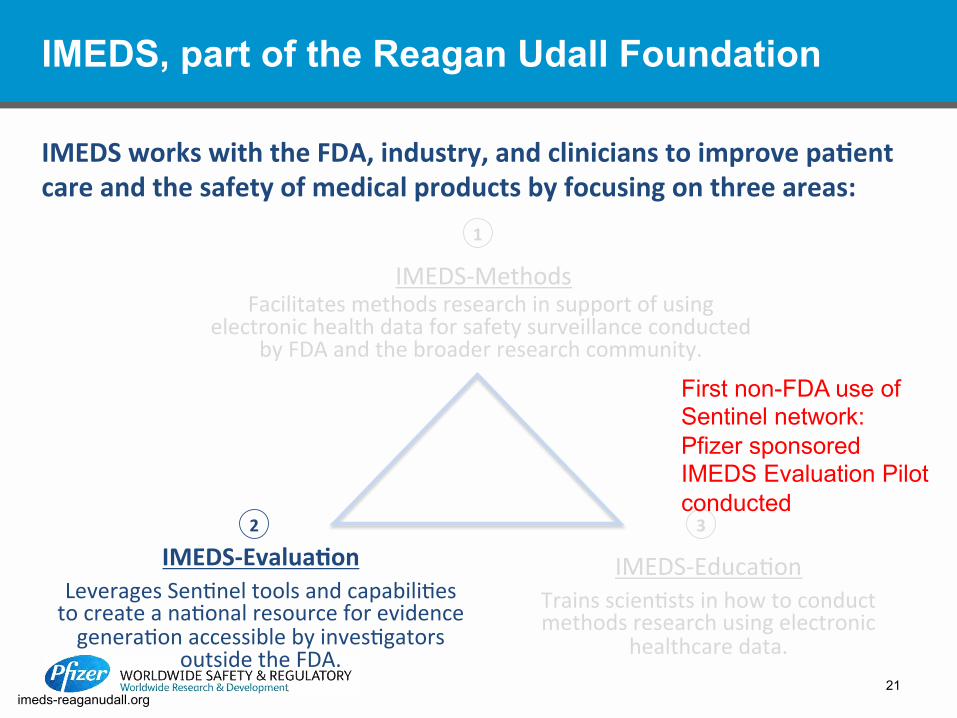
IMEDS-‐Methods Facilitates methods research in support of using
electronic health data for safety surveillance conducted by FDA and the broader research community.
IMEDS, part of the Reagan Udall Foundation
IMEDS-‐Evalua+on Leverages Sen6nel tools and capabili6es to create a na6onal resource for evidence genera6on accessible by inves6gators
outside the FDA.
IMEDS-‐Educa6on Trains scien6sts in how to conduct methods research using electronic
healthcare data.
IMEDS works with the FDA, industry, and clinicians to improve pa+ent care and the safety of medical products by focusing on three areas:
3 2
1
21 imeds-reaganudall.org
First non-FDA use of Sentinel network: Pfizer sponsored IMEDS Evaluation Pilot conducted
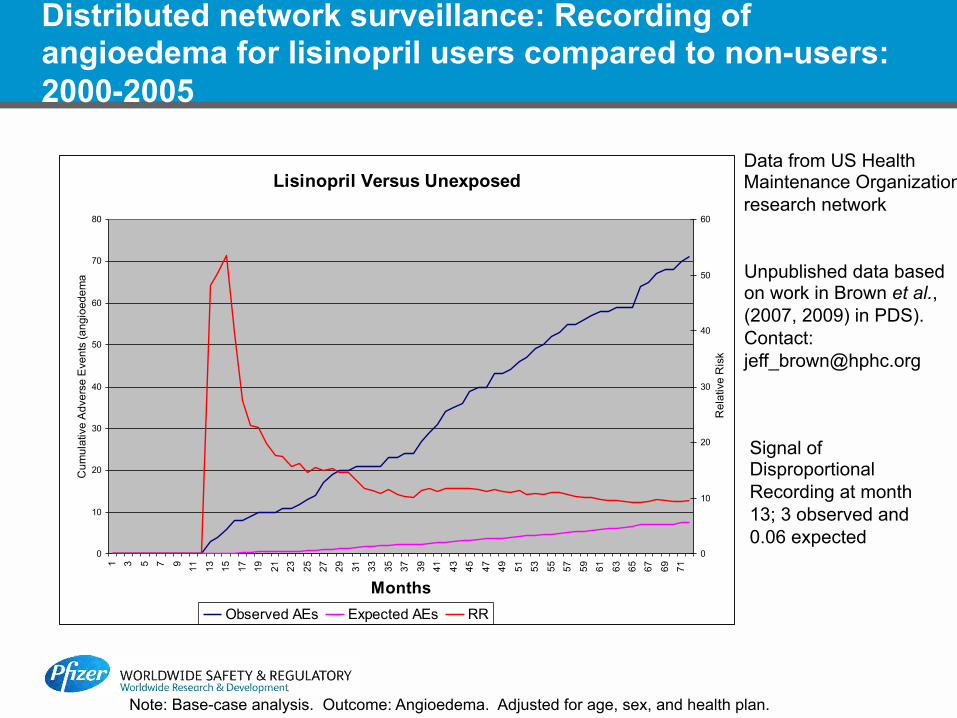
Distributed network surveillance: Recording of angioedema for lisinopril users compared to non-users: 2000-2005
Lisinopril Versus Unexposed
0
10
20
30
40
50
60
70
80
1 3 5 7 9 11 13 15 17 19 21 23 25 27 29 31 33 35 37 39 41 43 45 47 49 51 53 55 57 59 61 63 65 67 69 71
Months
Cum
ulat
ive
Adv
erse
Eve
nts
(ang
ioed
ema)
0
10
20
30
40
50
60
Rel
ativ
e R
isk
Observed AEs Expected AEs RR
Unpublished data based on work in Brown et al., (2007, 2009) in PDS). Contact: [email protected]
Note: Base-case analysis. Outcome: Angioedema. Adjusted for age, sex, and health plan.
Signal of Disproportional Recording at month 13; 3 observed and 0.06 expected
Data from US Health Maintenance Organization research network
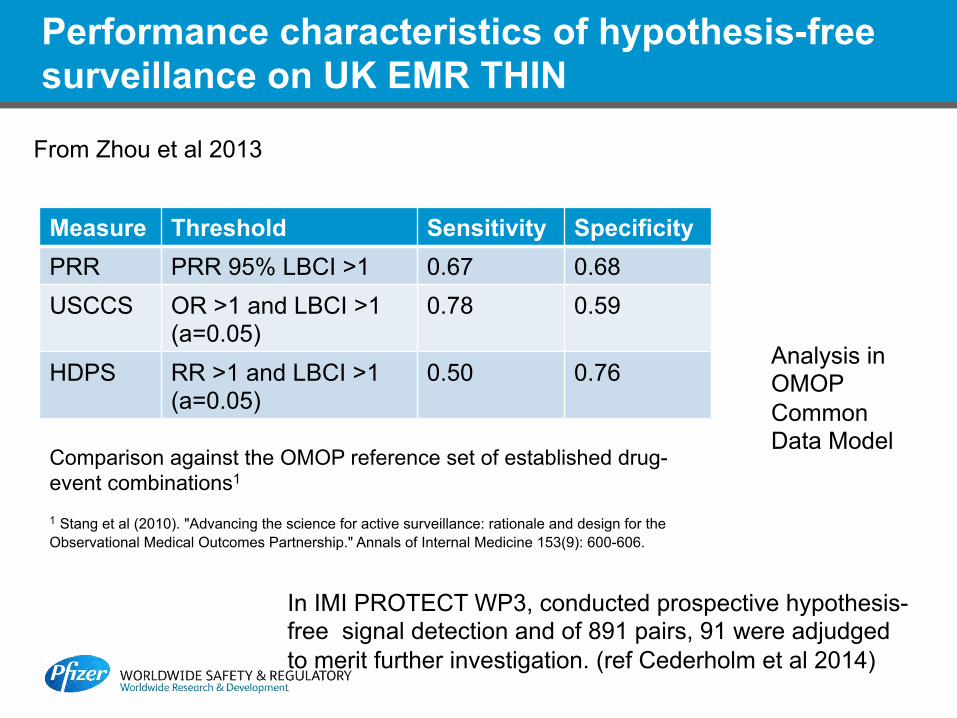
Performance characteristics of hypothesis-free surveillance on UK EMR THIN
Measure Threshold Sensitivity Specificity PRR PRR 95% LBCI >1 0.67 0.68 USCCS OR >1 and LBCI >1
(a=0.05) 0.78 0.59
HDPS RR >1 and LBCI >1 (a=0.05)
0.50 0.76
Comparison against the OMOP reference set of established drug-event combinations1
1 Stang et al (2010). "Advancing the science for active surveillance: rationale and design for the Observational Medical Outcomes Partnership." Annals of Internal Medicine 153(9): 600-606.
From Zhou et al 2013
In IMI PROTECT WP3, conducted prospective hypothesis-free signal detection and of 891 pairs, 91 were adjudged to merit further investigation. (ref Cederholm et al 2014)
Analysis in OMOP Common Data Model
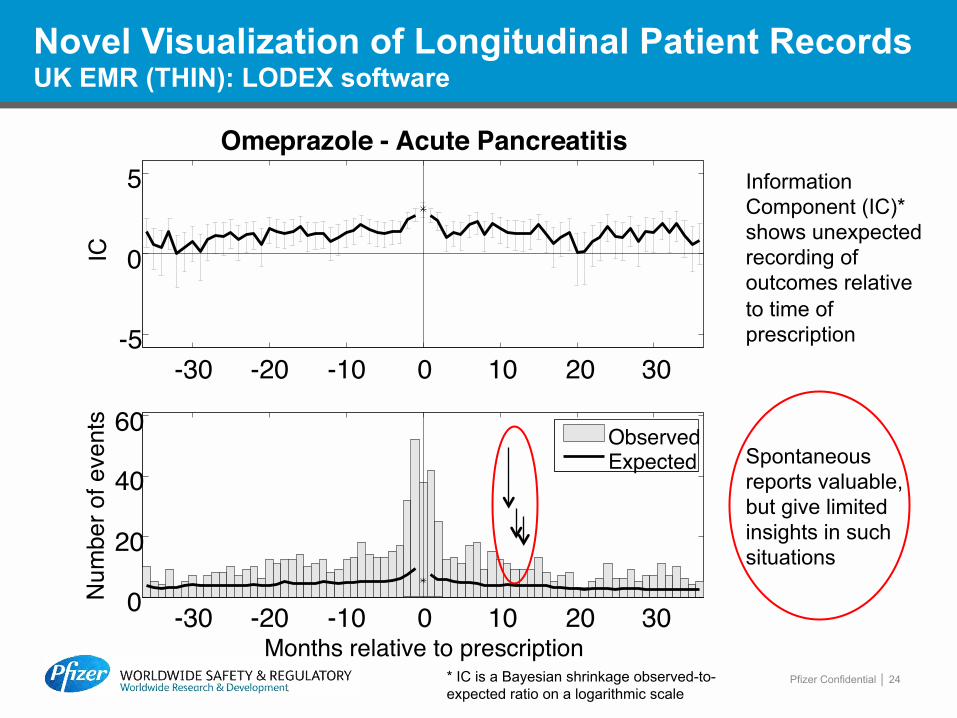
-30 -20 -10 0 10 20 30 -5
0
5 Omeprazole - Acute Pancreatitis
IC
-30 -20 -10 0 10 20 30 0
20
40
60
Months relative to prescription
Num
ber o
f eve
nts
Observed Expected
Pfizer Confidential │ 24
Spontaneous reports valuable, but give limited insights in such situations
Information Component (IC)* shows unexpected recording of outcomes relative to time of prescription
Novel Visualization of Longitudinal Patient Records UK EMR (THIN): LODEX software
* IC is a Bayesian shrinkage observed-to-expected ratio on a logarithmic scale

Variability in longitudinal data capture for healthcare analyses – getting richer data?
25
Patient Time
A
B
C
D
E
F
Structured data in a given data source (e.g., drug prescriptions, diagnosis codes)
Structured data from another source (e.g., inpatient data as well as primary care data)
Unstructured data - info solely gleaned from free text narrative (e.g. lab tests, clinical text observations) e.g. using Natural Language Processing
Information not routinely captured in records (e.g., herbal administration, prescriber and patient attitudes)
Prospective monitoring/collection and capture of new/more accurate data (e.g., DNA information, walked steps per day)
Data that only can be gleaned by interactive, often iterative discussion with healthcare provider, leading to further investigations and tests, and subsequent data capture (e.g., record specific triggering further lab tests)
Other challenges: Ø Missing patients, and observation time Ø Accuracy of listed data (and time
stamping) Ø Duplicated/overlapping information Ø Inconsistent recording across records
(difficulty linking underlying concepts)
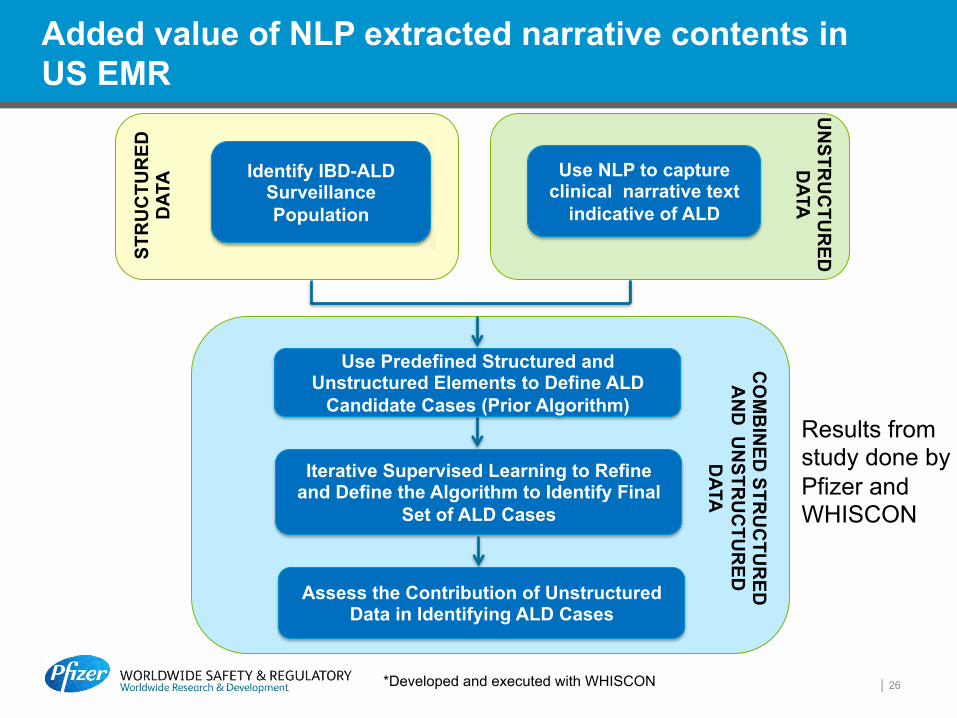
Added value of NLP extracted narrative contents in US EMR
│ 26
STR
UC
TUR
ED
DAT
A U
NSTR
UC
TUR
ED
DATA
Use NLP to capture clinical narrative text
indicative of ALD
Identify IBD-ALD Surveillance Population
Iterative Supervised Learning to Refine and Define the Algorithm to Identify Final
Set of ALD Cases
Assess the Contribution of Unstructured Data in Identifying ALD Cases
Use Predefined Structured and Unstructured Elements to Define ALD
Candidate Cases (Prior Algorithm)
CO
MB
INED
STRU
CTU
RED
A
ND
UN
STRU
CTU
RED
D
ATA
*Developed and executed with WHISCON
Results from study done by Pfizer and WHISCON
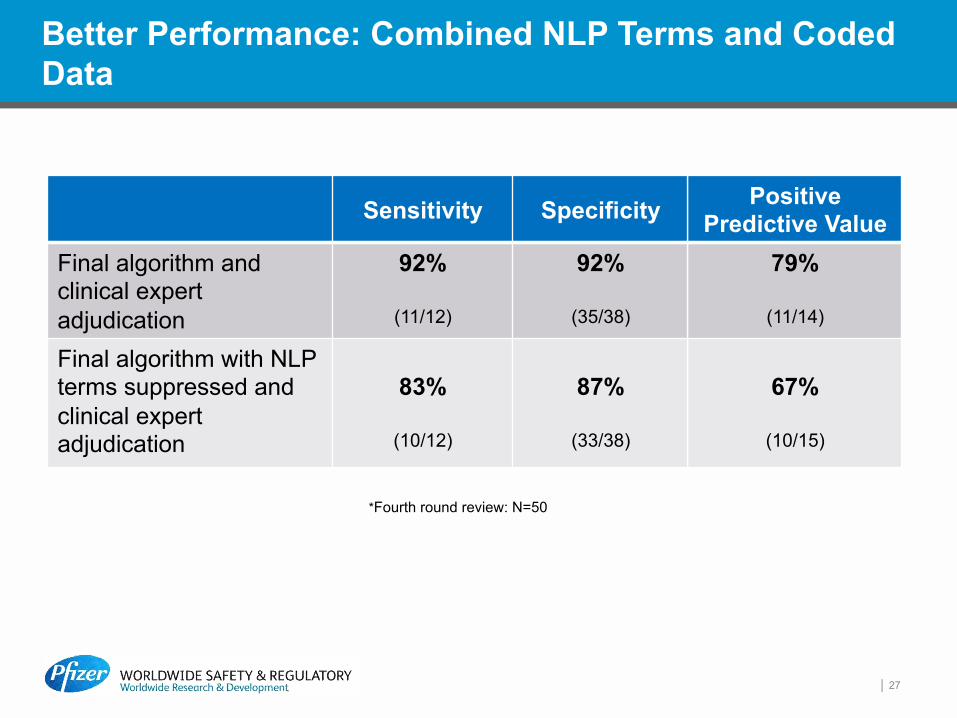
Better Performance: Combined NLP Terms and Coded Data
│ 27
Sensitivity Specificity Positive Predictive Value
Final algorithm and clinical expert adjudication
92%
(11/12)
92%
(35/38)
79%
(11/14)
Final algorithm with NLP terms suppressed and clinical expert adjudication
83%
(10/12)
87%
(33/38)
67%
(10/15)
*Fourth round review: N=50

NLP Data Contributed to Defining ALD Onset Dates and Getting Earlier ALD Onset Dates
ALD Cases N=4026
Onset date due to inclusion NLP
N=348 (9%)
Earlier Onset date due to NLP N=220 (5%)
Same onset date with or without NLP N=3458 (86%)
Earlier Onset within one month
N=183 (83%)
Earlier Onset b/w 1 to 6 months
N=10 (5%)
Earlier Onset >6 months
N=27 (12%)

Case Study: RWD Augmentation to Study Psoriasis and Chronic Kidney Disease
• Hypothesis for testing: Association between Psoriasis and Chronic Kidney Disease (CKD)?
• Psoriasis severity not recorded directly in UK EMR data • Conducted primary data collection on embedded subset
of psoriasis patients within the UK EMR “THIN” – GP directly measured Psoriasis extent by body surface
area • Study showed increasing association of CKD with
psoriasis severity • Reference: Wan et al (2013) Risk of moderate to
advanced kidney disease in patients with psoriasis: population based cohort study. BMJ 347
29
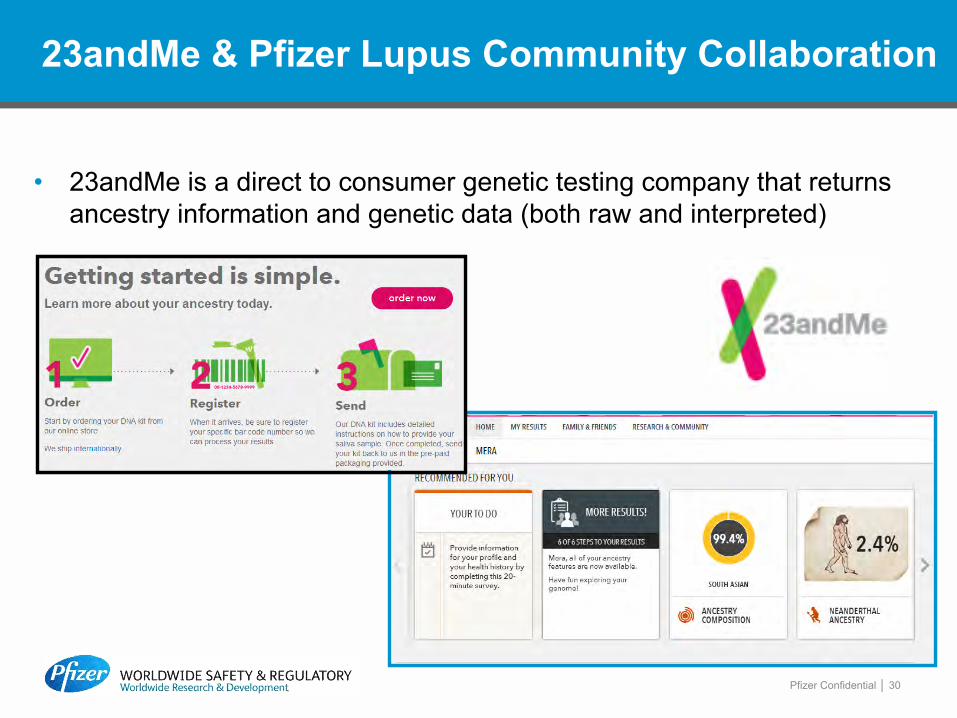
23andMe & Pfizer Lupus Community Collaboration
Pfizer Confidential │ 30
• 23andMe is a direct to consumer genetic testing company that returns ancestry information and genetic data (both raw and interpreted)
23andMe & Pfizer Lupus Community Collaboration
Pfizer Confidential │ 31
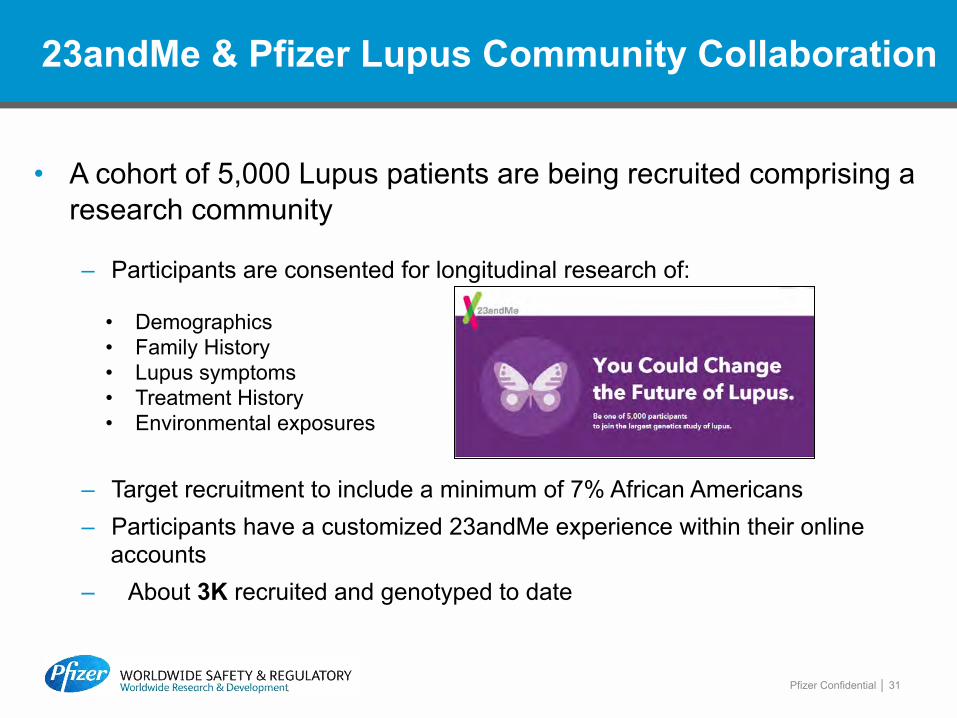
• A cohort of 5,000 Lupus patients are being recruited comprising a research community
– Participants are consented for longitudinal research of: – Target recruitment to include a minimum of 7% African Americans – Participants have a customized 23andMe experience within their online
accounts – About 3K recruited and genotyped to date
• Demographics • Family History • Lupus symptoms • Treatment History • Environmental exposures
23andMe & Pfizer IBD Community Collaboration
Pfizer Confidential │ 32
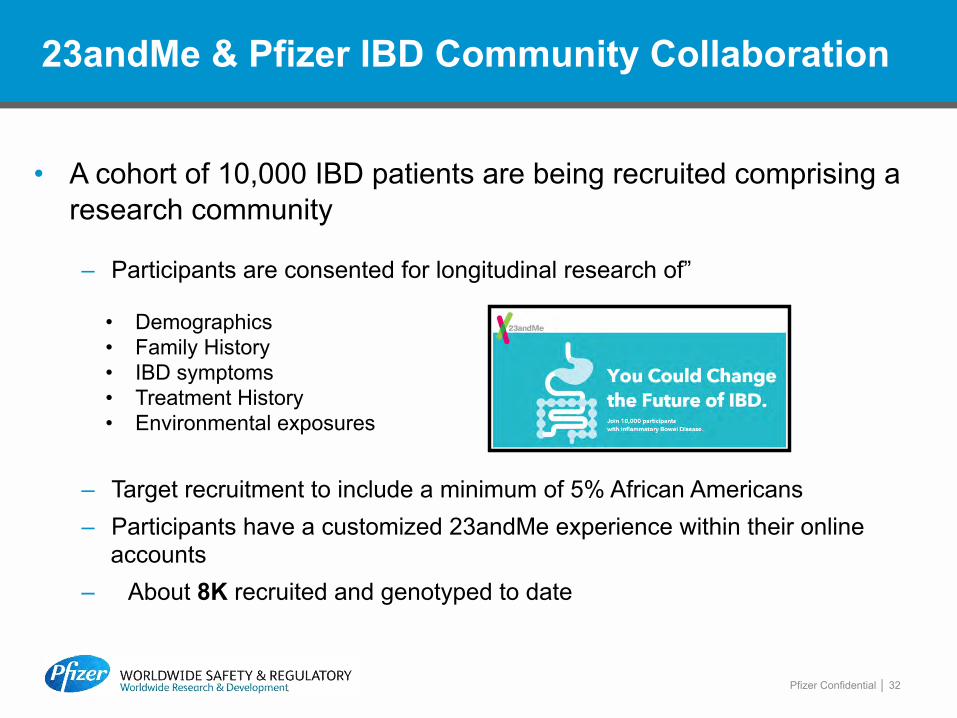
• A cohort of 10,000 IBD patients are being recruited comprising a research community
– Participants are consented for longitudinal research of” – Target recruitment to include a minimum of 5% African Americans – Participants have a customized 23andMe experience within their online
accounts – About 8K recruited and genotyped to date
• Demographics • Family History • IBD symptoms • Treatment History • Environmental exposures
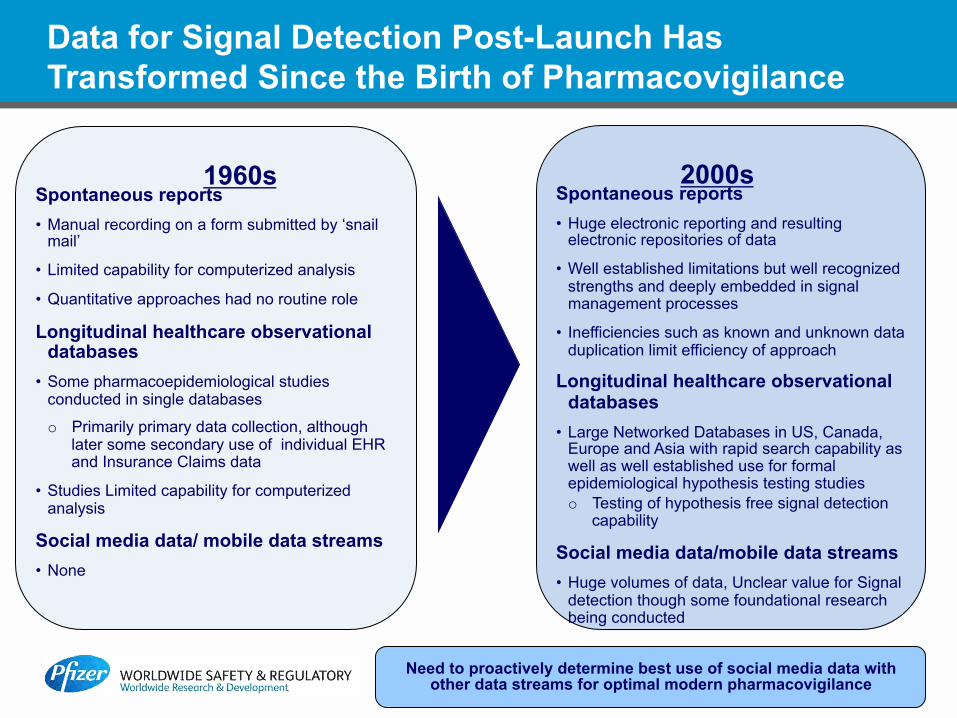
Spontaneous reports • Manual recording on a form submitted by ‘snail
mail’
• Limited capability for computerized analysis
• Quantitative approaches had no routine role
Longitudinal healthcare observational databases
• Some pharmacoepidemiological studies conducted in single databases
o Primarily primary data collection, although later some secondary use of individual EHR and Insurance Claims data
• Studies Limited capability for computerized analysis
Social media data/ mobile data streams • None
Spontaneous reports • Huge electronic reporting and resulting
electronic repositories of data
• Well established limitations but well recognized strengths and deeply embedded in signal management processes
• Inefficiencies such as known and unknown data duplication limit efficiency of approach
Longitudinal healthcare observational databases
• Large Networked Databases in US, Canada, Europe and Asia with rapid search capability as well as well established use for formal epidemiological hypothesis testing studies o Testing of hypothesis free signal detection
capability
Social media data/mobile data streams • Huge volumes of data, Unclear value for Signal
detection though some foundational research being conducted
Data for Signal Detection Post-Launch Has Transformed Since the Birth of Pharmacovigilance
Need to proactively determine best use of social media data with other data streams for optimal modern pharmacovigilance
1960s 2000s
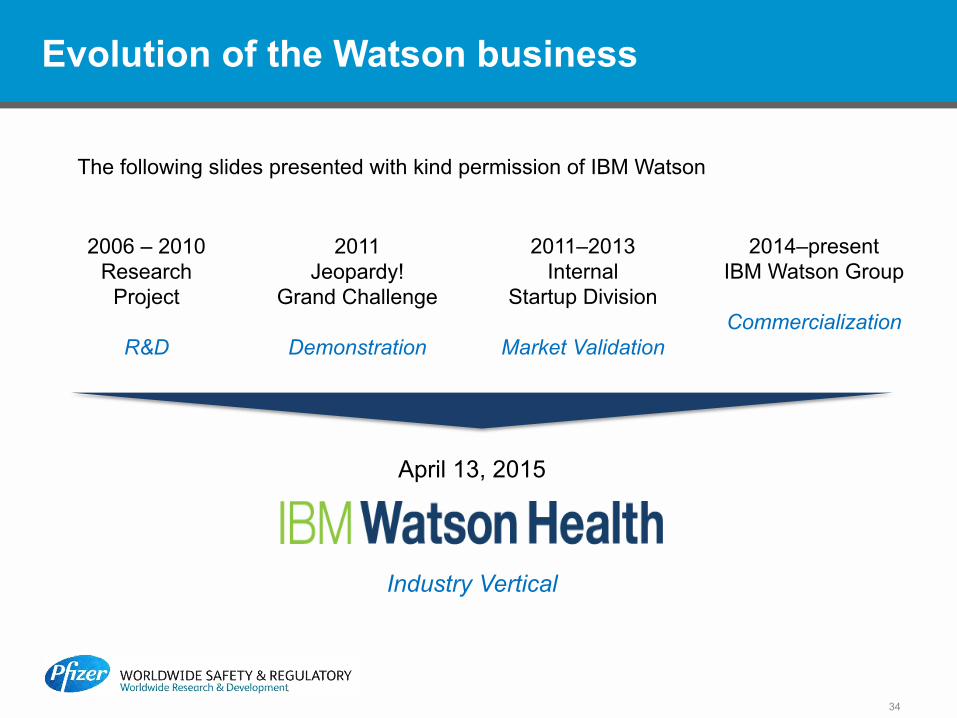
Evolution of the Watson business
The following slides presented with kind permission of IBM Watson
2011 Jeopardy!
Grand Challenge
Demonstration
2006 – 2010 Research
Project
R&D
2011–2013 Internal
Startup Division
Market Validation
2014–present IBM Watson Group
Commercialization
April 13, 2015
Industry Vertical
34
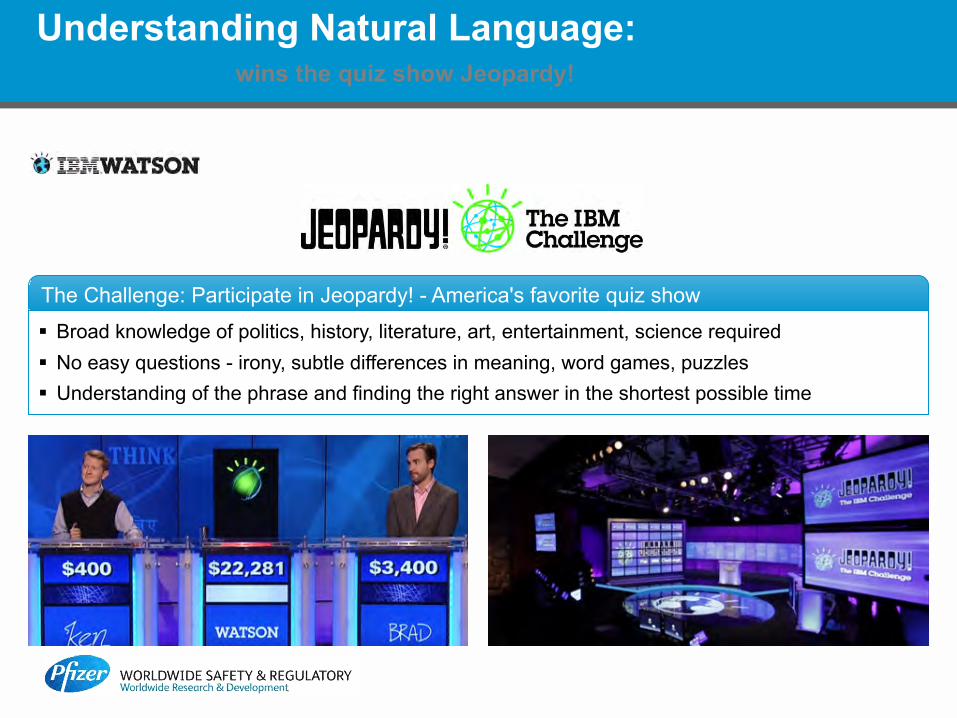
Understanding Natural Language: wins the quiz show Jeopardy!
The Challenge: Participate in Jeopardy! - America's favorite quiz show
§ Broad knowledge of politics, history, literature, art, entertainment, science required § No easy questions - irony, subtle differences in meaning, word games, puzzles § Understanding of the phrase and finding the right answer in the shortest possible time
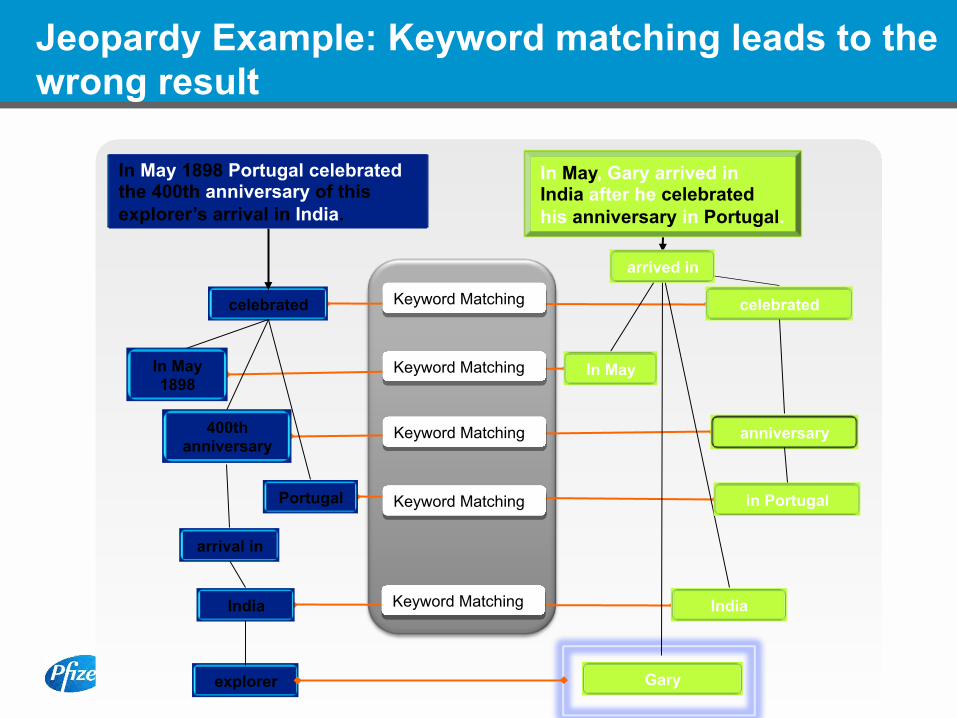
Jeopardy Example: Keyword matching leads to the wrong result
celebrated
India
In May 1898
400th anniversary
arrival in
Portugal
India
In May
Gary explorer
celebrated
anniversary
in Portugal
Keyword Matching
Keyword Matching
Keyword Matching
Keyword Matching
Keyword Matching
In May, Gary arrived in India after he celebrated his anniversary in Portugal.
arrived in
In May 1898 Portugal celebrated the 400th anniversary of this explorer’s arrival in India.
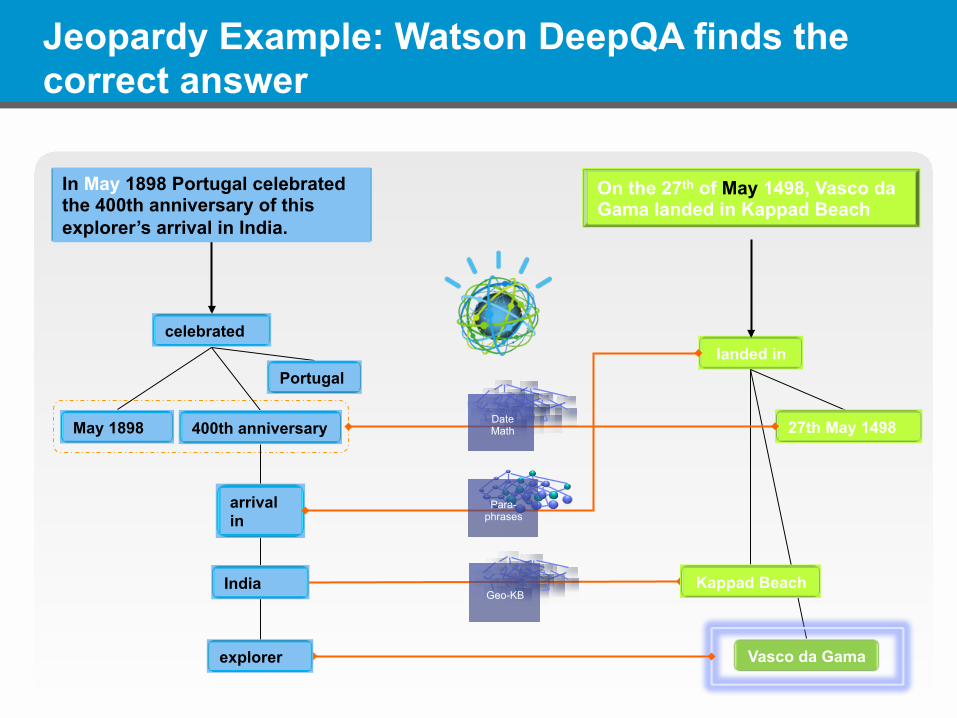
celebrated
May 1898 400th anniversary
arrival in
In May 1898 Portugal celebrated the 400th anniversary of this explorer’s arrival in India.
Portugal landed in
27th May 1498
Vasco da Gama
On the 27th of May 1498, Vasco da Gama landed in Kappad Beach
Kappad Beach
Para-phrases
Geo-KB
Date Math
explorer
India
Jeopardy Example: Watson DeepQA finds the correct answer
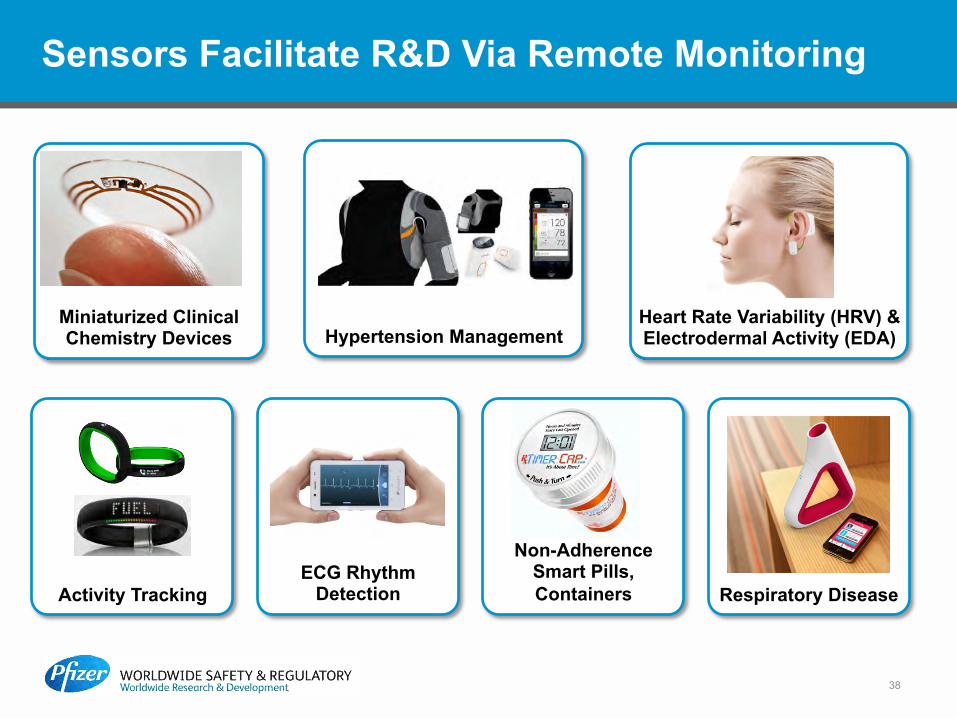
Miniaturized Clinical Chemistry Devices
Sensors Facilitate R&D Via Remote Monitoring
38
Hypertension Management
Activity Tracking ECG Rhythm
Detection
Non-Adherence Smart Pills, Containers Respiratory Disease
Heart Rate Variability (HRV) & Electrodermal Activity (EDA)
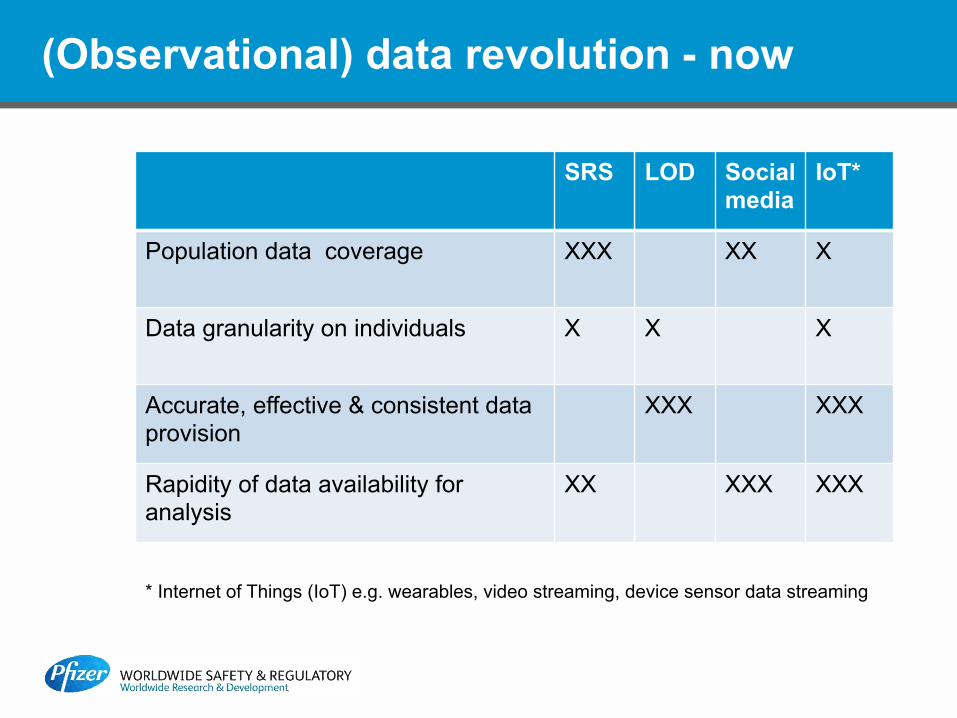
(Observational) data revolution - now
SRS LOD Social media
IoT*
Population data coverage XXX XX X
Data granularity on individuals X X X
Accurate, effective & consistent data provision
XXX XXX
Rapidity of data availability for analysis
XX XXX XXX
* Internet of Things (IoT) e.g. wearables, video streaming, device sensor data streaming
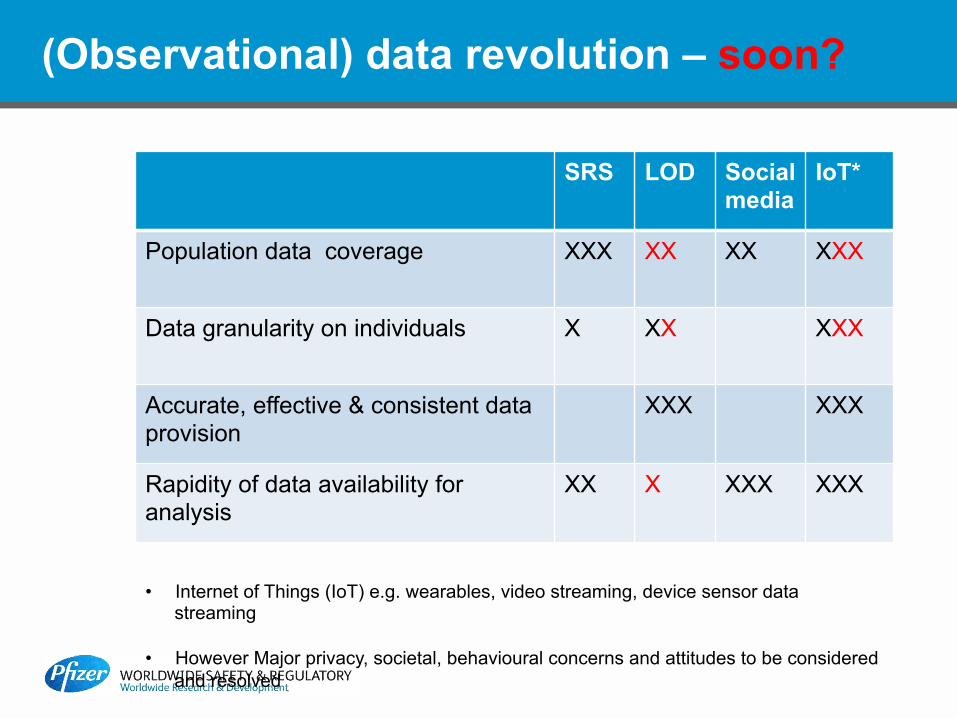
(Observational) data revolution – soon?
SRS LOD Social media
IoT*
Population data coverage XXX XX XX XXX
Data granularity on individuals X XX XXX
Accurate, effective & consistent data provision
XXX XXX
Rapidity of data availability for analysis
XX X XXX XXX
• Internet of Things (IoT) e.g. wearables, video streaming, device sensor data streaming
• However Major privacy, societal, behavioural concerns and attitudes to be considered and resolved
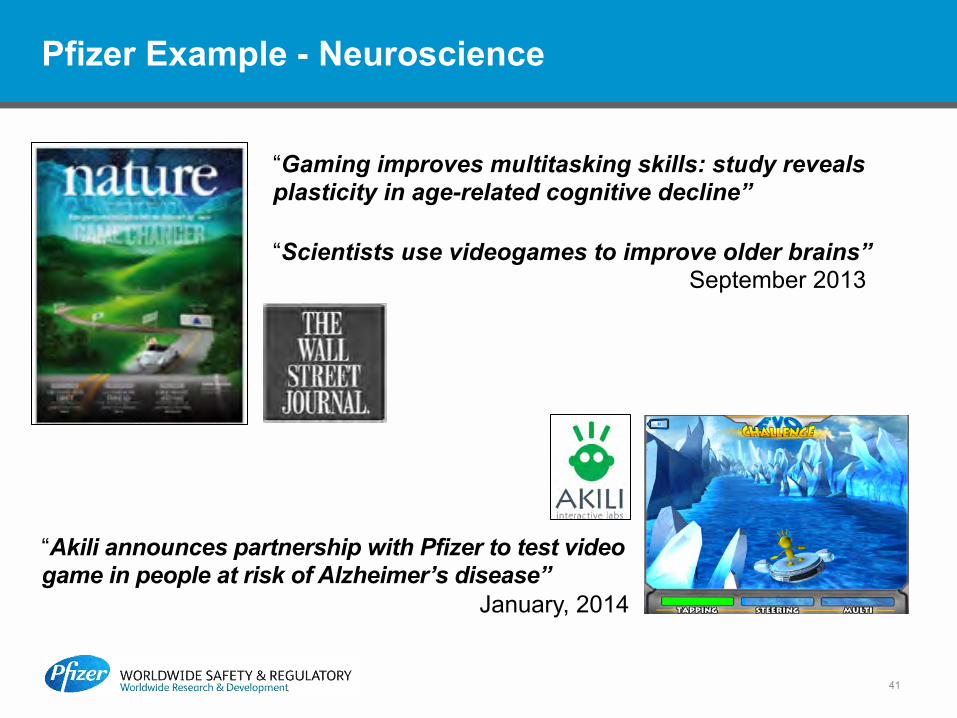
Pfizer Example - Neuroscience
“Scientists use videogames to improve older brains” September 2013
“Gaming improves multitasking skills: study reveals plasticity in age-related cognitive decline”
“Akili announces partnership with Pfizer to test video game in people at risk of Alzheimer’s disease”
January, 2014
41

BACK UPs
Pfizer Confidential │ 42
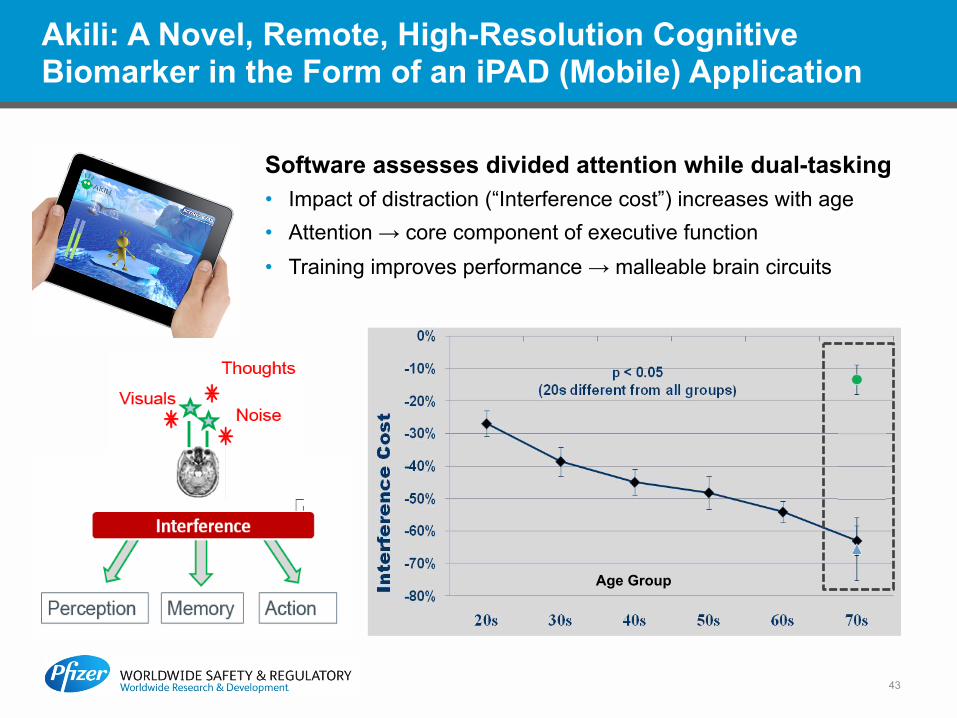
Akili: A Novel, Remote, High-Resolution Cognitive Biomarker in the Form of an iPAD (Mobile) Application
Software assesses divided attention while dual-tasking • Impact of distraction (“Interference cost”) increases with age • Attention → core component of executive function • Training improves performance → malleable brain circuits
Age Group
43
Conclusions
• Big Data Strategies including ‘Real World Data' use are employed throughout the drug development lifecycle, including Safety – ‘Big Data’ solutions focusing solely on observational data will
never provide a panacea and must ensure data security and privacy
• Analyzing more and more data does not automatically lead to more appropriate conclusions, and RCTs and other data types do and will continue to retain a key role
• IT developments have led to more capability and interest in conducting analyses across networks of many distinct observational ‘real world’ databases
– Examples, such as the Sentinel Network, use ‘distributed data networks’ – Efforts to enrich data for analyses, by embedding primary data collection or mining
clinical narratives for additional information are important – mData is an important develop for the future of Pharmacovigilance
44
Back up
Spontaneous reporting as a tool for Pharmacovigilance
• Analysis of spontaneous reports of suspected adverse drug reactions (ADRs) is a valuable tool in the detection of previously unknown drug adverse reactions
• Reports of adverse events (AEs) associated with a drug are not necessarily true ADRs, that is, they may be temporally associated with a drug but not caused by the drug.
• Hypothesis generation of new possible side effects from such data is referred to as ‘signal detection’ – An exploratory data analysis task
Ref Bate and Evans 2009 PDS
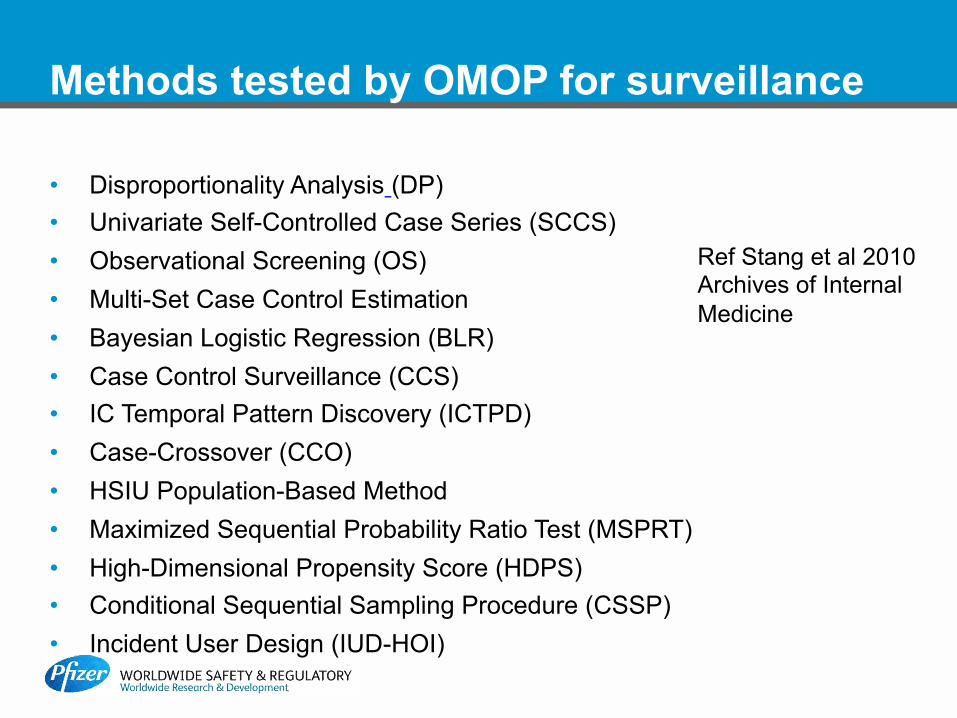
Methods tested by OMOP for surveillance
• Disproportionality Analysis (DP) • Univariate Self-Controlled Case Series (SCCS) • Observational Screening (OS) • Multi-Set Case Control Estimation • Bayesian Logistic Regression (BLR) • Case Control Surveillance (CCS) • IC Temporal Pattern Discovery (ICTPD) • Case-Crossover (CCO) • HSIU Population-Based Method • Maximized Sequential Probability Ratio Test (MSPRT) • High-Dimensional Propensity Score (HDPS) • Conditional Sequential Sampling Procedure (CSSP) • Incident User Design (IUD-HOI)
Ref Stang et al 2010 Archives of Internal Medicine
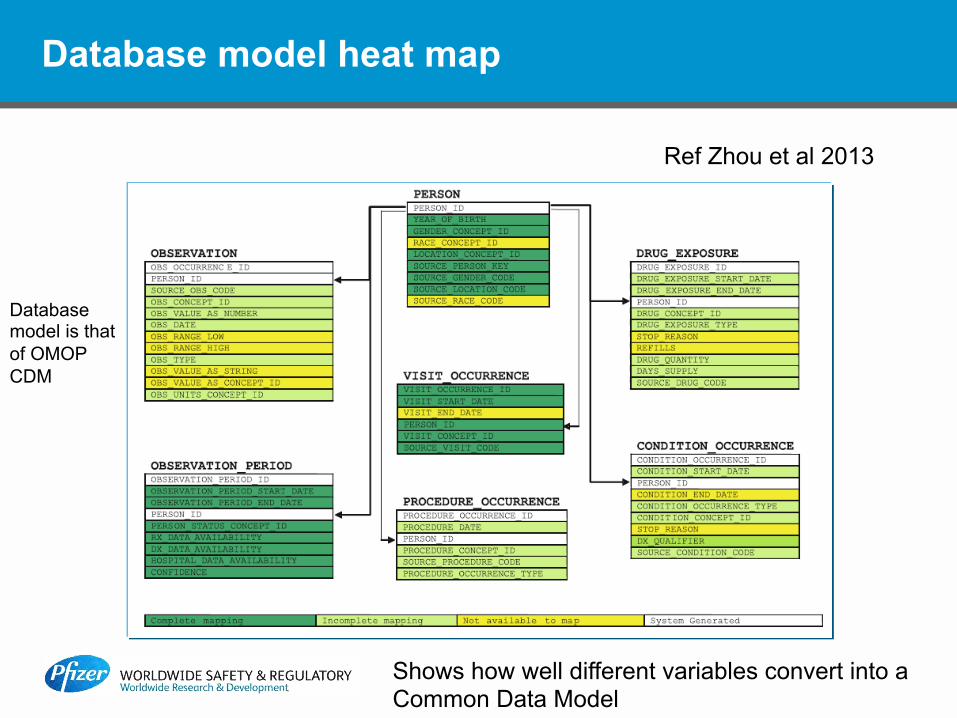
Database model heat map
Database model is that of OMOP CDM
Shows how well different variables convert into a Common Data Model
Ref Zhou et al 2013
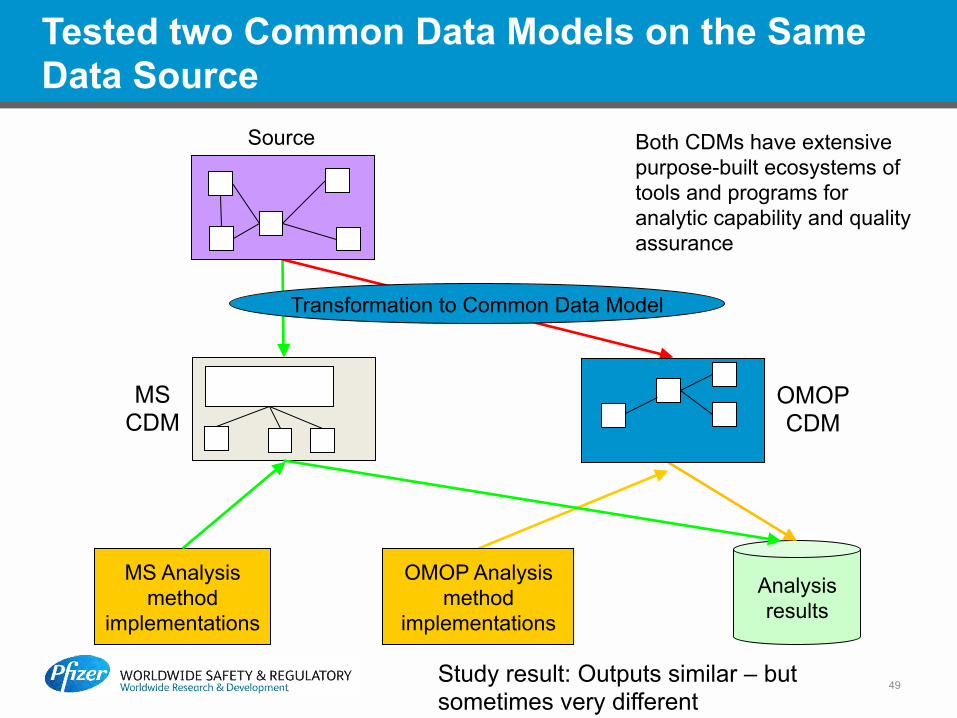
Tested two Common Data Models on the Same Data Source
49
Source
Analysis results
MS Analysis method
implementations
Transformation to Common Data Model
OMOP Analysis method
implementations
MS CDM
OMOP CDM
Both CDMs have extensive purpose-built ecosystems of tools and programs for analytic capability and quality assurance
Study result: Outputs similar – but sometimes very different
Issues to consider in selection of RWD
• Suitability of RWD source to address the question of interest – Data capture and its structure – Accessibility
• Assurance of data security and especially patient privacy • Demonstrability of data and analysis integrity • Recency of data available for analysis • Stakeholder needs
Procedures
51
• Common protocol for each drug-AE pair – Extensive sensitivity analyses on main
methodological issues
• Common standards, templates, procedures – Detailed data specification including definitions of
exposures, outcomes, and confounders for each database.
• Blinding of results of analyses within drug– AE teams and across WPs

ICΔ* shows unexpected frequent recording of outcome after terbinafine prescription
Example: Demonstrated Use of EMR Data for Early Identification of Drug Side Effects
* ICΔ is the difference in IC before and after prescription on a logarithmic scale 52
Angioedema was labelled In January 2004
However extensive testing of all such methods show imperfect performance
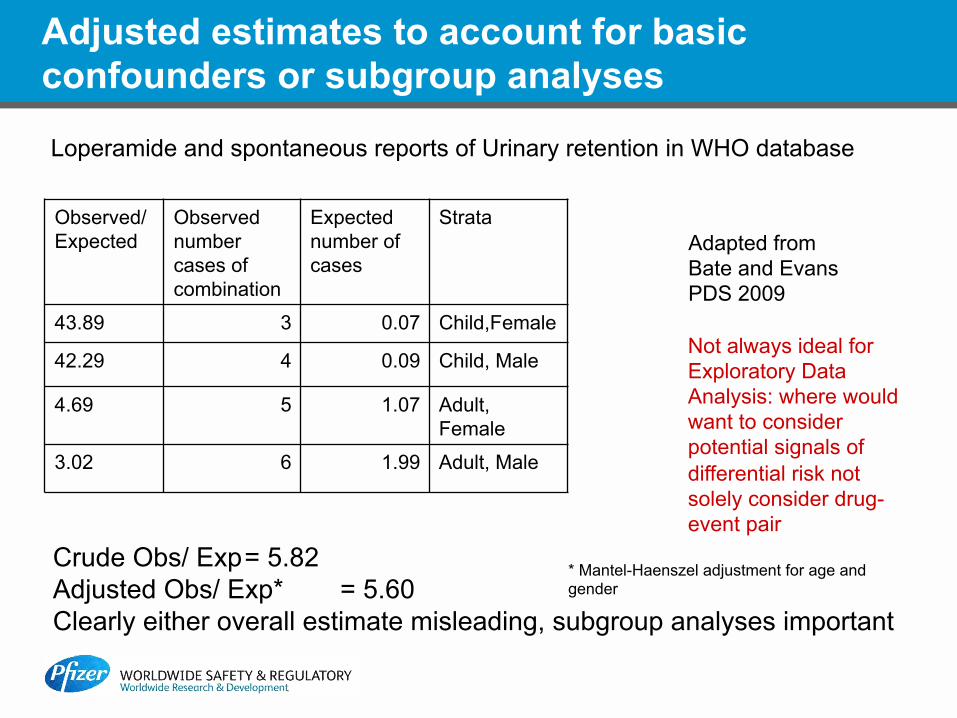
Observed/ Expected
Observed number cases of combination
Expected number of cases
Strata
43.89 3 0.07 Child,Female
42.29 4 0.09 Child, Male
4.69 5 1.07 Adult, Female
3.02 6 1.99 Adult, Male
Crude Obs/ Exp = 5.82 Adjusted Obs/ Exp* = 5.60 Clearly either overall estimate misleading, subgroup analyses important
Adapted from Bate and Evans PDS 2009
Not always ideal for Exploratory Data Analysis: where would want to consider potential signals of differential risk not solely consider drug-event pair
Loperamide and spontaneous reports of Urinary retention in WHO database
Adjusted estimates to account for basic confounders or subgroup analyses
* Mantel-Haenszel adjustment for age and gender
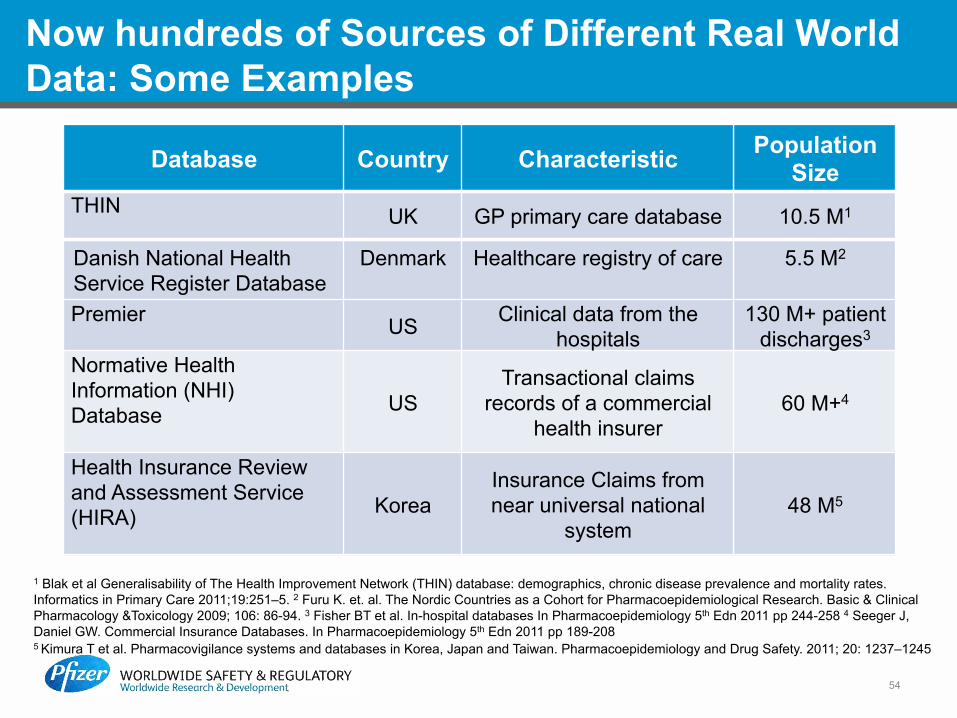
Now hundreds of Sources of Different Real World Data: Some Examples
Database Country Characteristic Population Size
THIN UK GP primary care database 10.5 M1
Danish National Health Service Register Database
Denmark Healthcare registry of care 5.5 M2
Premier US Clinical data from the
hospitals 130 M+ patient
discharges3 Normative Health Information (NHI) Database US
Transactional claims records of a commercial
health insurer 60 M+4
Health Insurance Review and Assessment Service (HIRA) Korea
Insurance Claims from near universal national
system 48 M5
1 Blak et al Generalisability of The Health Improvement Network (THIN) database: demographics, chronic disease prevalence and mortality rates. Informatics in Primary Care 2011;19:251–5. 2 Furu K. et. al. The Nordic Countries as a Cohort for Pharmacoepidemiological Research. Basic & Clinical Pharmacology &Toxicology 2009; 106: 86-94. 3 Fisher BT et al. In-hospital databases In Pharmacoepidemiology 5th Edn 2011 pp 244-258 4 Seeger J, Daniel GW. Commercial Insurance Databases. In Pharmacoepidemiology 5th Edn 2011 pp 189-208 5 Kimura T et al. Pharmacovigilance systems and databases in Korea, Japan and Taiwan. Pharmacoepidemiology and Drug Safety. 2011; 20: 1237–1245
54

Record linkage efforts over the years to improve safety surveillance - Examples
• Adverse event prediction for antidepressants using neural net based on chemical structural properties and receptor activity – Alvager et al 1993 – Almenoff et al 2011 similar chemical structure and chemical and
biological property linkage • Linked spontaneous reports to CYP 450 activity information for
drug-drug interaction signal detection – Strandell et al 2011
• Complementary value of signal detection across data streams – Pacurariu et al 2015
• Basic spontaneous report analysis process linked to EHR data and systems biology, with experimental validation of outputs – Tatonetti et al 2009, Lorberbaum et al 2015

PROTECT Goal
These methods are being tested in real-world situations
To strengthen the monitoring of benefit-risk of medicines in Europe by developing
innovative methods
to enhance early detection and assessment of adverse drug reactions from different data
sources (clinical trials, spontaneous reporting and
observational studies)
to enable the integration and presentation of data
on benefits and risks
www.imi-protect.eu 56
• Largest private/public partnership in EU. EMA coordinates PROTECT and a consortium of public and private partners
Other interesting applications of vision mining and data augementation
Sagawa R, Yoshiyasu Y, Alspach A, Ayusawa K, Yamane K, Hilton A.
Analyzing Muscle Activity and Force with Skin Shape Captured by Non-contact Visual Sensor. In Image and Video Technology 2015 Nov 25 (pp. 488-501). Springer International Publishing.
Also with the advent of 3D printing who knows what benefits that bring to
bear

Background reading
• Bate A et al. Designing and incorporating a Real World Data approach to international drug development and use - what the UK offers. Drug Discovery Today. In Press
• Behrman RE et al (2011). Developing the Sentinel System—a national resource for evidence development. New England Journal of Medicine, 364(6), 498-499.
• Brown, JS et al. (2009). Early adverse drug event signal detection within population‐based health networks using sequential methods: key methodologic considerations. Pharmacoepidemiology and drug safety, 18(3), 226-234.
• Cederholm S et al. 2014 Structured assessment for prospective identification of safety signals in electronic medical records: evaluation in The Health Improvement Network. Drug Safety. 38(1), 87-100.
• Stang et al (2010) Advancing the Science for Active Surveillance: Rationale and Design for the Observational Medical Outcomes Partnership Annals in Medicine 153(9), 600-6
• Walker AM, Zhou X, Ananthakrishnan AN, Weiss LS, Shen R, Sobel RE, Bate A, Reynolds RF. Computer-Assisted Expert Case Definition in Electronic Health Records. International Journal of Medical Informatics. In Press
• Xu Y et al A Comparative Assessment of Observational Medical Outcomes Partnership and Mini- Sentinel Common Data Models and Analytics: Implications for Active Drug Safety Surveillance. Drug Safety. 38(8), 749-765.
58