bij balanced score for the balanced scorecard: a ... · balanced score for the balanced scorecard:...
TRANSCRIPT

Balanced score for the balancedscorecard: a benchmarking tool
M. PunniyamoorthyFaculty of Production and Operations and Finance,
Department of Management Studies, National Institute of Technology,Tiruchirappalli, India, and
R. MuraliFaculty of Human Resources and Finance, Department of Management Studies,
National Institute of Technology, Tiruchirappalli, India
Abstract
Purpose – The purpose of this paper is to create a model called “Balanced score for the balancedscore card” and to provide an objective benchmarking indicator for evaluating the achievement of thestrategic goals of the company.
Design/methodology/approach – The paper uses the concepts of “Balanced scorecard” proposedby Robert. S. Kaplan and David P. Norton. This paper also adopts the model given by Brown P.A. andGibson D.F. and the extension to the model provided by P.V. Raghavan and M. Punniyamoorthy.Preference theory is used to calculate the relative weightage for each factor, using the process of pairwise comparison. The balanced score for balanced scorecard provides a single value by taking intoaccount all the essential objective and subjective factors – be it financial or non-financial. It alsoprovides a suitable weightages for those parameters. The target performance and the actualperformance are compared and the analysis is made.
Findings – Information from a leading organization was obtained and the balanced score for abalance scorecard was calculated for that organization. The variations were analyzed through thismodel. The depth and objectivity in the analysis is highlighted.
Research limitations/implications – This provides a single bench marking measure to evaluatehow far the firm had been successful in achieving the strategies. The paper has adopted the preferencetheory which limits the weightage to be accorded to the factors concerned. However, furtherrefinement can be provided by the usage of analytic hierarchy process for arriving suitableweightages.
Practical implications – The organization can calculate the balanced score by themselves, byassigning appropriate importance to the activities – as they deem fit. It is a tailor made benchmarkinginformation system created by the firm for itself.
Originality/value – This is of value to the top management to identify the important activities andsetting suitable target measures to be achieved in those activities. The variations are arrived bycomparing the targeted performance with the actual. This will help the firm to take suitable actionsunder those parameters where there are significant deviations.
Keywords Balanced scorecard, Benchmarking, Corporate strategy, Analytical hierarchy process
Paper type Research paper
IntroductionBusinesses houses are continuously striving to be successful amidst the increasinglycompetitive and constantly changing environments. To achieve that, they must bewilling to adopt any processes and accept any benchmarking standards which wouldhelp them in not only doing things right but also in doing the right thing.
The current issue and full text archive of this journal is available at
www.emeraldinsight.com/1463-5771.htm
BIJ15,4
420
Benchmarking: An InternationalJournalVol. 15 No. 4, 2008pp. 420-443q Emerald Group Publishing Limited1463-5771DOI 10.1108/14635770810887230

The bench mark so accepted should be a:. reference or measurement standard for comparison;. performance measurement that is the standard of excellence for a specific
business; and. measurable, best-in-class achievement (“On what is a benchmark?”, available at:
http://retailindustry.about.com/library/terms/b/bld_benchmark.htm).
Competition has become so intense that managers do have less time to respond tomarket situation. Efficiency in operations and profitability are the key words in drivingthe organizations today to remain competitive. The rapid technological developmentsand improvements in communication have forced the manager to deal with a largequantum of data and arrive at the decision, which would produce results comparable tothe market standards. This makes the process little too complex. What they perhapsneed is some benchmarking indicators to process the data objectively and to come to aconclusion not only correctly but also quickly.
It is observed:
Benchmarking is a process used in management and particularly strategic management, inwhich organizations evaluate various aspects of their processes in relation to best practice,usually within their own sector. This then allows organizations to develop plans on how toadopt such best practice, usually with the aim of increasing some aspect of performance.Benchmarking may be a one-off event, but is often treated as a continuous process in whichorganizations continually seek to challenge their practices. Benchmarking opensorganizations to new methods, ideas and tools to improve their effectiveness. It helps crackthrough resistance to change by demonstrating other methods of solving problems than theone currently employed, and demonstrating that they work (“On best process ofbenchmarking”, available at: www.managementupdate.info/benchmarking.htm).
Therefore, through this paper, we have devised a process of calculating a suitablebench mark figure called “Balanced score” through which the achievements of theperformance in the implementation of the strategy by the firm can be evaluated.
The paper uses the concepts of “Balanced scorecard” proposed by Kaplan andNorton (1992a); and the model adopted by Brown and Gibson (1972) along with theextension to the model provided by Ragavan and Punniyamoorthy (2003) to arrive at asingle measure called “balanced score”.
Need for incorporation of strategic intent in every activityOver the years, the economies have grown leaps and bounds and the companiesthemselves have outgrown several times. In order to grow further and at a rapid pace,most of them have branched out to become global players. This had forced them tomeet larger competition and high volatility in the business environment they operate:
Strategy is the direction and scope of an organization over the long term: Which achieves theadvantage for the organization through its configuration of resources within a changingenvironment, to meet the needs of the markets and to fulfill stakeholder expectation ( Jhonsonand Scholes, 2001).
Every act initiated by the competitors or its customers of the company has far reachingconsequences. It may be that any single desire or the ambition by the top managementcan alter the destiny of the company.
Balanced scorefor the balanced
scorecard
421

Porter (1985) has suggested the five force model and in this model he provides emphasison all the relevant factors that an organization should consider. He says that for anorganization to succeed it needs to take into account the firm, its competitors, its suppliers,its customers and also its substitutes. If all these are not monitored properly and thelinkages not understood correctly, then it can impede the performance of an organization.
A study contrasting high- and low-performing organizations yielded the data asshown in Table I.
So it becomes imperative for the managers to have the clear understanding of theultimate performance standards the firm has to achieve. Obviously, mereunderstanding may not suffice. They should also ensure that the information isproperly communicated down the line. Further the top management must be in aposition to periodically monitor the progress with regard to the achievement of thestrategic goals in order to ensure successful achievement of the strategies. For makinga meaningful evaluation, they must be having some objective measures to review theefficiency of the company taking into account all the dimensions of its operation.
It is observed that, in the present day context in any organization the intangiblefactors drive the tangibles assets. In a report on the Accounting for Intangibles, it wasstated that:
Human capital and structural capital are an indication of a company’s future value and abilityto generate financial results. This is why a more systematic method of reporting on andmanaging these intangible dimensions is needed (Skandia Reporting Model, 2001).
So the present day managers should also be proficient in reviewing the efficiency of thecompany in all the intangible components of the business operation, viz. in employeesatisfaction, quality standards, social obligations, customers and other non-financialwhich are very important to the success of an organization.
All the above requirements can be only linked effectively with the help of anappropriate strategy. This is because company can say to itself that it has fulfilled thepurpose of its existence only if it achieves the goals derived out of the strategicthinking process. If the company were to achieve its goals, then it would only meanthat all the parameters set for all the functions and activities of the firm are to beaccomplished.
Porter (1996) further describes:
Ultimately, all differences between companies in cost or price derive from hundredsof activities required to create, produce, sell and deliver their products or services [. . .]differentiation arises from both the choice of the activities and how they are performed.
Well-performing organizations(per cent)
Poorly-performing organizations(per cent)
Employees have a good 67 33Understanding of overallOrganization goalsSenior mangers are highly 26 0Effective communicatorsa
Source: aStewart (1999)Table I.
BIJ15,4
422

Obviously, the strategies adopted by the firm even to arrive a common generic goalsuch as, accomplishing higher sales, may be different depending upon theenvironments in which they operate and the strengths and weaknesses they possess.
“The researchers have observed Managing strategy is fundamentally different frommanaging operations” (Hope and Fraser, n.d.). It has also been outlined that:
An outstanding corporate strategy is not a random collection of individual building blocksbut a carefully constructed system of interdependent parts [. . .] [I]n a great corporatestrategy, all of the elements [resources, businesses and organization] are aligned with oneanother. This alignment is driven by the nature of the firm’s resources – its special assets,skills and capabilities (Kaplan, 1996).
Hence, it is needed for the organizations to develop a comprehensive strategic approachin all its levels and activities of functioning so that they can effectively initiate andmonitor all the activities.
Since, the strategies were all compartmentalized in the earlier cases, one departmentdid not understand the measures the others had taken. This resulted in the strategiesturning counterproductive and giving rise to the blame game. Hence, the need was feltfor developing some methods, which can ensure integration of the strategic content ineach and every function of the organization.
Further while implementing the strategies the firms face many a problems. It wasreported:
. only 5 per cent of the workforce understands their company strategy;
. only 25 per cent of managers have incentives linked to strategy;
. about 60 per cent of organizations do not link budgets to strategy;
. about 86 per cent of executive teams spend less than one hour per monthdiscussing strategy (balanced scorecard – BSC collaborative).
According to the BSC collaborative, there are four barriers to strategic implementation:
(1) Vision barrier. No one in the organization understands the strategies of theorganization.
(2) People barrier. Most people have objectives that are not linked to the strategy ofthe organization.
(3) Resource barrier. Time, energy, and money are not allocated to those things thatare critical to the organization. For example, budgets are not linked to strategy,resulting in wasted resources.
(4) Management barrier. Management spends too little time on strategy and toomuch time on short-term tactical decision making (Evans, n.d.).
All these observations call for not only developing proficiency in formulating anappropriate strategy to make the organizational goals relevant to the changingenvironment, but also call for an effective implementation of the strategy:
Managers intent on implementing strategy must coordinate a broad range of efforts aimed attransforming strategic intentions into action. Resulting actions constitute the firm’s realizedstrategy; and it reflects what an organization has done and ultimately determines how theorganizations will fare [. . .] Consequently, the ability to implement strategies is one of themost valuable of all managerial skills [. . .] Several factors impede strategy implementation
Balanced scorefor the balanced
scorecard
423

[. . .] Changing one element has a ripple effect that impacts other parts of the model, which inturn have their ripple effects and so on (Miller, 1998).
From the foregoing observations, we find that the “Balanced scorecard” is precisely theframework that enables the organization to implement the strategy successfully, asthis approach helps in providing adequate linkages, to enable the organizations toimplement complex and intricate activities involved in implementing the corporatestrategies and monitor every activities of the firm with the intent to achieve thestrategic objectives. It has also been observed that:
The balanced scorecard is a strategic performance management system that links performanceto strategy using a multi dimensional set of financial and non-financial performance measures.It focuses on better understanding the causal relationships and links within organizations andthe levers that can be pulled to improve corporate governance (Dye, 2003).
Balanced scorecard approachThe French and the Canadians were the first to use the BSC in a different form. TheFrench began using a measure called “the tableau de board”, or the dashboardof measure, which included both financial and non-financial measures. The emphasison quality in the American continent during the 1980s made Canadian companies toinclude non-financial measures also in evolving their business strategy. This was theinitial conception of the balanced scorecard (Stewart and Hubin, 2001).
Kaplan and Norton (1992b) had devised the BSC in its present form. They hadframed the BSC as a set of measures that allows for a holistic, integrated view of thebusiness process so as to measure the organization’s performance. The scorecard wasoriginally created to supplement “traditional financial measures with criteria thatmeasured performance from three additional perspectives – those of customers,internal business processes, and learning and growth” (Kaplan and Norton, n.d.).
In due course of time, the whole concept of the BSC evolved into a strategicmanagement system forming a bridge between the long- and short-term strategies ofan organization. Many companies readily adopted the BSC because it provided a singledocument in which the linkages of activities-more particularly by giving adequateimportance to both tangible and non-tangible factors were more vividly brought outthan in any other process adopted:
Clearly, opportunities for creating value are shifting from managing tangible assets tomanaging knowledge based strategies that deploy an organization’s intangible assets:Customer relationships, innovative products and services, high quality and responsiveoperative processes, information technology and databases and employee capabilities, skillsand motivation (Kaplan and Norton, n.d.).
The BSC has grown out itself from being just a strategic initiative to its present form of aperformance management system. The BSC, as it is today, is a performancemanagement system that can be used by organisations of any size to align the vision andmission with all the functional requirements and day-to-day work. It can also enablethem to manage and evaluate business strategy, monitor operational efficiency, provideimprovements, build organization capacity, and communicate progress to all employees:
The Balanced Scorecard concept has been successfully employed by many companies inrecent years to better measure their financial results. According to one study, fully 40 per cent
BIJ15,4
424

of Fortune 500 companies were using this system to evaluate performance at the end of 2000.In essence, the Balanced Scorecard was developed because it was becoming increasinglyapparent to many executives that traditional financial measures of performance were notallowing companies to relate financial measures of performance to long-term companyobjectives. For example, traditional financial analysis fails to take into account such keyvariables as levels of customer service, employee morale, market share by segment and otherimportant factors that influence an organization’s ultimate success (Analyst, 2001).
Hence, it is being adopted by many companies across the world today cutting acrossthe nature of the industry, types of business, geographical and other barriers.
Balanced scorecard (BSC) as a conceptThe mission set by the corporate entity normally reveals the cherished dreams of thefirm, which are strategic to its sustained growth. Such guiding principles arising out ofthe strategic intent of the company, is not fully captured in any traditional system. Ifthis can be calculated and be integrated into the traditional method then it willfacilitate to formulate a well-devised plan for the future growth:
In the knowledge-driven economy of today, intellectual capital and other such intangibleassets have not got desired presentation in the annual reports of companies (Corrigan, n.d.).
The BSC retains traditional financial measures. But financial measures tell the story ofpast events, an adequate story for those companies for which investments in long-termcapabilities and customer relationships were not critical for success. These financialmeasures are inadequate, however, for guiding and evaluating the performance of themodern companies as they are forced by intense competition provided theenvironment, to create future value through investment in customers, suppliers,employees, processes, technology, and innovation.
Kaplan and Norton describes the BSC as a processs which “move beyond aperformance measurement system to become the organizing frame work for a strategicmanagement system”.
The BSC is a system that enables the organization to clarify their strategy andtranslate them into action. It is a system, derived from the strategy, reflecting thebusiness objectives which the firm had set for itself. The approach supportsthe strategic planning and implementation by integrating all the activities of theorganization around a common understanding, viz. the goals of the organization.The BSC translates an organization’s strategy into a comprehensive set of performancemeasures that provides framework for the implementation of strategy.
Thus, BSC essentially is a means of focusing employee’s attention on desired behaviorand desired results. By combining financial and non-financial measures in a single reportthe BSC aims to provide the managers with richer and more relevant information aboutactivities they are managing than is provided by financial measures alone.
The BSC enables the companies to develop a more comprehensive view of theiroperations and to better match all operating and investment activities to long- andshort-term strategic objectives. The BSC approach provides a clear prescription as towhat companies should measure in order to “balance” the implications in all thefunctional areas, arising out of the strategic intent.
The components under these can be linked through a cause and effect diagram. Forexample, we can from the strategy, make out a strategy map and get all the linkages,
Balanced scorefor the balanced
scorecard
425

which will be triggered in order to achieve the desired goal. This can diagrammaticallybring out cause and effect relationship between the measures. This gives the cleareridea of the complex linkages with which the company has to mow through for itsultimate successes. Strategy map can be made for the entire activities as a whole or fora specific segment.
The strategic content of the company can be grouped under different perspectives,which will cover the entire activity of the firm. Kaplan and Norton introduced fourdifferent perspectives through which the firm’s entire activity can be integrated. They are:
(1) Financial perspective. It evaluates the profitability element of the strategy.
(2) Customer’s perspective. It identifies the targeted market, segments andmeasures the company’s success in these segments.
(3) Internal and business perspective. It focuses on internal operations.
(4) Learning and growth perspective. It identifies the capabilities in which theorganization must excel in order to achieve superior internal process thatcreates value for customers and share holders.
The four perspectives are complete in so far as no additional perspective is required torepresent any element of organizational activity that management team might believeworth the focus. Each perspective influences and influenced by the other perspectivesand can be shown in Figure 1.
This classification covers the entire gamut of activities in the major functional areas ofthe business. The financial focus concentrates on traditional return-based efficiency andeffectiveness metrics. The customer focus lists metrics about customer satisfaction,business potential and unit growth. The process and development focus provides detailsabout efficiency, outputs, and savings and of future growth. The innovative and learningfocus gives information pertaining to employee loyalty, skills and competencies.
Obviously a good strategic plan is one, which is successfully implemented. The BSCprovides a format whereby, all the requirements under the different perspectives willbe consolidated and each of the functional departments, viz. production, personnel,marketing and finance would exactly know what they are expected to do and when.This coordinated effort only can make the strategy successful. The growth plan of any
Figure 1.
Financial Perspective
Innovative andLearning Perspective
CustomerPerspective
Internal BusinessProcess
Perspective
BIJ15,4
426

organization should be built combining these four perspectives into a single-balancedintegrated view.
From out of these perspectives, the related objectives, measures and initiatives inthe identified critical areas of the firm are defined. In a measurement managedorganization:
[. . .] senior management was reported to be in agreement on measurable criteria fordetermining strategic success and in which management updated and reviewed semi-annualperformance measures in [. . .] primary performance areas (Lingle and Schiemann, 1996).
Measures are constructed by devising suitable metrics that aid target-setting andperformance measurement in those areas. For better understanding and managementthese measures can be broken down to the individual level, group level, business leveland then finally aggregated to the corporate level.
Metrics are designed to support strategies. They are carefully selected yardsticksthat help in the performance measurement.
From our own experience, we expect strategy scorecards to have 20-25 measures.Here, is a typical allocation across the four perspectives (Kaplan and Norton, n.d.):
(1) financial – five measures (22 per cent);
(2) customer – five measures (22 per cent);
(3) internal – eight to ten measures (34 per cent); and
(4) learning and growth – five measures (22 per cent).
Best Practices LLC (1999) analyzed the scorecards of 22 organizations that hadsuccessfully implemented and found just about the same distribution of measures.
The metrics are usually determined via a detailed and carefully analyzed survey orinterviews. The management should be able to identify shortcomings, to prioritizeaction items, and then conduct follow-on studies to choose appropriate metrics and thefix the targeted performance to be achieved under each of those metrics.
“Metrics” give numerical standards against which a client’s own processes can becompared. Metric benchmarks are of the form:
. finished-product first-pass yield of 97 per cent;
. scrap/rework less than 1 per cent of sales;
. cycle time less than 25 hours;
. customer lead times less than 20 days;
. productivity levels of $150,000 or more per employee; and
. plant-level ROA better than 15 per cent (“Metrics benchmark”, available at:www3.best-in-class.com/bestp/domrep.nsf/).
For example, the following can be set of metrics chosen under each perspective, firm asa whole for specified target requirements:
(1) Learning and growth perspective:. involve the employees in corporate governance;. inculcate leadership capacities at all levels; and. become a customer driven culture.
Balanced scorefor the balanced
scorecard
427

(2) Internal process perspective:. improve productivity standards;. eliminating defects in manufacturing;. provide adequate technical knowledge and skill for all the levels of
employees; and. customer feedbacks to be integrated in the operation.
(3) Financial perspective:. about 12 per cent return-on-equity to be achieved;. about 15 per cent revenue growth;. about 5 per cent reduction in production cost; and. about 3 per cent reduction in cost of capital.
(4) Customer perspective:. enhance market share by 5 per cent;. about 10 per cent increase in export sales;. obtain competitive pricing;. increase after sales service outlets by 10 per cent; and. to conduct face-to-face meeting with customers by organizing customer
meets.
BSC not only captures the change in any one measure but also provides insight into therelated changes in other perspectives. BSC, therefore helps to have an enlarged visionto the firms management as, each strategic intent will flow across all four perspectives,viz. financial, customer, internal processes, and learning and growth and the necessaryimpact is captured in those perspectives, respectively, and holds out the promise ofimproving a company’s prospects of more closely matching its management’s plans toits strategic goals and objectives.
Balanced score model for the balanced scorecardThe BSC in its present form certainly eliminates uncertainty to a great extent ascompared to the traditional financial factors-based performance measurement systems.However, when we set out to measure the actual performance against the targetedperformance, mostly not all the criterions is met. For some factors, actual performanceis greater than the targeted performance, for some it is less. Therefore, for the decisionmakers there may be some kind of confusion regarding the direction in which theorganization is going. That is, he is not clear whether the firm is improving ordeteriorating.
This is because the firm might have achieved the desired performance in not so vitalparameters but would have failed to show required performance in many vitalparameters. Hence, it becomes imperative to provide weightage for the factorsconsidered, so as to define the importance to be given to the various parameters. So thisprovides a clear direction to the management as to prioritize the fulfillment of thetargets set for those measures which have been ascribed for the larger weightage.
The firm can reasonably feel satisfied if it is able to achieve the targets set for it, as itwould encompass all the performance measures. Basically, “The balanced scorecard” is
BIJ15,4
428

constructed taking into account all the strategic issues. The balanced score, which weare suggesting is basically derived for the balanced score card. If the single bench markmeasure “The balanced score for the balanced scorecard” is created then it wouldclearly mean that the firm will be reasonably be in a position to evaluate theachievement of the strategic targets.
The balanced score for the BSC tries to arrive at a single value for comparing thetarget performance and the actual performance of the organization by suitably takinginto account the weightage to be assigned to each factor by considering the users viewpoint. His opinions and perceptions are used to create weightages for the parametersselected and a balanced score for the BSC is arrived.
Further, if we are able to devise a single benchmark measure, which would give theindication as to the direction in which the organization is proceeding with regard toachievement of the strategic intent, the decision maker can either maintain the statusquo or make any required modification. This decision he may be able to take in anobjective manner given the required benchmark figure.
In short, it is a single benchmarking measure, which evaluates under or overachievement of the firm in respect of fulfilling the goals set by the company. It can alsoprovide the variation of the actual measure from the targeted measure under each ofthe factors considered.
Balanced scores of two different time periods can also be compared to evaluate theperformance of the organization over those periods.
Thus, the balanced score model for a BSC, as suggested in this paper will provide asingle bench mark information for the decision makers to take appropriate action andconcentrate on such measures which would result in the achievement of the strategicneeds of the company.
Development of balanced score modelLet us now see the development of balanced score model for BSC. As discussed earlier,the BSC divides all the activities under four perspectives. The perspectives, themeasures under each perspective, the target and actual values of each measure areanalysed in a framework as shown in Figure 2.
The target and actual performance were calculated using the following method:
Balanced score for BSC ðtarget performanceÞ
¼ a1ðb1c1 þ b2c3 þ b3c5Þ þ a2ðb4c7 þ b5c9Þ þ a3ðb6c11 þ b7c13Þ þ a4ðb8c15Þ;ð1Þ
Balanced score for BSC ðactual performanceÞ
¼ a1ðb1c2 þ b2c4 þ b3c6Þ þ a2ðb4c8 þ b5c10Þ þ a3ðb6c12 þ b7c14Þ þ a4ðb8c16Þ:ð2Þ
There are four levels in the balanced score for balanced scorecard model.
Level 1The first level is the goal of the model, i.e. balanced score for BSC.
Level 2This level consists of the criteria for evaluating organizational performance under thefollowing categories:
Balanced scorefor the balanced
scorecard
429
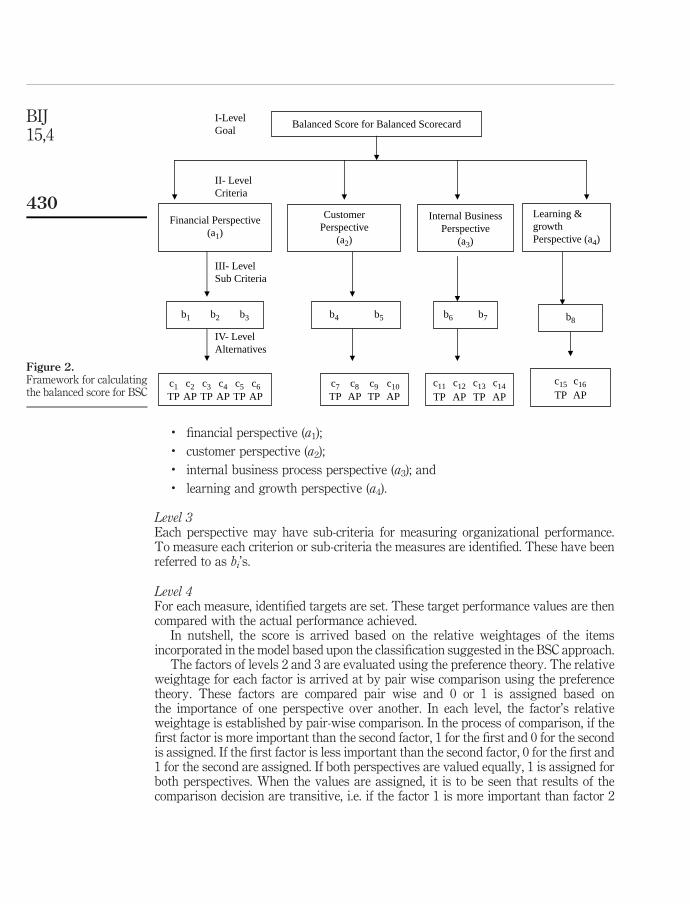
. financial perspective (a1);
. customer perspective (a2);
. internal business process perspective (a3); and
. learning and growth perspective (a4).
Level 3Each perspective may have sub-criteria for measuring organizational performance.To measure each criterion or sub-criteria the measures are identified. These have beenreferred to as bi’s.
Level 4For each measure, identified targets are set. These target performance values are thencompared with the actual performance achieved.
In nutshell, the score is arrived based on the relative weightages of the itemsincorporated in the model based upon the classification suggested in the BSC approach.
The factors of levels 2 and 3 are evaluated using the preference theory. The relativeweightage for each factor is arrived at by pair wise comparison using the preferencetheory. These factors are compared pair wise and 0 or 1 is assigned based onthe importance of one perspective over another. In each level, the factor’s relativeweightage is established by pair-wise comparison. In the process of comparison, if thefirst factor is more important than the second factor, 1 for the first and 0 for the secondis assigned. If the first factor is less important than the second factor, 0 for the first and1 for the second are assigned. If both perspectives are valued equally, 1 is assigned forboth perspectives. When the values are assigned, it is to be seen that results of thecomparison decision are transitive, i.e. if the factor 1 is more important than factor 2
Figure 2.Framework for calculatingthe balanced score for BSC
I-LevelGoal
II- LevelCriteria
III- LevelSub Criteria
IV- LevelAlternatives
Balanced Score for Balanced Scorecard
Financial Perspective(a1)
CustomerPerspective
(a2)
Internal BusinessPerspective
(a3)
b1 b2 b3 b4 b5 b6 b7
c1 c2 c3 c4 c5 c6TP AP TP AP TP AP
c7 c8 c9 c10TP AP TP AP
c11 c12 c13 c14
TP AP TP AP
Learning &growthPerspective (a4)
b8
c15 c16
TP AP
BIJ15,4
430

and factor 2 is more important that factor 3, then the factor 1 is more important thanfactor 3.
The factors of level 4 are grouped into financial and non-financial factors to measurethe effectiveness of the organization’s activity. The financial factors are cost andbenefit. Non-financial factors are classified into factors related with time dimensionsand other factors. The above said factors could be brought under categories, which areto be maximized, and the factors, which are to be minimized.
The whole framework is given in Figure 3.Now, we can frame a general expression considering the entire factors. The
expression is framed in such a manner that the factors are converted into consistent,dimensionless indices. The sum of each index is equal to 1. This is used to evaluate thefactors in order to assist to arrive at the relative weightage at the lowest level. This isthe framework developed by Ragavan and Punniyamoorthy (2003):
Figure 3.Framework for calculating
level 4 – alternatives
To be Maximized
Tangible Factors
To be Minimized
FinancialFactors
Non Financial Financial Factors Non FinancialFactors
MonetaryDimensions
TimeDimensions
Others MonetaryDimensions
TimeDimensions
Others
-Labour saving-Materialsaving-Inventory Costsaving
UtilisationTime
Produc-tivity
-Labour Cost-Material Cost-Overheads
-Cycletime-set uptime
Loss
Balanced scorefor the balanced
scorecard
431

ESI ¼ BMI ð1=X
BMÞ þ ½CMI
Xð1=CMÞ�21 þ BTI ð1=
XBTÞ
þ ½TMI
Xð1=TMÞ�21 þ ðNFI=
XNFÞ þ ½NFMI=ð
X1=NFM�21;
ð3Þ
where, ESI – effectiveness score for alternative I; BMI – benefit in money for alternative I;BTI – benefit in time for alternative I; CMI – cost to be minimized for alternative I; TMI –time to be minimized for alternative I; NFI – non-financial factors for alternative I to bemaximized; NFMI – non-financial factors for alternative I to be minimized.
The relative weightage for all the factors are arrived and the balanced score for theBSC is arrived using equations (1) and (2) for sample framework is shown in Figure 2.
Comparing the figures of targeted performance and the actual performance, we maybe able to say how the company had fared.
Balanced score model in an IT industryIn order to illustrate this model using real-time data, information from a leadingorganization was obtained and the balanced score for a BSC has been reached.
The company is one of the world’s leading international insurance and financialservices organization, with operations in more than 130 countries and jurisdictions. Itsmember companies serve commercial, institutional and individual customers through themost extensive worldwide property-casualty and life-insurance networks. In the USA, itscompanies are the largest underwriters of commercial and industrial insurance and itsglobal business also include retirement services, financial services and asset management.
Its financial services businesses include aircraft leasing, financial products, tradingand market making. The organization’s common stock is listed in the USA on theNew York Stock Exchange and ArcaEx, as well as the stock exchanges in London,Paris, Switzerland and Tokyo.
Beyond this small briefing, let us see how the balanced score for the BSC is calculated.The frame work to arrive at the balanced score for BSC for the industry concerned is
shown in (Figure 4).
Level 1 – goalBalanced score for BSC.
Level 2 – criteriaIn this model four perspectives are considered. They are:
(1) financial perspective;
(2) customer perspective;
(3) internal business process perspective; and
(4) learning and growth perspective.
Weightage for each perspective are arrived by preference table. In this case ofperspectives, 4C2 pairs are considered for pair-wise comparison using preferencetheory. The possible pair-wise combinations are:
. finance and customer perspective;
. finance and internal process perspective;
. finance and learning perspective;
BIJ15,4
432

. customer and internal perspective;
. customer and learning perspective; and
. internal and learning perspective.
After thorough consultation with the top management, the relative weightage for eachfactor is arrived at by pair-wise comparisons using the preference theory as describedearlier. The weightage thus calculated are used to attach importance for the respectiveperspectives in the preference table and the relative weightage are shown in Table II.
Calculations for level 3 sub-criteriaEach perspective will have sub-criteria for measuring organizational performance.To measure each criterion or sub-criteria measures are identified under each of the fourperspectives, viz financial, customer, internal and learning.
Now let us find out the weightages of every measure under each perspective.
Figure 4.Framework for calculatingbalanced score for BSC for
the firm in question
I-LevelGoal
II-LevelCriteria
III-LevelSub-Criteria
IV-LevelAlternatives
*(the metrics shown here are company specific ones in which we had made the observation,the details of which is given in the ensuing paragraph and not generic in nature; these areshown here to highlight how this is being worked out)
Balanced Score for Balanced Scorecard
Financial Perspective(a1)
Customer Perspective(a2)
InternalBusiness
Perspective
-BR-Onsite (b1)-BR-OffShore (b2)-Realization-Onsite (b3)-Realization-OffShore (b4)-Outstanding Receivables (b5)-Billed Vs Allocated (b6)-BA Ratio (b7)
-CSI Coverage (b8)-Customer satisfaction
Index (Average)(b9)
-On-time Delivery (b10)-On-Budget Delivery (b11)-Billing Analysis (b12)-Audit Coverage (b13)-Time sheet compliance
(WON) (b14)-Time sheet Compliance
(SWON) (b15)
c1 c2 c3 c4
TP AP TP AP
TP AP
APAP
AP
TP AP TP AP
TP AP TP AP
TP AP TP AP
TP AP TP AP
Learning &growth
perspective
TrainingDays/personb16
TP APc5 c6 c15 c16 c17 c18
c19 c20 c21 c22
c23 c24 c25 c26
c27 c28 c29 c30
c31 c32
c7 c9 c10c8
c11 c13 c14c12TP
TPTP APTP
****
Balanced scorefor the balanced
scorecard
433

Financial perspectiveWe do not disregard the traditional need for financial data. Timely and accuratefinancial data will always be a priority, and the managers will do whatever necessaryto provide it. In fact, we want to only point out that there is often more thanenough handling and processing of financial data at the cost of other relevant andimportant information and not to entirely ignore them. We have already seen that thecurrent emphasis on financial parameters leads to the “unbalanced” situationwith regard to other perspectives, viz. customer, internal process and learningperspectives.
Under the financial perspective, the following measures were identified by theindustry in question as very important. The information regarding the degree ofimportance in respect of the following sub-factors for the industry concerned arecollected (all the metrics mentioned are company specific and not generic in nature):
. billing revenue – onsite;
. billing revenue – offsite;
. realization per person – onsite;
. realization per person – offshore;
. number of days of outstanding receivables;
. billed vs allocated; and
. BA ratio.
In this case, 7C2 pairs are considered for pair-wise comparison using preference theoryand the relative weightage for each measure (sub-factor) is shown in (Table III).
Factor F&C F&I F&L C&I C&L I&L Weightage
Finance 1 1 1 3 a1 ¼ 0.4286Customer 0 1 1 2 a2 ¼ 0.2857Internal 0 1 0 1 a3 ¼ 0.1429Learning 0 0 1 1 a4 ¼ 0.1429
7Table II.Table for level 2 criteria
1 1 1 1 1 1 2 2 2 2 2 3 3 3 3 4 4 4 5 5 6Factor 2 3 4 5 6 7 3 4 5 6 7 4 5 6 7 5 6 7 6 7 7 Weightage
1 BR-on 1 1 0 1 0 0 3 b1 ¼ 0.12002 BR-off 1 1 1 1 1 1 6 b 2 ¼ 0.24003 Real-on 1 0 1 1 0 1 4 b3 ¼ 0.16004 Real-off 1 1 1 1 1 1 6 b4 ¼ 0.24005 Outstanding 0 0 0 0 1 1 2 b5 ¼ 0.08006 Bills/alloc 1 1 0 0 0 2 b6 ¼ 0.08007 BA 1 0 0 0 0 0 1 2 b7 ¼ 0.0800
25
Table III.Table for level 3sub-criteria – financialperspective
BIJ15,4
434

Customer perspectiveObviously, the firm felt that the customer satisfaction information is key knowledgeand a critical success factor. They informed that the poor performance of thisperspective is a leading indicator of future decline, even though the current financialpicture may look good.
The sub-factors considered are (all the metrics mentioned are company specific andnot generic in nature):
. customer satisfaction index coverage; and
. customer satisfaction index average.
In this perspective, 2C2 pairs are considered for pair-wise comparison using preferencetheory. Equal weightage (0.5) was assigned to both the factors (Table IV).
Internal perspectiveUnder this perspective, the firm had broadly identified two kinds of business process.They are:
(1) mission-oriented process; and
(2) support-oriented process.
After identifying the type of process, the sub-factors for the internal perspective for theindustry concerned are identified as follows (all the metrics mentioned are companyspecific and not generic in nature):
. on-time delivery;
. on-budget delivery (within 10 per cent over-run);
. billing timeliness;
. audit coverage
. time sheet compliance – (WON); and
. time sheet compliance – (SWON).
In this perspective, 6C2 pairs are considered for pair-wise comparison using preferencetheory. The relative weightage are as shown in Table V.
Learning and growth perspectiveThe industry considers only one metric, viz. training days/person under thisperspective. In this perspective, since only one factor is considered total weightage of 1was assigned to the factor. The weightage is shown in Table VI.
Level 4 alternativesThe target and the actual performance value of the measures mentioned are consideredas factors which could be grouped into financial and non-financial factors to measure
Factors Weightage
CSI coverage b8 ¼ 0.5Customer satisfaction index B9 ¼ 0.5
Table IV.Table for level 3
sub-criteria – customerperspective
Balanced scorefor the balanced
scorecard
435

the organization’s activity effectiveness. The financial factors are cost and benefit.Non-financial factors are classified into factors related with time dimension and otherfactors. The above factors could be brought under the catogories that are to bemaximized or to be minimized as shown in Figure 4.
Here, the actual and targeted values for each constituent of the level 3 aresubstituted in the equations (1) and (2), respectively, to arrive at the weightage forthe targeted and actual performance values for the industry concerned. All theweightage are shown in Table VII. These weightage are multiplied and summed toarrive at the balanced score for the BSC.
CalculationsFinancial perspective:
TP ¼ a1ðb1c1 þ b2c3 þ b3c5 þ b4c7 þ b5c9 þ b6c11 þ b7c13Þ;
AP ¼ a1ðb1c2 þ b2c4 þ b3c6 þ b4c8 þ b5c10 þ b6c12 þ b7c14Þ:
Customer perspective:
TP ¼ a2ðb8c15 þ b9c17Þ;
AP ¼ a2ðb8c16 þ b9c18Þ:
Internal process perspective:
TP ¼ a3ðb10c19 þ b11c21 þ b12c23 þ b13c25 þ b14c27 þ b15c29Þ;
AP ¼ a3ðb10c20 þ b11c22 þ b12c24 þ b13c26 þ b14c28 þ b15c30Þ:
Learning and growth perspective:
TP ¼ a4ðb16c31Þ;
AP ¼ a4ðb16c32Þ:
Substituting the respective values.
1 1 1 1 1 2 2 2 2 3 3 3 4 4 5Factor 2 3 4 5 6 3 4 5 6 4 5 6 5 6 6 Weightage
1 On time delivery 1 1 1 0 0 3 b10 ¼ 0.17652 On bud 1 0 0 1 0 2 b11 ¼ 0.11763 Bill time 0 1 1 0 1 3 b12 ¼ 0.17654 Audit coverage 0 1 0 1 1 3 b13 ¼ 0.17655 TS-WON 1 0 1 0 1 3 b14 ¼ 0.17656 TS-SWON 1 1 0 0 1 3 b15 ¼ 0.1765
17
Table V.Table for level 3sub-criteria – internalprocess perspective
Factors Weightage
Training days per person b16 ¼ 1
Table VI.Table for level 3sub-criteria – learningand growth perspective
BIJ15,4
436

Per
spec
tiv
eM
easu
reU
nit
Fre
qu
ency
Wei
gh
ts(a
i)W
eig
hts
(b1)
i–
jT
arg
eted
(c1)
i–
jA
ctu
als
Fin
anci
alp
ersp
ecti
ve
Bil
lin
gre
ven
ue
–on
site
¼b 1
US
DM
0.42
860.
1200
0.49
520.
5048
Bil
lin
gre
ven
ue
–of
fsh
ore¼
b 2U
SD
M0.
2400
0.55
190.
4481
Rea
liza
tion
per
per
son
–on
site
¼b 3
US
D/h
rM
0.16
000.
5144
0.48
56R
eali
zati
onp
erp
erso
n–
offs
hor
e¼
b 4U
SD
/hr
M0.
2400
0.48
740.
5126
Nu
mb
erof
day
sof
outs
tan
din
gre
ceiv
able
s¼
b 5
No
ofd
ays
M0.
0800
0.23
440.
7656
Bil
led
vs
allo
cate
d(T
&M
)¼
b 6P
erce
nt
M0.
0800
0.54
350.
4565
BA
rati
o¼
b 7P
erce
nt
M0.
0800
0.62
760.
3724
Cu
stom
erp
ersp
ecti
ve
CS
Ico
ver
age¼
b 8P
erce
nt
Q0.
2857
0.50
000.
5122
0.48
78C
ust
omer
sati
sfac
tion
ind
ex(a
ver
age)¼
b 9P
erce
nt
Q0.
5000
0.50
000.
5000
Inte
rnal
per
spec
tiv
eO
n-t
ime
del
iver
y¼
b 10
Per
cen
tM
0.14
290.
1765
0.50
000.
5000
On
-bu
dg
etd
eliv
ery
(wit
hin
10p
erce
nt
over
run
)¼
b 11
Per
cen
tM
0.11
760.
5238
0.47
62
Bil
lin
gti
mel
ines
s¼
b 12
Per
cen
tM
0.17
650.
5025
0.49
75A
ud
itco
ver
age¼
b 13
Per
cen
tQ
0.17
650.
5000
0.50
00T
ime
shee
tco
mp
lian
ce–
WO
N¼
b 14
Per
cen
tM
0.17
650.
5025
0.49
75T
ime
shee
tco
mp
lian
ce–
SW
ON
¼b 1
5P
erce
nt
M0.
1765
0.50
000.
5000
Lea
rnin
gan
dg
row
thp
ersp
ecti
ve
Tra
inin
gd
ays/
per
son¼
b 16
Day
s/p
mM
0.14
291.
0000
0.51
660.
4834
Bal
ance
dsc
ore
0.50
6241
0.49
3873
Table VII.Table indicating
balanced score for BSC
Balanced scorefor the balanced
scorecard
437

Financial perspective
TP ¼ a1ðb1c1 þ b2c3 þ b3c5 þ b4c7 þ b5c9 þ b6c11 þ b7c13Þ;
TP ¼ 0:4286ð0:12 £ 0:4952 þ 0:24 £ 0:5519 þ 0:16 £ 0:5144 þ 0:24
£ 0:4874 þ 0:08 £ 0:2344 þ 0:08 £ 0:5435 þ 0:08 £ 0:6276Þ
¼ 0:215843;
AP ¼ a1ðb1c2 þ b2c4 þ b3c6 þ b4c8 þ b5c10 þ b6c12 þ b7c14Þ;
AP ¼ 0:4286ð0:12 £ 0:5048 þ 0:24 £ 0:4481 þ 0:16 £ 0:4856 þ 0:24 £ 0:5126
þ 0:08 £ 0:7656 þ 0:08 £ 0:4565 þ 0:08 £ 0:3724Þ ¼ 0:212757:
Customer perspective
TP ¼ a2ðb8c15 þ b9c17Þ ¼ 0:2857ð0:5 £ 0:5122 þ 0:5 £ 0:5Þ ¼ 0:144593;
AP ¼ a2ðb8c16 þ b9c18Þ ¼ 0:2857ð0:5 £ 0:4878 þ 0:5 £ 0:5Þ ¼ 0:141107:
Internal process perspective
TP ¼ a3ðb10c19 þ b11c21 þ b12c23 þ b13c25 þ b14c27 þ b15c29Þ;
TP ¼ 0:1429½ð0:1765 £ 0:5 þ 0:1176 £ 0:5238 þ 0:1765 £ 0:5025 þ 0:1765 £ 0:5
þ 0:1765 £ 0:5025 þ 0:1765 £ 0:5Þ� ¼ 0:071983;
AP ¼ a3ðb10c20 þ b11c22 þ b12c24 þ b13c26 þ b14c28 þ b15c30Þ;
AP ¼ 0:1429½ð0:1765 £ 0:5 þ 0:1176 £ 0:4762 þ 0:1765 £ 0:4975 þ 0:1765 £ 0:5
þ 0:1765 £ 0:4975 þ 0:1765 £ 0:5Þ� ¼ 0:070931:
Learning and growth perspective
TP ¼ a4ðb16c31Þ ¼ 0:1429ð1 £ 0:5166Þ ¼ 0:073822;
AP ¼ a4ðb16c32Þ ¼ 0:1429ð1 £ 0:4834Þ ¼ 0:069078:
Results and analysisFor a clear analysis, let us find out the difference between the targeted weightage tothat of actual importance given under each of the perspectives as well as under thesub-criteria under those perspectives. This is given in Table VIII.
On the whole, the company’s targeted weightage is on the higher side 0.506241 ascompared to the actual of 0.493873 leading to a difference of 0.012368. This wouldmean that the overall performance of the company varies from specified target.
This leads us to discuss the reason(s) for the under performance of the company.It is observed that there is not only variation under the overall figure, but
also there are variations in all the criteria and the sub-criteria as well. Let us
BIJ15,4
438

therefore make a detailed analysis of all the criteria and sub-criteria in each of theperspective.
Financial perspectiveFrom the financial perspective, the company’s actual performance score (0.212757) isless than the target score (0.215843) (Table IX).
It is evident that the organization varies in terms of financial performance from thetargeted or the desired level. The reason quoted by the organization for this underperformance is inadequate employee training. This is true, because under the learningand growth perspective there is a significant variation of 0.004744. We know thatshortage of training results in lower skill levels of the employees, which in turn affectthe employee output. But, we feel that this alone cannot be the reason. In fact, we findthat under financial perspective the variation in “Billing revenue off shore” (b2) is0.010677, which is more than the variation shown under training. This clearly showsthat the management did not perceive this larger difference in the variation.
This is possibly because they were actually working on the financial value of theactivity and not on the importance value, the activity deserves. Further under thesub-criteria b1 (billing revenue – onsite), b4 (realization per person – offshore), b5
(number of days of outstanding receivables) though the actual performance is morethan the targeted performance, it is necessary for the management to ensure the reasonfor such a positive variance. Possibly, the firm is diverting more resources than it needsto for the performance of those sub-criteria.
For example, if we look at the variance in b5-, number of days of outstandingreceivables, we find the variance as very large, which call for a review to find the causefor such a variance.
Perspectives Targeted performance Actual performance Variance
Financial perspective 0.215843 0.212757 0.003086Customer perspective 0.144593 0.141107 0.003486Internal process perspective 0.071983 0.070931 0.001052Learning and growth perspective 0.073822 0.069078 0.004744
0.506241 0.493873 0.012368
Table VIII.Calculation of the
balanced score for theBSC – arriving at the
overall variance
MeasureTargeted
(ai £ bi £ ci)Actuals
(ai £ bi £ ci) Variance calculations
Billing revenue – onsite ¼ b1 0.025469 0.025963 20.00049Billing revenue – offshore ¼ b2 0.056771 0.046093 0.010677Realization per person – onsite ¼ b3 0.035275 0.033301 0.001975Realization per person – offshore ¼ b4 0.050136 0.052728 20.00259Number of days of outstanding receivables ¼ b5 0.008037 0.026251 20.01821Billed vs allocated (T&M) ¼ b6 0.018636 0.015652 0.002983BA ratio ¼ b7 0.021519 0.012769 0.00875Sub-total 0.215843 0.212757 0.003086
Table IX.Arriving at the variancefor financial perspective
Balanced scorefor the balanced
scorecard
439

Customer perspectiveRegarding the customer perspective the actual performance (0.1312) varies from thetarget performance (0.1344), thus producing the variance of 0.003242 is given in Table X.
Interestingly, in the two sub-criteria selected, one sub-criteria, viz. customersatisfaction index (average) ¼ b9, shows a significant difference and hence calls for adetailed review.
Internal perspectiveIn the internal, perspective shows the actual performance (0.08783) varies from thetarget performance (0.0762) is given in Table XI.
Here, also we observe that the sub-criteria time sheet compliance – WON ( ¼ b14)needed managements attention. Possibly, the performance under this subcriterion maybe enhanced by providing adequate internal training for the employees.
Learning and growth perspective (a4)
Training days=person ðb16Þ 0:073822 0:069078 0:004744:
Learning and growth perspective also shows difference in that the actual performance(0.06908) varies from the target performance (0.073822). This will naturally happen, asin the only metric identified under this perspective the actual performance under themeasure training days/person varies from the targeted weightage. Inadequate traininglike this can possibly result in increased rework constituting a major problem.
Findings and contributionsIf we have a resource, which needs to be distributed to different activities, then theresource is not obviously divided equally amongst the activities. For example, if wehave a resource of $1 million and five activities are to be attended to we do not earmark$200,000 for each activity. This is also true for the allocation of any other non-financialresources such as employee allocation, management’s attention, machines trainingneeds, quality requirements, etc. According to the importance the activity deserves, weprovide suitable weightages and allocate the resources, be it financial or non-financial.
CSI coverage ¼ b8 0.073168 0.069682 0.003486Customer satisfaction index (average) ¼ b9 0.071425 0.071425 0Sub-total 0.144593 0.141107 0.003486
Table X.Arriving at the variancefor customer perspective
On-time delivery ¼ b10 0.012611 0.012611 0On-budget delivery (within 10 per centoverrun) ¼ b11 0.008802 0.008003 0.0008Billing timeliness ¼ b12 0.012674 0.012548 0.000126Audit coverage ¼ b13 0.012611 0.012611 0Time sheet compliance – WON ¼ b14 0.012674 0.012548 0.000126Time sheet compliance – SWON ¼ b15 0.012611 0.012611 0Sub-total 0.071983 0.070931 0.001052
Table XI.Arriving at the variancefor internal perspective
BIJ15,4
440

So in this paper, we have detailed a process of identifying the essential criteria to beachieved by the company and the relative importance the company should give for thefulfillment of those criteria.
If the company either gives less attention to the fulfillment of any sub-criteria, thenthe organization has to set it right as otherwise the performance of other criteria wouldsuffer. This situation is also true if it gives more attention than is needed to thesub-criteria. But obviously, if there is variance in any sub-criteria which has the higherweightage allocated to it, then it commands more attention, as such variations wouldhave a leveraged impact on the overall performance of the organization.
So, it becomes apparent that the performances under all the perspectives areinterdependent. If the performance in a subcriterion under any perspectives is affected,then it may result in the show of adverse or favorable performance in the sub-criteria of theother perspectives. That is why the management had given the reason of traininginadequacy as the sole reason for the failure of adequate performance in other perspectives.
So by adopting the balanced score process as detailed in this paper, we are able toidentify the deficiency with respect to the importance afforded by the organization intheir entire set of activities.
Hence, this approach can be used for different situations without any difficulty.This is again a measure of importance provided by the organization itself.The organization is setting up for themselves the bench mark with respect to theimportance that should be afforded to the fulfillment of different sub-criteria. So it is atailor made benchmarking information system created by the firm for itself and hencethe question of unsuitability of the bench mark does not arise.
It has been observed that:
This Best Practices Benchmarkingw Report includes best practices to help companies createoptimal structures for benchmarking, successful approaches to prioritizing research requests,methods for building buy-in for benchmarking as a concept and effective ways to trackprocess improvements. When well executed, benchmarking initiatives help companiescompare their processes, identify gaps in performance and discover proven tactics for closingthose gaps. Successful companies harness the power of benchmarking to lower cost positions,increase productivity and drive greater competitiveness (“Best practices benchmarking”,available at: www3.best-in-class.com/bestp/domrep.nsf/).
True to this observation, we are providing a benchmark figure which would enable toevaluate the performance in the implementation of the strategy. In this process, wehave taken into account the subjective factors also and provided a suitable measurableindex. Many objective methods exist to find out the causes of under performance in theareas of financial measures. There are not many objective methods available to find outwhich are the areas of non-financial measures affecting the performance of the firm andto what extent.
Limitation of the researchThe levels 2 and 3 factors are evaluated using preference theory and it has certainlimitations. When we compare the degree of importance of one factor over another andassign 1 for a factor and 0 for another, it means that 0 importance is attached to thatfactor. There is a possibility, that factor may have uniformly 0 value in all the pair-wisecomparisons. This results in factor getting 0 relative importance. In other words, in thedecision a 0 value factor does get a role, which is not necessary.
Balanced scorefor the balanced
scorecard
441

Future prospect of the researchTo remove the above said limitation, future research may be carried out to evaluatecriteria (ai’s) and the sub-criteria (bi’s) by using analytic hierarchy process (AHP). Evenby adopting AHP, pair-wise comparison can be made and different values be assignedbased on the degree of importance ranging from 1 to 9. The reciprocal values can alsobe assigned based on the importance of one factor over the other. This may providemore refinement in providing adequate weightages to the relevant criteria and thesub-criteria.
ConclusionsThere are any numbers of attempts made to show the efficacy of the usage of the BSC forshowing better performance. While retaining all the advantages that are made availableby using the BSC approach in providing a frame work for showing better performance,through this process of calculating the bench mark figure called “Balanced score” we areable to add more value for the analysis. We are able to identify those parameterswhose actual performance vary from the targeted performance and find out their relativeproportion of adverse or favorable contribution to the performance of the company byassigning appropriate weights for such parameters – be it financial or non financial.Therefore, we are in a position to objectively capture the reason for variations in theperformance from the targeted levels in all the functional areas of the business with theuse of the concepts of BSC as well as applying the extended information arising out ofarriving at the “balanced score for the balanced scorecard”.
In conclusion arriving at a balanced score for BSC which is by and large consideredas a powerful approach in formulating a business excellence model, will certainly helpthe users of this approach to make an objective evaluation while implementing thesame in their business environment.
References
Analyst (2001), “Accounting for intangibles Skandia reporting model”, Analyst, October.
Best Practices LLC (1999), Best Practices Bench Marking Report, Developing the BalancedScorecard, Best Practices LLC, Chapel Hill, NC.
Brown, P.A. and Gibson, D.F. (1972), “A quantified model for facility site selection application tothe multi product location problem”, AIIE Transactions, Vol. 4 No. 1, pp. 1-10.
Corrigan, T.D. (n.d.), “Capital budgeting in the context of the balanced score card”, available at:www.iaes.org/conferences/past/philadelphia
Dye, R.W. (2003), “Keeping score”, CMA Management, 18-23 December/January.
Evans, M.H. (n.d.), “The balanced scorecard”, available at: www.exinfm.com/training
Hope, J. and Fraser, R. (n.d.), “Beyond budgeting”, BBRT, CAM-I, Europe White paper.
Jhonson, G. and Scholes, K. (2001), Exploring Corporate Strategy, Text & Cases, 4th ed.,Prentice-Hall, India, pp. 1-38.
Kaplan, R.S. (1996), Mobil USM & R (a): Linking the Balanced Scorecard, Harvard BusinessSchool, Boston, MA, 9-197-025 – 6.l.
Kaplan, R.S. and Norton, D.P. (1992a), “The balanced scorecard: measures that driveperformance”, Harvard Business Review, January/February, pp. 71-9.
Kaplan, R.S. and Norton, D.P. (1992b), The Balanced Scorecard: Translating Strategy into Action,Harvard Business School Press, Boston, MA.
BIJ15,4
442

Kaplan, R.S. and Norton, D.P. (n.d.), The Strategy Focused Organizations, Harvard BusinessSchool Press, Boston, MA, pp. 1-30, 369-80.
Lingle, J.H. and Schiemann, W.A. (1996), “From balanced scorecards to strategic gages: ismeasurement worth it?”, Management Review, March, pp. 56-62.
Miller, A. (1998), Strategic Management, 3rd ed., Irwin Mc-Graw Hill International Edition,New York, NY, pp. 313-45.
Porter, M.E. (1985), Competitive Advantage: Creating and Sustaining Superior Performance,Free Press, New York, NY.
Porter, M.E. (1996), “What is strategy”, Harvard Business Review, November/December, p. 62.
Ragavan, P.V. and Punniyamoorthy, M. (2003), “Strategic decision model for the justification oftechnology selection”, International Journal of Advanced Manufacturing Technology,Vol. 21, pp. 72-8.
Skandia Reporting Model (2001), Skandia Reporting Model: Accounting for Intangibles – EditedExcerpts from the Supplement to Annual Report 1994, Skandia – Analyst, October.
Stewart, A.C. and Hubin, J.C. (2001), “The balanced scorecard: beyond reports and rankings”,Planning for Higher Education, Vol. 29 No. 2, pp. 37-42.
Stewart, T. (1999), “The status of communication today”, Journal of Strategic CommunicationManagement, February\March, pp. 22-5.
About the authorsM. Punniyamoorthy is a Graduate in Mathematics, with a BTech in Production Technology fromMadras Institute of Technology, Chennai, and MTech in Industrial Engineering and OperationsResearch from Indian Institute of Technology, Kharagpur. He possesses ICWAI (inter)qualification and did his Doctorate in Management from Bharathidasan University,Tiruchirapalli. He is presently working as an Assistant Professor in the National Institute ofTechnology. One of his papers “A strategic decision model for the justification of technologyselection” published in the International Journal of Advanced Manufacturing Technology, UK(Vol. 21, 2003, pp. 72-8) has been selected by the American Society for Mechanical Engineers asone of the best ten papers in the area of technology selection. M. Punniyamoorthy is thecorresponding author and can be contacted at: [email protected]
R. Murali is a Post Graduate in Mathematics and has a Management Degree from IndhiraGhandhi National Open University. He is also a cost accountant and is presently a Fellow in theInstitute of Cost and Works Accountants of India, which is the apex body of cost accountants inIndia. He has worked in one of the biggest Nationalized Banks of India having a large network ofbranches in India and abroad for more than 26 years and has also served for more than ten yearsin the staff training college of the bank handling in the areas of credit and human resources.He is presently working as a Lecturer in the National Institute of Technology in cost andmanagement accounting, financial management, economics, strategic management and humanresources related topics.
Balanced scorefor the balanced
scorecard
443
To purchase reprints of this article please e-mail: [email protected] visit our web site for further details: www.emeraldinsight.com/reprints