bio 151 dccc cardio-iii #6 - cardiovascular iii heart...
TRANSCRIPT

Bio 151 – Laboratory Manual Human Anatomy & Physiology II DCCC Cardio-III
Last revised 08/2017
Pag
e1
#6 - Cardiovascular III – Heart Sounds,
Pulse Rate, Hemoglobin Saturation, and
Blood Pressure Objectives:
Observe slide of artery and vein cross-section
Auscultate heart sounds using a stethoscope
Measure pulse rate
Understand the theory of operation of the pulse oximeter
Take pulse and SpO2 measurements under a variety of physiological conditions
Interpret pulse and SpO2 data in a chart format
Measure blood pressure using a sphygmomanometer
Understand the origin of Korotkoff sounds
Compare pulse and blood pressure measurements under different body conditions
Calculate pulse pressure, stroke volume, and cardiac output using data collected
Display blood pressure and pulse data in graph form
I. Observation of Artery and Vein Slide
Obtain the artery and vein cross-section slide. Locate the artery (thick-walled, more obvious vessel) and
the vein (thin-walled, collapsed). Identify the following structures:
Artery:
tunica interna
o endothelium
tunica media
o smooth muscle
tunica externa
o connective tissue
lumen
Vein:
tunica interna
o endothelium
tunica media
o smooth muscle
tunica externa
o connective tissue
lumen
* Get your instructor to check your microscope
before storage and initial the lab report.
Figure 1. Artery and vein (from
AP Revealed).
Bio 151 – Laboratory Manual Human Anatomy & Physiology II DCCC Cardio-III
Last revised 08/2017
Pag
e2
II. Auscultation of Heart Sounds
A. Introduction
During the cardiac cycle, two major sounds result from the turbulent blood flow created as valves close.
These sounds are commonly described as lubb-dupp sounds. Lubb is the first sound (S1) which is
produced when the atrioventricular (AV) valves close. Dupp is the second sound (S2) which is
associated with the closure of the semilunar (SL) valves. These sounds can be easily auscultated using a
stethoscope.
B. Procedure
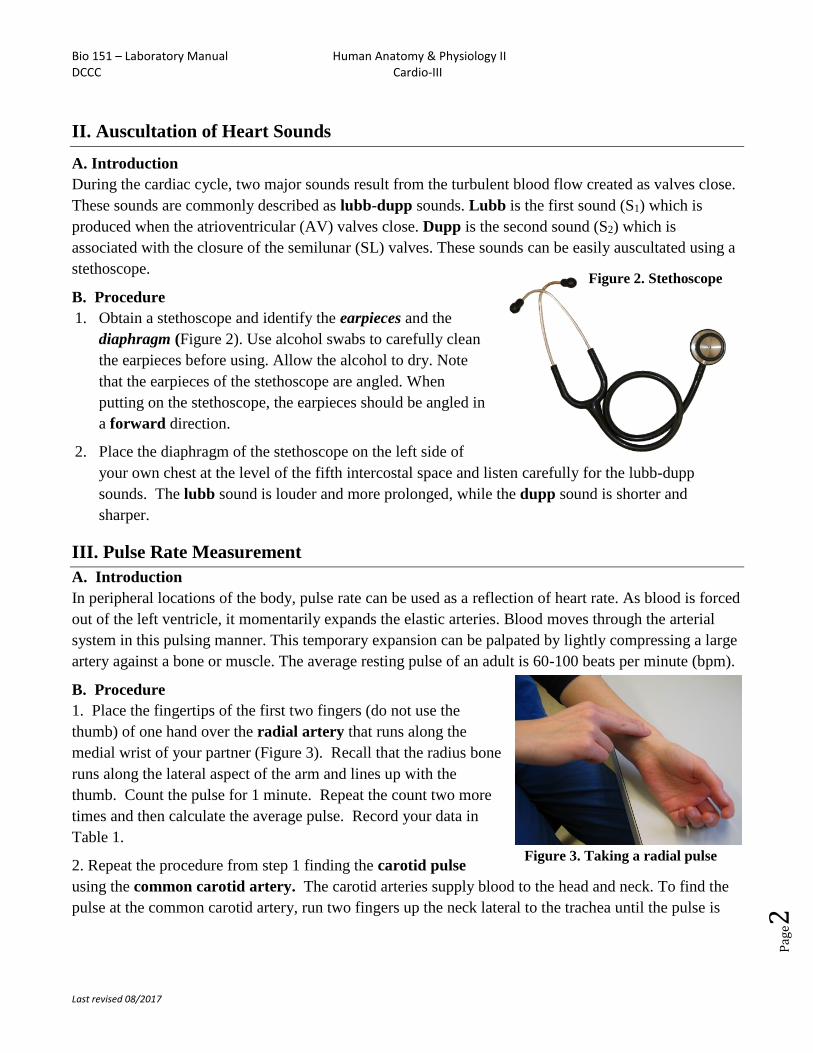
1. Obtain a stethoscope and identify the earpieces and the
diaphragm (Figure 2). Use alcohol swabs to carefully clean
the earpieces before using. Allow the alcohol to dry. Note
that the earpieces of the stethoscope are angled. When
putting on the stethoscope, the earpieces should be angled in
a forward direction.
2. Place the diaphragm of the stethoscope on the left side of
your own chest at the level of the fifth intercostal space and listen carefully for the lubb-dupp
sounds. The lubb sound is louder and more prolonged, while the dupp sound is shorter and
sharper.
III. Pulse Rate Measurement
A. Introduction
In peripheral locations of the body, pulse rate can be used as a reflection of heart rate. As blood is forced
out of the left ventricle, it momentarily expands the elastic arteries. Blood moves through the arterial
system in this pulsing manner. This temporary expansion can be palpated by lightly compressing a large
artery against a bone or muscle. The average resting pulse of an adult is 60-100 beats per minute (bpm).
B. Procedure
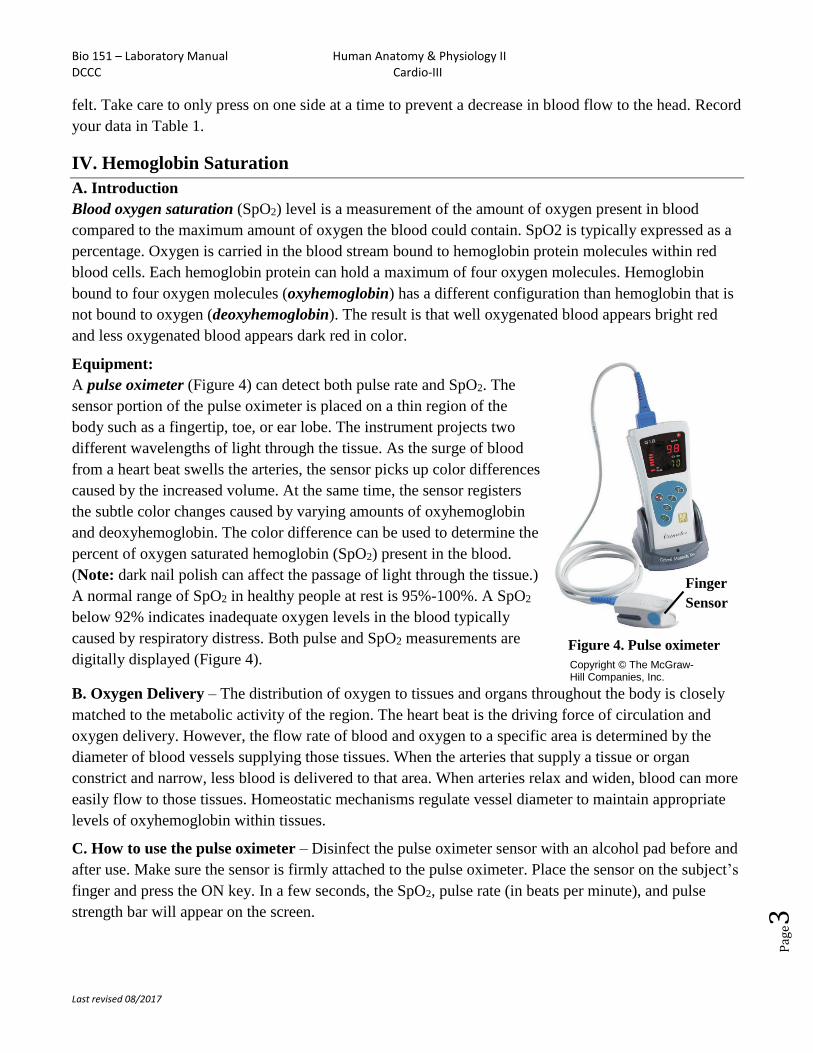
1. Place the fingertips of the first two fingers (do not use the
thumb) of one hand over the radial artery that runs along the
medial wrist of your partner (Figure 3). Recall that the radius bone
runs along the lateral aspect of the arm and lines up with the
thumb. Count the pulse for 1 minute. Repeat the count two more
times and then calculate the average pulse. Record your data in
Table 1.
2. Repeat the procedure from step 1 finding the carotid pulse
using the common carotid artery. The carotid arteries supply blood to the head and neck. To find the
pulse at the common carotid artery, run two fingers up the neck lateral to the trachea until the pulse is
Figure 2. Stethoscope
Figure 3. Taking a radial pulse
Bio 151 – Laboratory Manual Human Anatomy & Physiology II DCCC Cardio-III
Last revised 08/2017
Pag
e3
felt. Take care to only press on one side at a time to prevent a decrease in blood flow to the head. Record
your data in Table 1.
IV. Hemoglobin Saturation
A. Introduction
Blood oxygen saturation (SpO2) level is a measurement of the amount of oxygen present in blood
compared to the maximum amount of oxygen the blood could contain. SpO2 is typically expressed as a
percentage. Oxygen is carried in the blood stream bound to hemoglobin protein molecules within red
blood cells. Each hemoglobin protein can hold a maximum of four oxygen molecules. Hemoglobin
bound to four oxygen molecules (oxyhemoglobin) has a different configuration than hemoglobin that is
not bound to oxygen (deoxyhemoglobin). The result is that well oxygenated blood appears bright red
and less oxygenated blood appears dark red in color.
Equipment:
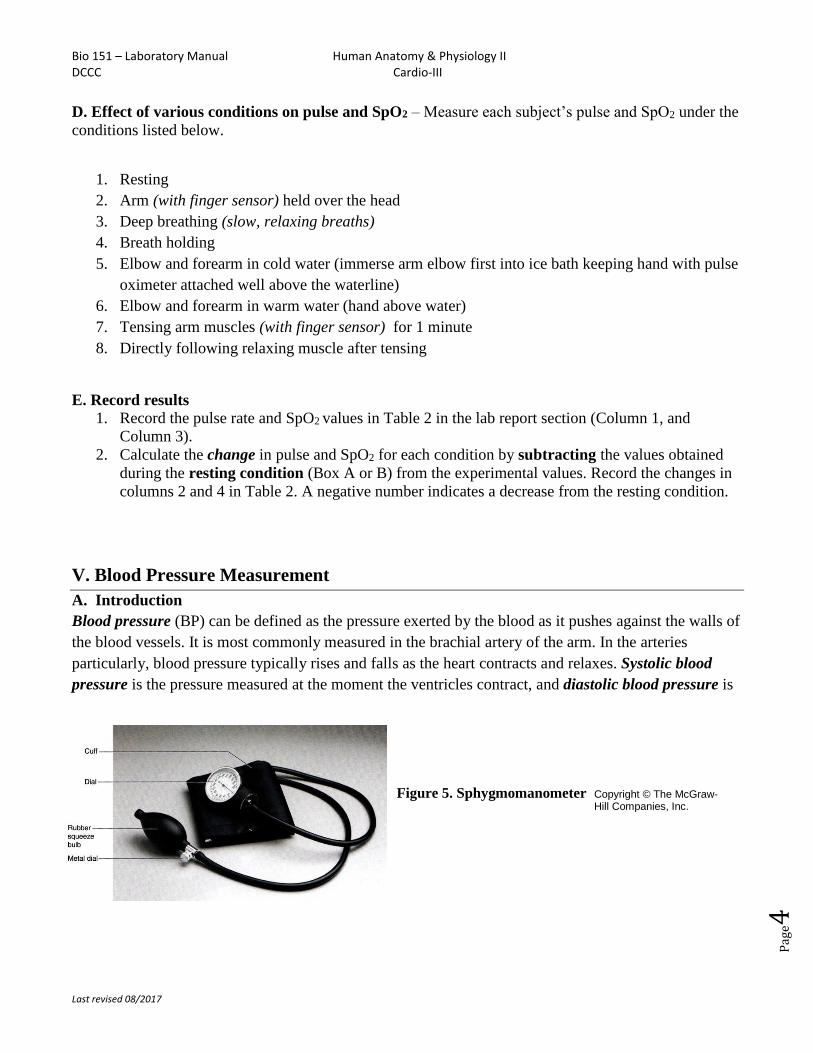
A pulse oximeter (Figure 4) can detect both pulse rate and SpO2. The
sensor portion of the pulse oximeter is placed on a thin region of the
body such as a fingertip, toe, or ear lobe. The instrument projects two
different wavelengths of light through the tissue. As the surge of blood
from a heart beat swells the arteries, the sensor picks up color differences
caused by the increased volume. At the same time, the sensor registers
the subtle color changes caused by varying amounts of oxyhemoglobin
and deoxyhemoglobin. The color difference can be used to determine the
percent of oxygen saturated hemoglobin (SpO2) present in the blood.
(Note: dark nail polish can affect the passage of light through the tissue.)
A normal range of SpO2 in healthy people at rest is 95%-100%. A SpO2
below 92% indicates inadequate oxygen levels in the blood typically
caused by respiratory distress. Both pulse and SpO2 measurements are
digitally displayed (Figure 4).
B. Oxygen Delivery – The distribution of oxygen to tissues and organs throughout the body is closely
matched to the metabolic activity of the region. The heart beat is the driving force of circulation and
oxygen delivery. However, the flow rate of blood and oxygen to a specific area is determined by the
diameter of blood vessels supplying those tissues. When the arteries that supply a tissue or organ
constrict and narrow, less blood is delivered to that area. When arteries relax and widen, blood can more
easily flow to those tissues. Homeostatic mechanisms regulate vessel diameter to maintain appropriate
levels of oxyhemoglobin within tissues.
C. How to use the pulse oximeter – Disinfect the pulse oximeter sensor with an alcohol pad before and
after use. Make sure the sensor is firmly attached to the pulse oximeter. Place the sensor on the subject’s
finger and press the ON key. In a few seconds, the SpO2, pulse rate (in beats per minute), and pulse
strength bar will appear on the screen.
Figure 4. Pulse oximeter
Finger
Sensor
Copyright © The McGraw-Hill Companies, Inc.
Bio 151 – Laboratory Manual Human Anatomy & Physiology II DCCC Cardio-III
Last revised 08/2017
Pag
e4
D. Effect of various conditions on pulse and SpO2 – Measure each subject’s pulse and SpO2 under the
conditions listed below.
1. Resting
2. Arm (with finger sensor) held over the head
3. Deep breathing (slow, relaxing breaths)
4. Breath holding
5. Elbow and forearm in cold water (immerse arm elbow first into ice bath keeping hand with pulse
oximeter attached well above the waterline)
6. Elbow and forearm in warm water (hand above water)
7. Tensing arm muscles (with finger sensor) for 1 minute
8. Directly following relaxing muscle after tensing
E. Record results
1. Record the pulse rate and SpO2 values in Table 2 in the lab report section (Column 1, and
Column 3).
2. Calculate the change in pulse and SpO2 for each condition by subtracting the values obtained
during the resting condition (Box A or B) from the experimental values. Record the changes in
columns 2 and 4 in Table 2. A negative number indicates a decrease from the resting condition.
V. Blood Pressure Measurement
A. Introduction
Blood pressure (BP) can be defined as the pressure exerted by the blood as it pushes against the walls of
the blood vessels. It is most commonly measured in the brachial artery of the arm. In the arteries
particularly, blood pressure typically rises and falls as the heart contracts and relaxes. Systolic blood
pressure is the pressure measured at the moment the ventricles contract, and diastolic blood pressure is
Figure 5. Sphygmomanometer Copyright © The McGraw-Hill Companies, Inc.

Bio 151 – Laboratory Manual Human Anatomy & Physiology II DCCC Cardio-III
Last revised 08/2017
Pag
e5
the pressure measured
when the ventricles relax.
Blood pressure
measurements vary
widely within the
population, but values
within the range of 110-
130 / 75-85 mm Hg are
considered normal.
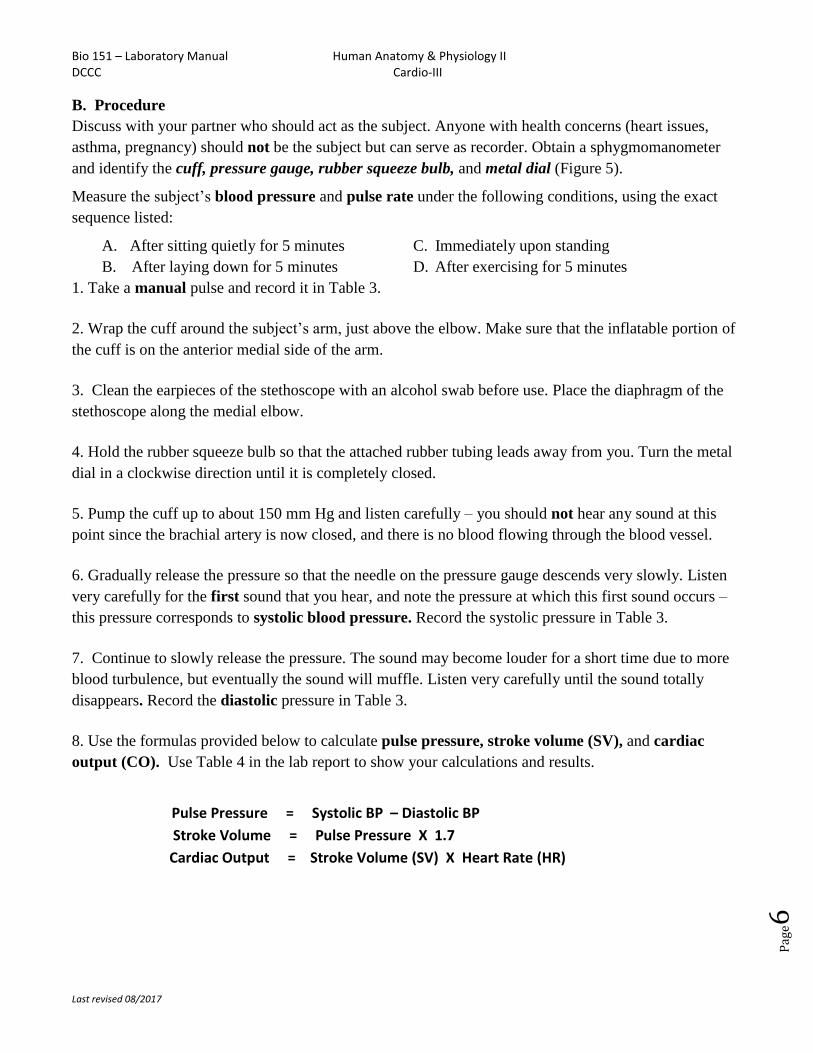
The sphygmomanometer
(usually called a blood
pressure cuff) is the most
commonly used
instrument to measure
blood pressure. Typical
sounds called Korotkoff
sounds can be detected
for determination of
systolic and diastolic
pressures (Figure 6a).
The procedure for using
the sphygmomanometer
involves placing the cuff
around the arm and
inflating the pressure
high enough to
completely block blood
flow through the brachial artery. At this point, there are no sounds heard when listening with the
stethoscope because there is no blood flowing through the artery (Figure 5b). As the pressure is
gradually released and the blood vessel first opens, blood will spurt through the artery, even though it is
still partially closed. The turbulence created by the spurting blood causes the first Korotkoff sound
heard. The pressure at which the first sound is heard corresponds to systolic blood pressure (Figure 6c).
As the pressure continues to decline, the sounds may become even louder because of greater blood
turbulence, but eventually the sounds completely disappear as the artery fully opens, and the blood flows
freely without turbulence. The pressure at which the sounds first stop represents the diastolic blood
pressure (Figure 6d).
Figure 6. Taking a blood pressure
Bio 151 – Laboratory Manual Human Anatomy & Physiology II DCCC Cardio-III
Last revised 08/2017
Pag
e6
B. Procedure
Discuss with your partner who should act as the subject. Anyone with health concerns (heart issues,
asthma, pregnancy) should not be the subject but can serve as recorder. Obtain a sphygmomanometer
and identify the cuff, pressure gauge, rubber squeeze bulb, and metal dial (Figure 5).
Measure the subject’s blood pressure and pulse rate under the following conditions, using the exact
sequence listed:
A. After sitting quietly for 5 minutes
B. After laying down for 5 minutes
C. Immediately upon standing
D. After exercising for 5 minutes
1. Take a manual pulse and record it in Table 3.
2. Wrap the cuff around the subject’s arm, just above the elbow. Make sure that the inflatable portion of
the cuff is on the anterior medial side of the arm.
3. Clean the earpieces of the stethoscope with an alcohol swab before use. Place the diaphragm of the
stethoscope along the medial elbow.
4. Hold the rubber squeeze bulb so that the attached rubber tubing leads away from you. Turn the metal
dial in a clockwise direction until it is completely closed.
5. Pump the cuff up to about 150 mm Hg and listen carefully – you should not hear any sound at this
point since the brachial artery is now closed, and there is no blood flowing through the blood vessel.
6. Gradually release the pressure so that the needle on the pressure gauge descends very slowly. Listen
very carefully for the first sound that you hear, and note the pressure at which this first sound occurs –
this pressure corresponds to systolic blood pressure. Record the systolic pressure in Table 3.
7. Continue to slowly release the pressure. The sound may become louder for a short time due to more
blood turbulence, but eventually the sound will muffle. Listen very carefully until the sound totally
disappears. Record the diastolic pressure in Table 3.
8. Use the formulas provided below to calculate pulse pressure, stroke volume (SV), and cardiac
output (CO). Use Table 4 in the lab report to show your calculations and results.
Pulse Pressure = Systolic BP – Diastolic BP
Stroke Volume = Pulse Pressure X 1.7
Cardiac Output = Stroke Volume (SV) X Heart Rate (HR)
Bio 151 – Laboratory Manual Human Anatomy & Physiology II DCCC Cardio-III
Last revised 08/2017
Pag
e7
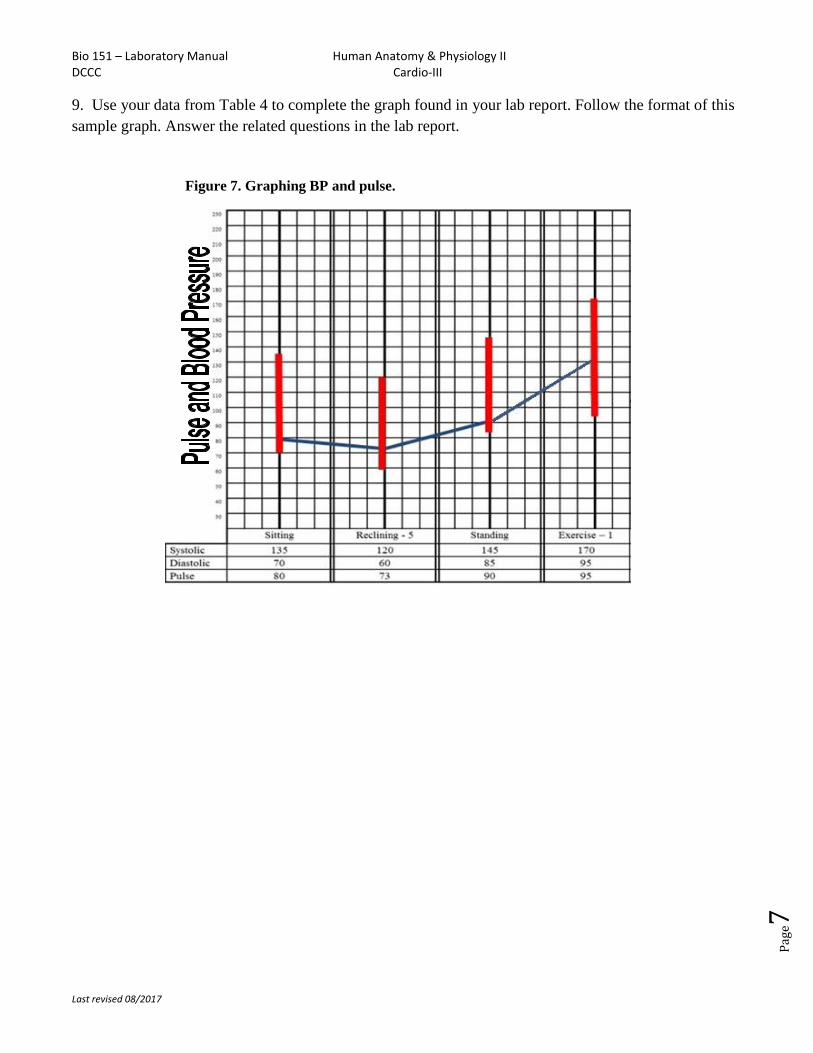
9. Use your data from Table 4 to complete the graph found in your lab report. Follow the format of this
sample graph. Answer the related questions in the lab report.
Figure 7. Graphing BP and pulse.

Bio 151 – Laboratory Manual Human Anatomy & Physiology II DCCC Cardio-III
Last revised 08/2017
Pag
e8
Blank on purpose
Bio 151 – Laboratory Manual Human Anatomy & Physiology II DCCC Cardio-III
Last revised 08/2017
Pag
e9
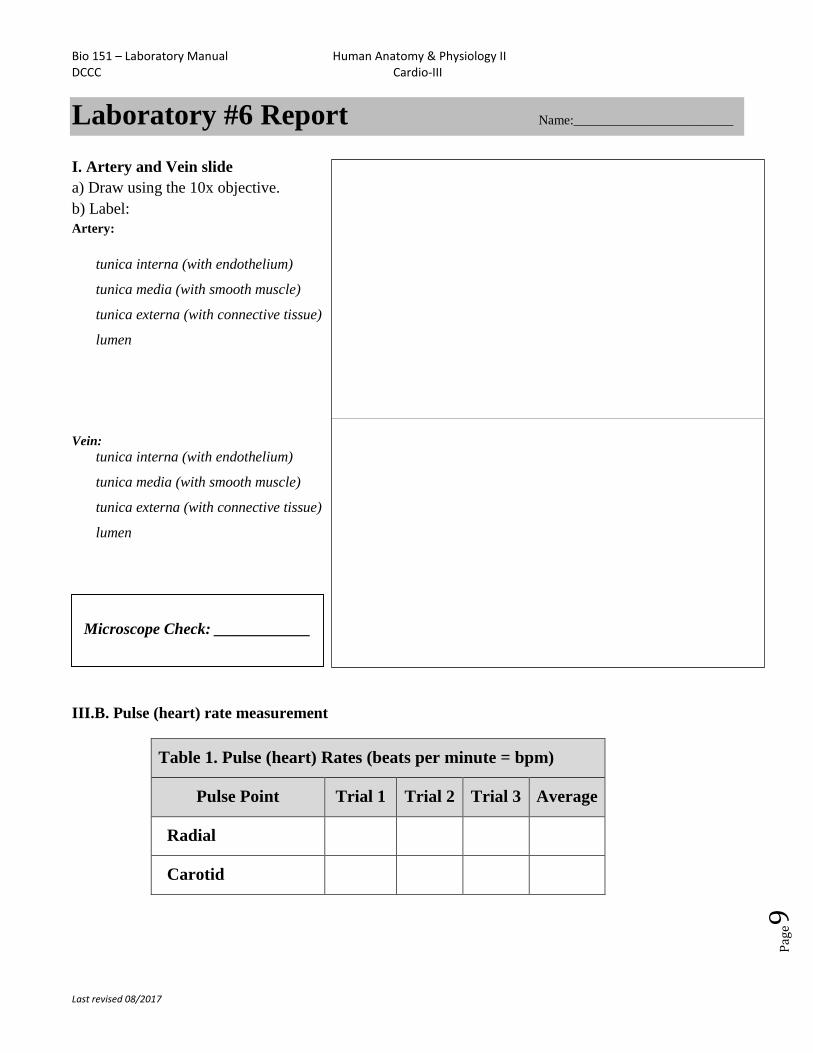
Laboratory #6 Report Name:________________________
I. Artery and Vein slide
a) Draw using the 10x objective.
b) Label:
Artery:
tunica interna (with endothelium)
tunica media (with smooth muscle)
tunica externa (with connective tissue)
lumen
Vein:
tunica interna (with endothelium)
tunica media (with smooth muscle)
tunica externa (with connective tissue)
lumen
Microscope Check: ____________
III.B. Pulse (heart) rate measurement
Table 1. Pulse (heart) Rates (beats per minute = bpm)
Pulse Point Trial 1 Trial 2 Trial 3 Average
Radial
Carotid
Bio 151 – Laboratory Manual Human Anatomy & Physiology II DCCC Cardio-III
Last revised 08/2017
Pag
e10
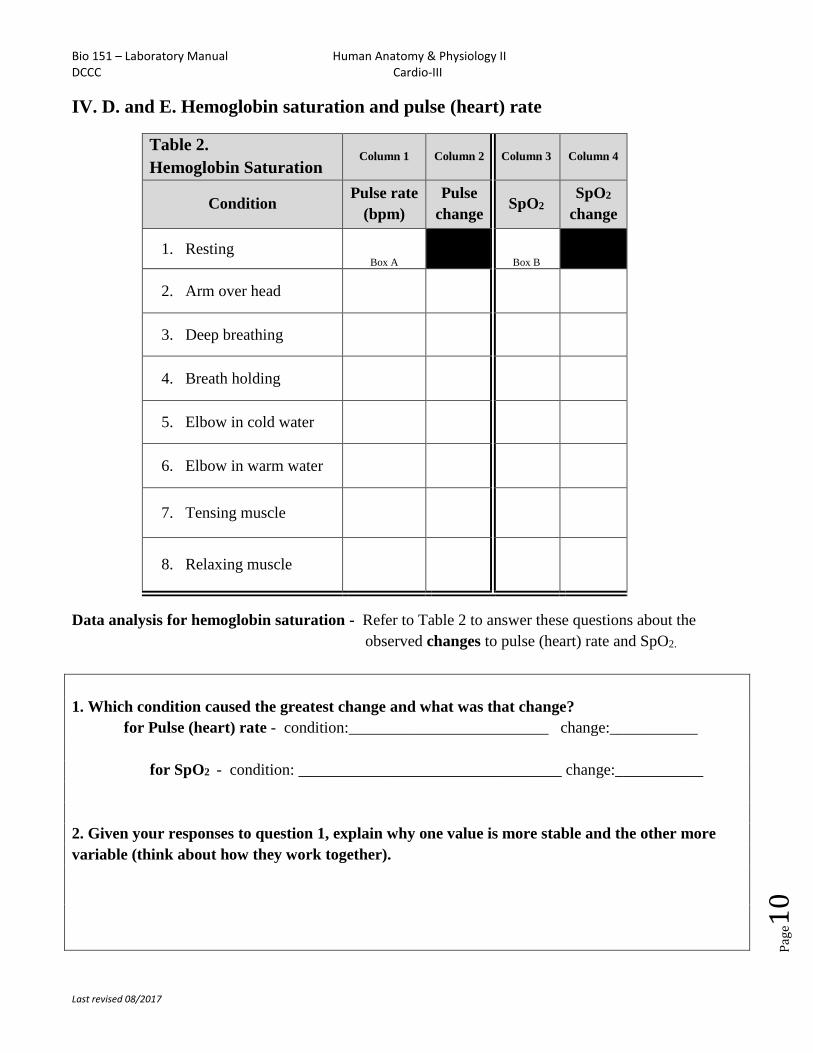
IV. D. and E. Hemoglobin saturation and pulse (heart) rate
Table 2.
Hemoglobin Saturation Column 1 Column 2 Column 3 Column 4
Condition Pulse rate
(bpm)
Pulse
change SpO2
SpO2
change
1. Resting Box A
Box B
2. Arm over head
3. Deep breathing
4. Breath holding
5. Elbow in cold water
6. Elbow in warm water
7. Tensing muscle
8. Relaxing muscle
Data analysis for hemoglobin saturation - Refer to Table 2 to answer these questions about the
observed changes to pulse (heart) rate and SpO2.
1. Which condition caused the greatest change and what was that change?
for Pulse (heart) rate - condition:_________________________ change:___________
for SpO2 - condition: _________________________________ change:___________
2. Given your responses to question 1, explain why one value is more stable and the other more
variable (think about how they work together).
Bio 151 – Laboratory Manual Human Anatomy & Physiology II DCCC Cardio-III
Last revised 08/2017
Pag
e11
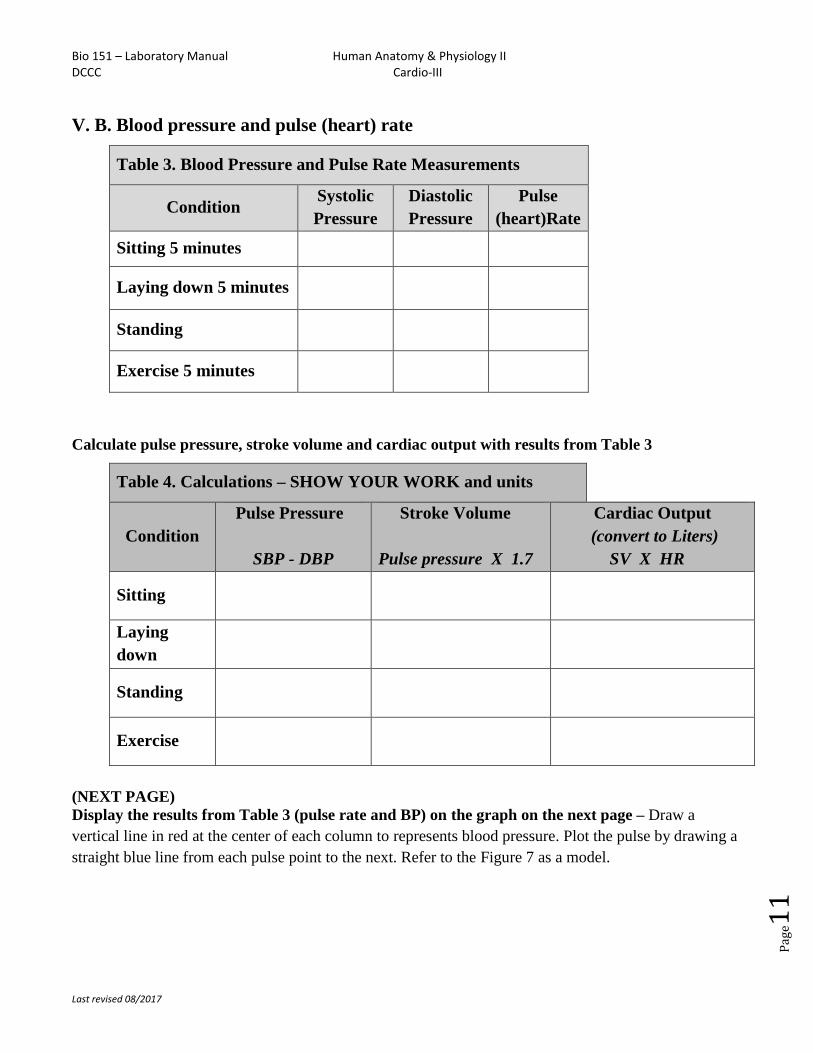
V. B. Blood pressure and pulse (heart) rate
Table 3. Blood Pressure and Pulse Rate Measurements
Condition Systolic
Pressure
Diastolic
Pressure
Pulse
(heart)Rate
Sitting 5 minutes
Laying down 5 minutes
Standing
Exercise 5 minutes
Calculate pulse pressure, stroke volume and cardiac output with results from Table 3
Table 4. Calculations – SHOW YOUR WORK and units
Condition
Pulse Pressure
SBP - DBP
Stroke Volume
Pulse pressure X 1.7
Cardiac Output
(convert to Liters)
SV X HR
Sitting
Laying
down
Standing
Exercise
(NEXT PAGE)
Display the results from Table 3 (pulse rate and BP) on the graph on the next page – Draw a
vertical line in red at the center of each column to represents blood pressure. Plot the pulse by drawing a
straight blue line from each pulse point to the next. Refer to the Figure 7 as a model.

Bio 151 – Laboratory Manual Human Anatomy & Physiology II DCCC Cardio-III
Last revised 08/2017
Pag
e12
230
220
210
200
190
180
170
160
150
140
130
120
110
100
90
80
70
60
50
40
30
Sitting Laying down Standing Exercise
Systolic
Diastolic
Pulse
rate
QUESTION:
Based on your data in the graph, draw conclusions about the relationships between exercise, pulse rate,
and blood pressure.