biol 300: fundamentals of biostatisticsirwin/biol300/wp-content/uploads/2017/... · biostatistics...
TRANSCRIPT
BIOL 300: Fundamentals of Biostatistics
Instructor: Darren Irwin
(Professor, Dept. of Zoology)

Statistics: possibly the most important subject you study at UBC
• Statistics is about how we can use information to infer something about Truth, while taking into account Uncertainty.
• Applicable in all fields.• Vital for scientists, especially biologists (and
medical professionals).• Understanding of statistical principles is
important for everyone.– Making decisions (e.g. medical / safety /
environmental / purchasing)– Interpreting news reports, voting, etc.

My three goals for you• As scientists, know how to design studies
and do statistical analysis on your own data.
• Be able to evaluate whether other people have done statistics correctly.
• Become skilled at statistical thinking.
Statistical thinking will one day be as necessary for efficient citizenship as the ability to read and write.
-H.G. Wells (paraphrased)

BIOL 300: Fundamentals of Biostatistics
Course web site:On UBC Connect

Instructor:
Darren Irwin(Professor, Dept. of Zoology)
Office: 209 Biodiversity (Beaty Biodiversity Research Centre)
e-mail: [email protected]
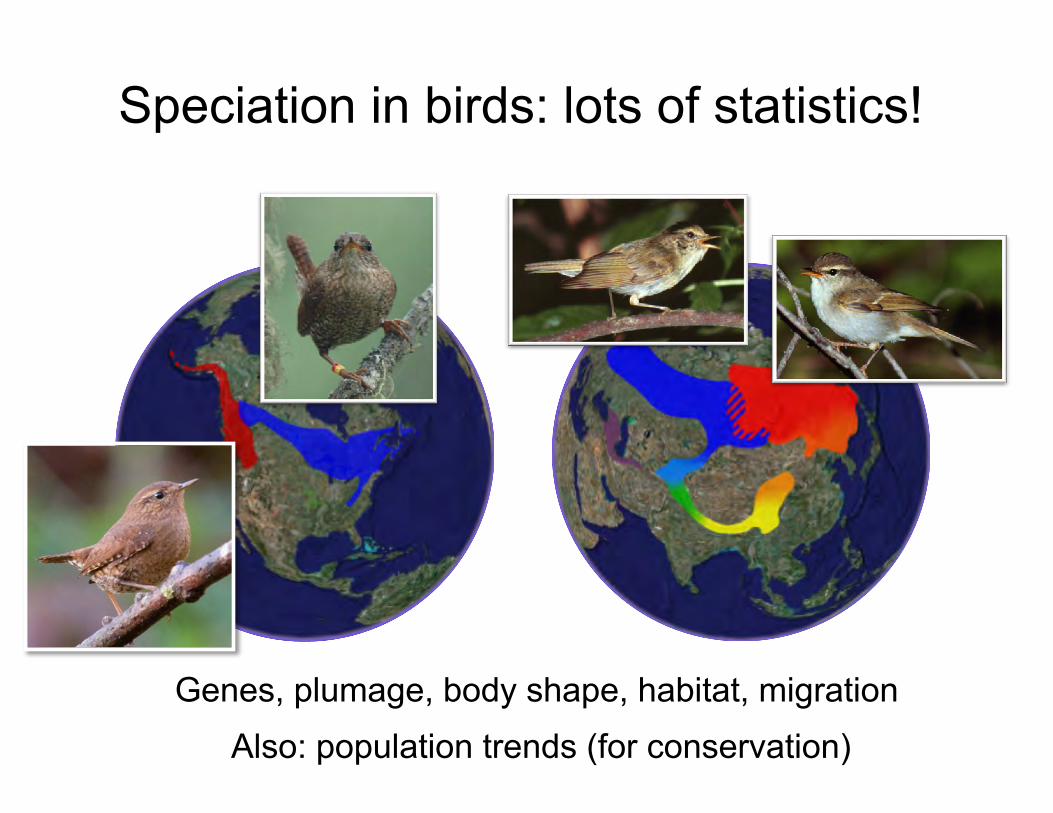
Speciation in birds: lots of statistics!
Genes, plumage, body shape, habitat, migrationAlso: population trends (for conservation)

Office hours: Mon. 3:30-5:00pm(Biodiversity 209)
Please feel free to ask questions during class(and after class most days)

Teaching Assistants(all graduate students in biology)
• Kenny Askelson
• Jordan Hamden
• Sherri Sadr Karimi
• Maddie Ore
• Ilan Rubin
Please: Respect the TA’s; Respect each other.

Respect each other
Please do:– Come to class ready to think about statistics.– Ask / answer questions during class.
Please don’t:– Distract your fellow students.
(e.g., texting, checking Facebook,fighting monsters, having conversations)

Textbook• Whitlock and
Schluter (2015) The Analysis of Biological Data, 2nd Edition.

Lab manual
• Available in a nicely bound copy for about $12 at Copiesmart in the UBC Village (near McDonald’s)
• Available as a PDF at course web site (on Connect)

Lab sections
• Begin second week of term (January 9-13), in Copp room 2008
• Attendance is strongly recommended (and required for some labs)
• Great opportunity for learning from TAs, using JMP, and for doing lab assignments.
JMP
• Statistical software for PCs and Macs• Used in the labs
• You might be interested in using this on your own computer (optional, and free for BIOL 300 students). See the course website for details.

Homework Assignments• Intended to help you learn
• Most questions are in textbook (numbers will be listed on website); some from lab material.
• Assigned each Friday.
• Due following Friday exactly at noon (12pm), in your TA’s box (at entrance to Stats Lab: Copp 2008). Feel free to turn in early (even days early), but not later than 12pm.
• First assignment due Jan. 13th:
– Chapter 1, problems 14, 15, 19, 21 – Chapter 2, problems 20, 22a-d, 23, 24

EvaluationHomework assignments 10% Lab assignment(s) 10% Mid-term 30% Final 50%
Policy on academic honesty:Your performance on the exams, homework, and assignments is expected to reflect your own work. Copying another's work or allowing your work to be copied can result in suspension or expulsion from UBC.

Midterm
March 3, in class

Online Discussion (Piazza)
• Piazza is an online discussion forum.• From the BIOL 300 page on Connect, you
can access Piazza.• Please post questions or comments there, for
other students and instructors to see and respond to.
• I am hoping that you (students) try to answer each others’ questions, but will also check in to help keep things on track.
• Please don’t post homework answers, but helpful guidance is encouraged.

Wait list• If you are on the wait list, we’ll have to see how much
room opens up in the next week.
• If you are not registered, try to register for the wait list. If you have questions about the process, email Tammy Tromba: [email protected].
• If you do not want to take the course, please de-register yourself (make room for others).

Other UBC Statistics Courses
• Credit given for only one of BIOL 300, EPSE 482, 483, FRST 231, GEOG 374, KIN 371, PSYC 218, 366, POLI 380, SOCI 328, STAT 200, 203
These other courses are paired with BIOL 300, but do not count as Biology courses (Biology majors should take BIOL 300).
Check with your academic advisor for details.

Origin of “Statistics”
In the 1700’s, the term “Statistics” was used to described the collection and analysis of demographic and economic data by states (i.e., governments).
The term was gradually applied to any sort of data from a population.
In biology, the need for analyzing data from variable populations led to great advances in statistical methods.

Introduction to Statistics
Statistics is the study of methods to describe and measure aspects of nature from samples. It provides tools to quantify the uncertainty of these measures, allowing us to determine their likely magnitude of departure from the truth.
Statistics become necessary when you have limited information (just a sample), but want to infer something about reality more generally (i.e., about a population).

Goals of statistics
• Estimate the values of important parameters
• Test hypotheses about those parameters
Parameter: a characteristic of a population.

Statistics is also about good scientific practice
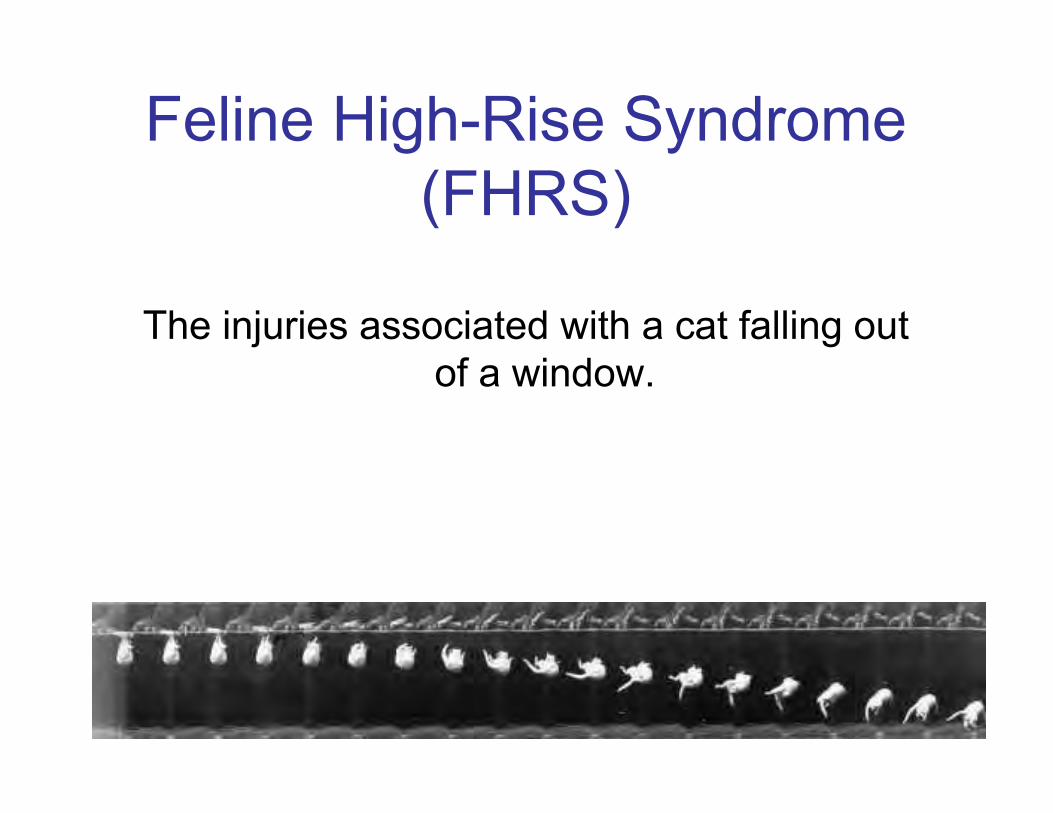
Feline High-Rise Syndrome (FHRS)
The injuries associated with a cat falling out of a window.

“The diagnosis of high-rise syndrome is not difficult. Typically, the cat is found outdoors, several stories below, and a nearby window or patio door is open.”
http://www.petplace.com/cats/highrise-syndrome-in-cats/page1.aspx
Two veterinarians decided to examine data from cats brought in to their clinics in New York City . . .
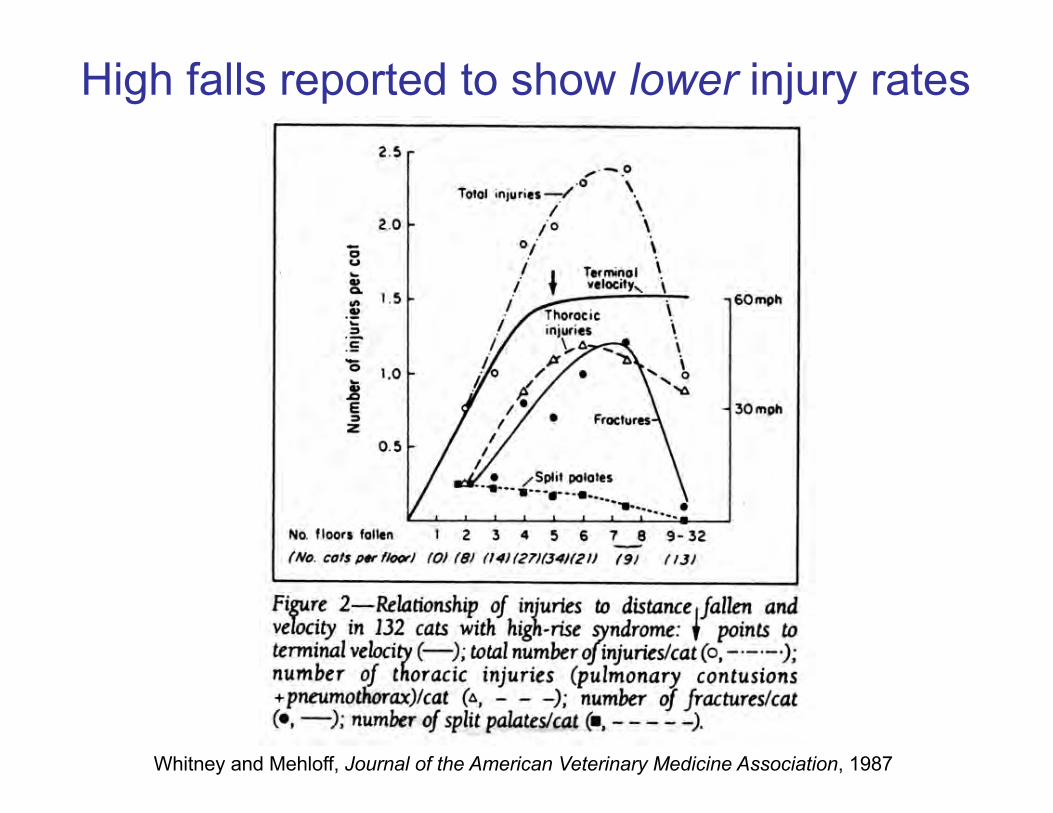
High falls reported to show lower injury rates
Whitney and Mehloff, Journal of the American Veterinary Medicine Association, 1987

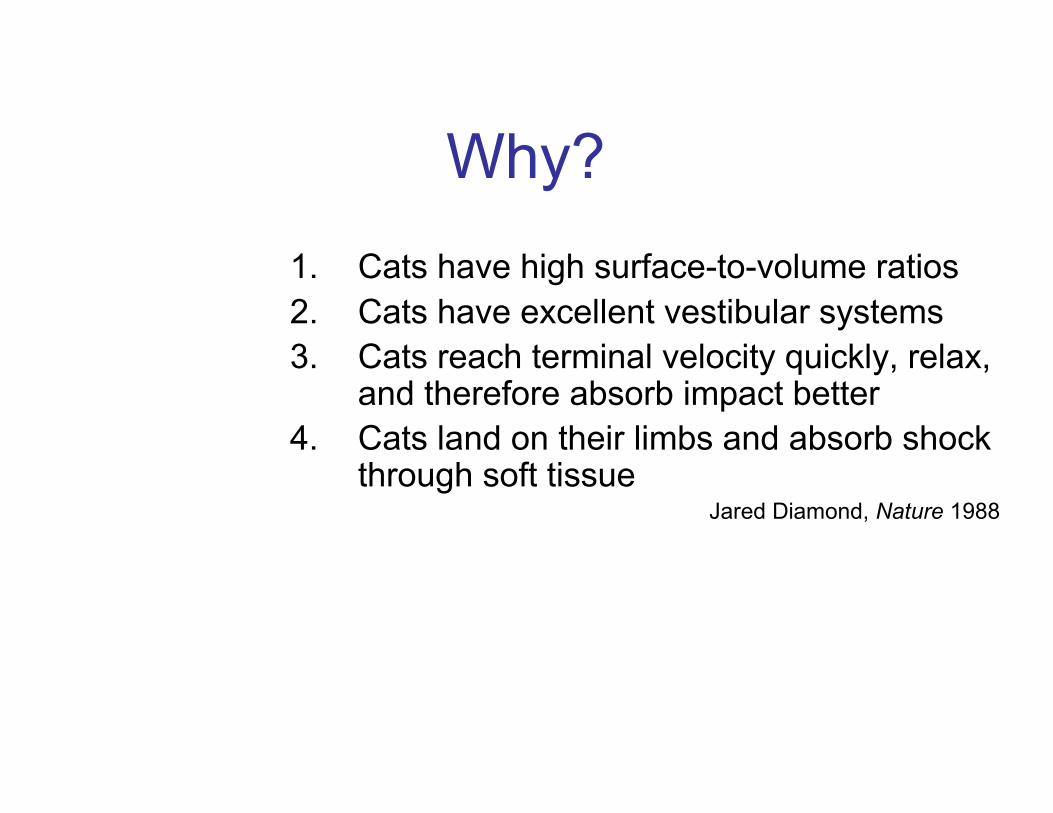
Why?1. Cats have high surface-to-volume ratios2. Cats have excellent vestibular systems3. Cats reach terminal velocity quickly, relax,
and therefore absorb impact better4. Cats land on their limbs and absorb shock
through soft tissueJared Diamond, Nature 1988
Why?1. Cats have high surface-to-volume ratios2. Cats have excellent vestibular systems3. Cats reach terminal velocity quickly, relax,
and therefore absorb impact better4. Cats land on their limbs and absorb shock
through soft tissueJared Diamond, Nature 1988
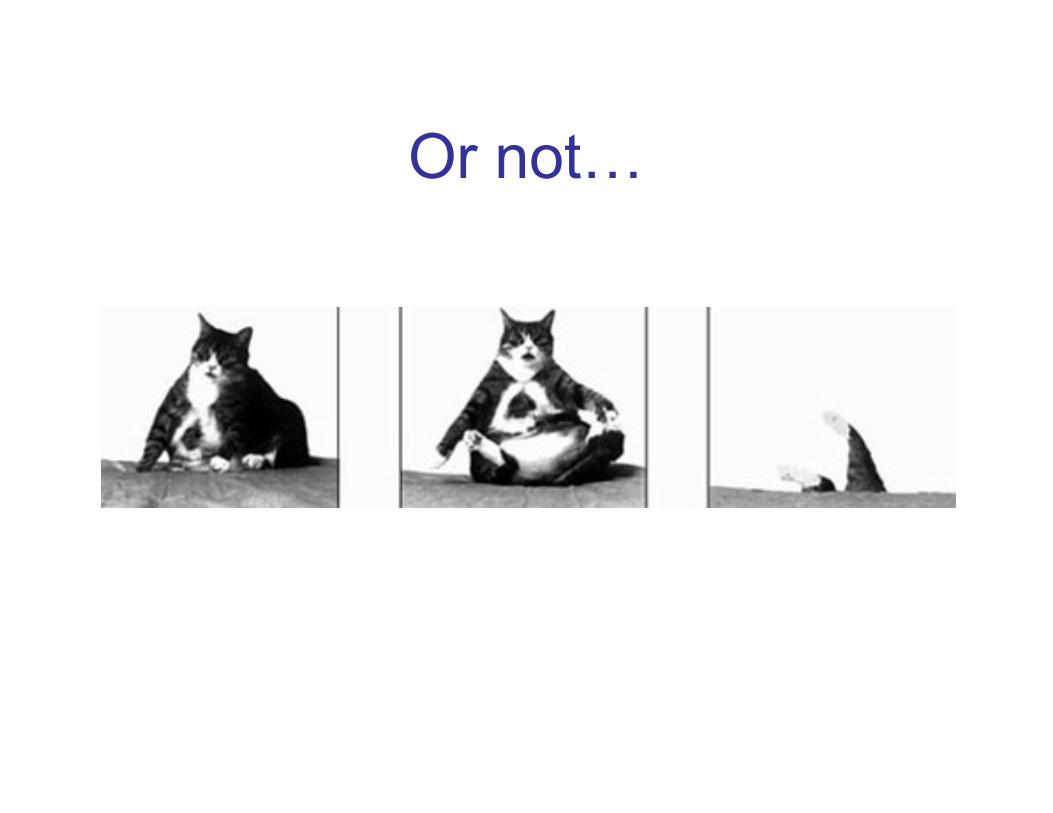
Or not…
Sample of convenience:a collection of individuals that happen
to be available at the time.

A newer study reports more injuries with longer falls
Vnuk et al. 2004. Feline high-rise syndrome: 119 cases (1998-2001). J. Fel. Med. Surg. 6:305-312.

FHRS illustrates importance of:
• Unbiased sample• Large sample size• Replication of studies• Careful choice of variables measured
– Are they really what you want to know?• Careful interpretation of data

Let’s collect some data . . .On an index card, please write (all anonymous and
optional):a) Your height (indicate inches or cm)b) Number of siblings you have (include half sibs)c) # of cups of coffee consumed in past week d) Your favorite colore) Length of your commute this morning (in minutes)f) Type of transportation used today (e.g., walk, bike,
car, bus)g) A random integer from 1 to 5

Read:Chapters 1 and 2
(If you don’t yet have textbook, ch1-3 are available as PDFs on website.)
In future weeks, read each chapter around the time I cover it in lecture, (and/or when I assign
homework from it).

Variables and Data
• A variable is a characteristic measured on individuals drawn from a population under study.
• Data are measurements of one or more variables made on a collection of individuals.

Explanatory and response variables
We try to predict or explain a response variable from an explanatory variable.
Older terminology: dependent variable and independent variable

Mortality on the Titanic, as predicted by sex
Populations and samples

Populations <-> Parameters;Samples <-> Estimates
Estimates almost always differ from Parameters, for a variety of reasons . . .

Pisaster sea stars

A population of starfish


A biased sample
Bias refers to the tendency of a measurement process to over- or
under-estimate the value of a true population characteristic.
If estimates tend to differ from a parameter in a certain direction, the
estimate is biased.

The 1936 US presidential election
vs.
Alf LandonRepublican
Franklin RooseveltDemocrat

1936 Literary Digest Poll
• 2.4 million respondents
• Based on questionnaires mailed to 10 million people, chosen from telephone books and club lists
• Predicted Landon wins: Landen 57% over Roosevelt 43%

1936 election results
Roosevelt won with 62% of the vote

What went wrong?
Subjects given the questionnaire were chosen from telephone books and clubs, biasing the respondents to be those with greater wealth
Voting and party preference is correlated with personal wealth

Volunteer bias
Volunteers for a study are likely to be different, on average, from the population
For example:– Volunteers for sex studies are more likely
to be open about sex– Volunteers for medical studies may be
sicker than the general population

Precise Imprecise
Biased
Unbiased
Each point represents an estimate of a parameter.

Properties of a good sample
• Random selection of individuals (each individual has equal probability of being selected)
• Independent selection of individuals
• Sufficiently large
In a random sample, each member of a population has an equal and independent
probability of being selected.
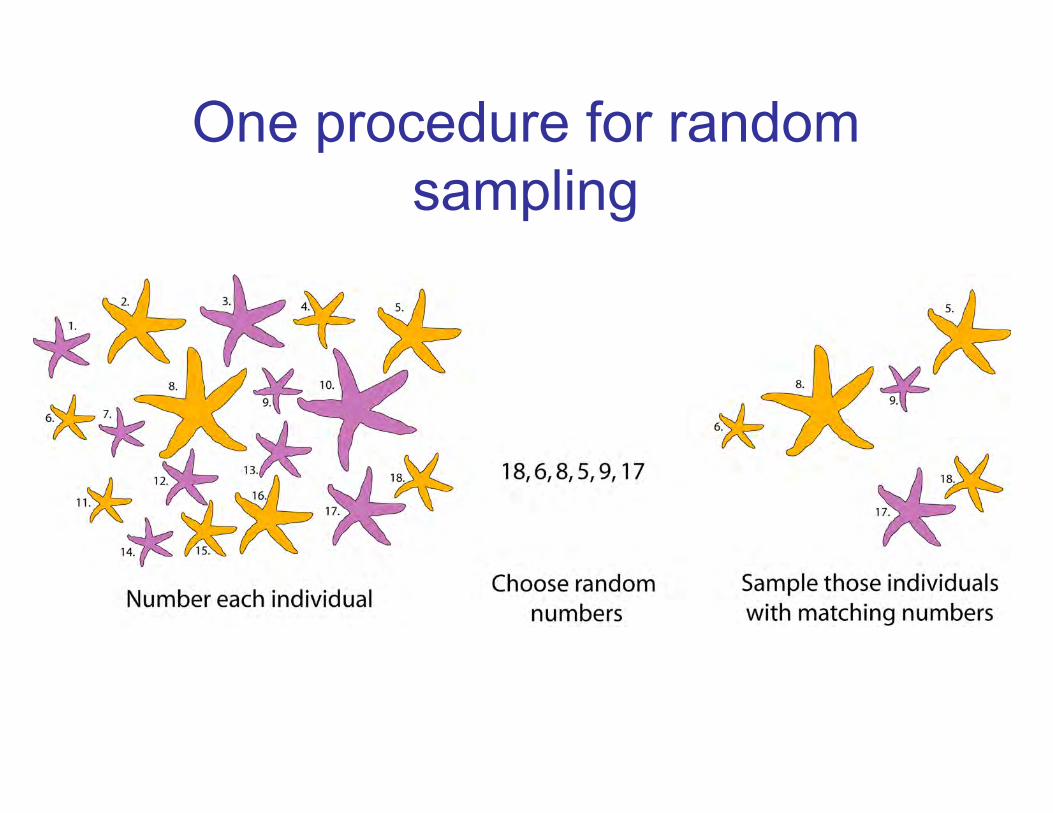
One procedure for random sampling

Population parameters are constants whereas estimates
are random variables, changing from one random sample to the next from the
same population.

Sampling error
• The chance difference between an estimate and the population parameter being estimated.
(note that sampling bias is not included here)
The good news: We can estimate the magnitude of sampling error using properties of the sample.
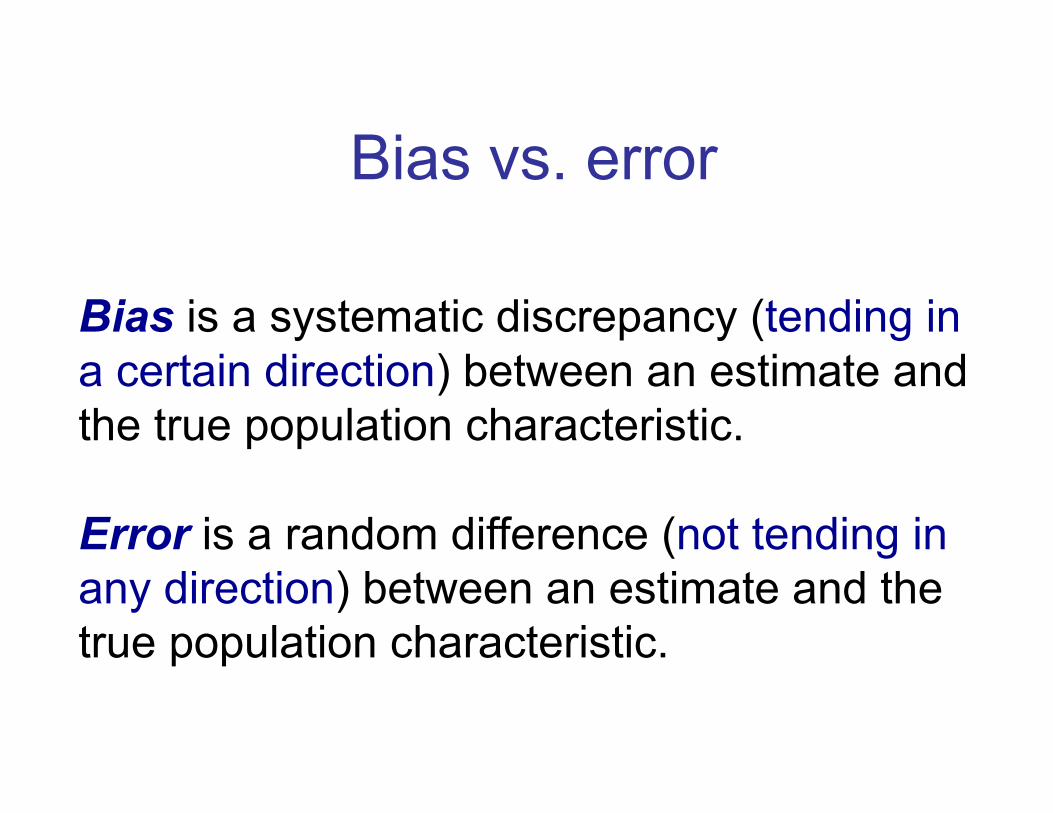
Bias is a systematic discrepancy (tending in a certain direction) between an estimate and the true population characteristic.
Error is a random difference (not tending in any direction) between an estimate and the true population characteristic.
Bias vs. error

Estimates (from samples) differ from Parameters (of populations) for four reasons:
“Bias” “Error”
Property of individuals
Measurement bias
Measurement error
Property of sample
Samplingbias
Sampling error
This is the main focus of Statistics

Larger samples on average will have smaller sampling
error

Heights of BIOL300 students (N = 183)(2017 Spring; self-reported)
Height (cm)
Freq
uenc
y
130 150 170 190 210 230 250 270
0
10
20
30

Heights of BIOL300 students (N = 183)(2017 Spring; self-reported, 2 outliers removed)
Height (cm)
Freq
uenc
y
143 152 161 170 179 188 197
0
5
10
15
25
20
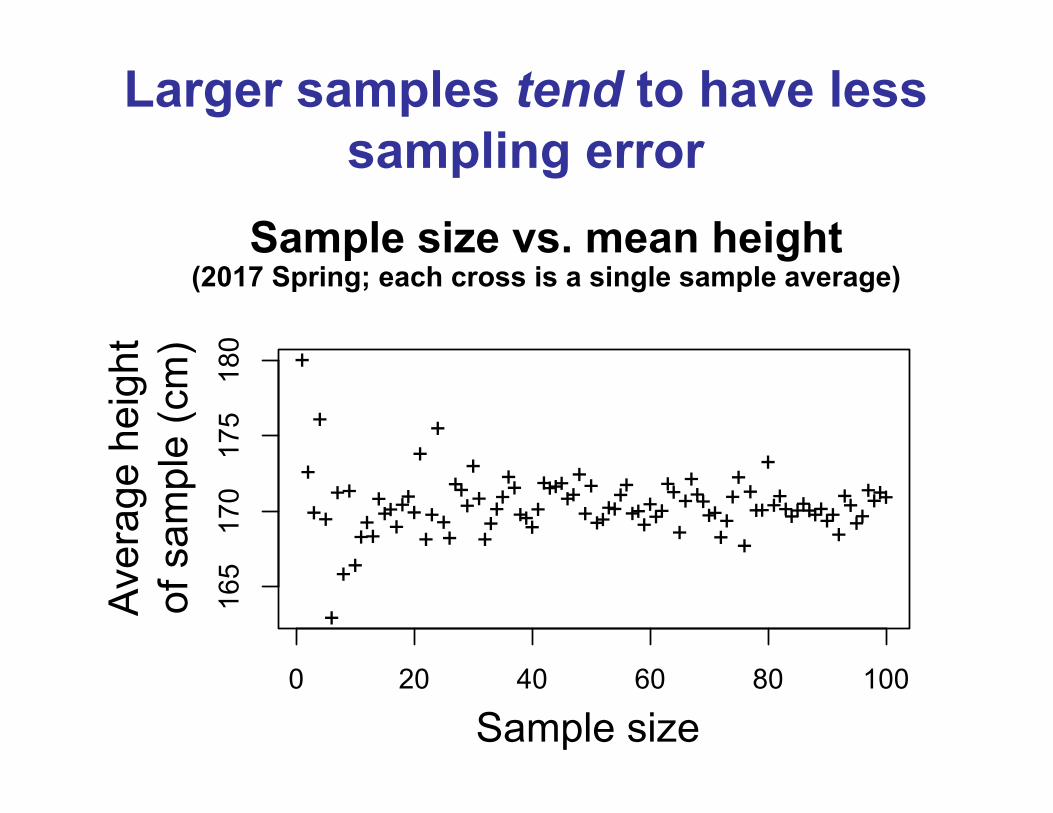
Larger samples tend to have less sampling error
Sample size vs. mean height(2017 Spring; each cross is a single sample average)
Sample size
Aver
age
heig
htof
sam
ple
(cm
) +
++
+
+
+
+
+
+
++++
+++++++
+
++
+
++
+++++++++++++++
+++++++++++++
++++++++
+++++++++
++++
+
+++
+++++++++++++
++++++++
0 20 40 60 80 100
165
170
175
180

Good samples are a foundation of good science
• When thinking about any study, one should always ask “How were the data collected?”

“B.C. residents support Northern Gateway pipeline project: poll”
Headline from the Vancouver Sun on January 5th, 2012:
Let’s examine the data and methodology:
The Ipsos-Reid press release:http://www.ipsos-na.com/news-polls/pressrelease.aspx?id=5460
Be a critical consumer of information!

Provincial election coming up on May 9th
• Lots of polling data will be in the news this term.
• To interpret well, need to think carefully about the methodology.
• Polling firms tend to underestimate their uncertainty. (Very hard to get unbiased sample!)
http://www.threehundredeight.com/p/british-columbia.html
http://www.insightswest.com/news/housing-still-top-of-mind-as-british-columbians-ponder-political-choices/

You must think carefully about what population is being sampled• All cats falling out of windows vs.
survivors being brought into vets• American voters vs. Americans who
have telephones who respond to survey through mail
• British Columbians vs. British Columbians willing to fill out online survey