biological wastewater treatment processes iii mbr processes
TRANSCRIPT

Biological Wastewater Treatment Processes III – MBR
Processes
Harlan H. Bengtson, PhD, P.E.
COURSE CONTENT
1. Introduction Biological wastewater treatment is very widely used for removal of biodegradable
materials from wastewater. The first course in this sequence, Biological Wastewater
Treatment I – Activated Sludge, starts with a discussion of the biochemical oxygen
demand that is created by biodegradable materials in water and the reason why such
materials must be removed from wastewater. This course is about the Membrane
Bioreactor (MBR) wastewater treatment process, including background information
about the process and a description of the process, as well as process design
calculations for several different configurations of the MBR process and numerous
example calculations.
2. Learning Objectives
At the conclusion of this course, the student will
Be familiar with the components of and general configuration of an MBR
wastewater treatment process
Know the advantages and disadvantages of an MBR wastewater treatment
process in comparison with a conventional activated sludge process
Know the type of pretreatment typically required for an MBR wastewater
treatment process
Be able to carry out process design calculations to determine the required
membrane area, membrane module volume and scouring air flow rate

Be able to carry out process design calculations for a BOD removal/nitrification
MBR process in order to determine the required aeration tank volume, sludge
wasting rate, air flow rate, and alkalinity addition
Be able to carry out process design calculations for a Pre-Anoxic Denitrification
MBR process in order to determine the required pre-anoxic tank volume, the
reduced oxygen/air requirement, the reduced alkalinity requirement, the anoxic
tank mixing power needed, and the sludge wasting rate
3. Topics Covered in this Course I. Description of the MBR (Membrane Bioreactor) Process II. Membrane Module Process Design Calculations III. Process Design Calculations for BOD Removal and Nitrification IV. Process Design Calculations for Pre-Anoxic Denitrification
4. Description of the MBR (Membrane Bioreactor) Process Initial Development of the MBR Process: Membrane filtration has been used for
quite some time in a variety of ways in water and wastewater treatment. It was not until
the 1970’s, however, that research at Rensselaer Polytechnic Institute proposed
coupling the activated sludge process with membrane filtration. Dorr-Oliver introduced
the first membrane bioreactor (MBR) wastewater treatment processes with a flat sheet
ultrafiltration plate and frame membrane. This process was put into use in Japan in the
1970s and 1980s, but did not come into very widespread use around the world. In 1989
Yamamoto et al (Ref #2 at the end of this course) developed and introduced submerged
membranes with a membrane module placed directly in the aeration tank rather than as
a separate process following the aeration tank. This innovation accelerated interest in,
development of, and spreading use of MBR wastewater treatment processes. Currently
almost all MBR processes being installed have a submerged membrane module in the
aeration tank, as shown in Figure 1 below.

Figure 1. MBR Wastewater Treatment Typical Process Flow Diagram
Comparison of the MBR Process with Conventional Activated Sludge: The first
difference to note is that the use of membrane filtration allows an MBR process to
produce a significantly higher quality effluent than that obtainable from a conventional
activated sludge process. Secondly, the mixed liquor suspended solids concentration
(MLSS) and the solids retention time (SRT) are limited in a conventional activated
sludge process by the need to produce a sludge with good settling characteristics in the
secondary clarifier. This is not a requirement for MBR processes, because the final
effluent is produced by filtration rather than by sedimentation. Thus, the MLSS and
SRT can both be larger for MBR processes than the typical values used for
conventional activated sludge. This results in a smaller aeration tank volume needed
for an MBR process than that needed for conventional activated sludge treating the
same wastewater flow.
On the other hand, the need to keep the membranes from getting fouled increases
operating costs over typical values for conventional activated sludge. The method that
has evolved for cleaning the membranes and keeping them from getting fouled is a
fairly high rate of aeration below the membrane module, so that the air bubbles keep the
membrane clean. This results in a higher aeration cost than that typically required for
conventional activated sludge. The scouring air flow below the membrane module is
typically provided by a coarse bubble diffuser system.
Pretreatment Prior to the MBR Aeration Tank: Primary clarification is not typically
used before the MBR aeration tank, however, coarse screening and grit removal should
be used if warranted by the wastewater characteristics, and fine screening (2 – 3 mm
pore size) should be used as the final pretreatment step before the aeration tank.

MBR Wastewater Treatment Process Alternatives: The MBR wastewater treatment
process alternatives that will be discussed in this course are the following:
1. BOD removal and Nitrification
2. BOD removal and Nitrification together with Pre-anoxic Denitrification
Overview of MBR Process Design Calculations: The membrane surface area
requirement, volume requirement, and required scouring air flow rate for the membrane
module can be calculated using membrane module properties typically available from
membrane module manufacturers or vendors together with incoming wastewater
information.
Sizing of the aeration tank will be done in a manner similar to that used for a completely
mixed activated sludge process.
5. Membrane Module Process Design Calculations
The membrane module properties typically required for process design and their units
are: 1) Average Membrane Flux, J, in L/hr/m2, 2) Module Packing Density, , in m2/m3,
and 3) Specific Aeration Demand, SADM in m3 air/hr/m2 membrane area. Using these
membrane/membrane module properties, the required membrane area, membrane
module volume, and scouring air flow rate can be calculated as follows:
Membrane area, AM = Qo/J, where Qo is the wastewater flow rate in L/hr. With Qo in
m3/day, the equation with conversion factors becomes: Am = (Qo/24)*1000/J.
With Qo in MGD, the equation with conversion factors becomes:
Am = (Qo/24)*1000000/[(J/3.7854)/(3.28082)]. Note that in this case, the flow rate has
been converted to gal/day and J has been converted to gal/hr/ft2.
The membrane module volume is then calculated as: VM = AM/ . For S.I. units no
conversion factors are needed. For U.S. units, must be converted from m2/m3 to ft2/ft3.
The scouring air flow required to keep the membrane from getting fouled is calculated
as: Required Scouring Air Flow = SADM*AM/60 . This gives the required scouring air

flow in m3/min. It is typically provided with a coarse bubble diffuser system. To
calculate the required scouring air flow in cfm, SADM should be converted to ft3 air/hr/ft2
membrane.
Example #1: a) A design wastewater flow 7571 m3/d is to be treated with an MBR
wastewater treatment system. The design membrane module properties are: average
membrane flux, J = 12 L/hr/m2 ; module packing density, = 120 m2/m3; specific
aeration demand, SADM = 0.3 m3 air/hr/m2 membrane. Calculate the required
membrane area, membrane module volume, and scouring air flowrate.
b) Repeat for a design wastewater flow of 2 MGD with the same membrane module
properties.
Solution: a) Figure 2 below is a screenshot of an Excel spreadsheet set up to make
the membrane module calculations described above for part a), with S.I. units. The
given membrane module properties were entered in the blue cells. Am, Vm and scouring
air flow are calculated by the worksheet in the yellow cells, using the equations given
above. Note that the specified wastewater flow rate of 7571 m3/d is used in the
calculations. As shown in Figure 2, the results are: Am = 26,288 m2, Vm = 219 m3, and
scouring air flow required = 131 m3/min.
b) The Figure 3 below is a similar screenshot with the calculations in U.S. units, as
described above. In this worksheet the specified wastewater flow rate of 2 MGD is used
in the calculations. The results in U.S. units are: Am = 282,956 ft2, Vm = 7736 ft3, and
scouring air flow required = 4642 cfm.

Figure 2. Excel Worksheet with Membrane Module Calculations – S.I. units
Figure 3. Excel Worksheet with Membrane Module Calculations – U.S. units

6. Process Design Calculations for BOD Removal and Nitrification
The aeration tank will be essentially a completely mixed tank, so the process design
calculations for the aeration tank can be done using a completely mixed activated
sludge (CMAS) process design procedure. The calculations described in this section
and illustrated with example calculations follow the CMAS process design procedure
presented in Metcalf & Eddy’s 4th edition of Wastewater Engineering, Treatment and
Reuse, which is the first reference in the list at the end of this course.
Required User Inputs: Quite a few user inputs are needed for the Metcalf & Eddy
CMAS process design procedure. The Figure 4 below, is an Excel spreadsheet
screenshot showing the wastewater parameters/characteristics inputs needed for the
MBR process design calculations. The Figure 5 below is another screenshot showing
the biological kinetic coefficients for BOD removal and for nitrification that are needed,
along with a couple of constants. The values shown in these two figures will be used in
the example calculations in this course.
Figure 4. Wastewater Parameter/Characteristics Inputs – U.S. units

Figure 5. Inputs for Biological Kinetic Coefficients and Constants – U.S. units
Table 1, on the next page, shows ranges and typical values for the BOD removal
biological kinetic coefficients. Table 2 provides similar information for nitrification
removal and biological kinetic constants.

Table 1. Ranges and Typical Values for Biological Kinetic Coefficients – BOD Removal
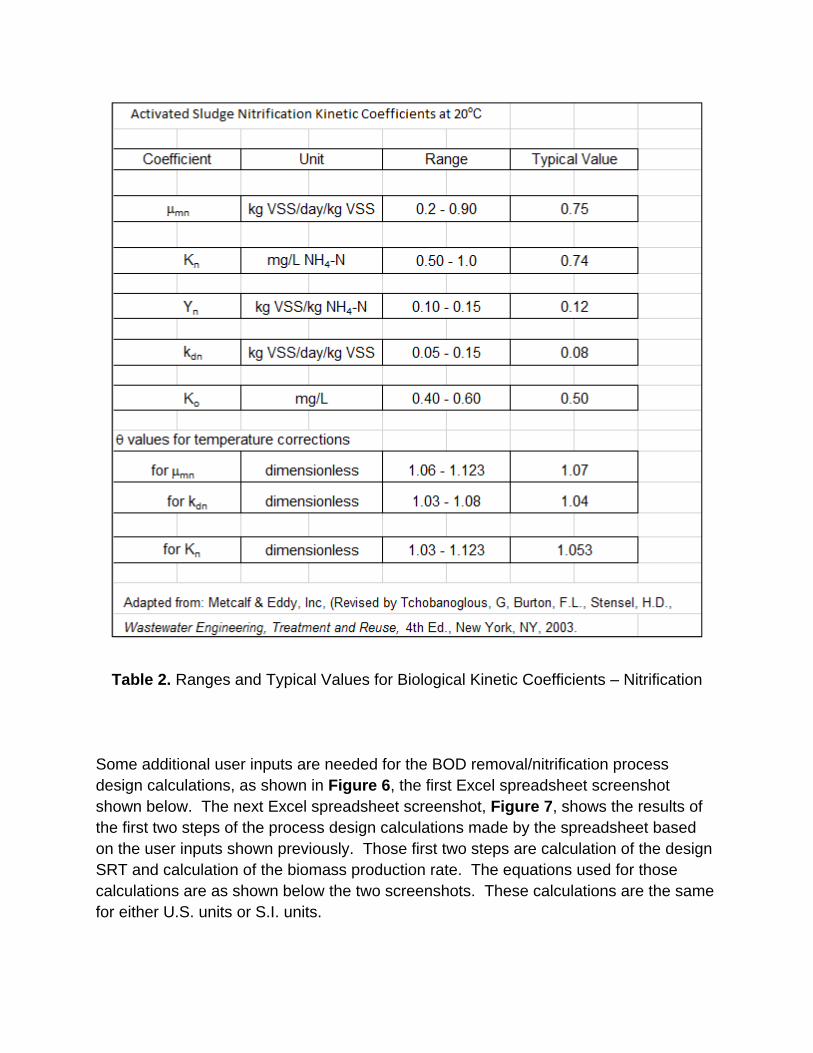
Table 2. Ranges and Typical Values for Biological Kinetic Coefficients – Nitrification
Some additional user inputs are needed for the BOD removal/nitrification process
design calculations, as shown in Figure 6, the first Excel spreadsheet screenshot
shown below. The next Excel spreadsheet screenshot, Figure 7, shows the results of
the first two steps of the process design calculations made by the spreadsheet based
on the user inputs shown previously. Those first two steps are calculation of the design
SRT and calculation of the biomass production rate. The equations used for those
calculations are as shown below the two screenshots. These calculations are the same
for either U.S. units or S.I. units.

Figure 6. User Inputs for MBR Process Design Calculations – BOD Removal and
Nitrification
Figure 7. Calculation of Design SRT and Biomass Production Rate

Equations for calculation of Design SRT:
nm at Tww = nm,20 Tww – 20 Kn at Tww = Kn,20
Tww – 20
kdn at Tww = kdn,20 Tww – 20 (Tww must be in oC for these calculations)
n = [ nN/(Kn + N) ] [ DO/(Ko + DO) ] - kdn Theoretical SRT = 1/n
Design SRT = (FS)(Theoretical SRT) FS = TKNpeak/TKNaverage
Equations for calculation of Biomass Production Rate:
m at Tww = m,20 Tww – 20 kd at Tww = kd,20
Tww – 20
S = Ks[1 + (kd)SRT]/[SRT(m - kd) - 1] PX,bio = QY(So - S)(8.34)/(1 + kdSRT) + fdkdQY(So - S)(8.34)SRT/(1 + kdSRT) + QYn(NOx)(8.34)/(1 + kdnSRT)
Note that the equation for PX,bio , as shown above, is for use with U.S. units (Q in MGD).
For S.I. units with Q in m3/d, the 8.34 conversion factor [(lb/MG}/(mg/L)] should be
replaced with (1/1000) to convert g/day to kg/day.
Figure 8 below shows the calculation of the amount of nitrogen oxidized to nitrate
(NOx), using the following equation: NOx = TKN - Ne - 0.12PX,bio/Q
The iterative procedure described in blue sets the difference between the estimated and
calculated values of NOx to zero by changing the initial estimated value in cell C14
(shown in Figure 6). These calculations are the same for either U.S. or S.I. units

Figure 8. Calculation of Amount of Nitrogen Oxidized to Nitrate
Figure 9 shows the calculation of the production rate and mass of VSS and TSS in the
aeration tank, using the following equations:
bpCOD/pCOD = (BODo - sBODo)/(CODo - sCODo) nbVSS = [1 - (bpCOD/pCOD)VSSo] PX,VSS = PX,bio + Q(nbVSS*8.34) PX,TSS = PX,bio/(VSSo/TSSo) + Q(nbVSS*8.34) + Q(TSSo - VSSo)8.34
Note that the equations for PX,VSS and PX,TSS, as shown above, are for use with U.S.
units (Q in MGD). For S.I. units with Q in m3/d, the 8.34 conversion factor
[(lb/MG}/(mg/L)] should be replaced with (1/1000) to convert g/day to kg/day.
Mass of MLVSS = (PX,VSS) SRT Mass of MLSS = (PX,TSS) SRT

Figure 9. Calculation of Production Rate and Mass of VSS and TSS in Aeration Tank
Figure 10 shows the calculation of the aeration tank volume and dimensions, the
detention time and the MLVSS concentration, using the following equations:
V = [Mass of MLSS/(MLSS*8.34)]*(1,000,000/7.48) (for V in ft3 and Mass of MLSS in lb)
V = Mass of MLSS*1000/MLSS (for V in m3 and Mass of MLSS in kg)
detention time: = V/Q
The actual equation used to calculate the detention time in U.S. units with V in ft3 and Q
in MGD is: = [(V*7.48/1,000,000)*(N*24)]/Q where V is the actual aeration tank
volume for each tank and N is the number of aeration tanks.
For S.I. units with V in m3 and Q in m3/d, the equation is: = [V*(N*24)]/Q
MLVSS = MLSS*(Mass of MLVSS/Mass of MLSS)
Also, the equation for the volume of a rectangular tank or the volume of a cylindrical
tank is used (along with the user specified depth of water in the tank (and the L:W ratio
if it is rectangular) to calculate the length and width or diameter of the aeration tank.

Figure 10. Calc. of Aeration Tank Volume and Dimensions, Detention Time, & MLVSS
Figure 11 shows the calculation of the F/M ratio, the Volumetric BOD loading, and the
sludge wasting rate, using the following equations:
F/M = QSo/(V*MLVSS)
This equation can be used as it is for S.I. units with Q in m3/day and V (the total volume
of all aeration tanks) in m3. For U.S. units with Q in MGD and V in ft3, some conversion
factors are needed, giving the following equation:
F/M = QSo/[(V*7.48/1,000,000)*MLVSS]
For S.I. units with Q in m3/d and V in m3, the equation for volumetric BOD loading is:
Vol BOD loading = QSo(1/1000)/V NOTE: V is the total vol. of all aeration tanks.
For U.S. units with Q in MGD and V = total aeration vol. in ft3, the volumetric BOD
loading in lb BOD/d/1000 ft3 can be calculated with the following equation:
Vol BOD loading = QSo*8.34/(V/1000)
For S.I. units with total aeration tank volume, V, in m3 the sludge wasting rate, Qw can
be calculated in m3/d using the following equation with TSS_W being the TSS
concentration in the wasted sludge:
Qw = [(V*MLSS)/(SRT*TSS_W)]

For U.S. units with total aeration tank volume, V, in ft3 the sludge wasting rate, Qw, can
be calculated in gal/d using the following equation:
Qw = [(V*7.48*MLSS)/(SRT*TSS_W)]
Figure 11. Calculation of F/M, Volumetric BOD loading, and Sludge Wasting Rate
Oxygen/Air Requirement and Blower Calculations will be made using the “Rule of
Thumb” guidelines shown below, which are made available by Sanitaire, a manufacturer
of aeration diffusers.
Rules of Thumb for Estimating Oxygen/Air Requirements for Coarse or Fine Bubble Diffusers
Source:
http://www.xylemwatersolutions.com/scs/sweden/sv-se/produkter/cirkulationspumpar/documents/san3.pdf
1. The typical AOR/SOR (or AOTE/SOTE) is 0.50 for a coarse bubble aeration system.
2. The typical AOR/SOR (or AOTE/SOTE) is 0.33 for a fine bubble aeration system.
3. The typical SOTE is 0.75% per foot (2.46%/m) of diffuser submergence for a coarse bubble system
4. The typical SOTE is 2.0% per foot (6.56%/m) of diffuser submergence for a fine bubble system
5. 1 SCF of air weighs 0.075 lb/ft3 (1.20 kg/m3) and contains 23% oxygen by weight, thus:
6. Air contains 0.0173 lbm of oxygen per SCF (0.2770 kg oxygen/SCM).
7. For biological treatment with SRT from 5 to 10 days, lb oxygen required /lb BOD removed
is typically in the range from 0.92 - 1.1 lb O2/lb BOD. Higher SRT results in a higher value
of lb O2 required/lb BOD removed.
8. The oxidation of 1 lb of ammonia nitrogen typically requires 4.1 to 4.6 lb of oxygen.

Figure 12 shows the S.I. version of user inputs needed to make the oxygen/air/blower
calculations using the “Rule of Thumb” guidelines shown above. Figure 13 shows the
U.S. version.
Figure 12. User Inputs for Oxygen/Air/Blower Calculations – S.I. Version
Figure 13. User Inputs for Oxygen/Air/Blower Calculations – U.S. Version
The results of the oxygen/air requirement and blower calculations are shown for S.I
units in Figure 14 and for U.S. units in Figure 15.

Figure 14. Oxygen/Air Requirement/Blower Calculations – S.I. Version
Figure 15. Oxygen/Air Requirement/Blower Calculations – U.S. Version
The calculations in this section are rather straightforward. The pressure at mid depth
is the (diffuser depth/2) times the specific weight of water with unit conversions as
needed. The BOD removal rate is the ww flow rate times the (influent BOD minus the
target effluent BOD) with unit conversions as needed. The NH3-N removal rate is the
ww flow rate times (the influent TKN minus the target effluent NH3-N). Again, unit
conversions are needed. The rate of oxygen requirement in lb/hr or kg/hr is
calculated as the BOD removal rate times the mass of O2 needed per mass of BOD
removed plus the NH3-N removal rate times the mass of O2 needed per mass of NH3-N
removed. The SOTE (standard oxygen transfer efficiency) is calculated as the diffuser
depth times the specified % per unit depth for SOTE. The AOTE (actual oxygen
transfer efficiency) is calculated as SOTE(AOTE/SOTE). The Air Requirement is
calculated (in SCMM) as [(oxygen requirement in kg/hr/AOTE)/O2 content in air in
kg/m3]/60. To calculate the Air requirement in SCFM, the oxygen requirement will be
in lbm/hr, and the O2 content in air will be in lbm/SCF.

Calculation of Alkalinity Requirements is illustrated in Figure 16 (S.I. units) and Figure 17 (U.S. units). The equations used for those calculations are as follows:
Alkalinity used for Nitrification = 7.14(NOx) (mg/L as CaCO3) Alk. Conc. needed = Alk. used for Nitrif. + Target Effl. Alk. - Alko (mg/L as CaCO3) Alk. Flow needed = Qo (Alk. Conc. needed)/1000 (kg/day) - S.I. units Alk. Flow needed = Qo (Alk. Conc. needed)*8.34 (lb/day) - U.S. units Sodium Bicarbonate Flow needed = (Alk. Flow needed)(Equiv Wt. of NaHCO3)/(Equiv. Wt. of CaCO3)
Figure 16. Calculation of Alkalinity Requirement – S.I. Version

Figure 17. Calculation of Alkalinity Requirement – U.S. Version
7. Process Design Calculations for Pre-Anoxic Denitrification
Denitrification Background: In order to carry out denitrification of a wastewater flow
(removal of the nitrogen from the wastewater), it is necessary to first nitrify the
wastewater, that is, convert the ammonia nitrogen typically present in the influent
wastewater to nitrate. The nitrification reactions require an aerobic environment and the
denitrification reactions require an anoxic environment (the absence of oxygen). The
anoxic denitrification reactor may be either before the BOD removal/nitrification reactor
(called pre-anoxic denitrification) or after the BOD removal/nitrification reactor (called
post-anoxic denitrification). Only the pre-anoxic option will be discussed here. A flow
diagram for an MBR process with pre-anoxic denitrification is shown in Figure 18
below.
In a pre-anoxic denitrification process, the BOD in the influent wastewater is used as the
carbon source for denitrification. In this process, however the influent wastewater
entering the pre-anoxic reactor still has ammonia nitrogen present rather than the nitrate
nitrogen needed for denitrification. A recycle flow from the aeration tank (identified as
Internal Recycle in Figure 18) is used to send nitrate nitrogen to the denitrification
reactor.

Figure 18. Flow Diagram for MBR Process with Pre-Anoxic Denitrification
Process Design for Pre-Anoxic Denitrification: These process design calculations
will be for pre-anoxic denitrification basins to go with the BOD removal/nitrification
aeration tanks that were sized in the previous section. The wastewater
parameters/characteristics and biological kinetic coefficients used above will also be
used here. Additional user inputs needed for process design of the pre-anoxic basins
are shown in Figure 19. The values in Figure 19 are for calculations in S.I. units. The3
U.S. version would have the freeboard specified as 1.5 ft, the liquid depth in the tank
specified as 15 ft, and the mixing energy for the anoxic reactor would be 0.38 hp/103 ft3.
As noted at the bottom of Figure 19, a preliminary estimate for the anoxic detention
time is needed for use in a later iterative calculation to zero in on its value.
Results of the first set of process design calculations are shown in Figure 20. The
items calculated are the active biomass concentration, Xb, the internal recycle ratio, IR,
the recycle flow rate to the anoxic tank, the NOx rate to the anoxic tank, the anoxic tank
volume based on the estimated detention time, and the F/M ratio. The equations used
for these calculations are as follows:
active biomass conc: Xb = [ Q(SRT)/V ][ Y(So - S)/(1 + kd(SRT) ]
Internal Recycle Ratio: IR = (NOx/Ne) - 1.0
Recycle Flow rate to anoxic tank: Qanox = IR(Q)
NOx feed rate = (Qanox)(NOXIR) F/M = QSo/XV

Figure 19. Additional User Inputs for Pre-Anoxic Denitrification Process Design S.I. Version
Figure 20. First Set of Calculations for Pre-Anoxic Denitrification Process Design -S.I.

The next set of calculations will determine the value of the SDNR (specific denitrification
rate) and make use of that SDNR value to calculate the required anoxic tank volume
and detention time. The SDNR has units of g NO3-N/day/g biomass. It is the rate at
which nitrate can be denitrified (removed) in grams per day per gram of biomass.
The calculated value for SDNR is based on Figure 8-23 in Metcalf & Eddy, Wastewater
Engineering, Treatment and Reuse, 4th Ed. (Ref #1 at the end of the course). Figure 8-
23 is a set of graphs that give SDNR as a function of F/M and rbCOD/bCOD. Values
were read from these graphs and used to derive a set of equations for SDNR as a
function of F/M and rbCOD/bCOD. Those derived equations are shown in Table 3
below.
Table 3. Equations for SDNR as a Function of F/M and rbCOD/bCOD
Figure 21 shows the results of the calculation of the SDNR and required anoxic tank volume and detention time. Note that an iterative calculation is needed as described in blue at the bottom of Figure 21, to calculate the required Anoxic Tank Volume and Detention Time.

Figure 21. Calc’n of SDNR and required Anoxic Tank Volume and Detention Time
The calculations for the values shown in Figure 21 proceed as follows. rbCODo was a
user specified value and bCODo was calculated as part of the BOD removal/nitrification
process design calculations, so the ratio of those two can readily be calculated. Then If
statements are used to find the two values of rbCOD/bCOD from Table 4, below, that
bracket the calculated value. The VLOOKUP function is then used to populate the
yellow cells in Table 4 with the coefficients for the equations giving SDNR as a function
of F/M at those two values of rbCOD/bCOD. Those coefficients are used to calculate
the SDNR at each of the bracketing values of rbCOD/bCOD and interpolation is used to
calculate the SDNR at 20oC for the rbCOD/bCOD value for this system. The SDNR at
the specified wastewater temperature, Tww, is then calculated as: SDNR at Tww =
(SDNR at 20oC)Tww-20. The value of to be used is the user specified value for the
SDNR temperature correction coefficient.

Table 4. Coefficients for SDNR Equation
The denitrification capacity is calculated as: Vanox(SDNR)(Xb) Note that Xb is the active biomass in the anoxic denitrification tank.
The % Excess Denitrification Capacity is then calculated using the denitrification capacity and the previously calculated NOx rate to the anoxic tank. Excel’s Goal Seek function is then used to set the % Excess Denitrification Capacity equal to the User entered value by changing the anoxic detention time. This results in a minimum required anoxic tank volume and detention time.
Figure 22 shows the remaining calculated values for the pre-anoxic denitrification system. This includes the anoxic tank width and length, the reduced oxygen/air requirement due to the nitrate reduction oxygen credit, the reduced alkalinity requirement due to the alkalinity produced by denitrification, the anoxic tank mixing power needed, and the sludge wasting rate.
The oxygen credit for nitrate reduction is calculated as: 2.86 Qo(NOx - Ne) The alkalinity produced by nitrate reduction is calculated as: 3.57(NOx - Ne)
The anoxic tank mixing power required is calculated as the anoxic tank volume times the user specified value for mixing power needed per unit volume.
The Sludge Wasting Rate is calculated as: Qw = (V*MLSS)/(SRT*TSS_W)

Figure 22. Final Set of Calculations for Pre-Anoxic Denitrification
8. Summary
The MBR (membrane bioreactor) process uses an aeration tank similar to those used in
conventional activated sludge processes, combined with membrane filtration as a
replacement for secondary sedimentation. This combination can produce a very high

quality effluent, typically with a more compact reactor than conventional activated
sludge, but requires a higher rate of aeration than conventional activated sludge in order
to keep the membranes from fouling. The current typical MBR process configuration
uses a membrane module submerged in the aeration tank.
This course includes discussion of process design calculations for the membrane
module used in an MBR system, for an MBR aeration tank designed to provide BOD
removal and nitrification, and for a pre-anoxic tank to go with an MBR BOD removal and
nitrification system.
9. References 1. Metcalf & Eddy, Inc, (Revised by Tchobanoglous, G, Burton, F.L., Stensel, H.D.),
Wastewater Engineering, Treatment and Reuse, 4th Ed., New York, NY, 2003.
2. Judd, Simon, “The MBR Book, Principles and Applications of Membrane Bioreactors
in Water and Wastewater Treatment,” 2nd Ed., Elesvier
3. Zaerpour, Masoud, “Design, Cost & Benefit Analysis of a Membrane Bioreactor,”
M.S. Thesis, Department of Environmental and Geomatic Engineering, Politecnico di
Milan, Academic Year, 2013-2014.
4. Yamamoto, K, Hiasa, H, Talat, M, Matsuo, T., “Direct Solid Liquid Separation Using
Hollow Fiber Membranes in Activated Sludge Aeration Tank,” Water Science and
Technology, 21, 43 – 45.
5. Bengtson, Harlan H., “Membrane Bioreactor Wastewater Treatment Calculations
Spreadsheet.” An online article at www.EngineeringExcelSpreadsheets.com
6. Bengtson, Harlan H., "Spreadsheets for MBR Wastewater Treatment Process Design Calculations," an Amazon Kindle ebook. 7. Bengtson, Harlan H., "Biological Wastewater Treatment Process Design Calculations," available at Amazon as a Kindle ebook or as a paperback.