treatment of textile wastewater by cas, mbr, and mbbr: a
TRANSCRIPT

water
Article
Treatment of Textile Wastewater by CAS, MBR,and MBBR: A Comparative Study from Technical,Economic, and Environmental Perspectives
Xuefei Yang * , Víctor López-Grimau , Mercedes Vilaseca and Martí Crespi
Institute of Textile Research and Industrial Cooperation of Terrassa (INTEXTER), Universitat Politècnicade Catalunya, Carrer de Colom, 15, 08222-Terrasa, Spain; [email protected] (V.L.-G.);[email protected] (M.V.); [email protected] (M.C.)* Correspondence: [email protected]; Tel.: +34-934016677
Received: 17 March 2020; Accepted: 2 May 2020; Published: 5 May 2020�����������������
Abstract: In this study, three different biological methods—a conventional activated sludge (CAS)system, membrane bioreactor (MBR), and moving bed biofilm reactor (MBBR)—were investigatedto treat textile wastewater from a local industry. The results showed that technically, MBR was themost efficient technology, of which the chemical oxygen demand (COD), total suspended solids (TSS),and color removal efficiency were 91%, 99.4%, and 80%, respectively, with a hydraulic retention time(HRT) of 1.3 days. MBBR, on the other hand, had a similar COD removal performance comparedwith CAS (82% vs. 83%) with halved HRT (1 day vs. 2 days) and 73% of TSS removed, while CAShad 66%. Economically, MBBR was a more attractive option for an industrial-scale plant since itsaved 68.4% of the capital expenditures (CAPEX) and had the same operational expenditures (OPEX)as MBR. The MBBR system also had lower environmental impacts compared with CAS and MBRprocesses in the life cycle assessment (LCA) study, since it reduced the consumption of electricityand decolorizing agent with respect to CAS. According to the results of economic and LCA analyses,the water treated by the MBBR system was reused to make new dyeings because water reuse in thetextile industry, which is a large water consumer, could achieve environmental and economic benefits.The quality of new dyed fabrics was within the acceptable limits of the textile industry.
Keywords: membrane bioreactor (MBR); moving bed biofilm reactor (MBBR); conventional activatedsludge system (CAS); textile wastewater; economic feasibility; life cycle assessment (LCA); water reuse
1. Introduction
As one of the largest industries worldwide, the textile industry produces significant amounts ofwastewater. Textile wastewater is generated in different steps during production, such as destarching,mercerization, dyeing, and washing [1], and is known to contain considerable amounts of organiccompounds which provide color to the effluent [2]. In recent years, more strict regulations of effluentdischarge have been applied in the textile industry, in order to reduce dye residues in the effluent beforedischarge into natural streams [3]. Consequently, finding suitable technologies to obtain an effectivetreatment of textile wastewater and to reuse its effluent in new production processes is essential for theindustry’s sustainable development.
One of the most applied biological methods in treating textile wastewater is the conventionalactivated sludge (CAS) process [4,5]. The main objective of the CAS process is to remove organiccompounds [6]. The CAS system has disadvantages such as high hydraulic retention time (HRT),problems with sludge settling, requirement of large space [7], and poor color removal efficiency dueto the low biodegradability of dyes which can only be partially adsorbed on biomass [8–10]. Hence,
Water 2020, 12, 1306; doi:10.3390/w12051306 www.mdpi.com/journal/water

Water 2020, 12, 1306 2 of 17
a tertiary physicochemical method is usually required to give a better treatment performance [3,11],which will increase the cost of the process.
In the past two decades, noticeable progress has been achieved with membrane bioreactor (MBR)technology in industrial wastewater treatment. MBRs separate the sludge by filtration, which differsfrom conventional CAS treatment [12]. MBRs can reduce land space and sludge production witha high biomass concentration in the reactor and are able to treat influent with wide fluctuations ofquality [13–16]. In the case study of MBR applied in textile wastewater treatment in Bangladesh,the performance of the MBR system was better than that of the CAS [17]. Another study reportedthat high removal efficiencies were achieved for chemical oxygen demand (COD), color, and totalsuspended solids (TSS), and the cytotoxicity was significantly reduced by MBR when operating atan HRT of 2 days [18].
Recently, biofilm systems have drawn much attention in treating different types of industrialwastewater due to their several advantages compared with conventional biological treatment, includingsaving space [19,20]. Among them, the moving bed biofilm reactor (MBBR) also has been applied intextile wastewater treatment in the last few years. One of the highlights of MBBR is a smaller volumeof the biological plant or a larger treating capacity in the same reactor volume due to the biofilm beingattached to carriers. Besides the great amount of biomass fixed on carriers, the concentration of biomassin suspension could be higher than that in the CAS process. In a previous study of textile effluenttreatment [21], the pilot-scale plant of MBBR removed 86% of COD and 50% of color, respectively.
In addition to the selection of suitable wastewater treatment from a technical point of view,the increased demand for sustainability of industries has led to the use of life cycle assessment (LCA) asa tool to evaluate the feasibility of technologies [22]. Previous studies have estimated the environmentalimpacts generated by one or combined units of treatment plants for textile wastewater. Nakhate et al.evaluated the environmental footprints of a textile wastewater treatment plant and found out thatconsumption of electricity dominated in most of the environmental burden [23]. Cetinkaya andBilgili compared, in another study, the environmental impacts caused by two desalination systems,and they found that using LCA could assess the environmentally friendlier treatment system for textilewastewater [24].
The aim of the current experimental study was to compare the efficiency of the CAS system,MBR process, and MBBR system in treating real textile wastewater. CAS is the current treatmentprocess of the textile industry which provides the wastewater for our study. In order to improve thetreating efficiency based on the existing CAS treatment, we have chosen MBBR and MBR to comparethe technical, environmental, and economic feasibility. Parameters such as chemical oxygen demand(COD), total suspended solids (TSS), and color were determined to verify that MBR and MBBR havea better efficiency than CAS process. Special attention was paid to color removal, as color is one of themain problems in textile wastewater treatment.
Based on the experimental results in the pilot plant, an economic study and LCA were carried outto compare the economic and environmental feasibility of implementation of these technologies on anindustrial scale and also to select the method of textile wastewater treatment with lower investment,operating costs, and environmental impact related to energy and materials consumption.
Water treated with the most viable method was reused to make new dyes because water reuse in thetextile industry, a large water consumer, is one of the main factors to achieve sustainable development.
2. Methodology
2.1. Pilot Plant Description and Analysis
Three pilot plants (flow diagram shown in Figure 1) were investigated for textile wastewatertreatment in this study. Among them, the plant for the CAS process and the plant for MBR wereoperated in parallel. The pilot plant for MBBR was the same as for the CAS operation, but without therecirculation of sludge. The three treatments were operated with a controlled temperature of 25 ◦C.

Water 2020, 12, 1306 3 of 17
The textile wastewater was obtained from a local textile industry, Acabats del Bages, S.A. (Monistrolde Montserrat, Spain). The characteristics of the wastewater are shown in Table 1, including pH,COD, color, biochemical oxygen demand (BOD), TSS, total nitrogen (TN), and total phosphorous (TP).The duration of experiments for three pilot plants was 96 days.
It should be noted that the pH of wastewater returned to 8.6 in the reactor due to the bufferingeffect caused by the presence of carbonates, usual in textile wastewater. It was unnecessary andunattainable on an industrial scale to adjust the pH. Therefore, in the economic and LCA study, we didnot take into account the amount of acid on the industrial scale.
Water 2020, 12, x FOR PEER REVIEW 3 of 17
the recirculation of sludge. The three treatments were operated with a controlled temperature of 25 °C. The textile wastewater was obtained from a local textile industry, Acabats del Bages, S.A. (Monistrol de Montserrat, Spain). The characteristics of the wastewater are shown in Table 1, including pH, COD, color, biochemical oxygen demand (BOD), TSS, total nitrogen (TN), and total phosphorous (TP). The duration of experiments for three pilot plants was 96 days.
Figure 1. Flow diagrams of (a) conventional activated sludge (CAS); (b) membrane bioreactor (MBR); (c) moving bed biofilm reactor (MBBR).
Figure 1. Flow diagrams of (a) conventional activated sludge (CAS); (b) membrane bioreactor (MBR);(c) moving bed biofilm reactor (MBBR).

Water 2020, 12, 1306 4 of 17
Table 1. Characteristics of textile wastewater.
Parameters Average
pH 8.6 *COD mg/L 2000
Color Pt-co /L 700BOD mg/L 400TSS mg/L 940TN mg/L 54TP mg/L 11
* The pH of the original textile wastewater was initially adjusted from 8.6 to 7.2 before the treatments.COD: chemical oxygen demand; BOD: biochemical oxygen demand; TSS: total suspended solids; TN: totalnitrogen; TP: total phosphorous.
The CAS pilot plant was composed of an aerobic reactor (volume 4 L) connected to a decantationtank. The flow rate in the CAS plant was 2 L/d, and the HRT was set to 2 days as the HRT of the currentCAS plant of the textile industry.
The MBR used in this study was a pilot plant, composed of an aerobic reactor with a submergedultrafiltration membrane. A Polyvinylidene fluoride (PVDF) hollow fiber membrane module ZeeWeed-1(ZW-1) (GE Power & Water, Canada) was used. The membrane characteristics are shown in Table 2.The aerobic reactor had a working volume of 20 L. The influent was pumped directly from a rawwastewater tank, mixed completely with aeration in the reactor. There was an air inlet in the membranemodule to prevent membrane fouling. The period of filtration and backwashing was set at 15 min and30 s for the laboratory-scale reactor according to previous study with the membrane module [25].
Table 2. ZeeWeed-1 (ZW-1) membrane characteristics.
Model ZW-1, submersible module
Configuration Outside/in hollow fiber
Membrane Surface 0.05 m2
Pore Size 0.04 µm
Maximum Transmembrane Pressure (TMP) 0.62 bar
Typical Operating TMP 0.1–0.5 bar
Maximum TMP Backwash 0.55 bar
Operating pH Range 5–9
As mentioned before, the MBBR pilot plant was the same one as in the CAS process. The aerobicreactor was filled with the carriers at a filling ratio of 30% (v/v). The plastic BIOFILL C-2 carriers usedin this study were provided by BIO-FIL (Barcelona, Spain). The main specifications and operationcharacteristics of carriers are shown in Table 3. MBBR operation was inoculated with aerobic sludgecollected from the wastewater treatment plant of the same textile industry. The start-up period lasted3 weeks so biofilm could grow on the carriers.
Table 3. BIOFILL type C-2 carrier characteristics.
Specific Surface 590 m2/m3
Piece Diameter 25 mm
Free Volume 90%
Weight per Piece 2.1 g
Density <1 kg/m3

Water 2020, 12, 1306 5 of 17
In the initial phase, both MBR and MBBR were operated with 2 days of HRT, as was the CASsystem. In order to assess a larger treating capacity and efficiency, the flow rate was increased graduallyduring the experiments. The flow rate in the MBR plant was fixed at 15 L/d and the HRT was 1.3 days,whereas the flow rate in the MBBR plant was 4 L/d and the HRT was fixed at 1 day. In the phase afterthe flow rates were stable, the concentration of dissolved oxygen (DO) in CAS was 2.1 mg/L, similar tothe DO level in the MBBR reactor of 2.2 mg/L. MBR had a lower DO concentration of 1.8 mg/L.
2.2. Economic Analysis
The economic assessment of capital expenditures (CAPEX) and operational expenditures (OPEX)for three treatment schemes is determined in the results section.
2.3. Environmental Impact Analysis
To compare the environmental impact of three treatment processes, life cycle assessment (LCA) wasperformed according to standard ISO 14040 [26]. Simapro was used as the LCA software. The databaseused was Ecoinvent 3.1. ReCiPe, midpoint and endpoint approach, and Hierarchist perspective wereconsidered as the methodology to calculate environmental impact. The selected functional unit was“1 m3 of treated effluent”. The data used in this study were taken from the experimental results.
2.4. Dyeing Tests Using Treated Water
The dyeing tests using treated water were performed with a laboratory Ti-Color dyeing machine(Prato, Italy) (Figure 2a) under the following conditions [27]: 10 g cotton fabric, dye concentration of 3%o.w.f (overweight of fiber), liquor ratio 1:10 (1 g fiber/0.01 L dye bath). Three commercial reactive dyessupplied by Dystar were used in the water reuse study: Yellow Procion HEXL, Crimson Procion HEXL,and Navy Procion HEXL. Besides the amount of dye, 60 g/L NaCl and 26 g/L Na2CO3 were added.The dyeing procedure is shown in Figure 2b. After the dyeing procedure, nine washing steps wereperformed with softened tap water to remove the dye that was not fixed onto the fiber. This washingprocess included nine steps:
• 1st–3rd: Washing bath with softened tap water at 50 ◦C for 10 min;• 4th: Soaping bath with 2 g/LCOTEMOLL TLTR at 95 ◦C for 15 min;• 5th: Rinsing bath with softened tap water at 50 ◦C for 10 min;• 6th: Soaping bath with 2 g/L COTEMOLL TLTR at 95 ◦C for 15 min;• 7th–9th: Rinsing bath with softened tap water at 50 ◦C for 10 min.
Water 2020, 12, x FOR PEER REVIEW 5 of 17
Table 3. BIOFILL type C-2 carrier characteristics.
Specific Surface 590 m2/m3 Piece Diameter 25 mm
Free Volume 90% Weight per Piece 2.1 g
Density <1 kg/m³
2.2. Economic Analysis
The economic assessment of capital expenditures (CAPEX) and operational expenditures (OPEX) for three treatment schemes is determined in the results section.
2.3. Environmental Impact Analysis
To compare the environmental impact of three treatment processes, life cycle assessment (LCA) was performed according to standard ISO 14040 [26]. Simapro was used as the LCA software. The database used was Ecoinvent 3.1. ReCiPe, midpoint and endpoint approach, and Hierarchist perspective were considered as the methodology to calculate environmental impact. The selected functional unit was “1 m3 of treated effluent”. The data used in this study were taken from the experimental results.
2.4. Dyeing Tests Using Treated Water
The dyeing tests using treated water were performed with a laboratory Ti-Color dyeing machine (Prato, Italy) (Figure 2a) under the following conditions [27]: 10 g cotton fabric, dye concentration of 3% o.w.f (overweight of fiber), liquor ratio 1:10 (1 g fiber/0.01 L dye bath). Three commercial reactive dyes supplied by Dystar were used in the water reuse study: Yellow Procion HEXL, Crimson Procion HEXL, and Navy Procion HEXL. Besides the amount of dye, 60 g/L NaCl and 26 g/L Na2CO3 were added. The dyeing procedure is shown in Figure 2b. After the dyeing procedure, nine washing steps were performed with softened tap water to remove the dye that was not fixed onto the fiber. This washing process included nine steps:
1st–3rd: Washing bath with softened tap water at 50 °C for 10 min; 4th: Soaping bath with 2 g/LCOTEMOLL TLTR at 95 °C for 15 min; 5th: Rinsing bath with softened tap water at 50 °C for 10 min; 6th: Soaping bath with 2 g/L COTEMOLL TLTR at 95 °C for 15 min; 7th–9th: Rinsing bath with softened tap water at 50 °C for 10 min.
(a) (b)
Figure 2. (a) Ti-Color equipment (b) dyeing procedure. Figure 2. (a) Ti-Color equipment (b) dyeing procedure.

Water 2020, 12, 1306 6 of 17
2.5. Analytical Methods
During this study, the control of the three pilot plants was carried out with analyses bycharacterizing the water at the entrance, in the bioreactor, and at the exit to determine the workingefficiency. COD, TSS, TN, TP, color, pH, conductivity, and turbidity were determined following theStandard Methods 23rd edition [20].
The quality of dyed fabrics with reused water was determined according to Standard UNE-EN ISO105-J03 by color differences with respect to reference dyeings performed with softened tap water [28].Total color differences (DECMC(2:1)) were calculated from lightness (DL*), chroma (DC*), and Hue (DH*)using the following equation:
DECMC(2:1) =[(DL·SL)
2 +(DC∗ab/SC
)2+(DH∗ab/SH
)2]1/2(1)
where SL, SC, and SH were calculated from the chromatic coordinates corresponding to referencedyeings (LR, CR, and hR) as follows:
SL = 0.040975LR/(1 + 0.01765LR) (2)
If LR < 16, SL= 0.511 (3)
SC = [0.0638CR/(1 + 0.0131CR)] + 0.638 (4)
SH = SC(Tf + 1 − f) (5)
f = {(CR)4/[(CR)4 + 1900]}1/2 (6)
T = 0.36 + |0.4·cos(35 + hR)| if hR ≥ 345◦ or hR ≤ 164◦ (7)
T = 0.56 + |0.2·cos(168 + hR)| if 164◦ < hR < 345◦ (8)
A spectrophotometer, MINOLTA CM 3600d (Osaka, Japan), was used for these measurementsaccording to Standard illuminant D65/10◦.
Generally, the color difference of one unit (DECMC (2:1) ≤ 1) is the acceptable limit in thetextile industry.
3. Results and Discussion
3.1. Treating Efficiency
During the experiments, the average biomass concentrations in the reactor of CAS, MBR, and MBBRwere 3 g/L, 2.3 g/L, and 3.5 g/L, respectively. As the textile wastewater had rather low contents of TN(54 mg/L) and TP (11 mg/L), over 90% removal of TN and TP was obtained after MBR and MBBRtreatment, whereas CAS eliminated 88% of TN and TP.
As mentioned in Section 2.1, the initial HRT for CAS, MBR, and MBBR was 2 days, whereas theinitial organic loading rate (OLR) was the same for the three treatments at 1 kg COD/ (m3 d). The HRTof MBR and MBBR was gradually reduced to evaluate if the treating efficiency could be maintainedwhile the treating capacity was increased.
Color in the influent varied between 400 and 1500 mg Pt-co/L. The removal rates of color obtainedby the three treatment systems are shown in Figure 3a. The average color removal efficiency was 55% inthe CAS process and was 80% in the MBR system, while in the MBBR system the color removal achieved61%. MBR was significantly more efficient at removing color than the CAS process under the sameoperating conditions. MBBR had a higher color-removing performance than the CAS process, whilethe HRT (2 days) of CAS was twice the HRT (1 day) of MBBR. In order to meet discharge standards,decolorizing agent was added to the effluent from the CAS and MBBR processes. After adding200 ppm of decolorizing agent, the color content reached the discharge standard in CAS, while the

Water 2020, 12, 1306 7 of 17
amount of decolorizing agent needed for MBBR was 100 ppm. In conventional biological treatment,the addition of various adsorbents and chemicals into the activated sludge system to improve the colorremoval efficiency is a common method, which will increase the cost and will generate secondarycontaminates [29,30].
Water 2020, 12, x FOR PEER REVIEW 7 of 17
COD of the influent remained at about 2000 mg/L. The average COD effluent of the CAS process was 350 mg/L, and the average efficiency of COD removal was 83%. The average COD value of the effluent from MBR was 170 mg/L, and the COD removal rate was 91%. The removal rates of COD in the three pilot plants are illustrated in Figure 3b. Furthermore, the CAS process worked with an HRT of 2 days, while the HRT of MBR worked only within 1.3 days. This demonstrated the efficiency and stability of the biological process of MBR. Similar results of COD removal in the MBR system and CAS process were also observed previously [17,31], indicating that after MBR treatment, a better COD removal efficiency can be obtained from the conventional AS process. The average COD value of the effluent from MBBR was 179 mg/L, and the COD removal rate was 82%. Although the removal rates of COD of the CAS and MBBR processes were similar, HRT of MBBR was half of the HRT of the CAS process. The average OLRs for the CAS system, MBR, and MBBR were 1 kg COD/ (m³ d), 1.5 kg COD/ (m³ d), and 2 kg COD/ (m³ d), respectively.
The TSS removal rates in the CAS system, MBR, and MBBRs are shown in Figure 3c. During the parallel experiments of CAS and MBR systems, the average value of TSS in the influent was 940 mg/L. The average TSS removal efficiency in the CAS process was 66%, while in MBR system the TSS removal achieved 99.6%. From the perspective of TSS removal, membrane filtration is an attractive method because of the total retention of suspended matter and significant retention of colloidal matter [32]. The results showed the advantage of the MBR process in TSS reduction with respect to the CAS process. The MBR process reached high TSS elimination without the necessity to add a tertiary treatment. MBBR achieved an average TSS removal rate of 78%, which was better than that of the CAS system.
(a) (b)
(c)
Figure 3. Removal rates of color (a), COD (b), and TSS (c) in activated sludge system, MBR, and MBBR
3.2. Economic Study of the Three Treatment Processes
0
20
40
60
80
100
3 21 40 47 53 60 70 75 90 96
colo
r rem
oval
rate
(%
)
time (days)
Color
0
20
40
60
80
100
3 21 40 47 53 60 70 75 90 96
COD
rem
oval
rate
(%)
time (days)
COD
0
20
40
60
80
100
3 21 40 47 53 60 70 75 90 96
TSS
rem
oval
rate
(%)
time (days)
TSS
AS MBR MBBR
Figure 3. Removal rates of color (a), COD (b), and TSS (c) in activated sludge system, MBR, and MBBR.
COD of the influent remained at about 2000 mg/L. The average COD effluent of the CAS processwas 350 mg/L, and the average efficiency of COD removal was 83%. The average COD value of theeffluent from MBR was 170 mg/L, and the COD removal rate was 91%. The removal rates of CODin the three pilot plants are illustrated in Figure 3b. Furthermore, the CAS process worked with anHRT of 2 days, while the HRT of MBR worked only within 1.3 days. This demonstrated the efficiencyand stability of the biological process of MBR. Similar results of COD removal in the MBR system andCAS process were also observed previously [17,31], indicating that after MBR treatment, a better CODremoval efficiency can be obtained from the conventional AS process. The average COD value of theeffluent from MBBR was 179 mg/L, and the COD removal rate was 82%. Although the removal rates ofCOD of the CAS and MBBR processes were similar, HRT of MBBR was half of the HRT of the CASprocess. The average OLRs for the CAS system, MBR, and MBBR were 1 kg COD/ (m3 d), 1.5 kg COD/
(m3 d), and 2 kg COD/ (m3 d), respectively.The TSS removal rates in the CAS system, MBR, and MBBRs are shown in Figure 3c. During the
parallel experiments of CAS and MBR systems, the average value of TSS in the influent was 940 mg/L.The average TSS removal efficiency in the CAS process was 66%, while in MBR system the TSS removalachieved 99.6%. From the perspective of TSS removal, membrane filtration is an attractive methodbecause of the total retention of suspended matter and significant retention of colloidal matter [32].The results showed the advantage of the MBR process in TSS reduction with respect to the CAS process.
Water 2020, 12, 1306 8 of 17
The MBR process reached high TSS elimination without the necessity to add a tertiary treatment.MBBR achieved an average TSS removal rate of 78%, which was better than that of the CAS system.
3.2. Economic Study of the Three Treatment Processes
The local textile industry produced 222,700 m3 of wastewater per year with 11 months underoperation. The wastewater treatment method of the industry is conventional activated sludge (CAS).The daily treatment flow is 920 m3/d. The current HRT of the CAS plant is 2 days.
3.2.1. Capital Expenditures (CAPEX)
The CAPEX of the CAS system was considered to be the reference (0) in the economic study.The CAPEX of MBR and MBBR treatments were added directly to the CAPEX of the CAS system.
For the MBR full-scale system, the membrane and the installation of the membrane (366,153 €)have been considered for the CAPEX estimation according to the CAPEX calculation from a study ofthe cost of a small MBR (100–2500 m3/d flow capacity) [33].
For the MBBR full-scale system, the cost of carrier medias (115,500 €) has been considered for theCAPEX estimation according to the suppliers’ information.
3.2.2. Operational Expenditures (OPEX)
Consumption of energy, decolorizing agent data, and environmental tax of sludge productionand wastewater discharge were gathered in order to estimate operational expenditures (OPEX) of thethree treatment plants.
Additionally, the cost of membrane replacement represented 2.4% of the energy cost [34], and theaverage lifetime of the UF membrane was taken as 10 years. The maintenance and repair costsrepresented 19.5% of the energy cost [34]. MBR could withstand higher concentrations of biomasswith much longer sludge retention time (SRT) than in conventional AS, which allows much less sludgeproduction in the MBR system and consequently, lowers the frequency of sludge disposal [13,35].During the experimental study of MBR, sludge concentration did not exceed the withstanding limitof the membrane. The sludge generation of MBR was estimated according the increasing rate of thebiomass concentration and the concentration limit for the membrane.
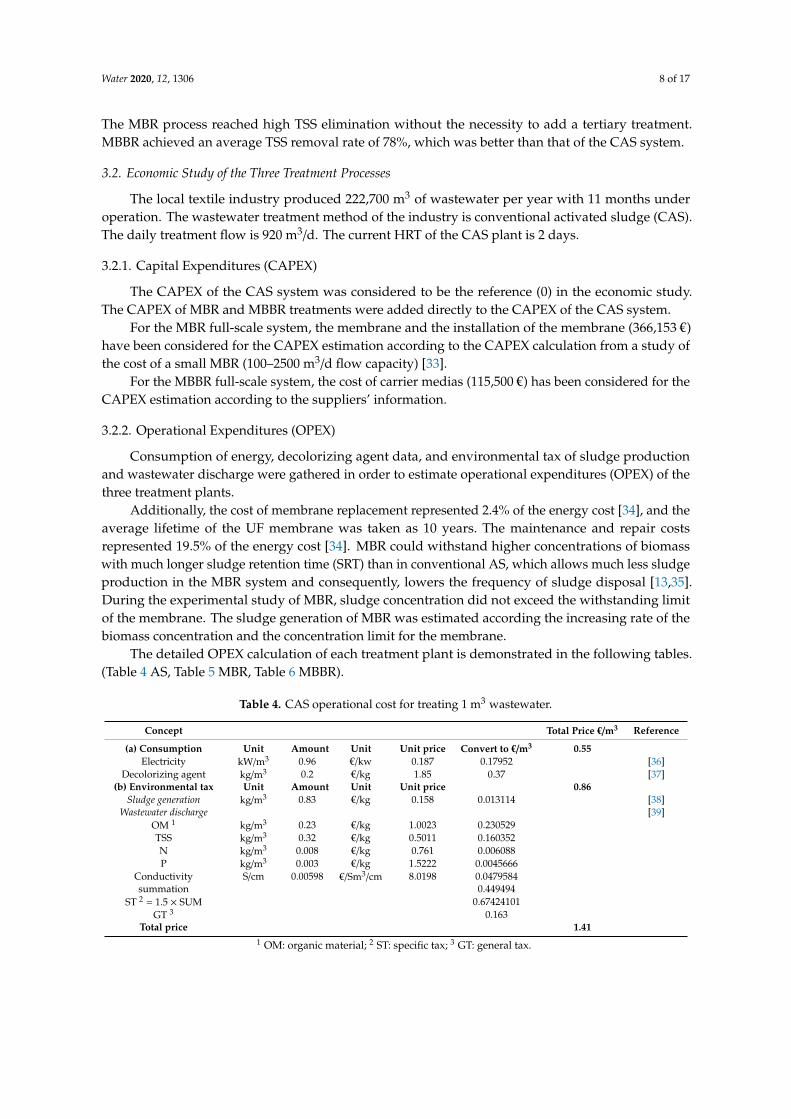
The detailed OPEX calculation of each treatment plant is demonstrated in the following tables.(Table 4 AS, Table 5 MBR, Table 6 MBBR).
Table 4. CAS operational cost for treating 1 m3 wastewater.
Concept Total Price €/m3 Reference
(a) Consumption Unit Amount Unit Unit price Convert to €/m3 0.55Electricity kW/m3 0.96 €/kw 0.187 0.17952 [36]
Decolorizing agent kg/m3 0.2 €/kg 1.85 0.37 [37](b) Environmental tax Unit Amount Unit Unit price 0.86
Sludge generation kg/m3 0.83 €/kg 0.158 0.013114 [38]Wastewater discharge [39]
OM 1 kg/m3 0.23 €/kg 1.0023 0.230529TSS kg/m3 0.32 €/kg 0.5011 0.160352N kg/m3 0.008 €/kg 0.761 0.006088P kg/m3 0.003 €/kg 1.5222 0.0045666
Conductivity S/cm 0.00598 €/Sm3/cm 8.0198 0.0479584summation 0.449494
ST 2 = 1.5 × SUM 0.67424101GT 3 0.163
Total price 1.411 OM: organic material; 2 ST: specific tax; 3 GT: general tax.

Water 2020, 12, 1306 9 of 17
Table 5. MBR operational cost for treating 1 m3 wastewater.
Concept Total Price €/m3 Reference
(a) Consumption Unit Amount Unit Unit price Convert to €/m3 0.51Electricity kW/m3 2.72 €/kw 0.187 0.50864 [36]
Decolorizing agent kg/m3 0 €/kg 1.85 0 [37](b) Environmental tax Unit Amount Unit Unit price 0.43
Sludge generation kg/m3 0.023 €/kg 0.0158 0.0003634 [38]Wastewater discharge [39]
OM kg/m3 0.11 €/kg 1.0023 0.110253TSS kg/m3 0.04 €/kg 0.5011 0.020044N kg/m3 0.004 €/kg 0.761 0.003044P kg/m3 0.002 €/kg 1.5222 0.0030444
Conductivity S/cm 0.00533 €/Sm3/cm 8.0198 0.04274553summation 0.17913093
ST = 1.5 × SUM 0.2686964GT 0.163
(c) Membranereplacement 0.01 [34]
(d) Maintenance andrepair 0.10 [34]
Total price 1.05
Table 6. MBBR operational cost for treating 1 m3 wastewater.
Concept Total Price €/m3 Reference
(a) Consumption Unit Amount Unit Unit price Convert to€/m3 0.27Electricity kW/m3 0.48 €/kw 0.187 0.08976 [36]
Decolorizing agent kg/m3 0.1 €/kg 1.85 0.185 [37](b) Environmental tax Unit Amount Unit Unit price 0.78
Sludge generation kg/m3 0.29 €/kg 0.158 0.004582 [38]Wastewater discharge [39]
OM kg/m3 0.23 €/kg 1.0023 0.230529TSS kg/m3 0.24 €/kg 0.5011 0.120264N kg/m3 0.009 €/kg 0.761 0.006849P kg/m3 0.002 €/kg 1.5222 0.0030444
Conductivity S/cm 0.00595 €/Sm3/cm 8.0198 0.04771781summation 0.40840421
ST = 1.5 × SUM 0.61260632GT 0.163
Total price 1.05
In terms of the consumption part, MBR had the highest cost (0.51 €/m3) of electricity consumptionbecause it required more electricity to operate and to maintain the membrane filtration. However,AS had the highest cost in the total consumption, with a value of 0.55 €/m3, among the three treatmentsdue to the larger amount of decolorizing agent used. This was not necessary for MBR because MBRachieved the color removal requirement and was used less in MBBR since MBBR had a better colorremoval performance. The reason that MBBR consumed half the electricity of the CAS system is thatthe HRT of MBBR was 1 day while in CAS it was 2 days, which means that MBBR with doubledtreating capacity could save 50% of the electricity expense.
In regard to environmental tax, it can be observed that MBR had the lowest expense (0.43 €/m3)since it had a better performance with organic compounds and TSS. MBBR, with half the HRT andmore efficient treatment behavior, would pay a lower environmental tax (0.78 €/m3) than the CASsystem (0.85 €/m3).
As mentioned in Section 3.3.1, the CAPEX for MBR was 366,153 €, and for MBBR it was 115,500 €,in order to improve the existing AS treatment of the studied textile industry. The only investment ofMBBR in CAPEX is the carriers, and the maintenance of carriers is more convenient and economicalthan maintaining the membrane. Even though the OPEX of MBR and MBBR are at the same value,MBBR had the advantage of low energy consumption and competitive treatment performance.Taken together, the results of CAPEX and OPEX show that MBBR is a more attractive option for thetextile industry economically.

Water 2020, 12, 1306 10 of 17
3.3. LCA Study Results
3.3.1. Inventory Results
The inventory results of each treating process are shown in Table 7. All data are related to thefunctional unit (1 m3 treated water). The impact of sludge generation was not taken into account inSimapro software; therefore, the impact of sludge generation could not be quantified in the LCA study.Nevertheless, sludge generated in the three treatments was quantified and is presented in Table 7.
Table 7. Inventory analysis of three processes.
Amount Unit/FU Ecoinvent Unit ProcessProcesses
Included in LCAAS MBR MBBR
Input Output Input Output Input Output
COD 2 0.35 2 0.17 2 0.34 KgTSS 0.94 0.32 0.94 0.04 0.94 0.24 KgN 0.055 0.008 0.055 0.004 0.055 0.009 KgP 0.008 0.003 0.008 0.002 0.008 0.002 Kg
Color 700 315 700 140 700 267 g Pt-coConductivity 6.46 5.98 6.46 5.33 6.46 5.95 mS/cmWastewater 1 0.959 1 1 1 0.959 m3
Sludge 0.83 0.023 0.29 Kg
decolorizing agent 0.2 0 0.1 KgDTPA,
diethylenetriaminepentaaceticacid, at plant/RER U
Electricity 0.96 2.72 0.48 Kwh Electricity, medium voltage,production ES, at grid/ES U
3.3.2. Environmental Impact Assessment
The environmental impact of each treatment process according to the LCA results using endpointapproach is discussed, and then the three studied treatments are compared with respect to their totalenvironmental impact.
CAS System
The results of the environmental impact assessment are presented in points (mPt) so that differentcategories could be compared. Firstly, the impact of the CAS treatment process was evaluated. As shownin Table 8, the CAS process had the lowest impact on Ecosystems, while it had a major impact onResources, followed by Human health.
Table 8. Environmental impact of CAS.
Human Health (mPt) Ecosystems (mPt) Resources (mPt)
Electricity (kWh/m3) 22.8 1.9 31.8Decolorizing agent
(kg/m3) 34.4 3.4 81.2
TOTAL 57.2 5.3 113.0
The decolorizing agent represents 60%–70% of the environmental impact of the CAS system,having the most significant impact for all the categories.
The impact of the decolorizing agent on the detailed categories with relation to Human health,Ecosystem, and Resources is shown in Figure 4. The decolorizing agent had an impact on Humanhealth mainly because of the effect on Climate change human health as well as Particulate matterformation categories, while Terrestrial ecotoxicity and Climate change ecosystems categories had majorimpacts on Ecosystems. Apart from that, the Fossil depletion category had the major responsibility forimpacting Resources, while the Metal depletion category had almost no impact.

Water 2020, 12, 1306 11 of 17
Water 2020, 12, x FOR PEER REVIEW 11 of 17
The results of the environmental impact assessment are presented in points (mPt) so that different categories could be compared. Firstly, the impact of the CAS treatment process was evaluated. As shown in Table 8, the CAS process had the lowest impact on Ecosystems, while it had a major impact on Resources, followed by Human health.
Table 8. Environmental impact of CAS.
Human Health (mPt) Ecosystems (mPt) Resources (mPt) Electricity (kWh/m3) 22.8 1.9 31.8
Decolorizing agent (kg/m3) 34.4 3.4 81.2 TOTAL 57.2 5.3 113.0
The decolorizing agent represents 60%–70% of the environmental impact of the CAS system, having the most significant impact for all the categories.
The impact of the decolorizing agent on the detailed categories with relation to Human health, Ecosystem, and Resources is shown in Figure 4. The decolorizing agent had an impact on Human health mainly because of the effect on Climate change human health as well as Particulate matter formation categories, while Terrestrial ecotoxicity and Climate change ecosystems categories had major impacts on Ecosystems. Apart from that, the Fossil depletion category had the major responsibility for impacting Resources, while the Metal depletion category had almost no impact.
1.27
1.27
1.28
1.28
1.29
1.29
1.30
1.30
1.31
1.31
Human Health
DA
LY (
×10
-5)
Ionising radiation
Particulate matter formation
Photochemical oxidantformationHuman toxicity
Ozone depletion
Climate change Human Health
7.20
7.22
7.24
7.26
7.28
7.30
7.32
7.34
Ecosystem
spec
ies.
yr (×
10-9
)
Terrestrial ecotoxicity
Natural land transformation
Urban land occupation
Agricultural land occupation
Marine ecotoxicity
Freshwater ecotoxicity
Freshwater eutrophication
Terrestrial acidification
Climate change EcosystemsWater 2020, 12, x FOR PEER REVIEW 12 of 17
Figure 4. Analysis of the effect of the decolorizing agent on the impacted CAS categories.
MBR Treatment
In the MBR treatment, as can be seen in Table 9, there was no consumption of decolorizing agent since the system removed most of the color in the effluents. The consumption of electricity during treatment represents the total environmental impact. The results show that the impact on Ecosystem was much lower, while the major impacts were on Resources and Human Health.
Table 9. Environmental impact of MBR.
Human Health (mPt) Ecosystems (mPt) Resources (mPt) Electricity (kWh/m3) 64.6 5.4 90.1
Decolorizing agent(kg/m3) 0 0 0 TOTAL 64.6 5.4 90.1
Figure 5 shows the impact of electricity consumption for MBR treatment on the detailed categories related to Human Health, Ecosystem, and Resources. Climate change human health and Particulate matter formation categories were the main factors that had an impact on Human health of electricity consumption. In the meantime, the impact on Ecosystems mainly was due to Agricultural land occupation and Climate change ecosystem, while Terrestrial ecotoxicity, Natural land transformation, Urban land occupation, and Terrestrial acidification had minor impacts on the Ecosystem category. Furthermore, the major impact on Resources came from Fossil depletion category, while the Metal depletion category had almost no impact.
0.00
1.00
2.00
3.00
4.00
5.00
6.00
7.00
Resources
$
Fossil depletionMetal depletion
0.00
0.50
1.00
1.50
2.00
2.50
3.00
3.50
Human Health
DA
LY (×
10-6
)
Ionising radiation
Particulate matter formation
Photochemical oxidantformationHuman toxicity
Ozone depletion
Climate change HumanHealth
Figure 4. Analysis of the effect of the decolorizing agent on the impacted CAS categories.
MBR Treatment
In the MBR treatment, as can be seen in Table 9, there was no consumption of decolorizing agentsince the system removed most of the color in the effluents. The consumption of electricity duringtreatment represents the total environmental impact. The results show that the impact on Ecosystemwas much lower, while the major impacts were on Resources and Human Health.
Figure 5 shows the impact of electricity consumption for MBR treatment on the detailed categoriesrelated to Human Health, Ecosystem, and Resources. Climate change human health and Particulatematter formation categories were the main factors that had an impact on Human health of electricityconsumption. In the meantime, the impact on Ecosystems mainly was due to Agricultural landoccupation and Climate change ecosystem, while Terrestrial ecotoxicity, Natural land transformation,Urban land occupation, and Terrestrial acidification had minor impacts on the Ecosystem category.Furthermore, the major impact on Resources came from Fossil depletion category, while the Metaldepletion category had almost no impact.

Water 2020, 12, 1306 12 of 17
Table 9. Environmental impact of MBR.
Human Health (mPt) Ecosystems (mPt) Resources (mPt)
Electricity (kWh/m3) 64.6 5.4 90.1Decolorizing agent(kg/m3) 0 0 0
TOTAL 64.6 5.4 90.1
Water 2020, 12, x FOR PEER REVIEW 12 of 17
Figure 4. Analysis of the effect of the decolorizing agent on the impacted CAS categories.
MBR Treatment
In the MBR treatment, as can be seen in Table 9, there was no consumption of decolorizing agent since the system removed most of the color in the effluents. The consumption of electricity during treatment represents the total environmental impact. The results show that the impact on Ecosystem was much lower, while the major impacts were on Resources and Human Health.
Table 9. Environmental impact of MBR.
Human Health (mPt) Ecosystems (mPt) Resources (mPt) Electricity (kWh/m3) 64.6 5.4 90.1
Decolorizing agent(kg/m3) 0 0 0 TOTAL 64.6 5.4 90.1
Figure 5 shows the impact of electricity consumption for MBR treatment on the detailed categories related to Human Health, Ecosystem, and Resources. Climate change human health and Particulate matter formation categories were the main factors that had an impact on Human health of electricity consumption. In the meantime, the impact on Ecosystems mainly was due to Agricultural land occupation and Climate change ecosystem, while Terrestrial ecotoxicity, Natural land transformation, Urban land occupation, and Terrestrial acidification had minor impacts on the Ecosystem category. Furthermore, the major impact on Resources came from Fossil depletion category, while the Metal depletion category had almost no impact.
0.00
1.00
2.00
3.00
4.00
5.00
6.00
7.00
Resources
$
Fossil depletionMetal depletion
0.00
0.50
1.00
1.50
2.00
2.50
3.00
3.50
Human Health
DA
LY (×
10-6
)
Ionising radiation
Particulate matter formation
Photochemical oxidantformationHuman toxicity
Ozone depletion
Climate change HumanHealthWater 2020, 12, x FOR PEER REVIEW 13 of 17
Figure 5. Analysis of the effect of electricity consumption on the impacted MBR categories.
MBBR Treatment
As shown in Table 10, MBBR treatment, like AS and MBR treatments, also had a major impact on Resources, while the impact on Ecosystem was the lowest. The environmental impact of the consumption of decolorizing agent was mainly presented in Resources.
Table 10. Environmental impact of MBBR.
Human Health (mPt) Ecosystems (mPt) Resources (mPt) Electricity (kWh/m3) 11.4 0.9 15.9
Decolorizing agent(kg/m3) 17.2 1.7 40.6 TOTAL 28.6 2.6 56.5
Comparison of the Three Treatments
The environmental impacts of three treatments are compared in Table 11 to evaluate which treatment had lower environmental impacts.
As shown, the MBBR system had the lowest impact on all three categories. Although decolorizing agent was used in the final step of AS and MBBR to obtain a well-clarified effluent and due to the filtration, decolorizing agent was not needed for MBR, the consumption of electricity had more significant environmental impacts on Human Health and Ecosystems.
1.09
1.10
1.11
1.12
1.13
1.14
1.15
1.16
Ecosystem
spec
ies.
yr (
×10
-8)
Terrestrial ecotoxicity
Natural land transformation
Urban land occupation
Agricultural land occupation
Marine ecotoxicity
Freshwater ecotoxicity
Freshwater eutrophication
Terrestrial acidification
Climate change Ecosystems
0.00
1.00
2.00
3.00
4.00
5.00
6.00
7.00
Resources
$
Fossil depletion
Metal depletion
Figure 5. Analysis of the effect of electricity consumption on the impacted MBR categories.
MBBR Treatment
As shown in Table 10, MBBR treatment, like AS and MBR treatments, also had a major impacton Resources, while the impact on Ecosystem was the lowest. The environmental impact of theconsumption of decolorizing agent was mainly presented in Resources.

Water 2020, 12, 1306 13 of 17
Table 10. Environmental impact of MBBR.
Human Health (mPt) Ecosystems (mPt) Resources (mPt)
Electricity (kWh/m3) 11.4 0.9 15.9Decolorizing agent(kg/m3) 17.2 1.7 40.6
TOTAL 28.6 2.6 56.5
Comparison of the Three Treatments
The environmental impacts of three treatments are compared in Table 11 to evaluate whichtreatment had lower environmental impacts.
Table 11. Environmental impacts of the three processes.
Human Health (mPt) Ecosystems (mPt) Resources (mPt)
AS 57.2 5.3 113.0MBR 64.6 5.4 90.1
MBBR 28.6 2.6 56.5
As shown, the MBBR system had the lowest impact on all three categories. Although decolorizingagent was used in the final step of AS and MBBR to obtain a well-clarified effluent and due to thefiltration, decolorizing agent was not needed for MBR, the consumption of electricity had moresignificant environmental impacts on Human Health and Ecosystems.
In addition to the endpoint methods, which are helpful for decision-making because resultscan be compared in points, midpoint analysis was also performed to help identify issues of specificenvironmental concerns [40]. The results of midpoint assessment are shown in Table 12. It can beobserved clearly that MBBR was environmentally advantageous since most of its impacts were thelowest in most of the categories, except in Climate change Human Health, Marine eutrophication, andFreshwater ecotoxicity, which were the three impact categories associated with the use of decolorizingagent. In MBBR operation, impacts on several categories could be reduced more than 70% morethan those generated in MBR, and these categories were Particulate matter formation, Terrestrialacidification, Agricultural land occupation, Urban land occupation, Natural land transformation, andUrban land occupation. The CAS system had high environmental impacts, especially on Climatechange Human Health, Marine eutrophication, and Freshwater ecotoxicity, due to the amount ofdecolorizing agent used in the treatment.
Table 12. Comparison of three processes: midpoint analysis.
Impact Category Unit AS MBR MBBR
Climate change Human Health kg CO2-eq 1.29 0.19 0.65Ozone depletion kg CFC-11 eq 1.39 × 10⁻⁷ 7.03 × 10⁻⁸ 6.94 × 10⁻⁸
Human toxicity kg 1.4-DB eq 0.12 6.10 × 10⁻² 6.06 × 10⁻²
Photochemical oxidant formation kg NMVOC 3.89 × 10⁻³ 5.58 × 10⁻³ 1.95 × 10⁻³
Particulate matter formation kg PM10 eq 1.95 × 10⁻³ 3.41 × 10⁻³ 9.73 × 10⁻⁴
Ionising radiation kg U235 eq 0.16 0.26 0.08Terrestrial acidification kg SO2-eq 6.46 × 10⁻³ 1.17 × 10⁻² 3.23 × 10⁻³
Freshwater eutrophication kg P-eq 7.84 × 10⁻⁵ 6.77 × 10⁻⁵ 3.92 × 10⁻⁵
Marine eutrophication kg N-eq 2.24 × 10⁻³ 4.27 × 10⁻⁴ 1.12 × 10⁻³
Terrestrial ecotoxicity kg 1.4-DB eq 2.96 × 10⁻⁴ 1.69 × 10⁻⁴ 1.48 × 10⁻⁴
Freshwater ecotoxicity kg 1.4-DB eq 7.40 × 10⁻³ 2.48 × 10⁻⁴ 3.70 × 10⁻³
Marine ecotoxicity kg 1.4-DB eq 1.04 × 10⁻³ 5.19 × 10⁻⁴ 5.18 × 10⁻⁴
Agricultural land occupation m2 year 5.51 × 10⁻³ 1.27 × 10⁻² 2.75 × 10⁻³
Urban land occupation m2 year 2.16 × 10⁻³ 4.34 × 10⁻³ 1.08 × 10⁻³
Natural land transformation m2 year 1.25 × 10⁻⁵ 2.67 × 10⁻⁵ 6.27 × 10⁻⁶
Water depletion m3 1.12 × 10⁻² 8.10 × 10⁻³ 5.60 × 10⁻³
Metal depletion kg 1 Fe eq 2.02 × 10⁻³ 2.08 × 10⁻³ 1.01 × 10⁻³
Fossil depletion kg oil eq 5.17 × 10⁻⁷ 4.14 × 10⁻⁷ 2.59 × 10⁻⁷

Water 2020, 12, 1306 14 of 17
3.4. Reuse of the Treated Effluent
Taking into account the previous results of economic and LCA analyses, MBBR treatment wasselected as the most feasible method to be applied at industrial scale. At this point, the possibility ofreusing the treated wastewater in a new dyeing processes was determined. MBBR was selected tocheck if the removal results of COD, SST, and color were sufficient to make new dyes without theirquality being affected by the presence of organic matter residues, suspended solids, and residual dyes.
One hundred percent of the treated water from the MBBR process was reused for a new dyeingprocess. Three reactive dyes—Yellow Procion HEXL, Crimson Procion HEXL, and Navy ProcionHEXL—were used in the water reuse study. The color differences with respect to a reference dyeingare shown in Table 13. DECMC(2:1) values of all three dyes were lower than 1, which is the acceptablelimit for the textile industry. The results imply the feasibility of MBBR treatment to obtain a waterreuse proportion up to 100% in the new dye baths. It should be considered that in practical textileproduction, there is 30% water loss due to evaporation or water fixed into the textile products. Therefore,the wastewater generated accounts for 70% of freshwater consumed by the industry. Although allthe treated water was reused, it is not equal to 100% of the total water consumed by the industry.If we wanted to reuse all treated water, this would be 70% of the water consumed.
Table 13. Color differences between fabrics dyed with the treated effluent and a reference dyeing.
Reactive Dyes 100% Effluent ReusedDECMC(2:1)
Yellow Procion HEXL 0.55 ± 0.08Crimson Procion HEXL 0.76 ± 0.07
Navy Procion HEXL 0.42 ± 0.01
A comparison of the cotton fabrics dyed with the three dyes studied is shown in Figure 6.
Water 2020, 12, x FOR PEER REVIEW 15 of 17
Therefore, the wastewater generated accounts for 70% of freshwater consumed by the industry. Although all the treated water was reused, it is not equal to 100% of the total water consumed by the industry. If we wanted to reuse all treated water, this would be 70% of the water consumed.
A comparison of the cotton fabrics dyed with the three dyes studied is shown in Figure 6.
Table 13. Color differences between fabrics dyed with the treated effluent and a reference dyeing.
Reactive Dyes 100% Effluent Reused DECMC(2:1)
Yellow Procion HEXL 0.55 ± 0.08 Crimson Procion HEXL 0.76 ± 0.07
Navy Procion HEXL 0.42 ± 0.01
Figure 6. Comparison of cotton dyeings made with the three dyes studied.
4. Conclusions
After carrying out the comparative study in three pilot plants with CAS, MBR, and MBBR technologies, MBBR showed that it was a better alternative than CAS, with a comparable COD removal rate to CAS and a more efficient color reduction, while the treating capacity was doubled. Although the MBR was the most efficient technology for organic compounds and color removal, the economic and LCA study suggested that MBBR is a more attractive option for textile wastewater treatment at an industrial-scale plant. MBBR had the same OPEX as MBR, both lower than that of the CAS system, but MBBR had lower investment costs and lower CAPEX, which was 68% less than the CAPEX of MBR. MBBR also largely reduced the environmental impacts on different categories with respect to CAS and MBR processes in general. MBBR reduces the environmental impact as compared with the AS, since it reduced the consumption of electricity and decolorizing agent with respect to AS. MBR had a higher electrical consumption but avoided the consumption of decolorizing agent.
Finally, new dyes made with treated water from MBBR met the quality standard for the textile industry (DECMC(2:1) ≤ 1). The presence of organic matter residues, suspended solids, and residual dyes in the effluent of MBBR did not affect the dyeing quality. Reuse of wastewater up to 100% is very promising in the textile industry as it is a considerable water-consuming industry worldwide.
Author Contributions: Investigation, X.Y.; Methodology, X.Y.; Project administration, V.L.-G. and M.C.; Resources, X.Y.; Supervision, V.L.-G., M.V. and M.C.; Writing—original draft, X.Y.; Writing—review & editing, V.L.-G.
Funding: This research was co-funded by ACCIÓ (Generalitat de Catalunya) within the REGIREU Project (COMRDI16-1-0062).
Acknowledgments: BIO-FIL (Barcelona, Spain) is gratefully acknowledged for providing plastic carriers BIOFILL C-2 in the MBBR study. Authors express their gratitude to Acabats del Bages, S.A. (Monistrol de Montserrat, Spain) for providing textile wastewater during the operation.
Conflicts of Interest: The authors declare no conflicts of interest.
Figure 6. Comparison of cotton dyeings made with the three dyes studied.
4. Conclusions
After carrying out the comparative study in three pilot plants with CAS, MBR, and MBBRtechnologies, MBBR showed that it was a better alternative than CAS, with a comparable COD removalrate to CAS and a more efficient color reduction, while the treating capacity was doubled. Althoughthe MBR was the most efficient technology for organic compounds and color removal, the economicand LCA study suggested that MBBR is a more attractive option for textile wastewater treatment atan industrial-scale plant. MBBR had the same OPEX as MBR, both lower than that of the CAS system,but MBBR had lower investment costs and lower CAPEX, which was 68% less than the CAPEX of MBR.MBBR also largely reduced the environmental impacts on different categories with respect to CASand MBR processes in general. MBBR reduces the environmental impact as compared with the AS,

Water 2020, 12, 1306 15 of 17
since it reduced the consumption of electricity and decolorizing agent with respect to AS. MBR hada higher electrical consumption but avoided the consumption of decolorizing agent.
Finally, new dyes made with treated water from MBBR met the quality standard for the textileindustry (DECMC(2:1) ≤ 1). The presence of organic matter residues, suspended solids, and residualdyes in the effluent of MBBR did not affect the dyeing quality. Reuse of wastewater up to 100% is verypromising in the textile industry as it is a considerable water-consuming industry worldwide.
Author Contributions: Investigation, X.Y.; Methodology, X.Y.; Project administration, V.L.-G. and M.C.; Resources,X.Y.; Supervision, V.L.-G., M.V. and M.C.; Writing—original draft, X.Y.; Writing—review & editing, V.L.-G.All authors have read and agreed to the published version of the manuscript
Funding: This research was co-funded by ACCIÓ (Generalitat de Catalunya) within the REGIREU Project(COMRDI16-1-0062).
Acknowledgments: BIO-FIL (Barcelona, Spain) is gratefully acknowledged for providing plastic carriers BIOFILLC-2 in the MBBR study. Authors express their gratitude to Acabats del Bages, S.A. (Monistrol de Montserrat,Spain) for providing textile wastewater during the operation.
Conflicts of Interest: The authors declare no conflicts of interest.
References
1. Kumar, P.; Prasad, B.; Mishra, I.M.; Chand, S. Treatment of composite wastewater of a cotton textile mill bythermolysis and coagulation. J. Hazard. Mater. 2008, 151, 770–779. [CrossRef]
2. Baêta, B.E.L.; Ramos, R.L.; Lima, D.R.S.; Aquino, S.F. Use of submerged anaerobic membrane bioreactor(SAMBR) containing powdered activated carbon (PAC) for the treatment of textile effluents. Water Sci. Technol.2012, 65, 1540–1547. [CrossRef]
3. Vilaseca, M.; Gutiérrez, M.-C.; López-Grimau, V.; López-Mesas, M.; Crespi, M. Biological Treatment ofa Textile Effluent After Electrochemical Oxidation of Reactive Dyes. Water Environ. Res. 2010, 82, 176–182.[CrossRef] [PubMed]
4. Salazar, L.; Crespi, M. Evaluation of kinetic coefficients using membrane bioreactor and active sludge processtreating textile wastewater. Desalin. Water Treat. 2010, 13, 471–478.
5. Muoio, R.; Palli, L.; Ducci, I.; Coppini, E.; Bettazzi, E.; Daddi, D.; Fibbi, D.; Gori, R. Optimization of a largeindustrial wastewater treatment plant using a modeling approach: A case study. J. Environ. Manag. 2019,249, 109436. [CrossRef] [PubMed]
6. Lim, A.L.; Bai, R. Membrane fouling and cleaning in microfiltration of activated sludge wastewater.J. Memb. Sci. 2003, 216, 279–290. [CrossRef]
7. Lourenço, N.D.; Franca, R.D.G.; Moreira, M.A.; Gil, F.N.; Viegas, C.A.; Pinheiro, H.M. Comparing aerobicgranular sludge and flocculent sequencing batch reactor technologies for textile wastewater treatment.Biochem. Eng. J. 2015, 104, 57–63. [CrossRef]
8. López-Grimau, V.; Riera-Torres, M.; López-Mesas, M.; Gutiérrez-Bouzán, C. Removal of aromatic amines anddecolourisation of azo dye baths by electrochemical treatment. Color. Technol. 2013, 129, 267–273. [CrossRef]
9. López-Grimau, V.; Pepió, M.; Gutiérrez-Bouzán, C.; Buscio, V. Kinetic models for the electrochemicaldecolouration of two reactive azo dyes. Desalin. Water Treat. 2018, 136, 405–412. [CrossRef]
10. López-Grimau, V.; Vilaseca, M.; Gutiérrez-Bouzán, C. Comparison of different wastewater treatments forcolour removal of reactive dye baths. Desalin. Water Treat. 2016, 57, 2685–2692. [CrossRef]
11. Lotito, A.M.; De Sanctis, M.; Rossetti, S.; Lopez, A.; Di Iaconi, C. On-site treatment of textile yarn dyeingeffluents using an integrated biological–chemical oxidation process. Int. J. Environ. Sci. Technol. 2014, 11,623–632. [CrossRef]
12. Yurtsever, A.; Çınar, Ö.; Sahinkaya, E. Treatment of textile wastewater using sequential sulfate-reducinganaerobic and sulfide-oxidizing aerobic membrane bioreactors. J. Memb. Sci. 2016, 511, 228–237. [CrossRef]
13. Ng, A.N.L.; Kim, A.S. A mini-review of modeling studies on membrane bioreactor (MBR) treatment formunicipal wastewaters. Desalination 2007, 212, 261–281. [CrossRef]
14. Arévalo, J.; Garralón, G.; Plaza, F.; Moreno, B.; Pérez, J.; Gómez, M.Á. Wastewater reuse after treatment bytertiary ultrafiltration and a membrane bioreactor (MBR): A comparative study. Desalination 2009, 243, 32–41.[CrossRef]

Water 2020, 12, 1306 16 of 17
15. Wang, Z.; Wu, Z. Distribution and transformation of molecular weight of organic matters in membranebioreactor and conventional activated sludge process. Chem. Eng. J. 2009, 150, 396–402. [CrossRef]
16. Bernhard, M.; Müller, J.; Knepper, T.P. Biodegradation of persistent polar pollutants in wastewater:Comparison of an optimised lab-scale membrane bioreactor and activated sludge treatment. Water Res. 2006,40, 3419–3428. [CrossRef] [PubMed]
17. Saha, P.; Hossain, M.Z.; Mozumder, M.S.I.; Uddin, M.T.; Islam, M.A.; Hoinkis, J.; Deowan, S.A.; Drioli, E.;Figoli, A. MBR technology for textile wastewater treatment: First experience in Bangladesh. Membr. Water Treat.2014, 5, 197–205. [CrossRef]
18. Friha, I.; Bradai, M.; Johnson, D.; Hilal, N.; Loukil, S.; Ben Amor, F.; Feki, F.; Han, J.; Isoda, H.; Sayadi, S.Treatment of textile wastewater by submerged membrane bioreactor: In vitro bioassays for the assessment ofstress response elicited by raw and reclaimed wastewater. J. Environ. Manag. 2015, 160, 184–192. [CrossRef]
19. Castro, F.D.; Bassin, J.P.; Dezotti, M. Treatment of a simulated textile wastewater containing the ReactiveOrange 16 azo dye by a combination of ozonation and moving-bed biofilm reactor: Evaluating theperformance, toxicity, and oxidation by-products. Environ. Sci. Pollut. Res. 2017, 24, 6307–6316. [CrossRef]
20. Yang, X.; Crespi, M.; López-Grimau, V. A review on the present situation of wastewater treatment in textileindustry with membrane bioreactor and moving bed biofilm reactor. Desalin. Water Treat. 2018, 103, 315–322.[CrossRef]
21. Park, H.O.; Oh, S.; Bade, R.; Shin, W.S. Application of A2O moving-bed biofilm reactors for textile dyeingwastewater treatment. Korean J. Chem. Eng. 2010, 27, 893–899. [CrossRef]
22. Tarantini, M.; Scalbi, S.; Misceo, M.; Verità, S. Life Cycle Assessment as a Tool for Water Management Optimizationin Textile Finishing Industry; SPIE—The International Society for Optical Engineering, Society of Photo-opticalInstrumentation Engineers: Bellingham, WA, USA, 2004; Volume 5583, pp. 163–170.
23. Nakhate, P.H.; Moradiya, K.K.; Patil, H.G.; Marathe, K.V.; Yadav, G.D. Case study on sustainability oftextile wastewater treatment plant based on lifecycle assessment approach. J. Clean. Prod. 2020, 245, 118929.[CrossRef]
24. Cetinkaya, A.Y.; Bilgili, L. Life Cycle Comparison of Membrane Capacitive Deionization and Reverse OsmosisMembrane for Textile Wastewater Treatment. Water. Air. Soil Pollut. 2019, 230, 149. [CrossRef]
25. Buscio, V.; Crespi, M.; Gutiérrez-Bouzán, C. Application of PVDF ultrafiltration membranes to treat andreuse textile wastewater. Desalin. Water Treat. 2016, 57, 8090–8096. [CrossRef]
26. ISO 14040: 2006. Environmental Management–Life Cycle Assessment—Principles and Framework. Availableonline: https://www.iso.org/standard/37456.html (accessed on 4 May 2020).
27. Buscio, V.; García-Jiménez, M.; Vilaseca, M.; López-Grimau, V.; Crespi, M.; Gutiérrez-Bouzán, C. Reuse ofTextile Dyeing Effluents Treated with Coupled Nanofiltration and Electrochemical Processes. Materials (Basel)2016, 9, 490. [CrossRef]
28. AENOR Textiles—Tests for Colour Fastness—Part J03: Calculation of Colour Differences (ISO 105-J03:2009);Spanish Association for the Standardization and Certification: Madrid, Spain, 2009. (In Spanish)
29. Pala, A.; Tokat, E. Activated Carbon Addition to an Activated Sludge Model Reactor for Color Removal froma Cotton Textile Processing Wastewater. J. Environ. Eng. 2003, 129, 1064–1068. [CrossRef]
30. Sirianuntapiboon, S.; Sansak, J. Treatability studies with granular activated carbon (GAC) and sequencingbatch reactor (SBR) system for textile wastewater containing direct dyes. J. Hazard. Mater. 2008, 159, 404–411.[CrossRef]
31. Salazar, L.; Crespi, M.; Roberto, S. Comparative study between activated sludge versus membrane bioreactorfor textile wastewater. Desalin. Water Treat. 2011, 35, 101–109.
32. Dong, B.; Chen, H.; Yang, Y.; He, Q.; Dai, X. Treatment of printing and dyeing wastewater using MBBRfollowed by membrane separation process. Desalin. Water Treat. 2014, 52, 4562–4567. [CrossRef]
33. Lo, C.H.; McAdam, E.; Judd, S. The cost of a small membrane bioreactor. Water Sci. Technol. 2015, 72,1739–1746. [CrossRef]
34. Iglesias, R.; Simón, P.; Moragas, L.; Arce, A.; Rodriguez-Roda, I. Cost comparison of full-scale waterreclamation technologies with an emphasis on membrane bioreactors. Water Sci. Technol. 2017, 75, 2562–2570.[CrossRef] [PubMed]
35. Radjenovic, J.; Matošic, M.; Mijatovic, I.; Petrovic, M.; Barceló, D. Membrane Bioreactor (MBR) as an AdvancedWastewater Treatment Technology. In Emerging Contaminants from Industrial and Municipal Waste; Springer:Berlin/Heidelberg, Germany, 2008; pp. 37–101.

Water 2020, 12, 1306 17 of 17
36. S.A., E.E. Endesa—Luz. Available online: https://www.endesatarifasluzygas.com/luz/?sem=sem-endesa-google-tl-75&adgroupid=77440481986&gclid=CjwKCAiAy9jyBRA6EiwAeclQhG_kGGL-xchrpwXH50-OM42n6Yx1KUOLsskbYiOKVgbKUWkNwAa99BoC-zkQAvD_BwE (accessed on 26 February 2020).
37. Montornès del Vallès, B. Discoloration Agent. TIDE 2000 S.L. Available online: http://www.tide2000.net/productos/coagulantes-y-decolorantes/ (accessed on 26 February 2020).
38. Ministry of Energy Ley 2/2014, de 27 de enero, de Medidas Fiscales, Administrativas, Financieras y del sectorpúblico. Boletín of del Estado, 30 January 2014; 61561–61567.
39. Oficial, D. LEY 4/2017, de 28 de marzo, de presupuestos de la Generalidad de Cataluña para 2017. 2017, pp. 4–7.Available online: https://www.boe.es/ccaa/dogc/2017/7340/f00001-00134.pdf (accessed on 4 May 2020).
40. Kägi, T.; Dinkel, F.; Frischknecht, R.; Humbert, S.; Lindberg, J.; De Mester, S.; Ponsioen, T.; Sala, S.;Schenker, U.W. Session “Midpoint, endpoint or single score for decision-making?”—SETAC Europe25th Annual Meeting, 5 May 2015. Int. J. Life Cycle Assess. 2016, 21, 129–132. [CrossRef]
© 2020 by the authors. Licensee MDPI, Basel, Switzerland. This article is an open accessarticle distributed under the terms and conditions of the Creative Commons Attribution(CC BY) license (http://creativecommons.org/licenses/by/4.0/).