biomass availability in india - european commission · 2018-03-19 · biomass resources are thinly...
TRANSCRIPT

Biomass Availability in India
EU-India Conference on Advanced Biofuels
at Taj Mahal Hotel, New Delhi
07 March 2018
A Ashok KumarPrincipal ScientistICRISAT – Hyderabad, INDIAE-mail: [email protected]

ICRISAT at a glance
• Non-profit, non-political international R & D institution established in 1972
• Belongs to CGIAR system with 15 sister centers, contributing for global food security
• Sorghum, Pearl millet, Finger millet, Chickpea, Pigeonpea and Groundnut are the six mandate crops of ICRISAT
• HQ in Hyderabad with eight regional/county offices in Africa
• Extensive partnerships for R4D impacts globally
• Demand driven innovations for inclusive market oriented development
CRP: Grain legumes and Dryland Cereals
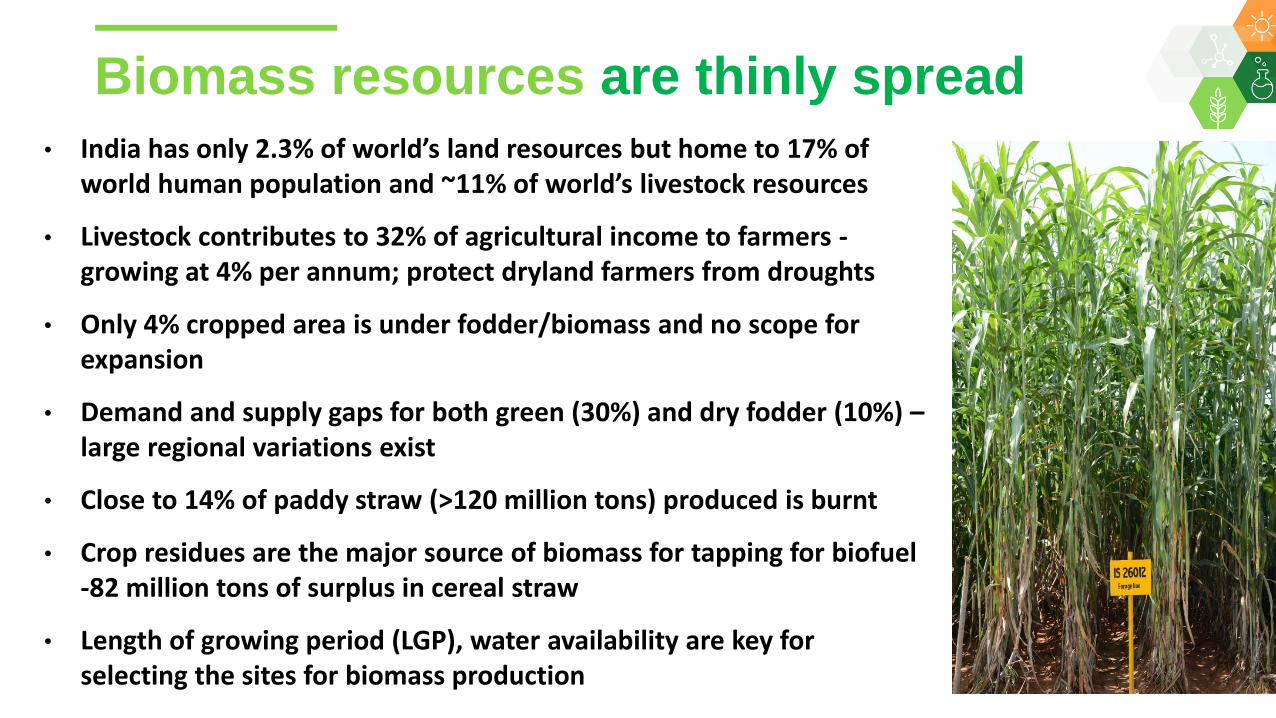
Biomass resources are thinly spread
• India has only 2.3% of world’s land resources but home to 17% of world human population and ~11% of world’s livestock resources
• Livestock contributes to 32% of agricultural income to farmers -growing at 4% per annum; protect dryland farmers from droughts
• Only 4% cropped area is under fodder/biomass and no scope for expansion
• Demand and supply gaps for both green (30%) and dry fodder (10%) –large regional variations exist
• Close to 14% of paddy straw (>120 million tons) produced is burnt
• Crop residues are the major source of biomass for tapping for biofuel -82 million tons of surplus in cereal straw
• Length of growing period (LGP), water availability are key for selecting the sites for biomass production

Changes in the area under fodder, forest, fallow, pasture and cultivable wasteland
Category & area (million
Ha)
1990 2010 2020* % change over
1990
Gross cropped areas
(Excluding fodder crops)
174.1 188.1 196.8 13.0
Fodder crops 8.3 7.9 7.09 -14.2
Forest 67.4 69.6 69.3 2.8
Permanent pastures &
grazing
11.3 10.2 9.5 -16.0
Misc. tree cops & groves
not included
3.8 3.3 3.1 -17.1
Cultivable wasteland 15.1 12.9 11.7 -22.2
Current fallow 13.7 15.7 14.4 5.1
Other fallow 10.3 9.8 9.8 -4.7
Declining fodder area, CPRs and plateau in the area & productivity of food crops. Waste and fallow
lands are under exploited due to labour shortage, uncertain rainfall and increased cost of inputs
* NIANP Projections
Major constraints and opportunities for biomass
Courtesy: Sanjay Bhoosreddy

Biomass (gm/m²): All land use / land cover
Adapted from: Murali Krishna Gumma

Length of growing periods (2000-14)
Kharif sown area = 189 Mha Rabi sown area = 115 Mha
Summer sown area is 24 m haAdapted from: Murali Krishna Gumma

Crop Residue Surplus Density
State State Area
Biomass Generation
Density (MT/km2)
Biomass Consumption
Density (MT/km2)
BiomassSurplus Density
(MT/km2)
Uttar Pradesh 238,566 578.6 417.7 160.9
Haryana 44,212 669.7 554.5 115.1
Tamil Nadu 130,058 309.9 207.2 102.7
Punjab 50,362 823.7 731.0 92.7
Maharashtra 307,713 265.6 173.0 92.6
West Bengal 88,752 299.8 259.0 71.4
Karnataka 191,796 203.8 143.8 60.1
Gujarat 196,024 157.7 102.2 55.5
Andhra Pradesh 275,068 160.7 118.2 42.5
Bihar 94,164 221.6 185.4 36.1
Others 1,668,264 - - -
Total 3,284,979 189.8 140.4 50.1
Courtesy: TIFAC

Unique biomass sources with multiple uses
• Sorghum is the 5th largest cereal crop globally (42 m ha)
• It is a C4 grass grown for food, feed, forage and fuel
• Grown in all continents - Resilient
• Wider adaptability (400 N and S of equator), Nutritious grain and fodder
• Climate change ready crop
• ICRISAT focuses on parental lines development for traits of interest and sharing (>900 A-/B- lines & >1000 R-lines)
• 270 cultivars released in 44 countries
Grain sorghum
Sweet sorghum
High biomass/forage sorghum

Building the farmers groups for feedstock supply
• CSH 22 SS first sweet sorghum hybrid in India in 2005
• Worked with more than 10,000 farmers in Telangana and Maharashtra
• Supplied the seeds, literature• Trained farmers in crop
production for higher yields• Linked them with ethanol
distilleries and decentralized crushing units

Key lessons learnt from sweet sorghum ethanol initiative
• Distillery should be multi-feedstock unit and produce
multiple products and by-products
• Explore sugar mills for using Sweet sorghum as
complimentary feedstock –no capex
• Distilleries can use sweet sorghum – need crushers
• Target area to be clustered rather than dispersed
• Strong agri R&D set up & supply chain management
• Whole plant utilization of sweet sorghum critical for
benefit maximization
• Mechanized crop production and harvesting
• Enabling policy environment - critical

Sugar mills as entry point for efficient biofuel
JAN FEB MAR APR MAY JUN JUL AUG SEP OCT NOV DEC
Sweet sorghum based Bioenergy Calendar
Sugarcane harvesting
Sweet sorghum harvesting
Sweet sorghum planting
• Ethanol price high now, close to Rs 40 ($0.67)• Large demand for ethanol for blending• There are >600 sugar mills in India, of which
>400 have distilleries attached• Sugarcane crushing: Nov-Mar
Sweet sorghum can be crushed in sugar mills without any modifications

Sugar mills can be converted in to 1G and 2G biofuel plants

6
6
Improved high biomass hybrids for sustainable biomass
production – No competition for food and fuel
Varieties On-farm fresh stalk yields (t h-1)
District Gwalior District Dewas &
Khargone
2013 2014 Mean 2013 2014 Mean
CSH 13 59.6 38.6 49.1 39.3 44.6 42.0
IS 27206 63.1 43.2 53.2 40.5 51.2 45.9
ICSSH 28 68.4 45.6 57.0 45.3 63.3 54.3
CSH 24 MF 55.2 41.3 48.3 38.4 51.3 44.9
CSV 24 SS 41.3 33.6 37.5 40.3 43.6 42.0
SPSSV 30 38.2 32.2 35.2 36.9 40.5 38.7
SSV 74 40.4 28.7 34.6 39 40.3 39.7
MP Chari 36.1 28.5 32.3 29.6 33.7 31.7
• Released in 2015 and notified by Govt. of India in 2016• Gives 288 lit of ethanol for 1 ton of dry biomass (C5 + C6)• Farmers get 25% higher income than grain farmers by selling stalks• Drought and salinity tolerant cultivars and low-lignin types developed

Single planting giving multiple cuts for sustainable resource use

Best performing SS cultivars identified across states
S No Sugar Mill/State Cultivars
1 Madhucon sugar and power industries, Telangana State
ICSV 25308, ICSV 25306, ICSSH 28, Phule Vasundhara and ICSV 12012
2 Shree Ganesh Khand UdyogSahakari Mandli Limited,
Gujarat
ICSSH 28, Phule Vasundhara, ICSV 25306, CSH 22 SS
3 U.P. Co-operative Sugar Factories Federation Limited,
Uttar Pradesh
Phule Vasundhara and ICSV 25306
4 Salem Co-operative Sugar Mills Limited, Tamil Nadu
ICSV 25308, ICSV 12012, ICSSH 28, CSH 22 SS, Phule vasundhara, CSV
24SS and Sugar graze
5 Core green sugars, Yadgir, Karnataka
ICSSH 28, ICSV 12012, ICSV 25308 and ICSV 25306
Sorghum Feedstock X Production system Matrix developed for lingo-cellulosic (2G) biofuel production

Low hanging fruit - stover from rice-fallow sorghum
• Newest crop in rice-fallows, started by farmers in Guntur district, A.P
• Replacing the maize, the current area stands at 50,000 ha but there is large scope for expansion (>1 m ha rice in AP)
• Predominantly Hybrids, grown under zero tillage with limited water
• Higher grain productivity (5.7 t ha-1) and procured by buyers from MH and AP
• Total biomass production is close to 150,000 tons – All the biomass is currently burnt as livestock here is not used to consume sorghum stover
• A 400 tpd 2G plant needs 120,000 tons of biomass for 300 days operation

Sustainability of 2G biofuel plants – critical interventions
• Locating 2G plants in ecologies with adequate rainfall and irrigation to support for year-round biomass production
• Sustainable crop intensification, rotation and farmers training• Transportation logistics and costs need to be considered
carefully in plant location• Farmers’ organized in clusters around the plant to provide
affordable storage, compaction services and timely transport• Rail lines should also be considered as cost-effective
transport arteries to keep larger plants operational• Return of sufficient organic matter to improve soil health
with by-products like biochar and lignin (as bio fertilizers)• Farmer Producers Organizations (FPOs) be used to integrate
farmers into feedstock value chains

Acknowledgements

Thank you
In partnership with CGIAR Centers, public and private organizations, governments, and farmers worldwide
Demand-driven Innovation for the Drylands
www.gldc.cgiar.org