biophysical principles of choanoflagellate self-organization
TRANSCRIPT

Biophysical principles of choanoflagellateself-organizationBen T. Larsona,b,c, Teresa Ruiz-Herrerod, Stacey Leee, Sanjay Kumare,f, L. Mahadevand,g,h,i,1
,and Nicole Kinga,b,1
aHoward Hughes Medical Institute, University of California, Berkeley, CA 94720; bDepartment of Molecular and Cell Biology, University of California,Berkeley, CA 94720; cBiophysics Graduate Group, University of California, Berkeley, CA 94720; dPaulson School of Engineering and Applied Sciences, HarvardUniversity, Cambridge, MA 02138; eUniversity of California, Berkeley–University of California, San Francisco Graduate Program in Bioengineering,Department of Bioengineering, University of California, Berkeley, CA 94720; fDepartment of Chemical and Biomolecular Engineering, University ofCalifornia, Berkeley, CA 94720; gDepartment of Physics, Harvard University, Cambridge, MA 02138; hDepartment of Organismic and Evolutionary Biology,Harvard University, Cambridge, MA 02138; and iKavli Institute for NanoBio Science and Technology, Harvard University, Cambridge, MA 02138
Edited by Thomas D. Pollard, Yale University, New Haven, CT, and approved December 4, 2019 (received for review June 4, 2019)
Inspired by the patterns of multicellularity in choanoflagellates,the closest living relatives of animals, we quantify the biophysicalprocesses underlying the morphogenesis of rosette colonies in thechoanoflagellate Salpingoeca rosetta. We find that rosettes repro-ducibly transition from an early stage of 2-dimensional (2D) growthto a later stage of 3D growth, despite the underlying variability ofthe cell lineages. Our perturbative experiments demonstrate thefundamental importance of a basally secreted extracellular matrix(ECM) for rosette morphogenesis and show that the interaction ofthe ECMwith cells in the colony physically constrains the packing ofproliferating cells and, thus, controls colony shape. Simulations of abiophysically inspired model that accounts for the size and shape ofthe individual cells, the fraction of ECM, and its stiffness relativeto that of the cells suffices to explain our observations and yieldsa morphospace consistent with observations across a range ofmulticellular choanoflagellate colonies. Overall, our biophysicalperspective on rosette development complements previous geneticperspectives and, thus, helps illuminate the interplay between cellbiology and physics in regulating morphogenesis.
morphogenesis | multicellularity | morphospace | quantitative cellbiology | extracellular matrix
Nearly all animals start life as a single cell (the zygote) that,through cell division, cell differentiation, and morpho-
genesis, gives rise to a complex multicellular adult form (1, 2).These processes in animals require regulated interplay betweenactive cellular processes and physical constraints (3–9). Aparticularly interesting system in which to study this interplay isthe choanoflagellates, the closest relatives of animals (10–12).Choanoflagellates are aquatic microbial eukaryotes whose cellsbear a diagnostic “collar complex” composed of an apical flagel-lum surrounded by an actin-filled collar of microvilli (13, 14) (Fig.1). The life histories of many choanoflagellates involve transientdifferentiation into diverse cell types and morphologies (15, 16).For example, in the model choanoflagellate Salpingoeca rosetta,solitary cells develop into multicellular colonies through serialrounds of cell division (17), akin to the process by which an-imal embryos develop from a zygote (Fig. 1A). Therefore,choanoflagellate colony morphogenesis presents a simple, phylo-genetically relevant system for investigating multicellular mor-phogenesis from both a biological and a physical perspective (14).S. rosetta forms planktonic, rosette-shaped colonies (“rosettes”),
in which the cells are tightly packed into a rough sphere that re-sembles a morula-stage animal embryo (17). Because the cell-division furrow forms along the apical–basal axis, thereby dis-secting the collar, all of the cells in rosettes are oriented with theirflagella and collars facing out into the environment and their basalpoles facing into the rosette interior (Fig. 1 B and C). Interestingly,all 3 genes known to be required for rosette development areregulators of the extracellular matrix (ECM): a C-type lectin calledrosetteless (18) and 2 predicted glycosyltransferases called jumble
and couscous (19). Nonetheless, little is known about either themechanistic role of the ECM or the extent to which rosette mor-phogenesis is shaped by physical constraints.A critical barrier to understanding the biological and physical
mechanisms underlying rosette morphogenesis has been theabsence of a detailed characterization of the morphogeneticprocess. For example, it is not known whether rosettes formthrough the development of invariant cell lineages akin tothose seen in Caenorhabditis elegans (20) or through variablecell divisions, as occurs, for example, in sponges and mice (21, 22).Moreover, it is not known whether there are identifiable de-velopmental stages in rosette development. To quantify theprinciples of rosette morphogenesis, we used a combination ofquantitative descriptions of rosette development, experimentalperturbations, and biophysical simulations that together revealthe importance of the regulated secretion of basal ECM inphysically constraining proliferating cells and thereby sculptingchoanoflagellate multicellularity.
ResultsRosette Morphogenesis Displays a Stereotyped Transition from2-Dimensional to 3-Dimensional Growth. To constrain our searchfor mechanistic principles, we first quantified the range of sizesand spectrum of morphologies of S. rosetta rosettes by measuring
Significance
Comparisons among animals and their closest living relatives,the choanoflagellates, have begun to shed light on the originof animal multicellularity and development. Here, we comple-ment previous genetic perspectives on this process by focusingon the biophysical principles underlying choanoflagellate col-ony morphology and morphogenesis. Our study reveals thecrucial role of the extracellular matrix in shaping the coloniesand leads to a phase diagram that delineates the range ofmorphologies as a function of the biophysical mechanismsat play.
Author contributions: B.T.L., T.R.-H., S.L., S.K., L.M., and N.K. designed research; B.T.L.,T.R.-H., and S.L. performed research; B.T.L. and T.R.-H. contributed new reagents/analytictools; B.T.L., T.R.-H., and S.L. analyzed data; and B.T.L., T.R.-H., S.L., S.K., L.M., and N.K.wrote the paper.
The authors declare no competing interest.
This article is a PNAS Direct Submission.
This open access article is distributed under Creative Commons Attribution-NonCommercial-NoDerivatives License 4.0 (CC BY-NC-ND).
Data deposition: Code for simulations is available at https://github.com/truizherrero/choanoflagellate_colonies.1To whom correspondence may be addressed. Email: [email protected] or [email protected].
This article contains supporting information online at https://www.pnas.org/lookup/suppl/doi:10.1073/pnas.1909447117/-/DCSupplemental.
First published January 2, 2020.
www.pnas.org/cgi/doi/10.1073/pnas.1909447117 PNAS | January 21, 2020 | vol. 117 | no. 3 | 1303–1311
BIOPH
YSICSAND
COMPU
TATIONALBIOLO
GY
EVOLU
TION
Dow
nloa
ded
by g
uest
on
Dec
embe
r 4,
202
1

the population-wide distribution of rosette size in terms of cellnumber. Following previous work, we defined rosettes starting atthe 4-cell stage, although cells can be found as singlets, doublets,and triplets as well. S. rosetta cultured solely in the presence of therosette-inducing bacterium Algoriphagus machipongonensis (23)led to a population in which the distribution of cells per individualwas stationary (i.e., unchanging over time), where an “individual”refers to any unicell or group of cells including rosettes. Whilesome rosettes contained as many as 25 cells, the most commonrosette size was 8 cells per rosette, with 51% of rosettes containingbetween 6 and 8 cells (Fig. 2A). While rosettes grow through celldivision, their ultimate size is determined by either colony fission(as reported; ref. 16) or cell extrusion (SI Appendix, Fig. S1). Ineach case, the rosettes contained 8 or more cells, suggesting thatthese rosette size-decreasing phenomena are more common inlarger rosettes.We next quantified defining features of the 3-dimensional
(3D) morphology of rosettes containing between 4 (the smallestcell number clearly identifiable as a rosette; ref. 24) and 12 cells(representing 90% of rosettes at steady state; SI Appendix, Ma-terials and Methods and Fig. 2 B and C). This analysis revealedthat rosettes increased in volume and diameter as cell numberincreased (Fig. 2D). Although the average cell volume reducedbetween the 4- and 5-cell stages of rosette development, averagecell volume did not change substantially with increasing cellnumber after the 5-cell stage (SI Appendix, Fig. S2), suggestingthat cells in rosettes grow between cell divisions. This contrastswith cleavage in the earliest stages of animal embryogenesis, inwhich cell volume steadily decreases as cell divisions proceedwith no cell or overall tissue growth (2).Our analyses revealed that rosette morphogenesis displays
2 distinct, but previously undescribed, phases: 1) a 2D phase ofgrowth from 4 to 7 cells, during which the overall shape of ro-settes changed substantially with increasing cell number; and 2) a3D phase from 8 to 12 cells, during which rosettes expandednearly isotropically (Fig. 2 C–E). Interestingly, the most commonrosette size (8 cells) corresponded to the transition between the2 phases of growth.Transitions from 2D to 3D growth can be driven by the con-
strained growth of cell layers leading to increasing mechanicalstresses (25–29). We hypothesized that the physical packing ofcells in rosettes might constrain cell growth and proliferation andhelp explain the growth transition during rosette morphogenesis.Indeed, cell packing initially increased, as indicated by an in-crease in the number of nearest neighbor cells (Fig. 2F), andsuggested by the reduced average sphericity of cells (SI Appendix,
Fig. S2). Following the growth transition at the 8-cell stage, cellpacking continued to increase with increasing cells per rosette,although the rate of increase slowed as a function of the numberof cells per rosette (Fig. 2F). Therefore, the transition to iso-tropic 3D growth in 8-cell rosettes may occur in response to theaccumulation of stress caused by the increase in cell packing ingrowing rosettes.
Rosette Developmental Dynamics Are Variable. The influence of cellpacking on rosette morphogenesis did not preclude the possibilitythat the rosette-developmental program might also involve specificpatterns of cell division that result in well-defined cell lineages. Wetherefore documented cell lineages in live, developing rosettes(Fig. 3). Consistent with the single published observation of liverosette development (17), the cells maintained polarity throughoutdevelopment, with their division planes oriented along the apical–basal axis. Relative to the cell-division times in linear chains (Fig.1A), which form when rosette-inducing bacteria are absent, weobserved a slight, but statistically significant, increase in divisionrate in rosettes (P = 0.03 by Wilcoxon rank sum test; SI Appendix,Fig. S3A). In addition, we found that both the order and timing ofcell divisions differed among different rosettes (Fig. 3 B and C),ruling out the possibility that cell lineages are invariant. Thisprocess of apparently unpatterned cell divisions resembles thedynamics of early embryogenesis in diverse animals, includingsponges and mice (21, 22).Although division patterns were variable between rosettes,
ruling out the possibility of invariant cell lineages, in no rosettedid cells from the 1st, 2nd, or 3rd cell division give rise to morethan 60% of cells (Fig. 3D). Moreover, cell division remainedbalanced throughout rosette morphogenesis, with no cell lineagecoming to dominate. Importantly, the cell lineages of chainsshowed the same kind of variability as rosettes (Fig. 3D). Theseobservations suggest that rosette morphogenesis does not requirethe strongest forms of cell-cycle control or coordination [i.e., thesynchronous divisions or deterministic division timing or orderobserved in the development of some animals such as C. elegans,Xenopus, Drosophila, and zebrafish (30–33) and in the green algaVolvox (34–36)].
ECM Constrains Proliferating Cells in Rosettes. To reconcile thestereotyped 3D growth transition (Fig. 2) with the variable de-velopmental dynamics of rosette formation (Fig. 3), we set out totest the “ECM constraint hypothesis” (Fig. 4 A and B). Thishypothesis was motivated by the idea that physical constraintsimposed by the geometry and mechanics of cell packing play a
cf
br
fi
A C
ChainRosette
e
c
fc
f
br
fiSerial cell divisions
B
+ RIFs
Fig. 1. S. rosetta develops from a single cell into multicellular colonies through serial rounds of cell division. (A) All choanoflagellate cells bear a diagnostic “collarcomplex” composed of an apical flagellum (f) surrounded by an actin-filled collar of microvilli (c) (13, 14). S. rosetta produces 2 different colonial forms: compact,mechanically robust, roughly spherical rosette colonies (Rosette) that form in the presence of bacterial Rosette Inducing Factors (RIFs; refs. 17, 23, and 24); andfragile, linear chain colonies (Chain) that form during rapid cell growth in the absence of RIFs (16). Both types of colonies form by serial cell divisions. Reprintedfrom ref. 16. Copyright (2011) with permission from Elsevier. Reprinted from ref. 19, which is licensed under CC BY 4.0. (B) A 3D reconstruction of a rosette (fromref. 37). Cells (blue) in rosettes are packed around a central focus with apical collars (c; orange) and flagella (f; green) facing into the environment. Some cells areconnected by cytoplasmic bridges (br; red) (37), which are also observed in chains (16). Filopodia (fi; purple) extend into the center of rosettes, which is devoid ofcells (18). Reprinted from ref. 37, which is licensed under CC BY 4.0. (C) Thin section through the equator of a rosette, imaged by transmission electron microscopy,illustrates the subcellular architecture of a rosette (37). Labeled as in B. (Scale bars, 3 μm.)
1304 | www.pnas.org/cgi/doi/10.1073/pnas.1909447117 Larson et al.
Dow
nloa
ded
by g
uest
on
Dec
embe
r 4,
202
1

A
0 10 200
10
20
Per
cent
age
of in
divi
dual
s
Cells per individual
B
D
8 10 12 14 16101
102
103
Maximum rosette width (µm)
Ros
ette
vol
ume
(µm
3 )
slope = 3.0
slop
e =
7.9
F
4 6 8 10 121
2
3
4
Cells per rosette
Nei
ghbo
r nu
mbe
r (c
ells
)
ab
c
ab
c
C
ii iii ivi
5 6 7 8 9 10 11 124
E
4 6 8 10 120
0.2
0.4
0.6
0.8
1.0
Cells per rosette
Sph
eric
ityF
latn
ess
Size Shape Packing
x
y
z
x
x
y z
y
z
5 15 25
Fig. 2. Quantitative analysis of rosette morphology reveals that rosettes undergo a reproducible 2D to 3D growth transition. (A) Under conditions of constantrosette induction, S. rosetta existed as unicells, doublets, triplets, and rosettes containing between 4 and 25 cells, with the most common rosette size being 8 cellsper individual. Following previous work (24), we defined 4 cells as the smallest number clearly identifiable as a rosette. Each unicell or group of cells was consideredan “individual.” The mean percentage of individuals in a population (y axis) was plotted by number of cells per individual (x axis). Error bars indicate SDs ofmeasurements from 3 different days. n = 511 individuals. Gray background indicates rosettes of 4 to 7 cells (D and E). (B) Image-analysis pipeline for quantitativelycomparing rosette morphologies is illustrated here for 2 representative rosettes. For each rosette, cell positions (dots) were extracted (B, i) and used to determinerosette size, including volume (measured by convex hull) (B, ii), shape, including flatness and sphericity (the former quantified by 1− c=b and the latter by
ffiffiffiffiffiffiffiffiffiffiffiffiffibc=a23
p
where a, b, and c, denoted by blue, red, and green vectors, respectively, are the principal axes in descending order by magnitude of an ellipsoid fit of cell positionsfor a given rosette) (B, iii), and cell packing [neighbor number determined by Voronoi tessellation (78) (B, iv)]. Dashed lines in B, iv indicate nearest neighbors (graywith black outline) of the cell indicated by the dark gray point. (C) Representative rosettes from 4 to 12 cells per rosette are each shown in 3 roughly orthogonalviews. The numbers above each image column indicate the number of cells per rosette. (D) Rosettes transition from an early phase of major shape change (graybackground; scaling exponent 7.9 with 95% CI [5.0, 9.8]) to a later phase of approximately isotropic growth (scaling exponent 3.0 with 95% CI [2.7, 3.3]), shown bylog–log plot of rosette volume (y axis) vs. maximum rosette width (x axis). (E) Rosettes transition from a relatively flat morphology during the 4- to 6-cell stage (graybackground; mean flatness ≅ 0.5 to 0.7 and mean sphericity ≅ 0.4 to 0.6, with flatness = 1.0 perfectly flat and sphericity = 1.0 perfectly spherical) to a morespheroidal morphology during the 8- to 12-cell stage (mean flatness ≅ 0.2 to 0.3 and mean sphericity ≅ 0.7 to 0.8). (F) Packing increases with cell number at adecreasing rate. D–F depict mean values; error bars indicate SEM. Gray background indicates rosettes of 4 to 7 cells. n = 100 rosettes, with ≥8 rosettes from eachcell-number class, pooled from 3 different samples. (Scale bars, 3 μm.)
Larson et al. PNAS | January 21, 2020 | vol. 117 | no. 3 | 1305
BIOPH
YSICSAND
COMPU
TATIONALBIOLO
GY
EVOLU
TION
Dow
nloa
ded
by g
uest
on
Dec
embe
r 4,
202
1

key role in morphogenesis and that the source of the physicalconstraint in growing rosettes is the ECM, which is known to berequired for rosette morphogenesis and connects all cells in arosette, filling the rosette center (16, 18, 19, 37). Observations ofincreased cell packing (Fig. 2F) in conjunction with decreasingcellular sphericity (SI Appendix, Fig. S2) were also consistentwith the hypothesized increasingly constrained cellular packingas a function of cell number. The phenomenon of physicallyconstrained morphogenesis suggests that the amount of ECMsecreted during rosette development is an important factor insculpting rosette morphogenesis (Fig. 4 A and B). We visual-ized and quantified the volume of the ECM by staining withfluorescein-conjugated Jacalin, a galactose-binding lectin (19, 38).Importantly, Jacalin does not stain chains, so its target is likelyspecific to rosette ECM (19). We found that the relative amount ofspace occupied by basal ECM (ECM volume/total cell volume,denoted by ϕ) in developing rosettes was constant and maintainedat roughly 6% (Fig. 4C and SI Appendix, Fig. S4). Therefore, weinfer that cells in rosettes produce ECM at a constant rate rel-ative to the growth of cells, either through synthesis and secre-tion alone or through a balance of regulated synthesis, secretion,and degradation.
A key prediction of the ECM constraint hypothesis (Fig. 4 Aand B) is that compressive stress on cells, balanced by stress inthe ECM, should increase with cell number. This predicted in-crease in residual, compressive stresses on cells in conjunction withincreased cell packing could, in part, explain our observations ofdecreasing cellular sphericity (SI Appendix, Fig. S2). This is remi-niscent of an athermal jamming transition in nonliving systems,such as granular materials driven by external stresses that lead topacking (39–41). Biological systems, such as snowflake yeast andmicrobes proliferating in confined environments (42, 43), alsoshow evidence of jamming, but this time the accumulated stress isdue to cellular growth and proliferation, leading to the notion ofself-driven jamming (42). Alternatively, cell–cell connections me-diated by lateral cell–cell adhesion or cytoplasmic bridges formedduring incomplete cytokinesis (Fig. 1 B and C and refs. 16 and 37)might be primarily responsible for the structural integrity of ro-settes. If cell–cell connections dominate over ECM in holdingtogether rosettes, we would expect cells to be under tension due tostretching of cytoplasmic bridges (37) or due to the forces arisingfrom cell–cell adhesion (44), such that measured stresses would bein the opposite direction to those predicted by the ECM constrainthypothesis (44, 45).
A
0 h
16 h
8 h
B a b c
1 1.11.2
1.11.2.1
1.2.21.2.1
1.2.21.1.1
1.1.2
1.2.1
1.2.2 1.1.1
1.1.2.1
1.1.2.21.2.1
1.2.2.1 1.1.1
1.1.2.1
1.1.2.21.2.2.2
1.2.1
1.2.2.11.1.1.1
1.1.2.1
1.1.2.2
1.2.2.2
1.1.1.2
1.2.1.1
1.2.2.11.1.1.1
1.1.2.1
1.1.2.2
1.2.2.2
1.1.1.2
1.2.1.2
1.1
1.2 1.1
1.2.1
1.2.2
1.2.1
1.2.2
1.1.1
1.1.2
1.2.1
1.2.2
1.1.1
1.1.2.11.1.2.2
1.2.11.2.2.1
1.1.1
1.1.2.11.1.2.2
1.2.2.2
1.2.1
1.2.2.1
1.1.1.1
1.1.2.11.1.2.2
1.2.2.2
1.1.1.2
1.2.2.1
1.1.1.1
1.1.2.11.1.2.2
1.2.2.2
1.1.1.2
1.2.1.11.2.1.2
1
–0.1 h 0 h 5.2 h 7.1 h 9.9 h 10.3 h 12.0 h 14.6 h
0
12
5
9 12
10
9663
30 0
12
0
12 9
5
9 6
10
633
00
9
6
0
12 39
5
6 03
10
0
Tim
e (h
)
X position () Y po
sition
()
C
D11
9
Rosettes Chains
8
12
Fig. 3. Variability of developmental dynamics in S. rosetta. (A) Lineage analysis for a representative rosette, imaged live by DIC microscopy. Individualdaughter cells were marked to record their relationship to their parent lineage (e.g., 1.1 and 1.2 are daughters of cell 1). (Scale bar, 3 μm.) (B) Representativecell lineages illustrating differences in both the order and timing of cell divisions during rosette development. Branch lengths scale with time and are set tozero based on the 1st division. (C) The same lineages displayed as space–time plots to illustrate cell-division variability between rosettes in both space andtime. The cells remained in place after divisions, with no large rearrangements, moving apart only slightly as they grew. Colors in B and C indicate the order ofcell divisions (red, 1st; orange, 2nd; yellow, 3rd; brown, 4th; light blue, 5th; and darker blue, 6th). (D) Although the order and timing of divisions werevariable, cell lineages that formed during rosette and chain development were balanced. In rosettes and chains, imbalanced lineages (i.e., with significantlydifferent numbers of cells) were not observed at any stage (SI Appendix, Fig. S3B). Shown are results for 4- and 5-cell rosettes and chains. “X” indicates adivision pattern that was never observed. Data were pooled from 3 independent rosette-induction experiments (for rosettes) and 3 independent experimentswith uninduced cells (for chains).
1306 | www.pnas.org/cgi/doi/10.1073/pnas.1909447117 Larson et al.
Dow
nloa
ded
by g
uest
on
Dec
embe
r 4,
202
1
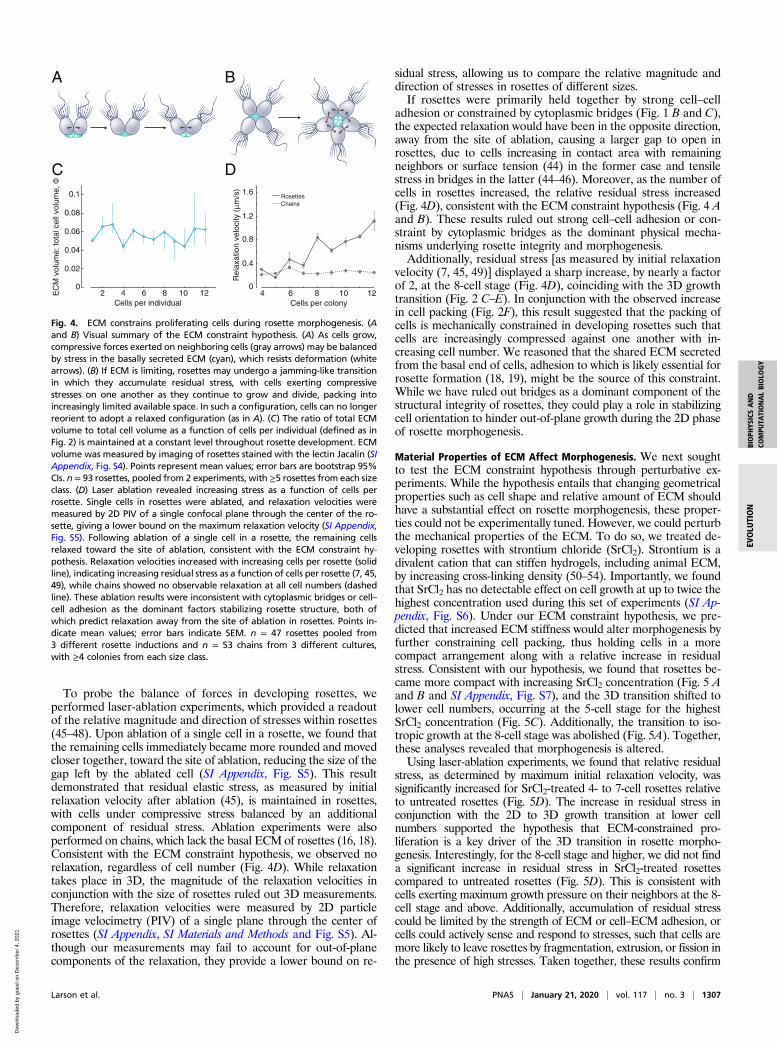
To probe the balance of forces in developing rosettes, weperformed laser-ablation experiments, which provided a readoutof the relative magnitude and direction of stresses within rosettes(45–48). Upon ablation of a single cell in a rosette, we found thatthe remaining cells immediately became more rounded and movedcloser together, toward the site of ablation, reducing the size of thegap left by the ablated cell (SI Appendix, Fig. S5). This resultdemonstrated that residual elastic stress, as measured by initialrelaxation velocity after ablation (45), is maintained in rosettes,with cells under compressive stress balanced by an additionalcomponent of residual stress. Ablation experiments were alsoperformed on chains, which lack the basal ECM of rosettes (16, 18).Consistent with the ECM constraint hypothesis, we observed norelaxation, regardless of cell number (Fig. 4D). While relaxationtakes place in 3D, the magnitude of the relaxation velocities inconjunction with the size of rosettes ruled out 3D measurements.Therefore, relaxation velocities were measured by 2D particleimage velocimetry (PIV) of a single plane through the center ofrosettes (SI Appendix, SI Materials and Methods and Fig. S5). Al-though our measurements may fail to account for out-of-planecomponents of the relaxation, they provide a lower bound on re-
sidual stress, allowing us to compare the relative magnitude anddirection of stresses in rosettes of different sizes.If rosettes were primarily held together by strong cell–cell
adhesion or constrained by cytoplasmic bridges (Fig. 1 B and C),the expected relaxation would have been in the opposite direction,away from the site of ablation, causing a larger gap to open inrosettes, due to cells increasing in contact area with remainingneighbors or surface tension (44) in the former case and tensilestress in bridges in the latter (44–46). Moreover, as the number ofcells in rosettes increased, the relative residual stress increased(Fig. 4D), consistent with the ECM constraint hypothesis (Fig. 4 Aand B). These results ruled out strong cell–cell adhesion or con-straint by cytoplasmic bridges as the dominant physical mecha-nisms underlying rosette integrity and morphogenesis.Additionally, residual stress [as measured by initial relaxation
velocity (7, 45, 49)] displayed a sharp increase, by nearly a factorof 2, at the 8-cell stage (Fig. 4D), coinciding with the 3D growthtransition (Fig. 2 C–E). In conjunction with the observed increasein cell packing (Fig. 2F), this result suggested that the packing ofcells is mechanically constrained in developing rosettes such thatcells are increasingly compressed against one another with in-creasing cell number. We reasoned that the shared ECM secretedfrom the basal end of cells, adhesion to which is likely essential forrosette formation (18, 19), might be the source of this constraint.While we have ruled out bridges as a dominant component of thestructural integrity of rosettes, they could play a role in stabilizingcell orientation to hinder out-of-plane growth during the 2D phaseof rosette morphogenesis.
Material Properties of ECM Affect Morphogenesis. We next soughtto test the ECM constraint hypothesis through perturbative ex-periments. While the hypothesis entails that changing geometricalproperties such as cell shape and relative amount of ECM shouldhave a substantial effect on rosette morphogenesis, these proper-ties could not be experimentally tuned. However, we could perturbthe mechanical properties of the ECM. To do so, we treated de-veloping rosettes with strontium chloride (SrCl2). Strontium is adivalent cation that can stiffen hydrogels, including animal ECM,by increasing cross-linking density (50–54). Importantly, we foundthat SrCl2 has no detectable effect on cell growth at up to twice thehighest concentration used during this set of experiments (SI Ap-pendix, Fig. S6). Under our ECM constraint hypothesis, we pre-dicted that increased ECM stiffness would alter morphogenesis byfurther constraining cell packing, thus holding cells in a morecompact arrangement along with a relative increase in residualstress. Consistent with our hypothesis, we found that rosettes be-came more compact with increasing SrCl2 concentration (Fig. 5 Aand B and SI Appendix, Fig. S7), and the 3D transition shifted tolower cell numbers, occurring at the 5-cell stage for the highestSrCl2 concentration (Fig. 5C). Additionally, the transition to iso-tropic growth at the 8-cell stage was abolished (Fig. 5A). Together,these analyses revealed that morphogenesis is altered.Using laser-ablation experiments, we found that relative residual
stress, as determined by maximum initial relaxation velocity, wassignificantly increased for SrCl2-treated 4- to 7-cell rosettes relativeto untreated rosettes (Fig. 5D). The increase in residual stress inconjunction with the 2D to 3D growth transition at lower cellnumbers supported the hypothesis that ECM-constrained pro-liferation is a key driver of the 3D transition in rosette morpho-genesis. Interestingly, for the 8-cell stage and higher, we did not finda significant increase in residual stress in SrCl2-treated rosettescompared to untreated rosettes (Fig. 5D). This is consistent withcells exerting maximum growth pressure on their neighbors at the 8-cell stage and above. Additionally, accumulation of residual stresscould be limited by the strength of ECM or cell–ECM adhesion, orcells could actively sense and respond to stresses, such that cells aremore likely to leave rosettes by fragmentation, extrusion, or fission inthe presence of high stresses. Taken together, these results confirm
A B
4 6 8 10 120
0.4
0.8
1.2
1.6
Cells per colony
Rel
axat
ion
velo
city
(µ
m/s
)
Cells per individual4 8 12
0
0.02
0.04
0.06
0.08
EC
M v
olum
e: to
tal c
ell v
olum
e, Φ
0.1
C D
6 102
RosettesChains
Fig. 4. ECM constrains proliferating cells during rosette morphogenesis. (Aand B) Visual summary of the ECM constraint hypothesis. (A) As cells grow,compressive forces exerted on neighboring cells (gray arrows) may be balancedby stress in the basally secreted ECM (cyan), which resists deformation (whitearrows). (B) If ECM is limiting, rosettes may undergo a jamming-like transitionin which they accumulate residual stress, with cells exerting compressivestresses on one another as they continue to grow and divide, packing intoincreasingly limited available space. In such a configuration, cells can no longerreorient to adopt a relaxed configuration (as in A). (C) The ratio of total ECMvolume to total cell volume as a function of cells per individual (defined as inFig. 2) is maintained at a constant level throughout rosette development. ECMvolume was measured by imaging of rosettes stained with the lectin Jacalin (SIAppendix, Fig. S4). Points represent mean values; error bars are bootstrap 95%CIs. n = 93 rosettes, pooled from 2 experiments, with ≥5 rosettes from each sizeclass. (D) Laser ablation revealed increasing stress as a function of cells perrosette. Single cells in rosettes were ablated, and relaxation velocities weremeasured by 2D PIV of a single confocal plane through the center of the ro-sette, giving a lower bound on the maximum relaxation velocity (SI Appendix,Fig. S5). Following ablation of a single cell in a rosette, the remaining cellsrelaxed toward the site of ablation, consistent with the ECM constraint hy-pothesis. Relaxation velocities increased with increasing cells per rosette (solidline), indicating increasing residual stress as a function of cells per rosette (7, 45,49), while chains showed no observable relaxation at all cell numbers (dashedline). These ablation results were inconsistent with cytoplasmic bridges or cell–cell adhesion as the dominant factors stabilizing rosette structure, both ofwhich predict relaxation away from the site of ablation in rosettes. Points in-dicate mean values; error bars indicate SEM. n = 47 rosettes pooled from3 different rosette inductions and n = 53 chains from 3 different cultures,with ≥4 colonies from each size class.
Larson et al. PNAS | January 21, 2020 | vol. 117 | no. 3 | 1307
BIOPH
YSICSAND
COMPU
TATIONALBIOLO
GY
EVOLU
TION
Dow
nloa
ded
by g
uest
on
Dec
embe
r 4,
202
1

important model predictions by demonstrating that material prop-erties of the ECM can affect morphogenesis, which highlights thecentral role of the ECM in sculpting rosette morphology.
Amount of ECM, Cell Shape, and ECM Stiffness as Control Parametersfor Morphogenesis. To formalize and test our hypothesis of mor-phogenesis shaped by ECM constraint (Fig. 4 A and B), we nextdeveloped a cell-based computational model to simulate rosettedevelopment. We used a coarse-grained approximation of the cell
geometry and the main interactions to focus on the primary factorsdriving colony morphogenesis. In this simplified model of rosettemorphogenesis (SI Appendix, SI Materials and Methods, SimulationAnalysis), there are just 3 dimensionless parameters that controlrosette colony shape. These correspond to the geometry of theindividual cells, quantified in terms of cell aspect ratio (lengthalong apical/basal axis vs. equatorial diameter), α; the fraction ofthe (disordered) ECM relative to total cell volume, ϕ; and thestiffness of the ECM compared to that of the cells (in terms of thestrength of ECM–ECM adhesion bonds relative to the forceexerted by growing and dividing cells), σ.Because development involves few cells (ruling out continuum
models) in a low-Reynolds-number environment where inertialforces play a negligible role (55, 56), we developed particle-basedsimulations akin to Brownian dynamics, but neglected the role ofthermal fluctuations, given the large size of the cells and aggregates(51). In the model, the ECM and cells were represented by a systemof interacting spherical particles (Fig. 6A). This particle representa-tion also allowed us to capture the discrete and variable nature of celldivision and the stochastic nature of ECM secretion, as well thepolarity of cell division and ECM secretion. Each cell in the modelwas composed of 3 linked spheres to capture cell shape and forcomputational tractability, with a small sphere representing the basalpole of the cell, a larger sphere representing the cell body, and thelargest representing the collar-exclusion region. Cells interacted ste-rically with one another. The ECM was modeled as a system of smallspheres with attractive interactions in order to capture the complexshapes the ECM can take on (SI Appendix, Fig. S4), as well as itsdeformability. ECM particles similarly shared attractive interactionswith the basal poles of cells. Cells in the model were allowed to dividestochastically, with the division plane orientation around the apico-basal axis determined by the previous division (consistent with ob-servations of rosette development from Fig. 3 and ref. 17), and ECMparticles were secreted stochastically at a constant rate from the basalpole of nondividing cells (see SI Appendix,Materials and Methods fora more detailed description of the model and simulations).Simulations with parameter values constrained by cell and
ECMmorphology data collected as part of this study showed thatthis simple model was sufficient to recapitulate rosette morpho-genesis, including the expected 3D transition at the 8-cell stage (SIAppendix, Fig. S8). Furthermore, simulations predicted that ro-sette morphogenesis should be robust to a range of scaled ECMstiffness values (Fig. 6 B–E and SI Appendix, Fig. S8) and to thevariability of cell divisions (SI Appendix, Fig. S8).Exploration of the effects of different parameter values
revealed that the model captures a range of different colonialmorphologies (Fig. 6 B and F). This space of forms and associatedmodel parameters constitutes a theoretical morphospace (57) ofECM-based colonial choanoflagellate morphologies. Interestingly,some of the simulated forms resembled colonies, such as tree-likestructures [found in Codosiga cymosa (58) and an uncharacterizedhypothesized Salpingoeca sp.; Fig. 6 G, t2 and t3] or cups [found inCodosiga umbellata (59) and Salpingoeca monosierra; Fig. 6 G, c4and c5], that have been reported in other choanoflagellate species(Fig. 6 F and G).We found that colony morphogenesis was sensitive to all 3 of
the dimensionless parameters, changes in each of which can leadto dramatic variations in predicted multicellular forms. For ex-ample, holding the other 2 parameters fixed, increase in ϕ alonewould be predicted to drive a change from rosettes to disks or cupsand from cones to trees (Fig. 6 C and D). This is consistent withour hypothesis that the constraint imposed by relative ECM vol-ume is a key factor in the transition from 2D to 3D morphologies.Colony morphogenesis was also affected by changes in σ; we foundthat reduced ECM stiffness is predicted to give rise to disks insteadof rosettes (Fig. 6D and E), which also supports our understandingthat the driving factor for rosette formation is the interaction be-tween ECM and cells. Finally, although the effect of changes in α
0
0.4
0.8
1.2
4 6 8 10 12Cells per rosette
Rel
axat
ion
velo
city
(µm
/s)
Maximum rosette width (µm)
Ros
ette
vol
ume
(µm
3 )
6 8 10 12 14101
102
103
4 6 8 10 120
0.2
0.4
0.6
0.8
1.0
Cells per rosette
Fla
tnes
s
C D
Untreated
1 mM SrCl25 mM SrCl2
B
0
200
400
600
4 6 8 10 12Cells per rosette
Ros
ette
vol
ume
(µm
3 )
4-cell
12-cellA
Fig. 5. Material properties of the ECM affect morphogenesis. Treatment ofrosettes with SrCl2, which stiffens hydrogels by increasing cross-linkingdensity (50–54), alters rosette morphogenesis. (A) Cells were packed moretightly in SrCl2-treated rosettes, leading to differences in rosette size andshape (also see SI Appendix, Fig. S7). The scaling relationship betweenmaximum rosette width and volume revealed that SrCl2 treatment abolishedthe transition to approximately isotropic growth at the 8-cell stage (scalingexponents for ≥8-cell rosettes of 1.1 with 95% CI [0.8, 1.4] and 1.6 with 95%CI [1.2, 2.0] for 1 and 5 mM SrCl2 treatments, respectively). Log–log plot ofrosette volume vs. maximum rosette width represents average values forrosette cell-number classes from 4 to 12 cells per rosette. Error bars are SEM.Rosette volume and maximum width are significantly smaller under SrCl2treatment (P < 0.03 for either maximum width or volume or both for allrosette cell numbers under both SrCl2 concentrations with no difference incell volume; see also B). (B) Rosettes became increasingly compact whentreated with increasing concentrations of SrCl2, as highlighted by a plot ofrosette volume vs. cells per rosette (reanalysis of data from A). While rosettesize decreased with increasing SrCl2 treatment, cell size remained unaffected(105.9 ± 8.8 μm3, 108.3 ± 8.0 μm3, and 115.3 ± 5.9 μm3 for untreated, 1 mMSrCl2, and 5 mM SrCl2, respectively, where reported values are mean ± SEM).Points represent means; error bars are SEM. (C) Quantification of rosetteflatness (as in Fig. 1) showed that SrCl2 shifts the 3D growth transition tolower cell numbers. At the highest SrCl2 concentration, the transition oc-curred by the 5-cell stage (compared to untreated rosettes, flatness wasfound to be significantly lower at the 4-cell stage; P < 0.03 by Wilcoxon ranksum tests). For A–C, results were from n = 100 rosettes pooled from 3 in-dependent experiments, with ≥8 rosettes for each size class for both SrCl2concentrations. Data for untreated rosettes were from Fig. 2 D and E. (D)Relative residual stress, as measured by relaxation velocity after laser abla-tion of single cells (as in Fig. 4D), increased significantly in rosettes of 4 to7 cells under 5 mM SrCl2 treatment compared to untreated rosettes (P <0.0005 by Wilcoxon rank sum test). As in the experiments in Fig. 4D, re-laxation in SrCl2 treated cells was always toward the site of ablation, in-dicating that cells were under compressive stress. These data demonstratethat increased residual stress is correlated with altered rosette morphology.Points represent means; error bars represent SEM from 41 total measure-ments pooled from 2 experiments, with ≥4 rosettes from each size class.
1308 | www.pnas.org/cgi/doi/10.1073/pnas.1909447117 Larson et al.
Dow
nloa
ded
by g
uest
on
Dec
embe
r 4,
202
1

0.02 0.06 0.10 0.14
0.6
0.7
0.8
0.9
0.5
Φ
α
σ = 0.6
0.6 0.80.7 0.9
0.2
0.8
0.6
0.4
1.0
0.5α
Φ = 0.04C
0.060.02 0.10 0.14
0.6
0.8
1.0
0.2
0.4
Φ
σ
α = 0.8D E
A
Cell
ECM
B
0.4
0.6
0.8
1.0
Sca
led
EC
M s
tiffn
ess
(σ)
0.060.14
0.10Cell aspect ratio(α)
0.02
Relative ECM volume
(Φ)
0.2
0.80.7
0.60.5
0.9
Rosettes
Disks
Trees
Cups andcones
Rosette Disk Disk TreeCup Cone Cup
Rosettes Disks TreesCups and cones
F
G
r1 d1 d2 c1 c2 c3 t1
r2
r3
d3
d4
c4
c5
t2
t3
r1
d1
d2
c1
c2
c3
t1
σ
Fig. 6. A simple model shows that amount of ECM, cell aspect ratio, and ECM stiffness tune multicellular morphogenesis. The model incorporates simple cellularand physical interactions, including ECM secretion and cell division, cell–cell steric interactions, and ECM adhesion. Three main parameters describe the system: cellaspect ratio, α; scaled ECM stiffness, σ; and relative ECM volume, ϕ. (A) A DIC image of a choanoflagellate (from ref. 16) next to a simulation snapshot to illustratehow cell geometry is modeled by 3 linked spheres (gray), and ECM is modeled by small spheres (green) secreted at the basal pole of cells. In the model, cells interactsterically with one another, and ECM spheres have adhesive interactions with one another and with basal cell particles. (Scale bar, 5 μm.) (B) The morphospace ofECM-based colonial morphologies generated by simulations can be broken into 4 regions: rosettes, disks, cups and cones, and trees. Lowercase letters indicate theregion in the morphospace occupied by the corresponding simulated colony in F. (C–E) Orthogonal planes through the displayedmorphospace, with the parameterof fixed value noted above each plot, illustrate how changing 2 parameters while keeping the 3rd fixed affects morphology. Colors indicate morphologicalclassification as in B. (C) Scaled ECM stiffness is constant (σ = 0.6). (D) Cell aspect ratio is constant (α = 0.8). (E) Relative ECM volume is constant (ϕ = 0.04). (F)Representative simulated colonies for each of the regions are displayed in 2 orthogonal views (r1 = rosette with α = 0.7, σ = 0.8, and ϕ = 0.04; d1 = disk with α = 0.75,σ = 0.85, and ϕ = 0.075; d2 = disk with α = 0.8, σ = 0.15, and ϕ = 0.02; c1 = cone with α = 0.55, σ = 0.5, and ϕ = 0.08; c2 = cup with α = 0.6, σ = 0.2, and ϕ = 0.09; c3 =cup with α = 0.9, σ = 0.12, and ϕ = 0.13; and t1 = tree with α = 0.65, σ = 0.9, and ϕ = 0.12). (G) Simulated colonial morphologies are reminiscent of morphologies ofcolonial choanoflagellates found in nature. r2, Codonosiga botrytis (79). r3, S. rosetta (80). d3, Proterospongia haeckelii (81). d4, Salpingoeca amphoridium (10). c4,Codosiga umbellata (59). c5, S. monosierra (82). t2, Codosiga cymosa (58). t3, Uncharacterized environmental isolate from Curaçao. Reprinted from refs. 58, 59,and 78. Reprinted from ref. 79, which is licensed under CC BY 4.0. Reprinted from ref. 10. Copyright (2008) National Academy of Sciences, U.S.A. Republishedfrom ref. 83 with permission of American Microscopical Society; permission conveyed through Copyright Clearance Center, Inc. (Scale bars, 10 μm.)
Larson et al. PNAS | January 21, 2020 | vol. 117 | no. 3 | 1309
BIOPH
YSICSAND
COMPU
TATIONALBIOLO
GY
EVOLU
TION
Dow
nloa
ded
by g
uest
on
Dec
embe
r 4,
202
1

was subtler, we saw a clear transition from disks to cups/cones forlow values of σ, and for a small range of ϕ, there was also a tran-sition from disks to rosettes, validating our hypothesis that the dif-ferences in cell aspect ratio observed across choanoflagellate speciescan constrain the morphology space accessible to the colony.Together these results demonstrate that basal secretion of a
shared ECM constitutes a robust, yet flexible, mechanism forregulating multicellular morphogenesis. Furthermore, these resultsmade specific predictions about different colony morphologiescorresponding to specific cell morphologies and relative ECMvolumes and stiffnesses. We did find that simulations failed torecapitulate all aspects of rosette morphogenesis, most saliently,the growth scaling (Fig. 2D) and the absolute magnitudes of flat-ness and sphericity (Fig. 2E and SI Appendix, Fig. S8), likely as ourmodel is a coarse-grained one, although simulations were consis-tent with SrCl2 treatment experiments in that increased scaledECM stiffness was predicted to make rosettes of lower cell numbermore 3D (SI Appendix, Fig. S8). We expect that a more detailedtreatment of the mechanics of cells and ECM may capture theseaspects of rosette morphogenesis more accurately, but such a de-tailed model is beyond the scope of the present study.
DiscussionOur quantitative analyses, experimental perturbations, and sim-ulations allowed us to understand the process by which singlecells of S. rosetta give rise to multicellular rosettes. We found thatthe earliest stages of rosette morphogenesis proceed through 2Danisotropic growth, which is stereotypically followed by a transitionto 3D isotropic growth. In particular, we found that the basal ECMsecreted by cells during rosette development physically constrainsproliferating cells and thereby drives a stereotyped morphogeneticprogression in the absence of strict cell-lineage specification anddivision timing. Simulations showed that this simple mechanism,the regulated basal secretion of ECM, is sufficient to not onlyrecapitulate rosette morphogenesis, but to yield a morphospacethat can not only explain the multicellular morphology of S. rosetta,but also that of other species of colonial choanoflagellates. Theseresults emphasize the importance of the choanoflagellate ECM formorphogenesis and should encourage future studies of its com-position, physical properties, and regulation.The importance of the basal ECM revealed in this study may
generalize to other choanoflagellate species and colonial mor-phologies in terms of the 3 dimensionless parameters that char-acterize the morphospace—the shape of the cells, the amount ofthe ECM (relative to the cells), and the stiffness of the ECM(relative to that of the cells). Indeed, our simulations predict thatdifferences in ECM levels (resulting from differing rates of bio-synthesis, secretion, or degradation), cell shape, and ECM stiffnessrelative to cells are sufficient to explain the existence of radicallydifferent colony morphologies across diverse choanoflagellates.Measurements and comparisons of ECM levels (ϕ), cell shape (α),and ECM stiffness (σ) in diverse colonial choanoflagellates will becrucial to validate the model, and deviations from the predictionsof the model could point to additional regulatory mechanisms.From a broader perspective, rosette morphogenesis shows
interesting parallels to mechanisms underlying morphogenesis indiverse other taxa. In terms of physical mechanisms, the con-strained proliferation of cells that occurs during rosette de-velopment generates crowding stresses like those that regulatemorphogenesis by animal epithelia (60, 61), snowflake yeast
(43), and bacterial biofilms (26). In epithelia, compaction ofcells due to crowding has been proposed as a general signal forcellular processes underlying tissue homeostasis, such as apoptosisand extrusion (62–65). Further, crowding of proliferating cells canproduce a jamming-like behavior, characterized by the accumula-tion of residual stress (42, 43), that has been proposed as a genericconstraint on the development of multicellular systems with fixedcell geometry (43). Due to the generality of physical constraints oncell packing, it is plausible that such phenomena acted both asconstraints and regulatory mechanisms in the development andmorphogenesis of early animals and their ancestors.Cellular mechanisms of rosette morphogenesis are also shared
with other multicellular systems. Our results demonstrate thatthe regulation of basal ECM sculpts the multicellular morphol-ogy of rosettes. Thus, our biophysical studies have converged onresults from genetic screens in S. rosetta that implicated animalECM gene homologs in the regulation of rosette development,including a C-type lectin (18) and predicted glycosyltransferases(19). The basal ECM of rosettes is reminiscent of the basallamina, a basally secreted layer of ECM that underpins animalepithelia and regulates tissue morphogenesis by constraining cellproliferation (29), including in Drosophila wing and egg-chamberdevelopment (60, 66, 67), branching growth during lung andsalivary-gland development (68, 69), notochord expansion (70),lumen elongation (71), and tumor growth in mammary epithelia(51). The ECM also sculpts morphogenesis in Volvox, in whichdefects in ECM composition disrupt morphogenesis (72, 73), andin bacterial biofilms, in which the ECM can constrain cells andthereby drive 3D morphogenesis (26, 74). Remarkably, somebacteria form multicellular rosettes in a process that is mediatedby basal ECM secretion (75, 76).Altogether, the principles that we can glean from the sim-
plicity of choanoflagellate morphogenesis hold the promise ofrevealing general principles by which biological and physicalmechanisms shape morphogenesis more broadly.
Materials and MethodsSee SI Appendix for a detailed account of materials and methods. Briefly,S. rosetta was grown under standard culture conditions, either as chains orrosettes (18, 23). Rosette development from single cells was induced by theaddition of outer membrane vesicles from A. machipongonensis (23). Elec-tron microscopy was performed as described (16). The number of cells inrosettes was determined by manual counting. The morphology of rosettesand ECM were quantified from 3D reconstructions of confocal z stacks byusing an imaging pipeline developed for this study. Lineage analyses wereperformed by manually tracking time-lapse phase contrast and differentialinterference contrast (DIC) images from time-lapse microscopy of developingrosettes and chains. Relaxation velocities were measured by 2D PIV of singleconfocal planes following laser ablation. Cells and ECM in simulations weremodeled as spherical particles with tunable adhesive and repulsive interac-tions and followed Brownian dynamics (77).
Data Availability. Code for simulations is available at https://github.com/truizherrero/choanoflagellate_colonies. All other data are available upon request.
ACKNOWLEDGMENTS. We thank Kent McDonald and Reena Zalpuri (Uni-versity of California, Berkeley Electron Microscopy Laboratory) for assistancewith transmission electron microscopy sample preparation and imaging;Mary West of the California Institute for Regenerative Medicine/CaliforniaInstitute for Quantitative Biosciences Shared Stem Cell Facility for access tothe laser ablation microscope; the late George Oster and Danny Wells forhelpful discussions; Debbie Maizels for assistance with the figures; and mem-bers of the N.K. laboratory for critical feedback and stimulating discussions.
1. W. Harvey, Exercitationes de Generatione Animalium: Quibus Accedunt Quaedam dePartu, de Membranis ac Humoribus Uteri & de Conceptione (Typis Du-Gardianis,London, 1651).
2. S. F. Gilbert, Developmental Biology (Sinauer Associates, Sunderland, MA, 2000).3. G. Golling et al., Insertional mutagenesis in zebrafish rapidly identifies genes essential
for early vertebrate development. Nat. Genet. 31, 135–140 (2002).4. Z. Xue et al., Genetic programs in human and mouse early embryos revealed by
single-cell RNA sequencing. Nature 500, 593–597 (2013).
5. B.-C. Chen et al., Lattice light-sheet microscopy: Imaging molecules to embryos at highspatiotemporal resolution. Science 346, 1257998 (2014).
6. P. J. Keller, A. D. Schmidt, J. Wittbrodt, E. H. K. Stelzer, Reconstruction of zebrafish early em-bryonic development by scanned light sheet microscopy. Science 322, 1065–1069 (2008).
7. M. Behrndt et al., Forces driving epithelial spreading in zebrafish gastrulation. Science338, 257–260 (2012).
8. M. Mayer, M. Depken, J. S. Bois, F. Jülicher, S. W. Grill, Anisotropies in cortical tensionreveal the physical basis of polarizing cortical flows. Nature 467, 617–621 (2010).
1310 | www.pnas.org/cgi/doi/10.1073/pnas.1909447117 Larson et al.
Dow
nloa
ded
by g
uest
on
Dec
embe
r 4,
202
1

9. A. Bailles et al., Transcriptional initiation and mechanically driven self-propagation ofa tissue contractile wave during axis elongation. bioRxiv:430512 (29 September 2018).
10. M. Carr, B. S. C. Leadbeater, R. Hassan, M. Nelson, S. L. Baldauf, Molecular phylogenyof choanoflagellates, the sister group to Metazoa. Proc. Natl. Acad. Sci. U.S.A. 105,16641–16646 (2008).
11. N. King et al., The genome of the choanoflagellate Monosiga brevicollis and theorigin of metazoans. Nature 451, 783–788 (2008).
12. I. Ruiz-Trillo, A. J. Roger, G. Burger, M. W. Gray, B. F. Lang, A phylogenomic in-vestigation into the origin of metazoa. Mol. Biol. Evol. 25, 664–672 (2008).
13. B. S. C. Leadbeater, The Choanoflagellates (Cambridge University Press, Cambridge,UK, 2015).
14. T. Brunet, N. King, The origin of animal multicellularity and cell differentiation. Dev.Cell 43, 124–140 (2017).
15. B. S. C. Leadbeater, Life-history and ultrastructure of a new marine species ofProterospongia (Choanoflagellida). J. Mar. Biol. Assoc. U. K. 63, 135 (1983).
16. M. J. Dayel et al., Cell differentiation and morphogenesis in the colony-formingchoanoflagellate Salpingoeca rosetta. Dev. Biol. 357, 73–82 (2011).
17. S. R. Fairclough, M. J. Dayel, N. King, Multicellular development in a choanoflagellate.Curr. Biol. 20, R875–R876 (2010).
18. T. C. Levin, A. J. Greaney, L. Wetzel, N. King, The Rosetteless gene controls devel-opment in the choanoflagellate S. rosetta. eLife 3, e04070 (2014).
19. L. A. Wetzel et al., Predicted glycosyltransferases promote development and preventspurious cell clumping in the choanoflagellate S. rosetta. eLife 7, e41482 (2018).
20. J. E. Sulston, E. Schierenberg, J. G. White, J. N. Thomson, The embryonic cell lineage ofthe nematode Caenorhabditis elegans. Dev. Biol. 100, 64–119 (1983).
21. S. P. Leys, A. V. Ereskovsky, Embryogenesis and larval differentiation in sponges. Can.J. Zool. 84, 262–287 (2006).
22. W. H. Lewis, E. S. Wright, On the Early Development of the Mouse Egg (CarnegieInstitution of Washington, Washington, DC, 1935).
23. R. A. Alegado et al., A bacterial sulfonolipid triggers multicellular development in theclosest living relatives of animals. eLife 1, e00013 (2012).
24. A. Woznica et al., Bacterial lipids activate, synergize, and inhibit a developmentalswitch in choanoflagellates. Proc. Natl. Acad. Sci. U.S.A. 113, 7894–7899 (2016).
25. E. Hannezo, J. Prost, J.-F. Joanny, Theory of epithelial sheet morphology in threedimensions. Proc. Natl. Acad. Sci. U.S.A. 111, 27–32 (2014).
26. J. Yan, A. G. Sharo, H. A. Stone, N. S. Wingreen, B. L. Bassler, Vibrio cholerae biofilmgrowth program and architecture revealed by single-cell live imaging. Proc. Natl.Acad. Sci. U.S.A. 113, E5337–E5343 (2016).
27. T. Savin et al., On the growth and form of the gut. Nature 476, 57–62 (2011).28. G. Forgács, S. A. Newman, Biological Physics of the Developing Embryo (Cambridge
University Press, Cambridge, UK, 2005).29. D. E. Ingber, Mechanical control of tissue morphogenesis during embryological de-
velopment. Int. J. Dev. Biol. 50, 255–266 (2006).30. U. Deppe et al., Cell lineages of the embryo of the nematode Caenorhabditis elegans.
Proc. Natl. Acad. Sci. U.S.A. 75, 376–380 (1978).31. J. Newport, M. Kirschner, A major developmental transition in early Xenopus em-
bryos: I. Characterization and timing of cellular changes at the midblastula stage. Cell30, 675–686 (1982).
32. D. A. Kane, C. B. Kimmel, The zebrafish midblastula transition. Development 119,447–456 (1993).
33. B. A. Edgar, P. H. O’Farrell, Genetic control of cell division patterns in the Drosophilaembryo. Cell 57, 177–187 (1989).
34. K. Bi�sová, V. Zachleder, Cell-cycle regulation in green algae dividing by multiple fis-sion. J. Exp. Bot. 65, 2585–2602 (2014).
35. J. G. Umen, B. J. S. C. Olson, Genomics of volvocine algae. Adv. Bot. Res. 64, 185–243(2012).
36. G. Matt, J. Umen, Volvox: A simple algal model for embryogenesis, morphogenesisand cellular differentiation. Dev. Biol. 419, 99–113 (2016).
37. D. Laundon, B. T. Larson, K. McDonald, N. King, P. Burkhardt, The architecture of celldifferentiation in choanoflagellates and sponge choanocytes. PLoS Biol. 17, e3000226(2019).
38. M. C. Roque-Barreira, F. Praz, L. Halbwachs-Mecarelli, L. J. Greene, A. Campos-Neto,IgA-affinity purification and characterization of the lectin jacalin. Braz. J. Med. Biol.Res. 19, 149–157 (1986).
39. C. S. O’Hern, S. A. Langer, A. J. Liu, S. R. Nagel, Random packings of frictionlessparticles. Phys. Rev. Lett. 88, 075507 (2002).
40. C. S. O’Hern, L. E. Silbert, A. J. Liu, S. R. Nagel, Jamming at zero temperature and zeroapplied stress: The epitome of disorder. Phys. Rev. E Stat. Nonlin. Soft Matter Phys. 68,011306 (2003).
41. X. Cheng, Experimental study of the jamming transition at zero temperature. Phys.Rev. E 81, 031301 (2010).
42. M. Delarue et al., Self-driven jamming in growing microbial populations. Nat. Phys.12, 762–766 (2016).
43. S. Jacobeen et al., Cellular packing, mechanical stress and the evolution of multicel-lularity. Nat. Phys. 14, 286–290 (2018).
44. M. L. Manning, R. A. Foty, M. S. Steinberg, E.-M. Schoetz, Coaction of intercellularadhesion and cortical tension specifies tissue surface tension. Proc. Natl. Acad. Sci.U.S.A. 107, 12517–12522 (2010).
45. X. Ma, H. E. Lynch, P. C. Scully, M. S. Hutson, Probing embryonic tissue mechanics withlaser hole drilling. Phys. Biol. 6, 036004 (2009).
46. M. S. Hutson et al., Combining laser microsurgery and finite element modeling toassess cell-level epithelial mechanics. Biophys. J. 97, 3075–3085 (2009).
47. M. Rauzi, P.-F. Lenne, Cortical forces in cell shape changes and tissue morphogenesis.Curr. Top. Dev. Biol. 95, 93–144 (2011).
48. I. Bonnet et al., Mechanical state, material properties and continuous description ofan epithelial tissue. J. R. Soc. Interface 9, 2614–2623 (2012).
49. M. S. Hutson et al., Forces for morphogenesis investigated with laser microsurgeryand quantitative modeling. Science 300, 145–149 (2003).
50. C. K. Kuo, P. X. Ma, Ionically crosslinked alginate hydrogels as scaffolds for tissueengineering: Part 1. Structure, gelation rate and mechanical properties. Biomaterials22, 511–521 (2001).
51. O. Chaudhuri et al., Extracellular matrix stiffness and composition jointly regulate theinduction of malignant phenotypes in mammary epithelium. Nat. Mater. 13, 970–978(2014).
52. E. A. Ryan, L. F. Mockros, J. W. Weisel, L. Lorand, Structural origins of fibrin clotrheology. Biophys. J. 77, 2813–2826 (1999).
53. I. C. Wilkie et al., Mechanical adaptability of a sponge extracellular matrix: Evidencefor cellular control of mesohyl stiffness in Chondrosia reniformis Nardo. J. Exp. Biol.209, 4436–4443 (2006).
54. J. Mo et al., Interfibrillar stiffening of echinoderm mutable collagenous tissue dem-onstrated at the nanoscale. Proc. Natl. Acad. Sci. U.S.A. 113, E6362–E6371 (2016).
55. E. M. Purcell, Life at low Reynolds number. Am. J. Phys. 45, 3–11 (1977).56. J. J. L. Higdon, The generation of feeding currents by flagellar motions. J. Fluid Mech.
94, 305 (1979).57. D. M. Raup, Geometric analysis of shell coiling: Coiling in ammonoids. JPaleo 41,
43–65 (1967).58. G. N. Calkins, Biology (Henry Holt and Company, New York, 1914).59. W. Saville-Kent, A Manual of the Infusoria: Including a Description of All Known
Flagellate, Ciliate, and Tentaculiferous Protozoa, British and Foreign, and an Accountof the Organization and the Affinities of the Sponges (David Bogue, London, 1881).
60. L. Hufnagel, A. A. Teleman, H. Rouault, S. M. Cohen, B. I. Shraiman, On the mecha-nism of wing size determination in fly development. Proc. Natl. Acad. Sci. U.S.A. 104,3835–3840 (2007).
61. A. E. Shyer et al., Villification: How the gut gets its villi. Science 342, 212–218 (2013).62. N. I. Petridou, Z. Spiró, C.-P. Heisenberg, Multiscale force sensing in development. Nat.
Cell Biol. 19, 581–588 (2017).63. B. I. Shraiman, Mechanical feedback as a possible regulator of tissue growth. Proc.
Natl. Acad. Sci. U.S.A. 102, 3318–3323 (2005).64. C. Guillot, T. Lecuit, Mechanics of epithelial tissue homeostasis and morphogenesis.
Science 340, 1185–1189 (2013).65. E. Moreno, L. Valon, F. Levillayer, R. Levayer, Competition for space induces cell
elimination through compaction-driven ERK downregulation. Curr. Biol. 29, 23–34.e8(2019).
66. J. C. Pastor-Pareja, T. Xu, Shaping cells and organs in Drosophila by opposing roles offat body-secreted collagen IV and perlecan. Dev. Cell 21, 245–256 (2011).
67. J. Crest, A. Diz-Muñoz, D.-Y. Chen, D. A. Fletcher, D. Bilder, Organ sculpting by pat-terned extracellular matrix stiffness. eLife 6, e24958 (2017).
68. K. A. Moore et al., Control of basement membrane remodeling and epithelialbranching morphogenesis in embryonic lung by Rho and cytoskeletal tension. Dev.Dyn. 232, 268–281 (2005).
69. J. S. Harunaga, A. D. Doyle, K. M. Yamada, Local and global dynamics of the basementmembrane during branching morphogenesis require protease activity and actomyo-sin contractility. Dev. Biol. 394, 197–205 (2014).
70. D. S. Adams, R. Keller, M. A. Koehl, The mechanics of notochord elongation,straightening and stiffening in the embryo of Xenopus laevis. Development 110, 115–130 (1990).
71. Q. Li et al., Extracellular matrix scaffolding guides lumen elongation by inducinganisotropic intercellular mechanical tension. Nat. Cell Biol. 18, 311–318 (2016).
72. A. Hallmann, D. L. Kirk, The developmentally regulated ECM glycoprotein ISG plays anessential role in organizing the ECM and orienting the cells of Volvox. J. Cell Sci. 113,4605–4617 (2000).
73. N. Ueki, I. Nishii, Controlled enlargement of the glycoprotein vesicle surrounding avolvox embryo requires the InvB nucleotide-sugar transporter and is required fornormal morphogenesis. Plant Cell 21, 1166–1181 (2009).
74. K. Drescher et al., Architectural transitions in Vibrio cholerae biofilms at single-cellresolution. Proc. Natl. Acad. Sci. U.S.A. 113, E2066–E2072 (2016).
75. R. L. Moore, K. C. Marshall, Attachment and rosette formation by hyphomicrobia.Appl. Environ. Microbiol. 42, 751–757 (1981).
76. O. Frank et al., Plasmid curing and the loss of grip–the 65-kb replicon of Phaeobacterinhibens DSM 17395 is required for biofilm formation, motility and the colonizationof marine algae. Syst. Appl. Microbiol. 38, 120–127 (2015).
77. T. Ruiz-Herrero, choanoflagellate_colonies. GitHub. https://github.com/truizherrero/choanoflagellate_colonies. Deposited 3 June 2019.
78. G. Voronoi, Nouvelles applications des paramètres continus à la théorie des formesquadratiques. Premier mémoire. Sur quelques propriétés des formes quadratiquespositives parfaites. J. Reine Angew. Math. 133, 97–178 (1908).
79. E. Haeckel, Kunstformen der Natur (Verlag des Bibliographischen Instituts, Leipzig,Germany, 1904).
80. D. J. Richter, P. Fozouni, M. B. Eisen, N. King, Gene family innovation, conservationand loss on the animal stem lineage. eLife 7, e34226 (2018).
81. M. Ertl, Zur taxonomie der Gattung ProterospongiaKent. Arch. Protistenkd. 124, 259–266 (1981).
82. K. H. Hake, “The microbiome of a colonial choanoflagellate from Mono Lake, CA”PhD dissertation, University of California, Berkeley (2019).
83. J. B. Lackey, Morphology and biology of a species of Protospongia. Trans. Am. Mi-crosc. Soc. 78, 202–206 (1959).
Larson et al. PNAS | January 21, 2020 | vol. 117 | no. 3 | 1311
BIOPH
YSICSAND
COMPU
TATIONALBIOLO
GY
EVOLU
TION
Dow
nloa
ded
by g
uest
on
Dec
embe
r 4,
202
1