biosinitialization osloadermainpathbootpostboot bios hands control to winload.exe winload.exe hands...
TRANSCRIPT


On/Off ScenariosPerformance Analysis and Diagnosis Overview
Sylvain GoyetteProgram ManagerMicrosoft Corporation

Agenda
On/Off TransitionsWindows® Performance Tools (WPT) UsageBoot Analysis Shutdown Analysis Sleep Analysis Call to ActionResources

Objectives
Understand functional behavior of on/off scenarios Describe the usage of WPT to generate and analyze performance tracesIdentify performance issues for boot, shutdown, and sleep transitions
On/Off Transitions
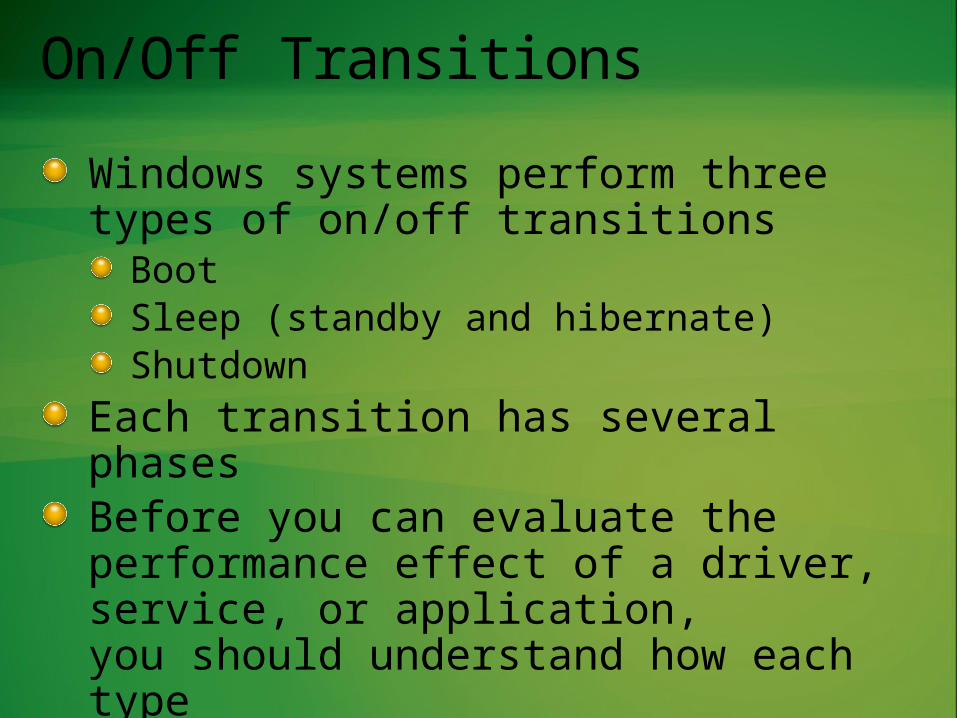
Windows systems perform three types of on/off transitions
BootSleep (standby and hibernate)Shutdown
Each transition has several phases Before you can evaluate the performance effect of a driver, service, or application, you should understand how each type of on/off transition works
On/Off Transitions: Boot
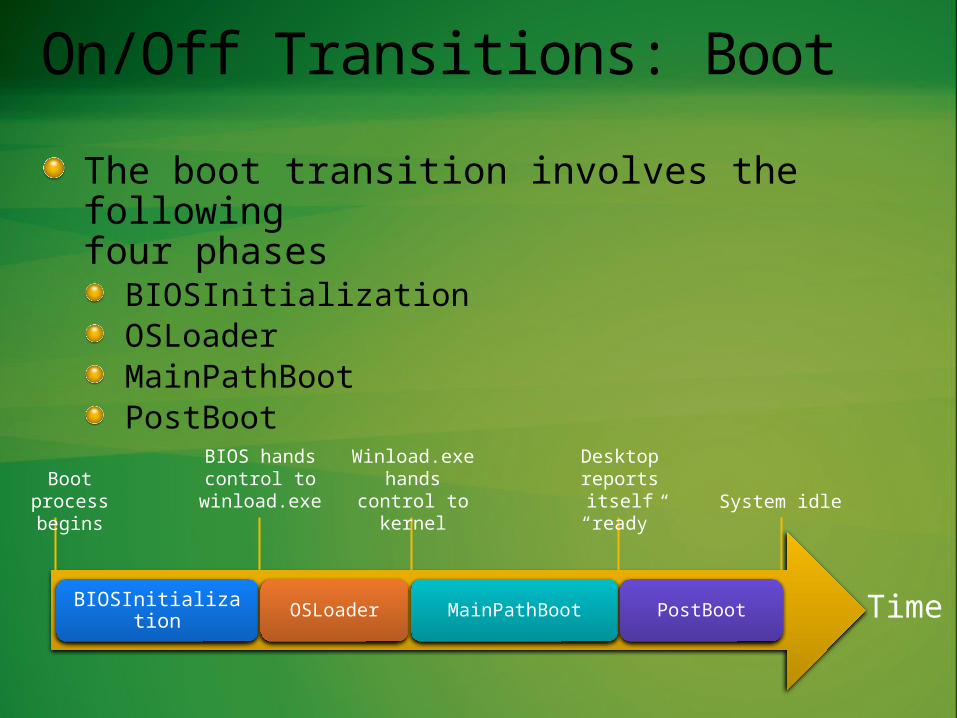
The boot transition involves the following four phases
BIOSInitializationOSLoaderMainPathBootPostBoot
BIOSInitialization OSLoader MainPathBoot PostBoot Time
Boot process begins
BIOS hands control to
winload.exe
Winload.exe hands control
to kernel
Desktop reports itself
“ready” System idle

On/Off Transitions: Boot Early Phases
BIOSInitializationPlatform firmware identifies and initializes hardware devices, and then runs a power-on self-test (POST)Target time is fewer than 10 seconds
OSLoaderWindows loader loads essential system drivers (BOOT_START) that are required to read minimal data from the diskThe loader initializes the system so the Windows kernel can execute

On/Off Transitions: Boot Decomposition
MainPathBoot Phase
BIOSInitialization OSLoader MainPathBoot PostBoot Time
PreSMSS SMSSInit WinLogonInit ExplorerInit
Winload.exe passes control
to kernal
Kernel passes control to Smss.exe
SCM started, Winlogon initialized
Explorer.exe is started
Desktop is ready and displayed
MainPathBoot Detail

On/Off Transitions: MainPathBoot
PreSMSSInitializes internal data structures and componentsInitializes the BOOT_START driversDetects additional system devices and loads their driversSome background Plug and Play activity overlaps with SMSSInit
SMSSInitInitializes the registryInitializes the video session (calls graphics adapter drivers)Starts the subsystem processes

On/Off Transitions: MainPathBoot
WinLogonInitDisplays the user logon screenStarts services that are handled by Service Control ManagerRuns the Group Policy scripts
ExplorerInitCreates the Desktop Window Manager (DWM) processStarts applications that are specified by Run and RunOnce keysIs CPU intensive; delays are mostly caused by contention induced by background activity

On/Off Transitions: PostBoot
PostBootIncludes all background activity that occurs after the desktop is readyLets users interact with the desktop, but the system might still be starting services, tray icons, and application code in the backgroundIs considered complete when Xperf data indicates that background activity has dropped to a reasonably idle level (10 seconds of accumulated idle time)

On/Off Transitions: Sleep – Suspend
The suspend part of sleep has five phasesSuspendAppsSuspendServicesQueryDevicesSuspendDevicesHiberFileWrite (optional)
SuspendApps SuspendServices QueryDevices SuspendDevices HiberfileWrite
User initiates suspend
Last application has finished
processing the request
Last service has finished
processing the request
Last device has finished
processing the request
Last device has been
suspendedSystem goes
to sleep

On/Off Transitions: Sleep – Suspend
SuspendAppsSends a suspend notification to all windowed applications through the Power service Serially sends these notifications; applications have a maximum of 2 seconds to process them
SuspendServicesSends power notifications only to services that have opted to receive them Serially sends these notifications

On/Off Transitions: Sleep – Suspend
QueryDevicesSends an IRP_MN_QUERY_POWER request for the power state so that devices can prepare for the power state change
SuspendDevicesSends an IRP_MN_SET_POWER request for a lower system power stateDevice drivers must then save appropriate device context and prepare the device for the system to enter sleep or hibernate

On/Off Transitions: Sleep – Resume
The resume part of sleep has three phasesBIOSInitialization (or HiberfileRead)ResumeDevicesPostResume
BIOSInitialization ResumeDevices PostResume
Processor begins power-on transition
Services and applications are
resumedSystem has
reached idle state
BIOS hands control to OSDevices are resume by kernel power manager

On/Off Transitions: Sleep – Resume
ResumeDevicesCompletes all device resume operations before the system can restore the desktop
Significantly affects performance if there is presence of excessive CPU resource consumption or long deferred procedure calls (DPCs)
PostResumeCovers the time that follows the resume transition; the goal is to get the system to an idle state as quickly as possible

On/Off Transitions: Shutdown
The shutdown transition has three phasesUserSessionShutdownSystemSessionShutdownKernelShutdown
UserSessionShutdown SystemSessionShutdown KernelShutdown
User initiates system
shutdownServices have
been shut downRest of the system
has been shut downUser-mode application have been shut down

On/Off Transitions: Shutdown
UserSessionShutdownShuts down all applications that are running in the user session – handled by the Client/Server Runtime Server Subsystem (Csrss.exe) Performs a handshake with all applications
SystemSessionShutdownPreshutdown notifications – shuts down in serial order all services that registered to receive preshutdown notificationsShutdown notifications – shuts down in parallel all services that registered to receive shutdown notifications

WPT Usage
The Windows Performance Tools (WPT) Kit contains performance analysis toolsThe WPT Kit is useful to a broad audienceIt is designed for measuring and analyzing system and application performance on Windows Server® 2008 and Windows 7WPT is available at
http://msdn.microsoft.com/en-us/performance/cc825801.aspx

WPT Usage: Tools Description
The WPT Kit is released as an MSI installer, one per architecture, and currently contains the Performance Analyzer tool suite
Tool Name File Name Function
Trace Capture, Processing, and Command-Line Analysis tool
Xperf.exe Captures traces, post-processes them for use on any machine, and supports command-line (action-based) trace analysis
Visual Trace Analysis tool Xperfview.exe Presents trace content in the form of interactive graphs and summary tables
On/Off Transition Trace Capture tool
Xbootmgr.exe Automates on/off state transitions and captures traces during these transitions

WPT Usage: Procedure
Step 1. Get a baseline measurement traceUse a retail installation of Windows that has up-to-date drivers for all devices but no additional features or applications
Step 2. Modify baseline or install custom image
Add devices, applications, and other system extensions one at a time so that you can evaluate their effects on on/off transition times
Step 3. Get a modified image trace

WPT Usage: Trace Creation and Analysis
How to generate and analyze a trace
Power state transition to examine:
To create the trace, type: xbootmgr followed by:
To process the trace, type: xperf –i filename followed by:
Boot -trace boot -a boot Shutdown -trace shutdown -a shutdown Suspend and resume -trace standby -a suspend Hibernate and resume -trace hibernate -a suspend Boot and shutdown cycle -trace rebootCycle -a boot
-a shutdown(on two separate command lines)

WPT Usage: Tracing Options
There are two types of tracesTiming traces
Timing traces provide an excellent low-impact way to measure on/off transition performance on a system-traceFlags base+cswitch+compact_cswitch
Analysis tracesThey require significant instrumentation; the instrumentation allows more efficient analysis of the root causes of issues-traceFlags latency+dispatcher-stackWalk Profile+CSwitch+ReadyThread

WPT Usage: Reducing Variance
To reduce the variance in test resultsUse the ‑prepsystem command-line option to Xbootmgr.exe so that the prefetcher can fully self-optimizeDelete all persistent network connectionsLeave wireless adapters enabled but not connected to any networkDisable User Account Control (UAC) and configure user profiles for auto-logonBe aware of test-signing performance impactLet the system idle for 15 minutes to ensure Catalog Integrity cache creation

Boot Transition: Target Boot Times
Target retail Windows 7 boot timesExcludes BIOS Init timeBest-in-class timings
System type General specifications Optimized boot time (seconds)
High-performance desktop Dual-core 2.8-gigahertz (GHz) CPU10,000-RPM disk3-gigabyte (GB) memory
10.0
Thin laptop, solid-state disk (SSD) Dual-core 2-GHz CPUSSD3-GB memory
12.2
Thin laptop Dual-core 2.4-GHz CPU5,400-RPM disk3-GB memory
19.3
Netbook 1.6-GHz CPU5,400-RPM disk1-GB memory
33.5

Boot Transition: XML Summary
Generate XML summaryxperf -i trace.etl -o summary.xml -a boot
When you examine the XML report, remember
Time unit appears in the timeFormat line at the top of the XML summary reportMost intervals and operations are described by a trio of start time, end time, and lifetime

Boot Transition: XML Summary
Boot Summary XML Report

Boot Transition: Methodology
Run several traces to reduce the impact of stray events Determine the average overall boot time and the relative subphase times for both the baseline and modified traceIdentify regressions for
PnP ActivitiesServicesSubphases
If you notice that one particular phase has an increased time, expand its timing node to view CPU and disk statistics

Boot Transition: Per-Phase Usage
Determine per-phase CPU and disk usage

Boot Transition: Plug and Play
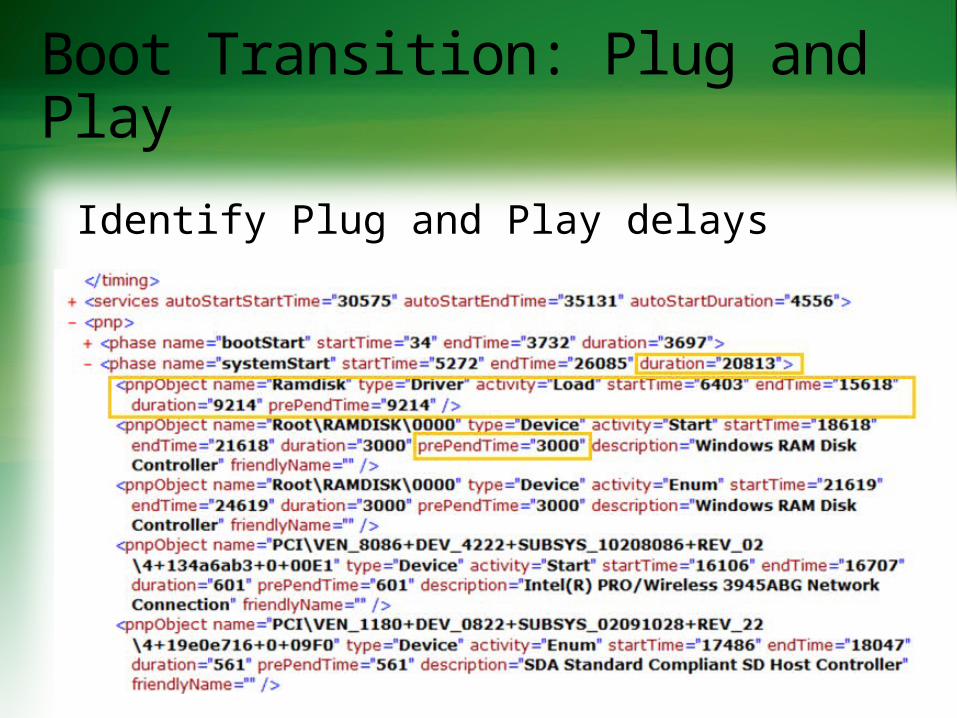
If you suspect performance issues with a driver that is loaded and initialized at boot, you can inspect the Plug and Play data for the driver Expand the PnP nodeYou should see three phase nodes under the PnP node
BootStartSystemStartRemainder
Boot Transition: Plug and Play
Identify Plug and Play delays

Boot Transition: System Video Initialization
Calculate the system session video initialization time
Filter out all SMSS events of interestfindstr.exe /C:"Microsoft-Windows-Subsys-SMSS" trace.csv > trace.csv.filteredfindstr.exe /i “csrss wininit” trace.csv.filtered
Locate the end of the first launch of Csrss.exeEvent type is in the first column:Microsoft-Windows-Subsys-SMSS/smss:ExecuteImage/StopThe timestamp is in the second column and the process name is in the sixth column
Locate the beginning of Wininit.exe startMicrosoft-Windows-Subsys-SMSS/smss:ExecuteImage/Start
Calculate the difference between these two timestamps

Boot Transition: User Video Initialization
Calculate the user session video initialization time
Filter out all SMSS events of interestfindstr.exe /C:"Microsoft-Windows-Subsys-SMSS" trace.csv > trace.csv.filteredfindstr.exe /i "csrss winlogon" trace.csv.filtered
Locate the end of the second start of Csrss.exeLocate the start of Winlogon.exe launch
Microsoft-Windows-Subsys-SMSS/smss:ExecuteImage/Start
Calculate the difference between these two timestamps
Boot Transition: WinLogonInit
WinLogonInit performance vulnerabilitiesMany operations occur in parallel during WinLogonInitOn many systems, this subphase is CPU bound and has large I/O demandsGood citizenship from the services that start in this phase is critical for optimized boot timesServices can declare dependencies or use load order groups to ensure that they start in a specific order; Windows processes load order groups in serial order

Boot Transition: Services
Locate the service start time interval in the Services graph of Xperfview.exe

Boot Transition: PostBoot
PostBoot performance vulnerabilitiesWindows examines and starts the entries in the various Run and RunOnce keys in the registry and the Startup folder in the file systemTo improve performance, the goal for this phase should be to quantify, and then limit the background processing that continues after the desktop is visible

Boot Transition: CPU Usage
Identify CPU consumption issues

Shutdown Transition: Analyzing Traces
Use the Xperf.exe and Xperfview.exe tools in the WPT to analyze the shutdown transition performance dataTo generate an XML summary of shutdown, use the -a shutdown action with Xperf
xperf -i trace.etl -o summary.xml -a shutdown

Shutdown Transition: XML Summary
Shutdown XML summary report

Shutdown Transition: Applications
Measuring application delays in UserSession:
Task 1. Observe application shutdown times in the Summary.xml file
Task 2. Identify the slow application in Xperfview:
CPU scheduling to spot delays along the critical pathCPU sampling to spot CPU usage issues

Shutdown Transition: Applications
Slow_Shutdown.exe
Thread 3604 is sleeping for 5 seconds
(by calling function KeDelayExecution)
Scheduling Summary Table

Shutdown Transition: Applications
CPU SamplingIdentify regions of significant CPU consumption

Shutdown Transition: Applications
Identify the applications that consume CPU in the summary table

Shutdown Transition: Services
Services that do not respond to the SCM notification are identified in the unresponsiveServices node of the reportUse XPerfView to visualize services shutdown

Sleep Transition: Analyzing Traces
Standby and hibernate analysisTo generate an XML summary of the suspend and resume phases, use the -a suspend action with Xperf
xperf -i trace.etl -o summary.xml -a suspend

Sleep Transition: XML Summary
Suspend XML summary report

Sleep Transition: Applications and Services
Expand the SuspendApps node to view detailed per-process timings
Expand the SuspendServices node to view detailed service timings

Sleep Transition: Services
Expand the Suspend (or Query or Resume) Devices node to view detailed device timings

Sleep Transition: PostResume
The CPU Sampling by CPU and Disk Utilization graphs in Xperfview display the activity level of the resumed systemCurrently, no tools support the calculation of a PostResume metric; instead, we strongly recommend that you compare traces against the baseline

Summary
Use xbootmgr to generate ETL tracesUse a controlled and repeatable testing methodologyEstablish a baseline with a clean Windows imageCompare the modified image against a baseline to spot regressionsUse xperf to generate an XML summary of the transitionUse xperfview to drilldown into:
CPU Scheduling view to detect delays along the critical pathCPU Sampling to detect CPU usage issues

Call to Action
Use WPT to identify performance issues in on/off scenariosIdentify regressions caused by the introduction of new services, applications, or device driversReduce boot, shutdown, and sleep timings to improve customer satisfactionView this Windows Summit 2010 presentation:
On/Off Scenarios: Common Issues, Recommendations, and Best Practices (SYST-175)
Fill out the evaluation for this presentation

Resources
Windows Performance Tools (WPT) KitDownload the latest version at:http://msdn.microsoft.com/en-us/performance/default.aspx
“Windows On/Off Transitions Solutions Guide” on the WHDC website:http://www.microsoft.com/whdc/system/pnppwr/powermgmt/OnOffTrans.mspx

© 2010 Microsoft Corporation. All rights reserved. Microsoft, Windows, Windows Vista and other product names are or may be registered trademarks and/or trademarks in the U.S. and/or other countries.
The information herein is for informational purposes only and represents the current view of Microsoft Corporation as of the date of this presentation. Because Microsoft must respond to changing market conditions, it should not be interpreted to be a commitment on the part of Microsoft, and Microsoft cannot guarantee the accuracy of any information provided after
the date of this presentation.MICROSOFT MAKES NO WARRANTIES, EXPRESS, IMPLIED OR STATUTORY, AS TO THE INFORMATION IN THIS PRESENTATION.