blood lactate and ventilatory thresholds in wheelchair athletes with tetraplegia and paraplegia
TRANSCRIPT
1 3
Eur J Appl PhysiolDOI 10.1007/s00421-014-2886-x
OrIgInAl ArtIclE
Blood lactate and ventilatory thresholds in wheelchair athletes with tetraplegia and paraplegia
C. A. Leicht · K. E. Griggs · J. Lavin · K. Tolfrey · V. L. Goosey‑Tolfrey
received: 16 October 2013 / Accepted: 2 April 2014 © Springer-Verlag Berlin Heidelberg 2014
the altered breathing in tEtrA does not seem to have a pronounced effect on the ventilatory threshold or the rcP.
Keywords Spinal cord injury · Exercise prescription · Wheelchair rugby · Wheelchair basketball · Ventilatory equivalent · Wheelchair exercise
AbbreviationsAB Able-bodiedAnOVA Analysis of varianceBla Blood lactatecV coefficient of variationES Effect sizegXt graded exercise test to exhaustionPArA Individuals with paraplegiarcP respiratory compensation pointrPE rating of perceived exertiontEtrA Individuals with tetraplegiav Propulsion velocityV̇CO2 cO2 productionV̇CO2
2/
V̇O2 − V̇CO2 Excess production of cO2
V̇E total ventilationV̇E
/
V̇CO2 Ventilatory equivalent for cO2
V̇E/
V̇O2 Ventilatory equivalent for oxygenV̇O2 Oxygen uptakeV̇O2max Maximum oxygen consumptionV̇O2peak Peak oxygen uptakeVt Ventilatory threshold95 % cI 95 % confidence interval of the
differences
Introduction
Exercise tests are used widely to determine physical capacity and to monitor performance over time in athlete,
Abstract Purpose the purpose of this study was to analyse the influence of spinal cord injury level on blood lactate (Bla) and ventilatory thresholds.Methods ten athletes with tetraplegia (tEtrA) and nine athletes with paraplegia (PArA) performed a graded wheelchair propulsion treadmill exercise step test to exhaustion. the aerobic and anaerobic Bla thresholds, the ventilatory threshold and the respiratory compensation point (rcP) were determined.Results the Bla thresholds were determined in 34 of 38 cases, ventilatory thresholds and rcPs in 31 of 38 cases. the anaerobic Bla threshold (76 ± 7 % V̇O2peak) and the rcP (77 ± 8 % V̇O2peak) did not differ significantly from each other (P = 0.92), with a coefficient of variation of 4.8 ± 3.4 % between thresholds. All other thresholds dif-fered significantly from each other (P < 0.05). thresholds expressed as the percentage of peak oxygen uptake did not differ between tEtrA and PArA (P > 0.05) despite altered breathing in tEtrA, which included a higher ven-tilatory equivalent for oxygen and a lower tidal volume.Conclusion Measuring Bla leads to a higher threshold determination rate compared with ventilatory data and the anaerobic Bla threshold can be used to predict the rcP.
communicated by Jean-rené lacour.
c. A. leicht · K. E. griggs · J. lavin · K. tolfrey · V. l. goosey-tolfrey (*) School of Sport, Exercise, and Health Sciences, the Peter Harrison centre for Disability Sport, loughborough University, loughborough lE11 3tU, UKe-mail: [email protected]
c. A. leicht e-mail: [email protected]
Eur J Appl Physiol
1 3
recreational, and patient populations. Particularly sensitive outcome parameters of these tests appear to be a number of thresholds, which have been shown to better predict performance than maximum data, such as maximum oxy-gen consumption (V̇O2max) (Bishop et al. 1998; Yoshida et al. 1987). In addition to their use as capacity markers, thresholds can serve to determine training zones (Meyer et al. 2005). thresholds can be determined using both blood lactate (Bla) and ventilatory data collected during a graded exercise test to exhaustion (gXt). the physiologi-cal process underlying these thresholds is the progressive contribution of anaerobic metabolism as energy demand increases. this results in the appearance of Bla and hydro-gen ions released from muscle, which are buffered leading to an excess production of cO2 (V̇CO2). Increases in V̇CO2, in turn, result in increased ventilation relative to oxygen uptake (V̇O2), which allows the determination of ventila-tory thresholds (Beaver et al. 1986). It has been shown in able-bodied (AB) populations that the first rise in Bla from baseline (commonly termed the aerobic Bla threshold) corresponds with the ventilatory threshold (Vt), where a break in the V̇CO2–V̇O2 relationship can be observed. At higher exercise intensities, approximating the maximal lac-tate steady state, some methods to determine the anaerobic Bla threshold coincide with the respiratory compensa-tion point (rcP), also known as the secondary Vt, where hyperventilation leads to a break point in the V̇CO2–ven-tilation relationship (Fabre et al. 2010; Meyer et al. 2005). this, therefore, suggests that threshold determination can be achieved with ventilatory rather than Bla data, sparing participants capillary blood sampling during physiological testing, which may be associated with discomfort and dis-ruption of the protocol.
In individuals with a spinal cord injury, the muscular and respiratory systems are compromised. lower lung function measures are found, with a gradual decrease with increas-ing spinal cord lesion level (Baydur et al. 2001). Further-more, the ventilatory equivalent for oxygen (V̇E
/
V̇O2) is higher during submaximal exercise in individuals with tetraplegia (tEtrA) when compared with individuals with paraplegia (PArA) (coutts et al. 1985). Due to the reduced active muscle mass, maximum Bla responses are lower in tEtrA when compared with PArA or individuals with-out spinal cord injury (leicht et al. 2012). It would there-fore be of interest whether these adaptations affect Bla thresholds or Vts. Presently, knowledge is lacking in this research area; whilst thresholds based on Bla (Perret et al. 2012; rotstein et al. 1994) and respiratory data (Bernardi et al. 2010; Bhambhani et al. 1995; coutts and McKenzie 1995; lovell et al. 2012; Schneider et al. 1999; Vinet et al. 1997) have been determined separately in populations with spinal cord injury, to the authors’ knowledge they have not yet been analysed concurrently.
consequently, the aim of this study was to compare Bla thresholds and Vts in tEtrA and PArA athletes. We hypothesise that (1) the aerobic Bla threshold will occur at the same intensity as the Vt, and (2) the anaerobic Bla threshold at the same intensity as the rcP in both groups, despite spinal cord injury-related adaptations and due to the common underlying physiological process for Bla produc-tion and increased ventilation.
Materials and methods
Participants
nineteen wheelchair athletes (10 tEtrA and 9 PArA; 1 female in each group) gave written informed consent to par-ticipate in this study, which was approved by the University’s Ethics committee. All participants performed their sport on at least a national level; a summary of their physical, physi-ological and sport characteristics is presented in table 1.
Experimental design
Participants visited the laboratory in the morning (09:00–11:00). they provided written informed consent and com-pleted separate health, training and disability question-naires. Body mass was obtained to the nearest 0.1 kg. All exercise tests were performed in the participants’ compe-tition court sports wheelchair on a motorised treadmill at a constant 1.0 % gradient (HP cosmos, traunstein, ger-many). tyre pressure was controlled and set at levels that participants would normally compete with.
First, a 5- to 10-min warm-up at speeds slower than the starting speed of the gXt was performed, followed by 10-min passive recovery to ensure that participants started the gXt from a rested state. the starting speed of the gXt varied between 1.2 and 2.0 m s−1 and was chosen accord-ing to disability, classification, and previous test results (where available), with the goal to obtain similar total test durations for all participants. the speed was then continu-ously and progressively increased by 0.2–0.4 m s−1 every 3 min, the increase again tailored individually for the rea-son above. the gXt was terminated when participants were unable to maintain the speed of the treadmill, and ver-bal encouragement was given throughout the test.
Data collection
Spirometric data were recorded continuously using an online gas analysis system in breath by breath mode (Meta-lyzer 3B, cortex Biophysik gmbH, leipzig, germany). Before each test, gases were calibrated using a two-point calibration (O2 = 17.0 %, cO2 = 5.0 % against room air);
Eur J Appl Physiol
1 3
volumes with a 3 l syringe at flow rates of 0.5–3.0 l s−1, according to the manufacturer’s recommendations. A lactate analyser was used to determine Bla (YSI 1500 SPOrt, YSI Incorporated, OH, USA), which was cali-brated before each test using a lactate standard solution of 5 mmol l−1 provided by the manufacturer.
At the end of each 3-min stage, a small capillary blood sample was obtained from the earlobe to measure Bla whilst participants were performing the exercise. One final sam-ple was obtained at the termination of the gXt, when par-ticipants were also asked to indicate their rating of perceived exertion (rPE) using a scale ranging from 6 to 20 (Borg 1982). Heart rate was recorded continuously at 5-s intervals using a heart rate monitor (Polar, Kempele, Finland).
threshold determination
All thresholds were determined independently by two researchers (cl and Kt) and the average was calculated for further analysis. the determination of the individual thresholds differed by more than 5 % in 11 out of 76 cases. For these cases, the researchers discussed the disparity and identified a mutually agreed threshold.
Blood lactate data
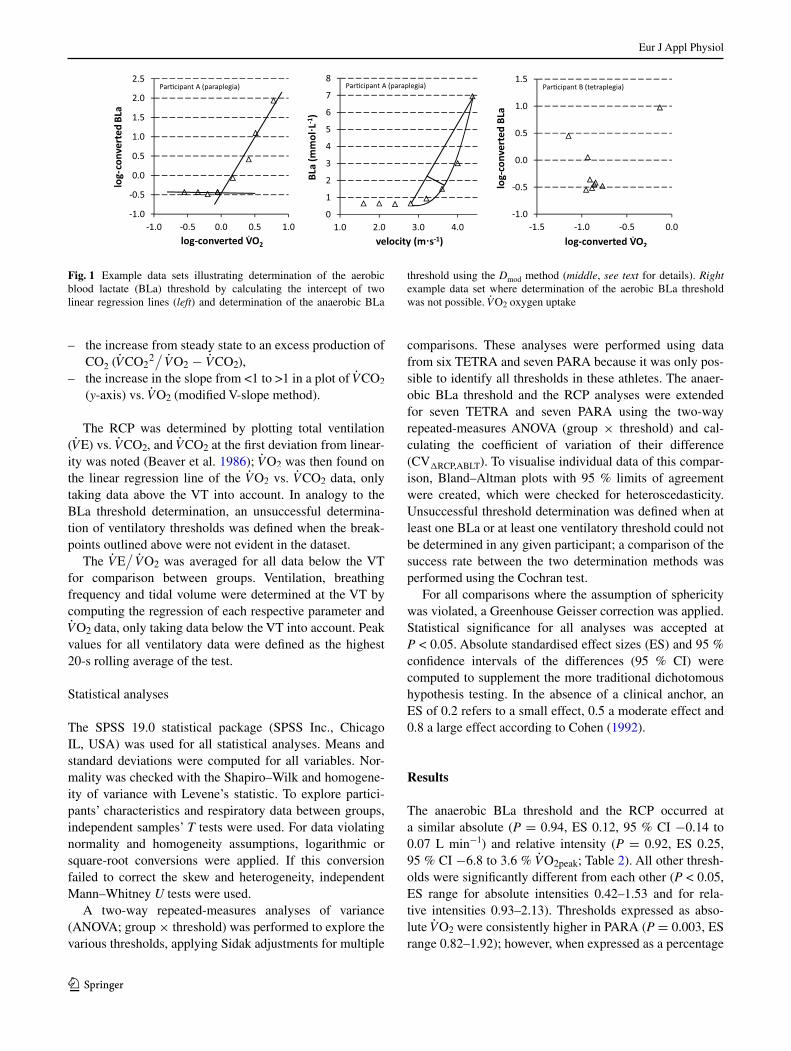
For the determination of the aerobic Bla threshold, the method by Beaver et al. (1985) was employed, using log–log transformation of Bla and V̇O2 data; the latter aver-aged over the final minute of each respective exercise stage. two linear regression lines were fitted to the horizontal and ascending parts of the Bla–V̇O2 relationship data, and the V̇O2 at the intersection of the regression lines was defined
as the aerobic Bla threshold. An unsuccessful Bla thresh-old determination was defined as the inability to allocate the data to two regression lines (Fig. 1).
For the determination of the anaerobic Bla threshold, the Dmod method by Bishop et al. (1998) was employed. Bla points were plotted against velocity data. the Bla point at the highest velocity was only plotted at this velocity value if the 3 min of that stage had been com-pleted. If participants exercised at the final stage for only X % of the full stage duration (3 min), then only X % of the speed increment was used to plot the final Bla point. A straight line was then drawn from the Bla point before the first rise (=aerobic Bla threshold, as determined above) and the Bla point at cessation of exercise. then, the point on the third-order polynomial regression curve of the Bla–velocity data furthest away from this straight line was determined to the nearest 0.1 m s−1, defining the anaerobic Bla threshold (cheng et al. 1992; Van Schuylenbergh et al. 2004). through this procedure, the anaerobic Bla threshold was obtained as a velocity in the first instance, and by computing the linear regression of the V̇O2–velocity data, the corresponding V̇O2 was determined.
Ventilatory data
In accordance with gaskill et al. (2001), three methods were used in combination to determine the Vt. It was found at the intensity that coincided with
–– the first rise in the V̇E/
V̇O2 without a concomi-tant increase in the ventilatory equivalent for cO2 (V̇E
/
V̇CO2),
Table 1 Participant characteristics
Apart from lesion level/disability types and sport, data are mean ± standard deviation or median (quartiles)
TETRA athletes with tetraplegia, PARA athletes with paraplegia, ES effect size, WC wheelchair, V̇O2peak peak oxygen uptake, BLa blood lactate
* Significantly different between groups (P < 0.05)
Parameter tEtrA PArA ES
Body mass (kg) 68.3 ± 8.4 64.1 ± 10.4 0.44
Age (years) 28.3 ± 4.2 26.2 ± 5.6 0.42
lesion level/disability types c5/6–c7 t4–l4 (N = 8), transverse myelitis (N = 1) –
Wc sport rugby (N = 9), basketball (N = 1) Basketball –
Wc sport experience (years) 7.1 ± 4.9 6.0 ± 5.0 0.20
training (h week−1) 14.3 ± 4.2 10.6 ± 5.5 0.76
V̇O2peak (l min−1) 1.57 ± 0.36 2.05 ± 0.54* 1.05
V̇O2peak (ml kg−1 min−1) 23.0 ± 4.9 32.8 ± 10.3* 1.22
Peak heart rate (b min−1) 136 ± 14 179 ± 12* 3.30
Peak Bla (mmol l−1) 4.9 ± 1.3 6.9 ± 2.0* 1.19
rating of perceived exertion 19 (19,20) 19 (19,20) 0.00
Eur J Appl Physiol
1 3
–– the increase from steady state to an excess production of cO2 (V̇CO2
2/
V̇O2 − V̇CO2),–– the increase in the slope from <1 to >1 in a plot of V̇CO2
(y-axis) vs. V̇O2 (modified V-slope method).
the rcP was determined by plotting total ventilation (V̇E) vs. V̇CO2, and V̇CO2 at the first deviation from linear-ity was noted (Beaver et al. 1986); V̇O2 was then found on the linear regression line of the V̇O2 vs. V̇CO2 data, only taking data above the Vt into account. In analogy to the Bla threshold determination, an unsuccessful determina-tion of ventilatory thresholds was defined when the break-points outlined above were not evident in the dataset.
the V̇E/
V̇O2 was averaged for all data below the Vt for comparison between groups. Ventilation, breathing frequency and tidal volume were determined at the Vt by computing the regression of each respective parameter and V̇O2 data, only taking data below the Vt into account. Peak values for all ventilatory data were defined as the highest 20-s rolling average of the test.
Statistical analyses
the SPSS 19.0 statistical package (SPSS Inc., chicago Il, USA) was used for all statistical analyses. Means and standard deviations were computed for all variables. nor-mality was checked with the Shapiro–Wilk and homogene-ity of variance with levene’s statistic. to explore partici-pants’ characteristics and respiratory data between groups, independent samples’ T tests were used. For data violating normality and homogeneity assumptions, logarithmic or square-root conversions were applied. If this conversion failed to correct the skew and heterogeneity, independent Mann–Whitney U tests were used.
A two-way repeated-measures analyses of variance (AnOVA; group × threshold) was performed to explore the various thresholds, applying Sidak adjustments for multiple
comparisons. these analyses were performed using data from six tEtrA and seven PArA because it was only pos-sible to identify all thresholds in these athletes. the anaer-obic Bla threshold and the rcP analyses were extended for seven tEtrA and seven PArA using the two-way repeated-measures AnOVA (group × threshold) and cal-culating the coefficient of variation of their difference (cVΔrcP,ABlt). to visualise individual data of this compar-ison, Bland–Altman plots with 95 % limits of agreement were created, which were checked for heteroscedasticity. Unsuccessful threshold determination was defined when at least one Bla or at least one ventilatory threshold could not be determined in any given participant; a comparison of the success rate between the two determination methods was performed using the cochran test.
For all comparisons where the assumption of sphericity was violated, a greenhouse geisser correction was applied. Statistical significance for all analyses was accepted at P < 0.05. Absolute standardised effect sizes (ES) and 95 % confidence intervals of the differences (95 % cI) were computed to supplement the more traditional dichotomous hypothesis testing. In the absence of a clinical anchor, an ES of 0.2 refers to a small effect, 0.5 a moderate effect and 0.8 a large effect according to cohen (1992).
Results
the anaerobic Bla threshold and the rcP occurred at a similar absolute (P = 0.94, ES 0.12, 95 % cI −0.14 to 0.07 l min−1) and relative intensity (P = 0.92, ES 0.25, 95 % cI −6.8 to 3.6 % V̇O2peak; table 2). All other thresh-olds were significantly different from each other (P < 0.05, ES range for absolute intensities 0.42–1.53 and for rela-tive intensities 0.93–2.13). thresholds expressed as abso-lute V̇O2 were consistently higher in PArA (P = 0.003, ES range 0.82–1.92); however, when expressed as a percentage
Fig. 1 Example data sets illustrating determination of the aerobic blood lactate (Bla) threshold by calculating the intercept of two linear regression lines (left) and determination of the anaerobic Bla
threshold using the Dmod method (middle, see text for details). Right example data set where determination of the aerobic Bla threshold was not possible. V̇O2 oxygen uptake

Eur J Appl Physiol
1 3
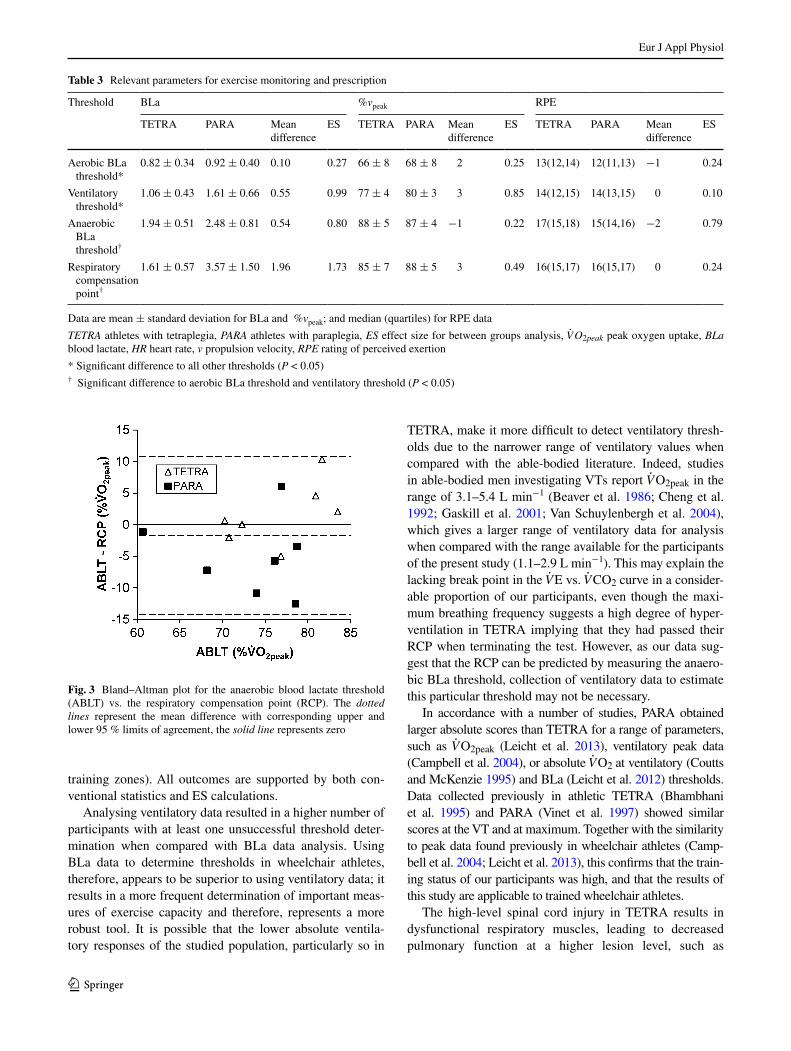
of peak oxygen uptake (%V̇O2peak), they did not differ between groups (P = 0.62, ES range 0.03–0.50; table 2). thresholds could not be determined in 11 out of 76 cases; unsuccessful threshold determination was more frequent when using ventilatory data when compared with Bla data (six participants vs. two participants; P = 0.05; table 2; Fig. 2). the cVΔrcP,ABlt was 4.8 ± 3.4 % for the whole sample, 3.6 ± 3.2 % for tEtrA and 6.1 ± 3.3 % for PArA, but was not significantly different between tEtrA and PArA despite a moderate-to-large ES (P = 0.19, ES 0.75, 95 % cI −6.3 to 1.4 %). A Bland–Altman plot depict-ing individual data of the relationship between the anaero-bic Bla threshold and the rcP is given in Fig. 3. Other parameters typically used for exercise monitoring and pre-scription are depicted in table 3. they show the same pat-tern as V̇O2 data, which means no difference between the anaerobic Bla threshold and the rcP, with all other thresh-olds significantly different from each other.
the V̇E/
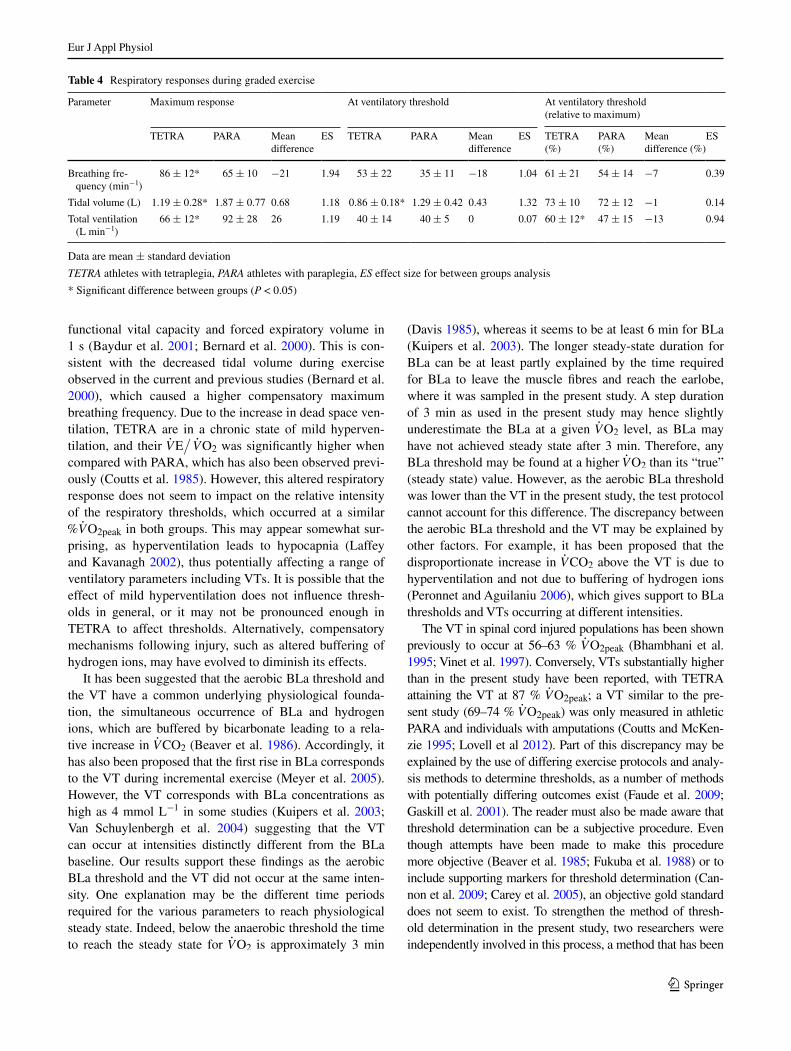
V̇O2 was significantly higher in tEtrA (35.0 ± 3.0) than in PArA (27.5 ± 3.3, P = 0.002, ES 2.40, 95 % cI 4.4–10.7). the maximum responses of
breathing frequency, tidal volume and total ventilation dif-fered between groups; tidal volume was also lower at the Vt in tEtrA (P < 0.05, table 4). Peak responses for heart rate, Bla concentration and rPE indicate that all participants provided a maximum effort. Aerobic capacity, as reflected by V̇O2peak, was higher in PArA (range 1.35–2.91 l min−1) than in tEtrA (range 1.07–2.23 l min−1) (table 1).
Discussion
the main finding of the present study is that the anaero-bic Bla threshold and the rcP occurred at the same rela-tive V̇O2 in tEtrA and PArA, with a cV of around 5 % between the thresholds. the other thresholds all differed significantly between each other. threshold responses of Bla, propulsion velocity and rPE support the findings derived by V̇O2 analysis. they provide practical tools for athletes and practitioners for exercise monitoring (changes in thresholds over time) and prescription (determination of
Table 2 Oxygen uptake at various thresholds and number of detectable thresholds
Data are mean ± standard deviation
TETRA athletes with tetraplegia, PARA athletes with paraplegia, ES effect size for between groups analysis, V̇O2peak peak oxygen uptake, BLa blood lactate
* Significant difference to all other thresholds (P < 0.05)† Significant difference to aerobic Bla threshold and ventilatory threshold (P < 0.05)
threshold V̇O2 (l min−1) % V̇O2peak Detected thresh-olds
tEtrA PArA Mean difference
ES tEtrA PArA Mean difference
ES tEtrA PArA
Aerobic Bla threshold* 0.97 ± 0.17 1.12 ± 0.18 0.15 0.82 58 ± 8 58 ± 18 0 0.03 8/10 9/9
Ventilatory threshold* 1.04 ± 0.25 1.42 ± 0.28 0.38 1.40 66 ± 6 70 ± 9 4 0.50 8/10 9/9
Anaerobic Bla threshold† 1.28 ± 0.25 1.53 ± 0.28 0.25 0.95 76 ± 5 76 ± 9 3 0.03 8/10 9/9
respiratory compensation point†
1.25 ± 0.25 1.74 ± 0.26 0.49 1.92 75 ± 5 78 ± 10 3 0.41 7/10 7/9
Fig. 2 total ventilation vs. V̇CO2 for the determination of the respiratory compensation point (rcP) in two individuals with tetraplegia. Left no discern-ible threshold, right discernible threshold
Eur J Appl Physiol
1 3
training zones). All outcomes are supported by both con-ventional statistics and ES calculations.
Analysing ventilatory data resulted in a higher number of participants with at least one unsuccessful threshold deter-mination when compared with Bla data analysis. Using Bla data to determine thresholds in wheelchair athletes, therefore, appears to be superior to using ventilatory data; it results in a more frequent determination of important meas-ures of exercise capacity and therefore, represents a more robust tool. It is possible that the lower absolute ventila-tory responses of the studied population, particularly so in
tEtrA, make it more difficult to detect ventilatory thresh-olds due to the narrower range of ventilatory values when compared with the able-bodied literature. Indeed, studies in able-bodied men investigating Vts report V̇O2peak in the range of 3.1–5.4 l min−1 (Beaver et al. 1986; cheng et al. 1992; gaskill et al. 2001; Van Schuylenbergh et al. 2004), which gives a larger range of ventilatory data for analysis when compared with the range available for the participants of the present study (1.1–2.9 l min−1). this may explain the lacking break point in the V̇E vs. V̇CO2 curve in a consider-able proportion of our participants, even though the maxi-mum breathing frequency suggests a high degree of hyper-ventilation in tEtrA implying that they had passed their rcP when terminating the test. However, as our data sug-gest that the rcP can be predicted by measuring the anaero-bic Bla threshold, collection of ventilatory data to estimate this particular threshold may not be necessary.
In accordance with a number of studies, PArA obtained larger absolute scores than tEtrA for a range of parameters, such as V̇O2peak (leicht et al. 2013), ventilatory peak data (campbell et al. 2004), or absolute V̇O2 at ventilatory (coutts and McKenzie 1995) and Bla (leicht et al. 2012) thresholds. Data collected previously in athletic tEtrA (Bhambhani et al. 1995) and PArA (Vinet et al. 1997) showed similar scores at the Vt and at maximum. together with the similarity to peak data found previously in wheelchair athletes (camp-bell et al. 2004; leicht et al. 2013), this confirms that the train-ing status of our participants was high, and that the results of this study are applicable to trained wheelchair athletes.
the high-level spinal cord injury in tEtrA results in dysfunctional respiratory muscles, leading to decreased pulmonary function at a higher lesion level, such as
Table 3 relevant parameters for exercise monitoring and prescription
Data are mean ± standard deviation for Bla and %vpeak; and median (quartiles) for rPE data
TETRA athletes with tetraplegia, PARA athletes with paraplegia, ES effect size for between groups analysis, V̇O2peak peak oxygen uptake, BLa blood lactate, HR heart rate, v propulsion velocity, RPE rating of perceived exertion
* Significant difference to all other thresholds (P < 0.05)† Significant difference to aerobic Bla threshold and ventilatory threshold (P < 0.05)
threshold Bla %vpeak rPE
tEtrA PArA Mean difference
ES tEtrA PArA Mean difference
ES tEtrA PArA Mean difference
ES
Aerobic Bla threshold*
0.82 ± 0.34 0.92 ± 0.40 0.10 0.27 66 ± 8 68 ± 8 2 0.25 13(12,14) 12(11,13) −1 0.24
Ventilatory threshold*
1.06 ± 0.43 1.61 ± 0.66 0.55 0.99 77 ± 4 80 ± 3 3 0.85 14(12,15) 14(13,15) 0 0.10
Anaerobic Bla threshold†
1.94 ± 0.51 2.48 ± 0.81 0.54 0.80 88 ± 5 87 ± 4 −1 0.22 17(15,18) 15(14,16) −2 0.79
respiratory compensation point†
1.61 ± 0.57 3.57 ± 1.50 1.96 1.73 85 ± 7 88 ± 5 3 0.49 16(15,17) 16(15,17) 0 0.24
Fig. 3 Bland–Altman plot for the anaerobic blood lactate threshold (ABlt) vs. the respiratory compensation point (rcP). the dotted lines represent the mean difference with corresponding upper and lower 95 % limits of agreement, the solid line represents zero
Eur J Appl Physiol
1 3
functional vital capacity and forced expiratory volume in 1 s (Baydur et al. 2001; Bernard et al. 2000). this is con-sistent with the decreased tidal volume during exercise observed in the current and previous studies (Bernard et al. 2000), which caused a higher compensatory maximum breathing frequency. Due to the increase in dead space ven-tilation, tEtrA are in a chronic state of mild hyperven-tilation, and their V̇E
/
V̇O2 was significantly higher when compared with PArA, which has also been observed previ-ously (coutts et al. 1985). However, this altered respiratory response does not seem to impact on the relative intensity of the respiratory thresholds, which occurred at a similar %V̇O2peak in both groups. this may appear somewhat sur-prising, as hyperventilation leads to hypocapnia (laffey and Kavanagh 2002), thus potentially affecting a range of ventilatory parameters including Vts. It is possible that the effect of mild hyperventilation does not influence thresh-olds in general, or it may not be pronounced enough in tEtrA to affect thresholds. Alternatively, compensatory mechanisms following injury, such as altered buffering of hydrogen ions, may have evolved to diminish its effects.
It has been suggested that the aerobic Bla threshold and the Vt have a common underlying physiological founda-tion, the simultaneous occurrence of Bla and hydrogen ions, which are buffered by bicarbonate leading to a rela-tive increase in V̇CO2 (Beaver et al. 1986). Accordingly, it has also been proposed that the first rise in Bla corresponds to the Vt during incremental exercise (Meyer et al. 2005). However, the Vt corresponds with Bla concentrations as high as 4 mmol l−1 in some studies (Kuipers et al. 2003; Van Schuylenbergh et al. 2004) suggesting that the Vt can occur at intensities distinctly different from the Bla baseline. Our results support these findings as the aerobic Bla threshold and the Vt did not occur at the same inten-sity. One explanation may be the different time periods required for the various parameters to reach physiological steady state. Indeed, below the anaerobic threshold the time to reach the steady state for V̇O2 is approximately 3 min
(Davis 1985), whereas it seems to be at least 6 min for Bla (Kuipers et al. 2003). the longer steady-state duration for Bla can be at least partly explained by the time required for Bla to leave the muscle fibres and reach the earlobe, where it was sampled in the present study. A step duration of 3 min as used in the present study may hence slightly underestimate the Bla at a given V̇O2 level, as Bla may have not achieved steady state after 3 min. therefore, any Bla threshold may be found at a higher V̇O2 than its “true” (steady state) value. However, as the aerobic Bla threshold was lower than the Vt in the present study, the test protocol cannot account for this difference. the discrepancy between the aerobic Bla threshold and the Vt may be explained by other factors. For example, it has been proposed that the disproportionate increase in V̇CO2 above the Vt is due to hyperventilation and not due to buffering of hydrogen ions (Peronnet and Aguilaniu 2006), which gives support to Bla thresholds and Vts occurring at different intensities.
the Vt in spinal cord injured populations has been shown previously to occur at 56–63 % V̇O2peak (Bhambhani et al. 1995; Vinet et al. 1997). conversely, Vts substantially higher than in the present study have been reported, with tEtrA attaining the Vt at 87 % V̇O2peak; a Vt similar to the pre-sent study (69–74 % V̇O2peak) was only measured in athletic PArA and individuals with amputations (coutts and McKen-zie 1995; lovell et al 2012). Part of this discrepancy may be explained by the use of differing exercise protocols and analy-sis methods to determine thresholds, as a number of methods with potentially differing outcomes exist (Faude et al. 2009; gaskill et al. 2001). the reader must also be made aware that threshold determination can be a subjective procedure. Even though attempts have been made to make this procedure more objective (Beaver et al. 1985; Fukuba et al. 1988) or to include supporting markers for threshold determination (can-non et al. 2009; carey et al. 2005), an objective gold standard does not seem to exist. to strengthen the method of thresh-old determination in the present study, two researchers were independently involved in this process, a method that has been
Table 4 respiratory responses during graded exercise
Data are mean ± standard deviation
TETRA athletes with tetraplegia, PARA athletes with paraplegia, ES effect size for between groups analysis
* Significant difference between groups (P < 0.05)
Parameter Maximum response At ventilatory threshold At ventilatory threshold (relative to maximum)
tEtrA PArA Mean difference
ES tEtrA PArA Mean difference
ES tEtrA (%)
PArA (%)
Mean difference (%)
ES
Breathing fre-quency (min−1)
86 ± 12* 65 ± 10 −21 1.94 53 ± 22 35 ± 11 −18 1.04 61 ± 21 54 ± 14 −7 0.39
tidal volume (l) 1.19 ± 0.28* 1.87 ± 0.77 0.68 1.18 0.86 ± 0.18* 1.29 ± 0.42 0.43 1.32 73 ± 10 72 ± 12 −1 0.14
total ventilation (l min−1)
66 ± 12* 92 ± 28 26 1.19 40 ± 14 40 ± 5 0 0.07 60 ± 12* 47 ± 15 −13 0.94

Eur J Appl Physiol
1 3
employed previously (gaskill et al. 2001). Further, by analys-ing participants competing in sports with similar physiological demands, dominated by intermittent activity (goosey-tolfrey and leicht 2013), we have attempted to limit the influence of the respective sport on the analysed thresholds.
Standardising exercise tests in populations as diverse as the one studied can pose a challenge. For example, we have not standardised the warm-up intensity by objective means but left it to the participants to warm up to be suf-ficiently prepared for the gXt. Even though all participants exhibited a Bla baseline, suggesting start of the gXt from a rested state, it would be advisable to objectively standard-ise the warm-up in any follow-up study. Further, push fre-quency was not recorded. Increases in push frequency with increasing speed are natural behaviour in any wheelchair court sport, so we opted for an ecologically valid approach which included freely chosen push frequency. Again, the impact of varying push frequency between participants may be evaluated in any follow-up.
Conclusions
the results of this study demonstrate a practical advan-tage of Bla over ventilatory data collection in wheelchair athletes, as unsuccessful Bla threshold determination occurred less frequently. the altered breathing in tEtrA does not appear to have an impact on thresholds, which occur at similar relative intensities irrespective of the dis-ability group. Factors such as training status may be more important predictors of relative threshold intensity than spi-nal cord injury level, which affects aerobic capacity. In a next step, we propose to investigate the use of these thresh-olds as tools to monitor and predict performance in wheel-chair athletes, with a special focus on any potential influ-ence of spinal cord injury level.
Acknowledgments We thank the great Britain Wheelchair rugby ltd. and British Wheelchair Basketball for their support. Apprecia-tion is extended to all sportsmen who volunteered to participate in this study.
Conflict of interest the authors declare that they have no conflict of interest.
Ethical standard the authors declare that the conducted experi-ments comply with the current laws of the country in which they were performed.
References
Baydur A, Adkins rH, Milic-Emili J (2001) lung mechanics in indi-viduals with spinal cord injury: effects of injury level and pos-ture. J Appl Physiol 90:405–411
Beaver Wl, Wasserman K, Whipp BJ (1985) Improved detection of lactate threshold during exercise using a log–log transformation. J Appl Physiol 59:1936–1940
Beaver Wl, Wasserman K, Whipp BJ (1986) A new method for detecting anaerobic threshold by gas exchange. J Appl Physiol 60:2020–2027
Bernard Pl, Mercier J, Varray A, Prefaut c (2000) Influence of lesion level on the cardioventilatory adaptations in paraplegic wheel-chair athletes during muscular exercise. Spinal cord 38:16–25
Bernardi M, guerra E, Di giacinto B, Di cesare A, castellano V, Bhambhani Y (2010) Field evaluation of paralympic athletes in selected sports: implications for training. Med Sci Sports Exerc 42:1200–1208. doi:10.1249/MSS.0b013e3181c67d82
Bhambhani Yn, Burnham rS, Wheeler gD, Eriksson P, Holland lJ, Steadward rD (1995) Ventilatory threshold during wheelchair exercise in untrained and endurance-trained subjects with quadri-plegia. Adapt Phys Act Q 12:333–343
Bishop D, Jenkins Dg, Mackinnon lt (1998) the relationship between plasma lactate parameters, Wpeak and 1-h cycling per-formance in women. Med Sci Sports Exerc 30:1270–1275
Borg gA (1982) Psychophysical bases of perceived exertion. Med Sci Sports Exerc 14:377–381
campbell Ig, Williams c, lakomy HK (2004) Physiological and met-abolic responses of wheelchair athletes in different racing classes to prolonged exercise. J Sports Sci 22:449–456
cannon Dt, Kolkhorst FW, Buono MJ (2009) On the determination of ventilatory threshold and respiratory compensation point via respiratory frequency. Int J Sports Med 30:157–162. doi:10.1055/s-0028-1104569
carey Dg, Schwarz lA, Pliego gJ, raymond rl (2005) respiratory rate is a valid and reliable marker for the anaerobic threshold: implications for measuring change in fitness. J Sports Sci Med 4:482–488
cheng B, Kuipers H, Snyder Ac, Keizer HA, Jeukendrup A, Hes-selink M (1992) A new approach for the determination of ventila-tory and lactate thresholds. Int J Sports Med 13:518–522. doi:10.1055/s-2007-1021309
cohen J (1992) A power primer. Psychol Bull 112:155–159coutts KD, McKenzie Dc (1995) Ventilatory thresholds during
wheelchair exercise in individuals with spinal cord injuries. Para-plegia 33:419–422
coutts KD, rhodes Ec, McKenzie Dc (1985) Submaximal exer-cise responses of tetraplegics and paraplegics. J Appl Physiol 59:237–241
Davis JA (1985) Anaerobic threshold: review of the concept and directions for future research. Med Sci Sports Exerc 17:6–21
Fabre n, Balestreri F, Pellegrini B, Schena F (2010) the modified Dmax method is reliable to predict the second ventilatory thresh-old in elite cross-country skiers. J Strength cond res 24:1546–1552. doi:10.1519/JSc.0b013e3181dc450a
Faude O, Kindermann W, Meyer t (2009) lactate threshold concepts: how valid are they? Sports Med 39:469–490
Fukuba Y, Munaka M, Usui S, Sasahara H (1988) comparison of objective methods for determining ventilatory threshold. Jpn J Physiol 38:133–144
gaskill SE, ruby Bc, Walker AJ, Sanchez OA, Serfass rc, leon AS (2001) Validity and reliability of combining three meth-ods to determine ventilatory threshold. Med Sci Sports Exerc 33:1841–1848
goosey-tolfrey Vl, leicht cA (2013) Field-based physiological test-ing of wheelchair athletes. Sports Med 43:77–91. doi:10.1007/s40279-012-0009-6
Kuipers H, rietjens g, Verstappen F, Schoenmakers H, Hofman g (2003) Effects of stage duration in incremental running tests on physiological variables. Int J Sports Med 24:486–491. doi:10.1055/s-2003-42020

Eur J Appl Physiol
1 3
laffey Jg, Kavanagh BP (2002) Hypocapnia. n Engl J Med 347:43–53. doi:10.1056/nEJMra012457
leicht cA, Bishop nc, goosey-tolfrey Vl (2012) Submaximal exercise responses in tetraplegic, paraplegic and non spinal cord injured elite wheelchair athletes. Scand J Med Sci Sports 22:729–736
leicht cA, tolfrey K, lenton JP, Bishop nc, goosey-tolfrey Vl (2013) the verification phase and reliability of physiological parameters in peak testing of elite wheelchair athletes. Eur J Appl Physiol 113:337–345. doi:10.1007/s00421-012-2441-6
lovell D, Shields D, Beck B, cuneo r, Mclellan c (2012) the aero-bic performance of trained and untrained handcyclists with spi-nal cord injury. Eur J Appl Physiol 112:3431–3437. doi:10.1007/s00421-012-2324-x
Meyer t, lucia A, Earnest cP, Kindermann W (2005) A conceptual framework for performance diagnosis and training prescrip-tion from submaximal gas exchange parameters—theory and application. Int J Sports Med 26(Suppl 1):S38–S48. doi:10.1055/s-2004-830514
Peronnet F, Aguilaniu B (2006) lactic acid buffering, nonmetabolic cO2 and exercise hyperventilation: a critical reappraisal. respir Physiol neurobiol 150:4–18. doi:10.1016/j.resp.2005.04.005
Perret c, labruyere r, Mueller g, Strupler M (2012) correlation of heart rate at lactate minimum and maximal lactate steady state in
wheelchair-racing athletes. Spinal cord 50:33–36. doi:10.1038/sc.2011.97
rotstein A, Sagiv M, Ben-Sira D, Werber g, Hutzler J, Annenburg H (1994) Aerobic capacity and anaerobic threshold of wheel-chair basketball players. Paraplegia 32:196–201. doi:10.1038/sc.1994.36
Schneider DA, Sedlock DA, gass E, gass g (1999) VO2peak and the gas-exchange anaerobic threshold during incremental arm crank-ing in able-bodied and paraplegic men. Eur J Appl Physiol Occup Physiol 80:292–297
Van Schuylenbergh r, Vanden Eynde B, Hespel P (2004) correlations between lactate and ventilatory thresholds and the maximal lac-tate steady state in elite cyclists. Int J Sports Med 25:403–408. doi:10.1055/s-2004-819942
Vinet A, le gallais D, Bernard Pl et al (1997) Aerobic metabolism and cardioventilatory responses in paraplegic athletes during an incremental wheelchair exercise. Eur J Appl Physiol Occup Phys-iol 76:455–461
Yoshida t, chida M, Ichioka M, Suda Y (1987) Blood lactate param-eters related to aerobic capacity and endurance performance. Eur J Appl Physiol Occup Physiol 56:7–11