blue square re n.v. - aegon · pdf fileb.3 risk management system including the own risk and...
TRANSCRIPT

Blue Square Re N.V.
Solvency and Financial Condition Report
2016

1
Table of contents Scope of the report ...................................................................................................................... 6
Summary ..................................................................................................................................... 7
A. Business and Performance ........................................................................................................ 8
A.1 Business ......................................................................................................................................... 8
A.1.1 Overview ................................................................................................................................ 8
A.1.2 Regulators and auditor ........................................................................................................... 8
A.1.3 Solvency II key figures ............................................................................................................ 9
A.1.4 Holders of qualifying holdings ................................................................................................ 9
A.1.6 List of principal subsidiaries, joint ventures and investments in associates ........................ 10
A.1.7 Related party transactions ................................................................................................... 11
A.1.8 Material lines of business and material geographical areas. ............................................... 12
A.2 Underwriting performance ......................................................................................................... 13
A.2.1 Premium Income .................................................................................................................. 13
A.2.2 Policyholder claims and benefits ......................................................................................... 14
A.3 Investment performance ............................................................................................................ 14
A.3.1 Investment income and expenses ....................................................................................... 14
A.3.2 Results from financial transactions ...................................................................................... 14
A.3.3 Projections of expected investment performance .............................................................. 15
A.3.4 Investments in securitisation ............................................................................................... 15
A.4 Performance of other activities .................................................................................................. 15
A.4.1 Other activities income and expenses ................................................................................. 15
A.4.2 Material leasing arrangements ............................................................................................ 16
A.5 Any other information ................................................................................................................ 16
B. System of Governance ............................................................................................................ 17
B.1 General information on the System of Governance ................................................................... 17
B.1.1 Corporate governance ......................................................................................................... 17
B.1.2 Remuneration policy ............................................................................................................ 21
B.1.3 Organizational Structure ...................................................................................................... 28
B.2 Fit and proper requirements ....................................................................................................... 28
B.2.1 Requirements ....................................................................................................................... 28
B.2.2 Process for assessment ........................................................................................................ 30
B.3 Risk management system including the Own Risk and Solvency Assessment ............................ 31
B.3.1 Risk management system .................................................................................................... 31

2
B.3.2 Own Risk and Solvency Assessment ..................................................................................... 42
B.4 Internal Control system ............................................................................................................... 46
B.4.1 Key procedures ..................................................................................................................... 46
B.4.2 Compliance activities and policy .......................................................................................... 50
B.5 Internal Audit function ................................................................................................................ 52
B.5.1 Internal Audit function ......................................................................................................... 52
B.5.2 Independence and objectivity of the Internal Audit function.............................................. 53
B.5.3 Internal Audits performed ................................................................................................... 53
B.6 Actuarial function ........................................................................................................................ 54
B.7 Outsourcing ................................................................................................................................. 56
B.7.1 External outsourcing arrangements ..................................................................................... 56
B.7.2 Intra-group outsourcing arrangements ............................................................................... 57
B.8 Any other information ................................................................................................................. 57
B.8.1 Assessment of adequacy ...................................................................................................... 57
B.8.2 Other material information .................................................................................................. 57
C. Risk Profile ............................................................................................................................. 58
General .......................................................................................................................................... 58
Prudent Person Principle ............................................................................................................... 59
Off-balance positions and Special Purpose Vehicles ..................................................................... 60
C.1 Underwriting risk ......................................................................................................................... 60
C.1.1 Underwriting risk description ............................................................................................... 60
C.1.2 Underwriting risk assessment .............................................................................................. 61
C.1.3 Underwriting risk concentration .......................................................................................... 63
C.1.4 Underwriting risk mitigation ................................................................................................ 63
C.1.5 Underwriting risk sensitivity ................................................................................................. 64
C.1.6 Underwriting risk data .......................................................................................................... 66
C.2 Market risk .................................................................................................................................. 66
C.2.1 Market risk description ........................................................................................................ 66
C.2.2 Market risk assessment ........................................................................................................ 67
C.2.3 Market risk concentration .................................................................................................... 67
C.2.4 Market risk mitigation .......................................................................................................... 68
C.2.5 Market risk sensitivity .......................................................................................................... 68
C.2.6 Market risk data ................................................................................................................... 69
C.3 Credit risk .................................................................................................................................... 69
3
C.3.1 Credit risk description .......................................................................................................... 69
C.3.2 Credit risk assessment .......................................................................................................... 71
C.3.3 Credit risk concentration ...................................................................................................... 71
C.3.4 Credit risk mitigation ............................................................................................................ 72
C.3.5 Credit risk sensitivity ............................................................................................................ 73
C.3.6 Credit risk data ..................................................................................................................... 73
C.4 Liquidity risk ................................................................................................................................ 73
C.4.1 Liquidity risk description ...................................................................................................... 73
C.4.2 Liquidity risk assessment ...................................................................................................... 73
C.4.3 Liquidity risk concentration .................................................................................................. 74
C.4.4 Liquidity risk mitigation ........................................................................................................ 74
C.4.5 Liquidity risk sensitivity ........................................................................................................ 74
C.4.6 Liquidity risk data ................................................................................................................. 74
C.4.7 Expected profit included in future premiums ...................................................................... 75
C.5 Operational risk ........................................................................................................................... 75
C.5.1 Operational risk description ................................................................................................. 75
C.5.2 Operational risk assessment ................................................................................................ 75
C.5.3 Operational risk concentration ............................................................................................ 76
C.5.4 Operational risk mitigation .................................................................................................. 77
C.5.5 Operational risk sensitivity ................................................................................................... 78
C.5.6 Operational risk data ............................................................................................................ 78
C.6 Other material risk ...................................................................................................................... 78
D. Valuation for Solvency Purposes ............................................................................................. 80
Approach towards IFRS to Solvency II balance sheet reconciliation ............................................. 80
Balance sheet reconciliation overview .......................................................................................... 81
D.1 Assets .......................................................................................................................................... 82
D.1.1 Goodwill ............................................................................................................................... 82
D.1.2 Deferred acquisition costs ................................................................................................... 82
D.1.3 Intangible assets .................................................................................................................. 82
D.1.4 Deferred tax assets .............................................................................................................. 83
D.1.5 Pension benefit surplus........................................................................................................ 84
D.1.6 Property, plant & equipment held for own use ................................................................... 84
D.1.7 Investments (other than assets held for index- and unit-linked funds) .............................. 84
D.1.8 Assets held for index- and unit-linked funds ....................................................................... 87
4
D.1.9 Loans and mortgages ........................................................................................................... 87
D.1.10 Reinsurance recoverables .................................................................................................. 87
D.1.11 Deposits to cedants ............................................................................................................ 88
D.1.12 Insurance and intermediaries receivables ......................................................................... 88
D.1.13 Reinsurance receivables .................................................................................................... 90
D.1.14 Receivables (trade, not insurance) .................................................................................... 90
D.1.15 Own shares ........................................................................................................................ 91
D.1.16 Cash and cash equivalents ................................................................................................. 91
D.1.17 Any other assets ................................................................................................................. 92
D.2 Technical provisions .................................................................................................................... 92
Data Quality ................................................................................................................................... 96
Model governance ......................................................................................................................... 97
Movements of technical provision ................................................................................................ 98
D.2.1 Technical provisions – non-life ............................................................................................ 99
D.2.2 Technical provisions – life (excluding index-linked and unit-linked) and health ............... 101
D.2.3 Technical provisions – index-linked and unit-linked .......................................................... 103
D.2.4 Matching adjustment ......................................................................................................... 103
D.2.5 Volatility adjustment .......................................................................................................... 103
D.2.6 Transitional risk-free interest rate-term structure ............................................................ 103
D.2.7 Transitional deduction ....................................................................................................... 104
D.2.8 Recoverables from reinsurance contracts and Special Purpose Vehicles ......................... 104
D.2.9 Material changes in assumptions made in calculations of technical provisions ............... 104
D.3 Other liabilities .......................................................................................................................... 105
D.3.1 Contingent liabilities .......................................................................................................... 105
D.3.2 Provisions other than technical provisions ........................................................................ 105
D.3.3 Pension benefit obligations ............................................................................................... 105
D.3.4 Deposits from reinsurers ................................................................................................... 105
D.3.5 Deferred tax liabilities ........................................................................................................ 105
D.3.6 Derivatives ......................................................................................................................... 105
D.3.7 Debts owed to credit institutions ...................................................................................... 106
D.3.8 Financial liabilities other than debts owed to credit institutions ...................................... 107
D.3.9 Insurance & intermediaries payables ................................................................................ 107
D.3.10 Reinsurance payables ...................................................................................................... 108
D.3.11 Payables (trade, not insurance) ....................................................................................... 108

5
D.3.12 Subordinated liabilities .................................................................................................... 109
D.3.13 Any other liabilities .......................................................................................................... 109
D.4 Alternative methods for valuation ............................................................................................ 110
D.5 Any other information .............................................................................................................. 110
Management actions ................................................................................................................... 110
Policyholder behaviors ................................................................................................................ 111
E. Capital Management ............................................................................................................. 112
General ........................................................................................................................................ 112
Capital Management policy ......................................................................................................... 112
Capital quality .............................................................................................................................. 113
Managing our leverage ................................................................................................................ 114
E.1 Own Funds ................................................................................................................................. 114
E.1.1 Aggregation methods ......................................................................................................... 114
E.1.2 Tiering of Own Funds .......................................................................................................... 114
E.1.3 Difference between Solvency Own Funds and IFRS Shareholders Equity .......................... 118
E.1.4 Transitional arrangements ................................................................................................. 118
E.1.5 Ancillary own funds ............................................................................................................ 118
E.1.6 Description of items deducted from Own Funds ............................................................... 118
E.1.7 Significant changes to Own Funds over the reporting period ............................................ 118
E.2 Solvency Capital Requirement and Minimum Capital Requirement ......................................... 119
E.2.1 Solvency Capital Requirement ............................................................................................ 119
E.2.2 SCR split by risk module ..................................................................................................... 120
E.2.3 Simplified calculations ........................................................................................................ 123
E.2.4 Undertaking- specific parameters (Article 104(7) of Directive 2009/138/EC) ................... 123
E.2.5 Article 51(2) of Directive 2009/138/EC .............................................................................. 123
E.2.6 Minimum Capital Requirement .......................................................................................... 123
E.3 Use of the duration-based equity risk sum-module .................................................................. 123
E.4 Differences between standard formula and partially internal model used .............................. 124
E.5 Non-compliance with capital requirements .............................................................................. 124
E.6 Any other information ............................................................................................................... 124
BSR Annual Report is available upon request through the website: www.bluesquarere.com

6
Scope of the report
This report is Blue Square Re N.V.’s Solvency and Financial Condition Report (SFCR) for the year
ended December 31st, 2016. This report informs Blue Square Re N.V.’s stakeholders about Blue
Square Re N.V.’s:
A. Business and Performance;
B. System of Governance;
C. Risk Profile;
D. Valuation for Solvency Purposes; and
E. Capital Management.
This report is prepared in accordance with the requirements of Solvency II Directive and Delegated
and relevant EIOPA Guidelines, in particular ‘Guidelines on reporting and public disclosure’ (EIOPA-
BoS-15/109) as issued by the European Insurance and Occupational Pensions Authority (EIOPA).
Blue Square Re N.V. is referred to in this document as ‘Blue Square Re’, ‘BSR’, or ‘the Company’, and
the parent company, Aegon N.V. together with its member companies are referred to as ‘Aegon
Group’ or simply ‘Aegon’.
While the information contained in this report is purported to be true and accurate to the best of
BSR’s knowledge, this is nonetheless an unaudited report.

7
Summary Blue Square Re N.V. (BSR) FY 2016 Own Funds and SCR are as follows:
The Own Funds dropped substantially over the last year due to the novation of the US stop-loss
mortality contract in Q4, and mitigated by a partial restructure of the Synthetic Longevity Hedge
contract. The novation led to the derecognition of Own Funds represented by future premiums
under this contract, but it also released the SCRs associated with this treaty.
In Q3, BSR updated mortality and morbidity assumptions related to the key contracts, resulting in the
overall strengthening of reserves, especially for the Dutch Longevity Reinsurance contract. The
overall impact is also a reduction in Own Funds, with marginal change in the SCR.
Within the company, BSR had grown the number of full-time employees over the year. A Research &
Development unit is created to spearhead innovative projects and ideas. The previously Pricing &
Modelling unit is restructured and renamed to Business Development to strengthen the focus on
client relationship management, account planning and general business development initiatives. The
modelling function is moved into the Valuation & Capital unit.
The systems of governance do not see material changes other than the appointment of a new
Management Board and a new Supervisory Board member respectively to replace the outgoing
members of the respective board.
With the novation of the US stop-loss mortality contract in Q4, the risk profile of BSR is tipped
towards longevity risk. The nonlife block continues to grow as BSR continues to strengthen the
participation in nonlife reinsurance across the Group. As of Q1 2017, the longevity risk profile is
substantially reduced with the complete restructure of the Synthetic Longevity Hedge, which was a
management action undertaken since Q4 2016.
Over the year, BSR had also significantly improved and streamlined the internal processes, which
collectively mitigated the operational risk elements. Models were reviewed and migrated into a
standardized modelling approach while BSR continues to improve the modelling standards. A data
management project was undertaken to build an integrated data platform for the validation, storage
and management of data. A significant milestone related to data management is expected to be
accomplished in 2017 when a platform is rolled out for use. A Solvency II financial reporting system
was rolled out across the Group for the production of QRTs in the required format.
BSR completes an Own Risk and Solvency Assessment (ORSA) annually culminating in an ORSA report
that is shared with the regulator. The most recent ORSA was dated Q4 2016.
Solvency II key figures
Amounts in EUR millions Dec 31, 2016 Jan 1, 2016 %
Own Funds 81.1 168.6 -52%
SCR 59.5 65.1 -9%
Solvency II ratio 136% 259%
8
A. Business and Performance
A.1 Business
A.1.1 Overview
Blue Square Re N.V. is a public limited liability company with its statutory seat and head office in The
Hague, the Netherlands.
A.1.2 Regulators and auditor
The authority responsible for Solvency II supervision on Blue Square Re N.V. is:
De Nederlandsche Bank (DNB), the Dutch Central Bank;
Address : Westeinde 1, 1017 ZN, Amsterdam
Telephone : +31 (0) 20 524 91 11
The external auditor of Blue Square Re N.V. is:
PricewaterhouseCoopers Accountants N.V.
Thomas R. Malthusstraat 5
1066 JR Amsterdam
Postbus 90357
1006 BJ Amsterdam
The Netherlands
Telephone: + 31(0)88-7920020
The external auditor’s mandate does not cover an audit on the information disclosed in this SFCR.

9
A.1.3 Solvency II key figures
In the following table, the Solvency II key figures for BSR are presented:
The year-end 2016 Solvency II ratio of 136% (January 1, 2016: 259%) is based on the Solvency Capital
Requirement (SCR) calculated under Standard Formula. The Own Funds dropped substantially over
the last year due to the novation of the US stop-loss mortality contract in Q4, and mitigated by a
partial restructure of the Synthetic Longevity Hedge contract. The novation led to the derecognition
of Own Funds represented by future premiums under this contract, but it also releases the SCRs
associated with this treaty.
BSR updated mortality and morbidity assumptions related to the key contracts, resulting in the
overall strengthening of reserves, especially for the Dutch Longevity Reinsurance contract. The
overall impact is also a reduction in Own Funds, with marginal change in the SCR.
Other significantly business developments over the past year are described concisely in the Summary
section.
The composition of the Own Funds and the SCR are discussed more in detail in respectively section
E.2 Solvency Capital Requirement and Minimum Capital Requirement and section E.1 Own Funds.
The material differences between the financial statements based on IFRS and the Solvency II figures
are discussed in more detail in section D. Valuation for Solvency Purposes.
A.1.4 Holders of qualifying holdings
Blue Square Re N.V. is wholly owned by Aegon N.V., a Dutch multinational insurer domiciled in The
Netherlands and regulated by the DNB.
On December 31, 2016, Aegon N.V. held a total of 45 common shares out of a total of 225 authorized
shares. The remaining 180 shares remain unissued.
Blue Square Re is part of the Aegon N.V. Group The following picture illustrates the simplified
structure of the Aegon group, to show the legal position of Blue Square Re in the group.
Solvency II key figures
Amounts in EUR millions Dec 31, 2016 Jan 1, 2016 %
Own Funds 81.1 168.6 -52%
SCR 59.5 65.1 -9%
Solvency II ratio 136% 259%

10
Organizational structure of the significant entities of Aegon Group
A.1.5 BSR’s corporate structure
Blue Square Re N.V., incorporated and domiciled in the Netherlands, is a private limited liability
company organized under Dutch law and recorded in the Commercial Register of The Hague under its
registered address at Aegonplein 50, 2591 TV, The Hague, the Netherlands.
Blue Square Re N.V. is a wholly owned subsidiary of Aegon N.V. BSR’s website address is
www.aegonbluesquare.com.
Aegon N.V., incorporated and domiciled in the Netherlands, is the ultimate parent of the Aegon
Group and publishes consolidated financial statements that have been prepared in accordance with
International Financial Reporting Standards as adopted by the European Union and with Part 9 of
Book 2 of the Dutch Civil Code. Aegon N.V.’s consolidated financial statements are available on its
website (www.aegon.com).
BSR received its reinsurance license from De Nederlandsche Bank (DNB) on February 22, 2011 and
with that it undertakes its principal activity of a reinsurer for specified life and non-life insurance
risks. BSR does not employ any employees.
A.1.6 List of principal subsidiaries, joint ventures and investments in associates
BSR does not have any subsidiaries nor any material related undertakings.
Aegon N.V.
Aegon Asset Management
Aegon International
N.V.
Aegon Americas
Aegon Asia
Aegon Europe N.V,.
Aegon Netherlands
Aegon UK
Aegon CEE
Corporate Center B.V.
Blue Square Re N.V.

11
A.1.7 Related party transactions
BSR provides reinsurance services to other entities within the Aegon Group. For the year 2016, the
premium received from Aegon entities amounts to EUR 20,282k (with the total premium being EUR
42,233k).
The breakdown per legal entity is as follows (amounts in EUR ‘000):
In 2016, the Company provided expertise to Aegon Levensverzekering N.V. in order to assist in
entering into a possible transaction for an amount of EUR 180k. Aegon Levensverzekering N.V. also
pays an amount of EUR 50k to the Company for managing the collateral process, which is classified as
Commission and Fee income in the Annual Report.
Over 2016, the Company paid claims on the transactions entered into with Aegon Group companies
for the amount EUR 3,403k of which EUR 2,236k relates to the transaction with Scottish Equitable plc
and EUR 1,167k relates to the transaction with Aegon Emeklilik ve Hayat A.S..
The Company has entered into a service level agreement with Aegon N.V. As a result Aegon N.V. will
provide amongst others administrative, asset management services and conducting management.
Over 2016, Aegon N.V. charged the Company an amount of EUR 2,001k (2015: EUR 1,651k) for these
services.
The Company has entered into a service level agreement with Aegon Insights (previously Aegon
Direct Affinity Marketing Services) Regional Office (hereafter: AI RO). As a result AI RO will provide
pricing, modelling and actuarial services. Over 2016, AI RO charged the Company for an amount of
USD 200k for these services.
In June 2014, the Company entered into an investment mandate with Aegon Asset Management.
Over 2016 Aegon Asset Management charged an investment management fee of EUR 44k (2015: EUR
94k).
Over 2016, the Company paid EUR 4,259k (2015: EUR 5,318k) to Aegon Insights Japan as commission
for the acquisition of reinsurance contracts. The commission over November and December for the
amount of EUR 402k is not paid before December 31, 2016 and is therefore included as a payable to
a group company.
The receivables from group companies of EUR 3,456k (2015: EUR 3,476k) consist of receivables under
the reinsurance contracts. The main receivables are on Aegon Levensverzekering N.V. (EUR 730k),
Legal entity 2016 2015
Aegon Levensverzekering N.V. 3,115 3,191
Aegon Schadeverzekering N.V. 584 850
Aegon Magyarország Általános Biztositó Zrt 3,933 5,228
Aegon Emeklilik ve Hayat A.S. 3,355 2,687
Scottish Equitable plc 2,353 2,349
Transamerica Life Bermuda 2,363 775
Monumental Life Insurance Company 4,578 4,638
Total premium 20,282 19,718

12
Monumental Life Insurance Company (EUR 1,185k), Aegon Msagyarország Általános Biztositó Zrt
(EUR 912k), Transamerica Life Bermuda (EUR 603k) and Aegon Emeklilik ve Hayat (EUR 912k).
The payables to group companies of EUR 1,742k (2015: EUR 6,835k) mainly consist of a payable to
Aegon N.V. with respect to services charged to the Company and invoices paid by Aegon N.V. on
behalf of the Company (EUR 1,066k) and a payable to Aegon Insights Japan relating to the November
and December commission for the acquisition of reinsurance contracts (EUR 402k).
BSR is wholly owned by Aegon N.V., and as such none of the members of the BSR Management or
Supervisory Board has any direct interest in BSR’s shares.
A.1.8 Material lines of business and material geographical areas.
The reinsurance contracts ceded to BSR can be grouped into three major lines of business:
1. Life
2. Health
3. Non-life
The Life line of business is the most material line, and within it, is currently highly skewed towards a
single large longevity reinsurance contract (Dutch Longevity Reinsurance). As such, this contract will
contribute significantly to the performance and volatility of BSR’s result in comparison to the other
ceded businesses. The major risk underlying this segment is the risk of participants in the reinsured
portfolio living longer than expected. The Life line of business encompasses reinsured products
offering protection against mortality (both the risk of people dying and the risk of people living
longer) and morbidity (mainly critical illness and total and permanent disability).
The Health similar-to-life includes reinsured products offering protection against supplemental
health, critical illness and cancer treatment, and accidental death and dismemberment.
Lastly, the Non-life line of business includes household reinsurance and fire damages, as well as
natural catastrophe reinsurance programs.
Given the current business model of BSR where business is ceded from all geographical segments
over the world as shown in the list above, but the underlying insurance risks are directly assumed on
BSR’s own balance sheet, which is domiciled in The Netherlands, BSR does not yet split the business
into geographical areas based on ceding company’s risk location.
It is also important to note that BSR, as a young company, continues to grow the balance sheet in the
coming years especially as envisioned in the business plan. As the balance sheet and risk profile of
BSR continue to evolve in the future, the categories for the lines of business and geographical
segmentation may consequently change in the future.

13
The company did not employ employees in 2016 and 2015. Personnel is legally employed by Aegon
group entities. At the end of 2016, 13.8 fulltime equivalent employees were dedicated to Blue
Square Re.
A.2 Underwriting performance
A.2.1 Premium Income
The premium income is specified in the table below by material lines of business – life and non-life –
as per the Financial Statements.
(amounts shown in EUR ‘000s)
The decrease in life premium income is mainly a result of the unwinding of the China Modified
Coinsurance transaction which was included in the figures of 2015 for EUR 11.6m, this is partly offset
by the new Brazil Life and the Spain Life reinsurance treaties.
The increase of non-life premium can be explained by the growth of the portfolio with regard to the
Spain JV non-life transaction and the Mitsumi Sumitomo transaction. This block of business is
classified as non-life in the BSR Financial Statements, but reclassified as Health (similar-to-life) on the
Solvency II balance sheet.
The premium to reinsurers of EUR 4.9m (2015: EUR 5.9m) relates to the Turkey Life Reinsurance
contract (EUR 1.1m) and the Aegon Hungary transaction (EUR 3.7m).
Gross Reinsurance
2016
Total Life 21,265 1,112
Non-Life
Property & Casualty 10,765 3,746
Accident & Health 5,790 -
Total Non-Life 16,555 3,746
Total Life & Non-Life 37,820 4,859
Gross Reinsurance
2015
Total Life 27,891 704
Non-Life
Property & Casualty 7,849 5,228
Accident & Health 3,555 -
Total Non-Life 11,404 5,228
Total Life & Non-Life 39,295 5,932

14
A.2.2 Policyholder claims and benefits
(amounts shown in EUR ‘000s)
The decrease in the policyholder claims and benefits is mainly the result of unwinding of the China
Modified Coinsurance transaction in Q1 2016 offset by higher claims for the UK Individual Protection
and the Brazil Life reinsurance treaties.
The increase in the change in valuation of liabilities for reinsurance contracts is mainly driven by the
mortality assumption updates, especially for the Dutch Longevity Reinsurance contract.
A.3 Investment performance
A.3.1 Investment income and expenses
This section provides an overview of the investment performance. The investment performance is
specified by income only as the investment income is shown net of investment management fees.
Investment income
(amounts shown in EUR ‘000s)
The interest income mainly relates to the deposit that was held by the cedant with regard to the
modified coinsurance transaction that was unwound in Q1 2016.
The dividend income relates to the dividend received on the investment funds.
A.3.2 Results from financial transactions
(amounts shown in EUR ‘000s)
2016 2015
Claims and benefits paid to policyholders 10,023 11,781
Change in valuation of liabilities for reinsurance contracts 23,061 16,379
Total 33,084 28,160
2016 2015
Interest income 1,206 3,410
Dividend income 179 -
Total 1,385 3,410
Results from financial transactions comprise: 2016 2015
Net fair value change of shares at fair value through profit or loss (2,738) (196)
Net fair value change of free standing derivatives 11,866 9,588
Net fair value change of financial liabilities 58 (86)
Net foreign currency gains and (losses) 498 (1,807)
Total 9,684 7,499

15
The net fair value gains of shares relate to the unrealized fair value movements (minus transaction
expenses) relating to the investments in Aegon Asset Management Investment Funds and Insurance
Linked Securities (“ILS”).
The net fair value loss of free standing derivatives relate to the longevity index derivative the
Company entered into in 2013 as well as the net fair value change of interest rate swaps the
Company entered into to hedge the interest rate sensitivity of the longevity index derivative. As a
result of unwinding the MLIC transaction an amount of EUR 9m is paid for unwinding the longevity
index derivative for the mortality leg. The change in comparison to prior year includes fair value
movements and assumption and model updates.
The net foreign currency gains mainly relate to the foreign currency results on the Deferred
Acquisitions Costs for reinsurance contracts and the results on the FX forwards.
A.3.3 Projections of expected investment performance
The investment performance is expected to perform normally over 2017. As the underlying securities
in BSR’s investment funds are of highly-rated and of short-term nature, we expect a return of 0 - 1%
on the Investment funds and a return of around 6 - 8% on the Insurance Linked Securities. At this
moment there are no plans to rebalance the investment portfolio, as the current liability duration of
BSR is negative, the expected liability is more than funded by expected future premiums.
In addition, the investment in insurance-linked securities is exposed to random natural catastrophe
events and as such, a normal year is expected to give good return, except in the unpredictable event
that a major catastrophe occurs. As most of BSR’s funds have been invested in highly-rated and
short-term instruments and since liability duration is negative, this fund is complementary to the risk
profile of other investments as it delivers a higher expected yield. The benefit of this fund choice is
that it offers diversification to BSR’s balance sheet in terms of risk exposure, and consequently, offers
a very attractive return on risk capital.
A.3.4 Investments in securitisation
BSR does not hold any investments through portfolio securitization. BSR had invested in some asset-
backed securities (ABS) through an ABS fund managed by Aegon Asset Management, and had fully
liquidated the position by year end 2016.
A.4 Performance of other activities
A.4.1 Other activities income and expenses
This section provides an overview of the performance of other activities – other than underwriting or
investment income and expenses.
With regard to other activities not related to underwriting or investment income and expenses, Blue
Square Re provides services to Aegon the Netherlands with regard to support on collateral processes
and consultancy services on longevity transactions for a total amount of EUR 230k.

16
A.4.2 Material leasing arrangements
Blue Square Re does not have any material leasing arrangements.
A.5 Any other information All relevant material information is included in this report; the management of Blue Square Re is not
aware of any other relevant information regarding the business, financials, and performance.
Performance of other activities
Amounts in EUR millions 2016 2015
Fee and commission income 0.0 0.0
Other revenues 0.2 0.4
Other income 0.0 0.0
Total other income 0.2 0.4
Commission and expenses 0.0 0.0
Interest charges and related fees 0.0 0.0
Other charges 0.0 0.0
Total other charges 0.0 0.0
Total performance other activities 0.2 0.4

17
B. System of Governance
B.1 General information on the System of Governance
B.1.1 Corporate governance
Blue Square Re N.V. is a public limited liability company incorporated and based in the Netherlands.
As a company established in the Netherlands, Blue Square Re must comply with Dutch law and
subscribes voluntarily to suitable parts of the Dutch Corporate Governance Code.
The company has a two-tier board system, with a Supervisory Board and a Management Board.
B.1.1.1 General Meeting of Shareholders
A General Meeting of Shareholders is held at least once a year and, if deemed necessary, the
Supervisory or Management Board of the Company has the authority to convene an Extraordinary
General Meeting of Shareholders. The main function of the General Meeting of Shareholders is to
decide on matters such as the adoption of annual accounts, amendment of the articles of
association, the approval of the remuneration of the Management Board and the Supervisory Board,
dividend payments and (re)appointments to the Supervisory Board and Management Board of Blue
Square Re.
B.1.1.2 The Supervisory Board and its committees
Blue Square Re Supervisory Board oversees the Management Board and the general course of affairs
of Blue Square Re in relation to the Company's business and corporate strategy. The Supervisory
Board must take into account the interests of all Blue Square Re stakeholders. The Supervisory Board
operates according to the principles of collective responsibility and accountability.
Composition of the Supervisory Board
Members of the Supervisory Board are appointed by the General Meeting of Shareholders. BSR aims
to ensure that the composition of the Company's Supervisory Board is well balanced in terms of
professional background, geography and gender. A profile has been established that outlines the
required qualifications of its members. The profile is tailored to the Company’s nature, size and
complexity and also incorporates the competences of the in DNB’s Suitability Matrix for Supervisory
Boards.
The Supervisory Board has drawn up a Succession Planning of the Blue Square Re Supervisory Board.
The Succession Planning will be reviewed, and updated if necessary, annually. Remuneration of the
Supervisory Board members is determined by the General Meeting of Shareholders.
The Supervisory Board currently consists of four members. The Company and the Supervisory Board
believe this number is appropriate to the nature, size and complexity of the Company. The
Supervisory Board is diverse in terms of gender and professional background of its members. The
diversity of its members ensures the complementary profile of the Supervisory Board. The
Supervisory Board does not have a risk and or audit sub-committee. Audit, risk and remuneration
related topics are discussed by the Supervisory Board in full.

18
The main role and responsibilities of the Supervisory Board are to fulfil its oversight responsibilities
regarding:
The achievement of Blue Square Re’s objectives;
The corporate strategy and the risks inherent in the business activities;
The integrity of the financial statements and financial reporting processes;
Internal control systems and the effectiveness of the internal audit process;
The performance of the external auditors and the effectiveness of the external audit process,
including monitoring the independence and objectivity of PwC;
Risk strategy, risk tolerance, risk monitoring and risk governance;
Regulatory compliance;
Overseeing the remuneration of the Management Board and Control functions;
Board member succession planning;
Reviewing and updating board profile and charters for the Supervisory and Management
Board;
Overseeing the corporate governance structure of the Company;
Any other applicable corporate governance legislation and regulations.
The Supervisory Board advises on the activities of the Management Board, identifying any matters
about which it considers action or improvements are needed, and making recommendations as to
the steps to be taken. Furthermore, the Supervisory Board regularly reviews risk exposures as they
relate to capital, earnings and compliance with risk policies. The Company's risk management is an
important topic for the Supervisory Board.
Composition of the Supervisory Board
According to the articles of association the Supervisory Board should consist of at least three
members. The Supervisory Board is composed of Independent Supervisory Directors and Aegon
Supervisory Directors. The majority of the members of the Supervisory Board must qualify as
independent.
The Board member is independent when there is no employment relationship between the person
and any company within the Aegon Group for the last five years.
The Supervisory Board currently consist of four members:
Wolf Becke, who is the Chairman and an independent board member;
Annette Sadolin, who is the Vice-Chairman and is an independent board member;
Patrick Peugeot, who is an independent board member;
Michiel van Katwijk, who is an Aegon Supervisory Director.
Key Functions
A description of the main roles and responsibilities of key functions, how they have necessary and
operational independence is disclosed in section B.2 Fit and proper requirements.

19
B.1.1.3 The Management Board
Blue Square Re's Management Board is responsible for the overall management of the Company and
is therefore responsible for achieving Blue Square Re's business objectives, developing the strategy
and its associated risk profile, taking into account the interests of all Blue Square Re stakeholders and
the development of the Company's earnings. Each member has duties related to his or her specific
area of expertise and for the management of the company as a whole.
Blue Square Re's Articles of Association determine that for certain decisions the Management Board
must seek prior approval from the General Meeting of Shareholders. In addition, the approval policy
of Blue Square Re determines that the Management Board must seek prior approval for certain
decisions from the Supervisory Board, and for certain decisions approval from the Executive Board of
Aegon N.V. prior to the Management Board approval.
Composition of the Management Board
The Management Board consists of a minimum of two Managing Directors, as described in the
articles of association. Members of the Management Board are only appointed by the General
Meeting of Shareholders after the Regulator has declared that it does not object to the intended
appointment.
The Management Board of Blue Square Re consists of:
Chris Madsen, who is Chief Executive Officer (CEO) and Chairman;
Martine Ammerlaan, appointed as Chief Financial Officer (CFO) and responsible for
Operations;
Pat Curtin, appointed as Chief Risk Officer (CRO, stepped down per April 30th, 2017);
Barry White member of the Management Board.
The number of Management Board members and their terms of employment are determined by the
General Meeting of Shareholders. The Supervisory Board prepares a profile for the size and
composition of the Management Board, taking into account the requirements regarding the
suitability and reliability as required under the provisions of the Act on Financial Supervision (Wet
financieel toezicht). Management Board members are appointed by the General Meeting of
Shareholders, following nomination by the Supervisory Board.
Role of the Management Board
The Management Board is entrusted with the overall strategic direction of the Company, more in
particular with respect to:
Setting, implementing and achieving the Company’s business objectives and strategy as well
as ensuring the delivery of results;
Establishing, monitoring and, where necessary, adjusting overall risk management of BSR.
Ensuring proper embedding of the risk strategy, the risk tolerance, risk monitoring and risk
governance;
Responsible for the set up and the proper functioning of the governance of new products or
services (business acceptance process);
The compliance with all relevant laws and regulations;

20
Assessing adequate functioning of the internal control framework by setting up and
periodically reviewing a system of monitoring and reporting;
Analysing risks with regard to Blue Square Re’s operational and financial objectives;
Adopting, discussing and sponsoring Blue Square Re’s policies;
Establish and periodically review effective systems of governance, which includes an
adequate transparent organisational structure with a clear allocation and appropriate
segregation of responsibilities;
Establishing and maintaining internal procedures that ensure that all major financial
information is known;
Responsible for the quality and completeness of (publicly) disclosed financial reports;
Ensuring that the External Auditor can properly perform his audit work;
Ensuring that effective processes and procedures are in place to prevent conflicts of interest
and identifying any potential sources of conflicts of interest;
An effective system for ensuring the transmission of relevant information.
Each individual Management Board member is accountable for the operations and management of
the role that the member is responsible for, in line with the Company’s policies, values and principles
and compliance standards. Management Board members are collectively responsible for managing
the company as a whole.
The Management Board shall have full information rights vis-à-vis all departments and processes
within the Company. The Management Board shall, in performing their duties, have access to the
expertise of and support and services from all BSR’s departments.
In the performance of their responsibilities, the Management Board shall act in accordance with the
interests of the Company and the business connected with it, taking into consideration the interests
of the Company’s stakeholders. The members of the Management Board shall externally express
concurring views with respect to important affairs, matters of principle and matters of general
interest in accordance with the final decision taken, with due observance of each member’s
individual responsibilities.
A description of how the risk management and internal control systems and reporting procedures
are implemented consistently, reference is made to section B.4 Internal Control system. Information
on any material intra-group outsourcing arrangements is described in section B.7 Outsourcing.
B.1.1.5 Material changes in the system of governance.
On April 30th, 2016 Ronald de Leeuw stepped down from the Management Board. On June 14th, 2016
Martine Ammerlaan was appointed as CFO and member of the Management Board. As per April 30th,
2017 Pat Curtin stepped down from the Management Board.
On June 1st, 2016 Karen Wright stepped down as Supervisory Director. On December 1st, 2016
Michiel van Katwijk took up office as a Supervisory Director.

21
B.1.2 Remuneration policy
Remuneration Principles
There were no employees employed by Blue Square Re N.V. in either 2016 or 2015. All employees,
including the Management Board are employed by Aegon Nederland N.V. or an Aegon Group
company. BSR has adopted the Aegon Group Global Remuneration Principles as laid down in the
Aegon Group Global Remuneration Framework (AGGRF) as a result whereof all employees working
for BSR are exposed to these principles
The Aegon Group Global Remuneration Principles (AGRF) provide the foundation for remuneration
policies and practices throughout the Aegon Group. The AGRF defines specific terms and conditions
for the employment of various groups of staff. In addition, all steps in the remuneration process, in
addition to the involvement of Human Resources, Risk Management, Compliance and Audit, are
governed by the AGRF and its underlying policies.
These Global Remuneration Principles are applied and implemented locally by BSR. The key pillars of
the Aegon Group Global Remuneration Principles are as follows:
Aegon remuneration is employee-oriented by: fostering a sense of value and appreciation in
each individual employee; promoting the short- and long-term interests and well-being of all
Aegon staff via fair compensation, pension and/or other benefits; supporting employees’
career development; and supporting the (international) mobility of its staff;
Aegon remuneration is performance-related by: establishing a clear link between pay and
performance by aligning objectives and target setting with performance evaluation and
remuneration; reflecting individual as well as collective performance in line with Aegon's
long-term interests; enhancing the transparency and simplicity of Aegon Group
remuneration, consistent with the principle of pay for performance; avoiding any pay for
non-performance;
Aegon remuneration is fairness-driven by: promoting fairness and consistency in Aegon’s
remuneration policies and practices, with remuneration packages that are well-balanced
across the different echelons within Aegon and its business units; avoiding any discrimination
in Aegon’s remuneration structures, including, among others, discrimination based on
nationality, race, gender, religion, sexual orientation, and/or cultural beliefs; creating global
alignment in the total compensation of all Identified Staff; aiming at controlled market
competitive remuneration, by providing total compensation packages in line with an
appropriately established peer group at a regional unit, country and/or functional level; and
Aegon remuneration is risk-prudent by: aligning business objectives with risk management
requirements in the target setting practices throughout the Aegon Group; giving an incentive
to appropriate risk-taking behavior while discouraging the taking of excessive risks;
protecting the risk alignment effects embedded in the remuneration arrangements of
individual staff against any personal strategies or insurance to counter them.
The AGRF, contains the guiding principles to support sound and effective remuneration policies and
practices by ensuring consistency throughout the Aegon Group. The framework is designed in
accordance with relevant rules, guidelines and interpretations, for instance the Decree on Sound
Remuneration Policy (Regeling beheerst beloningsbeleid (Rbb) Wft 2014) from DNB (the Dutch

22
Central Bank), and the 2015 Act on the Remuneration Policy of Financial Undertakings (Wet
beloningsbeleid financiële ondernemingen, Wbfo 2015 stb 2015, 45).
The regulations concern, among other things, a cap on variable compensation of twenty percent
(20%) of the fixed compensation and require at least fifty percent of the performance indicators used
for determining variable compensation to be of a non-financial nature. In addition the regulations
limit the use of financial retention and severance arrangements. The Wbfo has a provision that
makes it possible to apply an average variable compensation maximum of twenty percent (20%) for
employees whose employment conditions are not primarily determined by a Collective Labour
Agreement. As a result employees may receive a higher maximum as long as the average variable
compensation for this category of employees is twenty percent (20%) of the total fixed income of
that group of employees. Since the employment conditions of the BSR board members are not
primarily determined by a Collective Labour Agreement, Blue Square Re has offered the
Management Board a maximum variable compensation opportunity in line with the Wbfo exemption
of an average of twenty percent (20%) of variable compensation as referred to hereinbefore.
Role of Risk Management and Compliance
Variable compensation may have an impact on risk-taking behaviors and, as such, may undermine
effective risk management. This can lead to excessive risk taking, which can have a material impact
on the Company's financial soundness. To avoid such undesired effects, both the Aegon Group Risk
Management and Aegon Group Compliance functions are involved in the design and execution of
remuneration policies and practices. Given the size and complexity of BSR, the Risk Management and
Compliance functions for remuneration policies and practices are performed by the Aegon Group
Risk Management and Aegon Group Compliance functions.
The AGRF includes separate remuneration policies for specific groups of employees. This is in
recognition of the fact that these employees' roles and responsibilities require specific risk mitigating
measures and governance processes. These remuneration policies are for material risk takers
(Identified Staff) and Control Staff. Given the rationale for having a separate policy for material risk
takers and the risk mitigating measures that are applied to the remuneration of these individuals,
Risk Management is involved in deciding which positions are deemed 'Identified Staff'. Regarding the
form and timing of payments, the regulation requires a portion of the variable remuneration paid to
Identified Staff (i.e. members of the BSR Management Board) to be deferred and partially paid in
shares. Furthermore, where exceptions to the policies are requested to reflect local practices or
regulations, Risk Management and Compliance are involved in order to ensure such exceptions do
not undermine effective risk management and that sufficient mitigating measures are undertaken.
In addition, the Risk Management and Compliance functions, together with the Aegon Group Human
Resources and Aegon Group Finance functions, are responsible for the execution of the various
measures that ensure the AGRF and associated practices are aligned with the defined risk tolerances
and behaviors. The risk mitigating measures are taken prior to the pay-out of compensation to
individual employees (regardless of whether the compensation is deferred) as well as after pay-outs,
or allocated but deferred payments (before vesting of these payments) to ensure sustainability of
performance, are considered ex-post measures.
23
The risk management process is aimed to find an appropriate balance of ex-ante and ex-post
assessments to ensure effectiveness in both the short- and long-term risk taking behavior of
employees.
General compensation practices
The Aegon Group Global Remuneration Principles are based on a pay philosophy of total
compensation total compensation. This means that the aim is for total remuneration for experienced
and competent employees to be consistent with the market in which Blue Square Re operates and
competes for employees. Total compensation typically consists of base salaries and - where in line
with local market practices - variable compensation. Market survey information from reputable
sources is used to provide information on competitive compensation levels and practices.
Variable compensation, if any, is capped at an appropriate level as a percentage of base pay. Variable
compensation for senior management is usually paid out in cash and shares in Aegon NV over
multiple years, and is subject to further conditions being fulfilled. There is an additional holding
period for one year. Variable compensation already paid out may also be retrieved under certain
circumstances ('Claw-back').
Pension arrangements are offered in line with market practice.
In the following sections more detailed information is provided on the compensation practice for the
Supervisory Board and the Management Board of Blue Square Re.
Supervisory Board Remuneration
Independent Supervisory Directors are entitled to a base fee for membership of the Supervisory
Board. No separate attendance fees are paid to members for attendance at the regular Supervisory
Board meetings. The external members of the Supervisory Board receive an annual remuneration of
EUR 40k for the chairman and EUR 25k for the other members (excluding VAT).
The fee is a fixed amount. Independent Supervisory Directors do not receive any performance or
equity-related compensation, and Independent Supervisory Directors do not accrue pension rights
with Blue Square Re. These measures are designed to ensure the independence of Independent
Supervisory Board members and to strengthen the overall effectiveness of Blue Square Re's
corporate governance.
The Internal Supervisory Directors do not receive remuneration from Blue Square Re.
The remuneration of an internal member of the Blue Square Re’s Supervisory Board is based on the
AGRF and the therewith connected – for that specific function and employer applicable – Reward
Policy, as may be amended from time to time.
Management Board remuneration
Blue Square Re's Management Board is remunerated on the basis of the principles described in the
AGRF.

24
The remuneration for Management Board members charged to the Company in the financial year
pursuant to Section 383:1 of Book 2 of the Netherlands Civil Code is set out below (amounts in
thousands of euros).
The members of the Management Board are not employed by the Company. For the year 2016,
expenses for the members are either included in employee expenses (for members fully dedicated to
the Company) or are included in the cost charge from Aegon N.V.
During 2015 and 2016, a few Management Board members received Long Term Incentive and
Variable compensation. These Management Board Members have been identified as material risk
takers and control function holders at Aegon group level.
Below an overview is provided of the number of shares in Aegon NV resulting from the active plans
for Long Term Incentive and Variable Compensation for the Management Board members.
*) included on the basis of "on target" performance. Actual performance is established after 31 December of the performance period
Role of the Aegon NV’s Remuneration Committee
The Remuneration Committee of Aegon's Supervisory Board has overall responsibility for the Aegon
Group's Remuneration Policies. Members of the Committee are drawn from the Aegon N.V.
Supervisory Board.
Each year, Aegon's Remuneration Committee reviews Aegon's remuneration policies to ensure they
remain in line with prevailing international standards. This review is based partly on information
provided by Aegon's external advisor, Willis Towers Watson.
The Aegon Remuneration Committee may recommend changes to the policies to the Aegon
Supervisory Board. Given the size and complexity of Blue Square Re and the fact that the Company
only performs its activities for Aegon group entities it has no separate remuneration committee.
2016 2015
Current Management Board Members
Gross salary and social security contributions 352 385
Pension Premium 26 31
Other benefits * 325 232
Total 703 649
* Within the other benefits short term incentive plans are included.

25
Since the board members of Blue Square Re who receive variable compensation have been identified
as material risk taker and control function holder at group level, Aegon’s Remuneration Committee is
supervising the remuneration of these board members.
Fixed compensation
The fixed compensation of the members of the BSR Management Board is based on their
qualifications, experience and expertise.
Variable compensation
The Aegon Global Remuneration Principles are based on the belief that variable compensation
strengthens the commitment of the Management Board of Blue Square Re to the Company's
objectives, business strategy, risk tolerance and long-term performance. Variable compensation is
based on a number of individual and company performance indicators that are linked to these items.
The indicators are regularly evaluated by experts in the Aegon Groups Finance, Risk Management,
Business Control, Audit, Human Resources and Compliance departments to ensure the alignment
remains strong.
Performance is assessed by Aegon's Remuneration Committee and validated by the full Supervisory
Board. Each year, a one-year target is set for each performance indicator. By paying half of the
variable compensation in cash and the other half in shares, together with adding deferral and
additional holding periods to the variable compensation that is allocated, the long-term interests of
Management Board members are aligned with the interests of BSR and its stakeholders.
All variable compensation is conditionally granted at the beginning of each performance period. The
number of conditionally granted shares is calculated using the value of one Aegon share at the
beginning of this period. This value is equal to the average price on the Euronext Amsterdam stock
exchange for the period December 15 to January 15. After the performance year, the Company
assesses the realized performance against the performance indicators and compares the minimum,
target and maximum levels of the performance indicators with the realized performance. The
amount of conditional variable compensation that can be allocated is then established. Variable
compensation is allocated once the accounts for the financial year are prepared and after an ex-ante
assessment.
The allocated variable compensation consists of equal parts of cash and shares, of which 60% is paid
out (or vests) in the year following the performance year, and 40% is deferred to later years. This
deferred portion remains conditional until it vests.
The deferred parts vest in equal tranches after a one-year holding period. After an ex-post
assessment, which may lower the vesting portion, these two individual parts are paid 50% in cash
and 50% in shares. The shares are restricted for a further period of one year (with the exception of
shares withheld to cover for the payment of any applicable taxes, social security premiums and
possible other deductions by the government due for which the company holds a withholding
obligation in connection with the vesting of the shares).

26
The variable compensation pay-out can be illustrated by the following example and the table below.
For every 1,000 variable compensation that is allocated following the performance period, 600 is
paid out/vested in the year following that performance year (N in the following table). This part will
be paid 50% in cash (=300) and 50% in shares vesting immediately (=300 /5.128 = 49 shares). The
remaining 400 is deferred and vests according to a pre-defined schedule.
Risk adjustment methodology (ex-ante)
At the end of the performance period, but prior to allocation of variable compensation, the
Remuneration Committee Board assesses whether (downward) modifications are needed. For this
purpose, quantitative and qualitative measures at group, regional unit and individual level are taken
into account, such as:
Breaches of laws and regulations;
Breaches of internal risk policies (including compliance);
Significant deficiencies or material weaknesses relating to the Sarbanes-Oxley Act; and
Reputation damage due to risk events.
Ex-post assessment and discretionary adjustments
The Remuneration Committee uses its judgment in the assessment of the outcome of
strategic/personal targets to ensure that, taken together, they represent a fair reflection of the
overall performance of the Management Board member over the performance period.
In addition, the Remuneration Committee applies an ex-post risk assessment to deferred payouts of
variable compensation to determine whether allocated (that is, unvested) variable compensation
should become unconditional (meaning it vests) or should be adjusted. This ex-post assessment is
based on informed judgment by the Remuneration Committee, taking into account significant and
exceptional circumstances that are not (sufficiently) reflected in the initially applied performance
indicators.
Performance N N+1 N+2 N+3 N+4
Year
c
60% upfront s h h h
c c
c s h h h
40% Deferred c c
s s h h h
s c
s s h h
c Cash s Shares h Holding period
1/3
1/3
1/3

27
Implementation of this authority is on the basis of criteria such as:
The outcome of a re-assessment of the performance against the original financial
performance indicators;
A significant downturn in the Company’s financial performance;
Evidence of misbehavior or serious error by the participant;
A significant failure in risk management; and
Significant changes in the Company’s economic or regulatory capital base.
The Supervisory Board of Aegon asks the Remuneration Committee to review these criteria in detail
prior to each vesting and to document its findings. Based on this analysis, the Committee may then
put forward a proposal to the Supervisory Board of Aegon to adjust unvested variable compensation.
Deferred variable compensation may only be adjusted downwards. Ex-post, risk-based assessments
concern deferred variable compensation, not fixed compensation.
Circuit breaker
For each performance indicator, variable compensation is only paid if the threshold level set for that
performance indicator is reached
Claw-back provision
Where required based on the regulations that apply from time to time, where variable compensation
is based on incorrect data (including non-achievement of performance indicators in hindsight), or in
the event of material financial restatements or individual gross misconduct, Blue Square Re's
Supervisory Board is obliged to claim back variable compensation that has already been paid out or
vested.
Pension scheme
Members of Blue Square Re's Management Board are offered an Aegon group pension scheme.
Benefits offered are consistent with the local Aegon pension agreements, there are no specific early
retirement schemes.
The principal features of the pension scheme were as follows in 2016:
Average pay pension plan
Retirement age: 67 years
Accrual rate for old-age pension: 1.875% for all salary groups
Employee contribution: 5.45% of pensionable earnings
Pensionable salary: fixed annual salary on 1 April of any year (capped at EUR 101,519 gross)
Partner’s pension: 70% of projected old-age pension
Orphan’s pension: 14% of projected old-age pension
Flexible elements: early retirement, deferred retirement, exchange, high/low, part-time
No allowance for discretionary pensions

28
Loans
Blue Square Re does not grant Management Board members personal loans, guarantees or other
such arrangements, unless in the normal course of business and on terms applicable to all Aegon
employees.
Employment contracts
Members of the Management Board of Blue Square Re have a contract of employment with an
Aegon group entity, no severance payments were paid to Management Board members during the
year.
Other than intragroup reinsurance transactions as part of the business model for BSR as an internal
reinsurer (described in section A.1.7 Related party transactions) and the Aegon Corporate Center
cost charges (find ref), there are no other material transactions with the shareholder Aegon NV, with
persons who exercise a significant influence on the undertaking, and with members of the
Management Board or Supervisory Board.
B.1.3 Organizational Structure
In section B.2.1 Requirements, a list of the persons that are responsible for key functions within Blue Square Re is provided. Besides the members of the Management Board and Supervisory Board, Colin Selfridge, Alexander MacLean and Ruurd van den Berg are Solvency II key function holders.
B.2 Fit and proper requirements
B.2.1 Requirements
Aside from the General Meeting of Shareholders, as a public limited liability company under Dutch
law, Blue Square Re is governed by a two-tier board system, the Supervisory Board and the
Management Board. Blue Square Re’s Management Board is responsible for the day to day
management and the implementation of Blue Square Re’s strategy.
B.2.1.1 Supervisory Board
Blue Square Re’s Supervisory Board oversees the management of the Management Board, in
addition to the Company’s business and corporate strategy. The Supervisory Board must take into
account the interests of all Blue Square Re’s stakeholders. The Supervisory Board operates according
to the principles of collective responsibility and accountability.
All members of Blue Square Re’s Supervisory Board have been tested by the Dutch supervisory
authorities (DNB and AFM) on fitness and propriety prior to their appointment and fulfil these
requirements at an ongoing basis.

29
The following were members of the Blue Square Re’s Supervisory Board during the course of 2016: Supervisory Board
Wolf Becke Annette Sadolin Patrick Peugeot Karen Wright (till June 1st ,2016 Michiel van Katwijk (from December 1st, 2016)
B.2.1.2 Management Board
The Management Board is charged with the management of the Company, which means, among other
things, that it is responsible for the setting and achieving of the Company's objectives, strategy and
the associated risk strategy and risk tolerance, the ensuing delivery of results and corporate social
responsibility issues that are relevant to the company. The Management Board is accountable for these
matters to the Supervisory Board. The responsibility for the management of the Company is vested
collectively in the Management Board. The Management Board is responsible for compliance with all
relevant laws and regulations, for managing the risks attached to the Company’s activities and for the
financing the Company. The Management Board reports on these issues to and discusses the internal
risk management and control systems with the Supervisory Board
Individual members of the Management Board have responsibilities with specific parts of the
managerial tasks, without prejudice to the collective responsibility of the Management Board as a
whole. The Management Board remains collectively responsible for decisions, even if they are
prepared by individual members of the Management Board. An individual member of the
Management Board may only exercise such powers as are explicitly attributed or delegated to him and
he may never exercise powers beyond those exercisable by the Management Board as a whole. The
division of tasks within the Management Board is determined (and amended, if necessary) by the
Management Board, subject to the approval of the General Meeting of Shareholders. Management
Board members especially charged with particular managerial tasks are primarily responsible for the
risk control and monitoring of the managerial tasks concerned.
All members of the Management Board (as day-to-day policymakers of Blue Square Re) have been
tested by the Dutch supervisory authorities on fitness and propriety prior to their respective
appointments and fulfil these requirements at an ongoing basis.
The following were members of the Management Board during the course of 2016:
Management Board Approved Function
Chris Madsen Chairman, Chief Executive Officer Martine Ammerlaan Chief Financial Officer (started June 14th , 2016) Pat Curtin Chief Risk Officer Barry White Member Ronald de Leeuw Chief Operation Officer (till April 30th, 2016)

30
B.2.1.3 Other key functions
Blue Square Re has implemented the following four key control functions: risk management,
compliance, internal audit and the actuarial function.
Risk management
o Blue Square Re’s CRO is the function holder for risk management. He is also member
of the Management Board and chairs the Risk Committee. (Risk management is
described in more detail in section B.3 Risk management system including the Own
Risk and Solvency Assessment)
Compliance
The Aegon global head of Regulatory Compliance is the key function holder for Compliance at
BSR. Compliance resides under the Group CRO and is therefore a 2nd line role given The
independence and role of the BSR Compliance function are described in the BSR Compliance
Charter and address the Solvency II independence requirements and responsibility for
ensuring that the risk profile is managed in line with risk tolerance. Please refer to Section
B.4.2 Compliance activities and policy.Internal Audit
The Aegon global head of Internal Audit is the function holder for Internal Audit at BSR. In line with
the requirements, Internal Audit is fully objective and independent from all other functions,
reporting directly into the CEO and Supervisory Board Audit Committee. (Section
o B.5 Internal Audit function)
Actuarial function
o The Actuarial Function Holder resides within the 2nd line of defense at BSR with a
functional line to the CRO and a dotted line to the Supervisory Board. (Section B.6
Actuarial function)
The following Blue Square Re officers have also been approved by the appropriate Dutch regulatory bodies in 2016 following the requirement in the Netherlands that the Dutch regulatory bodies assess the integrity of the Solvency II key function holders.
Approved Person Approved Function Colin Selfridge Actuarial Function Holder Ruurd van den Berg Audit function Holder Alexander MacLean Compliance Function Holder
B.2.2 Process for assessment
In accordance with the Dutch Financial Supervision Act, Blue Square Re N.V., as a Reinsurance
company has identified, in addition to the members of the Management Board and Supervisory
Board, those persons that fulfil “key functions” as referred to in articles 3:271 and 3:272, in
connection with articles 3:8 and 3:9 of the Dutch Financial Supervision Act. This group of persons is
broader than but includes all persons that fulfil key functions as referred to in art. 294 (2) of the
Solvency II Delegated Regulation. These persons are subject to a pre-employment screening prior to
their employment within Aegon, as well as a propriety assessment by the Dutch supervisory
authorities prior to their appointment in a key function.

31
Ongoing compliance with propriety requirements of the persons that effectively run the undertaking
or have other key functions is a joint responsibility of the respective person as well as Blue Square
Re.
Fitness of the persons that effectively run the undertaking or have other key functions is determined
as part of the recruitment process. For each function Blue Square Re has drawn up a specific job
profile. Fitness of a specific person for a function is assessed against this job profile. The ongoing
compliance with fitness requirements is monitored as part of the regular HR cycle within BSR.
B.3 Risk management system including the Own Risk and Solvency
Assessment
B.3.1 Risk management system
B.3.1.1 Enterprise Risk Management Framework
BSR applies the methodology prescribed in the Aegon Enterprise Risk Management (“ERM”) Manual.
ERM is a company-wide holistic process which is designed to anticipate, identify and manage
potential events that may affect BSR. The aim is to manage risk within BSR’s risk tolerance in order to
provide reasonable assurance regarding the achievement of BSR’s objectives.
For BSR, ERM involves:
Understanding which risks BSR is facing;
Establishing a framework through which risk return trade-offs can be assessed;
Establishing risk tolerances, and supporting policies, for the level of exposure to a particular
risk or combination of risks;
Monitoring risk exposure and actively maintaining oversight over the Company’s overall risk
and solvency positions.
32
BSR’s ERM process can be broken down into multiple components. However, ERM is not strictly a
sequential process, where one component affects only the next. It is a multidirectional, iterative
process in which almost any component can and does influence another.
The principles and requirements of ERM apply on all organizational levels and concern both financial
and operational risks. Risks are managed from multiple perspectives, including economic, regulatory
and accounting. Relevant metrics in ERM include capital, earnings, liquidity value.
The first building block in the enterprise risk management process is the formulation of a risk
strategy. The risk strategy forms the basis for our risk tolerance, which is specified in terms of
financial strength, continuity, culture and risk balance and are translated into operating guidelines
for the various risk types
Compliance with the risk tolerance and the risk policy requirements is monitored and reported on at
least a quarterly basis to the BSR Risk and Capital Committee (“BSR RCC”). Once the risks have been
identified, evaluated and prioritized, an appropriate risk response needs to be defined. Action plans
are developed and managed if BSR’s risk tolerances are violated.
BSR controls the risk it faces along various dimensions through its risk governance framework, risk
monitoring, model validation, and embedding of risk management into functional areas, such as
business planning, capital planning and management, remuneration, pricing and product
development. Risk control is further supported by a strong risk culture and effective compliance risk
management.
The execution of these building blocks is a continuous and iterative undertaking, including periodic or
ad hoc adjustment of the strategy and risk tolerance based on new risk information or changes in the
business (environment).
Risk Strategy
The purpose of BSR’s risk strategy is to provide direction for the desired risk profile while supporting
BSR’s business strategy. An assessment is made whether BSR has the competence to manage the risk
and BSR’s risk preferences are formulated. In other words: from a risk-return perspective, which risks
BSR likes and which risks it wants to avoid. The assessment of risk preferences eventually leads to a
targeted risk profile that reflects the risks BSR wants to keep on the balance sheet and which risks it
would like to avoid by means of hedging, product design or other risk mitigation techniques/
management actions.

33
Risk strategy can be visualized with the following decision tree:
The risk strategy provides direction to the level of risk consistent with the requirements of various
stakeholders, including the shareholder, the regulator, and rating agencies.
Risk strategy: underwriting risk
The primary focus of BSR is underwriting risk as also evidenced by the target risk balance for the
Company of 65%. Underwriting risk consists of the following risks: mortality, longevity, morbidity,
policyholder behavior, property & casualty and expenses.
The total underwriting risk is managed at the acceptance of every new transaction as per the
Business Acceptance Process (“BAP”). The BAP ensures a consistent process is followed and the
underwriting risk of a new transaction is evaluated by relevant disciplines within BSR including the
Pricing department, the Valuation department and the Risk and Actuarial function.
Historically, mortality and longevity risks have been the largest risks for BSR. As BSR currently has a
large exposure with regard to longevity experience in the Netherlands, BSR has a hedge contract in
place which partially offsets the risk. Mortality continues to be one of the largest risks, mainly due to
exposure in the UK and Asia. However property and casualty catastrophe is now BSR’s second largest
exposure, due to the Hungary and Netherlands property catastrophe programs and investment in
ILS.
The underwriting risk exposure is calculated every quarter by the BSR Valuation and Capital
department based on the valuation models. The BSR Chief Risk Officer (“BSR CRO”) reviews the
underwriting risk exposure against the limits set in the BSR Risk Tolerance Statement every quarter
and also when reviewing each new transaction. This is presented in the BSR RCC through a risk
dashboard and discussed in the white paper that is prepared with each new material transaction.
Actuarial models need to undergo validation and all numbers are subjected to internal review. A
number of model improvements took place during 2016, including the implementation of a
standardized actuarial model for the aggregation of modelled results and for two of the largest life
contracts. Management recognizes that model reviews continue to be an ongoing and important
effort for the less material contracts through 2017. Plans are in place for three high materiality
Does the risk help us meet a customer need?
Do we have the competence to
manage the risk?
Do we like the risk?
Do we have remaining capacity?
Keep / accept the risk
Hedge /
mitigate
Hedge /
mitigate
Don’t offer / accept
Don’t offer / accept
Yes Yes Yes Yes
No No No No
Support
Business
Strategy
Risk
Competence
Risk
Preference
Risk
Tolerance
Targeted
Risk Profile

34
models – the aggregation model, the deterministic life model and the hedge valuation model – to
undergo independent model validation during 2017.
Risk strategy: investment risk
The objective of the Company is to first and foremost successfully manage underwriting risk. As a
result, investment performance - whilst of significant importance - is secondary to the primary
objective and the risk balance target of 5% (reduced from 20% previously) reflects this. The
investment approach is set with this consideration in mind. BSR has a very conservative investment
stance as documented in the investment and counterparty policy. The investment and counterparty
risk consists mainly of credit and credit spread risk and these are kept to a limited level.
BSR maintains an adequately diversified portfolio of assets to mitigate concentration, credit and
other risks including the risks that arises from excessive reliance on any one asset, issuer or group of
undertakings. BSR’s asset portfolio is split across ILS, cash bank deposits and assets managed by the
Investment Manager.
ILS were added to BSR’s investment portfolio during 2015, and the investment scaled up midway
through 2016. The underlying exposure represents about one hundred different risk types from
various geographies and risk classes ensuring broad diversification. BSR receives model detail on
each underlying risk from the asset manager and uses this in its risk analysis. ILS do not contribute to
investment risk, but instead to property and casualty risk, which provides a good balance to the main
underwriting risks (mortality and longevity).
Risk strategy: mismatch risk
The BSR MB has set the mismatch risk at 20% of BSR’s total risk balance target. Mismatch risk
consists of the following financial risks: interest rate risk, currency risk and liquidity risk. BSR does not
specifically seek mismatch risk but recognizes that it is often the result of accepting the insurance
risks BSR pursues.
Interest rate risk
BSR’s available capital benefits from higher interest rates, as does the solvency ratio. This is because
the duration of the underlying risks is longer than the net duration of the balance sheet. As required
capital increases faster than available capital. BSR continues to monitor that the risk is managed
within the stated limits.
Currency risk
BSR has exposure to multiple currencies due to the global nature of its business, but this exposure is
managed to be within the defined risk tolerance. The BSR MB has added an additional requirement
specifying that a shock of 30% on any one currency cannot cause deterioration in IFRS equity above
10%. BSR matches assets and reserves in local currency so any mismatch is generally due to future
profits. On a quarterly basis BSR maintains an overview of the impact of currency shocks on both an
IFRS as well as a SII basis.

35
The influence of currency risk may also be assessed from a total currency perspective, with a scenario
in which several currencies move at the same time. Cross sensitivities with other risks can be
considered as well. The impact from such scenarios does have to be analyzed in the context of BSR
having a multi-currency business model, which differs from companies operating with a single
currency.
The novation of the US mortality contract in Q4 significantly reduces BSR’s currency risk. However
the risk balance target will not be adjusted accordingly because the long-term strategy is unchanged,
and therefore currency risk can be expected to arise from entering into future reinsurance contracts.
Liquidity risk
BSR has a very liquid and conservative investment portfolio and any claims or collateral posting is
well below the cash holding level of BSR. All BSR investments can be liquidated within a short time
frame (daily except for ILS funds).
During 2016, a BSR bespoke liquidity stress was developed, which requires the Company to have
adequate cash-like assets under a scenario combining extreme collateral calls and high mortality and
property catastrophe claims. The BSR RCC monitors the position against the BSR bespoke stress, as
well as the overall Aegon group liquidity stress (which is less onerous for BSR), through the Risk
Dashboard.
Risk strategy: operational risk
The BSR MB has overall responsibility for risk management and oversees a broad range of strategic
and operational issues. The BSR MB adopts the risk governance framework and determines BSR’s
overall risk tolerance and BSR risk policies.
The BSR MB recognizes that running a reinsurance company will naturally entail the existence of
operational risk exposure but strives wherever possible to minimize this risk category. The Risk
function makes a periodic operational risk assessment and presents the outcome through the Risk
Dashboard in the BSR RCC. Any material issues are reported to the BSR MB and BSR SB.
For a broader discussion of operational risk, please refer to section C.5 Operational risk.
Risk Tolerance
The mission of BSR is to deliver underwriting risk and insurance expertise to Aegon units and
partners by retaining and centrally managing profitable underwriting risks. This approach is further
strengthened by driving innovation in underwriting risk solutions and helping to ensure that Aegon is
a leader in its chosen markets. All risk ceded to BSR is sourced from or by Aegon entities (including
joint ventures).
To realize its mission, BSR offers three products to Aegon units:
Underwriting risk mitigation;
Risk retention, and;
Shared services.

36
In support of these products, BSR develops innovative solutions and technology that help BSR work
efficiently. Such solutions and technology include longevity hedging structures and stochastic pricing
and risk models covering life and non-life exposures. Specifically, this technology allows BSR to
combine risks and manage diversification leading to economic capital efficiencies and economies of
scale for business units working with BSR.
Risk Strategy is not only about the risks we have to accept to fulfil our counterparty needs, but also
about how we value and manage those risks once they have been accepted. A key part in our Risk
Strategy is the formulation of our risk preferences. In other words: from a risk-return perspective as
well as from a risk balance perspective, which risks do we like and which risks do we want to avoid?
The assessment of our risk preferences eventually leads to a targeted risk profile that reflects the
risks we want to keep on the balance sheet and which risks we would like to avoid or mitigate by
means of hedging, product design, other risk mitigation techniques or management actions.
It is recognized that the key risks, strategic objectives and the resulting risk appetite can change. The
risk tolerance statements of BSR reflect the current appetite based on the current composition and
risk profile of BSR, which will be reviewed if major events occur, but at least annually. The risk
strategy and risk tolerance ensure that BSR, at all times, maintains a solvency and liquidity position
such that no plausible scenario would cause BSR to default on its obligations to counterparties.
Risk Balance
Diversification and risk balance is a core piece in the Company’s Risk Strategy. It manifests itself
when considering both whether we like the risk or not as well as whether we have remaining
capacity or not. The table above describes the long-term risk balance (target) levels for BSR for each
risk type mentioned in the Aegon Economic Framework (“EF”). This also ties directly to the more
detailed risk tolerance framework mentioned earlier in this section.
At a high level, the risk balance sought is the following (summary of table in previous section):
Risk Type Q4 2016 BSR Risk Balance Target
Investment Risk 5%
Mismatch Risk 20%
Underwriting Risk 65%
Operational Risk 10%
This table identifies the key risk categories within BSR and our gross risk tolerance in terms of
percent of total Gross ERC that can be allocated to each risk type. The key risks and limits are set at
levels which reflect our long term risk preferences and also align with BSR’s strategic objectives. BSR
may at times deviate from this due to market conditions but this will be explicitly discussed in the
BSR RCC.
Importantly, the risk balance target was updated in Q4 2016 to better reflect BSR’s desired risk
balance. In particular, more risk was allocated to the underwriting risk category as stated in BSR’s
mandate. Also, within the underwriting risk category more risk was allocated to mortality and
longevity, to reflect the reality that the majority of the internal reinsurance opportunities available to
BSR are for life risks. The original framework was established in 2015, and since then has served as a

37
useful tool to identify issues. In Q4 it was reviewed against the strategy, and it was appropriate to
reduce the target allocated to investment risk since this is not a risk type BSR actively seeks.
Risk Identification and Assessment
Our capital management strategy is first and foremost an economic consideration with risk being
properly evaluated and economically assessed. We endeavor to model cash flows at the appropriate
level of detail to firmly understand the risk drivers and ensure the ability to monitor the risk on a
going forward basis. An example of this is the development of the stochastic mortality model used
for the valuation of the Dutch Longevity Reinsurance and the Synthetic Longevity Hedge contracts.
This detailed approach is closely aligned with the spirit of Solvency II. Specific regulatory, stakeholder
and rating agency metrics can at times be at odds with this and thus form important constraints that
cannot be compromised. As a result, the capitalization of BSR as laid out in the capital management
policy is based on the most stringent of regulatory requirements, rating agency requirements (we
aim to maintain capitalization consistent with a S&P AA financial strength rating) and/or self-imposed
criteria. The capital management intervention levels are referred to in the capital management policy
as “Capital Management Zones” (see E.1 Own Funds).
Underlying risks are mapped to risk types and stresses are analyzed along these dimensions.
Consequently, Aegon Economic Framework (EF) is used as a supporting tool to measure and manage
risks, to help guide the development of our desired risk profile, and to help assess the soundness of
our overall capitalization. The EF’s quantification of risk and value is fundamentally an internal
management view. We participate in many markets with many local value and risk measurement
systems. The primary objective of the EF is to support the creation of value by defining transparent,
consistent, and objective measures of value and risk across the Aegon Group. The EF is the primary
basis for risk based decision making, and BSR’s basis for pricing decisions. The EF also includes a
consideration for regulatory capital. If this exceeds Economic Required Capital (“ERC”), a stranded
capital charge is added reflecting more capital needs to be held to satisfy regulatory requirements.
Section C.6 Other material risk describes the political risk, and the risk of being an internal reinsurer
of an international group. These strategic risk are other identified risk that are not fully included in
calculation of the SCR.
Risk Response, Monitoring and Reporting
The BSR CRO chairs the BSR RCC, where key risk topics are discussed and escalated to the BSR MB as
per BSR’s governance structure. Throughout 2016 BSR will continue to enhance risk reporting. The
BSR CRO is also a Member of the BSR MB ensuring a strong voice for Risk in the governance of BSR.
Risk Control
A system of effective controls is needed to mitigate the risks identified. In BSR’s ERM framework risk
control includes risk governance, risk policies, model validation, risk embedding, risk culture and
compliance. Finally, an effective risk governance framework is an important element of risk control
as clear responsibilities and structured decision making is a necessary requirement. The risk
governance framework is described in the following section.

38
B.3.1.2 Risk governance framework
The Company’s risk management is based on clear, well-defined risk governance. The goals of risk
governance are to:
Minimize ambiguity by clearly defining roles and responsibilities and risk reporting
procedures for decision makers;
Institute a proper system of checks and balances, and ensure that senior management is
aware of material risk exposure at all times;
Manage risk in line with the targeted risk profile, including the avoidance of an over-
concentration of risk in particular areas;
Facilitate diversification by enabling management to identify diversification benefits from
apparent risk-return trade-offs; and
Reassure external stakeholders that Blue Square Re has appropriate risk management
structures and controls in place.
Blue Square Re’s risk management framework is represented across all levels of the organization.
This ensures a coherent and integrated approach to risk management throughout the company. In
this context, Blue Square Re has a range of risk policies that detail specific operating guidelines and
limits. These policies are designed to keep overall risk-specific exposures to a manageable level. Any
breach of policy limits or warning levels, identified through the performance of internal controls,
triggers remedial action or heightened monitoring. Additional risk policies may be developed and
implemented at a local level to cover situations specific to particular regions or business units.
Blue Square Re's risk management governance structure has four basic layers (as illustrated in the
figure below):
The Supervisory Board;
The Management Board;
The Risk & Capital Committee (RCC); and
The Investment Committee.
Blue Square Re’s risk governance framework

39
Supervisory Board
The Supervisory Board is responsible for overseeing Blue Square Re’s Enterprise Risk Management
(ERM) framework, including risk governance and measures taken to ensure risk management is
integrated properly into the Company’s broader strategy. The Supervisory Board oversees the
Company’s risk exposure as it relates to capital, earnings and market consistent value at risk and
compliance with the risk policies. It is the responsibility of the Management Board and the CRO to
inform the Supervisory Board should any risks directly threaten the solvency, liquidity or operations
of the company.
Management Board
The Management Board has an overall responsibility for risk management. The Management Board
adopts the risk strategy, risk governance, risk tolerance and material changes in risk methodology
and risk policies. It is the responsibility of the Blue Square Re’s Management Board to inform the
Supervisory Board should any risks directly threaten the solvency, liquidity or operations of the
company. The CRO can escalate issues to the Supervisory Board and to The CRO of Aegon Group.
The Management Board oversees a broad range of strategic and operational issues. The
Management Board discusses and sponsors ERM, in particular:
Embedding of risk strategy into business strategy and enterprise risk management into
business operations;
Reviewing risk governance structures, risk tolerance statements and risk policy limits;
The Pricing and Product Development Policy;
The introduction of new risk policies; and
Compliance with the ERM framework and policies.
The Management Board is supported by the Risk & Capital Committee and the Investment
Committee.
Risk and Capital Committee (RCC)
The Blue Square Re Risk & Capital Committee (“BSR RCC”) oversees and actively monitors and
investigates all BSR risk taking and risk management decisions, with the authority to recommend to
the Blue Square Re Management Board (“BSR MB”) on the risk strategy and the risk limits. The BSR
RCC provides high level assurance to the BSR MB that BSR’s risk taking is in compliance with the
defined risk management frameworks, policies and guidelines.
The BSR RCC is responsible for promoting the risk management culture of BSR. The committee fulfils
this responsibility by ensuring adequate and appropriate staffing in the financial and operational risk
functions as well as ensuring that the measurement and management of BSR’s risk position is within
the defined guidelines. As a general principle, BSR will adopt risk measurement and management
methods that are aligned with those used by its shareholder (Aegon N.V.) and its regulator (DNB).
This will ensure leverage of best-practices, effective support and ease of consolidation.

40
The BSR RCC’s responsibilities are to:
Set overall risk policies and frameworks for BSR in line with BSR’s defined risk strategy and risk
tolerance statement:
Approve and oversee the execution of the BSR’s risk framework;
Review and approve the BSR Risk Tolerance and any BSR risk, pricing, underwriting and
investment policies as appropriate from the perspective of the risk framework;
Generate new policies as risks emerge;
Provide management reports to the BSR MB on risk strategy and risk assessment and
highlight deviations or potential deviations from risk framework and agreed risk tolerance,
along with options available to rectify these deviations.
Provide oversight:
Review and approve business initiatives and risk-related transactions;
Review key BSR risk metrics and reports to ensure appropriateness, completeness,
consistency, accuracy and reliability for decision making;
Oversee the completeness, integrity and operation of BSR’s internal financial control and risk
management systems;
Monitor changes to key regulations and external developments with respect to risk and
capital and ensure that appropriate actions are taken;
Oversee pricing processes to ensure adherence to pricing policies and controls;
Monitor compliance of all risk policies and approve exceptions, if any;
Review and monitor the capital position of BSR from an economic and statutory perspective;
Review annually the effectiveness of the BSR RCC in meeting its responsibilities.
Support decision making:
Support risk based strategy development, execution of risk policies, and appropriate risk
reporting and analyze consistency with the Aegon Risk Framework and make
recommendations to the BSR MB;
Support strategic planning and the identification of key and emerging risks to meeting BSR’s
strategic plan, and ensuring that these risks are appropriately measured and brought to the
attention of the BSR MB;
Support BSR decision making by providing a holistic view of risk exposures across the
business.
Ensure appropriate reporting and escalation:
Complete and present all reports requested by the BSR MB;
Immediately inform the BSR MB if the statutory solvency of BSR is jeopardized.
Investment Committee (IC)
The Blue Square Re Investment Committee (“BSR IC”) assesses the compliance of investments with
investment mandates set by the BSR MB. The BSR IC also provides advice with regard to the set-up of
investment mandates.

41
The BSR IC has the following responsibilities:
Researching and designing the BSR Investment Strategy;
With the aid of the appointed Asset Manager selecting suitable investment products that are
in line with the stated BSR Investment Strategy;
Implement and execute the investment policy guidelines as adopted by the BSR MB;
Advise the BSR MB with regard to executing investment management agreements;
Monitor the management and performance of the BSR’s investment portfolio within the
investment policy guidelines and investment mandates and to ensure that where possible
investment returns (both income and capital appreciation) are within acceptable limits;
Discuss investment strategies, including ALM considerations, investment parameters and
policies annually or more frequently as appropriate;
Ensure that the Asset & Liability Management (ALM) & Investment strategy meets the limits
and requirements of the Investment & Counterparty Risk policy;
Assess Investment Managers on the management of the portfolio and present to the BSR MB
for approval;
Present the investment performance of the portfolio to the BSR MB;
Ensure adherence to Group policy guidelines; e.g., Aegon Credit Name Limit Policy (“CNLP”).
The following must be discussed by the BSR IC prior to the advice to the BSR MB:
All investment-related transactions which can have a material impact on the solvency
position, risk profile or earnings of BSR;
Any exception to a BSR investment mandate;
Investment-related transactions, that carry new risks, outside of the approved business plan;
Changes to the investment mandates;
Any other item that a member of the BSR IC requests to be submitted for discussion at the
BSR MB.
Prudent Person Principle
The prudent person principle has been adopted into Blue Square Re’s System of Governance. The investment mandates section of the Standard of Practice paper makes sure that the prudent person principles are satisfied. The Prudent Person principle is described in more detail in section C. Risk Profile. External credit agencies
A significant management measure to avoid excessive credit risk is to diversify and limit exposure to
individual issuers. Appropriateness of credit assessment is in scope of systems of governance at BSR.
The Company manages credit risk exposure by individual counterparty, sector and asset class,
including cash positions. The methodology used is described in the Credit Name Limit Policy (CNLP),
under which limits are monitored is described in section C.3.4 Credit risk mitigation.
Lines of defense
Blue Square Re's risk management structure is organized along three 'lines of defense' to ensure
conscious risk-return decisions, and to limit the magnitude of potential losses within defined levels of
certainty. The objective of this structure is to avoid surprises due to the materialization of

42
unidentified risks, or from losses that exceed predefined risk tolerance levels and related limit
structures.
The Company's first line of defense, including the business and support functions, has direct
responsibility for managing and taking risk in accordance with defined risk strategy, risk tolerances
and risk policies. The second line of defense (Risk Management function, Actuarial Function Holder
and the Compliance Function Holder) facilitates and oversees the effectiveness and integrity of ERM
across the Company. The third line of defense, the audit function, provides independent assurance
opinions on the effectiveness of the systems of internal control, risk management and governance.
Model validation process
BSR has requirements in place on model validation. The requirements are covered in the Model
Validation Framework, including the Model Validation and Model Change policies. This is an Aegon
Group framework that BSR has adopted in full. The Model Validation function is part of the Aegon
Group Risk function, and is independent from model owners and business users. For 2017, Blue
Square Re has planned for three model validations. The Lead Model Validator will prepare the model
validation reports, which will be approved in the Group Model Validation Committee (MVC). The
MVC is responsible for approving all model validation reports, including those on Solvency II models.
The purpose of the model validation process is to assess the model’s integrity, including the
performance of the model and the ongoing appropriateness of its specifications. Before model
validation by the Model Validation Function can take place, BSR management – the first line of
defense – should have ensured that the model in scope of the model validation meets the
requirements set out in the Model Validation Framework. To ensure this, the model owners the
Valuation and Capital department perform tests during both model development and model
operation. The model validation process consists of different stages. The first phase of the actual
validation is the base line testing of the model, confirming that business and regulatory requirements
are met. The second phase ensures the first line keeps the model in a secure environment, where the
model cannot be changed by unauthorized personnel and model changes are subject to a controlled
model change process. Phase three is the independent review. Amongst other things, the Model
Validator assesses the appropriateness of testing carried out by the model owners and also performs
its own independent testing. The findings of the model review are then documented and result in a
model opinion. Phase four entails the closure of identified gaps by the model owners according to a
gap closure plan. The gap closure plan is an important step in the model validation process as it
ensures follow up and provides transparency for the relevant stakeholders.
B.3.2 Own Risk and Solvency Assessment
B.3.2.1 ORSA process overview
The Own Risk and Solvency assessment (ORSA) is a continuous process which includes a range of
processes and procedures to identify, assess, monitor, manage, and report both current and forward
looking risk and capital positions. The ORSA builds on the existing risk and capital management and
business planning processes. The ORSA unites these processes under a single framework, ensuring
key business decisions are based on an internal assessment of risk and associated capital
requirements. It connects and aligns risk and capital management, business planning, and strategic

43
decision making processes, and delivers the “ORSA outcomes” (from Solvency II Directive
2009/138/EC, Article 45(1)) namely:
The assessment of overall solvency needs taking into account the specific risk profile,
approved risk tolerance limits and the business strategy of the undertaking;
The compliance, on a continuous basis, with the capital requirements and with the
requirements regarding technical provisions; and
The extent to which BSR’s risk profile deviates from the assumptions underlying the
calculation for its Solvency Capital Requirement.
The ORSA is an iterative process and is owned by the Management Board. It is used as a vehicle
through which to manage BSR’s business. The ORSA captures key elements of the capital, financial
and risk management processes which support our overarching objective to achieve our business
strategy. The ORSA is embedded within our organization through the annual Budget and Medium
Term Plan (“MTP”) process, the Business Acceptance Process, and the quarterly governance process
(including underlying reporting processes).
As stated, the process incorporates several existing, underlying processes. Full descriptions of these
underlying processes are not included here but are referenced and supporting information is
available. In brief these processes include:
Business Strategy
Blue Square Re has an overall business plan detailing the strategy of the Company. Our business
strategy is proposed by the BSR’s Management Board for review and approval by the BSR’s
Supervisory Board followed by the Aegon Group Executive Board and subsequent implementation. In
the 2017-2019 Medium Term Plan, a number of priorities were identified with Aegon N.V. which
form the areas on which Blue Square Re will focus throughout the planning period.

44
Budget & Medium Term Plan (MTP)
As part of setting our strategy, we project the potential financial, risk and capital impacts of
implementing that strategy under a range of scenarios. In this way we test our plans in both
quantitative and qualitative terms. The Budget and MTP process links our strategy with financial
analysis. Specifically, the plans are tested against our risk tolerance statements for financial strength.
These tests determine whether BSR complies with the business continuity related statements. Also,
the impact of the strategic initiatives on financial strength ratings is assessed from a capital
management policy and economic perspective on the planning period.
Risk Assessment
As part of the Budget and MTP process, the Blue Square Re’s Management Board makes a risk
assessment at least on a yearly basis, which forms the basis for a number of risk scenarios. In
addition, risk assessments also occur on an ongoing basis as part of the Business Acceptance Process
and the Quarterly Reporting cycles.
Business Acceptance Process
The Business Acceptance Process is a core process and ensures that Blue Square Re has a solid
platform with respect to pricing, analysis, documentation and approval of prospective reinsurance
transactions, whether new contracts or renewals. As part of the Business Acceptance Process, the
BSR Management Board makes a forward looking assessment, whereby the impact of each
prospective transaction on the risk and solvency position of the Company is compared to the risk
tolerance statements and forecast that result from the annual MTP process. As such, the BSR MB
considers the Business Acceptance Process as being an intermediate (partial) ORSA.
Quarterly Risk & Capital Assessment
As part of the ORSA, Blue Square Re has at least monthly Management Board meetings and quarterly
Blue Square Re Supervisory Board meetings, supported by at least quarterly Risk and Capital
Committee and Investment Committee meetings. The frequency of these meetings may be increased
as necessary. The full Management Board are also members of the RCC allowing further opportunity
to review existing and new business performance and providing a level of stable continuity through
the governance framework. Charters have been established for each committee, specifying
membership, responsibilities and escalation requirements. Reporting requirements are specified in
the relevant Risk Policies. The monitoring of BSR’s risk and capital position is a standard agenda item
for the RCC, the MB and the SB. These discussions are supported by risk, capital and financial
information, including forecast information. They also include a risk assessment of both financial and
operational risk. An assessment is made as to whether Blue Square Re remains within approved risk
tolerances and whether management action is necessary.
Risk and Control Self-Assessment
The Risk and Control Self-Assessment (“RCSA”) is performed annually, or more often as needed, and
serves to ensure that BSR’s process and control structure adequately mitigates all significant risks.
BSR’s operational risks are identified during sessions with the relevant process owners within BSR.
There is an independent assessment by the Chief Risk Officer, and furthermore the RCSA is submitted
to Group. The following processes were identified as significant following the RCSA: business
acceptance, claims handling, premiums, valuation, finance, compliance, IT, outsourcing and a process
45
for general risks. These processes are all described in the AO/IC manual and are linked directly to the
RCSA.
B.3.2.2 ORSA Governance
The ORSA is performed annually or more often when deemed necessary. A non-regular ORSA does
not require all sections to be re-produced necessarily. The BSR Management Board is responsible for
the monitoring of the triggers that may initiate the execution of a non-regular ORSA.
In the context of the ORSA, each the RCC, MB and SB has the following responsibilities:
Risk and Capital Committee (RCC)
o Endorsement of Extreme Event Scenarios;
o Endorsement of the Extreme Event results;
o Endorsement of the final ORSA report and ORSA policy;
o Endorsement of Capital Management Policy;
o Endorsement of Risk Strategy; and
o Endorsement of quarterly Risk and Capital Reporting results.
Management Board
o Challenge and approval of the B/MTP results;
o Challenge and approval of ORSA results;
o Discuss and approve quarterly risk reporting and capital reporting results;
o Approval and sign-off final ORSA report;
o Approval of Capital Management Policy;
o Approval of Extreme Event Scenarios;
o Approval of ORSA Policy;
o Approval of Risk Strategy; and
o Approval of Quarterly Risk and Capital reporting results.
Supervisory Board
o Discussion and approval of the B/MTP results;
o Discussion and challenge of the quarterly risk and capital reporting results; and
o Review and challenge of the ORSA report.
B.3.2.3 ORSA Triggers
The ORSA Policy lists potential triggers for producing a non-regular ORSA report during the planning
period, but this is neither an exhaustive list nor an automatic process, and the ultimate decision
resides with the BSR Management Board:
A major amendment to approved risk tolerance statements;
A sudden and significant reduction in solvency ratios falling below critical values;
An acquisition that significantly changes the business, solvency or risk profile;
A divestiture that significantly changes the business, solvency or risk profile;
A start-up of a major new line of business;
A significant change in valuation or risk methodology;
A significant change to the mix of assets;
A major change in reinsurance arrangements;
A significant change in financial markets;

46
A significant change in regulations.
While the novation of the US stop-loss mortality contract and the consequential restructure of the
Synthetic Longevity Hedge meet the trigger requirements for producing a non-regular ORSA, but as
discussions have been taking place during Q4, a decision was taken to complete the ORSA alongside
the MTP as part of the regular annual cycle by projecting these significant events into the regular
ORSA. To the extent that the novation and restructure happen as planned, a non-regular ORSA is not
triggered.
During the evaluation of the options for the US stop-loss mortality contract, i.e. novation or restrike,
consideration was given to the knock-on impacts on the BSR solvency position and risk tolerance
projected to the end of 2016 which led to the decision to pursue a restructure of the
mortality/longevity hedge, liquidate asset-backed securities fund and rebalance the interest rate
hedges. Other alternative such as currency hedging was considered but ruled out as being ineffective
at the time.
B.4 Internal Control system
B.4.1 Key procedures
BSR has developed an Internal Control System which secures it compliance with applicable laws,
regulation and administrative processes and the effectiveness and efficiency of operations in view of
its objectives, as well as the availability and reliability of financial and non-financial information.
The Internal Control System consist of a suitable control environment, appropriate control activities,
effective information and communication procedures, adequate monitoring mechanisms and a
compliance function. Reference is made to section B.4.2 Compliance for a detailed description of the
compliance function.
BSR’s control activities aim to assure an adequate level of internal control over the Company’s
objectives and in particular operational and financial reporting including the production of Solvency II
and IFRS numbers. The objective is to provide assurance regarding the reliability, accuracy,
completeness, timeliness and quality of internal and external (regulatory) reporting and the
safeguarding of assets.
The system is based on the Aegon Internal Control Framework (AICF) and developed in accordance
with regulations that Aegon must comply with globally (i.e. Sarbanes-Oxley 404 and Solvency II). The
principles of the System have been embedded into key policies, such as Data Quality Policy, Model
Validation Policy, Model Review Standards, and Model Change Policy. This section reports on the
general principles of BSR’s Internal Control System and reports on the Operational Risk Framework -
as key element of the Blue Square Re’s Internal Control System.
B.4.1.1 General principles of BSR’s internal control system
The general principles of the internal control system apply to all functional areas or departments that
are involved with Solvency II reporting. These principles are:

47
All employees must comply with the Code of Conduct. The Code of Conduct states that all
employees will conduct their work in an ethical manner;
If employees become aware of or observe fraud, questionable accounting practices, or other
unethical behavior they should report it to a member of management, Human Resources or
to their local ethics hotline;
Employees must be instructed regarding sensitivity and confidentiality of company and
policyholder or client information;
All departments must develop a system of internal control to ensure that the assets and
records of the company are adequately protected from loss, theft, alteration or unauthorized
access;
All departments establish and maintain adequate segregation of duties. Where adequate
segregation cannot be achieved, other compensating controls must be established and
documented;
The Company has business continuity plans in place with a regular update process;
Records of the company must be maintained in compliance with record retention policies
and local regulatory requirements.
B.4.1.2 Operational Risk Framework
A key element of Blue Square Re’s internal control system is the Operational Risk Management
function. The Operational Risk Management function uses a risk framework that facilitates action
planning and embeds continuous improvement regarding the internal control environment
throughout the organization. The fundamental building blocks for the Operational Risk framework
are described below.
Process Mapping, in the context of Solvency II critical reporting, is the identification of significant
processes and their owners. Process owners are responsible for effective execution of risk
management activities within their processes.
Risk Assessment is achieved through periodic risk control self-assessments (RCSAs) that are
undertaken to get an understanding of business objectives, identification of the operational risks for
realizing these objectives, to assess the adequacy of the risk mitigation or controls in place given the
identified risks and to assess the likelihood of losses (including financial reporting errors and their
impact). These assessments bring a clear understanding of the risks along with a clear understanding
of the control activities that are key to mitigating those risks. This includes Solvency II reporting
framework which addresses financial reporting risk and the modeling risks to the company. This risk
identification is supported by a value chain that will help identifying the key risks and handover
points.
Scenario Analysis (SA) is the process of developing scenarios along structured dimensions, using
opinions from Subject Matter Experts and business leaders, deriving reasoned risk assessment of the
severity and frequency, thus enabling business improvements, better risk management and
measurement of required operational risk capital.

48
Risk Monitoring is accomplished through effective design and implementation of Key Risk Indicators
(KRIs) or other monitoring mechanisms are measurements that meet the information of
management monitoring current risk and control profiles. Relative to financial reporting,
management have to monitor actively processes and key controls to ensure that they are designed
and operating effectively. Management’s active monitoring of key controls, KRIs, or other
measurements along with identifying and implementing related action plans reflects the proactive
nature of risk management efforts. Appropriate metrics or measurements should be identified such
that they are indicators of potential risk or control deficiencies.
Risk Validation is obtained through the identification, collection and analysis of operational loss
events or through validation of the effectiveness of controls that mitigate risks. To enhance the
learning organization, root causes of operational loss events or control deficiencies are analyzed and
shared. This sharing facilitates more effective risk management and continuous process
improvement. Loss events or control reviews validate that the risk assessments are effective and
validate that the KRIs are effective to monitor or predict risk.
Risk Response & Action Plans are overarching to the risk identification, monitoring and validation
process. Risk response is the decision making process to accept, control, transfer or avoid risks.
Action plans are developed and implemented to achieve the desired risk mitigation. Action plans
arise from risk assessments, key risk indicators and control monitoring, or losses and control reviews.
In order to facilitate the operational risk management of processes within BSR, an “open items” log
has been created to track operational gaps, to define ownership and actions, and to measure
progress.
Risk Reporting covers all aspects of operational risk management, validating and demonstrating the
importance of risk management to our operations. Reporting that highlights risks, loss events,
control weaknesses and trends in KRIs provides a mechanism for taking appropriate and timely
actions, enhancing decision making and providing feedback that gauges the success for the
Operational risk Frame program as a whole. The figure below provides a graphical illustration of the
Operational Risk Framework.

49
B.4.1.3 Responsibilities & roles of the Operational Risk function
The Operational Risk function executes its duties objectively and independently in all parts of the
Company. The Operational risk function operates in accordance with law and regulations, BSR
policies and procedures supported by relevant external professional or good/market practices
standards.
In realizing the objective of the Operational Risk function, the following roles are important:
Advise:
Keep well informed of good practices, regulatory and industry standards and trends in the
fields of operational & conduct risk management and determine relevance and impact on
BSR;
Advise on development of the operational & conduct risk framework and development of
improvements and new initiatives that encompasses the relevant, material risks pertaining to
the Company.
Support & facilitate:
Maintain and support implementation and embedding of an appropriate operational &
conduct risk strategy and framework, including methodologies, risk & internal control
systems, (group) policies, guidelines and programs and provide expertise where needed;
Support identification and assessment of material risks by facilitating Risk Control Self-
Assessment sessions both on a strategic level and an operational level, reviewing and
challenging business strategy and business developments in relation to operational, conduct
and regulatory risks
Support assessment of (aggregated) risk exposures and management of risks (by identifying
mitigating measures such as key controls as performed by the business);
Develop and maintain a curriculum to educate all staff, enhance awareness and lead training
regarding operational and conduct risk management related responsibilities and
accountabilities;
Challenge:
Report to the MB on the actual operational and conduct risk profile compared to the risk
tolerance levels. This includes monitoring of the effectiveness of the risk management and
internal control framework related to operational & conduct risks and of the effectiveness of
the performance management and remuneration processes;
Detect potential violations or deficiencies in compliance with Aegon's O&CRM framework,
investigate incidents, help management to address these issues and develop remediation
plans as appropriate;
Ensure that serious incidents are reported to the external regulator adequately and in a
timely manner;
Provide oversight and reporting to the Management Board on the effectiveness of
remediation measures including action plan monitoring;

50
Provide challenge and oversight of the regulatory compliance framework, monitoring the
effectiveness of implementation on all elements (including methodology, policies and
programs) in managing regulatory risks and report to the Management Board.
B.4.2 Compliance activities and policy
Blue Square Re has adopted a Compliance Charter, which intends to strengthen the effectiveness of
the compliance. The Charter describes the governance, roles and responsibilities and operations of
Blue Square Re’s compliance management. It defines the scope of the Blue Square Re’s Compliance
Function. The charter will be reviewed at least every two years and may be amended at any time
with the approval of the management board of Blue Square Re. The charter has not been updated in
2016, the charter will be updated in 2017 as scheduled, however no material changes are expected
in the 2017 update.
B.4.2.1 Objective of the function
The objective of the Compliance function is to support the Management Board in ensuring that Blue
Square Re acts in line with relevant legal, regulatory requirements and group risk tolerance. The
compliance officer is advising and assisting the business in complying with applicable rules,
regulations and internal standards, including reporting, as a first line activity. The second line
responsibility of the function will promote and foster compliance with laws and regulations and
internal policies. Delivered well, strong (regulatory) compliance will enable the organisation to act
with integrity and enable optimal service delivery to our clients.
B.4.2.2 Compliance Risk
Compliance risk at BSR is defined as the risk of impairment to the organization’s business model,
reputation, integrity and financial condition, resulting from failure to comply with laws, regulations
and internal company rules and policies. This includes the risk of failure to comply with established
good business practices and failing to balance the expectations of key stakeholders such as
customers, employees and society as a whole.
B.4.2.3 Compliance Risk Appetite
BSR aims to be compliant with all applicable laws and regulations, internal company rules and
policies governing its operations and established good business practices. BSR will ensure that this
requirement is embedded in the culture of its business operations.
B.4.2.4 Tolerance
Where the application of a rule or guidance is open to interpretation, BSR may make a judgement if it
can evidence a reasonable argument for its actions and the interpretation does not result in BSR
taking any unacceptable risks. In judging the application of a rule or guidance that is open for
interpretation, Blue Square Re considers the following to be unacceptable:
Customer financial loss or loss of rights due to non-compliance with applicable regulatory
requirements;
Implementation of any product, service, process or system that is likely to result in loss of
customer or intermediary confidence in the Company's ability to conduct business
compliantly;
51
Business practices that do not display integrity and may damage Blue Square Re or Aegon's
reputation
Implementation of any product, service, process or system that is likely to result in
enforcement action by the regulator;
Implementation of any product, service, process or system that, if the regulator were aware,
would lead to a guidance for the company to undertake corrective and/or remedial action;
B.4.2.5 Regulatory compliance
The Management Board is ultimately responsible for regulatory compliance throughout BSR. The MB
is entrusted with the responsibility to oversee the implementation and effectiveness of the
Regulatory Compliance framework within BSR. Blue Square Re’s risk management structure is
organized into the three ‘lines of defense’ model as described in section B.3.1.2 Risk governance
framework.
The Blue Square Re’s Compliance Officer has a formal status, which is stated and communicated
through the Blue Square Re’s Compliance Charter. The Compliance Officer reports to the Blue Square
Re’s Management Board and the Supervisory Board and is directly accountable to the Aegon Global
Head of Regulatory Compliance, who also serves as the Key Function Holder for Compliance in BSR.
B.4.2.6 Responsibilities & roles of the Blue Square Re’s Compliance function
The Blue Square Re’s Compliance officer acts as a gatekeeper within the organisation to identify
regulatory requirements, and, working with the company’s management, ensure these regulations
are complied with.
The Compliance function operates in accordance with the BSR Compliance Charter. In addition, the
function is designed to ensure compliance with applicable regulatory and legal requirements
applicable to the business, supported by the relevant external professional or good market practice
standards.
In realizing the objective of the Compliance function, the following aspects are important:
Advise the Management Board on:
o The (potential) impact of regulatory developments on Blue Square Re;
o The development of a regulatory compliance framework that encompasses the
relevant regulatory requirements and risks pertaining to Blue Square Re;
o The status of Blue Square Re’s compliance with laws, regulations and appropriate
internal policies.
Support & facilitate the Management Board and the business in the implementation,
maintenance and embedding of the Regulatory Compliance framework.
Monitor on behalf of the Management Board the implementation and effectiveness of the
Regulatory Compliance framework.
Support the Management Board in making all Blue Square Re employees conscious of
compliance risks and raising awareness of the Aegon Code of Conduct and compliance
policies.
Report on compliance developments and issues to the Blue Square Re Management Board.

52
B.5 Internal Audit function Blue Square Re has adopted the Aegon Group Internal Audit Charter, the Aegon Group Chief Internal
Auditor will monitor compliance of the Blue Square Re Charter to the group charter on a regular basis
to ensure ongoing compliance with the Aegon group charter. The Charter describes the governance,
roles and responsibilities and operations of Blue Square Re’s Audit function. The charter will be
reviewed periodically and may be amended at any time with the approval of the management board
of Blue Square Re. The charter has not been updated in 2016, the charter will be updated in 2017 as
scheduled, however no material changes are expected in the 2017 update.
B.5.1 Internal Audit function
The Internal audit function “Internal Audit” assists the Management Board, the Supervisory Board and
Aegon Group in protecting Blue Square Re’s assets, reputation, and sustainability by independently
and objectively evaluating the effectiveness of internal controls, risk management and governance
processes. The Internal Audit function is the third line of defense.
Aegon Group’s Internal Audit Function fulfills the internal audit role for Blue Square Re, where the
key function holder is the Aegon Group Chief Audit Executive. He assigns the planning, execution and
reporting tasks to a designated internal auditor within Aegon Group Internal Audit. The Internal
Auditor of Blue Square Re is part of Aegon Group Internal Audit and reports directly to the Aegon
Group Chief Audit Executive. The designated auditor does not hold any other title within Blue Square
Re. The auditor went under the in-employment screening in 2017 Q1 and had a positive result (PES
level 3).
The designated internal auditor reports functionally and administratively to Blue Square Re’s Chief
Executive Officer and the Supervisory Board.
The agreed services to be performed by Aegon Group Internal Audit are organized in the Service
Level Agreement of Blue Square Re with Aegon Group Internal Audit.
The head of Internal Audit reports functionally and administratively to Blue Square Re’s Chief
Executive Officer and the Supervisory Board.
Internal Audit’s main tasks and responsibilities are:
Prepare and execute a risk based audit plan which is approved (semi-)annually by the
Management Board and the Supervisory Board. This audit plan includes 1st and 2nd line
processes as well and the assessment of the corporate governance within Blue Square Re.
Execution of the audit plan according to the Aegon global internal audit methodology and
report the results to Management and Supervisory Board. The audit report includes audit
recommendations and management action for improving the control environment of the
audited processes.

53
Identify, and agree with management, opportunities to improve internal controls, risk
management and governance processes and verify that such improvements are
implemented within pre-agreed deadlines;
Assist in the investigation of any suspected fraudulent activities within the Company.
Conduct specific reviews or consulting activities based on Management or Supervisory Board
request and report the results of these activities to the Supervisory Board;
Issue periodic reports to the Management Board and the Supervisory Board, summarizing
the progress and results of the annual audit plan, as well as on the status of management
actions connected to earlier audit reports;
B.5.2 Independence and objectivity of the Internal Audit function
Internal Audit executes its duties in accordance with the International Internal Auditing Standards
(IIAs) as well as with BSR’s policies and procedures.
Aegon Group Internal Audit is authorized to have full, free and unrestricted access to all BSR’s
records, functions, physical properties and personnel, including where appropriate outsourced
operations, within a reasonable period of time of making the request. Local laws and regulations will
apply regarding the attainment of any records required.
Internal Audit avoids any conflict of interest and accesses the expertise and knowledge necessary to
undertake work in respect of specialist business functions. Outsourcing of Internal Audit activities
could alleviate temporary resourcing constraints. This decision needs to go through the appropriate
governance including the Aegon Group Chief Audit Executive and the Supervisory Board.
The Aegon Group Chief Audit Executive verifies that any resource not employed by internal audit
department possesses the necessary knowledge, skills and other competencies to execute the duties
of Internal Audit. These resources are appropriately assigned to the audit team or to otherwise assist
the internal auditors and comply with the principles of the BSR Internal Audit Charter.
Internal audit does not execute any operational duties for Blue Square Re. Any possible conflict of
interest is reported to the Management and Supervisory Board in accordance with the Institute of
Internal Auditors in an immediate manner.
B.5.3 Internal Audits performed
In 2016, Group Internal Audit performed thematic global Group audits, were Blue Square Re was as
part of Aegon Corporate Center in scope from an Aegon group perspective. Audits on information
security, Access Control & IT control framework, Global Integrity Audit, and Shadow IT & Application
Security. In these audits no significant issues were identified for Blue Square Re.
In 2016 one specific Blue Square Re audit was performed. An audit on the design of the business
acceptance process. The underwriting process is one of the key processes of Blue Square Re, in
respect of pricing and modeling of new and renewed deals.
54
Management summary
The control environment around the pricing and modelling process has been designed with due care
in 2015. Thorough and extensive documentation was created to ensure that the process is
transparent enough to represent the steps that take place during pricing of a deal. In our opinion, the
control environment needs to be further strengthened to ensure that the key controls are in place
and well documented. If roles and responsibilities are clearly agreed and requirements are well
documented, some further efficiency can be achieved regarding the required level of documentation.
Efficiency is a key element at Blue Square Re. Considering the size of the company, we recognized
some areas where further documentation is recommended to better ensure sustainability of
controls. We understand that focusing on the five most important deals has priority, however we
draw the attention that proper execution of controls should apply to all deals to ensure consistency.
During the reporting phase of this audit, there was a vacancy for the role of Head of Pricing and
Modelling. This position is currently filled by the Chief Executive Officer of BSR until the successful
recruitment of the new pricing manager. Due to the fact that multiple roles are assigned to one
employee, resulting in an overload of duties, more focused attention is needed to ensure proper
control environment and segregation of duties.
Important issues
1. The design of the business acceptance process needs further improvement
2. Requirements for certain responsibilities are not well documented
3. Lack of proper documentation of the pricing review
4. Lack of formalization of the data quality initiative
5. No control is designed to ensure completeness and timeliness
6. No control is designed to ensure adherence to End User Computing requirements
7. Lack of process to ensure compliance with risk policies
Management will complete the actions on a continuous basis.
Audit plan 2017
Based on a risk assessment performed at the end of 2016, the audit plan for 2017 consist of:
Business acceptance process audit - effectiveness testing of controls
IT audit on data warehouse
Global IT audit – Shadow IT
Global IT audit - ISIR (Information Security Incident Response)
The audit plan is approved by the Supervisory Board of BSR. Changes to the plan will be reported to
the Supervisory Board and approved by the Board.
B.6 Actuarial function BSR’s Actuarial Function is responsible for the appropriate and on-going assessment of insurance
liabilities and related items, including oversight of pricing and valuation of insurance liabilities and
mechanisms to manage these insurance liabilities. The BSR Actuarial Function is split in the Valuation
& Capital Team (first line of defense) and the Actuarial Function Holder (AFH, second line of defense).

55
The Actuarial Function is an independent and hybrid function which operates in part as direct support
to frontline business operations and in part to keep oversight on behalf of the BSR MB and SB regarding
reserving, underwriting, reinsurance, pricing, and expense allocations. Work of the Actuarial Function
constitutes to a large extent assessing and challenging the appropriateness and sufficiency of various
inputs to and outputs from the actuarial and risk capital processes. This activity is part of the regular
review processes within business operations.
Calculation of the technical provisions and required capital, assumption setting and modeling
(development, testing, implementation, and methodology) occur within BSR Valuation & Capital Team,
with review and challenge by the AFH. The Head of Valuation & Capital reports to the Chief Financial
Officer. In order to ensure the independence of the Actuarial Function, the Actuarial Function Holder
reports to the Chief Risk Officer. This also ensures close coordination between the Actuarial Function
and the Risk Team and contributes to the effective implementation of the risk management system.
At least once a year, the AFH and the Valuation & Capital team collaborate to produce an Actuarial
Function Report summarizing the key conclusions and recommendations around the technical
provision and solvency position.
One of the objectives of the actuarial function is to align the assessment and management of actuarial
risks (also referred to as underwriting risks) with Blue Square Re’s broader corporate and risk
management strategies. The risk tolerance for each actuarial risk is derived from the risk tolerance
framework of BSR. The AFH works with the first line of defense to effectively manage actuarial risks in
line with Blue Square Re’s risk tolerances.
Objectives of the functions
The objectives of the actuarial functions are:
Ensure appropriate methodology and best estimate assumptions for the valuation of BSR’s
liabilities and related items for both existing and new business, including procedures that
ensure timely review and appropriate level of granularity on an ongoing basis;
Ensure that reinsurance liabilities and related items are valued and reported properly,
including choice of valuation approach, reflection of uncertainty and management discretion,
model set-up, data quality (both internal and external data) and other relevant components
of valuation;
Furnish the Risk & Capital Committee and the Management Board with actuarial analysis and
advice at least concerning:
o Appropriateness, adequacy and quality of data, assumptions and methodologies used
to determine technical provisions and related items including items that are deemed
to require future attention;
o Adequacy of reinsurance arrangements;
o Impact of strategic or management decisions on liabilities.
Ensure appropriateness of the technical provisions, including the risk margin;
Support the Management Board in the execution of an effective Underwriting Policy, Pricing
and Product Development Policy and Reinsurance Use Policy by providing expert opinions;
Ensure compliance with regulatory actuarial (reporting) requirements, including the actuarial
signoff on adequacy of reserves;
56
Support proper actuarial consideration in management decision making and key business
activities in a transparent and coherent manner;
Oversee compliance with actuarial standards and methodologies;
Timely reporting to the Management Board on material deviations from actual experience to
the projected best estimate;
Support the implementation of an effective risk management system in BSR.
The Actuarial Function Holder is responsible for the Actuarial Function Report, with a review
and opinion on the data quality, adequacy of the technical provisions, including the risk margin
by a detailed assessment around the assumptions, models, methodologies, and risk controls.
Any uncertainties and recommendations are also called out in the report.
B.7 Outsourcing
B.7.1 External outsourcing arrangements
External outsourcing arrangements are arrangements of any form between BSR and a supplier, by
which that the supplier performs a function or an activity, whether directly or by sub-outsourcing,
which could otherwise be performed by the organization itself.
Outsourcing risk is considered material under Solvency II when ‘a function or activity is a critical or
important function or activity on the basis of whether this function or activity is essential to the
operation of the undertaking as it would be unable to deliver its services to policyholders without the
function or activity.’ Examples of significant and material processes that, if performed by another
entity, would be classified as material outsourced arrangements includes:
Provision of customer administration or back-office support services;
Risk management and internal control related functions including compliance, internal audit
and financial accounting;
Product development and pricing;
Asset and portfolio management;
Underwriting and claims handling;
Supplier Hosted Data Storage & Application Services (e.g. Cloud Computing), such as
Workday or Sales Force;
IT maintenance and support;
Reinsurance administration function is outsourced to a vendor/supplier who also
services/supports the business (policies);
The Own Risk Solvency Assessment process; and
Human Resource Management support or payroll processing.
Outsourcing arrangements and material suppliers impact operational risk as a result of potential
material changes to and reduced control over the related people, processes and systems. To manage
outsourcing arrangements, BSR has set up an Outsourcing & Supplier Risk Policy. The aim of this
policy is to ensure that arrangements entered into by BSR which can result in material risk (i.e. risk
classification severe and significant) are subject to appropriate due diligence, approval and ongoing
monitoring. All material risks arising from these activities should be appropriately managed to ensure
that BSR is able to meet both its financial and service obligations.

57
B.7.2 Intra-group outsourcing arrangements
Blue Square Re has material intra-group outsourcing agreements. BSR makes use of several ancillary
service companies which perform a range of services for BSR. These ancillary service companies are
fully owned by the Aegon Group. BSR has outsourced the asset management function to Aegon Asset
Management, who manages the investments based on investment mandates.
The Outsourcing & Supplier Risk Policy also covers the intra-group outsourcing. For intra-group
outsourcing (i.e. the supplier is a legal entity fully owned by Aegon) the examination of the vendor
may be less detailed as BSR has greater familiarity with the vendor. However, both BSR and Aegon
Group require for intra-group outsourcing agreements a written agreement including a service level
agreement (SLA) (if applicable), stipulating duties and responsibilities of both parties to exist.
Given the size of Blue Square Re, the company has outsourced part of the functions to Aegon
Corporate Center, to Aegon Global Technology and to Aegon Asset management. The company has a
Service Level Agreement with Corporate Center, AGT and AAM in place. The SLA’s contains
descriptions of the roles, responsibilities and monitoring of the outsourced activities. On a regular
basis, at least yearly, the responsible Blue Square Re Management Board member evaluates the
performance of the outsourced activity.
B.8 Any other information
B.8.1 Assessment of adequacy
The Corporate Governance at Blue Square Re is determined by the MB and SB and the shareholder,
Aegon N.V.. Regulations and (inter)national guidelines are taken into account and the roles and
responsibilities of the Management and Supervisory Board are reflected in management charters.
Those management charters are reviewed on a regular basis and revisions will follow required
approval processes.
In addition, all employees of Blue Square Re are committed to the Code of Conduct which consists of
our Purpose, Core Values, Business Principles and Rules of Conduct of Aegon Group, which Blue
Square Re endorses. The Code of Conduct also addresses Governance aspects and reflects on the
internal guidelines and policies, the compliance with laws and regulations, information sharing and
the identification and management of risks in a prudent way.
B.8.2 Other material information
Blue Square Re is not aware of any other material information regarding the system of governance.

58
C. Risk Profile
General
Since its founding, BSR has been focused on underwriting risk transfer solutions for Aegon
businesses. The Company aims to continue to increasingly retain a significant portion of the
underwriting risk that is being reinsured to external reinsurers by Aegon companies or joint ventures
for the purpose of managing volatility that diversifies well at the Aegon Group.
The largest risks Blue Square Re faces are underwriting risks - mortality, longevity and non-life
catastrophe. This is consistent with the Company’s risk strategy. BSR aims for a balanced risk profile
while meeting its overall objectives, although currently longevity is the largest underwriting risk. BSR
is also exposed to non-life property and casualty risk, both through reinsurance of this risk and
investment in Insurance Linked Securities.
Operational risk continues to be an area of focus for the company as it transitions from a start-up
phase and moves towards defining, standardizing and automating processes. This will reduce the
amount of manual intervention in processes, improve controls and ensure scalability. Significant
improvements have been made in the last 12-18 months to reduce operational risk, as described
earlier in section B.3.1 Risk management system.
To manage its risk exposure, BSR has risk policies in place. Some of these policies are Aegon group
policies while others are specific to the unique situation of BSR. The policies limit BSR’s exposure to
major risks. The limits in these policies in aggregate remain within the BSR’s overall tolerance for risk
and financial resources. Operating within this policy framework, BSR employs risk management
programs described in section B.3.1 Risk management system.
As part of its risk management program, BSR takes inventory of its current risk position across risk
categories. The Company also measures the sensitivity of net income and shareholders’ equity under
shock scenarios. Management uses the insight gained through these ‘what if?’ scenarios to manage
the risk exposure and capital position. The models, scenarios and assumptions used are reviewed
regularly and updated as necessary, with greater focus given to the more material assumptions.
The results of BSR’s sensitivity analyses are presented later in this section to show the estimated
sensitivity of net income and shareholders’ equity to various scenarios. For each type of market risk,
the analysis shows how net income and shareholders’ equity would have been affected by changes in
the relevant risk variable that were reasonably possible at the reporting date. For each sensitivity
test the impact of a reasonably possible change in a single factor is shown.
The sensitivities do not reflect what the net income for the period would have been if risk variables
had been different because the analysis is based on the exposures in existence at the reporting date
rather than on those that actually occurred during the year. Nor are the results of the sensitivities
intended to be an accurate prediction of BSR’s future shareholders’ equity or earnings.
The analysis does not take into account the impact of future new business, which is an important
component of BSR’s future earnings. It also does not consider all methods available to management

59
to respond to changes in the financial environment, such as changing investment portfolio
allocations or adjusting premiums.
As part of business planning, the resilience of BSR’s business strategy is tested in several extreme
scenarios. These scenarios cover both economic and underwriting risks.
Prudent Person Principle
The prudent person principle is within the scope of Aegon's, and therefore BSR's, System of
Governance. The investment mandates section of the Standard of Practice paper makes sure that the
prudent person principles are satisfied. The risks on the investment side are reported through the
Investment Committee with the look-through data provided by Aegon Asset Management. There are
numerous risk policies in place to ensure that the assets held are appropriate to the nature of the
liabilities without taking on excessive risks:
The Investment and Counterparty Risk Policy establishes the exposure limit for Investment
and Counterparty Risk.
The Currency Risk Policy limits the amount of currency risk allowed.
Concentration in exposures are avoided by testing extreme scenarios in the Budget/MTP
process and by setting single counterparty limits in the Group Credit Name Limit Policy.
The requirements related to use of derivatives can be found in the Derivative Use Policy. This
policy ensures that a consistent standard of responsible derivative usage is in place across
the Aegon Group. In addition, the consolidated reporting of derivative positions provides
transparency to derivative usage as well as a demonstration of controls.
The Reinsurance Use Policy (RUP) establishes the process with which reinsurance use is
conducted in Aegon in order to ensure a consistent high standard of reinsurance use across
the Group, to ensure proper internal controls are in place around risks arising from
reinsurance (e.g. counterparty, basis) wherever material and to ensure globally consistent
information on Aegon's reinsurance treaties is available.
The primary objective of investments owned by BSR is to pay claims as they come due and preserve
capital without exposing BSR to significant liquidity, market, credit, or valuation risks. Only relatively
liquid assets of high quality and rating are considered, whilst the nature of the liabilities is taken into
account. The primary objective of BSR is to first and foremost successfully manage underwriting risk.
Secondary to the primary objective is investment performance; therefore a conservative investment
approach is pursued. An ALM assessment on the liability profile of BSR indicates that future expected
claims are largely covered by future premium income related to existing contracts as most of the in-
force reinsurance contracts of BSR has been structured with such cash flow profile. This further
reduces the onus on BSR to invest in long-term high-yielding assets to fulfil future obligations.
BSR attempts to mitigate its exposure to any investment risks (market, credit, foreign currency
exchange and liquidity) by regularly stress-testing the resilience of its investment portfolio in a range
of scenarios and investment conditions and checking the resulting impact on its solvency position.
The assets should be as duration-matched as practically possible - taking into account risk reward
characteristics - to minimize the asset liability mismatch associated with BSR's economic profile.

60
BSR maintains an adequately diversified portfolio of assets to mitigate concentration, credit and
other risks including the risks that arises from excessive reliance on any one asset, issuer or group of
undertakings. BSR's asset portfolio is split across short-term assets such as cash and money markets,
as well as longer term assets invested through funds managed by third party, namely fixed income
funds and ILS.
ILS were added to BSR's investment portfolio during 2015, and the investment scaled up midway
through 2016. The underlying risk exposure represents different risk perils from various geographical
regions, counterparties, and maturities ensuring broad diversification. BSR receives model detail on
each underlying risk from the asset manager and uses this in its risk analysis. ILS do not contribute to
traditional investment risk such as interest, spread or equity, but instead to property and casualty
catastrophe risk, which provides a good balance to the main underwriting risks (mortality and
longevity).
Liquidity management is a fundamental building block of BSR's overall financial planning and capital
allocation processes. The Company's liquidity risk policy sets guidelines in order to achieve a prudent
liquidity profile and to meet cash demands even under extreme conditions.
Off-balance positions and Special Purpose Vehicles
Initial margin for the Synthetic Longevity Hedge is held off balance sheet. Each counterparty has
posted initial margin in their home currency, amounting to EUR 10.3m in total. These amounts are
held in government bonds in a segregated custodian account with a reputable, highly-rated bank.
Payables due under letter of credit agreements provided by Blue Square Re to the U.S. Internal
Revenue Service at December 31, 2016 amounted to EUR 75k (2015: EUR 75k). As of that date no
amounts had been drawn, or were due under letter of credit facility.
C.1 Underwriting risk
C.1.1 Underwriting risk description
Underwriting risk relates to the policies reinsured into BSR. It is the risk of incurring losses when
actual experience deviates from BSR’s best estimate assumptions on mortality, morbidity,
policyholder behavior, P&C claims and expenses. BSR has a preference to selectively grow
underwriting risk, but this needs to go hand-in-hand with a strong underwriting process. BSR's
earnings depend, to a significant degree, on the extent to which claims experience is consistent with
assumptions used to price reinsurance contracts and establish technical liabilities.
If actual claims experience is less favourable than the underlying assumptions used in establishing
such liabilities, BSR’s income would be reduced. Furthermore, if less favourable claims experience
became sustained, BSR may be required to increase liabilities for other related products, which may
reduce BSR’s income. This may have a materially adverse effect on BSR's results of operations and
financial condition.

61
Sources of underwriting risk include policy lapses, policy claims (such as mortality and morbidity) and
expenses. In general, BSR is at risk if policy lapses increase, as expected future profits are reduced as
a result. BSR reinsures certain types of policies that are at risk if mortality or morbidity increases,
such as term life insurance and accident insurance. BSR also reinsures annuity products that are at
risk if mortality decreases (longevity risk), through the Dutch Longevity Reinsurance contract. If the
trend toward increased longevity persists, BSR may experience adverse effects because the period of
time over which annuity benefit payments are made becomes longer as life expectancies increase.
BSR is also at risk if expenses are higher than assumed.
BSR monitors and manages its underwriting risk by underwriting risk type. Attribution analysis is
performed on earnings and reserve movements in order to understand the source of any material
variation in actual results from what was expected. BSR also performs experience studies for
underwriting risk assumptions, comparing BSR’s experience to industry experience as well as
combining BSR and industry experience together based on the depth of the history of each source.
Some risk mitigations are built into the reinsurance structures of product plans, as there are some
reinsurance contracts where BSR’s reinsurance rate will follow the reviewable premium structure of
the reinsured product plans, or yearly renewable term reinsurance that allows for BSR to raise
reinsurance rates should the cedant also raise the policyholder mortality charges. BSR also has the
ability to reduce expense levels over time, thus mitigating unfavorable expense variation.
Across 2016 the main changes in underwriting risk exposure were:
A reduction in mortality risk exposure due to the novation of the US stop-loss mortality
reinsurance contract to another entity.
As a result the Synthetic Longevity Hedge was restructured to remove the US mortality
aspect of the hedge (the restructure took place in parts, first in December 2016, the
remainder in February 2017).
Investment in Insurance Linked Securities was increased to by an additional EUR 10m during
2016, thus increasing non-life risk.
The annual Hungarian non-life catastrophe contract was renewed in December 2016. Like
last year, BSR has a share of the first layer, but now BSR also took a small share of the higher
reinsurance layers, so the maximum risk exposure was increased.
C.1.2 Underwriting risk assessment
For underwriting risks, BSR manages the risks by regularly reviewing the experience, holding capital
to cover the worst case event, monitoring the risk exposures against risk limits (which are set in
accordance to the Risk Strategy), and actively looking for risk mitigation opportunities. Capital
requirements are calculated using the Solvency II Standard Formula. Risk limits are based on the
Aegon internal economic framework, and are covered in more detail in the next section.
BSR reviews its actuarial assumptions annually in the third quarter. In addition, as part of an ongoing
commitment to deliver operational excellence, the company reviews and refines its models where
necessary.

62
Changes over the reporting period
Changes in, among other things, morbidity, mortality, longevity trends and policyholder behavior
may have a considerable impact on the Company's income. Assumptions used to price products and
establish technical liabilities are reviewed on a regular basis. In 2016, BSR made several changes and
updates to assumptions and models.
Key assumptions
Assumptions reviewed and updated in 2016 include:
Dutch Longevity Reinsurance mortality trend projection based on recalibration of internal
stochastic mortality model using new general population mortality of CBS 2015.
Dutch Longevity Reinsurance mortality experience factors based on 3 years of observation in
the reinsured portfolio and 3 years of Aegon NL overall insured portfolio experience.
Synthetic Longevity Hedge trend projection of the US and NL based on latest general
population data published by the US and the Dutch statistical agencies.
UK Individual Protection mortality and morbidity assumptions are updated based on Aegon
UK overall experience studies.
Maintenance expense assumption was updated based on a study on actual incurred
expenses against projected growth of BSR according to the Medium Term Plan.
Assumption reviews also completed this year but with a recommendation to continue using the
existing assumption include:
TLB mortality assumption, where limited data in the high net worth individual space leads to
very limited and non-credible data for a detailed experience analysis. The mortality review is
based on benchmarking BSR’s assumption against peers.
With the updates above, the assumptions used for the key contracts are viewed to be appropriate
for the valuation of technical provisions for FY 2016. Only in its sixth year of operations, BSR
continues to enhance data reporting process, build credible experience in its portfolio and monitor
closely any emerging trend focusing on the key contracts for signs of long-term deviations from
current assumptions.
Models
The MoSes models for TLB High Net Worth reinsurance contract, UK Individual Protection contract,
and an aggregation model went live in Q4 2016. Collectively, there are two primary models within
MoSes – (1) a deterministic life model for TLB and UK Individual Protection, and (2) an aggregation
model used to value all cash flow scenarios projected for all contracts of BSR, which resulted in the
valuation of technical provisions and capital. Model test plans were conceived and the MoSes models
were tested against these test plans before a recommendation for approval is given to the
Management Board. Ultimately, the MoSes models were approved for use as of Q4 2016, and the
model change impact was quantified and reported as part of the quarterly movement analysis of
technical provisions (hence S-II Own Funds & IFRS Equity) and capital requirements.
The model development and model change process is managed through a versioning system. It
allows for the automated and controlled logging of historical changes made to a given model, where
past models are never deleted but stored on the server. This is an auditable system as one can
63
always retrieve past information and obtain information as to who made the changes, when the
changes were made and the nature of the changes.
As BSR is still in the process of migrating existing Excel-based models into an integrated modelling
platform, there remains some residual risk in the operation of these models. The use of Excel-based
models is expected to reduce over time as the model migration continues with the lesser impact
models.
C.1.3 Underwriting risk concentration
BSR manages risk concentration actively by applying internal risk limits, which are set for each
underwriting risk type (mortality, longevity, morbidity, policyholder behavior, property and casualty
and expenses). The limits are intended to target a balanced mix of risks which ensures a high level of
risk capital diversification. Management actions are taken when a risk is too high or low compared to
the agreed risk limits.
At Q4 2016 longevity risk was the most concentrated risk due to the large longevity reinsurance
transaction in The Netherlands. During Q1 2017 this risk reduced in size due to the completion of the
restructure of the mortality hedge following the novation of the US stop-loss contract.
BSR’s business plan is focussed on taking on further mortality and non-life risk through additional
reinsurance contracts. Where transactions are with counterparties in non-Euro-denominated
countries, there may be a resultant increase in currency risk exposure. Similarly entry into long-term
contracts may lead to an increase in interest rate risk. However there are no plans to adopt a riskier
investment strategy, so the company’s risk profile will continue to be heavily weighted towards
underwriting risk. Risk concentration will be considered as part of the decision process for any future
transactions, but in general the aim is to achieve a balanced mix of underwriting risks to maximise
diversification. Therefore, while the size of the balance sheet and required capital is expected to
grow, the type of underwriting risk exposure the company faces should remain consistent with that
described above.
C.1.4 Underwriting risk mitigation
The Synthetic Longevity Hedge is an out-of-the-money, synthetic hedge that was conceived as a
means of longevity risk mitigation and thus capital reduction. Initially, it combined longevity risk on a
Dutch annuity portfolio and mortality risk of a mortality book in the US. However, upon the novation
of the US stop-loss contract in Q4 2016, the US mortality leg of the hedge contributed to a one-sided
risk exposure instead of a hedge position. To mitigate this exposure, BSR agreed with the
counterparties to restructure the contract to lock down the US projection of mortality paths as
defined under the hedge payout, in order to remove this source of volatility and thus the risk. As a
result, as of Q1 2017, the hedge now protects BSR only against Dutch longevity worsening. At least
once a year in conjunction with the annual mortality assumption update (as new mortality data point
is only published once a year), the hedge effectiveness of the hedge is reassessed using an internal
stochastic mortality model.

64
The Synthetic Longevity Hedge is collateralised via initial and variation margin. Each counterparty has
posted initial margin in their home currency, amounting to EUR 10.3m in total. These amounts are
held in government bonds in a segregated custodian account with a reputable, highly-rated bank.
As at 31 December 2016, BSR had posted a total variation margin of EUR 9.2m in cash with the
counterparties, as shown in section D.1.14 Receivables (trade, not insurance). Due to the recent
hedge restructure a repayment of collateral is expected in early 2017. The conditions of the collateral
arrangement are that its value is recalculated on a monthly basis, using a shared third party valuation
model. It is rebalanced whenever the difference between the calculated collateral value and the
posted amount exceeds EUR 1.5m.
BSR hedges its exposure to mortality risk on the Turkey Life Reinsurance contract by having a
mortality catastrophe reinsurance cover in place to limit potential claims payout in a single large
event. On the same contract, a retrocession agreement is in place so that for each individual policy
any exposure above EUR 36.4k is passed on to an external reinsurer.
The Dutch Longevity Reinsurance transaction is collateralised, but this is intended to mitigate credit
risk so it is covered in more detail in section C.3.4 Credit risk mitigation.
For certain other contracts BSR mitigates its risk by only participating in lower reinsurance layers,
which caps the company’s exposure.
Going forward BSR’s strategy is to grow by taking on similar underwriting risks to those already in
place. The current approach to risk mitigation is expected to continue in the short to medium term.
There are further options available, such as outward reinsurance of policyholder behavior risk, which
may be pursued if necessary to achieve a balanced risk profile.
C.1.5 Underwriting risk sensitivity
BSR carries out sensitivity testing on its current portfolio, by stress testing key risks to assess the
financial impact. In addition to the sensitivities, as part of its business planning process, extreme
event scenarios are evaluated. The extreme event scenarios defined by Aegon Group as part of the
business planning process are mainly focused on extreme economic conditions. These are less
onerous for BSR due to the high quality and liquid nature of the asset portfolio. Therefore additional
scenarios are considered, taking into account the specific nature of BSR’s portfolio and the key
underlying risks (longevity/expenses).
Sensitivity testing
The table below shows the sensitivity results of BSR, and the impact on the BSR S-II ratio. The
sensitivities are performed relative to BSR’s forecast of Q4 2016 financials without taking into
account the mortality risk mitigating effect of the Synthetic Longevity Hedge. In other words, the
table below shows the pre-hedge sensitivities, which is larger than the actual sensitivities if mortality
is stressed.

65
BSR is predominantly driven by underwriting risk, with longevity risk representing the largest risk on
the BSR balance sheet. The Dutch Longevity Reinsurance contract represents the largest proportion
of the current risk profile of BSR, which drives the adverse sensitivity towards lower mortality rate
and lower interest rate.
The losses under -10% and -15% mortality are almost entirely driven by the Dutch Longevity
Reinsurance, and this has to do with it being a pure longevity reinsurance contract at which BSR
assumes risk when the underlying insured pensioners live longer. The size of the obligation, valued at
about EUR 1.2 billion, dominates the risk exposure of any other contract that BSR currently has on its
balance sheet. A lower mortality rate also has a secondary effect on the SCR given the amount and
duration of remaining annuity payments are now higher and longer under SII, although the SCR
impact is significantly smaller in magnitude than those of the Own Funds impact. The mortality
sensitivity this year shows a smaller magnitude (of the same direction) of sensitivities compared to
last year. This is due to the longevity portfolio running off. It is also worthwhile noting that the
mortality sensitivity excluded the US stop-loss mortality contract due to the novation.
The other scenarios are not material drivers to the economic value of BSR since the solvency ratio of
the company stays relatively constant in both morbidity and lapse shocks. This is to say, in case of
lapse up and morbidity up shocks, one notices losses in Own Funds (as previously mentioned, BSR
profits are expected to realize over time and are still locked in future projections of cash flows) which
are offset by the release of capital and the opposite is true in case of down shocks. Given current
composition of BSR portfolio, we may draw a conclusion that the company’s solvency is not
threatened by relatively huge volatility in morbidity. Lapse sensitivity on the other hand, while still
insignificant to BSR, may be slightly mis-estimated in this analysis as BSR had estimated the impact of
lapse risk on the MSI contract (which is exposed to higher lapses due to the relatively high future
profits) in lieu of a full model run. The modelling of MSI will be tightened in the future consistent
with BSR’s model review plan.
Base 81,061 59,523 136%
Sensitivities (in EUR '000s) Own Funds gain/(loss) Gross SCR
increase/(decrease) Solvency ratio
Mortality +15% 43,815 (333) 211%
Mortality+10% 29,747 (920) 189%
Mortality-10% (33,825) 1,091 78%
Mortality-15% (53,104) 2,215 45%
Morbidity +10% (388) (69) 136%
Morbidity -10% 390 70 137%
Lapse +20% (879) (343) 135%
Lapse +10% (434) (175) 136%
Lapse -10% 519 183 137%
Lapse -20% 1,025 375 137%
Interest rates +50bps 2,580 (3,966) 151%
Interest rates -50bps (3,118) 4,528 122%
EUR appreciation +25% (4,689) (2,036) 133%
EUR depreciation -25% 7,866 3,898 140%

66
The proportion of nonlife risks in BSR remains small and not sensitivity-tested. The nonlife
catastrophe risk is described qualitatively in the later sub-section on Nonlife Shock, as the occurrence
of catastrophe risk is more binary in nature.
C.1.6 Underwriting risk data
As a Standard Formula entity, BSR uses the prescribed correlation matrix to assess the dependency of
sub-modules (risk types) to arrive at the aggregate risk capital.
C.2 Market risk
C.2.1 Market risk description
As described previously, the objective of the Company is to first and foremost successfully manage
underwriting risk. As a result, BSR has a very conservative investment stance which is focused on
maintaining adequate liquidity ahead of achieving high investment returns. Investment and
counterparty risk consists mainly of credit risk and this is kept to a limited level. BSR does not hold
any equities in its asset portfolio.
BSR is exposed to market risk through the mismatch in the sensitivity of assets and liabilities to
changes in interest rates and currency exchange rates. Exposure to concentration risk has been
assessed as immaterial, and liquidity risk is managed through regular monitoring of the balance of
cash and cash-equivalent assets.
BSR’s exposure to interest rate and currency risks reduced during 2016 as a result of the novation of
the US stop-loss mortality reinsurance and recapture of the China modified coinsurance.
BSR maintains an adequately diversified portfolio of assets to mitigate concentration, credit and
other risks including the risks that arises from excessive reliance on any one asset, issuer or group of
undertakings. This is achieved by investing in fixed income funds as opposed to direct holding of fixed
income securities. BSR’s asset portfolio is split across Insurance Linked Securities, cash in bank, and
assets managed by Aegon Asset Management.
ILS were added to BSR’s investment portfolio during 2015, and the investment scaled up midway
through 2016. The underlying risk exposure represents different risk perils from various geographical
regions, counterparties, and maturities ensuring broad diversification. BSR receives model detail on
each underlying risk from the asset manager and uses this in its risk analysis. ILS do not contribute to
investment risk, but instead to property and casualty risk, which provides a good balance to the main
underwriting risks (mortality and longevity).
BSR does not have direct exposure nor write any embedded financial options and guarantees. This
means BSR does not have material financial risk embedded within the reinsurance contracts.
As described above, BSR’s business plan is focussed on taking on further mortality and non-life risk
through additional reinsurance contracts. Where transactions are with counterparties in non-Euro-
denominated countries, there may be a resultant increase in currency risk exposure. Similarly entry

67
into long-term contracts may lead to an increase in interest rate risk. However there are no plans to
adopt a riskier investment strategy, so the company’s risk profile will continue to be heavily weighted
towards underwriting risk.
C.2.2 Market risk assessment
On January 1st 2016 Solvency II came into force and since then BSR have used the Standard Formula
for Solvency II required capital calculations. The Standard Formula can be used to assess BSR’s market
risk exposure and to determine an appropriate level of capital buffer to target.
In addition Aegon has had its own internal economic framework in place for several years, and BSR
also calculates required capital under this framework. In the economic framework BSR uses the same
1-in-200 shocks as the Solvency II Standard Formula for most underwriting risks, so the overall solvency
result is fairly similar across the two frameworks. For market risks there are differences between the
two frameworks, but as discussed these risks are less material for BSR. The economic framework result
is used in assessing how the company’s situation compares to its risk tolerance.
BSR also carries out sensitivity testing, which is covered in more detail in the next section, to assess
the impact of changes in economic factors on its solvency position.
In its capital management policy, BSR targets a solvency ratio of 140-160%. Following complete
restructure of the Synthetic Longevity Hedge in Q1 2017, BSR’s solvency ratio is in the opportunity
range (160%-180%). Based on sensitivity analysis, this level of capitalization is more than adequate to
prevent a breach in BSR’s risk tolerance for market risks. As such, BSR’s capitalisation is appropriate to
support its exposure to market risk.
C.2.3 Market risk concentration
BSR’s investment portfolio is split across cash, ILS, and funds managed by Aegon Asset Management
(AAM).
The cash in banks are currently split across two reputable banks, and BSR’s exposure to these banks
is subject to assessment against the Aegon Credit Name Limit Policy.
For ILS, the underlying risk exposure represents different risk perils from various geographical
regions, counterparties, and maturities ensuring broad diversification.
The AAM funds held are for money markets as well as European government, government-related,
and corporate fixed income instruments. AAM choose the underlying assets within each fund, taking
a well-diversified approach and subject to meeting BSR’s investment mandate.
Therefore there are no market risk concentrations that are a material concern for BSR. These are
regularly monitored through the risk tolerance, as shown in section C.1.3 Underwriting risk
concentration.

68
C.2.4 Market risk mitigation
BSR hedges interest rate mismatch risk using interest rate swaps. Otherwise the market risk
exposures are not significant enough to merit the cost of putting in place hedging arrangements. The
swaps are monitored daily in accordance with a mandated tolerance and rebalanced as necessary.
The interest rate swaps are collateralised through a combination of initial and variation margin. BSR
posted initial margin of EUR 3m in cash and as at 31 December 2016, variation margin of EUR 641k,
also in cash to the clearing house via Aegon Derivatives. This amount is shown as an asset on the BSR
balance sheet, as described in section D.1.9 Loans and mortgages. Variation margin is recalculated
daily. The interest rate swap trades are executed using Aegon Derivatives N.V. as a pass through
vehicle between BSR and the external market.
As BSR grows by entering into new reinsurance contracts, interest rate risk exposure will continue to
be monitored and the hedge will be adjusted to ensure this risk remains within limits.
For any significant development that introduces a temporary but significant market risk exposure (for
instance, pending settlement in a foreign currency), BSR may enter into a currency hedge.
C.2.5 Market risk sensitivity
As mentioned earlier, BSR is mainly exposed to underwriting risks and therefore, market risk extreme
event scenario testing is deemed not quite applicable. Nonetheless, point in time estimate of
sensitivity analyses are performed on market risks by parallel shifting the yield curves and shocking
the spot currency exchange rate. An overview of relevant Solvency II market sensitivities is presented
below.
The loss from a -50 bps interest rate sensitivity is driven by the risk margin on the majority of the
contracts. In terms of best estimate liability projection, the dollar duration of the premium cash flows
is higher than the dollar duration of the benefit and expense cash flows, i.e. a gain on the best
estimate portion of the technical provisions when interest rates decline. However, the increase in
risk margin causes a loss to Own Funds which more than offsets the gain in best estimate. The
increase in risk margin is due to an even larger payout and longer duration under the worst-case
scenario, resulting in an increase in time 0 capital and projected capital requirements. This in turn
affects the risk margin which is the cost of holding the higher capital under the interest rate down
scenario.
Foreign currency sensitivities are mostly driven by changes in best estimate portions of technical
provisions not denominated in EUR, as well as movements in Dutch Longevity Reinsurance risk
Base 81,061 59,523 136%
Sensitivities (in EUR '000s) Own Funds gain/(loss) Gross SCR
increase/(decrease) Solvency ratio
Interest rates +50bps 2,580 (3,966) 151%
Interest rates -50bps (3,118) 4,528 122%
EUR appreciation +25% (4,689) (2,036) 133%
EUR depreciation -25% 7,866 3,898 140%

69
margin. Even though this contract is EUR denominated, its margin is nonetheless the most sensitive
of all contracts (in absolute terms) to any impact resulting from a change in risk margin
diversification. The change in margin diversification is a result of the change in total non-hedgeable
risks from a currency shock, which in turn affects the diversification benefit on the risk margin
greatly. The impacts on Own Funds and SCR are partially offsetting, whereby a 25% increase in FX
rate (interpreted as weakening of foreign currencies with respect to the euro) causes a loss in Own
Funds and a release of SCR of half of its size, and vice versa for the opposite FX sensitivity.
C.2.6 Market risk data
As a Standard Formula entity, BSR uses the prescribed correlation matrix to assess the dependency of
sub-modules (risk types) to arrive at the aggregate risk capital.
C.3 Credit risk
C.3.1 Credit risk description
Credit risk is the risk that the market value of fixed income investments fluctuates because of
changes in the financial condition of the obligor or the appetite in the market for this risk. Credit risk
can manifest itself in three ways: spread widening, rating migration and default. The key risk driver
has generally been spread widening, but defaults and downgrades are also relevant.
BSR has a small exposure to credit risk through investment in AAM bond funds within its asset
portfolio. During 2016 BSR also had exposure in an AAM asset backed securities fund, but the holding
was liquidated after reassessment of the portfolio, which reduced the company’s exposure to credit
risk.
The following sets out the restrictions that are stipulated in the Investment Management Agreement
with the Investment Manager. Note that where funds are purchased, these criteria apply to the
average profile of the fund.
Allocation
No more than 60% may be invested in non-sovereign fixed income instruments (together
with the criterion immediately below, this means at least 40% is always invested in
sovereigns and cash);
No less than 20% can be in cash or T-bills (including money market accounts);
Duration and maturity
The overall (including cash) portfolio duration must not exceed 3 years;
No maturity may exceed 7 years.
Quality
50% of all bonds must be A-rated at the time of purchase;
No equity shares are allowed;
No more than 10% invested in any single name.

70
The chart below shows the investment mix within BSR’s asset portfolio at the end of 2016 (a list of
look-through assets is reported in the QRT S.06.02.01):
Spread widening, downgrades and defaults in debt securities held within the above AAM funds, or
the failure of certain counterparties, may adversely affect BSR’s profitability and shareholders´
equity.
The table on the next page shows that the majority of the assets held in the AAM funds are highly-
rated. Cash is held with reputable, A-rated banks.
Instrument Class Credit Rating Solvency II Asset Value (€m)
Cash in Bank A 4,445
Total AAM Investment Funds AAA 4,884 AA 11,573
A 14,276 BBB 8,938 BB 0.037
Not rated 0.828
Total 40,537
ILS Not Rated 21,343
Total Investments 66,324
The ILS investment via an external fund is a different type of asset, offering exposure to underwriting
risk from a well-diversified portfolio of insurers. The fund consist of roughly 25% catastrophe bonds
and 75% private (re)insurance placements.

71
BSR holds a small amount of interest swaps to hedge market risk. Therefore the company is exposed
to the risk of default by the counterparties to the swaps on their financial obligations. This could be
due to, among other things, bankruptcy, lack of liquidity, market downturns or operational failures.
The fact that the swaps are cleared and collateralised mitigates this risk, although in extreme
scenarios it is possible that the collateral the counterparties provide may prove inadequate to cover
their obligations at the time of the default. However, the initial margin requirement for cleared
trades has lowered this risk significantly.
BSR also faces a small amount of counterparty default risk on its two existing outward reinsurance
transactions. These transactions are with highly-rated reputable reinsurers.
C.3.2 Credit risk assessment
As in section C.2.2 Market risk assessment, credit risk is measured by calculating required capital
using both the Solvency II Standard Formula and Aegon’s economic framework. The economic
framework result is used in assessing how the company’s situation compares to its risk tolerance.
As premiums and deposits are received by BSR, these funds are invested to pay for future
policyholder obligations. Therefore BSR typically bears the risk for investment performance equalling
the return of principal and interest. BSR is exposed to credit risk on its general account fixed income
portfolio, over-the-counter derivatives and reinsurance contracts. Some issuers have defaulted on
their financial obligations for various reasons, including bankruptcy, lack of liquidity, downturns in
the economy, downturns in real estate values, operational failure and fraud. Therefore future
excessive defaults or other reductions in the value of these securities and loans could have an
adverse effect on BSR’s business, results of operations and financial condition.
However BSR’s credit risk exposure is currently small. Most in-force reinsurance contracts are
expected to produce positive cashflows into BSR in future, so the requirement to invest in high
yielding or long duration assets to pay for future obligations is low. Instead the main investment
objective is to ensure sufficient liquidity in the short term ahead of profits emerging on the contracts.
Counterparty risk on the interest rate swaps and outward reinsurance contracts has been assessed to
be immaterial.
C.3.3 Credit risk concentration
BSR’s investment portfolio is split across cash in bank, ILS, and funds managed by Aegon Asset
Management (AAM).
The bank deposits are currently split across two reputable banks, and BSR’s exposure to these banks
is subject to assessment against the Aegon Credit Name Limit Policy.
For ILS, the underlying risk exposure represents different risk perils from various geographical
regions, counterparties, and maturities ensuring broad diversification.

72
The AAM funds held are for money markets as well as European government, government-related,
and corporate fixed income instruments. AAM choose the underlying assets within each fund, taking
a well-diversified approach and subject to meeting BSR’s investment mandate.
Therefore there are no credit risk concentrations that are a material concern for BSR. These are
regularly monitored through the risk tolerance, as shown in C.1.3 Underwriting risk concentration.
The exposures are generally diversified, with concentration in government securities, and in the cash
positions held in two bank accounts.
C.3.4 Credit risk mitigation
BSR manages credit risk exposure by individual counterparty, sector and asset class, including cash
positions. BSR complies with the Aegon Credit Name Limit Policy (CNLP) under which limits are
placed on the aggregate exposure that it has to any one counterparty. Limits are placed on the
exposure at both Aegon group and BSR level. If an exposure exceeds the stated limit, then the
exposure must be reduced to the limit for the country unit and rating category as soon as possible.
Exceptions to these limits can only be made after explicit approval from the Risk and Capital
Committee (RCC). The policy is reviewed regularly.
The limits also vary by a rating system, which is a composite of the main rating agencies (S&P,
Moody’s and Fitch) and Aegon’s internal rating of the counterparty.
Should the case arise where the internal ratings were higher for a particular credit, and exposure was
also high causing non-compliance with the CNLP, this methodology would serve as a safety check to
ensure investment and management comfort with the exposure level.
CNLP Ratings for securities are based on each individual security and the issuing entity, not on the
ultimate parent. Since equities do not have a rating, the senior unsecured debt rating is used to
classify the credit exposure.
The credit risk inherent in the interest rate swap derivative contracts is mitigated by entering into a
credit support agreement with the counterparty. Main counterparties to these transactions are
investment banks which are typically rated ‘A’ or higher. The credit support agreement dictates the
threshold over which collateral needs to be pledged by BSR or its counterparty.
The Dutch Longevity Reinsurance transaction is collateralised to mitigate counterparty credit risk. A
calculation model has been agreed with the counterparty, to value the payment stream for both
parties to the transaction. As at 31 December 2016, BSR is in receipt of EUR 6m of variation margin,
which is held in cash.
BSR mitigates credit risk in outward reinsurance contracts by only having one active retrocession
contract with a highly-rated counterparty.
Given BSR’s low exposure to credit risk, there are no plans to adopt other credit risk mitigation
techniques during the business planning period.

73
C.3.5 Credit risk sensitivity
BSR’s sensitivity to credit risk is assessed through the required capital calculations under the Solvency
II Standard Formula and Aegon economic framework. Since the amount of capital required to cover a
1-in-200 shock is fairly small, sensitivity testing has not been carried out for smaller credit stresses.
C.3.6 Credit risk data
As a Standard Formula entity, BSR uses the prescribed correlation matrix to assess the dependency of
sub-modules (risk types) to arrive at the aggregate risk capital. Spread risk is a sub-module of the
market risk module under Standard Formula, and consequently aggregated into the market risk
capital.
C.4 Liquidity risk
C.4.1 Liquidity risk description
Liquidity risk needs to be managed in BSR’s business. If BSR requires significant amounts of cash at
short notice in excess of normal cash requirements, it may have difficulty selling certain investments
at attractive prices or in a timely manner. Therefore BSR’s choice of asset portfolio is targeted at
maintaining strong liquidity, and this approach has been consistent throughout 2016.
The asset mix is shown in section C.3.1 Credit risk description. The bank deposits and money market
funds are treated as cash-like for liquidity testing purposes. The bond funds are not included as liquid
assets when testing extreme liquidity scenarios, but in fact normally these funds can be liquidated
within a few days.
C.4.2 Liquidity risk assessment
BSR has its own Liquidity Risk Policy. Under this policy BSR is obliged to maintain sufficient levels of
highly liquid assets to meet cash demands by policyholders and account holders over the next two
years.
The policy requires BSR to regularly test both the Aegon-wide Stressed Liquidity Scenario and a more
onerous locally-defined stress. The Aegon-wide scenario is more focused on disintermediation risk
due to rising interest rates or own credit risk, which are less applicable to BSR. The scenario also
assumes a frozen credit market over an extended period of time.
The locally-defined liquidity stress for BSR involves the above credit market disruption as well as a
combination of the following immediate demands on cash:
1. Maximum natural catastrophe claims on property cover, e.g. maximum natural catastrophe
event loss in The Netherlands or Hungary reinsurance contracts
2. Deaths of 2 high net worth (e.g. €5m sum assured) individuals at maximum retention
covered by the TLB life treaty
3. Three successive years of continuous severe collateral calls.

74
This testing aims to ensure sufficient liquidity for BSR to fulfil its obligations towards reinsurance
counterparties and other stakeholders for an extended period of time of two years without
becoming a forced seller. BSR has so far been able to demonstrate it would have cash remaining even
under these extreme scenarios.
C.4.3 Liquidity risk concentration
The BSR-specific liquidity stress scenario described above requires an unlikely combination of events
to occur to give rise to extremely large cash demands. For liquidity to come under strain following a
single event, it would need to be caused by an extreme property catastrophe such as an earthquake
in Hungary, or the coincidental deaths of several high net worth policyholders in Asia under the TLB
contract.
BSR’s property catastrophe risk is spread across several countries through the Hungary and
Netherlands contracts and investment in ILS. However for mortality risk under the TLB contract there
is some concentration since a mass mortality event such as an epidemic affecting certain cities, e.g.
Hong Kong, could cause the deaths of several policyholders at the same time.
C.4.4 Liquidity risk mitigation
As described in section C.3.1 Credit risk description, BSR holds a mixture of assets including a sizable
proportion in highly liquid bank deposits and money market funds. The asset holdings and projected
cashflows are monitored at the quarterly BSR Investment Committee, so they can be rebalanced to
meet upcoming cash demands.
C.4.5 Liquidity risk sensitivity
BSR’s liquidity stress testing has been described above in C.4.2 Liquidity risk assessment.
It is worthwhile noting that the described liquidity stress tests only include cash and money markets
as the source of liquidity. Apart from that, BSR has the fixed income funds whose underlying
securities include high-quality European government, government-related and corporate securities
where active and liquid market exist.
C.4.6 Liquidity risk data
The management of liquidity risk is via frequent monitoring, assessment and stress testing. This is in
contrast with the other risk types that incur capital requirements as they are a function of a longer-
term 1-year horizon, which is not pragmatic for the management of liquidity risk, in which the length
of exposure time is significantly shorter.
As such, BSR defined the scenarios described in section C.4.2 Liquidity risk assessment for the stress
testing, and did not allow for diversification between these risks despite their independent nature.
The liquidity stress test could be thought to be more punitive for the explained reason, but
nonetheless serves a pragmatic scenario for BSR’s assessment.

75
C.4.7 Expected profit included in future premiums
The technical provisions of BSR consist largely of protection business and a large longevity swap
contract, whose contract boundary is long-term until maturity. The future profits embedded in these
reinsured policies contribute towards BSR’s Own Funds (but also reduced by the risk margin when
recorded on the Solvency II balance sheet). Both in the case of longevity swap and protection
business, the non-payment of future premium will theoretically lead to the cessation of all future
obligations (as well as the release of risk margin).
As such, the EPIFP, calculated as the difference between the regular best estimate portion of
technical provision and the best estimate with non-payment of future premiums, will be largely
similar to the size of best estimate liability. The EPIFP, gross of tax, as of FY 2016 is EUR 75.6m.
C.5 Operational risk
C.5.1 Operational risk description
Like other companies, BSR faces operational risk resulting from operational failures or external
events, such as processing errors, acts from personnel, and natural or man-made disasters. BSR's
systems and processes are designed to support BSR products and transactions and to avoid such
issues as system failures, business disruption, financial crime and breaches of information security.
BSR works on analyses on a continuous basis, studying such operational risks, and regularly develops
contingency plans to deal with them.
C.5.2 Operational risk assessment
BSR’s approach to evaluating operational risks is based on the qualitative rating of those risks with
regard to their potential impact and likelihood after consideration of the effectiveness of controls.
The resulting ratings reflect the uncontrolled (residual) risk the business area is running. BSR senior
management report their forward-looking risk profile on a quarterly basis, together with details of
action plans that address key risks and, where appropriate, the CRO’s opinion on the effectiveness of
those plans.
The Risk function oversees the collation and reporting of operational risk management information
and challenges it prior to submission to the RCC (Risk and Capital Committee). The reporting of
Operational Risk is condensed into RAG (Red Amber Green) status for each identified sub-risk and the
overall operational risk in order to draw out the conclusion of the qualitative analysis behind them.
BSR is a young company which is making the transition from start-up to a more established entity.
The assessment of operational risk reflects the fact that in the company’s early days the focus was on
growth, but in the last 18 months operational excellence has been prioritised. Although a number of
risk categories are currently assessed as amber, strong progress was made in 2016 and action plans
are in place to move them to green.

76
The RAG (Red Amber Green) status has improved over the course of 2016. Business risk is considered
to be amber due to BSR’s dependency on other Aegon units to achieve the new business in its
business plan. Also a project is underway to deliver a new data management system, so that brings
with it the risk of an unsuccessful implementation that fails to meet business requirements. People
risk is expected to move from amber to green in the near future with the recruitment of permanent
staff to fill two key roles in the company.
Processing risk has moved from red to amber as a result of work successfully carried out in 2016 to
improve data, modelling and assumptions for the most material in-force contracts in BSR.
Inaccuracies in (financial) models could have a significant adverse effect on BSR’s business, results of
operations and financial condition. Reliance on various (financial) models to measure risk, price
products and establish key results, is critical to BSR’s operations. Therefore comfort can be taken
from the following 2016 developments:
Detailed reviews of the most material transactions – US Stop-Loss Mortality Reinsurance
(since novated), Dutch Longevity Reinsurance, the Dutch longevity hedge, TLB High Net
Worth Mortality Reinsurance and UK Individual Protection - which resulted in
corrections/improvements and more reliable results,
Migration of modelling of life contracts to a more robust environment,
Hiring of additional resources into the Valuation & Capital team,
Review of and, where recommended, updates to key valuation assumptions – Dutch
mortality, UK mortality, TLB mortality, administration expenses,
Strengthening of the Business Acceptance Process which covers the onboarding of new
reinsurance transactions and renewal of existing contracts.
Development of data dictionaries and enhancement of manual data quality checks for key
contracts, with a view to automating data processing in a data management system.
The detailed actions which have been agreed are monitored in the BSR Open Items Log. The progress
in completing these actions is tracked in the RCC and any failure to meet agreed deadlines is
challenged.
C.5.3 Operational risk concentration
A simplistic approach is taken to the calculation of Operational risk capital (ORC) in BSR. For risk
tolerance purposes under Aegon Economic Framework, it is calculated to be 10% of the total of other
risk capital and is updated annually. The qualitative assessment outlined in the section above helps
justify the level of risk capital held.
Based on a qualitative assessment the main concentrations of operational risk for BSR are in
processing risk, and systems and business disruption risk.
Processing risk includes the risk of misstatement of financial results due to errors in data, models or
processes. It also covers the risk that reinsurance claims are paid in error. To mitigate these risks
BSR’s management endeavours to maintain a well-controlled environment and sound policies and
practices to control these risks and keep operational risk at appropriate levels. Notwithstanding
these control measures, however, operational risk is part of the business environment in which BSR

77
operates, and is inherent in reinsurance business, particularly across diverse geographical regions.
BSR’s risk management activities cannot anticipate every economic and financial outcome, or the
specifics and timing of such outcomes. Furthermore, if the contractual arrangements put in place
with any third-party service providers are terminated, including contractual arrangements with
providers of information technology, administrative or investment management services, BSR may
not be able to find an alternative provider on a timely basis or on equivalent terms. BSR may incur
losses from time to time due to these types of risks.
While systems and processes are designed to support existing transactions and avoid systems failure,
fraud, information security failures, processing errors and breaches of regulation, any failure may
lead to a materially adverse effect on BSR’s results of operations and corporate reputation. In
addition, BSR must commit significant resources to maintain and enhance its existing systems in
order to keep pace with industry standards and customer preferences. If BSR fails to keep up-to-date
information systems, BSR may not be able to rely on information for product pricing, risk
management and underwriting decisions. In addition, even though back-up and recovery systems
and contingency plans are in place, BSR cannot assure investors that interruptions, failures or
breaches in security of these processes and systems will not occur, or if they do occur, that they can
be adequately addressed. The occurrence of any of these events may have a materially adverse
effect on BSR’s businesses, results of operations and financial condition.
Changes towards more sophisticated internet technologies, the introduction of new products and
services, changing customer needs and evolving applicable standards increase the dependency on
internet, secure systems and related technology. Introducing new technologies, computer system
failures, cyber-attacks or security breaches may disrupt BSR’s business, damage BSR’s reputation and
adversely affect BSR’s results of operations, financial condition and cash flows.
BSR retains confidential information on its computer systems, including customer information and
proprietary business information. Any compromise to the security of BSR’s computer systems that
results in the disclosure of personally identifiable customer information may damage BSR’s
reputation, expose BSR to litigation, increase regulatory scrutiny, and require BSR to incur significant
technical, legal and other expenses.
BSR mitigates these data risks by only retaining this information within the Aegon data centres in the
UK. It does not share such information with third parties or outside of the Aegon network. Access to
confidential information is restricted to BSR staff and IT administrators. Information security
measures are in place for both physical and remote access to these data centres. Examples of
measures are access controls (e.g. physical building access security, network directory access
restrictions, and password requirements), firewalls, antivirus protection, and HR screening of staff.
C.5.4 Operational risk mitigation
The previous section sets out the measures taken to mitigate key operational risks: processing risk,
and systems and business disruption risk.

78
In support of the RCSA, significant progress has been made in the last 18 months in documenting
BSR’s processes, for example the validation of data for use in the valuation of key contracts. Going
through the act of documentation provides an opportunity to identify further process gaps.
The Business Acceptance Process was developed as a control for the situation when BSR is taking on
risk through new contracts or contract renewals. It requires the Business Development team to
document the risks around a transaction for endorsement by the RCC and sign-off by the MB. The
documentation includes evidence of review by subject matter experts across BSR, who assess impact
of the transaction in terms of both financial and operational risks.
As described above, operational risks are assessed on a quarterly basis in a dashboard and given a
RAG status. Any risks that are classed as red or amber have actions assigned to restore them to
green. These actions are captured in the Open Items Log, which is managed by the Risk department.
Progress on the actions is tracked in the RCC and failure to meet agreed deadlines is challenged.
The actions in the Open Items Log come from a number of sources. They include any findings raised
by Risk, external or internal audit, or coming from the RCSA.
C.5.5 Operational risk sensitivity
BSR does not sensitivity test operational risk in a quantitative manner, but instead seeks to
understand the risks to which it is exposed and the implications for the company should operational
risk events occur. The preceding sections set out BSR’s main exposures to operational risk, the
potential consequences, and the steps taken to mitigate these risks.
C.5.6 Operational risk data
As a Standard Formula entity, BSR uses the prescribed factor-based approach to determine the
Operational Risk Capital. As the calculated Operational Risk Capital is effectively a function of earned
premium (the binding constraint), the premium measure is thus a summation of premiums due for all
lines of business without regard for their dependency.
C.6 Other material risk BSR is exposed to the other risks described in this section on an ongoing basis. These exposures have
been in place since the establishment of the company and are expected to continue since the
business strategy involves carrying out reinsurance business in various geographical regions and
continuing as part of the wider Aegon group.
Wider risks such as those shown here are identified and assessed as part of the RCSA process.
Political Risk
BSR conducts reinsurance transactions with counterparties in a range of countries. Therefore it is
exposed to the risk of political and regulatory changes in a particular country, including The
Netherlands, which could change the nature of the business that can be carried on. For example, the

79
decision of the UK to leave the EU could in theory have implications for BSR’s ability to conduct
business with UK entities, although there has been no change at this stage.
Since BSR works with several different countries, it does not have a concentrated exposure to any
particular foreign country. However it is worth noting that a transaction is currently in place with
Aegon Turkey. Turkey has gone through a period of political upheaval with a recent coup attempt
followed by a successful referendum campaign to change certain aspects of the system of
government. These changes could in due course affect the regulation of Aegon Turkey, and by
extension BSR. This risk is mitigated by the fact that BSR does not hold assets backing the Aegon
Turkey contract outside The Netherlands, so it should not be possible for any assets to be held in the
country due to changes in Turkish regulations. BSR will continue to monitor the status of the Turkey
contract and the appropriate actions will be taken as required.
The largest single exposure to political risk is to a change of regime in The Netherlands, both because
the NL longevity contract is the most material and because in theory a change in the Dutch rules
could affect all contracts.
This risk exposure is mitigated by the fact that most of BSR’s assets are held in The Netherlands, not
in any foreign territories. Therefore the worst case scenario caused by political change abroad is that
BSR loses out on future premium income – it is not at risk of having assets seized and not released by
a foreign government as a result of a changing political environment.
The exposure to political risk in The Netherlands is perceived to be low, given its membership of the
EU, the Solvency II regime and the country’s democratic system of government.
Group Risk
BSR is part of the wider Aegon group, conducting reinsurance business which is sourced by other
Aegon units. Therefore BSR has a dependency on other parts of the group continuing to see the
benefits of engaging in internal reinsurance transactions. If other parts of the group do not prioritise
this activity, then BSR will fail to write the new contracts which will allow the business to grow and
achieve good diversification of risk types.
Similarly BSR’s business may be impacted if the group strategy changes. For example, in the event
that Aegon chooses to sell one of its business units, it may be a consequence that the business unit
no longer engages in reinsurance with BSR.
This risk is mitigated by the BSR Management Board having direct contact with senior management
in Aegon N.V. The CEO of BSR is heavily involved in the reinsurance strategy of the group as a whole,
so any potential impacts on BSR of changes in strategy are identified at an early stage.

80
D. Valuation for Solvency Purposes In this chapter the IFRS balance sheet is reconciled to the Solvency II balance sheet. First, the
approach used for the reconciliation of the IFRS balance sheet to the Solvency II balance sheet is
discussed. Subsequently a reconciliation overview of the IFRS balance sheet to the Solvency II
balance sheet is provided. This is followed by a reconciliation by balance sheet item between the
IFRS and Solvency II, including an explanation of the differences in measurement and presentation
between IFRS and Solvency II and the resulting reconciliation differences.
Approach towards IFRS to Solvency II balance sheet reconciliation
In this section of the report we discuss the approach towards the reconciliation of the balance sheet
based on the International Financial Reporting Standards and the reporting requirements under the
Solvency II regime.
At a high-level, there are only two major reconciliation steps required for BSR:
Reclassification. This is mainly applicable for accrued interests and deferred taxes where the
reported IFRS values are presented differently under Solvency II.
Revaluation. This is predominantly driven by the revaluation of IFRS technical provision to
Solvency II technical provision. Apart from that, revaluation step is also applied to accrual
accounting items such as DAC and prepaid commission as these will be implicitly valued
through the revaluation of technical provision. The deferred tax line is adjusted alongside
each revaluation adjustment.

81
Balance sheet reconciliation overview
The table below shows the IFRS to Solvency II balance sheet reconciliation for each material asset
and material liability.
(amounts shown in EUR)
In the sections that follows, the reconciliation for each balance sheet item is discussed in more detail.
IFRS to SII Reconciliation Q4 2016 IFRS Value Reclassifications Revaluation Solvency II value
Assets
Deferred acquisition costs 13,030,029 (13,030,029) -
Deferred tax assets 3,740,566.00 (3,740,566) -
Investments (other than assets held for index-linked and unit-linked contracts) 63,172,398 1,405 - 63,173,803
Collective Investments Undertakings 61,879,063 61,879,063
Derivatives 1,293,335 1,405 1,294,740
Loans and mortgages 3,641,461 3,636 3,645,097
Other loans and mortgages 3,641,461 3,636 3,645,097
Reinsurance recoverables from: 444,799 - - 444,799
Non-life and health similar to non-life 444,799 - - 444,799
Non-life excluding health 444,799 444,799
Insurance and intermediaries receivables 6,330,007 (6,330,007) -
Reinsurance receivables 4,058,768 4,058,768
Receivables (trade, not insurance) 11,159,779 2,266,199 (1,954,738) 11,471,239
Cash and cash equivalents 4,444,922 4,444,922
Total assets 105,963,961 (3,740,566) (14,984,767) 87,238,628
Liabilities
Technical provisions – non-life 5,189,301 (1,381,020) 3,808,281
Technical provisions – non-life (excluding health) 5,189,301 (1,381,020) 3,808,281
Best Estimate 5,189,301 (1,812,259) 3,377,041
Risk margin 431,239 431,239
Technical provisions - health (similar to non-life)
Technical provisions calculated as a whole
Best Estimate
Risk margin
Technical provisions - life (excluding index-linked and unit-linked) 27,357,405 (39,197,491) (11,840,085)
Technical provisions - health (similar to life) (333,630) (12,966,641) (13,300,271)
Technical provisions calculated as a whole
Best Estimate (333,630) (19,017,988) (19,351,618)
Risk margin 6,051,347 6,051,347
Technical provisions – life (excluding health and index-linked and unit-linked) 27,691,035 (26,230,850) 1,460,186
Best Estimate 27,691,035 (87,297,389) (59,606,353)
Risk margin 61,066,539 61,066,539
Deferred tax liabilities (3,740,566) 6,398,436 2,657,870
Derivatives 573,754 34,872 608,625
Debts owed to credit institutions 3,159 3,159
Financial liablitilies other than debts owed to credit institutions 6,001,089 6,001,089
Insurance & intermediaries payables 916,589 (675,257) 241,332
Reinsurance payables -
Payables (trade, not insurance) 1,945,569 675,257 2,620,827
Any other liabilities, not elsewhere shown 39,742 (34,872) 2,072,139 2,077,010
Total liabilities 42,026,607 (3,740,566) (32,107,935) 6,178,106
Excess of assets over liabilities 63,937,354 0 17,123,168 81,060,522

D.1 Assets The Fair Value approach is prescribed for the majority of assets groups. All assets without specific
valuation rules are valued in accordance with IFRS, provided that this is consistent with an economic
valuation. When applying an economic valuation of assets, insurers should refer to a three level
valuation hierarchy. The use of quoted prices is the default method of valuation. Where this is not
possible, insurers should use quoted prices of similar assets. Where no quoted prices can be used,
the insurer can develop an alternative valuation method that makes maximum use of market inputs.
D.1.1 Goodwill
This is not applicable for BSR, as BSR does not hold any goodwill assets under IFRS and that S-II does
not recognize this asset category.
D.1.2 Deferred acquisition costs
IFRS Treatment:
Deferred acquisition costs (DAC) are related to the acquisition of insurance contracts under only one
reinsurance treaty of BSR. The DAC represents directly attributable acquisition costs with regard to
the upfront payment of ceding commissions to Aegon Insights Limited for the marketing and sales
activities of BSR’s reinsurance treaty with Mitsui Sumitomo Insurance Co. Ltd., Japan (MSI). The DAC
is allocated to future reporting periods and are amortized over time.
Solvency II Treatment:
Solvency II regulation does not recognize deferred acquisition costs. Under Solvency II, these are
captured under insurance liabilities, which for Solvency II embodies all the acquisition costs and
servicing costs within the contract boundaries defined. For the valuation of the insurance liabilities,
the principles of accrual based accounting and the matching principle are not applied.
Reconciliation difference: Revaluation Adjustments
Deferred acquisition costs are not recognized under Solvency II and for this reason they are
eliminated (i.e. revalued to nil with corresponding adjustment of reducing equity/own funds) as one
of the reconciliation steps.
Therefore, the entire DAC under IFRS of EUR 13.0 million is eliminated. This amount fully pertains to
the MSI reinsurance treaty that covers health-related policies in Japan.
D.1.3 Intangible assets
This is not applicable for BSR, as BSR does not hold any intangible assets under IFRS and that S-II does
not recognize this asset category.
Blue Square Re N.V.
IFRS to SII Reconciliation December 31, 2016 IFRS Value Reclassification Revaluation Solvency II value
AssetsDeferred acquisition costs 13,030,029 (13,030,029) -

83
D.1.4 Deferred tax assets
An IFRS deferred tax assets of EUR 3.7m is reported.
IFRS Treatment:
Deferred tax assets (DTA) are recognized for the estimated future tax effects of temporary
differences between the carrying value of an item and its tax value with the exception of differences
arising from the initial recognition of goodwill, and of assets and liabilities that do not impact taxable
or accounting profits. International Accounting Standard (IAS) 12 prescribes the accounting
treatment for Income Taxes, including IAS 12.5 and IAS 12.46 for (deferred) tax. A tax asset is
recognized for tax loss carry forwards to the extent that it is probable at the reporting date that
future taxable profits will be available against which the unused tax losses and unused tax credits can
be utilized (IAS 12.5). Current tax liabilities or assets for the current and prior periods shall be
measured at the amount expected to be paid to or recovered from the taxation authorities, using the
tax rates that have been enacted or substantively enacted by the end of the reporting period (IAS
12.46).
Solvency II Treatment:
The Solvency II methodology for the calculation of deferred tax follows the provisions of IAS 12
Income Taxes. Deferred tax assets and liabilities are recognized for Solvency II purposes on the basis
of the temporary differences between the carrying amounts of the assets and liabilities in the
Solvency balance sheet and the tax balance sheet values according to local tax regulations of the
insurance company. A deferred tax accrual is calculated at corporate tax rate. Tax losses carried
forward are recognized as deferred tax assets if their future benefit is plausible.
In line with the IFRS approach, Solvency II does not require discounting of deferred tax assets and
liabilities
IFRS to Solvency II reconciliation adjustments:
Considering the requirements outlined above, IFRS to Solvency II balance sheet reconciliation
adjustments of deferred tax items should comprise of Deferred Tax Assets (DTA) and Deferred Tax
Liabilities (DTL) reflecting the tax impact of all the individual revaluations processed for all relevant
components of the Balance Sheet. In case the sum of all the adjustments made for the revaluation of
the IFRS Balance Sheet to the Solvency II Balance Sheet results in the DTA or DTL changing their sign
to negative - effectively becoming DTL and DTA respectively – an additional reclassification
adjustment is required to move the DTA or DTL to the opposite side of the Balance Sheet.
Reconciliation difference: Reclassification Adjustments
To reconcile the IFRS deferred tax position with the Solvency II deferred tax position on the balance
sheet, a EUR 3.7 reclassification is performed on the revalued net negative DTA balances from assets
to liabilities under Solvency II.
IFRS to SII Reconciliation Q4 2016 IFRS Value Reclassifications Revaluation Solvency II value
Assets
Deferred tax assets 3,740,566.00 (3,740,566) -
Liabilities
Deferred tax liabilities (3,740,566) 6,398,436 2,657,870

84
Reconciliation difference: Revaluation Adjustments
The difference between the balance sheet valuation of the deferred tax assets according to IFRS or
Solvency II is purely driven by the differences in the valuation of the relevant balance sheet elements
between the IFRS balance sheet and Solvency II balance sheet. A significant portion of these
differences are due to the valuation of technical provisions under IFRS and Solvency II. Where tax
bases do not change, revaluation adjustments related to DTA balances must then be equal to the
revaluation adjustments for other balance sheet elements multiplied by applicable tax rates.
The revaluation adjustments of DTA amounts to a total of EUR -6.4m, consisting of the following:
EUR -9.2m to DTA for the total differences in the valuation of technical provisions
EUR -0.4m to DTA for the derecognition of the unearned premium reserves and prepaid
commissions related to the Spain Household reinsurance
EUR +3.3m to DTA for the derecognition of DAC
D.1.5 Pension benefit surplus
This is not applicable for BSR.
D.1.6 Property, plant & equipment held for own use
This is not applicable for BSR.
D.1.7 Investments (other than assets held for index- and unit-linked funds)
The EUR 63.2m of investments is made up of the following:
Collective investments undertakings:
o EUR 40.5m of investment in funds managed by Aegon Asset Management (AAM).
The funds encompass government and corporate fixed income securities and money
market instruments.
o EUR 21.3m of investment in ILS. The fund invests in short duration catastrophe
insurance-linked fixed income securities.
Derivatives
o EUR 1.2m for the value of the Synthetic Longevity Hedge that hedges against the
longevity exposure of the Dutch Longevity Reinsurance contract.
o EUR 0.1m for the value of an interest rate derivative entered into for the purpose of
hedging the interest rate risk exposure of the Synthetic Longevity Hedge. A negligible
amount for the accrued interest is reclassified from the Trade Receivables account
into the Derivatives account for Solvency II revaluation.
Blue Square Re N.V.
IFRS to SII Reconciliation December 31, 2016 IFRS Value Reclassification Revaluation Solvency II value
AssetsInvestments (other than assets held for index-linked and unit-linked contracts) 63,172,398 1,405 - 63,173,803
Collective Investments Undertakings 61,879,063 - 61,879,063
Derivatives 1,293,335 1,405 - 1,294,740

85
IFRS Treatment:
IAS 39 Financial Instruments: Recognition and Measurement defines the following categories of
financial instruments excluding derivatives:
1. Fair Value through Profit or Loss (FVTPL);
2. Held-to-maturity (HTM);
3. Available for sale assets (AFS).
HTM category is measured at amortized cost, while FVTPL and AFS are measured at Fair Value on the
IFRS balance sheet. BSR classifies all the general account investments as Fair Value through Profit or
Loss.
The investments in funds are reported at the closing net asset value (NAV) of the fund, which is the
market tradable value (or redemption value, excluding redemption penalty) of such fund at the
closing date of the reporting period. The interest rate swap is also measured at fair value using
market curves as the plain vanilla swap has a deep and liquid market.
On the other hand, the Synthetic Longevity Hedge is based on a marked-to-model valuation as a deep
and liquid market does not exist for such instrument. The hedge consists of two legs – a floating leg
for the potential payoff to BSR if the hedge attaches and a fixed leg for the premium payment to risk
takers. The fixed leg is a series of fixed contractual cash flows, so this leg is valued as the present
value of these cash flows using market swap rates.
Inputs to the floating leg payoff valuation are market swap rates and Dutch mortality rate projection
taking into account expected mortality improvements (including the uncertainty around the
expectation). The uncertainty around the mortality expectation provides a view on the distribution of
future mortality paths, and consequently, the distribution of payoffs from this instrument. The
valuation of the payoff distribution employs the methodology similar to the valuation of technical
provision, whereby a best estimate (probability-weighted present value) and risk margin are
determined. It is important also to note as it is structured as an out-of-the-money hedge, it is not
unusual to expect the payoff value of this instrument to eventually taper off to nil, leaving only the
fixed leg payment from BSR to risk takers that carry a non-zero value because the contractual
obligation to pay remains throughout the term of the hedge contract.
Given the marked-to-model valuation and the sensitivity to mortality assumptions, the Annual Report
discloses the mortality sensitivities and are presented below. In the 2016 figure, the base asset value
is presented as a netted value of both derivative legs. For comparative purpose and to reconcile to
the annual report of 2016, 2015 is also presented netted. Given that the Company novated the US
stop-loss mortality contract as per Q4 2016, the US mortality leg of the derivative contributed to a
one-sided risk exposure (instead of a hedge position). As a result, the Company became exposed to
US longevity risk (since the hedge asset value would decrease if US mortality rates decrease). To
mitigate this exposure, the Company decided to lock down the US projection of mortality paths (both
male and female) to remove future source of volatility and thus the risk. As at year end 2016 the
Company managed to partially restructure the derivative, and as of February 2017, the restructure is
complete with all counterparties. As a result the sensitivity became a one-sided exposure with larger
impact because of the restructure to the derivative that removes the US mortality exposure leaving

86
only a one-sided Dutch longevity exposure, and that the removal of the US mortality exposure means
it no longer serves an offsetting impact.
(amounts shown in EUR ‘000s)
Solvency II Treatment:
Irrespective of whether investments in financial instruments are FVTPL, HTM or AFS, Solvency II
requires Fair Value to be applied for value measurement.
Under Solvency II, assets held for index- and unit-linked funds are presented as a separate category
(see section D.1.8 Assets held for index- and unit-linked funds), while under IFRS these assets are
reported together with the assets not held for index-and unit-linked contracts as investments.
IFRS to Solvency II reconciliation adjustments:
To bridge between IFRS and Solvency II, the investment in financial assets valued at amortized cost
under IFRS, need to be measured at Fair Value for Solvency II. All the financial instruments measured
at Fair Value for IFRS are not revalued in course of the reconciliation process to Solvency II, as the
IFRS Fair Value concept and definition are followed by Solvency II. However, presentational
differences may exist between IFRS and Solvency II, and reclassifications are required to comply with
Solvency II requirements (e.g. presentation of policyholder accounts or derivatives).
For the avoidance of doubt, the valuation methodology under IFRS for the Synthetic Longevity Hedge
is fully compliant with the Solvency II valuation principle, and thus no further adjustment is
necessary.
Reconciliation difference: Reclassification Adjustments
The reclassification adjustment of EUR 1.4 thousand is for the accrued interest related to the plain
vanilla interest rate swap, which by market convention is valued using market rates. The IFRS values
the derivative at the clean price excluding the accrued interest, whereas the revaluation includes the
accrued interest for the market value.
At January 1, 2016 Total gains/losses Purchases Sales Total Total unrealized gains and
in income statement losses for the period
recorded in the P&L for
instruments held at
December 31, 2016
Assets Carried at fair value
Fair value through profit and loss
Derivatives (1,707) (8,638) - - 1,181 328
Total assets at fair value - (8,638) - - 1,181 328
At January 1, 2015 Total gains/losses Purchases Sales Total Total unrealized gains and
in income statement losses for the period
recorded in the P&L for
instruments held at
December 31, 2015
Assets Carried at fair value
Fair value through profit and loss
Derivatives 6,872 (11,187) - - (1,707) (11,138)
Total assets at fair value - (11,187) - - (1,707) (11,138)
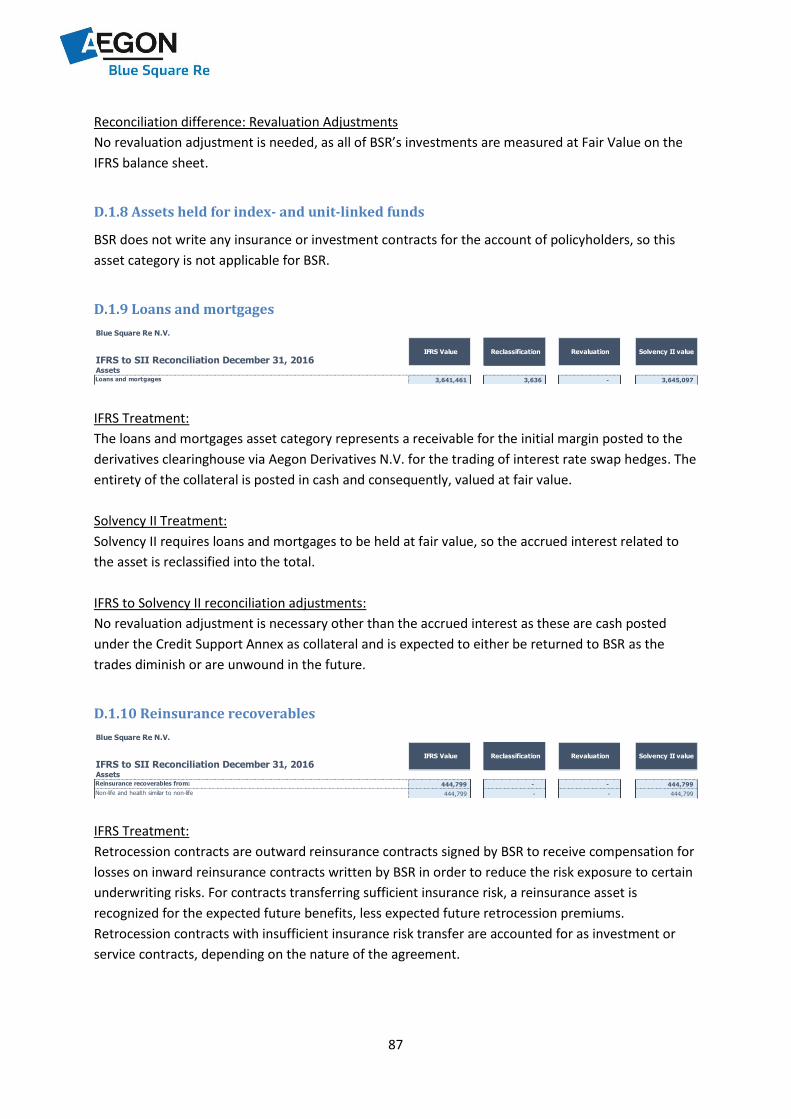
87
Reconciliation difference: Revaluation Adjustments
No revaluation adjustment is needed, as all of BSR’s investments are measured at Fair Value on the
IFRS balance sheet.
D.1.8 Assets held for index- and unit-linked funds
BSR does not write any insurance or investment contracts for the account of policyholders, so this
asset category is not applicable for BSR.
D.1.9 Loans and mortgages
IFRS Treatment:
The loans and mortgages asset category represents a receivable for the initial margin posted to the
derivatives clearinghouse via Aegon Derivatives N.V. for the trading of interest rate swap hedges. The
entirety of the collateral is posted in cash and consequently, valued at fair value.
Solvency II Treatment:
Solvency II requires loans and mortgages to be held at fair value, so the accrued interest related to
the asset is reclassified into the total.
IFRS to Solvency II reconciliation adjustments:
No revaluation adjustment is necessary other than the accrued interest as these are cash posted
under the Credit Support Annex as collateral and is expected to either be returned to BSR as the
trades diminish or are unwound in the future.
D.1.10 Reinsurance recoverables
IFRS Treatment:
Retrocession contracts are outward reinsurance contracts signed by BSR to receive compensation for
losses on inward reinsurance contracts written by BSR in order to reduce the risk exposure to certain
underwriting risks. For contracts transferring sufficient insurance risk, a reinsurance asset is
recognized for the expected future benefits, less expected future retrocession premiums.
Retrocession contracts with insufficient insurance risk transfer are accounted for as investment or
service contracts, depending on the nature of the agreement.
Blue Square Re N.V.
IFRS to SII Reconciliation December 31, 2016 IFRS Value Reclassification Revaluation Solvency II value
AssetsLoans and mortgages 3,641,461 3,636 - 3,645,097
Blue Square Re N.V.
IFRS to SII Reconciliation December 31, 2016 IFRS Value Reclassification Revaluation Solvency II value
AssetsReinsurance recoverables from: 444,799 - - 444,799
Non-life and health similar to non-life 444,799 - - 444,799

88
Reinsurance premiums, commissions and claim settlements are accounted for in the same way as the
original contracts for which the reinsurance was concluded. The insurance premiums for the original
contracts are presented gross of reinsurance premiums paid.
A reinsurance recoverable of EUR 0.4m is reported on the balance sheet. This recoverable relates to
the claims recovery under an inactive retrocession program for the Hungary motor third-party
liability (MTPL) reinsurance. This value of EUR 0.4m mirrors exactly the offsetting value of EUR 0.4m
on the corresponding technical provision, as this specific set of reinsurance treaties fully protects BSR
against any default or non-payment of retroceded obligation to BSR, as well as any future adverse
development of claims against BSR. This is achieved through contractual clauses in this specific set of
reinsurance treaties.
Currently, BSR only has one active retrocession contract, which is an outward reinsurance contract
for an excess of loss mortality risk transfer covering the incoming reinsured life portfolio from Aegon
Turkey. As the overall portfolio from Turkey is considered small on the BSR balance sheet, the
valuation of the retrocession contract is currently not segregated from the valuation of the
reinsurance contract, and consequently, both contracts are reported on a net basis on the technical
provision line of the balance sheet.
Solvency II Treatment:
For Solvency II value measurement, a Fair Value approach is used for the reinsurance receivables. It is
similar to the valuation of insurance liabilities, however without a risk margin (and after adjusting for
counterparty default risk.
IFRS to Solvency II reconciliation adjustments:
No reclassification nor revaluation adjustments are performed for the reason that the retrocession
contracts on the Hungary MTPL portfolio is deemed fully effective as a total offset against the
technical provision. The bases, methods and assumptions covering the technical provision is
described in section D.2.1 Technical provisions – non-life, but it is suffice to mention that the inactive
reinsurance and retrocession contracts on the Hungary MTPL portfolio are immaterial to BSR.
D.1.11 Deposits to cedants
This is not applicable to BSR.
D.1.12 Insurance and intermediaries receivables
The insurance and intermediaries receivables are receivables as at the close of the accounting period
on December 31st, 2016 from either internal or external counterparties. For SII these receivables are
all allocated to the line ‘receivables trade, not insurance’ or on the line ‘reinsurance receivables’. As
of Q1 2017, a thorough review of the allocation of accounts has taken place which results in
Blue Square Re N.V.
IFRS to SII Reconciliation December 31, 2016 IFRS Value Reclassification Revaluation Solvency II value
AssetsInsurance and intermediaries receivables 6,330,007 (6,330,007) - -
89
reclassifications. Nevertheless these adjusted allocations have no impact on the value of the total
own funds. The total receivable has been allocated to:
Internal (Aegon) cedants EUR 3.1m – allocated to receivables trade, not insurance;
Internal (Aegon) cedant with regard to Transamerica Premier Life Insurance Company EUR
1.2m – allocated to reinsurance receivables;
External cedants & Aegon Insights EUR 2.9m – allocated to reinsurance receivables;
Internal receivable which is related to expenses/cost charge -/-EUR 0.9m – allocated to
receivables payables, not insurance as the total balance to Aegon N.V is a liability.
The operational aspect of reinsurance reporting typically lags the risk period by 1-3 months (or some
even 6 months) as stipulated in the respective treaties, causing a natural delay in the settlement of
cash flows.
The receivable of EUR 6.3m mainly consists with regard to the following receivables on
counterparties:
The largest receivable is due from Aegon Insights (EUR 2.0m) for the refund of ceding
commission paid by BSR for past policy acquisitions prior to the year 2014, as the commission
paid is recently trued up for actual persistency. Similar recalculation is to be performed for
the year 2015 and 2016, but these are not yet recognized on the balance sheet;
The receivable from Transamerica Premier Life Insurance Company (TPLIC, previously MLIC)
represents the second biggest component of EUR 1.2m for the last quarter of premium due
prior to the novation of this treaty. All other contracts contribute to the remaining
reinsurance receivables, but each with a net value of less than EUR 1m;
The receivables from external cedants & Aegon Insights of EUR 2.9m;
The receivable from Aegon N.V. (EUR -0.9m) represents the internal liability related to the
payment of expenses/cost charge by BSR.
IFRS Treatment:
Insurance and intermediaries receivables are valued at amortized cost, at the estimates provided by
the cedants.
Generally, BSR reaches out to cedants after the quarterly close of accounting period to obtain the
latest estimate of receivables (or payables) due for the performance of the business over the last
reporting period. The information is therefore more up-to-date, but nonetheless an early estimate of
the upcoming reinsurance statement of account. No further adjustments are made to these
estimates obtained from the cedants, as past experience indicates stability in the early estimates. For
contracts with pre-set or known cash flows, the receivables will be based on the respective
contractual agreement. As BSR writes business in multiple currencies, the receivables in local
currencies are translated to EUR using the closing currency exchange rates.
Solvency II Treatment:
Solvency II requires that receivables are held at Fair Value.

90
IFRS to Solvency II reconciliation adjustments:
Given the short term nature of these receivables, there should exist no material measurement
differences between amortized cost for IFRS and Fair Value for Solvency II.
Reconciliation difference: Revaluation Adjustments
The insurance and intermediaries receivables on BSR’s balance sheet are predominantly short term
balance sheet items. Therefore, the difference between the amortized cost under IFRS and Fair Value
under Solvency II is not material. As such, no revaluation is performed between IFRS and Solvency II.
D.1.13 Reinsurance receivables
IFRS Treatment:
Reinsurance receivables are valued at amortized cost, at the estimates provided by the
retrocessionnaires.
Solvency II Treatment:
Solvency II requires that receivables are held at Fair Value.
IFRS to Solvency II reconciliation adjustments:
Given the short term nature of these receivables, there should exist no material measurement
differences between amortized cost for IFRS and Fair Value for Solvency II.
Reconciliation difference: Reclassification Adjustments
As been written before, the total amount included on the line reinsurance receivables consists of the
following receivables:
Internal (Aegon) cedant with regard to Transamerica Premier Life Insurance Company EUR
1.2m – allocated from insurance and intermediaries receivables;
External cedants & Aegon Insights EUR 2.9m – allocated from insurance and intermediaries
receivables;
D.1.14 Receivables (trade, not insurance)
Blue Square Re N.V.
IFRS to SII Reconciliation December 31, 2016 IFRS Value Reclassification Revaluation Solvency II value
AssetsReinsurance receivables - 4,058,768 - 4,058,768
IFRS to SII Reconciliation Q4 2016 IFRS Value Reclassifications Revaluation Solvency II value
Assets
Receivables (trade, not insurance) 11,159,779 2,266,199 (1,954,738) 11,471,239

91
The Receivables (trade, not insurance) asset category consists of three items on the IFRS balance
sheet:
1. Prepaid commission of EUR 2.0m for the nonlife reinsurance treaty with the Aegon Spain
joint venture.
2. A receivable for the collateral posted by BSR for variation margin on the Longevity Hedge
instrument of EUR 9.2m.
3. Accrued interest on the interest rate swap and the initial margin for the interest rate swap,
both of which are of negligible value;
IFRS Treatment:
Trade and other receivables are initially recognized at amortized cost.
Solvency II Treatment:
Solvency II requires that receivables are held at Fair Value. The only value that remains to be
reported on the Solvency II balance sheet is the EUR 9.2m associated to the collateral posted for the
variation margin of the Synthetic Longevity Hedge.
Reconciliation difference: Reclassification Adjustments
1. Internal (Aegon) cedants EUR 2.3m – allocated from insurance and intermediaries
receivables;
2. A small reclassification adjustment of EUR -5k is made for the interest rate swap, as discussed
in section D.1.7 Investments (other than assets held for index- and unit-linked funds) and for
the collateral on the initial margin for interest rate swap as discussed in section D.1.9 Loans
and mortgages.
Reconciliation difference: Revaluation Adjustments
The revaluation of EUR -2.0m is a result of derecognizing the prepaid commission portion of the
unearned premium reserves, as a portion of the unearned premium liability had incorporated the
upfront reinsurance commission paid by BSR to the Spanish joint venture. Under Solvency II, the
impact of unearned premium reserves and prepaid commissions are effectively included in the
valuation of technical provision.
D.1.15 Own shares
This is not applicable to BSR.
D.1.16 Cash and cash equivalents
IFRS Treatment:
Cash comprises of cash at banks, totaling EUR 4.4m as at year end 2016. Cash equivalents are short-
term, highly liquid investments with original maturities of three months or less that are readily
convertible to known cash amounts, are subject to insignificant risks of changes in value and are held
Blue Square Re N.V.
IFRS to SII Reconciliation December 31, 2016 IFRS Value Reclassification Revaluation Solvency II value
AssetsCash and cash equivalents 4,444,922 - 4,444,922

92
for the purpose of meeting short-term cash requirements. Money market investments that are held
for investment purposes (backing insurance liabilities, investment liabilities or equity based on asset
liability management considerations) are not included in cash and cash equivalents, but are
presented as investment or investment for account of policyholders.
Solvency II Treatment:
The Fair Value approach is prescribed, with no revaluation being necessary.
D.1.17 Any other assets
There are no other assets reported in this category, nor does Blue Square Re have any material
leasing arrangements. The entirety of BSR asset balances has been explained throughout section D.1
Assets.
D.2 Technical provisions This section provides the value of technical provisions including the amount of the best estimate and
the risk margin, as well as a description of the bases, methods and main assumptions used. The value
of the technical provisions are specified in the tables of sections: D.2.1 Technical provisions – non-
life; D.2.2 Technical provisions – life (excluding index-linked and unit-linked) and health; and D.2.3
Technical provisions – index-linked and unit-linked.
The technical provisions classified by line of business as at December 31st, 2016 and January 1st, 2016
are shown as follows. The life line of business forms the most material segment for BSR, in which the
size of both the best estimate and risk margin is the largest, albeit offsetting for the most part.
Technical Provisions by lines of business
Amounts in EUR mill ions
Line of businessTechnical
Provision
Best
Estimate
Risk
Margin
Life 1.5 -59.6 61.1
Health -13.3 -19.4 6.1
Non-life 3.8 3.4 0.4
Total -8.0 -75.6 67.5
Technical Provisions by lines of business
Amounts in EUR mill ions
Line of businessTechnical
Provision
Best
Estimate
Risk
Margin
Life -31.4 -90.0 58.6
Health -10.7 -13.9 3.2
Non-life 3.9 3.7 0.3
Total -38.2 -100.3 62.1
December 31, 2016
January 1, 2016

93
Bases (different reporting regimes)
Being a Solvency II regulated entity located within the EEA, BSR’s Solvency II technical provisions are
calculated taking into account the requirements of the Solvency II directive, implementing measures
and guidance, and the Aegon Market Consistent Reporting Manual (AMCRM).
Key models and methodologies
The technical provisions are calculated using projection models and where the liabilities with no
embedded options and guarantees are calculated deterministically. This is generally true under all
cases in BSR, as BSR does not write any embedded options and guarantees in the reinsurance
treaties. The Dutch Longevity Reinsurance transaction is modelled stochastically in terms of mortality
projection as a legacy of the past modelling, even though there is no mortality optionality in this
structure per se. Nonetheless, BSR entered into an out-of-the-money longevity hedge (Synthetic
Longevity Hedge) hedging this contract which requires stochastic mortality model for the valuation of
this hedge.
The technical provisions consist of the Best Estimate Liability and the Risk Margin. Non-hedgeable
Solvency Capital Requirements (SCRs) form the basis of the calculation of the Risk Margin. The Risk
Margin calculation is based on a cost-of-capital method applied to a projection of non-hedgeable
SCRs based on a 99.5% confidence level and aggregation is performed by applying diversification
benefits factors to each risk type that is applicable under the Standard Formula. The risk margin
aggregation method follows the reference undertaking concept under Solvency II.
Ongoing validation and review processes are in place to ensure that models being used remain
appropriate and can be relied upon, including model validations, process reviews carried out by the
Internal Audit function and review of results performed by external auditors.
The Actuarial Function Holder (AFH) provides at least once a year an independent opinion on the
adequacy and reliability of the technical provisions, including a summary of concerns and
recommendations, if any. This is documented by the AFH in an annual Actuarial Function Report.
Assumptions – Best estimate non-economic assumptions Non-economic assumptions are proposed by the 1st line actuarial function and then reviewed by the
2nd line risk and actuarial function while approved by the management board. This governance also
includes seeking the independent opinion and recommendation of the Actuarial Function Holder
(AFH), as the BSR AFH also serves as a risk officer to BSR.
The review of key non-economic assumptions (defined as material risks of material contracts) is
conducted at least once a year, and the review of other assumptions will be conducted at least once
every 3 years. Once a year in Q1, a plan will be made to select the assumptions that will be reviewed
during the calendar year. A review entails performing an experience study, where data is available, or
otherwise assessing the appropriateness of current assumption sets, e.g. by benchmarking. The
conclusion, whether or not an assumption update is recommended, will be presented by the 1st line
actuarial function to the AFH, RCC and MB. In the event of an assumption update proposal, the
impact will be quantified in the accompanying recommendation report. Ultimately, the MB has to

94
approve the use of assumptions, taking the opinions of Actuarial and Risk functions into
consideration.
In early 2016, the assumptions were classified into Tier 1 and Tier 2 as part of the assumption
planning process. In 2017, after the novation of the US stop-loss mortality contract in Q4 2016
(previously identified as “Tier 1” and consequently unclassified), the mortality assumptions for the
Dutch Longevity Reinsurance (and by virtue, the associated Longevity Hedge) and expense
assumption are classified internally as “Tier 1”, meaning they are material contracts/assumptions for
the size of BSR and should be reviewed at least once a year. The other assumptions are “Tier 2”,
meaning they are less material and should be reviewed at least once every three years. The
assessment of materiality has been based on a combination of sensitivities and expert judgement.
Throughout the year 2016, the 1st line actuarial function has reviewed and provided recommendation
for the updates of the Tier 1 and some Tier 2 mortality assumptions (in the case of TLB, the
recommendation is to continue using the existing mortality assumption). All the assumption update
recommendations were discussed in the RCC, and subsequently endorsed by the RCC and approved
by the MB. It is important to note that no mortality assumption update was made to the US stop-loss
mortality contract, as the contract was novated in Q4 2016.
Assumptions reviewed and updated in 2016 include:
Dutch Longevity Reinsurance mortality trend projection based on recalibration of internal
stochastic mortality model using new general population mortality of CBS 2015.
Dutch Longevity Reinsurance mortality experience factors based on 3 years of observation in
the reinsured portfolio and 3 years of Aegon NL overall insured portfolio experience.
Synthetic Longevity Hedge trend projection of the US and NL based on latest general
population data published by the US and the Dutch statistical agencies.
UK Individual Protection mortality and morbidity assumptions are updated based on Aegon
UK overall experience studies.
Maintenance expense assumption was updated based on a study on actual incurred
expenses against projected growth of BSR according to the Medium Term Plan.
Assumption reviews completed this year with a recommendation to continue using the existing
assumption include:
TLB mortality assumption, where limited data in the high net worth individual space leads to
very limited and non-credible data for a detailed experience analysis. The mortality review is
based on benchmarking BSR’s assumption against peers.
With the updates above, the assumptions used for the key contracts are viewed to be appropriate for
the valuation of technical provisions for FY 2016. Only in its sixth year of operations, BSR continues to
enhance data reporting process, build credible experience in its portfolio and monitor closely any
emerging trend focusing on the key contracts for signs of long-term deviations from current
assumptions.

95
Assumptions – Economic assumptions The key economic assumptions are the EIOPA swap curve for discounting. BSR currently does not
make further adjustments to the EIOPA base swap curve for the credit risk, volatility adjustments nor
matching adjustments. Where applicable, risk-neutral economic scenarios are generated that are
applied for the valuation of the options and guarantees included in the liabilities, but this is currently
not necessary as BSR does not write any embedded options and guarantees.
The governance process for economic assumption setting is centralized to Aegon Group on behalf of
all Aegon entities. BSR currently uses the yield curves generated by the Group for the calculation of
technical provisions. Locally, the yield curve is then checked against the EIOPA published yield curves
to ensure consistency at the annual time points. BSR relies on the Group for appropriate
interpolation between annual time points.
Level of uncertainty associated with the value of the technical provisions The risk margins relate to normal uncertainty around the best estimate assumptions and are included
in the technical provisions as addition to the best estimate liabilities. The IFRS sensitivities are
presented in the Annual Report, and the Solvency II sensitivities are presented in this document,
throughout the sensitivities sub-section of section C. Risk Profile.
Additional special uncertainties, as reported in the Actuarial Function Report 2016 are the following:
The mortality experience of the Dutch Longevity Reinsurance has been lighter than the initial
assumptions set at inception. While the current assumptions reflect a best estimate weighing
the short-term portfolio-specific experience with little credibility against the longer-term
Aegon NL overall experience, the technical provision remains sensitive to the future
development of mortality experience.
The persistency modeling of the TLB universal life policies to be reviewed and potentially
refined. This is in light of the growing volume of the TLB reinsured policies, and made more
conspicuous at year end 2016 after the shrinking of BSR balance sheet as a result of the
novation of a large US stop-loss mortality contract.
For similar reason as above, the reinsured policies related to the Aegon Insights business,
most notably the Mitsui Sumitomo policies, also became more material, requiring further
strengthening of the service level agreement with Aegon Insights in HK who performs the
calculation of technical provision on behalf of BSR.
The projection of risk margin follows a default approach according to the shape of the best
estimate payout runoff pattern. A more detailed analysis on the capital projection still needs
to be carried out to ensure the appropriateness of the general assumption across all
reinsurance treaties and product specifications. This is also reiterated in the ensuing
simplification sub-section.
With regards to the mortality experience of the Dutch Longevity Reinsurance, additional information
is provided in section D.2.9 Material changes in assumptions made in calculations of technical
provisions.

96
Significant simplified methods used to calculate the technical provisions All methods used in the calculation of the technical provisions are to be proportionate to the nature,
scale and complexity of the risks underlying the related companies’ insurance obligations.
The calculation of technical provision for the non-life contracts are based on limited data. As such,
the calculation is performed based on initial business assessment on the potential volume of business
and the historical loss ratio. Ultimately, the materiality of the non-life contracts on the balance sheet
is deemed to be small, as these contracts are structured as a 1-year reinsurance contracts. Similarly,
the claims provision of the Spain Household contract is currently not included in the technical
provision. This can be seen as a future opportunity for further improvements. The estimated claims
provision from cedant’s estimate is roughly half a million euros.
Other potential simplification of methods include the capital projection methodology for the
determination of risk margin. Currently, the capital projection is based on a default method of
projecting capital along the shape of the present value of future obligations under each reinsurance
treaty. Exceptions include the large material contracts such as the Dutch Longevity Reinsurance and
the Synthetic Longevity Hedge, in which a more detailed analysis of capital projection has been
performed and a more precise methodology is implemented for each of them. Going forward, BSR
will continue to assess the appropriateness of existing capital projection methodology for the other
contracts.
Data Quality
The significant data leading to the calculation of technical provision is the policyholder data
(anonymized) as well as treaty and reinsured product information that defines the nature of risk
transfer. The area of data management is identified for future improvement, and this has been
gradually addressed over the past year and going into the near future.
In terms of managing policyholder data, BSR defines the classification into life, health, and non-life. In
the case of life, which is the most significant portion of the BSR balance sheet, the calculation of
technical provision is determined at individual policyholder level. Collectively, the individual policies
form a cohort of reinsured policies under a reinsurance treaty, whereby the required capital and risk
margin are calculated at the treaty level. Currently, each treaty is treated as a homogenous risk group
of its own, whereby the insurance cash flows underlying the policyholders are projected on a per-
policy basis, but aggregated to the treaty level. The risk capital and margin calculation are
determined at the level of the homogeneous risk group, with some dependency on the overall entity-
level diversification.
BSR data management is improving, but the ultimate goal of having systems in place to automate
data processing and checks, and claims, premium and treaty management, has not been achieved
yet. Ahead of implementation of automated solutions, good progress has been made in developing
and documenting manual checks on data, although this has been focused on the most material
contracts. Data dictionaries have been developed for a number of contracts to ensure a good level of
understanding of the information received from cedants.

97
Ultimately the aim is to have automated processes covering all in-force contracts and the ability to
accept new contracts with minimal fuss. Projects are ongoing with the eventual goal of strengthening
the governance and process around data quality.
BSR has identified, designed and implemented key control points in order to improve the robustness
of reporting activities. These efforts are documented in the Risk Control and Self-Assessment (RCSA)
and have been sampled-tested by Risk and Actuarial functions.
During 2017, it is recommended that the RCSA is reviewed and updated to allow for changes that
have taken place, such as the implementation of the integrated modeling platform. To ensure a
complete picture of the risks around the process has been captured, it is recommended that the end-
to-end process is mapped out to ensure there are no gaps in the control framework.
Model governance
The model governance process has been gradually formalized over the year 2016. Previously, BSR
maintained a suite of independent spreadsheet models for the purpose the liability projection. These
spreadsheet cash flow models were developed at the time of business acceptance, and modified for
the purpose of ongoing valuation.
Over the year 2016, BSR has undertaken an effort in identifying the material Top 5 contracts by order
of materiality, and ensured proper modelling standards apply to these contracts. These were
identified as the US stop-loss mortality contract, Dutch Longevity Reinsurance, Synthetic Longevity
Hedge, TLB High Net Worth and UK Individual Protection. Also importantly, the model/methodology
used for the aggregation of all cash flows, to determine technical provisions and capital requirements
for BSR under all frameworks, was also put under review.
The review of the remaining components of the key models concluded with the official migration to
an integrated modelling platform in Q4 2016, for the TLB High Net Worth, UK Individual Protection
and aggregation models. Collectively, there are two primary models within MoSes – (1) a
deterministic life model for the aforementioned models, and (2) an aggregation model used to value
all cash flow scenarios projected for all contracts of BSR, which resulted in the valuation of technical
provisions and capital. Model test plans were conceived and the MoSes models were tested against
these test plans before a recommendation for approval is given to BSR MB. Ultimately, the MoSes
models were approved for use as of Q4 2016, and the model change impact was quantified and
reported as part of the quarterly movement analysis of technical provisions (hence S-II Own Funds &
IFRS Equity) and capital requirements.
The model development and model change process is managed through a versioning system
(subversion). The system allows for the automated and controlled logging of historical changes made
to a given model, where past models are never deleted but stored on the network server. This is an
auditable system as one can always retrieve past information and obtain information as to who made
the changes, when the changes were made and the nature of the changes.

98
Movements of technical provision
The table shows an attribution of the performance of the technical provisions (TP) over the year
2016. The opening value is the technical provisions as of Q4 2015. The total movements consist of
one-off changes (model/methodology, assumption, major one-offs), the total value of new business,
total expected movements, economic variance, experience variance as well as diversification and
operational risk impacts.
The aggregated impact of the model and methodology changes in an increase in TP by EUR 7.2m.
The following 2 contracts experienced model changes in 2016: UK Individual Protection (total impact:
EUR 3.4m decrease in TP) and TLB High Net Worth Mortality Reinsurance (total impact: EUR 0.4m
decrease in TP).
There were also a few methodology updates to the following contracts and calculations: Spain
household reinsurance program premium projection (total impact: EUR 3.4m), excluding Synthetic
Longevity hedge capital relief from margin diversification (total impact: EUR 8.2m increase in TP),
update of the cash flow timing in margin calculations (total impact: EUR 1.1m decrease in TP) and
adjustment in mass lapse shock factor from 30% to 40% (total impact: EUR 0.5m increase in TP).
The changes done to assumptions increased the TP by EUR 16.6m. Out of this amount, the update of
Dutch Longevity Reinsurance mortality trend and level decreased TP by EUR 10.4m, Synthetic
Longevity Hedge mortality trend update decreased TP by EUR 0.7m, UK Individual Protection
mortality and morbidity updates led to an increase in TP of EUR 2.1m and maintenance expense
assumption update increase TP by EUR 3.9m.
BSR recaptured the China Modified Coinsurance contract that led to a decrease in TP of EUR 85.5m
but the overall balance sheet impact of the recapture was only an increase in OF by 6.5m. The
novation of US Stop-Loss Mortality Reinsurance contract resulted in EUR 61.2m increase in TP.
SII P&L Attribution Life Health Non-life Total
2015Q4 reported (31,429) (10,691) 3,916 (38,204)
Model/Methodology changes 3,753 71 3,416 7,239
Assumption updates 17,420 (804) (13) 16,603
CNOOC: recapture (85,537) - - (85,537)
US stop-loss: novation 60,073 1,098 0 61,172
TOTAL one-off changes (4,290) 365 3,403 (523)
TOTAL Value of New Business (744) - 40 (705)
Interest 168 36 (2) 201
Premium CF 109,204 4,699 3,249 117,152
Benefit CF (100,009) (1,532) (3,376) (104,917)
Expense CF (2,009) (642) (97) (2,748)
Release of margin (6,745) (650) (265) (7,660)
TOTAL Expected movements 608 1,911 (491) 2,028
Interest Rate Variance (11,756) (2,146) 106 (13,796)
FX Variance 3,348 (873) (2) 2,474
TOTAL Economic experience (8,408) (3,018) 104 (11,323)
TOTAL Experience variance 52,163 (1,513) (3,138) 47,512
TOTAL Diversification impact (6,192) (342) (24) (6,558)
TOTAL Operational Risk impact (248) (12) (0) (260)
2016Q4 reported 1,460 (13,300) 3,808 (8,032)

99
The remaining variances are due to:
Foreign exchange rate movements, EUR 2.5m increase in TP: EUR 3.3m increase in TP was
accumulated over the first 3 quarters of 2016 (prior to novation) by the US stop-loss contract
due to EUR appreciation with respect to USD.
Interest rates movements, EUR 13.8m decrease in TP: EUR 9.4m decrease in TP was
accumulated over the first 3 quarters of 2016 (prior to novation) by the US stop-loss contract
because of lowering of the interest rates.
Deviations from actuarial assumptions, i.e. experience variance, EUR 47.5m increase in TP:
EUR 52.4m was the total accumulated increase in TP of the US stop-loss contract during the
first 3 quarters of 2016 (prior to novation).
Changes in diversification, EUR 6.6m decrease in TP.
Change in operational risk, EUR 0.3m decrease in TP: operational risk decreased from Q4
2015 to Q4 2016.
D.2.1 Technical provisions – non-life
The non-life technical provision comprises the following reinsurance contracts, consisting of
proportional coinsurance structure and non-proportional excess-of-loss (XOL) structure:
- Aegon Spain JV household reinsurance program (coinsurance) – Status: active
- Netherlands property catastrophe program (XOL) – Status: active
- Hungary property catastrophe program (XOL) – Status: active
- Netherlands property per risk program (XOL) – Status: inactive
- Hungary motor third party liability (XOL) – Status: inactive
Active contracts refer to programs at which BSR is still at risk for future claim events, and therefore
future premium income is still to be earned. Inactive contracts refer to past reinsurance programs
that BSR participated in which claims are still pending final settlement and earns no future premium
income. Of the listed contracts, the Hungary motor third party liability (MTPL) contract is fully
retroceded to external market with special terms that fully negate counterparty risk. Therefore, an
equal amount of the reserve is reported as reinsurance recoverables on the balance sheet as
described in section D.1.10 Reinsurance recoverables.
This section describes the material differences between the bases, methods and main assumptions
used for the valuation for solvency purposes and the financial statements.
IFRS Treatment:
Non-life insurance contracts are insurance contracts where the insured event is not life-contingent.
For non-life products the insurance liability generally includes reserves for unearned premiums,
unexpired risk, inadequate premium levels, and outstanding claims and benefits. No catastrophe or
Blue Square Re N.V.
IFRS to SII Reconciliation December 31, 2016 IFRS Value Reclassification Revaluation Solvency II value
Liabilities
Technical provisions – non-life 5,189,301 (1,381,020) 3,808,281
Technical provisions – non-life (excluding health) 5,189,301 (1,381,020) 3,808,281
Technical provisions calculated as a whole -
Best Estimate 5,189,301 (1,812,259) 3,377,041
Risk margin 431,239 431,239

100
equalization reserves are included in the measurement of the insurance liability, unless the nature of
the reinsurance contract itself is a transfer of catastrophe risk only.
The reserve for unearned premiums includes premiums relating to risk coverage for periods beyond
the balance sheet date. Generally, the reserve is released over the remaining coverage period of the
premium and is recognized as premium income.
The liability for outstanding claims and benefits is established for claims that have not been settled
and any related cash flows, such as claims handling costs. It includes claims that have been incurred,
but have not been reported to BSR. The liability is calculated at the reporting date using statistical
methods based on empirical data and current assumptions that may include a margin for adverse
deviation.
At current state, as the non-life contracts contributed to only a small proportion of BSR’s balance
sheet, the unearned premium reserves and the claims liability, including IBNR and outstanding claims
reserves are modeled by the cedants.
The non-life reinsurance contracts are structured as a 1-year reinsurance, upon which future terms
and conditions and reinsurance programs of the cedant may change. As such, the recognition of the
future profit is until the maturity of the reinsurance treaty.
Solvency II Treatment:
For Solvency II, a Fair Value approach is used. Additionally, Solvency II does not distinguish between
pre-claims and post-claims liabilities, but requires discounting of all the expected future cash flows by
current discount rates and adding a risk margin based on the cost of capital (‘CoC’) for the non
hedgeable risks.
Under Solvency II, the contract boundary that is applicable is also 1-year, consistent with the current
IFRS treatment.
Regarding the discount rate, the Solvency II discount rate is based on the swap rate at the reporting
date (BSR does not make further spread adjustment). While the Solvency II discount rates differ in
their extrapolation of the curve and the last liquid point assumptions compared to IFRS, these
extrapolation assumptions will have almost no differences due to the short-term nature of non-life
contracts.
Reconciliation difference: Reclassification Adjustments
There are no reclassification adjustments necessary.
Reconciliation difference: Revaluation Adjustments
The total revaluation adjustments of EUR -1.4m includes:
EUR -1.3m for the revaluation of the Spain Household reinsurance treaties, mainly for the
derecognition of UPR under IFRS and to revalue the contract based on projected cash flows.
This revaluation also implicitly accounts for the commission structure, which was discussed in

101
section D.1.14 Receivables (trade, not insurance) where the revaluation related to the
derecognition of IFRS prepaid commission led to a loss of EUR 1.6 in assets.
EUR -85k for the recognition of future profits from the Dutch and Hungary natural
catastrophe reinsurance treaties. The IFRS valuation at year end 2016 defers all future profits
for future recognition.
D.2.2 Technical provisions – life (excluding index-linked and unit-linked) and health
The life technical provisions comprise of the following reinsurance contracts:
- Dutch Longevity Reinsurance (longevity swap)
- TLB High Net Worth Mortality Reinsurance (YRT mortality risk transfer)
- India Mortality Reinsurance (coinsurance)
- Turkey Life Reinsurance (mortality risk transfer)
- Spain Life Reinsurance (1-year coinsurance)
- Brazil Life Reinsurance (2-year coinsurance)
- Direct Marketing Australia Life (consists of two small coinsurance contracts)
The health technical provision consists of only one contract:
- Direct Marketing Products with Mitsui Sumitomo, Japan (MSI) (coinsurance)
Despite being an internal reinsurer, the direct marketing contracts in Australia and Japan are directly
written by external parties to the Aegon Group and reinsured to BSR. This is because the products
are designed and sold in partnership with Aegon Insights, which is a subsidiary of the Aegon Group
that specializes in the direct marketing space in the Asia-Pacific region. They are effectively products
designed under significant involvement by Aegon, and subsequently directly written on the balance
sheet of third party insurers.
This section describes the material differences between the bases, methods and main assumptions
used for the valuation for solvency purposes and the financial statements.
IFRS Treatment:
Life insurance contracts are insurance contracts with life-contingent benefits. The measurement of
the liability for a life insurance contract varies and depends on the nature of the product.
Liabilities arising from traditional life insurance products, particularly those with fixed and
guaranteed account terms, are using the gross premium valuation method. Under this method, the
liability is determined as the sum of the discounted value of the expected benefits and future
Blue Square Re N.V.
IFRS to SII Reconciliation December 31, 2016 IFRS Value Reclassification Revaluation Solvency II value
Liabilities
Technical provisions - life (excluding index-linked and unit-linked) 27,357,405 (39,197,491) (11,840,085)
Technical provisions - health (similar to life) (333,630) (12,966,641) (13,300,271)
Technical provisions calculated as a whole -
Best Estimate (333,630) (19,017,988) (19,351,618)
Risk margin 6,051,347 6,051,347
Technical provisions – life (excluding health and index-linked and unit-linked) 27,691,035 (26,230,850) 1,460,186
Technical provisions calculated as a whole -
Best Estimate 27,691,035 (87,297,389) (59,606,353)
Risk margin 61,066,539 61,066,539

102
administration expenses directly related to the contract, less the discounted value of the expected
future premiums. The liability is calculated based on current non-economic assumptions (e.g.,
mortality, morbidity, lapse, etc.). The discount rate is locked at the time of inception of the contracts.
To the extent a profit is calculated at the time of inception, the profit is deferred for future
recognition by the inclusion of a deferred revenue liability (DRL) in the technical provision. The
calculation frequency of the DRL is quarterly during each reporting period. The amortization of the
DRL is determined based on the present value of future profits at the time of inception, and is not
revalued going forward as experience unfolds. The discount rate for IFRS technical provision is the
risk-free term structure of the underlying currency of BSR’s reinsurance contracts, and is locked at
inception.
Life insurance contracts under which the policyholder bears the risks associated with the underlying
investments are classified as insurance contracts for account of policyholders. As at year end 2016,
BSR does not directly reinsure any insurance contracts for account of policyholders. Indirect risk
exposure towards such contracts by means of yearly renewable term reinsurance treaties that
transfer only mortality risk is treated just like a traditional life insurance products.
Generally, at each reporting date, the adequacy of the life insurance liabilities net of DAC, are
assessed using a liability adequacy test (LAT). The liability adequacy test is performed also using a
gross premium method and that the same non-economic assumptions are used as they are already
current best estimates. On the other hand, the discount rate is unlocked to current market risk-free
rates to revalue the liabilities for LAT purpose. The DRL is derecognized for LAT, and in lieu of that, an
explicit risk margin is added to the best estimate liabilities. The risk margin is calculated using the
cost of capital approach for non-hedgeable risks, allowing for diversification between the risks.
The LAT for year end 2016 shows a current surplus of approximately EUR 38 million over the reported
IFRS technical provision, net of DAC.
Solvency II Treatment:
For Solvency II, a Fair Value approach is used. Additionally, Solvency II requires discounting of all the
expected future cash flows by current discount rates and adding a risk margin based on the present
value of the cost of capital (‘CoC’) for the non-hedgeable risks.
Currently, BSR’s valuation of life technical provision is not affected by contract boundaries, such that
the boundary of all contracts are the same under IFRS and Solvency II.
Regarding the discount rate, the Solvency II discount rate is based on the swap rate at the reporting
date. BSR does not use any additional spread measure on top of the risk free rate. The Solvency II
discount rate used differ in their extrapolation of the curve compared to IFRS and the last liquid point
assumptions are different than applied for IFRS.
Reconciliation difference: Reclassification Adjustments
There are no reclassification of life and health technical provision from IFRS to Solvency II.

103
Reconciliation difference: Revaluation Adjustments
An overall revaluation amount of EUR -39.2 million has been processed, consisting of EUR -13.0m for
health technical provision and EUR -26.2m for life technical provision.
A total of EUR -26.2m revaluation of life technical provision is shown, consisting of the following:
EUR -26.4m for the revaluation of the Dutch Longevity Reinsurance, which is the most material
contract on BSR’s balance sheet.
o EUR -19.6m of the total revaluation is due to the incorporation of the Solvency II risk
margin relative to the IFRS deferred profit held at “amortized cost”. The Solvency II
risk margin is lower than the IFRS deferred profit because of the initial recognition of
IFRS being based on a more conservative mortality assumptions calibrated internally,
which showed a higher risk profile than Solvency II Standard Formula.
o The remaining EUR -6.8m is related to the unlocking of IFRS discount curves to use
Solvency II market discount curves instead.
A remaining EUR 0.2m for the revaluation of all other Life contracts. The differences relate to
only the inclusion of risk margin (instead of the deferred profits embedded within the IFRS
technical provision) and the unlocking of discount curves.
The revaluation of health technical provision consists of only one reinsurance treaty with MSI, for
EUR -13.0m in total, consisting of EUR -19.0m for best estimate and EUR +6.1m for risk margin. The
impact is due to the relatively large future profits embedded within the IFRS technical provision that
has been deferred for recognition via the DRL. Under the Solvency II revaluation, the future profits
are recognized in the calculation leading to a gain relative to IFRS, but this should be viewed
alongside the derecognition of the DAC of EUR 13m as discussed in section D.1.2 Deferred acquisition
costs.
D.2.3 Technical provisions – index-linked and unit-linked
This is not applicable for BSR.
D.2.4 Matching adjustment
The matching adjustment is not currently applicable to BSR.
D.2.5 Volatility adjustment
The volatility adjustment is not currently applicable to BSR.
D.2.6 Transitional risk-free interest rate-term structure
BSR does not apply the transitional risk-free interest rate-term structure – as described in Article
308c of Directive 2009/138/EC.

104
D.2.7 Transitional deduction
BSR does not apply the transitional deduction – as described in Article 308d of Directive
2009/138/EC.
D.2.8 Recoverables from reinsurance contracts and Special Purpose Vehicles
A reinsurance recoverable of EUR 0.4m is reported on both the IFRS and S-II balance sheets. This
recoverable relate to the claims recovery under an inactive retrocession program for the Hungary
third-party liability reinsurance.
A Solvency II economic valuation of the retroceded liabilities is applied. While the value of the
reinsured liabilities should typically allow for a best estimate default provision, this is deemed
unnecessary for this contract, as the inward reinsurance where BSR has an obligation to the insurer
specifically contains clauses specifying that the obligation of BSR to the cedant is fully contingent
upon the recovery from retrocession counterparties. In other words, the cedant assumes the
counterparty risks of the retrocessionaires. The amounts recoverable are reliable and are expected to
be recovered to fully offset the gross technical provision set aside for this contract.
BSR also makes use of a retrocession program for the Turkey Life Reinsurance contract. As this
contract is not currently a material contract in terms of the size of obligation to BSR, the inward and
outward reinsurance contracts are presented as netted within the technical provision. The allowance
for default is not taken into consideration as this is immaterial at the moment.
D.2.9 Material changes in assumptions made in calculations of technical provisions
During 2016 a number of assumption changes were made with regard to the calculation of technical
provisions. Assumptions reviewed and updated in 2016, including impact assessments are as follows:
EUR +14.8m: Dutch Longevity Reinsurance mortality experience factors based on 3 years of
observation in the reinsured portfolio. Given the early observation, equal weight is given to
the observation and the initial assumption. If the observation continues at its current trend,
further reserves strengthening is to be expected.
EUR +9.1m: Maintenance expense assumption was updated based on a study on actual
incurred expenses against projected growth of BSR according to the Medium Term Plan. The
expense study came to a conclusion that the future maintenance expense needed to be
strengthened, and the assumptions are also further apportioned to those related to current
in-force and those for the current overrun.
EUR -4.4m: Update to the Dutch Longevity Reinsurance mortality trend projection based on
new annual data point (i.e., general population mortality of CBS 2015).
EUR +2.1m: Mortality and morbidity assumptions related to the UK Individual Protection
contract is updated based on cedant’s experience studies.
While not an assumption update per se, BSR started excluding the margin diversification benefit of
the Synthetic Longevity Hedge in the risk margin calculation. The exclusion resulted in an increase to
technical provision of EUR 8.2m.

105
D.3 Other liabilities
D.3.1 Contingent liabilities
This is not applicable to BSR.
D.3.2 Provisions other than technical provisions
This is not applicable to BSR.
D.3.3 Pension benefit obligations
This is not applicable to BSR.
D.3.4 Deposits from reinsurers
This is not applicable to BSR.
D.3.5 Deferred tax liabilities
For an explanation of the deferred tax liabilities, please refer to the explanations already provided in
section D.1.4 Deferred tax assets. The same explanation in relation to the origin and amount of DRL
holds as described earlier because the reported DTL on the Solvency II balance sheet is a result of the
differences in valuation between the IFRS and Solvency II balance sheets, whereas the tax basis
remains unchanged.
D.3.6 Derivatives
The derivative liability on BSR balance sheet reflects only one position of interest rate swap for the
hedging of the Synthetic Longevity Hedge.
BSR does not assume directly risk from any embedded options and guarantees not any contractual
features that resemble embedded derivatives through the insurance policies underlying the
reinsurance treaties. For instance, TLB universal life policies that otherwise may have embedded
derivatives are reinsured to BSR only for the mortality risk and is achieved via a YRT mortality
reinsurance treaty.
IFRS to SII Reconciliation Q4 2016 IFRS Value Reclassifications Revaluation Solvency II value
Assets
Deferred tax assets 3,740,566.00 (3,740,566) -
Liabilities
Deferred tax liabilities (3,740,566) 6,398,436 2,657,870
Blue Square Re N.V.
IFRS to SII Reconciliation December 31, 2016 IFRS Value Reclassification Revaluation Solvency II value
LiabilitiesDerivatives 573,754 34,872 - 608,625

106
IFRS Treatment:
Life insurance contracts typically include derivative-like terms and conditions. With the exception of
policyholder options to surrender the contract at a fixed amount, contractual features that are not
closely related to an insurance contract and that do not themselves meet the definition of an
insurance contract are accounted for as derivatives.
IFRS requires for embedded derivatives to be bifurcated and presented separately as derivatives
(liabilities) when they are not 'closely related' to the host contract. In that case they must be valued
at Fair Value in the IFRS balance sheet.
These embedded derivatives are however not applicable for BSR. The EUR 0.6m relates to only a
plain vanilla interest rate swap derivative, valued at market rates on the closing date of the reporting
period.
Solvency II Treatment:
Similarly to IFRS, a Fair Value approach is prescribed for Solvency II. In the case of the interest rate
swap, the market value is adjusted for the accrued interest.
Reconciliation difference: Reclassification Adjustments
The reclassification adjustment of EUR 34.9 thousand is for the accrued interest related to the plain
vanilla interest rate swap, which by market convention is valued using market rates. The IFRS values
the derivative at the clean price excluding the accrued interest, whereas the revaluation includes the
accrued interest for the market value.
Reconciliation difference: Revaluation Adjustments
No revaluation adjustment is needed, as all of BSR’s investments are measured at Fair Value on the
IFRS balance sheet.
D.3.7 Debts owed to credit institutions
A negligible amount of EUR 3k is reported as debt owed to credit institutions. This amount pertains
to the accrued interest related to the initial and variation margin posted for the trading of interest
rate swap hedging program on the Synthetic Longevity Hedge.
In principle, these values should be reported in the same account balance as the posted margin.
However, given the immateriality, BSR had not reclassified this.
IFRS Treatment:
Considered 'financial liabilities' like debt owed to credit institutions are to be valued at amortized
cost or Fair Value. If valued at Fair Value, then the discount rates should also include the Own Credit
Spread (OCS).
Blue Square Re N.V.
IFRS to SII Reconciliation December 31, 2016 IFRS Value Reclassification Revaluation Solvency II value
Liabilities
Debts owed to credit institutions 3,159 - 3,159

107
Solvency II Treatment:
For Solvency II, a Fair Value approach is prescribed excluding the effect of changes in OCS since initial
recognition.
IFRS to Solvency II reconciliation adjustments:
No further adjustments were made in the reconciliation due to the immateriality.
D.3.8 Financial liabilities other than debts owed to credit institutions
IFRS Treatment:
This liability category represents the collateral received from Aegon Levensverzekering N.V. under
the Dutch Longevity Reinsurance transaction, including the accrued interests. The entirety of the
collateral is posted in cash and consequently, valued at fair value.
Solvency II Treatment:
Solvency II requires measurement at fair value, which is already the case for this component under
IFRS.
IFRS to Solvency II reconciliation adjustments:
No revaluation adjustment is necessary as these are cash posted under the Credit Support Annex as
collateral and is expected to either be returned to the cedant as experience emerges differently over
time or to diminish gradually as the marked-to-model value of the reinsurance treaty converges to
the realized valued over time as it runs off.
D.3.9 Insurance & intermediaries payables
The insurance and intermediaries payables for BSR are payables from BSR as at the close of the
accounting period on December 31st, 2016 to either cedants or the intermediaries of BSR. The
operational aspect of insurance and intermediaries reporting typically lags the risk period by 1-3
months (or some even 6 months) as stipulated in the respective treaties, causing a natural delay in
the settlement of cash flows with counterparties.
The overall balance of EUR 0.9m is small on the balance sheet, and BSR aims to settle payables as
soon as possible. The balance of EUR 0.9m consists of various small amounts payables to the cedants,
as well as some fees to Aegon Insights and Aegon Asset Management.
Blue Square Re N.V.
IFRS to SII Reconciliation December 31, 2016 IFRS Value Reclassification Revaluation Solvency II value
LiabilitiesFinancial liablitilies other than debts owed to credit institutions 6,001,089 - 6,001,089
Blue Square Re N.V.
IFRS to SII Reconciliation December 31, 2016 IFRS Value Reclassification Revaluation Solvency II value
LiabilitiesInsurance & intermediaries payables 916,589 (675,257) - 241,332

108
IFRS Treatment:
Insurance and intermediaries payables are valued at amortized cost, at the estimates or statements
provided by the cedants. Generally, BSR reaches out to cedants right after the quarterly close of
accounting period to obtain the latest estimate of payables (or receivables) due for the performance
of the business over the last reporting period. The information is therefore more up-to-date, but
nonetheless an early estimate of the upcoming reinsurance statement of account. No further
adjustments are made to these estimates obtained from the cedants, as past experience indicates
stability in the early estimates. For contracts with pre-set or known cash flows, the payables will be
based on the respective contractual agreement. As BSR writes business in multiple currencies, the
payables in local currencies are translated to EUR using the closing currency exchange rates.
Solvency II Treatment:
Solvency II requires that payables are held at Fair Value.
IFRS to Solvency II reconciliation adjustments:
Given the short term nature of these payables, there should exist no material measurement
differences between amortized cost for IFRS and Fair Value for Solvency II.
Reconciliation difference: Reclassification Adjustments
The reclassification adjustment of EUR 0.7m relates to the payables to Aegon cedants which are
allocated to the payable (trade, not insurance).
Reconciliation difference: Revaluation Adjustments
Reinsurance payables on BSR’s balance sheet are predominantly short-term balance sheet items.
Therefore, the difference between the amortized cost under IFRS and Fair Value under Solvency II is
not material. As such, no revaluation is performed between IFRS and Solvency II.
D.3.10 Reinsurance payables
This is not applicable as at FY 2016 as there are no outstanding payables to retrocessionnaires as at
year-end 2016.
D.3.11 Payables (trade, not insurance)
The payables (trade, not insurance) category consists mainly of cost charges to Aegon Group
(corporate center) for the group services and to a smaller extent, general expense payables.
IFRS Treatment:
Payables (trade, not insurance) are considered to be financial liabilities and are to be valued at
amortized cost or Fair Value. If valued at Fair Value, then the discount rates should also include the
Own Credit Spread (OCS).
IFRS to SII Reconciliation Q4 2016 IFRS Value Reclassifications Revaluation Solvency II value
Liabilities
Payables (trade, not insurance) 1,945,569 675,257 2,620,827
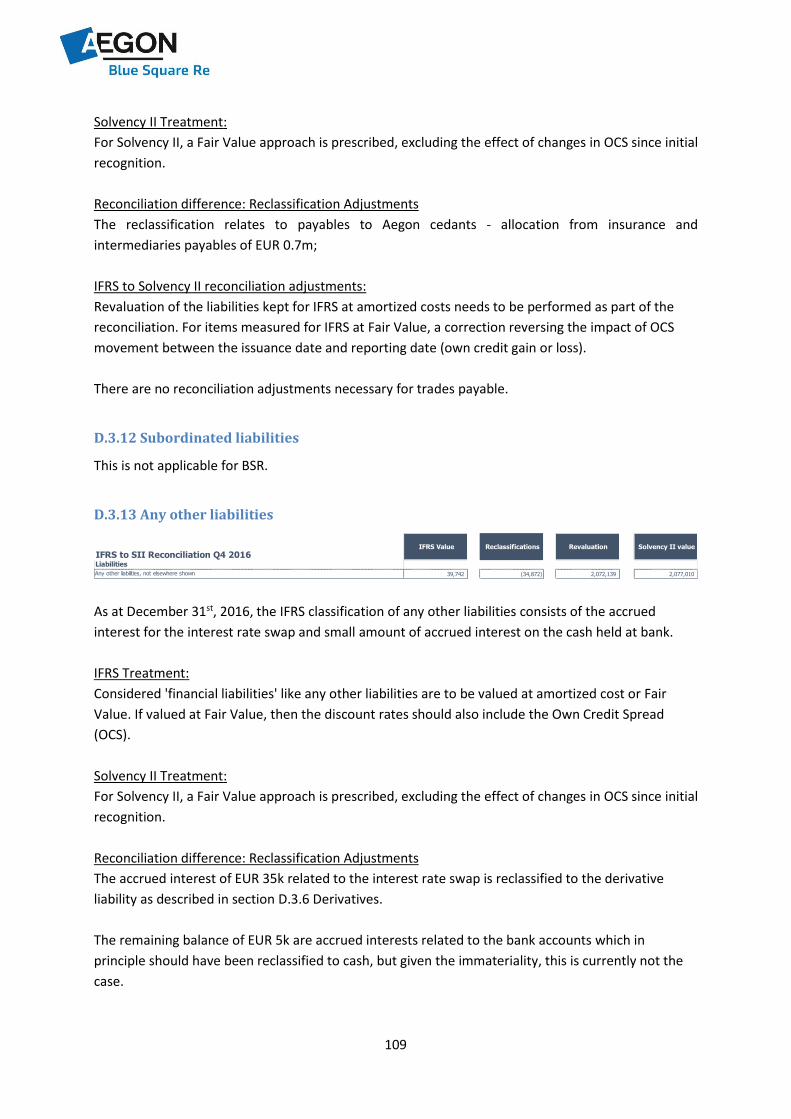
109
Solvency II Treatment:
For Solvency II, a Fair Value approach is prescribed, excluding the effect of changes in OCS since initial
recognition.
Reconciliation difference: Reclassification Adjustments
The reclassification relates to payables to Aegon cedants - allocation from insurance and
intermediaries payables of EUR 0.7m;
IFRS to Solvency II reconciliation adjustments:
Revaluation of the liabilities kept for IFRS at amortized costs needs to be performed as part of the
reconciliation. For items measured for IFRS at Fair Value, a correction reversing the impact of OCS
movement between the issuance date and reporting date (own credit gain or loss).
There are no reconciliation adjustments necessary for trades payable.
D.3.12 Subordinated liabilities
This is not applicable for BSR.
D.3.13 Any other liabilities
As at December 31st, 2016, the IFRS classification of any other liabilities consists of the accrued
interest for the interest rate swap and small amount of accrued interest on the cash held at bank.
IFRS Treatment:
Considered 'financial liabilities' like any other liabilities are to be valued at amortized cost or Fair
Value. If valued at Fair Value, then the discount rates should also include the Own Credit Spread
(OCS).
Solvency II Treatment:
For Solvency II, a Fair Value approach is prescribed, excluding the effect of changes in OCS since initial
recognition.
Reconciliation difference: Reclassification Adjustments
The accrued interest of EUR 35k related to the interest rate swap is reclassified to the derivative
liability as described in section D.3.6 Derivatives.
The remaining balance of EUR 5k are accrued interests related to the bank accounts which in
principle should have been reclassified to cash, but given the immateriality, this is currently not the
case.
IFRS to SII Reconciliation Q4 2016 IFRS Value Reclassifications Revaluation Solvency II value
Liabilities
Any other liabilities, not elsewhere shown 39,742 (34,872) 2,072,139 2,077,010
110
IFRS to Solvency II reconciliation adjustments:
The reconciliation adjustment consists of:
EUR 1.7m with regard to the impact of projecting the risk margin on an annual basis instead
of a monthly basis; and
EUR 0.4M related to the Spain Household claim provision.
Off balance sheet positions
Initial margin for the Synthetic Longevity Hedge is held off balance sheet. Each counterparty has
posted initial margin in their home currency, amounting to EUR 10.3m in total. These amounts are
held in government bonds in a segregated custodian account with a reputable, highly-rated bank.
Payables due under letter of credit agreements provided by Blue Square Re to the U.S. Internal
Revenue Service at December 31, 2016 amounted to EUR 75k (2015: EUR 75k). As of that date no
amounts had been drawn, or were due under letter of credit facility.
D.4 Alternative methods for valuation BSR does not use alternative methods for valuation.
D.5 Any other information This section describes additional information about the assumptions regarding management actions
and policyholder behaviors. Other than these, there are nothing additional to disclose other than
those already described throughout this chapter.
Management actions
BSR does not make any assumptions for future management actions in the calculation of technical
provisions nor for any components on the balance sheet.
As a reinsurer, there are limited management actions written into the reinsurance treaties and
reinsured policies that BSR can perform on a standalone basis as a direct risk mitigation to the
reinsured in-force policies. For instance, BSR does not write any products with discretionary
participating features. Typically, in the case of reviewable rates, BSR is able to increase the
reinsurance premium rates if the cedant also increases the premium rates on existing policyholders.
Nonetheless, it is also prudent to point out that reinsurance treaty is after all a customized bilateral
agreement in which BSR is able to initiate discussion with the cedant, taking into account the
business relationship and business proposition as a whole, to mutually agree to change certain
aspects surrounding the existing reinsurance treaties. This is however not expected to be the case
under normal business circumstances. An example of this was performed on the Synthetic Longevity
Hedge contract, whereby the novation of the US stop-loss mortality contract left a one-sided
exposure in the hedge and BSR was able to reach out to counterparties to mutually agree to
restructure the hedge contract.
Besides that, the management actions that BSR can realistically employ are geared towards expense
management, financial hedging, and retrocession.

111
Policyholder behaviors
The assumptions for policyholder behaviors are the base surrender and lapse rates that are
historically observed within the reinsured portfolio. Most of the reinsured policies to BSR are pure
protection policies with little or no cash values or investment features, leaving BSR quite immune to
dynamic policyholder behaviors.
Of particular interest is the TLB YRT mortality reinsurance of the universal life plans. BSR only
reinsures the mortality benefit and collects the mortality risk premium for the UL policies, so in risk
perspective, BSR is not exposed to the financial options and guarantees embedded in the UL policies.
However, as the reinsured benefit is defined as the net amount at risk equaling to the difference
between face amount and account value, the latter is a function of investment return and
policyholder behavior, especially over a long-term assumptions. This issue manifests as a matter of
future volume of in-force reinsured business as opposed to the direct risk sharing, so is currently
simplified in the modelling.
112
E. Capital Management
General
The financial strategy supports the execution of our business strategy. Once a year in Q4, BSR
updates the business strategy that concludes with a medium term plan. In 2016, the plan spans
across a 3-year horizon for in-force contracts.
The key financial strategy themes can be broadly classified into business and operational objectives:
Business objectives
o Continue to implement Aegon’s reinsurance strategy and contribute to optimizing
Aegon’s S-II capital position by achieving diversification under S-II regime through
reinsurance solutions;
o Contribute to Aegon’s bottom line results by retaining risks that fall within Aegon’s
overall risk appetite;
o Focus on the top business opportunities.
Operational objectives
o Ensure that BSR actuarial, finance and operational areas’ processes have the
appropriate infrastructure to meet relevant internal and external requirements as
the book of business grows.
The capital management strategy supports the execution of the financial strategy. The main capital
management themes are described in this chapter.
Capital Management policy
BSR Capital Management policy aims to enhance transparency and accountability around capital
management in the entity. The policy is an adaptation of Aegon Group capital management policy to
ensure alignment towards the realization of Group capital strategy across all business entities.
The capitalization of BSR is based on the most stringent of local regulatory requirements, rating
agency requirements, and self-imposed criteria. BSR has a AA- financial strength rating from Standard
& Poor’s (S&P) for being core to the realization of Aegon Group strategy.
The Capital Management policy sets the following capitalization zones:
1. Accelerated deployment
2. Opportunity zone;
3. Target zone;
4. Warning zone;
5. Recovery zone; and
6. Regulatory zone.

113
In managing the capital adequacy, the Company’s capital management framework is built on, among
other things, managing capitalizations towards the target capital management zone. Under the
Company’s capital management framework the following target capitalization is most relevant:
Following complete restructure of the Synthetic Longevity Hedge in Q1 2017, BSR’s solvency ratio is
in the opportunity range (160%-180%) as of Q1 2017.
The frequent monitoring of actual and forecasted capitalization levels is an important element in the
Company’s capital framework in order to actively steer and manage towards maintaining adequate
capitalization levels. BSR’s capital framework is based on several capital management zones in which
escalating management actions are called for in a timely manner to ensure there is always adequate
capitalization.
The capital management zones and the management interventions connected to these zones as soon
as the capital ratio falls or is projected to fall within a particular capitalization zone are illustrated in
the table below.
Capital management zones
Company’s Economic Area
Local capital management actions
Accelerated Deployment >180% SCR Acceleration of capital deployment.
Opportunity 160% - 180% SCR Drive acceleration of growth and/or additional remittances to the group.
Target 140% - 160% SCR Execute capital deployment and remittances according to capital plan.
Warning 120% - 140% SCR Re-assess capital plan and risk positions.
Recovery 100% - 120% SCR Re-asses capital plan and risk positions. Reduce or suspend remittances.
Regulatory plan <100% SCR Suspension of dividends. Regulatory plan required.
The Capital Management policy provides guidance for financial strength and continuity which,
together with culture and risk balance are the Risk Tolerance statements set in Blue Square Re’s ERM
Framework. The Company aims to maintain the capital ratio within the target zone, which we believe
is sufficient to maintain a capitalisation ratio of at least 100% after a one in ten year adverse scenario
would have occurred. For additional detail on the Risk Tolerance statements, please refer to section
B.3.1.1 Enterprise Risk Management Framework.
Capital quality
Capital quality is a reflection of the Company’s stability and ability to absorb future financial losses.
BSR’s total Own Funds is comprised of only Unrestricted Tier 1 capital.
This is in light of Solvency II regulation that makes a distinction between available and eligible own
funds, in which both are split into tiers as shown in section E.1.2 Tiering of Own Funds.
Capitalization Target Range (Solvency II) Dec 31, 2016 Jan 1, 2016
140%-160% 136% 259%

114
Available own funds
Unrestricted Tier 1 capital consists of BSR’s share capital, share premium and the reconciliation
reserve.
Eligible own funds
Under Solvency II regulation, restrictions apply to the eligibility of Tier 2 and Tier 3 capital, as well as
the eligibility of restricted Tier 1. The total of Tier 2 and Tier 3 Own Funds may not exceed 50% of the
SCR whilst the eligibility of Tier 3 Own Funds is limited to 15% of SCR. Restricted Tier 1 may not
exceed 20% of Tier 1 Own Funds.
BSR’s total Own Funds is comprised of only Unrestricted Tier 1 capital and consequently is not
subject to tiering restrictions. All of BSR’s available own funds are eligible own funds, and amounted
to EUR 81.1 m on December 31, 2016
Managing our leverage
This is currently not applicable as BSR does not make use of financial leverage.
E.1 Own Funds
E.1.1 Aggregation methods
The solvency position is calculated as a ratio, by dividing Own Funds by the Capital Requirement.
There are two capital requirements: a Solvency Capital Requirement (SCR) and a Minimum Capital
Requirement (MCR). The MCR is an absolute minimum metric. The SCR, on the other hand, is a target
level that, in general, all insurance companies should aim for. The solvency ratio uses the SCR as the
denominator.
All Own Funds of BSR sits within the legal entity, not requiring further aggregation and consolidation.
The SCR is calculated for each risk sub-modules applicable to BSR as per the Delegated Acts. The sub-
modules are aggregated to the entity-level basic SCR using the correlation matrices prescribed under
the Standard Formula.
E.1.2 Tiering of Own Funds
The Own Funds are divided into three Tiers. An overview of the general characteristics of the three
Tiers of Own Funds is visualized in the figure below.
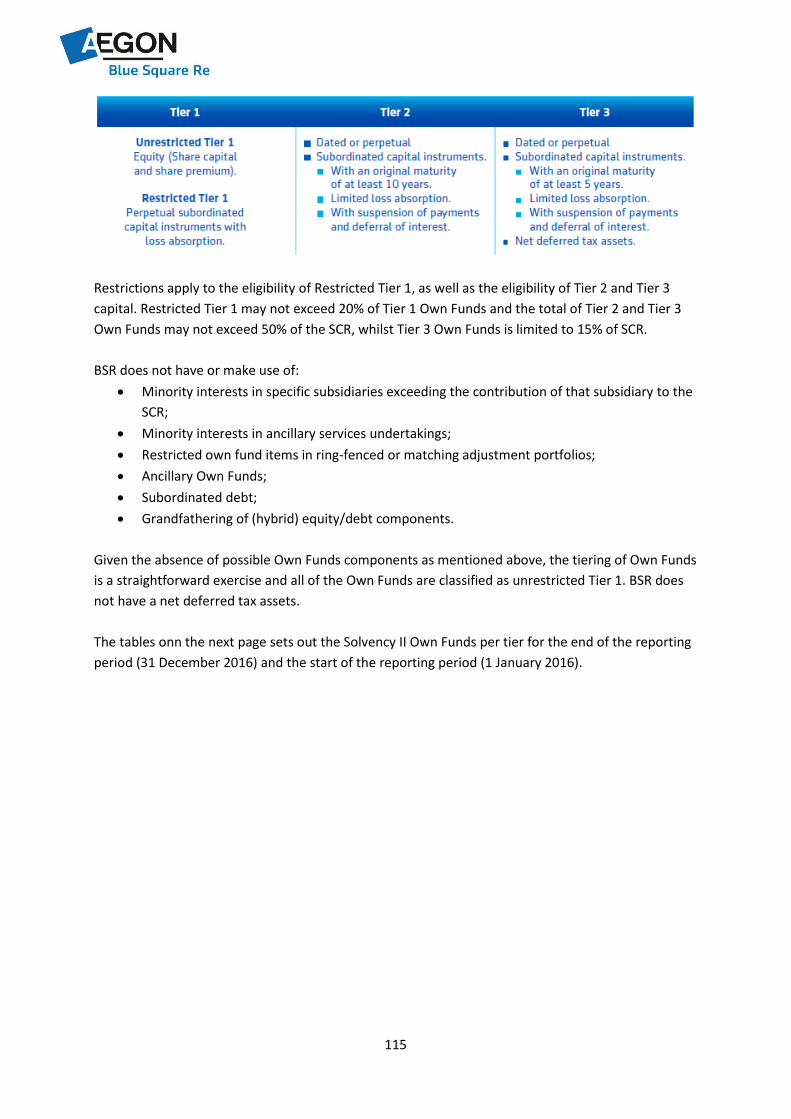
115
Restrictions apply to the eligibility of Restricted Tier 1, as well as the eligibility of Tier 2 and Tier 3
capital. Restricted Tier 1 may not exceed 20% of Tier 1 Own Funds and the total of Tier 2 and Tier 3
Own Funds may not exceed 50% of the SCR, whilst Tier 3 Own Funds is limited to 15% of SCR.
BSR does not have or make use of:
Minority interests in specific subsidiaries exceeding the contribution of that subsidiary to the
SCR;
Minority interests in ancillary services undertakings;
Restricted own fund items in ring-fenced or matching adjustment portfolios;
Ancillary Own Funds;
Subordinated debt;
Grandfathering of (hybrid) equity/debt components.
Given the absence of possible Own Funds components as mentioned above, the tiering of Own Funds
is a straightforward exercise and all of the Own Funds are classified as unrestricted Tier 1. BSR does
not have a net deferred tax assets.
The tables onn the next page sets out the Solvency II Own Funds per tier for the end of the reporting
period (31 December 2016) and the start of the reporting period (1 January 2016).

116
In the section below, the Own Funds items in each tier are discussed in more detail. As BSR only has
Tier 1 items over the reporting period, only Tier 1 items will be discussed.
Ordinary share capital
Ordinary share capital (gross of own shares) is comprised of 45 common shares (out of 225
authorized shares). Each share has par value per share of EUR 1,000. The amount (EUR 45,000)
presented here in Tier 1 unrestricted aligns with the data published in the Annual Report. The
ordinary share capital is unchanged over the reporting period.
Share premium account
Share premium account related to ordinary share capital is comprised of EUR 81.8m for common
shares. The share premium account reflects the total additional paid-in amounts above the par value
of the common shares. The amount presented here in Tier 1 unrestricted aligns with the data
published in the Annual Report. The ordinary share capital is unchanged over the reporting period.
Reconciliation reserve
The reconciliation reserve is calculated as follows:
BSR Own Funds Tiering as at 31 December 2016
Amounts in EUR mill ions
Total Tier 1
unrestricted
Tier 1
restricted
Tier 2 Tier 3
Ordinary share capital 0.0 0.0
Share premium account 81.8 81.8
Reconciliation reserve -0.8 -0.8
Available Own Funds 81.1 81.1
Eligible Own Funds 81.1 81.1
Solvency Capital Requirement (SCR) 59.5
Minimum Capital Requirement (MCR) 14.9
Solvency II Ratio 136%
BSR Own Funds Tiering as at 1 January 2016
Amounts in EUR mill ions
Total Tier 1
unrestricted
Tier 1
restricted
Tier 2 Tier 3
Ordinary share capital 0.0 0.0
Share premium account 81.8 81.8
Reconciliation reserve 86.7 86.7
Available Own Funds 168.6 168.6
Eligible Own Funds 168.6 168.6
Solvency Capital Requirement (SCR) 65.1
Minimum Capital Requirement (MCR) 17.8
Solvency II Ratio 259%
Reconciliation reserve
Amounts in EUR millions Dec 31, 2016 Jan 1, 2016
Excess of Assets over Liabilities 81.1 168.6
-/- Share Capital and Share Premium -81.9 -81.9
Reconciliation reserve -0.8 86.7
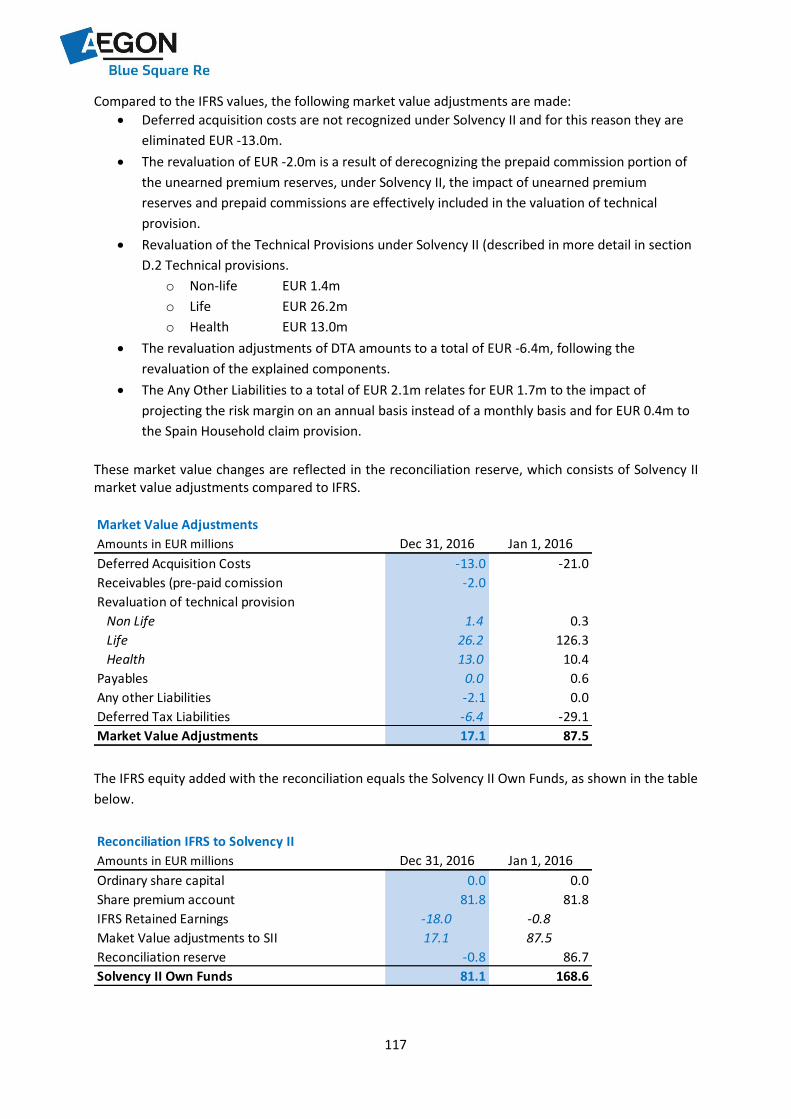
117
Compared to the IFRS values, the following market value adjustments are made:
Deferred acquisition costs are not recognized under Solvency II and for this reason they are
eliminated EUR -13.0m.
The revaluation of EUR -2.0m is a result of derecognizing the prepaid commission portion of
the unearned premium reserves, under Solvency II, the impact of unearned premium
reserves and prepaid commissions are effectively included in the valuation of technical
provision.
Revaluation of the Technical Provisions under Solvency II (described in more detail in section
D.2 Technical provisions.
o Non-life EUR 1.4m
o Life EUR 26.2m
o Health EUR 13.0m
The revaluation adjustments of DTA amounts to a total of EUR -6.4m, following the
revaluation of the explained components.
The Any Other Liabilities to a total of EUR 2.1m relates for EUR 1.7m to the impact of
projecting the risk margin on an annual basis instead of a monthly basis and for EUR 0.4m to
the Spain Household claim provision.
These market value changes are reflected in the reconciliation reserve, which consists of Solvency II market value adjustments compared to IFRS.
The IFRS equity added with the reconciliation equals the Solvency II Own Funds, as shown in the table
below.
Market Value Adjustments
Amounts in EUR millions Dec 31, 2016 Jan 1, 2016
Deferred Acquisition Costs -13.0 -21.0
Receivables (pre-paid comission -2.0
Revaluation of technical provision
Non Life 1.4 0.3
Life 26.2 126.3
Health 13.0 10.4
Payables 0.0 0.6
Any other Liabilities -2.1 0.0
Deferred Tax Liabilities -6.4 -29.1
Market Value Adjustments 17.1 87.5
Reconciliation IFRS to Solvency II
Amounts in EUR millions Dec 31, 2016 Jan 1, 2016
Ordinary share capital 0.0 0.0
Share premium account 81.8 81.8
IFRS Retained Earnings -18.0 -0.8
Maket Value adjustments to SII 17.1 87.5
Reconciliation reserve -0.8 86.7
Solvency II Own Funds 81.1 168.6

118
E.1.3 Difference between Solvency Own Funds and IFRS Shareholders Equity
For a quantitative explanation of the material differences between equity as shown in the financial
statements and the excess of assets over liabilities as calculated for solvency purposes, refer to
section D. Valuation for Solvency Purposes (balance sheet reconciliation overview) and the table
disclosed as part of the reconciliation reserve in section E.1.2 Tiering of Own Funds.
The main difference between the Solvency II Own Funds and IFRS Shareholders Equity as reported in
the Annual Report is mainly caused by the differences in the valuation of the insurance liabilities. The
insurance liabilities are based on locked-in discount rates and deferred margins for IFRS accounting
purposes whereas Solvency II requires these to be based on market discount rates and the use of the
cost of capital approach for the risk margin valuation. The excess of the valuation of technical
provisions under Solvency II is described in more detail in section D.2 Technical provisions.
Another difference relates to the derecognition of Deferred Policy Acquisition Cost under Solvency II,
as explained in section D.1.2 Deferred acquisition costs.
E.1.4 Transitional arrangements
BSR does not make use of any transitional arrangements.
E.1.5 Ancillary own funds
The year end 2016 Solvency position of BSR did not include any ancillary own funds as defined by
article 89(1) of Directive 2009/138/EC.
E.1.6 Description of items deducted from Own Funds
BSR does not make any deductions from the Own Funds.
E.1.7 Significant changes to Own Funds over the reporting period
As of year-end 2015, BSR’s Own Funds (OF) amounted to EUR 168.6m and dropped at the end of
year-end 2016 to EUR 81.1m. The OF movements are a function of many compounds.
In the first quarter, BSR recaptured the China Modified Coinsurance contract for a total increase in
OF by EUR 6.6m. In the third quarter, BSR updated some of its assumptions – mortality trend and
level of Dutch Longevity Reinsurance and mortality trend of Synthetic Longevity Hedge, mortality and
morbidity assumptions of the UK Individual Protection contract as well as the company-wide
maintenance expense assumption – for a total impact equaling to a decrease in Own Funds of EUR
31.2m. In the fourth quarter, the company executed two simultaneous management actions: a
novation the US stop-loss mortality contract and a partial restructure of Synthetic Longevity Hedge
which amounted cumulatively to a EUR 65.2m decrease in OF.
The annual experience variance coming from underwriting risks decreased the OF over the year by
EUR 42.1m of which majority comes from the worsening performance of the novated US stop-loss
mortality contract prior to the eventual novation at the end of the fiscal year. The changes in the

119
economic environment (term structures and foreign exchange rates) increased the OF by EUR 14.3.
The company released EUR 7.7m of profit from margins of technical provisions. Finally, the annual
changes in the deferred taxes on the market value adjustment contributed EUR 25.2m.
E.2 Solvency Capital Requirement and Minimum Capital Requirement
E.2.1 Solvency Capital Requirement
A solvency capital requirement is the amount of funds that insurance and reinsurance undertakings
are required to hold in the European Union. Solvency capital requirement is a formula-based figure
calibrated to ensure that all quantifiable risks are taken into account, including non-life underwriting,
life underwriting, health underwriting, market, credit, operational and counterparty risks.
The Solvency Capital Requirement (SCR) should reflect a level of eligible own funds that enables
insurance and reinsurance undertakings to absorb significant losses and that gives reasonable
assurance to policyholders and beneficiaries that payments will be made as they fall due. The
solvency position is calculated as a ratio, by dividing Own Funds by the Capital Requirement. There
are two capital requirements: a Solvency Capital Requirement (SCR) and a Minimum Capital
Requirement (MCR). The MCR is an absolute minimum metric. The SCR, on the other hand, is a target
level that, in general, all insurance companies should aim for. The solvency ratio uses the SCR as the
denominator.
Solvency II allows for the SCR to be calculated either as Standard Formula, which refers to the
standard methods and factors prescribed by the Solvency II regulation; or as Internal Model, which is
based on an undertaking-specific internal assessment of the risk and requires regulatory approval for
the use of such models. BSR applies the Standard Formula calculation for the SCR.
This section outlines the year end 2016 Solvency Capital Requirement (SCR) and Minimum Capital
Requirement (MCR). Note that the SCR and MCR are still subject to supervisory assessment.
The table shows the comparative year end positions for 2016 against year-end 2015 (also known as
“Day 1 Solvency II Reporting” when Solvency II first came into effect). The changes in Own Funds
have been explained in section E.1.7 Significant changes to Own Funds over the reporting period.
The single key driver for the decrease in SCR is the novation of the US stop-loss mortality contract in
Q4. Prior to the novation, this reinsurance treaty is one of the largest treaties on BSR’s balance sheet,
Solvency II key figures
Amounts in EUR millions Dec 31, 2016 Jan 1, 2016 %
Own Funds 81.1 168.6 -52%
SCR 59.5 65.1 -9%
Solvency II ratio 136% 259%
MCR 14.9 17.8 -16%
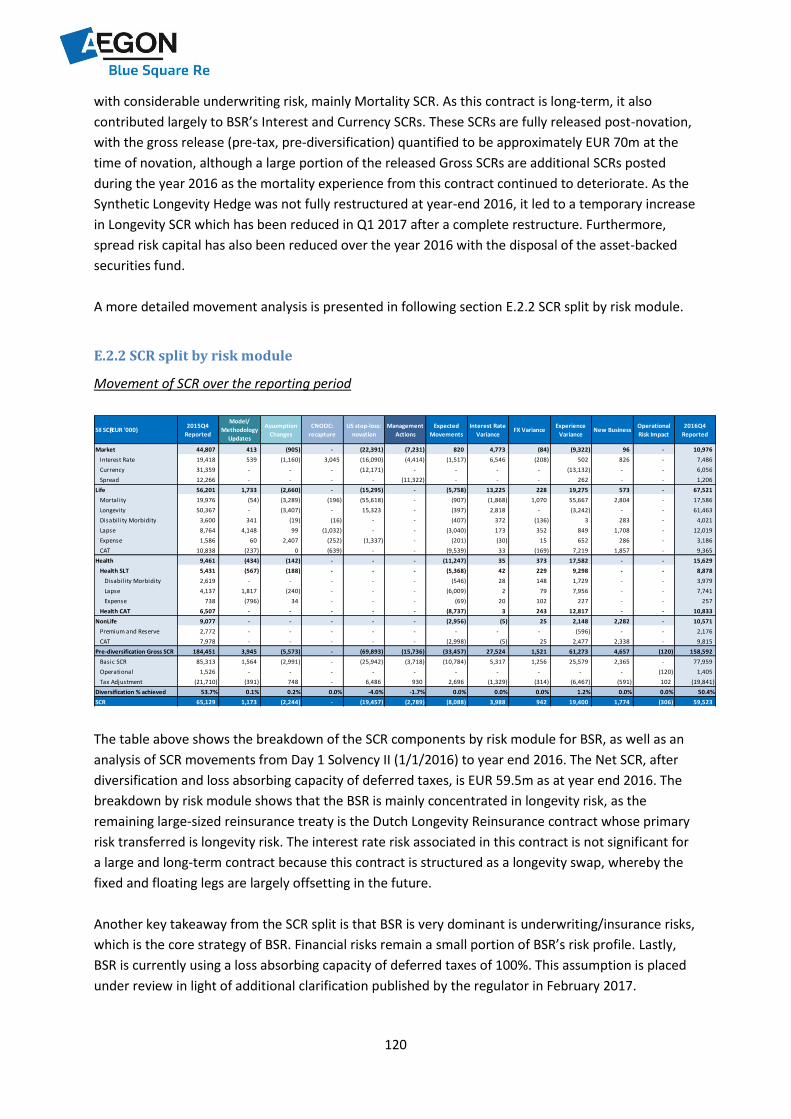
120
with considerable underwriting risk, mainly Mortality SCR. As this contract is long-term, it also
contributed largely to BSR’s Interest and Currency SCRs. These SCRs are fully released post-novation,
with the gross release (pre-tax, pre-diversification) quantified to be approximately EUR 70m at the
time of novation, although a large portion of the released Gross SCRs are additional SCRs posted
during the year 2016 as the mortality experience from this contract continued to deteriorate. As the
Synthetic Longevity Hedge was not fully restructured at year-end 2016, it led to a temporary increase
in Longevity SCR which has been reduced in Q1 2017 after a complete restructure. Furthermore,
spread risk capital has also been reduced over the year 2016 with the disposal of the asset-backed
securities fund.
A more detailed movement analysis is presented in following section E.2.2 SCR split by risk module.
E.2.2 SCR split by risk module
Movement of SCR over the reporting period
The table above shows the breakdown of the SCR components by risk module for BSR, as well as an
analysis of SCR movements from Day 1 Solvency II (1/1/2016) to year end 2016. The Net SCR, after
diversification and loss absorbing capacity of deferred taxes, is EUR 59.5m as at year end 2016. The
breakdown by risk module shows that the BSR is mainly concentrated in longevity risk, as the
remaining large-sized reinsurance treaty is the Dutch Longevity Reinsurance contract whose primary
risk transferred is longevity risk. The interest rate risk associated in this contract is not significant for
a large and long-term contract because this contract is structured as a longevity swap, whereby the
fixed and floating legs are largely offsetting in the future.
Another key takeaway from the SCR split is that BSR is very dominant is underwriting/insurance risks,
which is the core strategy of BSR. Financial risks remain a small portion of BSR’s risk profile. Lastly,
BSR is currently using a loss absorbing capacity of deferred taxes of 100%. This assumption is placed
under review in light of additional clarification published by the regulator in February 2017.
SII SCR(EUR '000)2015Q4
Reported
Model/
Methodology
Updates
Assumption
Changes
CNOOC:
recapture
US stop-loss:
novation
Management
Actions
Expected
Movements
Interest Rate
VarianceFX Variance
Experience
VarianceNew Business
Operational
Risk Impact
2016Q4
Reported
Market 44,807 413 (905) - (22,391) (7,231) 820 4,773 (84) (9,322) 96 - 10,976
Interest Rate 19,418 539 (1,160) 3,045 (16,090) (4,414) (1,517) 6,546 (208) 502 826 - 7,486
Currency 31,359 - - - (12,171) - - - - (13,132) - - 6,056
Spread 12,266 - - - - (11,322) - - - 262 - - 1,206
Life 56,201 1,733 (2,660) - (15,295) - (5,758) 13,225 228 19,275 573 - 67,521
Mortality 19,976 (54) (3,289) (196) (55,618) - (907) (1,868) 1,070 55,667 2,804 - 17,586
Longevity 50,367 - (3,407) - 15,323 - (397) 2,818 - (3,242) - - 61,463
Disability Morbidity 3,600 341 (19) (16) - - (407) 372 (136) 3 283 - 4,021
Lapse 8,764 4,148 99 (1,032) - - (3,040) 173 352 849 1,708 - 12,019
Expense 1,586 60 2,407 (252) (1,337) - (201) (30) 15 652 286 - 3,186
CAT 10,838 (237) 0 (639) - - (9,539) 33 (169) 7,219 1,857 - 9,365
Health 9,461 (434) (142) - - - (11,247) 35 373 17,582 - - 15,629
Health SLT 5,431 (567) (188) - - - (5,368) 42 229 9,298 - - 8,878
Disability Morbidity 2,619 - - - - - (546) 28 148 1,729 - - 3,979
Lapse 4,137 1,817 (240) - - - (6,009) 2 79 7,956 - - 7,741
Expense 738 (796) 34 - - - (69) 20 102 227 - - 257
Health CAT 6,507 - - - - - (8,737) 3 243 12,817 - - 10,833
NonLife 9,077 - - - - - (2,956) (5) 25 2,148 2,282 - 10,571
Premium and Reserve 2,772 - - - - - - - - (596) - - 2,176
CAT 7,978 - - - - - (2,998) (5) 25 2,477 2,338 - 9,815
Pre-diversification Gross SCR 184,451 3,945 (5,573) - (69,893) (15,736) (33,457) 27,524 1,521 61,273 4,657 (120) 158,592
Basic SCR 85,313 1,564 (2,991) - (25,942) (3,718) (10,784) 5,317 1,256 25,579 2,365 - 77,959
Operational 1,526 - - - - - - - - - - (120) 1,405
Tax Adjustment (21,710) (391) 748 - 6,486 930 2,696 (1,329) (314) (6,467) (591) 102 (19,841)
Diversification % achieved 53.7% 0.1% 0.2% 0.0% -4.0% -1.7% 0.0% 0.0% 0.0% 1.2% 0.0% 0.0% 50.4%
SCR 65,129 1,173 (2,244) - (19,457) (2,789) (8,088) 3,988 942 19,400 1,774 (306) 59,523

121
In terms of the detailed analysis of SCR movements, the values in the opening column are SCR
components as of 1/1/2016.1 The total movements consist of one-off changes (model/methodology,
assumption, major one-offs and management actions), total expected movements, economic
variance, experience variance, the total value of new business as well as operational risk impacts.
The total impact on SCR of model changes (TLB High Net Worth Mortality Reinsurance and UK
Individual Protection) as well as methodology changes (Spain household reinsurance program
premium cash flow projection and mass lapse shock adjustment) is a EUR 1.2m increase.
The assumption changes introduced to the Dutch Longevity Reinsurance, Synthetic Longevity Hedge,
UK Individual Protection and maintenance expenses decreased SCR by EUR 2.2m. China Modified
Coinsurance recapture resulted in the total release of all its gross capital components and novation of
US Stop-Loss Mortality Reinsurance led to an overall decrease in SCR of EUR 19.5m. Other
management actions that lowered SCR by EUR 2.8m consist of liquidating ABS Fund and updating the
IRS hedging structure.
The remaining variances consist of:
Expected movements
o The expected roll-forward releases capital under the best estimate projection. The
current presentation however shows too much of capital releases for contagion
scenarios over a 1-year horizon (Life and Health modules, Lapse and Catastrophe
sub-modules), and this is trued-up under the experience variance movement.
Interest rate variance
o Overall, the interest rate term structures of currencies BSR operates in decreased
throughout the year.
Currency variance
o Presented impacts come from changes in SCR components due to currency
movements. The total Currency SCR impact (excluding the impact of US stop-loss
novation) is a decrease of EUR 13.1m and is classified as experience variance.
Experience variance
o Majority of the Mortality SCR experience variance is attributed to the pre-novation
experience of US stop-loss contract. Going forward, BSR expects more stability in the
future movements of Mortality SCR due to significantly lower volatility post-
novation.
o Decrease in Longevity SCR is attributed solely to the Dutch Longevity Reinsurance
contract.
o Increase in Health SCR is explained by the incoming new business from the Direct
Marketing Products with Mitsui Sumitomo contract. The impact shown includes both
the experience of in-force and new business of policies sold through Aegon Insights.
o Increase in Non-life Catastrophe SCR is largely attributed to the additional
investment of EUR 10.0m into the insurance-linked securities fund.
1 Note: given the various level of diversification/aggregation under S-II, some rows are not additive. The focus should be on the
contribution to and movement in underlying gross capital. Rows that are a result of diversification are color-coded in blue.

122
New business
o The total capital strain of the 2016 new business is EUR 1.8m.
Operational risk impact
o Operational risk decreased over the year as a function of a lower volume of
premiums, as per Standard Formula.
Loss absorbing capacity of deferred taxes
For the assessment of loss absorbing capacity of deferred taxes (“LACDT”), BSR assesses the
differences between the IFRS balance sheet (which is a proxy for BSR tax balance sheet) against the
Solvency II balance sheet. One fundamental difference between the two balance sheets is that
current IFRS accounting employs a book value measure, that requires the deferral of future profit in
the reinsurance contracts that BSR writes, whereas the Solvency II balance sheet allows for the
recognition of the future profits under best estimate assumption, but establishes a risk margin to
reflect the uncertainty of the future profit. Specifically, the deferral of the IFRS profit is achieved
through the Deferred Revenue Liability (DRL) components included in the IFRS technical provision.
Given this is the key difference for BSR between the balance sheets under the two frameworks, IFRS
implicitly introduces some conservatism relative to the S-II balance sheet. This is due to the fact the
future profits outweigh future obligations for BSR and the same reasons the Liability Adequacy Test
produces a surplus for BSR. Consequently, under the S-II balance sheet, a Deferred Tax Liability (DTL)
of EUR 3.1m is established (instead of a DTA under IFRS), mainly for the market value adjustments
between the two balance sheets.
The assessment of LACDT is based on Article 207 of the Delegated Act. The Basic SCR and Operational
Risk SCR of BSR amounts to EUR 79.4m prior to consideration of LACDT. An immediate loss of this
magnitude will result in a potential DTA of EUR 19.8m at a tax rate of 25%. Given the existing DTL of
EUR 3.1m, a net DTA of EUR 16.8m is to be recognized. The DTA is recoverable from the future profits
in the reinsurance contracts and new business, where the value of risk margin of in-force policies,
undiscounted, for the first 10 years of projection, is EUR 45.5m.
The remaining portion of the DTA is expected to be recoverable through future profits arising from
new business opportunities in BSR as per the medium-term business plan concluded by the
Management Board in 2016Q3.
In conclusion, with the reversal in DTL which is to be expected and, above that, the major sources of
future profit of BSR, from in-force and from new business opportunities, BSR expects to have a 100%
loss absorbing capacity of deferred taxes. Furthermore, other less material sources of profits such as
the expected return of residual Own Funds after shock, additional real world investment returns and
any other sources of potential income will further add to the qualification of the DTA recoverability
test.
BSR is in the process of reviewing the Q&A published by DNB in early February 2017 and expects to
confirm our position before 2017Q2 as recommended in the Q&A.

123
SCR and MCR
The SCR position as at FY 2016 of EUR 59.5m partially includes the capital requirement for the
redundant US mortality risk exposure that remains in the Synthetic Longevity Hedge after the
novation of the underlying US stop-loss mortality contract. Final discussions with all counterparties
could not be completed in time by year-end as the discussions are bilateral in nature. As at February
2017, the hedge is completely restructured, and will reduce the SCR.
The MCR is 25% of SCR and amounts to EUR 14.9m.
E.2.3 Simplified calculations
BSR does not apply simplified calculations for calculating the Standard Formula SCR.
E.2.4 Undertaking- specific parameters (Article 104(7) of Directive 2009/138/EC)
BSR does not apply undertaking-specific parameters as defined in article 104(7) of the Directive
2009/138/EC for calculating the Standard Formula SCR.
E.2.5 Article 51(2) of Directive 2009/138/EC
In the implementation of the Directive 2009/138/EC in the Dutch Financial Supervision Act, the
Netherlands has made use of the Member State option provided for in article 51(2) of the Directive
2009/138/EC.
E.2.6 Minimum Capital Requirement
The MCR for reinsurer is calculated by aggregating a prescribed percentage of total capital at risk
with the sum, across all lines of business, of a defined percentage of net technical provisions,
excluding the risk margin for that line of business.
In the case of BSR, the resulting calculation, known as the linear MCR, turns out to be EUR 8.9m
which is lower than the floor level of 25% of SCR. As a result, the year-end 2016 MCR of BSR is set to
the floor level of EUR 14.9m.
E.3 Use of the duration-based equity risk sum-module BSR does not make use of the duration-based equity risk sub-module set out in article 304 of
Directive 2009/138/EC for the calculation of the Standard Formula SCR.

124
E.4 Differences between standard formula and partially internal model used This is not applicable to BSR as BSR fully uses the Standard Formula for the calculation and
aggregation of all applicable risk modules.
The appropriateness of Standard Formula is described in the annual ORSA.
E.5 Non-compliance with capital requirements There has not been any instance during 2016 that the BSR Solvency II ratio was below the SCR, nor
the MCR level. To ensure that BSR maintains adequate solvency levels, actual and expected capital
positions are monitored against capitalization zones that are defined in BSR’s Capital Management
Policy. Several activities are performed to monitor and assess the future development of BSR’s
solvency position, such as the annual budgetting and Medium Term Planning (MTP) process and
periodic management reporting, including analysis on the movements in Own Funds and SCR on a
quarterly basis.
Decisions to return capital to shareholders are based on Solvency assessments that look into the
impact of the decisions on the current and future projected Solvency position.
Any Solvency position is subject to risks and BSR therefore constantly monitors such risks. These are
quantified to determine the impact of such risks on the current and the projected Solvency position.
The Capital Management Policy provides actions that need to be performed as soon as the identified
risks could cause the projected Solvency ratio to fall within a particular capitalization zone.
As described in the business planning period, the base scenario of the business planning period
projects BSR to fall below the target capitalization zone as BSR continues to write new business, but
that is because the business planning period does not include any capital injection to BSR to support
the writing of new business. In an internal reinsurance transaction, it is reasonable to expect capital
released from the cedant to be reallocated to BSR who then assumes the reinsured risks.
E.6 Any other information All relevant information regarding the capital management of BSR have been described throughout
section E. Capital Management.
G-SII designation
On November 3, 2015, Aegon Group was first designated by the Financial Stability Board (FSB) as a
Global Systemically Important Insurer (G-SII), based on an assessment methodology developed by the
International Association of Insurance Supervisors (IAIS). The FSB annually reviews the G-SII
designation and Aegon Group continues to be designated at the time of publication of the Solvency
and Financial Condition Report. Blue Square Re provides data to support its Global Parent Aegon N.V.
and therefore it is subject to enhanced group supervision.
As a result of the G-SII designation, Aegon Group is subject to an additional layer of direct supervision
at Group level. Aegon has put a specific G-SII governance structure in place to ensure the G-SII
125
requirements are met. Within 12 months of a G-SII designation, G-SIIs are required to develop a
liquidity risk management plan, a systemic risk management plan and an ex-ante recovery plan.
In accordance with these requirements, Aegon Group submitted these plans to DNB and to the G-SII
crisis management group (CMG), which was established for Aegon Group. CMG is required: to
establish a crisis management group (within 6 months of G-SII designation); to enter into a cross-
border cooperation agreement; to develop a resolution plan based on a resolution strategy (within
18 months); and to undertake a resolvability assessment (within 24 months).
As of 2016, G-SIIs have calculated and reported a Basic Capital Requirement (BCR) and Higher Loss
Absorbing Capacity (HLA) on a confidential basis pursuant to IAIS guidelines. Furthermore, the IAIS is,
at the time of publication of Aegon’s 2016 SFCR, consulting on an International Capital Standard (ICS),
with the plan being to adopt ICS Version 1.0 for confidential reporting in mid-2017.