blueprint for an eu cycling strategy for a eucs_draft... · blueprint for an eu cycling strategy -...
TRANSCRIPT

Page 1/99
Blueprint for an EU Cycling Strategy
Draft version – March 2017

Blueprint for an EU Cycling Strategy - Introduction
Page 2/99
Table of content
Table of content ...................................................................................................................................... 2
Preface ..................................................................................................................................................... 4
Introduction ............................................................................................................................................. 5
Chapter 1 - The State of Cycling and Potential for Growth ..................................................................... 9
1.1 The Current State of Cycling .......................................................................................................... 9
1.2 The Growth Potential for Cycling by 2030 .................................................................................. 13
Chapter 2 - Benefits of Cycling and their contribution to EU Policy Goals ........................................... 23
Summary ........................................................................................................................................... 23
2.1 Benefits to the Economy, Environment, Energy, Climate & Natural Resources ......................... 23
2.2 People: Health, Well-being, Social & Cultural Affairs .................................................................. 26
2.3 More Livable Cities: Mobility, Technology & Urban design ........................................................ 27
Conclusion ......................................................................................................................................... 28
Annex: ................................................................................................................................................ 29
Chapter 3 - Behavioural Change ............................................................................................................ 30
Summary ........................................................................................................................................... 30
3.1 Convince Decision-Makers to Support Cycling ........................................................................... 30
3.2 Facilitate the Cooperation Among Road Users for Safer Cycling ................................................ 32
3.3 Encourage Citizens to Cycle More ............................................................................................... 36
Chapter 4 - Cycle Infrastructure ............................................................................................................ 39
Summary ........................................................................................................................................... 39
4.1 Infrastructure Guidance .............................................................................................................. 39
4.2 EuroVelo and Other Cycle Route Networks ................................................................................ 40
4.3 Ensuring Safer Infrastructure for Cyclists .................................................................................... 42
4.4 Cycle Parking ............................................................................................................................... 45
Chapter 5 - Vehicle Regulation .............................................................................................................. 47
Summary ........................................................................................................................................... 47
5.1 Vehicle safety .............................................................................................................................. 47
5.2 Bicycle Technical Standards ........................................................................................................ 49
5.3 Pedelec/EPACs, Speed EPAC Regulation ..................................................................................... 51
5.4 Automated and Autonomous Vehicles and Cyclists .................................................................... 53
Chapter 6 - Achieving Global Policies through Cycling .......................................................................... 56
Summary Cycling implements global policies on a local level .......................................................... 56
6.1 Status Quo on Global Policies: what’s in it for Cycling in the EU? .............................................. 56
6.2 The Status Quo: How does the EU use the global agendas to promote cycling worldwide? ..... 58
6.3 The proposed changes: Recommendations to change activities ................................................ 59
Chapter 7: A Financial + Fiscal Level Playing-Field for Cycling with Other Modes of Transport ........... 62

Blueprint for an EU Cycling Strategy - Introduction
Page 3/99
Summary ........................................................................................................................................... 62
7.1 Subsidies for Cycling .................................................................................................................... 63
a. Funding for Investments in Cycling ............................................................................................... 63
b. Financial incentives for purchasing electric bicycles ..................................................................... 65
7.2 Cycling Friendly Public Procurement ........................................................................................... 66
7.3 Cycling Friendly Taxation Systems............................................................................................... 67
a. Pro-cycling Personal Income and Corporate Tax Regulations ................................................... 67
b. VAT on bike sales, bike repair ....................................................................................................... 69
7.4 Internalisation of External Costs of Car Driving .......................................................................... 70
a. Congestion charges ....................................................................................................................... 70
b. Fuel taxes ....................................................................................................................................... 71
7.5 Cycling-friendly competition and trade policy measures ............................................................ 73
Chapter 8 - Intermodality and Intelligent Transport Systems (ITS) ....................................................... 77
Summary ........................................................................................................................................... 77
8.1 Smart Cycling, ITS and Digital Agenda ......................................................................................... 78
8.2 Passenger Rights .......................................................................................................................... 81
Chapter 9: Governance ......................................................................................................................... 84
Summary ........................................................................................................................................... 84
9.1 Cycling Check in Policies and Inter-Service Consultation ............................................................ 85
9.2 Cycling Focal Point ....................................................................................................................... 86
9.3 Cooperation with THE PEP, National Focal Points and Stakeholders.......................................... 87
9.4 Cycling Clearing House and Expertise Centre .............................................................................. 88
9.5 Cycling Friendly Institutions as a Role Model .............................................................................. 89
Chapter 10 – Monitoring and evaluation .............................................................................................. 91
Summary ........................................................................................................................................... 91
10.1 Policy Evaluation ....................................................................................................................... 91
10.2 Monitoring Through Key Performance Indicators..................................................................... 92
10.3 Common Definitions for Data Collection .................................................................................. 97
10.4 Develop Methods for Harmonisation and Improve Synergy among Data Collection Initiatives
........................................................................................................................................................... 98
10.5 Stimulate + Harmonise Data Crowdsourcing and Use Possibilities of Big Data Collection ....... 99

Page 4/99
Preface
This present draft blueprint document for an EU Cycling Strategy is the first time ever that, in a consolidated manner, all EU policies that have a direct or indirect link to cycling, have been collected in one single document. In an intensive and collaborative approach over the past 9 months, this draft blueprint document has been structured around 1 0 chapters, each describing
The status quo of cycling in relevant policy fi eld
The status quo of cycling in relevant EU policy
Policy recommendations for the EU, national and local levels
EU added value The bicycle is usually considered as a tool for short-distance commuting, shopping, leisure and social tr ips, hence primarily asking for the support of local and regional authorities. Yet local, regional governments operate within the context that the national and European level provide in terms of regulation, funding, capacity building, knowledge exchange about best practices etc. It can work both ways: reinforcing local, regional action or seriously undermining it. While about half of EU Member States have stepped up and provided that leadership by adopting a national cycling strategy , however, so far the EU is lacking a strategic vision and coordinated actions in favor of cycling . Without coordination the isolated actions wil l not contribute effectively to improve the conditions for cycling or will even make the conditions worse (unintentionally). We want to thank all expert group members and other stakeholders that have come together in the campaign for an EU Cycling Strategy and provided content fo r this draft blueprint document!
EU Cycling Strategy Campaign - Mission
“‘Encouraging more people to cycle more often’ across the EU has the potential to unlock socio-
economic benefits worth billions of Euros. Stakeholders from diverse backgrounds have therefore
joined forces to develop a blueprint for an EU Cycling Strategy which will recommend objectives
and define actions falling within EU competence. Published at the Velo-city 2017 conference in
June it will then be submitted to the European Commission as a new inspiration for action.”
Adam Bodor Fabian Küster ECF Advocacy Director ECF Senior Policy Officer

Page 5/99
Introduction
This introduction entails four parts:
Overall policy objectives
Why the EU should act
Call for an EU Cycling Strategy from EU institutions and other stakeholders
Roadmap
Overall policy objectives for the EU Cycling Strategy
The expert group elaborating this blueprint document have identified 4 key objectives for the EU Cycling Strategy with horizon 2030 . 1) Cycling should be an equal partner in the mobility system. Users pay for the full external costs of motorised transport while the societal benefi ts of active mobil ity are fully taken into account in transport planning and investment decisions. In addition, it will show the path towards priorit ising cycling over individual motorised transport. 2) Cycle use in the EU will increase by 50% in the decade from 2019/2020 – 2030. Its share in the transport modal split will be at least 1 2 % which means 0.48 cycle trips per person per day as an average. 3) The rates (per km cycled) for fatalit ies and seriously injured among cyclists wil l be halved in the decade 2019/2020 – 2030. 4) The EU should double its investments in cycle projects to 3 bil lion Euro during the Multiannual Financial Framework 2021 – 2027 (up from 1.5 bil lion Euro in 2013 - 2020) and aim for another doubling to 6 bill ion Euro during the 2028 – 2034 period.
Why the EU should act:
The EU should take action for at least three reasons: 1. COMPETENCE The treaties have given the EU a mandate to take action in a number of policy f ields relevant to cycling. Prominent examples that call for stron ger EU engagement include:
Cohesion policy, Horizon 2020, Trans -European Transport Network (TEN -T): Identify EU policy and funding instruments that are already mobilized or that should be mobil ized to increase cycling’s mode share 1 (about 1.5bn Euro of EU funds will be invested in cycling infrastructure during between 2014 - 20202);
Facilitate the exchange of best practices in fields where the EU has a ’soft’ competence , including on urban mobility, tourism, public health, Corporate Social Responsibil it y…
3;
1 ‘Declaration on cycling as a climate friendly transport mode’, Action plan, point 2.
2 According to estimations by DG REGIO
3 ‘Declaration on cycling as a climate friendly transport mode’, Action plan, point 3.

Blueprint for an EU Cycling Strategy - Introduction
Page 6/99
Use the EU’s legal competence to propose legislation, in particular at aiming to make motorized vehicles safer for pedestrians and cyclists as part of the General Safety Regulation revision.
2. SCALE AND EFFECT Article 5-3 TEU on subsidiarity stipul ates that the EU “shall act if and in so far as the objectives of the proposed action cannot be sufficiently achieved by the Member States, either at central level or at regional and local level, but can rather, by reason of the scale or effects of the proposed action, be better achieved at Union level”. Scale: Half of the EU (adult) population does cycle, 8% uses the bicycle as its primary mode of transport. The latter figure differs tremendously across Europe: from 36% in the Netherlands to 0% in Malta and 1% in Cyprus and Portugal. 2,112 cyclists were ki lled on European roads in 2014, representing 8 .1% of all road fatalities , which needs to be adressed on the European level. Effect: The economic benefits of cycling have been valued at €513b i l l ion and 650,000 jobs. Doubling cycling would posit ively impact the Commission Priority “Jobs, growth and investments” : Create another 400,000 employments in local economies, ease congestion, foster a healthier and more productive workforce. 42% of car trips could be shifted to (e-)cycling, hereby contributing to Priority “Energy and Climate” and the GHG emission reduction target for the transport sector (60% by 2050). The full socio-economic and environmental benefits of cycling can only be unlocked if there is an coordinated approach at European level that legislates where it has competence, identifies and exchanges best practice and builds capacities at those local, regional and national authorit ies that currently lack behind. 3. A LEVEL-PLAYING FIELD FOR CYCLING WITH OTHER TRANSPORT MODES Many policies, both at national and European level, have historically favoured the use of cars or overlooked cycling. An EU Cycling Strategy would increase coordination as well as the status and visibil ity of cycling both withi n Commission services and to the outside world, for example in the formulation of e -mobility policies, the digital agenda, ITS and ‘Smart Cities’, fiscal stimuli, public procurement, etc.
Call for an EU Cycling Strategy from EU institutions and other stakeholders
Various EU institutions have called upon the European Commission to develop an EU Cycling Strategy, including: The informal Council meeting of Transport Ministers of the EU -28 Member States endorsed the ‘Declaration on cycling as a cl imate friend ly transport mode’ during the Luxembourg EU Presidency (7 October 2016). 4 The Declaration included 3 action points with regards to the European level:
i. Integrate cycling into multimodal transport policy, including smart mobility, stressing the need to promote physical infrastructure and behavioural change programs.
4 http://www.eu2015lu.eu/en/actualites/communiques/2015/10/07-info-transports-declaration-velo/07-Info-Transport-Declaration-of-Luxembourg-on-Cycling-as-a-
climate-friendly-Transport-Mode---2015-10-06.pdf
Blueprint for an EU Cycling Strategy - Introduction
Page 7/99
i i. Develop an EU level strategic document on cycling. This strategic document should (1)
l ist all the goals within EU competence that would benefit from an increase in cycling’s mode share, (2) identify EU policy and funding instruments that are already mobilized or that should be mobil ized to increase cycling’s mode share and to foster cycling related employment in the EU, and (3) include cycling in the above EU policies and funding instruments.
i i i. Set up a European focal point for cycling (1) to serve as a one -stop-shop for cycling
related questions, (2) to facil itate the exchange of best practices among Member States, notably on cyclists’ road safety, and (3) to monitor the implementation and the impact of the EU strategy for cycling.
The European Parliament ’s response to the European Commission’s mid -term review of the 2011 Transport White Paper, calling for ’an EU roadmap for cycling to be included in the Commission Work Programme 2016’ 5 (September 9, 2015) The Committee of the Regions adopted its own-initiative report for an ‘EU Roadmap for Cycling’ (October 12, 2016). 6 More than 80 public and private entities have already expressed their sup port for an EU Cycling Strategy (State: March 8, 2017 ).
Roadmap – EU Cycling Strategy
This draft blueprint document for an EU Cycling Strategy has been put together by an expert group of approximately 25 experts, representing 13 governmental and non -governmental organisations, academia and business represen tations (see l ist below). In addition, input was collected over the past 9 months from a much wider set of stakeholders through various channels: chapter feedback groups, 5 public events/ workshops and a survey in which more than 630 people and organisations from 37 countries participated . The recommendations of the own-initiative report of the Committee of the Regions on “An EU Roadmap for Cycling” were also taken into account. WHAT HAS HAPPENED SO FAR?:
June 22, 2016: Cycling Forum Europe breakfast meeting
September 14, 2016: EU Cycling Strategy kick-off event “Cycling into the future”
September 29, 2016: Stakeholder workshop at CIVITAS conference
September 28 – November 6, 2016: Public survey (results: here)
October 12, 2016: Adoption of the Committee of the Regions opinion on “An EU Roadmap for Cycling”
November 25, 2016: 1st Expert Group Meeting
December 6, 2016: Cycling Forum Europe Bikeconomics event
January 24, 2017: 1 s t Workshop ECF – European Union Cycl ing Group
February 14, 2017: 2nd Expert Group Meeting
February 20, 2017: Public event on behavioural change (Bike2Work)
March 13, 2017: 2 nd ECF – European Union Cycling Group
5 2015/2005(INI), EP Plenary vote on September 9, 2015.; https://ecf.com/news-and-events/news/european-parliament-approves-eu-roadmap-cycling-its-plenary-session 6http://cor.europa.eu/en/activities/opinions/pages/opinion-factsheet.aspx?OpinionNumber=CDR%201813/2016’’
Blueprint for an EU Cycling Strategy - Introduction
Page 8/99
WHAT IS GOING TO HAPPEN?:
March 20 – April 10, 2017: Draft version of EU Cycling Strateg y blueprint document online for public consultation
April 25, 2017: 3rd Expert Group Meeting
May 2017: 4th Expert Group Meeting
June 13 – June 16, 2017: Publication and public hand -over of EU Cycling Strategy to EU Commissioner for Transport, Violeta Bulc, at Velo-city 2017 conference in Arnhem-Nijmegen.
ORGANISATIONS REPRESENTED IN EXPERT GROUP
Catholic University Leuven, Belgium
CONEBI - Confederation of the European Bicycle Industries
CROW, Netherlands
Danish Cycling Embassy
Department of Transport - Ministry of Sustainable Development and Infrastructure of Luxembourg
ECF - European Cyclists' Federation
EPHA - European Public Health Alliance
ETSC - European Transport Safety Council
GIZ - German Development Agency
Green Budget Europe
Ministry of Environment, Austria
Ministry of National Development, Cycling Coordination Department, Hungary
Polis
Transport for London, UK
UCI – Union Cycliste Internationale OBSERVER STATUS:
European Commission, DG MOVE N.B. All views and recommendations expressed in this draft blueprint EU Cycling Strategy do not necessarily reflect those of our expert group members and other consulted stakeholders.

Page 9/99
Chapter 1 - The State of Cycling and Potential for
Growth
This chapter will discuss two items: 1. The current state of cycling in the EU -28 with regards to cycle use, fatalities, bicycle
sales and production 2. The growth potential for cycling by 2030
1.1 The Current State of Cycling
Cycle use in the EU-28
The exact cycling mod e share in the transport modal split is unknown. Eurostat used to collect and publish figures on cycle use until 2003, however ended its data collection in 2004 when 10 new countries became EU members. The reason for this is most likely the lack of availab le data in these new Member States. The only source to enable reliable comparisons and conclusions is the Eurobarometer (EB) transport survey from 2007, 2010 and 2014. People were asked the question: “On a typical day, which mode of transport do you use mo st often?”
In 2014, 8% of respondents of EB 422 replied ‘bicycle’ (compared to 8.6% in 2007 and 7.4% in 2010). The figures varied in the 2014 EB between 36% in the Netherlands to 0% in Malta and 1% in both Cyprus and Portugal. Women and men were found to cycle to the same extent, namely 8%. In regard to age groups, the category 15 – 24 cycles most at 11%, whereas age groups 25 – 39 and 40 – 54 each came in at 7%; age group 55+ again saw a sl ight increase: 8%.
0
5
10
15
20
25
30
35
40
45
CY PT IE EL LU ES UK BG FR EE HR IT LV AT LT PL RO SK EU CZ SI DE BE FI SE HU DK NL
On a typical day, which mode of transport do you use most often?
2007 2010 2014

Blueprint for an EU Cycling Strategy – Chapter 1 - The State of Cycling and Potential for Growth
Page 10/99
ABOUT HALF THE EUROPEAN POPULATION CYCLES Another Eurobarometer 7 surveyed how often respondents used different modes of transport. Here 12% answered “least once a day”, 17% “a few times a week” and 20% “a few times a month or less”. 50% replied they never did. We conclude that on a European average , 0.32 bicycle trips are made per adult person per day. Once more, the Netherlands leads the chart with 43% saying they cycled at least once a day; only 13% replied they would never cycle. The EB also found a clear age gap, with 64% of the category 15 – 24 found to be cycle users compared to 37% among the 55+.
AVERAGE CYCLE TRIP DISTANCE The European Commission website cites a 1998 OECD report which found that in European countries the average cycle trip distance was around 3 km. 8 According to the same report, between approximately 30% and 40% of the km cycled is travelled on home -work trips, whereas home-leisure trips cover about 20-45% of the person km. 9 CYCLE TOURISM, LEISURE AND SPORT TRIPS Bicycles can be used for tourism and leisure as well. Ac cording to a study commissioned by the European Parliament, 2.3 billion cycle tourism day trips are undertaken per year in Europe, and 20.4 mil lion cycle trips include overnight stays. 10
7 Eurobarometer 406 (2013) Attitudes of Europeans towards urban mobility. 8https://ec.europa.eu/transport/road_safety/specialist/knowledge/pedestrians/references_en#ref_34_OECD_1998; European countries included in the OECD report: UK, Siwtzerland, Denmark, Sweden, the Netherlands. 9https://ec.europa.eu/transport/road_safety/specialist/knowledge/pedestrians/pedestrians_and_cyclists_unprotected_road_users/walking_and_cycling_as_transport_modes_en
10 Richard Weston et al., ed. Marc Thomas, ed. assistance Nóra Révész, The European Cycle Route Network EUROVELO study (Directorate General for Internal Policies Policy Department B: Structural and Cohesion Policies – Requested by
0
5
10
15
20
25
30
35
Frequency per category
At least one a day A few times a week A few times a month or less
Blueprint for an EU Cycling Strategy – Chapter 1 - The State of Cycling and Potential for Growth
Page 11/99
ECF estimates that currently about 134 billion km are cycled every ye ar in the EU. 11
Road safety
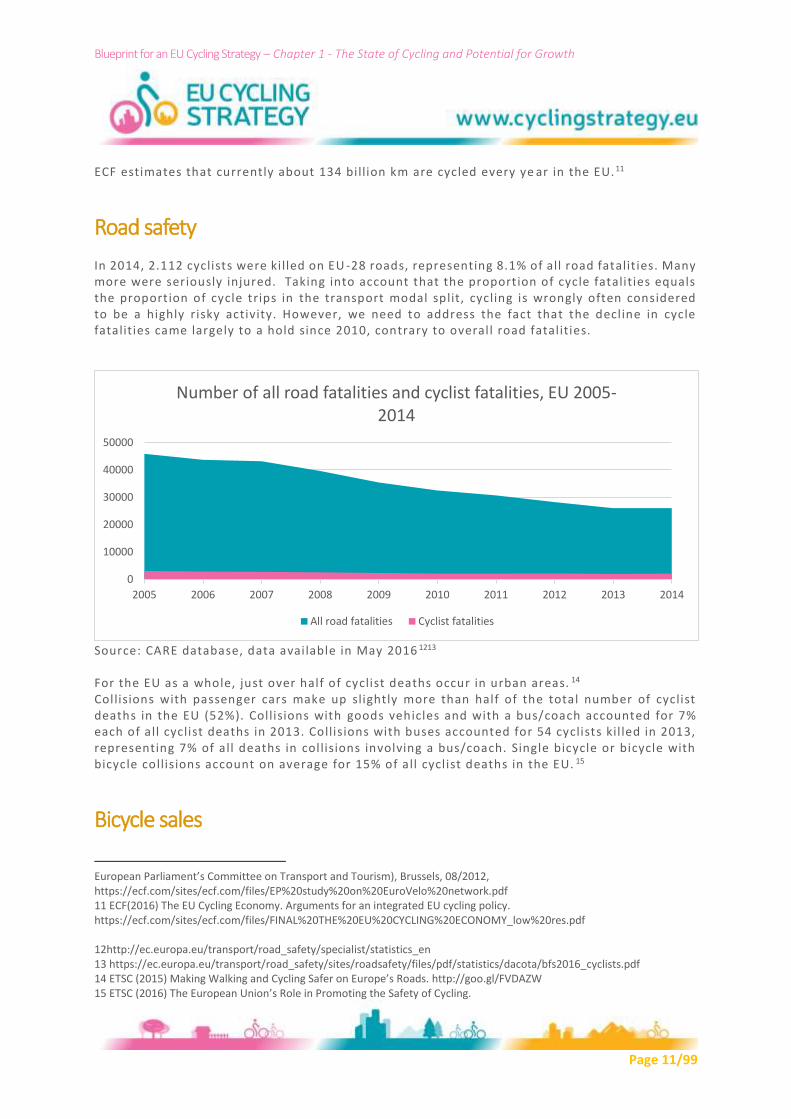
In 2014, 2.112 cyclists were ki lled on EU -28 roads, representing 8.1% of all road fatalit ies. Many more were seriously injured. Taking into account that the proportion of cycle fatalities equals the proportion of cycle trips in the transport modal split, cycling is wrongly often considered to be a highly risky activity. However, we need to address the fact that the decline in cycle fatalities came largely to a hold since 2010, contrary to overall road fatalities.
Source: CARE database, data available in May 2016 1213 For the EU as a whole, just over half of cyclist deaths occur in urban areas. 14 Collisions with passenger cars make up slightly more than half of the total number of cyclist deaths in the EU (52%). Collisions with goods vehicles and with a bus/coach accounted for 7% each of all cyclist deaths in 2013. Collisions with buses accounted for 54 cyclists kil led in 2013, representing 7% of all deaths in collisions involving a bus/coach. Single bicycle or bicycle with bicycle collisions account on average for 15% of all cyclist deaths in the EU. 15
Bicycle sales
European Parliament’s Committee on Transport and Tourism), Brussels, 08/2012, https://ecf.com/sites/ecf.com/files/EP%20study%20on%20EuroVelo%20network.pdf 11 ECF(2016) The EU Cycling Economy. Arguments for an integrated EU cycling policy. https://ecf.com/sites/ecf.com/files/FINAL%20THE%20EU%20CYCLING%20ECONOMY_low%20res.pdf 12http://ec.europa.eu/transport/road_safety/specialist/statistics_en 13 https://ec.europa.eu/transport/road_safety/sites/roadsafety/files/pdf/statistics/dacota/bfs2016_cyclists.pdf 14 ETSC (2015) Making Walking and Cycling Safer on Europe’s Roads. http://goo.gl/FVDAZW 15 ETSC (2016) The European Union’s Role in Promoting the Safety of Cycling.
0
10000
20000
30000
40000
50000
2005 2006 2007 2008 2009 2010 2011 2012 2013 2014
Number of all road fatalities and cyclist fatalities, EU 2005-2014
All road fatalities Cyclist fatalities

Blueprint for an EU Cycling Strategy – Chapter 1 - The State of Cycling and Potential for Growth
Page 12/99
The EU bicycle sales market has been remarkably stable over the past 12 years or so in terms of quantity, with about 20 mil lion bicycles being sold every year. 16
However, the electric bicycle market has seen strong growth figures over the past 10 years, with sales growing at an average annual rate of 16% in the period 2013 – 2015. That year 1.325 million electric bicycles were sold, bringing the total stock to about 6.5 mill ion units in the EU by the end of 2015.
In absolute figures, Germany is the biggest market, with 605,000 electric bicycles being sold in 2015, bringing the total stock to about 2.6 mill ion units. 17 In relative terms, Belgium leads the market with 39.2% of all bicycles sold in 2016 coming with electric assistance (186,000 units). 18
16 Conebi (2016) Market report analysis 2016 edition. 17 In 2016, 605,000 e-bikes were sold in Germany, 13 % more than in 2015. http://www.bike-eu.com/sales-trends/nieuws/2017/3/german-market-follows-e-bike-trend-less-volume-high-turn-over-10129222?utm_source=Vakmedianet&utm_medium=email&utm_campaign=20170307-bikeeurope-std&tid=TIDP169547X483B79CD736A4183B0398243C0F83B88YI4 18 https://www.becycled.be/magazine/belgische-fietsverkoop-2016-elektrische-fiets-damesfietsen/
0
5000000
10000000
15000000
20000000
25000000
2000 2001 2002 2003 2004 2005 2006 2007 2008 2009 2010 2011 2012 2013 2014 2015
European Bicycle Sales
European Bicycle Sales
0
200,000
400,000
600,000
800,000
1,000,000
1,200,000
1,400,000
2007 2008 2009 2010 2011 2012 2013 2014 2015
Electric bicycle sales in Germany and in the EU-28
Electric bicycle sales in Germany Electric bicycle sales in the EU-28

Blueprint for an EU Cycling Strategy – Chapter 1 - The State of Cycling and Potential for Growth
Page 13/99
Bicycle and parts manufacturing
12 Million bicycles, 1.1. Mil lion Pedal -Assist E-bikes and €1.5 bil lion worth of Bicycle Parts and Accessories were produced in Europe, representing a market share of 61% for EU produced bikes and EPACs and 50% of the market value of parts (total value: €3 bill ion). The EU industry saw erosion of its market share in Europe over a thirty -year cycle due to low cost imports from Asia which has captured a significant market share, especially in lower cost bikes distributed through mass market retailers. This led to a reduction of European businesses and investment. However this trend has been reversed in the past few years with new market entrants and industrial investments which have given EU manufacturers market leadership in some sectors and encouraged global leaders to invest within the EU instead of Asia. Since 1993 the EU industry has benefitted from European Commission antidumping mea sures against the unfair competition from China’s exporters of bicycles and has successfully had the measures renewed, along with anti -circumvention measures applied to some other countries. With this protection the EU bicycle industry has stabil ised loss of market share to Chinese producers and been able to maintain a critical mass of manufacturing in the EU, unlike countries like the USA and Japan that have lost almost al l local manufacturing in the same time period. This market leadership is particularl y strong in urban bikes and now in the pedal assisted electric bike category where a stable regulatory regime and strong market conditions have been created by government interventions.
1.2 The Growth Potential for Cycling by 2030
What wil l be the state o f cycling in the European Union in 2030? Despite that it is impossible to predict precisely, a number of societal (mega)trends in combination with stakeholder needs and technological developments provide us with information, both in terms of opportunities and threats, as to where cycling mobility is heading. Growing cycling - not only in terms of kilometres cycled or number of trips, yet also in terms of increasing the modal share in the transport modal split – is at the expense of other forms of transportation. It is the stated policy objective of many political stakeholders, in particular at city level, to reduce the overall share of car trips. Therefore, to what extent can cycling realistically grow, in particular at the expense of car driving? We anal ysed the trends and defined three possible scenarios depending the activities of the public sector especially on the European level. Note well, every next scenario includes the efforts of the former ones.
Scenario 1: Europe without an EU Cycling Strategy - individual efforts from member states, regions and cities
1. Assumptions: a. Committed national, regional and local stakeholders whom already invest in wil l
continue their efforts. b. The EU institutions continue to support cycling on the current level, however will
not increase their activity level nor enhance their coordination efforts. 2. Achievable level of cycling by 2030: +25% growth:

Blueprint for an EU Cycling Strategy – Chapter 1 - The State of Cycling and Potential for Growth
Page 14/99
a. 10% of the European Citizens choose cycling as their main daily transport mode. b. 0.4 trips per day wil l be made by bicycle by a n average EU adult cit izen.
3. Feasibil ity, consequences: a. This scenario does not require any further effort from the EU institutions, but does
not make use of the EU’s coordination potential to increase impact vis -à-vis cycling related measures.
b. Member states, regions and cities merely rely upon their national initiatives and expertise, hence limiting the exchange of knowledge and effectiveness.
c. The cycling industry and non-governmental sector should increase its efforts, however due to their l imited resources and the non-favourable environment for cycling, the achievement of cycling objectives is at risk.
d. The option of a passive “EU” in this field can lead to severe damages at certain fields in the “cycling environment” (see details at trends).
Scenario 2: EU Cycling Strategy accepted and implemented to provide level playing field for cycling
1. Assumptions: a. The EU institutions will increase their support for cycling and wil l coordinate, both
horizontally and vertically, better guided by the EUCS. b. The EUCS will create a stronger commitment to cycling investment from national,
regional and local stakeholders. 2. Achievable level of cycling by 2030: +50% growth:
a. 12% of the European Citizens will chose cycling as their main mode of daily transport.
b. 0.48 trips per day wi ll be made by bicycle by an average EU adult cit izen. 3. Feasibil ity, consequences:
a. Because this scenario attempts to establish a level playing -field for cycling, it is realistic and feasible to gain sufficient support on all levels of governance to support and implement The EUCS.
b. This scenario does require further efforts from the EU institutions, however delivers its results mainly through coordination.
c. Member states, regions and cities can use the best available knowledge and can count on the support of th e EU institutions. This motivates, in particular, stakeholders that were not investing in cycling related measures to a sufficient degree.
d. The cycling industry and non -governmental sector can benefit from a “cycling friendly environment”.
Scenario 3: In addition to pro-cycling activities, restrictive measures are applied to individual motorised transport. Sustainable modes of transport are prioritized.
1. Assumptions: a. The EU institutions significantly increase their support for cycling and propose/apply
restrictive measures directed at individual motorised transport (based on the internalisation of external costs).

Blueprint for an EU Cycling Strategy – Chapter 1 - The State of Cycling and Potential for Growth
Page 15/99
b. The EUCS will bring about stronger committed national, regional and local stakeholders whom invest in cycling and restrict individual motorised tra nsport.
2. Achievable level of cycling by 2030: +100% growth: a. 16% of the European Citizens will chose cycling as their main mode of daily
transport. b. 0.64 trips per day will be made by bicycle by an average EU adult cit izen.
3. Feasibil ity, consequences a. This scenario requires strong political commitment to prioritise cycling (sustainable
transport) over other modes of transport. Every level needs to accept and implement measures.
b. This scenario necessitates significant efforts from the EU institutions. It delivers results mostly through means of coordination, however not by more direct subsidy, but by changing investment priorities, regulations and strong recommendations.
c. Member states, regions and cities can use the best available knowledge. They can count on the support of the EU institutions when they would like to prioritise sustainable modes of transport.
d. Cycling industry and non -governmental sector can benefit from a “cycling friendly environment” and the increased use cycling.
The abovementioned scenarios o f course depend on external factor as well, they are not determined by the public sector decisions alone. The scenarios wil l be explained in greater detail later in this chapter. To highlight how the scenarios are related to the trends, we prepared the fol lowing table:
No EUCS EUCS approved
Priority for cycling
Healthy lifestyle + ++ +++
Urbanisation + ++ +++
MaaS + ++ +++
Importance of environment + ++ ++
EPACs + ++ +++
New bikes + + +
Innovative infrastructure for cyclists + ++ +++
Autonoumous cars - 0 ++
Price signals to customers - 0 ++
Behavior - image of cycling + + ++
Growth in cycling by 2030: +25% +50% +100%
+, ++ or +++ this trend/situation has positive impact on cycling 0 – this trend has no impact on the level of cycling - This trend has / can have negative impact on cycling in case of that specific scenario. The current EUCS describes the necessary activit ies to achieve the second scenario and will show the path how to achieve the 3 r d more ambitious objectives. The most committe d stakeholders can already take the more ambitious actions (not written in details in the current EUCS, but which will be highlighted in the next version of the EUCS). To highlight the background of the trends this sub -chapter will consist of four parts:
The wider framework: trends, drivers, technology
Blueprint for an EU Cycling Strategy – Chapter 1 - The State of Cycling and Potential for Growth
Page 16/99
Cycle innovations
The potential for shift ing motorized trips to cycling
Uncertainties and potential barriers to cycling mobility
The wider framework: trends, drivers, technology
The EU-funded project Mobil i ty4Europe19 aims to develop an “Action Plan for the Future of Mobil ity in Europe” in 2030. It has identified 8 of such wider trends, with some of them also having an impact on cycling mobil ity, including: INCLUSIVE SOCIETY, PERSONALIZATION AND ACCESSIBILITY ‘Healthy l ifestyles’ is one of the drivers identified. A healthy l ifestyle will be needed more than ever, considering the huge cost that a lack of physical activity brings to Europe’s health care systems. Numerous studies have come to the conclusion that a large segment of Europe’s population does not meet the WHO minimum requirement of daily physical activity. A comparative study in 8 EU Member States found out that “the proportion of children who meet physical activity (PA) guidelines of 60 min of moderate -to-vigorous physical activity (MVPA) per day ranged from 2.0% (Cyprus) to 14.7% (Sweden) for gir ls and from 9.5% (Italy) to 34.1% (Belgium) for boys.” 20 DIGITAL SOCIETY AND INTERNET OF THINGS AS WELL AS NOVEL BUSINESS MODELS AND INNOVATION IN TRANSPORT ‘Mobility on Demand’ and ‘Shared mobil ity’ (which imply ‘decline of ownership model’) are among the drivers identified here. Private car ownership, certainly in large cities where bike -sharing, car-sharing and ride-sharing options are getting increasingly popular, is likely to decline in the mid- to long-term as mainly young people embrace these new technologies and mobility concepts. In the Netherlands, car ownership among the 18 - 30 years old decreased by 8% from 2005 – 2015 whereas it st ill continued to grow amo ng the other age groups (30 – 50: + 3%; 50 – 65: + 12%; 65 – 75: +21%; 75+: +36%). 21 This coincides with a decline in new driving licenses in cit ies, for instance in Brussels, 30% fewer new driving l icenses were obtained in 2016 compared to the year 2000, d espite a 17% population growth in the age group 18+. Among the age group 18 – 21, the decline was even more prevalent with minus 48% new driving l icenses obtained. 22 With regards to bike-sharing, 524 schemes are currently operating in Europe. 23 Building on current success bike sharing is stil l undergoing significant investment and changes in business models. This extends from moving bikes out of individual ownership into a fleet management structure similar company cars through to huge fleets of bikes left on the streets of large cit ies without need for traditional docking stations. The fleet management approach to bicycle use is particularly interesting with the development of pedelecs and speed pedelecs because it overcomes barriers of price and maintena nce for these more expensive and technical machines.
19 www.mobility4eu.eu 20 https://academic.oup.com/ije/article/doi/10.1093/ije/dyw317/2937783/Cohort-Profile-The-transition-from-childhood-to 21 https://www.cbs.nl/nl-nl/nieuws/2017/08/65-plussers-met-meer-auto-s-en-kilometers-op-de-weg 22 http://www.bruzz.be/nl/actua/rijbewijs-steeds-minder-trek-brussel (needs link to study) 23 http://bike-sharing.blogspot.be/

Blueprint for an EU Cycling Strategy – Chapter 1 - The State of Cycling and Potential for Growth
Page 17/99
Connected bikes and bike fleets enhance this: Connecting bikes enables bike sharing solutions to evolve to the next level and become an integral part of metropolitan mobility. Connected shared bikes are much easier to operate in shared systems and create opportunities for improved business models in relation to bike sharing. Having an electrical power source on board of a bike offers perfect opportunities for bikes to become part of a seamless, Mobility as a Service, transport network managed as a fleet, either by commercial operators or by employer fleet leasing schemes. The first connected bikes are coming to the market now, enabling new services to be linked to bikes, that earl ier were seen as only av ailable in combination with cars. Once a bike is connected to a service network providing access to seamless plan, book and pay services (MaaS), the bike will become an integral part of new mobility solutions in cities. Seamless connections with public tra nsport and shared mobil ity services (see next) are enabled and the bike will also become a reliable last mile solution. Even theft of (more expensive) high tech bikes is effectively tackled by connecting bikes. Ride-sharing, such as it is offered by Ube r, is taking off in many cities across Europe as well. While Uber claims to be part of the future of shared mobil ity contributing to a decrease in private car ownership, we see the r isk that if tr ips are not pooled, more car trips will be induced. URBANISATION AND SMART CITIES People are moving back to the cities. The European Commission predicts that by 2050, 85% will be living in an urban environment, compared to 74% today. 24 If re-urbanisation is well -managed, i.e. respects the principles of mixed land -use planning, the past trend of ever -longer average distances and total mileage caused by mass -motorisation, could come to a halt or even be reversed. Short distances favours active modes: the average cycle distance in most European countries is about 3 km25; According to Dutch figures, e -bikes have a higher mileage compared to ‘normal’ bikes with a factor of 1:1.7, increasing the average distance of an e -bike trip to about 5km. 26 We did not find data for the average distance of speed pedelecs (power suppor t unti l 45km/h). GROWING IMPORTANCE OF ENVIRONMENTAL PROTECTION Poor air quality is one of the main environmental and public health challenges many cities are facing. The European Environment Agency estimates that more than 400,000 premature deaths are caused by toxic air in the EU. 27 In 23 out of 28 Member States air quality standards are stil l being exceeded. On February 14, 2017, the European Commission sent out final warnings to the 5 largest EU Member States (Germany, France, UK, Italy and Spain) for fai ling to address
24 United Nations, Department of Economic and Social Affairs/Population Division (2009), World urbanisation prospects – The 2009 revision, http://esa.un.org/unpd/wup/index.htm. Quoted in Commission Staff Working Document Accompanying the White Paper - Roadmap to a Single European Transport Area – Towards a competitive and resource efficient transport system, SEC (2011) 391 final. 25https://ec.europa.eu/transport/road_safety/specialist/knowledge/pedestrians/pedestrians_and_cyclists_unprotected_road_users/walking_and_cycling_as_transport_modes_en 26 CROW, 2012. Quoted in: Transport and Mobility Leuven (2017) Internalisering van externe kosten van transport in Vlaanderen: actualisering 2016, p. 61. http://www.tmleuven.be/project/miraexternekostenupdate/Internalisering%20van%20externe%20kosten%20van%20transport%20in%20Vlaanderen%202016.pdf; Another Dutch publication put the average distance cycled on a‚ normal‘ bike at 3.7km, on a e-bike at 5.6km. Kennisinstituut voor Mobiliteitsbeleid (2015) Fietsen en Lopen: De smeerolie van onze mobiliteit. 27 http://www.eea.europa.eu/soer-2015/europe/air/keymessage-2015-01-30-1654211257

Blueprint for an EU Cycling Strategy – Chapter 1 - The State of Cycling and Potential for Growth
Page 18/99
repeated breaches of air pollution l imits for nitrogen dioxide (NO2). 28 Whereas more and more cities are introducing Low Emissions Zones (LEZ), environmental protections groups are taking authorit ies to courts in order to force them to ste p up measures. Co2 emissions from the transport sector are the other side of the same coin. While the European Commission set the target of reducing Green House Gas emissions from transport by 60% by 2050 (compared to 1990), there is st il l a long way to go in order to meet this goal. 29 GROWING IMPORTANCE OF SUSTAINABLE TRANSPORT Against the background of environmental and climate policy challenges, high levels of congestion and re-urbanisation, many authorities at local, regional and national level have been producing integrated transport strategies, e.g. Sustainable Urban Mobil ity Plans with the support of the European Commission. Cycling delivery plans can be an integrated part of such wider strategies or stand -alone approaches. About half of the EU Member States have a current national cycling strategy in place. 30 Austria, the Czech Republic, Finland, Hungary, Germany* 31, Ireland, Slovakia and the United Kingdom have concrete cycling modal share objectives in place. The l ist is even longer for capital ci t ies, with at least 15 having set a quantifiable objective to grow cycling. 32
Cycle innovations
Besides the increase of bike -sharing schemes in Europe, there are other major innovations that deserve to be looked at into further detail: Electric power assis ted cycles (EPACs), new ride/stability features, new materials and fast cycle routes (cycle highways). ELECTRIC POWERED ASSISTED CYCLES (EPACS) For Europe as a whole, the steady growth in EPAC 33 sales is probably the main driver for an increase in cycling mobil ity. The German Federal Environment Agency saw the advantages of pedelecs as to: ;
make it easier to travel longer distances
make it possible to transport grea ter loads;
make it easier to overcome natural obstacles, such as inclines and headwinds;
offer an alternative to company cars;
be ideal for recreational activities. 34
28 European Commission Press Release: Commission warns Germany, France, Spain, Italy and the United Kingdom of continued air pollution breaches, 14.02.2017. http://europa.eu/rapid/press-release_IP-17-238_en.htm 29 Roadmap to a single European Transport Area – Towards a competitive and resource-efficient transport system, COM(2011) 144 final 30 https://ecf.com/what-we-do/cycling-all-policies/national-cycling-policies 31 Germany’s 2nd National Cycling Master Plan (2012) concluded that a 15% cycling mode share is achievable by 2020 (16% in urban areas, 13% in rural areas). 32 ECF Internal Research. 33 Electric powered assisted cycles include: Pedelecs – of speeds up to 25 kph and power cut out at 250 watts; L1e-A “powered cycles” – of speeds up to 25 kph and power cut out at 1000 watts; L1e-B for “mopeds” – of speeds up to 45 kph and power up to 4000 watts (speed pedelecs) 34 German Federal Environment Agency (2014): Electric bikes get things rolling: The environmental impact of pedelecs and their potential.

Blueprint for an EU Cycling Strategy – Chapter 1 - The State of Cycling and Potential for Growth
Page 19/99
Part 1.3 of this chapter described the big success in sales of EPACs on the European market. However, this success currently relies on 5 developed markets in terms of EPAC sal es per capita (Austria, Belgium, Denmark, Germany, and the Netherlands) accounting for 24.4% of EU population 35 but 80% in EPAC sales in 2015. 36 In the meantime other EU-countries showed significant growth like France, Italy, Spain, Sweden and the UK This implies a tremendous potential to grow sales across the EU as a whole. The development curve for EPACs depends on two scenarios. In the first scenario these markets will mature and the growth rate for the EU will decline. However the other possibility is significant new growth in regions of Europe where overall bicycle use is lower than the leading countries, where the EPACs become the instrument for behaviour change and mode shift to cycling. In Europe’s hotter cit ies arriving at a destination soaked in sweat is a major deterrant to cycling in most of the warmer months, a factor made worse in hill ier cities. Many of these countries have a historic moped/scooter culture which is suited to these topographies. It is important to note that electric bike shari ng has been established in Madrid, Milan and in 2017 Lisbon to address these major barriers to take -up. Barcelona, Paris and Lyon wil l introduce a proportion of electric bikes to its scheme in 2017 due to its market analysis of growth needs Growth EPAC sales potential scenario 2030 and cycle use (mature market model) Assumption 1: The EPAC sales market continues to grow at an average annual growth rate of 16% until 2030. About 12.3 mil lion will be sold in 2030 in the EU -28. Assumption 2: EPACs wil l be in usage for 8 years, 37 hence the total EPAC stock in 2030 wil l consist of 62 million EPACs sold in the period 2023 – 2030. Assumption 4: The estimated annual mileage of an EPAC is approximately 2,000km. A Swiss report put the figure at 2,400km/annum 38, a Dutch report at 1,500km/annum 39. Calculation: 62 mill ion EPACs × 2,000km/EPAC = 124 bill ion km/annum. The Swiss report also pointed out that about 1/6 of the km cycled by EPASs were shifted from ‘normal’ bikes: 124 – 20.66 = 103.33 bn km. In conclusion: there is a potential of generating 103 bill ion km cycled on EPACs in the 2030 through an increase in sales. OTHER TYPES OF EPACS While pedelecs are the most common e -bikes sold, other types such as e -cargo bikes (in particular in the L1e-A category) and speed pedelecs (L1e-B) are entering the market. E-cargo bikes can carry loads of up to 200kg, more and more logistic companies have installed such fleets. With regard to speed pedelecs, the market is sti ll in its infancy. In the Netherlands,
35 http://ec.europa.eu/eurostat/tgm/table.do?tab=table&init=1&language=en&pcode=tps00005&plugin=1 36 Conebi (2016) European Bicycle Market 2016 edition. 37 TML (2017). 38 Buffat, Marcel, et al., Bischof Schweizerische Eidgenossenschaft (Eidgenössisches Departement für Umwelt, Verkehr, Energie und Kommunikation UVEK - Bundesamt für Energie), ‘‘Verbreitung und Auswirkungen von E-Bikes in der Schweiz‘‘, Schlussbericht, 12/08/2014, p126. 39 Jones, Tim, Lucas Harms and Eva Heinen. ‘‘Motives, perceptions and experiences of electric bicycle owners and implications for health, wellbeing and mobility‘‘, Journal of Transport Geography 53 (2016), p42.

Blueprint for an EU Cycling Strategy – Chapter 1 - The State of Cycling and Potential for Growth
Page 20/99
3 528 units were sold in 2015, bringing the total stock to about 5,700 (by October 2015). 40 A research project at the University of KU Leuven, Belgium, currently looks into the “Quantification of technical performances, cyclist experience and safety of speed pedelecs for commuter use”. 41 NEW DESIGN FEATURES OF BIKES INCLUDING STABILITY FEATURES, SPEED CONTROL AND MATERIALS The technical abilit ies for bike manufacturers to increase passive and active ride features of bikes in traffic are increasing rapidly. Bikes are develop ing into high tech vehicles with increased rigidity, high performance brakes and tires and lighting. The E -and Connected developments enable features l ike active stability control and active speed adaption, which can be brought to the market soon. Connecte d interaction with other traffic (sensors) and traffic control (e.g. traffic l ights) are already tested in pilots. These developments are aimed to improve rider confidence for first time riders, new entrants and new users of e -bikes, overcoming some of the deterrents to use that stop people cycling.
New materials: The use of r igid, but l ight, high tech free shape -able materials in bikes has been seen in road race-and mountain bikes for some time. The materials and technologies are becoming affordable for c ity-and commuter bikes al well, which will help improve the attractiveness of bikes in general and help to move away from the image of the bike being a “poor man’s transport”. The bicycle industry is fast positioning itself as a provider of Smart Electric Mobil ity, not just sport and leisure.
INNOVATIVE INFRASTRUCTURE SOLUTIONS ‘Convenience’ and ‘speed’ are the two primary considerations for people to use a given mode of transport. 42 Hence the combination of EPACs with high -quality cycle infrastructure ap pears to be the right recipe for changing people’s mobility behaviour. Fast cycling routes 43 are “high standard bicycle paths reserved for cyclists for fast and direct commuting over long distances.” At this moment, fast cycling routes projects can be foun d primarily in Northern European countries. 44 At city level, London and Copenhagen are the examples best known. As for the Netherlands, the construction of 675km of ‘Fietssnelwegen’ (fast cycle routes) across the country by 2025 is envisioned. Approximately one third is already in place. In Germany, a 100km long Ruhr fast cycle route is under development at an estimated cost of €187m. A feasibility study estimated that as much as 400,000 daily car -km could be shifted to cycling if this cycle highway will be completed. 45 Many more German cities are rolling out plans to build fast cycle lanes (Munich, Hamburg, Berlin, etc.). Other innovations are related to the surface of infrastructure (such as the integrated use of solar panels), the gamification of cycle ro utes or the deployment of shared spaces.
40 https://www.rvo.nl/sites/default/files/2015/11/Special%20E-tweewielers%20en%20Speed%20pedelecs%20oktober%202015.pdf 41 http://www.researchportal.be/en/project/quantification-of-technical-performances-cyclist-experience-and-safetyof-speed-pedelecs-for-commuter-use-(KUL_3E140643)/#tabs 42 Eurobarometer 422, 2014. 43 ECF factsheet on Fast Cycling Routes, 2014. https://ecf.com/what-we-do/urban-mobility/fast-cycling-routes 44 An overview about cycle highways can be found at ECF website: https://ecf.com/what-we-do/urban-mobility/fast-cycling-routes 45 Machbarkeitsstudie Radschnellweg Ruhr R1, 2014. http://www.rs1.ruhr/fileadmin/user_upload/RS1/pdf/RS1_Machbarkeitsstudie_web.pdf

Blueprint for an EU Cycling Strategy – Chapter 1 - The State of Cycling and Potential for Growth
Page 21/99
Cyclelogistics Case Study: The Potential for Shifting Motorized Trips to Cycling
As part of the Cyclelogistics projects 46, a detailed analysis has been made as to what motorized trips could be shifted to cycling. The report says: “The share of motorised trips in European urban areas is on average 60% of all trips. 40% are done by public transport, cycling or walking’’ Taking all motorised trips as basis for the calculation (60% =100%) we find that 42% of all motorised trips could be potential ly shifted to bicycle transport. Because these trips are:
Related to light goods transport (more than a handbag less than 200 kg)
Are short enough (less than 5 km for bike, less than 7 km for e -bike)
Are not part of a complex trip chain that involves usage of a car ·
Motorised trips and potential for shifting (Basis: 60% = 100% motorised tr ips) Motorised trips purpose
Trips to shift to bike/cargo bike
Trips, no goods involved
Motorized trips; not to shift
Commuting 20% 5% 10% 5%
Leisure 23% 7% 8% 8%
Shopping 22% 17% 5%
Business 10% 5% 5%
Cargo & Service 25% 8% 17%
Total 100% 42% 18% 40%
Uncertainties and Potential Barriers to Cycling
As described above, a lot of societal trends and technological innovations indicate t hat cycling will be growing over the next decade in Europe. However, there are also a number of uncertainties and potential barriers:
1) Rebound effects from use of autonomous cars and on -demand ride-sharing options for motorized transport
With the advent of autonomous cars and on -demand ride sharing/ ride hail ing options for motorized transport, driving a car, or rather being driven by a car, might become a lot easier and hence induce additional demand for car mobility. On the positive side, as “most crashe s involve some element of human error” 47, autonomous driving is said to make the transport system safer for all road users. This could remove one of the barriers to cycling (“Cycling is not safe!”). Questions remain:
46 Karl Reiter, Susanne Wrighton (2014) Potential to shift goods transport from cars to bicycles in European cities. Analysis done as part of Intelligent Energy Europe project Cyclelogistics (2011 – 2014). 47 ETSC (2016) Prioritising the Safety Potential of Automated Driving in Europe.

Blueprint for an EU Cycling Strategy – Chapter 1 - The State of Cycling and Potential for Growth
Page 22/99
Several car manufacturers have been ann ouncing to sell fully autonomous cars on the market by the turn of the next decade (2020/21). In the first instance, they wil l be primarily used on motorways. When will ful ly autonomous cars enter the urban realm? Will autonomous cars be able to cope with the many interactions with pedestrians and cyclists? Or will there be a push for ‘cars -only’ corridors to limit such interactions? In case of a coll ision, will algorithms prioritise the safety of car passengers or people outside the car?
An OECD claims that “the car fleet needed would be only 3% in size of the today's fleet” 48, freeing up 95% of the space needed for parking cars for other purposes, including the provision of bike lanes. However, this wil l only be the case if people give up private car ownership and if car journeys will be pooled. However, it is also imaginable that empty cars wil l be roaming the streets; that road capacity will increase considerably (comparable to concepts of ‘platooning’ of heavy goods vehicle on motorways), etc.
2) Price signals: subsidies, internalization of external costs
Drivers respond to price signals. For example, in cities where congestion charges were introduced, car use decreased. 49 In its 2011 Transport White Paper, the European Commission declared the objective to “proceed to the full and mandatory internalisation of external costs (including noise, local pollution and congestion on top of the mandatory recovery of wear and tear costs) for road and rail transport” 50 in the period 2016 - 2020, yet in practice, motorize d transport remains heavily subsidized, inducing artificial demand for car use. 51 Question:
Will we come to a fiscal and financial level playing field between transport modes? And if so, by when?
3) Behaviour While young people have fewer driver l icenses, own fewer cars and drive less than their peers 20 years ago in many countries, the opposite holds stil l true for other age groups, in particular the 55+. Question:
Will people once they start a family, buy a property in suburbia, be offered a company car etc. yet adopt the mobility behaviour of previous generations?
48 OECD/ITF (2016) Shared Mobility: Innovation for Liveable Cities. 49 Holger Haubold, ECF (2016) Congestion charges and cycling. https://ecf.com/groups/congestion-charges-and-cycling 50 Roadmap to a single European Transport Area – Towards a competitive and resource-efficient transport system, COM(2011) 144 final 51 E.g. study about Flanders (Belgium): TML (2017).

Page 23/99
Chapter 2 - Benefits of Cycling and their contribution
to EU Policy Goals
Summary
This chapter is divided in 3 sub -chapters: 1. Economic, Environment, Climate, Energy & Resource benefits The cycling economy provides thousands of jobs, and doubling cycling would mean more jobs for lower skil led people. The value of bike manufacturing, sales and cycle tourism far exceeds €50 bilion. Cycling regularly, including Bike to work translates into re duced work absenteeism, supporting the key EU asset: the productive capacity of the workforce. Cycling currently contributes to EU climate and CO2 goals, air and noise pollution, saves fuel and natural resources. 2. People: Health, Well-being, Social & Cultural Affairs Regarding health and public health, the mill ions of people cycling regularly in the EU enjoy, on average, longer, healthier lives and better mental health from the physical activity and related benefits. This translates into reduced work ab senteeism, improved children’s health, development and well -being benefits. Cycling’s low costs and ease of use contribute to social and gender equality, and to reducing health inqualit ies for all including refugees fleeing violent confl icts. Cycling impr oves connectivity between people, accessibility especially, but not only in congested and urban areas. It enhances social safety, and resilience. 3. More Liveable Cities: Mobility, Technology & Urban design Cycling makes EU cities more l iveable and m ore cycling will do even more so. The benefits of cycling are to be found in mobil ity, including reductions in Congestion, Public Transport costs, by reducing pressure especially at peak times and reductions in Construction and maintenance of road infrastructure. Cycling provides enhancements and efficiencies in connectivity eg inter - and multi modality; to urban design by freeing space in cities through integrated urban planning and infrastructure, and to smart city development through smarter cycling, with cyc l ing’s contributions to new technologies. EU competences related to cycling include the fields of industry, employment, transport, environment, cl imate, health and social policy, and global development. We make the case that cycling delivers significant cost savings in public investments and helps meet established EU targets. This implies development of an integrated EU cycling strategy that includes cycling in all relevant policy areas to aid the EU to multiply the benefits cycling delivers.
2.1 Benefits to the Economy, Environment, Energy, Climate & Natural Resources
Economic benefits: boosting jobs, growth and investment
Blueprint for an EU Cycling Strategy – Chapter 2 - Benefits of Cycling and their contribution to EU Policy Goals
Page 24/99
Cycling makes a significant contribution to the European Commission’s first priority of providing a new boost for jobs, growth and in vestment as expressed by Commission President Juncker in his political guidelines. 52 The bicycle manufacturing industry contributes €6bill ion to the EU economy and bike sales and repairs add another €3.4bill ion each year. The value of bicycle tourism is €44,000,000,000 from 2.3bill ion cycle tourism trips per year in Europe. This does not i nclude the value of bicycle tourism in other sectors, like travel agencies not specialised on cycling. Over 650,000 jobs are associated with the current level of cycling in Europe. Cycling has a higher employment intensity per mil lion euro turnover than o ther transport sectors, thus offering a higher job creation potential. Furthermore, cycling jobs are more geographically stable than other sectors; they benefit local economies, and they offer access to the labour market to lowly qualified workers. 53 If cycling’s modal share were to be doubled, more than 400,000 additional jobs could be created, reaching a total of more than 1 mil lion jobs in the cycling economy. This means that cycling helps the EU to achieve the Europe 2020 goals in terms of green growth and green job creation, as stated for example in the Green Employment Initiative. 54 Cycle commuting to work is related to reduced work absenteeism, providing significant benefits for businesses and employers. Employees who cycle to work have 1.3 fewer si ckness days than those who do not cycle to work, a gain per employee of €260 per year. 55 Across the EU, cycling to work provides a €4,5bill ion benefit due to reduced absenteeism and contributes to EU occupational, safety and health (OSH) policy goals of re duced absenteeism and sustainable jobs.
Environmental benefits
The estimated value of air pollution from cars avoided by current levels of cycling is € 427 million. Cycling is an important means to achieve the EU air policy objectives of reducing the health impacts of air pollution by 52% in 2030 compared to 2005 and reducing the share of ecosystem area exceeding eutrophication limits to 35%, as stated in the 2013 Communication “A Clean Air Programme for Europe”. 56 Cycling also contributes to reducing nois e pollution in Europe, with an estimated value of € 300 million. This helps to achieve the target of significantly decreasing noise pollution in the Union, moving closer to levels recommended by the World Health Organisation, by 2020, as stated in
52 A New Start for Europe: My Agenda for Jobs, Growth, Fairness and Democratic Change. https://ec.europa.eu/commission/sites/beta-political/files/juncker-political-guidelines-speech_en_0.pdf 53 ECF 2014. Cycling works. Jobs and job creation in the EU Cycling Economy. https://ecf.com/sites/ecf.com/files/141125-Cycling-Works-Jobs-and-Job-Creation-in-the-Cycling-Economy.pdf 54 COM(2014)446: Green Employment Initiative: Tapping into the job creation potential of the green economy. http://ec.europa.eu/transparency/regdoc/rep/1/2014/EN/1-2014-446-EN-F1-1.Pdf 55 http://www.ncbi.nlm.nih.gov/pubmed/20580736 56 COM(2013)918: A Clean Air Programme for Europe. http://eur-lex.europa.eu/legal-content/EN/TXT/PDF/?uri=CELEX:52013DC0918&from=EN

Blueprint for an EU Cycling Strategy – Chapter 2 - Benefits of Cycling and their contribution to EU Policy Goals
Page 25/99
the General Union Environment Action Programme to 2020 ‘Living well, within the l imits of our planet’. 57 Cycling infrastructure requires much less space than infrastructure for cars. This leads to reduced construction-related costs, resource savings and the preser vation of environmental assets like soil and water. It also helps to achieve the aim of having no net land take in the EU by 2050 in the 2011 Roadmap to a Resource Efficient Europe. 58 Another environmental benefit is increased permeable surface areas, meani ng higher soil quality and less water pollution, helping to reach the objective of preventing further soil degradation and preserving soil functions stated in the Thematic Strategy for Soil Protection of 2006. 59
Benefits in terms of climate protection and energy savings
The current estimate of 134 billion km cycled annually provides CO2 savings of 15 bill ion kg with a value of €2 bill ion per year. Benefits include CO2 emissions avoided and the associated climate change damages, i.e. the so -called “social cost of carbon”. 60 Additionally, cycling prevents the so-called “rebound effect” from the use of electric cars. 61 The fuel savings due to avoided car traffic linked to current cycling levels in the EU are estimated at €2.8bill ion. Cycling contributes to achieving Junkers’ P riority 3 “A resil ient Energy Union and forward looking climate change”, f irstly by reducing high energy dependency. Cycling helps meet targets in the EU 2030 Framework for climate and energy policy adopted in 2014, 62 namely the target of 40% cut in greenhouse gas emissions compared to 1990 levels (specific targets for the transport sector: 20% reduction from 2008 levels by 2030, and a 60% reduction from 1990 levels by 2050) and at least 27% energy savings compared with the business -as-usual scenario. Cycling significantly contributes to 12 of the 17 UN Sustainable Development Goals 63, as presented to the UN Climate Summit COP 21 in Paris. 64
57 DECISION No 1386/2013/EU OF THE EUROPEAN PARLIAMENT AND OF THE COUNCIL of 20 November 2013 on a General Union Environment Action Programme to 2020 ‘Living well, within the limits of our planet’. http://eur-lex.europa.eu/legal-content/EN/TXT/PDF/?uri=CELEX:32013D1386&from=EN 58 COM(2011)571: Roadmap to a Resource Efficient Europe. http://eur-lex.europa.eu/legal-content/EN/TXT/PDF/?uri=CELEX:52011DC0571&from=EN 59 COM(2006)231: Thematic Strategy for Soil Protection. http://eur-lex.europa.eu/legal-content/EN/TXT/PDF/?uri=CELEX:52006DC0231&from=EN 60 EPA Factsheet 2015: The Social Cost of Carbon, https://www3.epa.gov/climatechange/Downloads/EPAactivities/social-cost-carbon.pdf 61 See e.g.: https://www.theguardian.com/environment/blog/2011/feb/22/rebound-effect-climate-change 62 COM(2014)520: Energy Efficiency and its contribution to energy security and the 2030 Framework for climate and energy policy, http://ec.europa.eu/energy/sites/ener/files/documents/2014_eec_communication_adopted_0.pdf 63 Neun, M. 2016. S4C and COP 21 – challenges, achievements and perspectives for the evolution of cycling. Key-note presentation at the Scientists-for-Cycling colloquium at Velo-city 2016 Taipei, 26.02.2016. Extended abstract available at: https://drive.google.com/file/d/0ByMLurB9op4KeFpjWlZ4UzM1cGktZDNNeXBiRFZDS0ktdXhJ/view [accessed: 15.10.2016]. 64 ECF 2015. Cycling Delivers on the Global Goals. At: https://ecf.com/what-we-do/global-cycling-policies/voluntary-commitment-un [accessed: 15.10.2016].

Blueprint for an EU Cycling Strategy – Chapter 2 - Benefits of Cycling and their contribution to EU Policy Goals
Page 26/99
2.2 People: Health, Well-being, Social & Cultural Affairs
Cycling is an investment in health and productivity
Cycling is an investment in health and productivity across all ages. Health and well -being have central and innate value to all EU cit izens. Physical and mental health among working age adults is essential to a key economic asset: the productive capacity of EU wo rkforce. Current levels of cycling in the EU prevent 27,860 premature deaths annually due to the physical activity, with an economic savings of €96.5billion estimated with the W.H.O. HEAT tool 65. The healthier l ives also involve reduced morbidity from non -communicable diseases (NCDs) including cardiovascular disease (CVD), coronary heart disease, stroke, cardiopulmonary diseases (COPD), several cancers, hypertension, overweight and obesity, type 2 diabetes. Morbidity benefits 66 from current levels of cycling in the EU are valued at €38.6bil lion annually. The policy benefits include the EU Lisbon 2020 goal to increase the average healthy lifespan by 2 years and the reduction of NCDs by 25% by 2025, the Sustainable Development Goal 3 of reducing NCDs by 30% by 2030, and several other aspects of the EU Environment and Health Strategy and the associated Action plan 67. MENTAL HEALTH BENEFITS One in four persons in the EU suffers a mental health condition during their lifetime, and cycling’s contribution to better cardiovascular health delays dementia. Cycling can improve brain functioning and mental health: 68 Regular physical exercise has a dose -response relationship with better functioning at work and less mental health related absenteeism 69. It also helps counter cognitive declines including memory, executive function, visuospatial skills, and processing speed in normally aging adults 70. The estimated value of cycling and mental health is €30bill ion. The contributions to EU policy goals include a healthy workforce, reduced absenteeism and sustainable jobs. HEALTH BENEFITS FOR CHILDREN Cycling to school and for recreation at a young age helps reap life -long benefits. 71 Cycling helps meet the objective of halting the rise in overweight and obesity in children and youn g people
65 http://www.heatwalkingcycling.org/ 66 http://www.gracq.org/sites/default/files/2014rbceconomievelo.pdf 67 https://ec.europa.eu/health/healthy_environments/policy/health_environment/strategy_en https://ec.europa.eu/health/healthy_environments/policy/health_environment/actionplan_en 68 https://www.psychologytoday.com/blog/minding-the-body/201505/bicycling-can-sharpen-your-thinking-and-improve-your-mood 69 http://psycnet.apa.org/psycinfo/2012-00194-001/ Job burnout and depression: Unraveling their temporal relationship and considering the role of physical activity. Toker, Sharon; Biron, Michal; Journal of Applied Psychology, Vol 97(3), May 2012, 699-710. http://dx.doi.org/10.1037/a0026914 70 http://journal.frontiersin.org/article/10.3389/fnagi.2013.00075/full 71 Sustrans 2016. The benefits of cycling for children and families. Overview available at: http://www.sustrans.org.uk/what-you-can-do/children-and-families/cycling-kids/benefits-family-cycling [accessed 2.11.2016].

Blueprint for an EU Cycling Strategy – Chapter 2 - Benefits of Cycling and their contribution to EU Policy Goals
Page 27/99
(0-18 years) by 2020 in the EU Action Plan on Childhood Obesity 2014 -202072. Cycling brings health and social benefits for families. 73 The overall estimated value of cycling for children is currently €20bill ion.
2.3 More Livable Cities: Mobility, Technology & Urban design
Mobility CONGESTION EASING Cycles ease congestion by providing mobil ity and logistics services despite being much smaller than fossil fuel powered motor vehicles which often contain one single occupant. The value of cycling replacing car trips is €6,5bill ion. Cycles currently provide a small but growing share of urban logistics trips, with a potential of replacing 50 % of them. This contributes to the EU target of Carbon Free urban logistics by 2050. PUBLIC TRANSPORT SUBSIDIES Cycling replaces public transport trips. Reducing pressure on PT systems especially in the peak hours when costs are the highest, cycling can help to decrease subsidies for public transport. If Public Bike Schemes are part of public transport, this helps also to take pressure of the rest of the system. CONNECTIVITY - INTER- AND MULTIMODALITY Cycling is a top provider of solutions for inter - and multimodality with other modes of transport. It improves capacity building with public transport, offering ride+travel solutions etc. SMARTER CYCLING – CONTRIBUTION OF CYCLING TO NEW TECHNOLOGIES AND SMART CITY DEVELOPMENT Many bikes produced today are high-tech products. New, l ight -weight materials (e.g. carbon fibres) are developed and tested that can be used in other areas as well. This is especially true for electric bikes and their innovative components like batteries and new power trains, which have made electromobility a reality in the EU. Today, many more electric bikes than electric cars are sold in Europe. Cycling is also becoming more and more connected, using ICT for applications l ike route planning, public bike systems or GPS tracking. With these new services, cycling becomes an integral part of the transport systems of future smart cities. URBAN DESIGN – BENEFITS OF INTEGRATED URBAN PLANNING AND INFRASTRUCTURE There are many benefits of improving urban design that enable and promote active transport like walking and cycling. The benefits of reducing motor vehicle congestion and air pollution are the headliners. More space in cities for cycling, making cities more accessible for all, connecting neighbourhoods and creating meeting places lea ds to many other benefits, e.g.
72https://ec.europa.eu/health/sites/health/files/nutrition_physical_activity/docs/childhoodobesity_actionplan_2014_2020_en.pdf 73 ECF 2012. “The Charter of Vancouver on CHILDREN AND CYCLING”, signed at Velo-city Global Vancouver 2012, June 29th. Available at: http://www.ecf.com/about-us/manifesto/children-have-the-right-to-cycle/ [accessed: 12th September 2014].

Blueprint for an EU Cycling Strategy – Chapter 2 - Benefits of Cycling and their contribution to EU Policy Goals
Page 28/99
better social cohesion, improved business revenues. Both the EU Action Plan on Childhood Obesity and the EU Council Recommendation promoting health -enhancing physical activity across sectors (HEPA, 2013) 74 note the need to address urban planning and urban design to achieve increased physical activity at the population level with the associated mortality and morbidity decreases. Construction and maintenance of road infrastructure is decreased by avoiding car related -investment and reduced wear from cycles versus cars 75.
Conclusion
Some benefits of cycling are only economic, such as the savings individuals and businesses have from cycling instead of using private motorized vehicles. Subsidies reduced or avoided for public transport - and reduced road and infrastructure construction maintenance costs due to the lighter weight of cycles vs individual private motor vehicles. However, there is an additionality of immense positive externalit ies related to cycling which support gree n, healthy, happy, resilient, cohesive, connected, fairer, l ivable citizens, cit ies and communities. Many of the contributions cycling makes to help the EU meet policy goals are in the fields of industry, employment, transport, environment, cl imate, heal th and social policy, and global development. We make the case that cycling delivers significant cost savings in public investments and helps meet established EU targets. This implies development of an integrated EU cycling strategy that includes cycling i n all relevant policy areas to aid the EU to multiply the benefits cycling delivers.
74 (26 November 2013 on OJ, C 354, 4.12.2013,) 75 http://etsc.eu/10th-annual-road-safety-performance-index-pin-report/ & https://data.oecd.org/transport/infrastructure-investment.htm

Blueprint for an EU Cycling Strategy – Chapter 2 - Benefits of Cycling and their contribution to EU Policy Goals
Page 29/99
Annex:
An EU Strategy for Cycling Adds Value to these
EU Policy Programmes
1. A New Start for Europe: My Agenda for Jobs,
Growth… Priority 1” new boost for jobs”
2. A New Start for Europe: My Agenda for Jobs,
Growth… Priority 3 “A resilient Energy Union and
forward looking climate change”
3. Trans-European Transport Network Regulation
[Regulation (EU) No1315/2013]
4. Connecting Europe Facility [Regulation (EU) No
1316/2013]
5. European Commission Communication on Tourism
- Europe, the world’s No 1 tourist destination: a
new political framework for tourism in Europe
COM(2010) 352 final
6. Rail Passenger Rights’ and Obligations [Regulation
(EU) No 1371/2007]
7. EU White Paper: Roadmap to a Single European
Transport Area COM(2011) 144 final
8. The EU Roadmap for moving to a low-carbon
economy in 2050 COM (2011) 112 final
9. EU 2030 Framework for climate and energy policy
10. Clean Air Policy Package / Air quality Directive
[Directive 200/50/EC]
11. National Emissions Ceiling Directive [Directive
2001/81/EC]
12. .
13. DECISION No 1386/2013/EU OF THE EUROPEAN
PARLIAMENT AND OF THE COUNCIL of 20 Nov
2013 on a General Union Environment Action
Programme to 2020 ‘Living well, within the limits
of our planet’
14. Thematic Strategy for Soil Protection (2006) 231
15. Roadmap to a Resource Efficient Europe
(2011)571:
16. EU Environmental Action Plan
17. Funds: Horizon 2020 Smart Green and Integrated
Transport, CIVITAS, Urban Mobility Package
18. Together towards competitive and resource-
efficient urban mobility COM (2013) 913 final
19. Key Features of an EU Urban Agenda [SWD(2015)
109] and UN New Urban Agenda (Habitat III)
20. Towards a European road safety area: policy
orientations on road safety 2011 – 2020
COM(2010) 389 final
21. Infrastructure Safety Directive 2008/96/EC
22. Directive 2003/59/EC on the initial qualification
and periodic training of drivers of certain road
vehicles for the carriage of goods or passengers
23. Intelligent Transport Systems Directive [Directive
2010/40/EU]
24. ITS action plan and Cooperative-Intelligent
Transport Systems (C-ITS)
25. Urban Mobility Package
26. Funds: Horizon 2020 Smart Cities and
Communities
27. European Green Vehicles Initiative under Horizon
2020 [Reg (EU) No 1291/2013]
28. Horizon 2020 Smart Cities and Communities
29. Directive 2014/94/EU on the deployment of
alternative fuels infrastructure
30. Together towards competitive and resource-
efficient urban mobility COM (2013) 913 final
31. Digital Agenda for Europe (Smart Cities and
Communities)
32. European Innovation Partnership (EIP) on Smart
Cities and Communities
33. EC Communication on Green Employment
Initiative – Tapping into the job creation potential
of the green economy [COM (2014) 446]
34. European Parliament Resolution on Green
Employment [201/2238(INI)]
35. Jobs, Growth and Investment Package
36. Type-Approval Requirements for the General
Safety of Motor Vehicles [Regulation (EC) No
661/2009]
37. Air Quality Directive (2008/50/EC)
38. Environmental Noise Directive (2002/49/EC)
39. Eurostat Statistical System [Regulation (EU)
2015/759]
40. White Paper on A Strategy on Nutrition,
Overweight, and Obesity-related health issues,
2007
41. 2014 Council Resolution on EU Work Programme for Sport (2014-2017)
42. EU Action Plan on Childhood Obesity 2014-2020 43. EU Council Recommendation on HEPA 26
November 2013 on OJ, C 354, 4.12.2013 44. Cohesion Policy, Funds supporting
a. ERDF
b. ESF
c. The Cohesion Fund
d. EAFRD
e. CEF
f. Structural and Investment Fund

Chapter 3 - Behavioural Change
Summary
This chapter contains three sub -chapters:
1. Convince decision-makers to support cycling 2. Facilitate the cooperation among roa d users for safer cycling 3. Encourage citizens to cycle more
Encouraging citizens to cycle more often, for example through the European Mobil ity Week, has been all too often the only measure in promoting cycle use. However this chapter argues that a more coherent approach is needed. Behaviour is influenced by many factors: training, both for cyclists as well as motorised transport users; infrastructure that is convenient and safe to entice people to cycle; highway codes such as in the form of speed manageme nt and its enforcement, that ensure people’s physical integrity. The 2013 EU Urban Mobil ity Action Plan established guidelines for cities on how to develop and implement Sustainable Urban Mobility Plans. It was complemented by guidelines on urban logistics and access restrictions; measures were to be taken to improve road safety in the urban context. This Chapter calls for a complete implementation of this action plan by 2020. With horizon 2030, the EU should consider on how to integrate, for example, the European Mobility Week in a larger, coherent behaviour change policy based on lessons learnt from successful EU funded projects that delivered highly transferable, tried and tested behaviour change campaign techniques. In many countries, in particular wi th lower daily cycling levels, cycling for recreation and tourism purposes is an excellent way of establishing a cycling culture that in a 2nd phase may contribute to a culture of using the bicycle as a daily means of transportation. The EU is requested to extend its efforts, e.g. by establishing a European Mobil ity online platform to provide a one-stop-shop for anyone interested in active tourism in Europe.
3.1 Convince Decision-Makers to Support Cycling
The status quo of cycling in EU cities
While the overall trend for cycling in EU cities is positive the evolution is not fast enough and not everywhere. There are great disparities between forerunner, climber and beginner cycling cities. The reason behind these disparit ies is often a lack of polit ical su pport for cycling as a good solution for different problems of urban areas. Whilst there is more and more evidence that cycling has a positive impact on different urban policies (cycling delivers health, environmental and congestion benefits - see chapter 1 on the benefits of cycling), the disparit ies between EU cities show this evidence is not taken up widely yet across the continent.

Blueprint for an EU Cycling Strategy - Chapter 3 - Behavioural Change
Page 31/99
The status quo of cycling in relevant EU Policy
The Commission is promoting cycling as a part of the delivery of the Urban Mobil ity Action Plan 2013 which included guidelines for cit ies to set up Sustainable Urban Mobil ity Plans (SUMPs). Road safety was highlighted as a horizontal issue and specific guidance on integrating road safety are being prepared. Following the UN Habi tat Urban Agenda, the EU is also developing an Urban Agenda (including a partnership on urban mobil ity). The EU organises conferences to stimulate the take up of good practices on sustainable urban mobility (CIVITAS, Open Days, Green Week, SUMP conference) .
The proposed changes in EU policy
EU LEVEL
Fully implement the current Urban Mobility Action Plan by 2020 with a focus on active mobility,
Revise the Urban Mobility Action Plan (after 2020) with clear references to cycling,
Harmonise and encourage monitoring of the progress in sustainable urban mobility and develop a benchmarking tool (including increase of modal share and kms/hrs of cycling, reduction of deaths/serious injuries, and budget increases - see also in Chapter 11 on Monitoring),
Encourage Member States to nominate cycling focal points and set up centres for knowledge sharing at a national level as in The Netherlands, Denmark, Germany and at regional level in Flanders and in Baden -Württemberg, where a cycling strategy was published recently; stress the importance of allocating budget to realise the objectives of national cycling plans including safety and research measures
NATIONAL LEVEL
Set a common framework for action by developing a national cycling plan or updating an existing plan (ideal ly as part of a holistic national transport plan and/or National Policy Framework for Urban Mobility),
Set concrete mode share and safety targets (both objective and perceived safety) and monitor progress,
Nominate ambassadors and set up centres of excell ence for knowledge sharing at a national level, 76
Allocate budget to realise the objectives of national cycling plans including safety and research measures .
REGIONAL AND LOCAL LEVEL
Develop a regional/local cycling plan or update an existing plan, ideally as part of a holistic Sustainable Urban Mobility Plans (SUMPs),
SUMPs should adopt a clear hierarchy of transport users, with pedestrians, cyclists and public transport users’ safety, convenience and comfort needs considered first,
Set concrete mode shar e and safety targets (both objective and perceived safety) and monitor progress,
76 The Netherlands, Denmark, Germany and on regional level Flanders and Baden-Württemberg have such knowledge centres on cycling

Blueprint for an EU Cycling Strategy - Chapter 3 - Behavioural Change
Page 32/99
Interlink cycling with public transport systems enabling for them to be used interchangeably (parking, taking the bike on the train) 77
In line with the “Safe System Approach” t he transport system should accommodate cyclists and account for their characteristics[3]. This can also act as a measure to invite more cyclists out into the roads and to help these new users consider cycling as a habitual mode of transport.
EU Added value (and/or cost of non-Europe)
If the EU clearly encourages cycling, more decision -makers will consider implementing cycling measures more often and more easily. EU cit ies will become more liveable, efficient and sustainable while stimulating the economic v iability of cities and making citizens healthier. This will contribute to the Paris Agreement, the goals set in UN habitat’s New Urban Agenda and the EU targets for CO2 emission reduction for transport sector, air quality standards and noise.
3.2 Facilitate the Cooperation Among Road Users for Safer Cycling
The status quo of cycling in urban road safety
Fear of traffic is an oft -cited reason for not walking or cycling. Fear of safety risks is a major barrier to the uptake of cycling and introducing saf ety measures and the fact that cyclist numbers are increasing can help to overcome this fear. Addressing both perceived and objective
77 In Spain, some municipalities (Barcelona, Seville, Zaragoza, Bilbao, San Sebastian and Madrid) have added electrically assisted bicycles to their public transport services.
Bicycle Accounts Since 1996, the City of Copenhagen has published a biannual Bicycle Account surveying citizens about the city’s cycling initiatives. Besides being a reader-friendly tool to communicate to citizens and press , the Bicycle Account plays an important role in the efforts to make Copenhagen an even more bicycle -friendly city as it provides a clear indication of needs, demands and tendencies that strengthen policy -making, investments and green initiatives. A number of other Danish cit ies and the Capital Region of Denmark have developed similar accounts. The EU project CHAMP developed a guide for cities to set up their own Performance Analysis to reflect on their current cycling policy and helps identify their strengths and weaknesses. Starting from this baseline, a city can define new objectives to improve its cycling policy and choose which actions to focus on. Source:http://www.champ-cycling.eu/en/upload/PDF/Performance_analysis_final.pdf

Blueprint for an EU Cycling Strategy - Chapter 3 - Behavioural Change
Page 33/99
safety improvements wil l require slightly different but necessari ly coordinated approaches. (Please see also Chapter 4 on Infrastructure) Heavy Goods Vehicles (HGV) make up 3% of the European vehicle fleet and 7% of driven kilometres, yet they are involved in 15% of fatal accidents, costing almost 4,000 lives across the EU. Coll isions with passenger cars make up sl ightly more than half of the total number of cyclist deaths in the EU (52%). It is important that drivers are cognisant of the movements of cyclists and other smaller, slower modes of transport, and that cyclists are aware of danger areas around motorised vehicles. D istraction and high motor vehicle speed are major road safety problems that are also often behavioural issues. Speed is the factor most quoted as a cause in traffic collisions resulting in deaths and as such, it plays an important role in diminishing or in creasing the severity of collisions. Though we include speed management under behavioural issues, it also requires a holistic approach including vehicle safety (ISA) and infrastructure measures, therefore speed reduction is also dealt with in those chapter s (5 and 4 respectively). Additionally, every year, millions of tourists and professional drivers travel by car outside their country of origin in Europe. Being in unfamiliar environments, signposting and road markings offer vital guidance information to drivers and warn them of dangers.
The status quo of cycling in relevant EU Policy
Road Safety is a shared competence between the EU and Member States, joint efforts are needed to and contribute to the creation of a safer environment for cyclists and all E U road users. At present the European Commission does keep a list of some of the EU Member States main road rules for travelling abroad, but not on signposting and road markings, or other road rules. As part of the European road safety policy orientations (2011-2020), the improvement of education and training of road users was required. Within this context the two EU Directives related to this are due for review:
EU professional drivers are required to have followed professional training. In most Member States only 5% to 10% followed this training,
Directive 2006/126: sets the minimum standards for driving licenses, testing and training. At present this does not include interaction with cyclists and pedestrians
The Road Safety Policy Orientations also aim ed to increase enforcement of road rules and is moving towards this goal with the cross border enforcement Directive. This Directive allows prosecution across borders including for the offences of speeding, alcohol use and running red lights. With regards to speed management please see Chapters 4 on infrastructure and 5 on vehicle regulations. With regards to in -vehicle distraction please see Chapter 5 on vehicle regulations. For cyclists distraction please see Chapter 8 on smart cities.
The proposed changes in EU policy
Currently, there are no harmonized EU road code rules, other than those relating to social rules for large vehicles or roadworthiness of vehicles. The 1968 Vienna Convention has partial

Blueprint for an EU Cycling Strategy - Chapter 3 - Behavioural Change
Page 34/99
harmonization of road signs, but there is stil l qui te a large variation across the EU, especially with regards to cyclists. EU LEVEL
Encourage Member States to adopt zones with a speed l imit of 30km/h in residential areas and areas used by many pedestrians and cyclists, and a maximum speed of 50km/h elsewhere in urban areas. These should be coupled with self -explaining infrastructure measures to support the enforcement of the speed l imits. Promote cycling within the context of health, but with the emphasis on safe use of the roads
Support Member States in preparing national enforcement plans with annual targets for compliance in the areas of speeding, drink driving and distraction, especially in urban areas where there are high numbers of pedestrians and cyclists.
Encourage a Zero Tolerance approach to use of drugs and alcohol
Strengthen the Cross Border Enforcement Directive within the context of the revision in 2017 by ensuring greater convergence in enforcement of road safety related road traffic rules and developing common minimum standards for enforceme nt.
Link sanctions to relative risk: graded sanctions should be applied for higher speeds in 30 km/h and 50 km/h zones where there are higher numbers of cyclists.
Development of principle of road usage with due consideration of all other road users
Support awareness information campaigns on the risks of distracted driving.
Ensure broad information to EU employers and cit izens about the legal overview of use of mobile phones in the different EU Member States for example by publishing these information on their website (this is done).
With regards to road traffic death investigation, develop methods to enable better assessment of the role of distraction in road traffic deaths, including a review of existing reporting systems. Road traffic death data systems on nomadic device use should be improved, including type of device and the context in which it was being used when the crash occurred.
Include mobile phone in the upcoming road safety enforcement strategy and Cross Border Enforcement Directive and facilitate exchange of best practice on enforcement between the different police forces (this is done).
Include managing risks associated with mobile phone use in driver training.
Ensure that the Directive on misleading advertising is respected as regards mobile phones.
Continue to support the field operational trials of mobile phone and apply lessons learnt to address risks and benefit from safety services.
NATIONAL LEVEL
Provide all cit izens (not just cyclists) with adequate training regarding cycling skil ls. This training covers rules relating to the use of cycling infrastructure and governing the interaction between cyclists and motorised traffic at junction and other points of conflict. This could be part of a broader safety training programme for children and young adults.
Improve enforcement of i llegal road behaviour for all road users
Encourage a Zero Tolerance approach to use of drugs and alcohol to cover al l road users
Run awareness campaigns alerting cyclists of dangers posed by distracted cycling (mobile phone use/earphones) use of alcohol and drugs and lack of visibil ity in traffic, without discouraging cycling

Blueprint for an EU Cycling Strategy - Chapter 3 - Behavioural Change
Page 35/99
Encourage local authorities to adopt zones with a speed limit of 30km/h in residential areas and areas used by many cyclists (See chapter 4 on Infr astructure)
Prepare national enforcement plans with yearly targets for compliance in the areas of speeding, distraction and drink driving, especially in urban areas, where there are high numbers cyclists.
Strengthen enforcement against illegal parking when pedestrian and cyclist facilities are abused by parking on footpaths and cyclists’ lanes.
Map high risk sites for cyclists and use this to inform and direct enforcement actions of especially speeding
Run regular targeted information campaigns for those dr iving for work linked to enforcement on the risks of using a mobile phone.
Adopt clear and strict legislation banning the use of mobile phones, including hands free, whilst driving.
Integrate distracted driving into driver training REGIONAL AND LOCAL LEVEL
adopt zones with a speed limit of 30km/h in residential areas and areas used by many cyclists (See chapter 4 on Infrastructure)
Strengthen enforcement against illegal parking when pedestrian and cyclist facilities are abused by parking on footpaths and cyclists’ lanes.
EU Added value (and/or cost of non-Europe)
Cyclists training and education courses are run throughout the EU, there are various organisations that run courses, ranging from cycling organisations, independent training organisations and companies, to public authorities and schools. Education of basic transport social rules and training starting from a young age (children) but also newly arrived people in Europe (immigrants) can contribute to the EU Vision Zero: “By 2050, move close to zero fatalities in road transport. In line with this goal, the EU aims at halving road casualties by 2020”.
Better understanding between lorry drivers and cyclists
Heavy Goods Vehicles (HGV) make up 3% of the European vehicle fleet and 7% of driven
kilometres, yet they are involved in 15% of fatal accidents, costing almost 4000 lives
across the EU. In London 59% of potential cyclists cite safety concerns as the key barrier
to them cycling. A recent initiative involving 1500 lorry and van drivers working in the
capital have been given cycling training to help combat deaths on London roads. The
course takes place over one day, with three-and-a-half hours of classroom-based learning
followed by the same time on a bike on the road. It is important that drivers are cognisant
of the movements of cyclists and other smaller, slower modes of transport, and that
cyclists are aware of danger areas around motorised vehicles.
Source: http://www.standard.co.uk/news/transport/lorry-drivers-trained-on-bikes-in-bid-
to-cut-cycling-deaths-in-london-a3427141.html
Blueprint for an EU Cycling Strategy - Chapter 3 - Behavioural Change
Page 36/99
3.3 Encourage Citizens to Cycle More
The status quo of cycling in behavior change of citizens
The state of cycling both for daily as well as recreationa l/tourism purposes has been described in full detail in Chapter 1. Some researchers and observers argue that encouraging people to cycle can also increase road safety, and that a motorist is less l ikely to collide with a person walking and bicycling when there are more people walking or bicycling - the “safety in numbers” effect. 78 It is important to understand whether this is indeed a behavioural effect of drivers being more aware or whether this is actually a product of more infrastructure boosting numbe rs and safety instead. Full comprehension of this issue will effect cycling policy (to promote cycling alone or promote cycling and infrastructure)
The status quo of cycling in relevant EU Policy
The EU already supports some measures to encourage cit izens to cycle (more):
Campaigns
Promotion of Tourism and Leisure The EU campaign for sustainable transport - the European Mobility Week (EMW) - is a growing success story. Every year, more and more municipalities participate and involve numerous local stakeholders in a posit ive way. Cycling forms part of the EMW and often features prominently in the activities at a local level and the expertise on behaviour change campaigns gathered through various EU projects could increase the impact of the European Mobility Week. Following the Lisbon Treaty, tourism comes under the remit of the EU; however, it al locates relatively few resources to this sector. The direct f inancial support it currently gives is primarily through the COSME Programme, primarily aimed at suppo rting SMEs. Nevertheless, cycling tourism and in particular EuroVelo, the European cycle route network, has benefitted from a number of grants over the past 5 years for relatively small projects related to the central coordination of the network and route development projects. It is possible for cycle tourism projects to receive Cohesion Policy funding but actually using these funds for tourism generally was discouraged by the European Commission during the preparation of the current funding programme. Smart cities and Intelligent Transport Systems technologies can make cycling more comfortable and provide incentives to cycle. This will be covered in Chapter 8 on smart cities. For fiscal and taxation incentives, including the growth of EPAC/Pedelec use, please see Chapter 7 on Fiscal Incentives.
78 Jacobsen (2003), Safety in numbers: more walkers and bicyclists, safer walking and bicycling. Injury
Prevention, http://goo.gl/FEPfrl

Blueprint for an EU Cycling Strategy - Chapter 3 - Behavioural Change
Page 37/99
The proposed changes in EU policy
EU LEVEL
Embed the European Mobility Week in a larger, coherent behaviour change policy based on lessons learnt from successful EU funded projects that delivered highly transferab le, tried and tested behaviour change campaign techniques.
Develop guidelines on behaviour change campaigns based on the accumulated knowledge gathered from EU projects (e.g. Bike2Work, SWITCH, .
Establish a European Mobility online platform (in partnersh ip with the European Travel Commission) to provide a one -stop-shop for anyone interested in active tourism in Europe. The existing EuroVelo.com website could be used as a basis and expanded to include hiking, mountain biking etc.
Set minimum standards for safe and attractive infrastructure (see Chapter 4) to encourage more cycling.
NATIONAL LEVEL
Establish National (EuroVelo) Cycle Tourism Coordination Centres. To make successful cycle tourism destinations it is important to establish organisational str uctures to coordinate the necessary actions on the national level, including integrating EuroVelo -related tasks.
Introduce a national cycling friendly service scheme. Such schemes have been established in many European countries and are often run by the Na tional (EuroVelo) Cycling Tourism Coordination Centre. However, there remain some countries that do not have any schemes while in other cases several different regional schemes create a confusing situation for users.
REGIONAL AND LOCAL LEVEL
Participate in the EMW.
Apply minimum EU/national standards for safe and attractive infrastructure (see Chapter 4) to encourage more cycling .
EU Added value (and/or cost of non-Europe)
Behaviour change campaigns and training are important to make more people change th eir mode of transport and to establish a level playing field between all modes of transport. Supporting cycle tourism, an increasingly important part of the tourism sector, which employs an estimated 450,000 people around the continent.

Blueprint for an EU Cycling Strategy - Chapter 3 - Behavioural Change
Page 38/99
Bike2Work
The EU project Bike2Work main objective of the project is to achieve a significant
energy-efficient modal shift from motorized modes to cycling by introducing behaviour
change programs to employers that sustainably change the behaviour of commuters.
The Bike2Work project got half a million people out of their cars and convinced them to
shift their daily habits in favour of a more sustainable and healthier commute.
The legacy of the project is the Cycle-Friendly Employer Certification (CFE). The cycle-
friendly employer certification scheme was developed to establish a European standard
for cycle-friendly companies. The certification is intended to help European companies
to improve the situation for employees that cycle to work, and to acknowledge their
effort they will receive the certificate “cycle friendly employer”.
Source:https://ecf.com/news-and-events/news/ultimate-guide-how-run-successful-
bike2work-campaign

Chapter 4 - Cycle Infrastructure
Summary
The four subchapters set out below look at different aspects of cycling infrastructure:
1. Infrastructure guidance 2. EuroVelo and other cycle route networks 3. Ensuring safer infrastructure for cyclists 4. Cycle parking
However, they share the common aim of improving conditions for people who want to cycle to make it a more attractive mode of transport. Cyclists have few standard characteristics (in terms of age, physical f itness, reasons for travelling etc.), and this should be reflect ed in infrastructure design, but this is an area where the EU leads the world, so there are many good practice examples across the continent. It should also be noted that investments in cycle infrastructure are cheaper than investments for motorised traffic and public transport. The posit ive effects of cycling go beyond mobility and sustainability. Cycle friendly cities are rated higher in terms of quality of l ife. The bicycle is therefore a potential catalyst for improving the living environment as a whole. In order to take advantage of this added value, an integrated approach should be taken to the planning of our communities. Cycling infrastructure should be included at the start of the design process for all land use developments, rather than a dded at the end as an afterthought.
4.1 Infrastructure Guidance
The status quo of cycling in relevant policy field
Safe and attractive conditions need to be provided in order to increase the propensity of people to take trips by bike and leave the stabil i ty and security of motorised transport. The way each Member State delivers safe and attractive conditions can vary due to regulatory and behavioural differences. Some international best practices have emerged (e.g. CROW Design Manual for Bicycle Traffic 79) although they tend to reflect the situation in the country where they were developed and therefore it is not always straight -forward to transfer the recommendations to other situations.
The status quo of cycling in relevant EU Policy
The EU does not provide any specific guidance on cycling infrastructure. There is guidance on infrastructure for other transport modes related to the TEN -T Network (separate safety
79 CROW (2017) Design Manual for Bicycle Traffic: https://www.crow.nl/publicaties/_nieuw-design-manual-for-bicycle-traffic

Blueprint for an EU Cycling Strategy - Chapter 4 - Cycle Infrastructure
Page 40/99
directives related to Road Infrastructure 80 and Road Tunnels 81) but there is no reference to cycling in either.
The proposed changes in EU policy
EU LEVEL
Despite the differences in each Member State there are certain key principles to cycle infrastructure that are universal and should be adopted everywhere and at all levels if cycling growth targets are to be achieved. The EU should set minimum quality criteria based on these principles (tai lored to the likely levels of use). This activity should include identifying common definitions of infrastructure types. The criteria should not go into technical details (e.g. surface material) but instead define the quality from the users’ perspective (e.g. width, type of users etc.). EU funding for projects should be contingent on them meeting, and ideally exceeding, these minimum quality criteria.
The EU should support the preparation of more detailed standards/guidance documents, based on bicycle user needs, at a national level (where they do not currently exist). Again, recieving EU funding should be contingent on such documents being in place.
As well as cycling specific projects, all land based infrastructure projects should take cycling into consideration and provide motivating conditions to increase levels of cycling, including temporary measures (e.g. diversions during works etc.).
The EU should play a more active role in gathering expertise on cycling infrastructure, spreading best practice and building the capacity of public bodies, both in the EU and beyond.
The EU should encourage cities, as innovators, to undertake pilots/tests on cycling infrastructure (e.g. through Horizon 2020 grants). The results and evidence should be communicated together with recommendations for how they can be adapted to suit local circumstances.
NATIONAL LEVEL
Preparation of national standards/guidance documents, w ith EU support, based on bicycle user needs (where they do not currently exist).
EU Added value (and/or cost of non-Europe)
The European Union is spending at unprecedented levels on promoting cycling and improving infrastructure with €1.5 bill ion being allocated during the current financial period through the Cohesion Policy alone 82. It is therefore important that value for mon ey is attained and that infrastructure is delivered that is not compromised to the extent that it will not entice new people to cycle. By following the recommendations set out in this subchapter, it should ensure a high level of service that will help to s upport the growth of cycling.
4.2 EuroVelo and Other Cycle Route Networks
80 http://eur-lex.europa.eu/legal-content/EN/ALL/?uri=CELEX%3A32008L0096 81 http://eur-lex.europa.eu/legal-content/EN/TXT/?uri=URISERV%3Al24146 82 https://ecf.com/what-we-do/european-funding/eu-funds-observatory-cycling
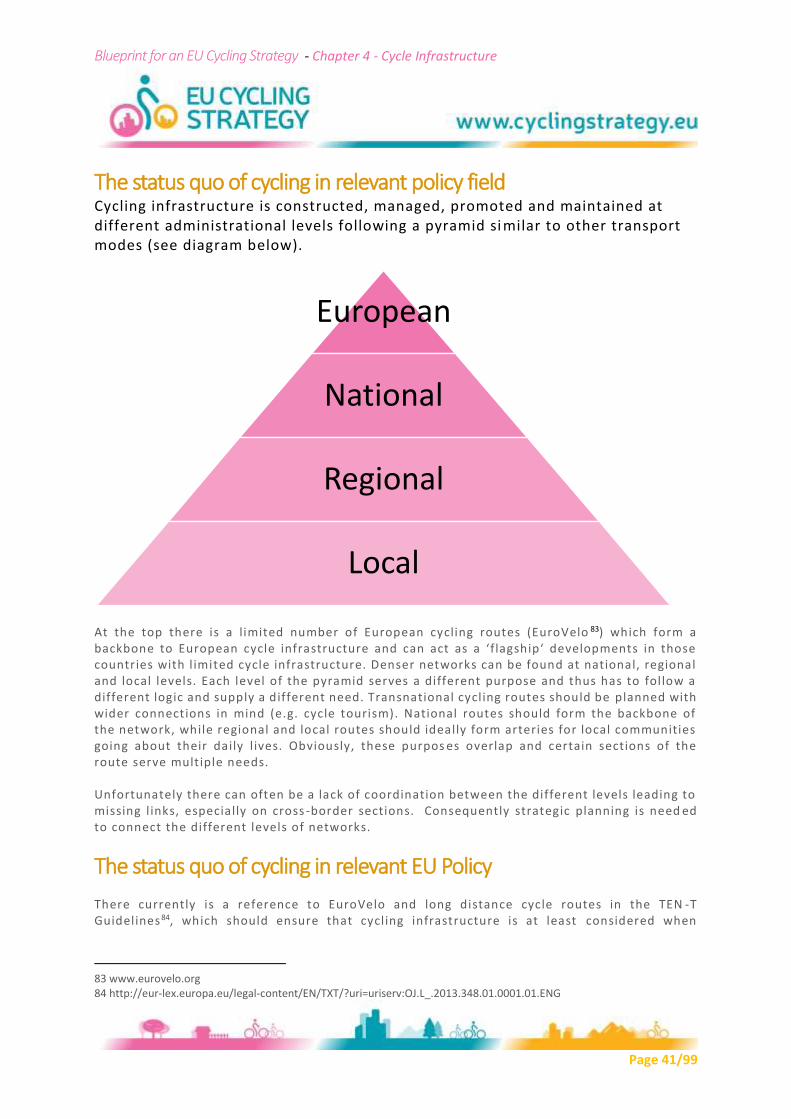
Blueprint for an EU Cycling Strategy - Chapter 4 - Cycle Infrastructure
Page 41/99
The status quo of cycling in relevant policy field Cycling infrastructure is constructed, managed, promoted and maintained at different administrational levels following a pyramid si milar to other transport modes (see diagram below).
At the top there is a limited number of European cycling routes (EuroVelo 83) which form a backbone to European cycle infrastructure and can act as a ‘f lagship‘ developments in those countries with l imited cycle infrastructure. Denser networks can be found at national, regional and local levels. Each level of the pyramid serves a different purpose and thus has to follow a different logic and supply a different need. Transnational cycling routes should be planned with wider connections in mind (e.g. cycle tourism). National routes should form the backbone of the network, while regional and local routes should ideally form arteries for local communities going about their daily l ives. Obviously, these purpos es overlap and certain sections of the route serve multiple needs. Unfortunately there can often be a lack of coordination between the different levels leading to missing l inks, especially on cross -border sections. Consequently strategic planning is need ed to connect the different levels of networks.
The status quo of cycling in relevant EU Policy
There currently is a reference to EuroVelo and long distance cycle routes in the TEN -T Guidelines84, which should ensure that cycling infrastructure is at least considered when
83 www.eurovelo.org 84 http://eur-lex.europa.eu/legal-content/EN/TXT/?uri=uriserv:OJ.L_.2013.348.01.0001.01.ENG
European
National
Regional
Local

Blueprint for an EU Cycling Strategy - Chapter 4 - Cycle Infrastructure
Page 42/99
implementing infrastructure projects for other modes. However, cycling projects cannot be the basis of a standalone project at the moment. Furthermore, the EU has provided support for some routes or networks through individual grants (e.g. Interreg project related to EuroVelo 15 - Rhine Cycle Route 85). There is currently no EU policy or guidelines on cycle route network planning or coordination on international, national, regional or local levels.
The proposed changes in EU policy
EU LEVEL
EuroVelo, the European cycle route network should be included in the TEN -T network.
The EU should issue guidance for the development of national, regional and local networks. This should refer to the Infrastructure Module being developed as part of THE PEP Masterplan on cycling.
The EU should continue to support projects related to cycle route networks and individual routes, particularly cross -border connections (e.g. funding through Interreg projects).
NATIONAL LEVEL
Development of national cycle rou te networks (where they do not currently exist).
Collaboration on cross -border projects related to cycle routes or networks.
Preparation of national cycle signage guidance where they do not currently exist. REGIONAL AND LOCAL LEVEL
Development of regional cycle route networks (where they do not currently exist).
EU Added value (and/or cost of non-Europe)
The European cycle route network should receive the same treatment as the networks for other modes.
4.3 Ensuring Safer Infrastructure for Cyclists
The status quo of cycling in relevant policy field
Unless they are legally prohibited , al l road schemes affect cyclists and therefore the user needs of cyclists must be incorporated into road safety procedures. Currently this is not the case in many Member States. Indeed, in many countries the existing road infrastructure has not been built with cyclists in mind. It is hardly surprising therefore that many potential cyclists are put off by the safety and attractiveness of the infrastructure that they would ha ve to use. Fear of traffic is an oft -cited reason for not walking or cycling. For example, 59% of potential cyclists in London cite safety
85 http://www.rhinecycleroute.eu/

Blueprint for an EU Cycling Strategy - Chapter 4 - Cycle Infrastructure
Page 43/99
concerns as the key barrier to them cycling 86. Introducing safety measures can therefore help
to overcome this fear. Addressing both perceived and objective safety improvements require sl ightly different but necessari ly coordinated approaches. In recent years, the rise of electric assisted bicycles (pedelecs and speed pedelecs - see Chapters on vehicle regulation and on Trade /Industry) have also started to influence decisions with regards to cycling infrastructure:
Is it safe to use these vehicles on current cycling infrastructure?
Should electric bikes share cyclist infrastructure or mix with motor vehicle traffic?
Should pedelecs and speed pedelecs be treated the same or differently with respect to infrastructure use?
Intelligent Speed Assistance is a technology that limits the speed or makes it harder for drivers to go above the limit (see Chapter 5 on vehicle r egulation), which has obvious implications for the safety of cyclists. In order to enable Intelligent Speed Assistance to function across the EU, Member States will have to map speed limits across their road network. There is currently a very varied coverage of speed l imit mapping across the EU with some countries such as the Netherlands ready to go with a reasonably comprehensive and working system, and many others with limited or no coverage.
The status quo of cycling in relevant EU Policy
The European road safety policy orientations (2011 -2020)87 aimed to provide a general framework and challenging objectives to guide national and local strategies to:
Create a cooperation framework based on the exchange of best practices across the EU;
Adopt a strategy for injuries and first aid to address the need to reduce the number of road injuries;
Improve the safety of vulnerable road users Specific actions within the orientations with regards to infrastructure include to “Ensure that European funds will only be granted to infrastructure compliant with the road safety and tunnel safety Directives” and “To promote the application of the relevant principles on infrastructure safety management to secondary roads of Member States, in particular through the exchange of best practices”. EU Directive 2008/96/EC 88 deals specifically with safety of road infrastructure primarily in the context of TEN-T but Member States can extend its scope on a voluntary basis. It mandates the use of four procedures for al l EU road networks, which include road safety impact assessments, road safety audits, network safety management and safety inspections (although it makes no specific mention of cyclists). EPACs/Pedelecs and speed-pedelecs are differentiated into two vehicles at the level of the EU (see Chapter 5 on vehicle regulation for a full breakdown of the EU breakdown on how these bikes are regulated). When we drop down to the national level, this distinction is often followed
86 ETSC (2016) The EUs Role in Promoting the Safety of Cycling: http://etsc.eu/wp-content/uploads/The-EUs-Role-in-Promoting-the-Safety-of-Cycling_ETSC_15-July-2016.pdf 87 eur-lex.europa.eu/legal-content/EN/AUTO/?uri=celex:52010DC0389 88 See footnote 80.
Blueprint for an EU Cycling Strategy - Chapter 4 - Cycle Infrastructure
Page 44/99
and how electrically assisted bikes are treated within national road rules although not always. This means that Speed pedelecs are often treated as mopeds and not allowed on cycling infrastructure. In order to reduce speed of vehicles, the European Commission will be reviewing the type approval of motorized vehicles and will include Intelligent Speed Assistance (see cha pter 5 on vehicle regulation). However in order for the technology to w ork properly the required infrastructure will need to be in place to inform the vehicle of the speed limits. There are currently no coordinated efforts in place for speed limit mapping although there are some specific projects related to this topic that are funded by the commission.
The proposed changes in EU policy
EU LEVEL
As set out under subchapter 4.a, a commitment to high standards of cycle -friendly design should be a condition of receiving EU funding. With this in mind, Directive 2008/96/EC should be extended beyond what is effectively the safest part of the network, the TEN-T. EU citizens travel beyond the TEN-T and should be entit led to equal levels of safety on all roads that they travel on, in all countries. I f the requirements of Directive 2008/96/EC were extended beyond the TEN -T network the use of the four instruments could enable road designers and p lanners to identify the need to design road infrastructure that is safe for cyclists.
The EU can support cycling road safety by financing research and, even more importantly, provide critical appraisal of currently accepted practices. By disseminating of examples of good practice in design, the Commission can showcase those countries that have high cycling numbers, excellent cycling facil ities and safe infrastructure
The EU should promote 30 km/h as the default speed l imit in urban areas amongst the member states. Ideally 30 should km/h be an EU wide default speed in areas where people work, play, walk and cycle (l ink to Chapter 3).
There are many benefits of pedelecs and speed pedelecs but further research is required to understand the safety implicatio ns of their use on existing and new infrastructure, and on interactions with mixed traffic. There is not a great deal of research at the moment, and with the explosion in the growth of these vehicles safety should be explored as it is with cycling or with other modes. Furthermore, information on the development, use and regulation of these vehicles should be communicated from the European Commission to Member States. This would include road safety research; market data; Member State road rules (infrastruct ure use, helmet use, road regulations etc.).
If we are to see the real benefits of Intelligent Speed Assistance (ISA) it is essential that there is a coordinated effort across the EU. Information on speed l imits is currently held and stored, but in a varie ty of formats and by a variety of authorities. There must be a common understanding of data requirements, interface specifications and system performance evaluation. ISA will therefore require action to ensure standardisation at EU or wider international level. This should be coordinated by the European Commission and carried out by Member States.
NATIONAL LEVEL
Cycling should feature in road safety audits. Careful consideration should particularly be given to stipulating the degree of separation required from motor traffic based on the speed and volume of motor traffic and the street context. Most cycling collisions

Blueprint for an EU Cycling Strategy - Chapter 4 - Cycle Infrastructure
Page 45/99
take place at junctions and so junction design is of paramount importance if cycling is to be encouraged.
Member States should undertake the speed limit mapping to ensure that the ISA works efficiently.
EU Added value (and/or cost of non-Europe)
There is real disparity in road safety between member states, which shows that governments alone are not able to provide for a policy framework that en sures level of safety. There is also a real lack of knowledge amongst many Member States on how to start creating safer environments for cyclists despite the fact that within the EU there are some world leaders in cycling safety. This is a perfect market place for the EU to broker good safety standards and contribute to its road safety goals, such as the reduction of fatalit ies and serious injuries. Cross border coordination on speed l imit reduction. Enabling type approved technologies like Intell igent S peed Assistance to work across the single market.
4.4 Cycle Parking
The status quo of cycling in relevant policy field
Bicycle parking is the often overlooked part of bicycle infrastructure planning. However, secure and easily accessible bicycle parking , for example in public transport interchanges and apartment blocks, is a crucial element in the daily modal choice decision of people. A Berlin pilot project on the use of pedelecs for commuting purposes has identified the lack of secure and easily accessible bike parking as a main barrier to a wide -spread use. The French Environmental and Energy Management Agency (ADEME), recently highlighted the positive impact of cycle-rail infrastructure, noting that every bicycle parking place rented generates CO₂ em ission reductions of up to 550 kg per year.
The status quo of cycling in relevant EU Policy
EU Directive 2010/31/EU on the energy performance of buildings currently does not include any provisions on parking. In a proposed update of the directive publish ed in November 2016 89, the Commission encourages the roll -out of the required infrastructure for e -mobility (with a focus on large commercial buildings and excluding public buildings and SMEs) but this does not include electric assisted bicycles.
89 COM (2016) 765 final Proposal for a DIRECTIVE OF THE EUROPEAN PARLIAMENT AND OF THE COUNCIL amending Directive 2010/31/EU on the energy performance of buildings

Blueprint for an EU Cycling Strategy - Chapter 4 - Cycle Infrastructure
Page 46/99
The Alternative Fuels Infrastructure Directive 90 seeks to move from fossil fueled to alternative fueled vehicles, including electric vehicles. Member states are required to provide electric vehicle charging points at certain points both in and outside of urban areas . L-category vehicles are also included within the Directive which means that Speed pedelecs are a part of the Directives aims but not pedelecs currently (see also chapter on vehicle regulations for a discussion on pedelecs and speed pedelecs).
The proposed changes in EU policy
EU LEVEL
Within the remit of the Alternative Fuels Directive Dedicated parking and recharging points for pedelecs should be included Directive to ensure level -playing field with other electric vehicles. Member States should be enco uraged to include charging provision for electric assisted bikes (pedelecs/EPACs) at public transport and commuting (offices) nodes where people are more l ikely to use and park these bikes. Bike parking at these points should be of a high enough quality to overcome the fear of theft or damage to these more expensive machines.
When drawing up national electromobility strategies according to the EU’s Alternative Fuel Directive, due attention and adequate financial support should be given to L -type vehicles like speed pedelecs and electric cargobikes that fall into this category. This includes charging infrastructure, but above all infrastructure for safe parking (which is important due to the higher value of these vehicles compared to conventional bikes) and adapted road infrastructure (which is important due to the higher speed that can be reached). While low-powered pedelecs do not fall under the scope of the directive, they would also benefit from these measures.
EU Added value (and/or cost of non-Europe)
Provide a level playing field for all modes.
90 http://eur-lex.europa.eu/legal-content/EN/TXT/?uri=celex%3A32014L0094

Chapter 5 - Vehicle Regulation
Summary
Of the 4 pil lars 91 of road safety, regulating for safer vehicles is a major EU competence. Vehicle technologies have been moving at an incredible pace over the past few ye ars, with various levels of semi-autonomy being almost standard amongst high end vehicles now and the pursuit of the concept of “driverless cars” and “autonomous driving”. It is also coming at a t ime when road fatalities have been levelling off. In 2014 a bout 26,000 people of all modes were kil led in road accidents throughout the EU. Bicycle fatalities make up 8.1% of the total number of road accident at 2,112 deaths and has fallen from 3,044 in 2005. This is excellent progress, however;
This is a reduction of 30% cyclist fatalities which though good has fallen at a much slower rate than fatalit ies in total at 42%
There has also been a levell ing off of cycling fatalities recently, with 2,170 recorded in 2012 and even a slight increase from 2013 at 2,001. T his is mirrored by the figures for all road fatalities
This is the European Commission’s huge opportunity to kick -start the reduction in fatalities in crashes around the EU. It is also a key time since there are technologies that can really focus on stopping crashes with those outside the vehicle and on speed reduction; these are genuine firsts and could be a real revolution in road safety for cyclists, and indeed for al l road users. Bicycles and electric assisted powered bicycles (pedelecs/EPACs) are de veloped through the International and European standards bodies (CEN and ISO), while higher powered pedelecs (Speed pedelecs) are regulated through two and three wheel motor vehicle Type Approval. These seem to have been successful in creating a stable env ironment for manufacturers to enter into the single market and for safe vehicles for consumers.
5.1 Vehicle safety
The status quo of cycling in Vehicle Safety
Collisions with cars, vans and lorries account for a large proportion of cyclist deaths. Differen t factors influence impact severity between motor vehicles and cyclists including the level of protection provided by the vehicle. For large vehicles the risk of overrun is high, especially when turning, and countermeasures for this are needed. For all veh icles, the shape and stiffness of the vehicle front substantial ly influence injury risk and measures to encourage forgiving vehicle fronts are needed. The number of fatalities for vehicle occupants has been fall ing at a faster rate than that for those outs ide the vehicle, including cyclists, it could be argued that vehicle occupant safety has been priorit ized over those outside the vehicle with regards to road safety measures for the vehicle.
91 Infrastructure; Behaviour; Vehicles; Enforcement

Blueprint for an EU Cycling Strategy - Chapter 5: Vehicle Regulation
Page 48/99
The status quo of cycling in relevant EU Vehicle Safety Policy
The EU has exclusive competence on vehicle safety measures and vehicle type approval under Article 114 of the EU treaty. The European Commission is set to revise the Pedestrian Protection Regulation and the General Safety Regulation (GSR) which set technic al requirements applied to all new motor vehicles sold in the EU market. EU pedestrian protection legislation prescribes requirements for the construction and functioning of vehicles and frontal protection systems in order to reduce the number and severity of injuries to pedestrians and other vulnerable road users who are hit by the fronts of vehicles. The General Safety Regulations prescribe many technological and design safety features, most of which are aimed at increasing the safety of occupants but not those outside of the vehicle such as cyclists.
The proposed changes in EU policy
There is an urgent need to update Pedestrian Protection legislation on motor vehicle testing procedures, including technical features setting requirements for more forgiving car fronts. These should explicitly include the needs of cyclists In particular, for cyclist protection that should be procedures for assessment of automatic emergency braking for turning heavy goods vehicles. There should also be improvements in the crush depth available in the event of a coll ision with an unprotected road user to therefore reduce the number and severity of injuries. Alongside this, the General Safety Regulation (GSR) 2009/661 wil l reconsider current technical requirements applied to all new motor vehicles sold in the EU market. An upcoming revision offers an opportunity to maximise vehicle safety potential by improved heavy goods vehicle cabin design and in -vehicle technologies that will bring safety benefits for both car occupants and for those outside the vehicles such as cyclists. A range of safety technologies, including over ridable Intell igent Speed Assistance (ISA) and Autonomous Emergency Braking (AEB) should be fitted as standard on new vehicles. In particular, for cyclist protect ion that should be procedures for assessment of automatic emergency braking for turning heavy goods vehicles. Of relevance under both the GSR and Pedestrian Protection regulations is the development of a new protocol for consumer testing of cyclist AEB sy stems for passenger cars. The protocol will determine test ranges for bicycle speeds, the coll ision point on the vehicle, size and posture of the bicyclist. This wil l be based on studying databases from 6 EU countries and looking at severe car-to-cyclist deaths and seriously injured to prepare for including this technology in the Euro NCAP testing from 2018. Each year European public authorit ies spend the equivalent of 16% of EU Gross Domestic Product in total on procurement and this is regulated at EU lev el. Criteria for procuring safe vehicles should be integrated into this legislative framework. EU LEVEL
Update existing tests and extend scope of Pedestrian Protection Regulation 78/2009 to include cyclist protection . To ensure the safer design of motoris ed vehicles by extending the head impact zone.
Support the development of airbags for the windshield and windshield frame as a viable safety measure to improve the protection of cyclists and other vulnerable users struck by cars.
Blueprint for an EU Cycling Strategy - Chapter 5: Vehicle Regulation
Page 49/99
Introduce Autonomous Emerg ency Braking Systems which operate at al l speeds, as well as those that can detect cyclists, especially from turning heavy goods vehicles. Introduce energy absorbing front underrun protection for all new heavy goods vehicles to attenuate the severity of cyclist/HGV coll isions.
Ensure that side protection closes off the open space between the wheels of al l new heavy goods vehicles.
Remove exemptions that exist so as to oblige use of side guards to protect cyclists in coll isions with trucks.
Develop new direct vision requirements for trucks that would improve the driver’s current field of view by lowering the eye height and enlarging the size of the window apertures.
Improve the vision of the passenger side both through the windscreen and through the side door window and to the rear.
Develop procurement and other contractual processes to ensure that where construction, infrastructure or any other project or development is supported, partially or in full, via EU funding, that the use of trucks which meet the ne w direct vision, and revised underrun standards as a contractual requirement for that funding, both in construction work and in the operation of major infrastructure projects.
Devise a new simple test procedure to reduce the frequency of cyclist/pedestrians going under the front of the HGV or its wheels.
Adopt legislation for the mandatory fitt ing all new passenger cars and l ight trucks and vans under 3.5 tonnes with Autonomous Emergency Braking (AEB) systems which operate at al l speeds, as well as those th at can detect cyclists.
Adopt legislation for the mandatory fitting of all new vehicles with an overridable assist ing Intell igent Speed Assistance (ISA) system.
Encourage Member States to roll out digital speed map information and make this available to public and private operators covering the entire road network including a function to update changes to speed limits.
Mandate indicator l ights which flash alongside of the truck or the trailer of a truck to show that a truck is turning making this more visib le to cyclists in the surrounding.
5.2 Bicycle Technical Standards
The status quo of bicycle technical standards
The EN ISO standard 4210-10 ‘Cycles — Safety requirements for bicycles’ consists of 9 separate parts and covers technical bicycle safety and ap plies to city / trekking bicycles, mountain bikes, racing bicycles and bicycle for young adults. This series of standards are also l isted as a harmonised standard (l isted under European General Product Safety Directive (GPSD)) in the Official Journal (OJ) of the European Union.
The status quo of bicycle technical standards in EU Policy
Bicycle standards are used to improve safety, strengthen interoperability and enhance consumer choice. In the European Union, bicycles are assigned to the field of applicatio n of the General Product Safety Directive. In recent years, several European and International Standards, including safety -related requirements and test methods for bicycles, have been developed. In 2014, the European standards for city trekking bicycles ( EN14764), mountain

Blueprint for an EU Cycling Strategy - Chapter 5: Vehicle Regulation
Page 50/99
bikes (EN14766), children’s bicycles (EN14765) and racing bicycles (EN14781) were replaced by the International Norm EN ISO 4210 (part 1 to 9). This international standard also contains requirements for young adult bicycles. The requirem ents for children’s bicycles are summed up in EN ISO 8098. This series of standards was published in the Official Journal of the European Union under the General Product Safety Directive. Sticking to the standards of this norm means that the products are in line with the General Product Safety Directive and that they are sufficiently safe. The fact that the General Product Safety Directive neither requires a CE marking of the products nor a conformity declaration of the manufacturers / importers makes it hard to control the products regarding their conformity to the applicable standards. Besides the safety standards for bicycles, international standards for bicycle l ighting and bike trailers have been established in the last few years. In addition to issues of agreeing standards there is the additional EU issue of compliance and enforcement. Without effective compliance there is a r isk to consumer safety and there is not a Competitive Internal Market within the EU. The introduction of type approval for L category Speed EPACs also introduces a new dimension to the industry, requiring a new standard of conformity. The fact that the General Product Safety Directive neither requires a CE marking of the products nor a conformity declaration of the manufacturer s / importers makes it hard to control the products regarding their conformity to the applicable standards. Type approval can also be avoided for machines that fal l outside the current regulations but can be “tweaked” by users or retailers to reach higher power and speeds. Additionally information from the RAPEX database on unsafe products prove that apparently many bicycles, and especially low -quality import articles, are imported to the European Union without satisfying the respective safety standards. In order to protect the consumers from unsafe products stricter controls are necessary at the very moment of the import of the articles to identify unsafe products already when entering the European Union and thus to prevent the market access. Compliance with EU legislation on non -food products is checked during market surveillance activities, the general principles of which are laid down in Regulation (EC) No 765/2008 setting out the requirements for accreditation and market surveil lance relating to the m arketing of products. In addition, most EU harmonised legislation on non -food products and Directive 2001/95/EC contain market surveillance provisions. The European Commission recently carried out a public consultation on the evaluation of the market surveillance provisions of Regulation (EC) No 765/2008 and on actions to enhance enforcement and compliance in the Single Market for goods. This is part of the Single Market Strategy, which can only function well and be fair for people and businesses if all ma rket operators play by the rules. Budgets of national market surveillance authorities have been cut during the last ten years despite a constant increase in the volume of imports of consumer goods from third-countries. Examples of issues arising in the co nsultation can be shown by the Dutch Government position:
“there is a strong need for harmonisation of market surveillance at the points of importation
to prevent ‘shopping’ by selecting the weakest point; and secondly, the capacity of MSAs at

Blueprint for an EU Cycling Strategy - Chapter 5: Vehicle Regulation
Page 51/99
the prime points of importation should be adequate for the work load associated with the
imports.”
There is evidence emerging in 2016 that imports from countries subject to anti -dumping tariffs are deliberately mis-labelling bicycles and EPACs to avoid duties, givin g further evidence that the import controls are inadequate in a large number of member states. With 8 million bikes being imported this creates some limited consumer risk, but as the EPAC and Speed EPAC markets grow there is high risk of non -conforming machines with speeds up to 45kmph and sub -standard batteries also entering the market. Contrary to the standardisation of European and international safety standards, rules of road traffic law for bicycles have not been harmonised so far. In every member sta te, different requirements are in place, e. g. regarding the lighting equipment of bicycles. Moreover, there are different rules in the member states of the European Union for placing bicycles on the market. These different requirements and rules make it h ard for bicycle manufacturers to enter the market in the member states of the European Union.
The proposed changes in EU policy
According to most stakeholders standardisation of the bicycle is reasonably stable and has produced the safest bicycles in the world. EU LEVEL
Mandatory CE marking in the General Product Safety Directive
Stricter controls of imported products at the customs in order to identify unsafe ones and preventing their market access
Continued industry and consumer representation at CEN and ISO
5.3 Pedelec/EPACs, Speed EPAC Regulation
The status quo of cycling in Pedelec/EPACs, Speed EPAC Regulation
Pedelecs (Pedal Electric Assisted Cycles) or EPACS (Electrically Powered Assisted Cycles) are much like bicycles however when pedalling the r ider gets progressive assistance from the electric drive system, the motor cuts off at a maximum speed at 25 km/h. Speed EPACs can also be pedalled like bicycles and gets progressive assistance from the electric drive system, but the motor cuts off at a m aximum speed at 45 km/h.
The status quo of Pedelec/EPACs and Speed EPAC Regulation in EU Policy

Blueprint for an EU Cycling Strategy - Chapter 5: Vehicle Regulation
Page 52/99
Currently the most popular and highest selling EPAC is the sub 250 W EPAC/ sub 25 km/h bike. These lower powered bikes are out of scope of type approval Reg ulation (EU) 168/2013 and regulated through the European Standards Organisation CEN with a view to eventually being incorporated into the International Organization for Standardization ISO which include all other bicycle safety standards. Although these st andards are not legally binding bicycles do fall under the EU General Product Safety Directive and EPACs under the EU Electromagnetic Compatibility (EMC) and Machinery Directives, meaning that if an incident does occur with an electric bike (or bicycle) but the vehicle complies with the standards then it will benefit from a presumption of safety, if this EPAC does not conform there will be no such presumption. It is also seen essential ly as a bicycle by all public authorities with regards to road regulation s. There are also faster and/or higher powered EPACs which are regulated within two and three wheel motor vehicle type approval , even though they are pedal assisted they are viewed as motorised vehicles by the EU authorities, there are two relevant catego ries for these vehicles; L1e-A “powered cycles” – of speeds up to 25 km/h and continuous rated power cut out at 1kW L1e-B for “mopeds” – of speeds up to 45 km/h and continuous rated power up to 4 kW L1e-A deals mainly with tandem bikes or cargo type bikes , though cargo bikes slower than 25km/h and with less than 250W are developed according to EN 15194 standard Though while L1e-B deals with so-called 'speed' EPACs and are classified as mopeds, they are described as “Cycles designed to pedal of vehicle cat egory L1eB in Delegated acts EU 3/2014. Directive 2014/94/ on the deployment of Alternative Fuels Infrastructure will be looking to technical, promotional and strategic solutions to growing the electric vehicle market. Light Electric Vehicles such as Spe ed EPACs and large cargo bikes are included in this as with all other Light Electric Vehicles (LEVs). Though charging for Light Electric Vehicles (LEVs) uses typical domestic charging, barriers of charging sti ll have to be overcome to develop a comprehensi ve public network. Electric bikes require a publicly accessible network of charging points which should be standardised, but separated from the so -called type 2 charging device which is for larger vehicles. The type 2 charging device can serve as a good ex ample but is oversized and not suitable for EPAC applications.
The proposed changes in EU policy
The CEN EPAC standard EN 15194 is currently in the process of a revision. In parallel ISO TC 149 SC 1 is working on a global ISO standard, which will mean dis cussion amongst other international stakeholders. This is currently ongoing with industry participation and will include input from EU cycling consumer organisations. Within type approval there are some concerns with how higher speed EPACs and cargo bikes are treated. Care should be taken when regulating speed EPACs and larger more powerful cargo

Blueprint for an EU Cycling Strategy - Chapter 5: Vehicle Regulation
Page 53/99
bikes that they are not overburdened with the same measures as more powerful motorbikes; this is currently an ongoing process under DGGROW at the European Commiss ion. Since speed EPACs are defined as motorised vehicles (Classification – L1e light two-wheel powered vehicle; sub classification - L1e-B two-wheel moped) within EU type approval, member states then often decide to define them in national traffic legisla tion as mopeds. This means that at member state level the use of speed EPACs on the roads have the same rules as mopeds which often means, moped helmet, driving license and insurance, limited use of bicycle infrastructure. Applying the same national road r egulations for mopeds to speed EPACs may not be the best approach. There is a debate about whether an UN -ECE R22 moped helmet is suitable for the speed EPAC since it is an active mode of transport. On this topic work has been ongoing by the Dutch standards body NEN to create a ‘speed EPAC’ helmet standard which has been accepted by the Dutch government. It is important to keep on monitoring the safety of the Cycling infrastructures, the road users’ behaviours, the trainings for a better use of these vehi cles and last, but not least, the traffic management. Moreover, market uptake, modal share, security/theft, f iscal incentives etc. should be also monitored: work l ike this is important to be transmitted to other member states so they can make the best informed decisions on how to deal with these very new vehicles. These issues are to be dealt with in other chapters. (For road safety of EPACs see chapters 3 and 4 on behaviour and infrastructure; fo f iscal incentives see chapter 7). EU LEVEL
Improve data collection on collisions.
Monitoring of how classification of these vehicles works and its relationship to information about management of these new vehicles on the roads should be continued.
Continuing current good collaboration in standards development a t the global level.
Include EPACs and LEVs in the context of the Alternative Fuels Infrastructure with regards to promotional and technical coordination to increase the numbers of electric vehicles.
To continually work with all stakeholders to enforce the prevention of tampering.
To improve information coming from retailers to consumers concerning the use of bikes.
Together with Member States to ensure deployment of the Alternative Fuels Directive includes comprehensive charging networks for LEVs
5.4 Automated and Autonomous Vehicles and Cyclists
The status quo of cycling in EU policy on the development of automated and autonomous vehicles
At present there is an urgent need for a new harmonised regulatory framework for automated driving at EU level. This should take other road users such as cyclists into account. Setting this up would be an essential precursor to automation. A multi -stakeholder initiative called Gear 2030 was launched by the European Commission and will aim to develop a roadmap for

Blueprint for an EU Cycling Strategy - Chapter 5: Vehicle Regulation
Page 54/99
automated driving in the EU in 2017. A range of EU legislation from vehicle type approval, driver licencing, data protection and insurance wil l have to be revised. In parallel, the C-ITS Platform was created in 2014 gathering national authorit ies, C -ITS stakeholders and the Commission. This follows on from the ITS Directive 2010/40 and the ITS Action Plan. Its most recent report published in January 2016 sets out a roadmap and a deployment strategy for C-ITS in the EU. The C-ITS Masterplan prepares the way for th e priority C-ITS applications was published in November 2016. “Safety and the potential to reduce accidents caused by human error” is one of the main motivations for higher levels of automated driving, according ERTRAC. This is especially so if they are programmed to watch out for and be sensitive to the needs of pedestrians and cyclists. Automated driving can therefore be considered as a key aspect to support several EU transport policy objectives including road safety. However, research to assess the po tential of automated driving’s safety benefits is only just beginning.
C-ITS, automation and how to connect Cyclists
ITS can detect the presence of cyclist/pedestrians and can also act to prevent a collision. More research is needed to find out how well cu rrent systems detect cyclists and are able to prevent deaths and injuries 92. An EU report on C-ITS highlighted the challenge posed by unequipped users, including cyclists 93. A recent EU funded project cyclist/pedestrian - ITS has come up with a list of recommendations on how Cyclists and pedestrians can be integrated and reap the full benefits of C-ITS94. It has prepared a road map for deployment of cyclist/pedestrian applications. One of its key recommendations is that cyclists could benefit from the development of a statement of principles (similar to the HMI Statement of Principles for in -vehicle systems 95) for ITS. A real concern, especially during the introduction and transitional stage of automation, is looking at how these vehicles wil l interact with vu lnerable road users. Of course some of the in-vehicle safety technologies now already being deployed are specifically able to help prevent coll isions with cyclist/pedestrians. Although research is ongoing with new ideas in this field 96, at present pedestrians and cyclists are largely unequipped with ITS safety equipment which might allow them to interact with automated vehicles. This means that in a more and more connected transport system active modes of transport will be locked out 97. However more positively, C-ITS and the emerging driverless technologies can be used to better manage traffic, including congestion charging, restricting access to urban areas etc. Interaction between non autonomous vehicle drivers and cyclist/pedestrians often takes the form of communication through eye contact. Vehicles and their sensors and cameras will have to go above and beyond simple detection and be able to pick up on different forms of
92Hynd, D., et al. (2015) Benefit and Feasibility of a Range of New Technologies and Unregulated Measures in the fields of Vehicle Occupant Safety and Protection of
Vulnerable Road Users, Transport Research Laboratory. http://goo.gl/tmwYqp
93European Commission (2016) C-ITS Platform Final Report. http://goo.gl/B6JVFD
94VRUITS (2016) Recommended practices for improving usability of ITS applications and the integration of VRUs in C-ITS systems. http://goo.gl/3uK6hz
95European Commission (2008) European State of Principles of in-vehicle systems. http://goo.gl/ldvZ7l
96 http://www.prospect-project.eu and http://www.vruits.eu/
97 There are also consequences of this for transport planning chapters 2 and 4 looking at cycling promotion, active travel planning and infrastructure

Blueprint for an EU Cycling Strategy - Chapter 5: Vehicle Regulation
Page 55/99
communication. Risk compensation and risk management methods by cyclists and drivers may be radically altered. New ITS are also emerging and the use of personal devices by cyclists are on the rise, some could help cyclists themselves for example for navigation and safe route choice but could also be a cause for concern with distraction. I TS is already being built into e -bikes with, for example, haptic handle bars which give feedback warnings and in cyclist safety equipment. Please see also the Chapter on Smart cities, ITS and smarter Cycling.
The proposed changes in EU policy
EU LEVEL
Develop a coherent and comprehensive EU regulatory framework for the deployment of automated vehicles.
Revise the EU type approval regime to ensure that automated vehicles comply with all specific obligations and safety considerations of the traffic law in d ifferent Member States.
Revise type approval standards to cover all the new safety functions of automated vehicles, to the extent that an automated vehicle will pass a comprehensive equivalent to a ‘driving test’. This should take into account high risk sc enarios for occupants and road users outside the vehicle.
Conduct research looking at the transitional phase of mixed automated and semi -automated vehicles and interaction with vulnerable road users.
Develop an Human Machine Interface Statement of Principl es for use of ITS by cyclists to guide the design of how cyclists interact with devices, apps and other smart technology without risky or distracting behaviour.
Develop EU guidelines and regulations for the use of mobile devices by cyclists, with a target to minimise distraction.
Encourage research on vehicle detection systems to warn cyclists.

Chapter 6 - Achieving Global Policies through Cycling
Summary Cycling implements global policies on a local level
The Global Policies – comprising the Paris Agreement on Climate Change, the Sustainable Development Goals and the New Urban Agenda – carry a strong mandate to promote cycling. The EU has started to implement these policies through multiple internal and external strategies. For example, the Paris Agree ment is reflected in the EU’s ambitious goal to reduce GHG emissions by 80% in the EU by 2050. Furthermore, the “European Consensus on Development” announces an adjustment of the development cooperation of the EU, which will be geared towards achieving the Sustainable Development Goals. However, the strategies do not account sufficiently for the potential of cycling and active mobility in order to reach the global targets. The necessary shift of priorities in the transport system is mentioned only sporadically in the documents. This goes in hand with only a minor portion of EU development cooperation being dedicated to comprehensive sustainable mobility planning, even though a large portion of its budget is dedicated to the transport sector. The EU’s strategy documents build the basis for the further development of internal and external policies. It is therefore crucial that they emphasise the cross -cutting benefits of sustainable mobility and specifically cycling in order to reach the Paris Agreement and the SDGs. Financial and technical cooperation programmes should tap the full potential of cycling by dedicating more means to sustainable mobility planning and implementation. The exchange of Directorate-General for Mobil ity and Transport (DG MOVE) with im plementing bodies is conducive to using existing knowledge for development cooperation. Finally, this knowledge should be enriched and exchanged through mutual learning with partner countries.
6.1 Status Quo on Global Policies: what’s in it for Cycling in the EU?
The past three years have brought with them three major global processes: the Paris Agreement, the Sustainable Development Goals, and the New Urban Agenda. Cycling is essential to achieving the global agendas - and the EU has shown it is eager to respond in a strong manner to the challenge of reaching these goals. This subchapter elaborates on policies that are derived from the global agendas and focused on EU -internal action.
Paris Agreement
The Paris Agreement, the framework for global actions t o address climate change adopted in December 2015, aims to maintain the increase in global temperature below 2 degrees (2DS). The agreement required all countries to prepare Nationally Determined Contributions (NDCs) as a means to view commitments and trac k progress. The preparation and reporting of NDCs is legally binding.
Blueprint for an EU Cycling Strategy - Chapter 6 - Global Policies
Page 57/99
Transport is a key sector in this agreement. It is one of the few sectors that keeps growing on emission levels - and it already accounts for 23% of all energy-related greenhouse gas emissions (IEA 2016). In order to reach the 2° target, the transport sector has to completely decarbonize between 2045 and 2055 (UNEP 2016). Achieving this requires a comprehensive, cross -sectorial strategy for which cycling provides a climate -neutral alternative in passenger and freight transport. However, while transport on the whole is explicit ly mentioned in 75% of the NDCs submitted, cycling and walking are only mentioned in 14% of those (SLoCaT 2016). The European Commission, on behalf of all 28 member states, submitted a joint NDC with the objective of at least 40% domestic reduction in greenhouse gas emissions by 2030. Sectors are supposed to share the necessary efforts, with greater energy efficiency being a key component of the measures (European Union 2015). This feeds into the 2030 energy and climate framework and the Roadmap 2050 , both being strategies to reach substantial GHG emission reductions. By 2030, CO2 emissions sh ould decrease by 40% compared to 1990 levels and continue to an 80% reduction by 2050. Transport is supposed to contribute to this by a 60% emission reduction from 1990 levels by 2050 (European Council 2014) . The decarbonisation of the transport sector and the 2° target wil l only be achieved if a transformation of mobility as well as a decarbonisation of drive trains takes place. The EU’s NDC, as well as the guidin g documents of the 2030 energy and climate framework as well as the Roadmap 2050 are largely focused on the latter and mention cycling not at all or only sporadically (European Commission 2011, para. 2.4) .
Sustainable Development Goals (Agenda 2030)
The Sustainable Development Goals are a set of 17 goals - also known as Agenda 2030 - with 169 targets to achieve them. In order to reach the Sustainable Development Goals (SDG) accessibility is key . Although transport has no dedicated SDG, achieving most of the goals will be difficult without a function ing mobility system . Active mobility is the most equitable form of mobility - providing access to jobs, markets, and education - therefore a shift in the transport sector can be a central point to directly deliver on the Sustainable Development Goals . Cycling incorporates great potential to facil itate this change. The European Cycling Foundation ( ECF) has identified 11 out of the 17 goals to which cycling directly contributes (ECF 2015), showing the importance of cycling in achieving these targets. For the Sustainable Development Goals , the European Union has set up two work streams: in short term up to 2020 EU policies will be evaluated on their ability to meet the goals. In mid -term, changes to EU policies will be implemented post 2020 in order to reach the goals. The European Commission’s communication on the implementation of the SDG’s already referred to the importance of sustainable mobility systems as an enabler to achieve some of the goals (European Commission 2016a) . However, the linkage of active mobility to the SDGs, which has been elaborated above, has to be carried to implementation of cycling policies and infrastructure.
New Urban Agenda

Blueprint for an EU Cycling Strategy - Chapter 6 - Global Policies
Page 58/99
Launched on the occasion of the Habitat II I conference in Quito in 2016, the New Urban Agenda is an action-oriented document which sets global standards for sustainable urban development. It is clearly mandating governments to promote cyclin g due to its potential on better public spaces (§37), more livable cit ies (§100) , road safety (§113), access for al l through priorit izing cycling and walking over private motorized transportation (§114) as well as the encouragement of all government levels to develop and explore financial instruments to improve infrastructure including cycling (§118). As stated in the European Commission’s event at the Habitat II I in Quito, the main implementation of the New Urban Agenda in Europe wil l take the form of th e Urban Agenda for the EU. It aims to strengthen the urban dimension in Europe, also by ensuring better access by cities to European funds and facilitating knowledge exchange between cities. The work on the Urban Agenda for the EU is st ill on -going and its shape and impact remains to be seen.
6.2 The Status Quo: How does the EU use the global agendas to promote cycling worldwide? The Global Policies call for action in Europe, but also worldwide. The many facets of European Union’s development cooperation can contribute substantial ly to the achievement of the goals. It is mainly carried out by the Directorate -General International Cooperation and Development’s (DG DEVCO), but also other bodies such as the Directorate-General for Neighbourhood and Enlargemen t Negotiations (DG NEAR). The Paris Agreement has already left a mark: With 14 bill ion Euros of the 2014-2020 EU foreign aid budget earmarked for climate relevant projects , we see a substantial shift in priorities - consistent with the current EU internal budget reorientation. (European Commission 2013) Energy and cl imate is a also focus area in DG DEVCO ’s management plan (DG International Cooperation and Development 2016, 18ff.) The interface of these topics with sustainable transport is already reflected in some programmes for technical cooperation : the EUROCLIMA+ programme of DG DEVCO supports the Mobil iseYourCity -init iative, which implements cl imate-friendly Sustainable Urban Mobility Plans (SUMPs) in its partner cities . Since the concept of SUMPs was developed by DG MOVE, this makes an excellent example for the potential of good cooperation between the EU bodies as well as the facil itation of knowledge exchange with other parts of the world. The EU is also engaged in other projects dedicated to cl imate and transport. The Global Covenant of Mayors ’ member cit ies commit to reduce greenhouse gas emissions by at least 40% by 2030. This effort takes up the goal of the Paris Agreement, but also the idea of the New Urban Agenda to strengthen cities in their role to reach sustainable urban development. Through the Sustainable Energy and Climate Action Plans , the cit ies draw measures to reach their aims - including a transport chapter. The EU provides an array of funding opportunities for European cities. By using the European Neighbourh ood and Partnership Instrument , the EU has punctually f inanced their implementation with Sustainable Urban Demonstration Projects in various adjacent states. However, support for non-EU members is not yet steady . With the adoption of the Sustainable Development Goals, the EU also started to readjust their development cooperation towards the achievement of the goals. Firstly, this was tackled by

Blueprint for an EU Cycling Strategy - Chapter 6 - Global Policies
Page 59/99
developing a new “European Consensus on Development” (European Commission 2016b) . In this, the EU and its member states pledge to support more resource efficient urban infrastructure, including transport. (European Commission 2016b, para. 46) In addition, DG DEVCO funds a variety of infrastructure measures. A strong focus l ies on Africa and the road sector (Ecorys 2016b, 15f.) , with the provision of infrastructure, equipment and technical assistance accounting for most expenditures (Ecorys 2016a, 10). By enhancing access to education and jobs, especially for the rural population, it contribute s to a variety of SDGs. However, efforts to support a comprehensive approach to urban mobility and cycling are still minor . Lastly, there are EU funded research projects through Horizon 2020 that target the improvement
of sustainable mobility planning worldwide. For example the SOLUTIONS project focused on
transferring knowledge between cities from different parts of the world. Also other research
projects, such as FUTURE-RADAR, have global knowled ge exchange components in them.
6.3 The proposed changes: Recommendations to change activities
The global agendas can only be achieved through global action. The EU’s strategic documents are ambitious by focusing budgets and programmes to reach the agenda’s goals – but cycling will have to play an integral part in order to achieve this. This is not yet appropriately covered in the according documents: the role of avoiding trips and shifting to low carbon modes in order to tackle climate change has to be covered better in the EU joint NDC, the 2030 energy and climate framework as well as the Roadmap 2050. While efficient and sustainable urban transport infrastructure is mentioned in the European Consensus on Development, the paragraph names only the econo mic benefits of those measures. More emphasis should be laid on the cross -cutting benefits of the promotion of active mobility, which delivers on many of the Sustainable Development Goals. The European Union disposes of an array of good practices to promo te cycling, ranging from planning systems such as SUMPs to examples of adequate infrastructure. At the same time, only a fraction of the international cooperation efforts are utilizing this existing knowledge . We urge the EU to take its own climate -, SDG-, and NUA-related strategies seriously and to account for sustainable mobility in its development cooperation to a larger extend. To move forward with this is crucial to take advantage of the existing expertise by enlarging DG MOVE’s cooperation with implementing bodies, such as DG DEVCO and DG NEAR. The goal of this cooperation should be to dedicate more means to the support of comprehensive mobility planning that includes active mobility in an urban and rural setting. The European foreign aid budget sh ift towards more climate projects means that DG DEVCO needs to scale up its programmes to strengthen local capacity, as planning for sustainable transport systems requires larger capacity and tools due to their complexity. Partial ly, DG DEVCO has started to provide sector- instead of project -based support, which could be a good starting point, if accompanied with knowledge exchange appropriately. In financial

Blueprint for an EU Cycling Strategy - Chapter 6 - Global Policies
Page 60/99
cooperation, a special focus should be on inclusive designs that take the needs of pedestrians and cyclists into account. The Global Covenant of Mayors represents a substantial resource of cities dedicated to low -carbon development . In order to harness this, steady funding mechanisms should be put in place to setup and implement Sustainable Energy and Climate Action Plans for non-European member cities, e.g. through the EU Neighbourhood Policy. Funding guidelines for research under the Horizon umbrella should account for projects that also test for the applicability of their f indings in a global contex t. Furthermore, exchange knowledge and mutual learning with partner from the global South should be a bonus in the application process. We therefore recommend to…
emphasise the cross-cutting benefits of active mobility in relevant strategy documents , such as the 2030 energy and cl imate framework and the European Census for Development and any forthcoming documents .
establish a regular exchange format between DG MOVE and DG DEVCO as well as DG NEAR and develop a joint work plan on deploying sustainable mobi lity concepts worldwide.
enlarge technical assistance programmes that are dedicated to support active mobil ity and cycling, e.g. through better urban mobility planning. Existing programmes include EUROCLIMA+ and its MobiliseYourCity init iative as well as t he Global Covenant of Mayors’ energy and climate action plans.
enforce infrastructure designs that account for the need of active modes of transport in EU financed projects.
facilitate global knowledge exchange , also through research projects.
The benefits of EU added value: small interventions have big impact worldwide
The EU is in a posit ion reach its N ationally Determined Contributions as well as to assist developing and emerging economies to fulfi l their climate change obligations. Through various streams of technical assistance and financial aid as described above, small interventions around the world can have an impact worldwide

Blueprint for an EU Cycling Strategy - Chapter 6 - Global Policies
Page 61/99
Zambia
Access to cycling can unlock income shows a study on dairy farmers in Zambia: Farmers
who were given bicycles made up to 25% more deliveries, transported 23% more litres of
milk each trip and increased income by 23%, compared to farmers who walked or used
other transportation modes. Similarly, enrolment figures in schools rise significantly
when children have access to a means of transport. This is especially true for girls. (WBR
2016) By scaling up the EU’s cycling promotion worldwide, the European Union can
strengthen this direct economic impact on the life of many people, also in rural areas.
Ukraine
In Ukraine, cycling has experienced a massive boost during the recent five years. This is
supported by awareness rising for the general population and decision makers as well
as capacity building on network planning and facilitating cyclist needs – facilitated by
activists and funded also through international cooperation projects. The efforts show
effect: in Kiev, the amount of people cycling increased after establishing a bike path on
a key connector street. However, many new roads are still poorly designed. This can be
partly tackled by establishing national standards, but another big challenge remains in
building up the knowledge basis and capacity in municipal administrations to facilitate
the shift in priorities appropriately.
International cooperation programmes, such as various GIZ programmes supporting
Lviv in becoming Ukraine’s bike capital, have supported local professionals in creating a
momentum of change. This momentum needs to be carried onward by further
supporting Ukraine’s arising cycling culture technically and financially, for example
through the European Neighbourhood Policy programme.

Chapter 7: A Financial + Fiscal Level Playing-Field for
Cycling with Other Modes of Transport
Summary
In order to ach ieve a substantial modal shift towards cycling, investments are needed – both in “hard measures” like building new infrastructure and in “soft measures” l ike behaviour change campaigns. Often there is not enough money allocated to cycling at the relevant a dministrative levels to implement necessary measures. This is because cycling is not valued as an equal mode of transport in investment plans and thus results in no set share of budget dedicated to cycling. European funding schemes could be used as front -end financing but are not used to the full potential, mainly because they are scattered over different funding channels and because a coordinated strategy for funding cycling at the EU level is lacking at the moment. Therefore, cycling should be streamlined into all relevant EU funding streams. The financial means available for cycling measures should be further increased during the next Multiannual Financial Framework, and recipients should be encouraged by the Commission to use them. In the field of public procurement, current EU Green Public Procurement Guidelines do not yet encourage a modal shift towards sustainable modes of transport like cycling. Therefore, it should be an obligatory step in procurement procedures according to the EU GPP criteria to check if the purchase of passenger cars can be replaced by using bicycles ( including pedelecs), and cargobikes (including electric cargobikes) instead of LCVs. Monetary incentives are a powerful tool to steer behaviour. Taxation is mainly a national competence, however, the EU can give valuable recommendations in this field. While in many countries, tax benefits are available for people using their car or public transport for their daily commute to work, fiscal incentives for cycling are only granted in a f ew countries. Additionally, the introduction of e-bikes to the market opens up a new segment of bike use that goes far beyond conventional bikes in terms of distance and convenience. Yet again, the high potential is not fully tapped because of considerably higher purchase costs. Fiscal incentives for cycling can range between tax benefits to install cycling -friendly infrastructure in companies, subsidies for commuting by bike (direct or indirect), or reduced VAT rates for the purchase and repair of bikes. At the same time, steps should be taken to go towards a taxation of car-driving that takes into account all externalit ies, for example by introducing congestion charging or by increased fuel taxes that reach the same level for both diesel and petrol. Addit ionally, the EU and Member States should develop holistic e -mobility strategies, promoting not only e -cars but also e-bikes. The aim is to have cycling acknowledged as equal mode of transport in the fiscal system, providing a level playing field for al l mo des of transport. Finally, increasing cycling will need a stable supply of high -quality bikes. European producers have shown to be world leaders in these field. Therefore, trade and competition policy measures should make sure that there is a favourable c limate for the EU cycling industry to unfold its innovation potential, to create new green jobs and to supply consumers with high -quality bikes that are fit for everyday use.

Blueprint for an EU Cycling Strategy - Chapter 7: A Financial + Fiscal Level Playing-Field for Cycling with Other Modes of Transport
Page 63/99
7.1 Subsidies for Cycling a. Funding for Investments in Cycling
The status quo of cycling in a relevant policy field
In the previous Multiannual Financial Framework, which covered the period from 2007 to 2013, approximately EUR 600 million was allocated to cycling. Regarding the current period (2014 – 2020), we estimate that EUR 1.325 billion of EU funds can be used for cycling, based on the explicit references included in the current versions of the programming documents. If we take into account the implicit and indirect references as well, cycling -related measures can absorb an estimated EUR 2.041 billion of EU subsidies. This is more than twice or, if we count all references, more than three times as much as was available in the former period. This is positive news but the distribution of the funds is unequal among countries and reg ions, as is the type of projects that can be supported. The following EU level funding streams available that could be used for promoting cycling:
European Regional Development Fund and European Agriculture Fund for Rural Development are the main source f or cycling projects
The Connecting Europe Facility (CEF) can be used for the development of cycling infrastructure measures connected to the Trans -European Transport Networks (TEN -T).
The Horizon 2020 programme can support innovation and research projects containing cycling components.
The COSME programme can support the competitiveness of cycling -related enterprises (e.g. cycling related manufacturing SMEs) and European -scale cycling tourism projects.
The LIFE programme can support environment - and climate-related actions.
Erasmus+ and Europe for Cit izens programmes can support European campaigns, events and other “soft” measures to involve European citizens, change their perceptions and/or behaviour (for example to promote physical activity).
However, there are some major challenges to a coordinated and efficient use of EU funds for cycling:
The current TEN-T Guidelines provide an opportunity to co -finance cycling-related measures through CEF but the current wording does not support standalone cycling projects (they have to be part of a wider project) and there is no obligation to integrate cycling-related measures
The European Commission discouraged Member States and regions allocating funding for cycling-related measures in their Operational Programmes ( OPs).
The Horizon 2020 programme has a strong focus on supporting R&D&I in the car sector only, without taking a holistic view on changing the mobil ity system to make it more sustainable.
The proposed changes in EU policy Based on examples from all around Europe, the following suggestions can be made for investment levels in infrastructure and promotional measures. The investment levels are aggregated over all levels of governance:

Blueprint for an EU Cycling Strategy - Chapter 7: A Financial + Fiscal Level Playing-Field for Cycling with Other Modes of Transport
Page 64/99
Category/modal share Level Grow
Starter (up to 10%) 5€ 10€
Climber (10-25%) 10€ 15-25€
Champion (over 25%) 25€ 30€
EU LEVEL EU Funds provide a unique opportunity to boost cycling by providing additional resources for direct and indirect cycling-related measures. To use this opportunity, cycling needs to be treated on an equal footing with other modes of transport also when it comes to funding:
Cycling should be streamlined into all relevant EU funding streams. This requires a close and regular coordination between all the responsible DGs within the Commission and the executive agencies. 10% of the EU’s transport budget should be invested in cycling measures.
The financial means available for cycling measures through the Cohesion Policy should be further increased during the next Multiannual Financial Framework, and regions a nd cities should be encouraged by the Commission to use them. The use of these means could be made more efficient by developing European guidelines for cycling measures that include best practices, and that regions and cities can use when implementing cycl ing measures co-funded by the EU.
The Connecting Europe Facil ity (CEF) should fully integrate the EuroVelo network into the Trans-European Transport Network (TEN -T).
The transport part of the Horizon 2020 programme should move from researching funding that is focused on developing new forms of cars to an approach that looks at the mobility system as a whole, and includes (electric) cycling as an innovative form of transport and an integral part of the smart cit ies of the future.
Cycling measures should be incorporated in all relevant land -based transport projects co-funded by the EU.
NATIONAL LEVEL
When drafting operational programmes for the EU Cohesion and Rural Development Funds, national and regional administrations should ensure that cycling projects a re eligible to receive an adequate share of funding from the transport and tourism -related parts of the programmes.
Cycling strategies should be adopted at the national and regional level and include concrete provisions on adequate funding levels for infra structure and promotion measures.
REGIONAL AND LOCAL LEVEL
At the regional and local level, administrations should make sure that they have the capacity to use available funding for cycling from the national and the EU level, meaning that there should be enough staff working on this topic and that this staff should have adequate knowledge about all funding opportunities.
Regional and local authorities should use adequate levels of own resources to co -finance investments and maintenance of cycling projects in order to reach the target investment levels stated above.

Blueprint for an EU Cycling Strategy - Chapter 7: A Financial + Fiscal Level Playing-Field for Cycling with Other Modes of Transport
Page 65/99
EU Added Value (and/or cost of non-Europe)
Funding cycling measures gives the opportunity to promote cycling also to regions that do not have enough own means, and where cycling levels are curren tly not high enough to justify large investments through this limited own means. Furthermore, a coordinated EU funding strategy for cycling with guidelines on how to best use the available means can encourage others to make more and better investments as w ell.
b. Financial incentives for purchasing electric bicycles
The status quo of cycling in relevant policy field
Despite their obvious benefits, many public e -mobility strategies in Europe, including at EU level, focus exclusively on cars and do not take into account the possibil ities that other forms of electric mobil ity l ike e -bikes offer for making the transport system as a whole more sustainable. For example, Germany had already spent circa EUR 1.4 bill ion of public subsidies on research and development of electric cars by 2014, and added another subsidy scheme of almost EUR 1 bill ion, including a buyer’s premium, in 2016. The results of this massive investment are rather disappointing to date: there are 25,500 purely electric cars on German roads toda y, and the target of having rolled out 1 million electric cars by 2020 seems almost impossible to reach. At the same time, electric bikes have seen a massive uptake in Germany during the same period with practically no public subsidies involved either for research and development or for purchase premiums, apart from some small pilot projects. Currently, approximately 2.5 mill ion electric bikes are in use in Germany, and the number would probably be much higher had there been the same targeted and massive pu blic financial support as for electric cars.
The proposed changes in EU policy
E-bikes are sti ll considerably more expensive than conventional bikes. While there has been a large uptake in several countries (Germany, the Netherlands, Belgium), their market development is sti ll in the take -off phase in others. Purchase subsidy schemes could help to bridge this price gap. We suggest an approach adapted to market conditions:
In markets with low sales figures, a purchase subsidy of EUR 500 (around 10% of the current purchase subsidies of electric cars in many European countries) could help to bridge the price gap to conventional bikes and facil itate market uptake of electric bikes (including low-powered as well as speed pedelecs), which in turn have a high poten tial to achieve a modal shift away from car trips to cycling.
In more mature markets, more targeted subsidy schemes, e.g. for speed pedelecs and electric cargobikes due to their higher price, or for charging infrastructure in small businesses could be an option. Subsidies for electric bikes could also be given as a reward for cancell ing a car’s registration.
EU Added Value (and/or cost of non-Europe)

Blueprint for an EU Cycling Strategy - Chapter 7: A Financial + Fiscal Level Playing-Field for Cycling with Other Modes of Transport
Page 66/99
Following a balanced electromobility promotion strategy which includes e -cycling wil l help the EU to make its transport system as a whole more sustainable and tackle issues such as congestion or public health problems due to physical inactivity, which does not happen if the only focus is electric cars.
7.2 Cycling Friendly Public Procurement
The status quo of cycling in relevant policy field
The Clean Vehicles Directive (Directive 2009/33/EC of the European Parliament and of the Council of 23 April 2009 on the promotion of clean and energy -efficient road transport vehicles), 98 as well as the current non -binding EU Green Public Procurement Criteria (EU GPP) for Transport, published in 2012, 99 only take into account improvements of motorised vehicles in terms of energy use and emission reductions. They do not yet encourage a modal shift towards sustainable modes of transport l ike cycling.
The proposed changes in EU policy
EU LEVEL
Procurement criteria should not only strive to make marginal improvements on cars and light commercial vehicles (LCVs) bought by procurers, but also to achieve a modal shift towards environmentally fr iendly transport modes like cycling. Therefore, it should be an obligatory step in procurement procedures according to the EU GPP criteria to check if bicycles (including pedelecs) can be bought instead of passenger cars, and cargobikes (including electric cargobikes) instead of LCVs.
Recommendations should also include the replacement of a service car pool for public bodies by a subscription to mobility services, which include flexible access to public transport, car-sharing and (electric) rental bikes.
The provision of postal and courier services by environmentally friendly transport modes l ike cycling is a dynamic and rapidly expanding sector, in which many local SMEs are active throughout Europe. Including these services in the criteria and givi ng recommendations on the use of bike/cargobike postal and courier service would therefore give a boost to local economies in the EU while at the same time reducing congestion, air pollution and CO2 emissions.
NATIONAL LEVEL
National, regional and local a uthorit ies should integrate the criteria mentioned above in their procurement policies and ensure that cycling is streamlined into all relevant procurement procedures regarding mobility and logistics.
EU Added value (and/or cost of non-Europe)
98 http://eur-lex.europa.eu/legal-content/EN/TXT/HTML/?uri=CELEX:32009L0033&from=EN
99 http://ec.europa.eu/environment/gpp/pdf/criteria/transport.pdf

Blueprint for an EU Cycling Strategy - Chapter 7: A Financial + Fiscal Level Playing-Field for Cycling with Other Modes of Transport
Page 67/99
The public sector stands for an important part of transport and mobil ity usage in the EU. EU guidelines on green public procurement for transport that include cycling as an integral part have therefore a large potential to improve transport and mobil ity systems, also in countries and regions with currently low cycling rates and where the public sector could be a forerunner.
7.3 Cycling Friendly Taxation Systems a. Pro-cycling Personal Income and Corporate Tax
Regulations
The status quo of cycling in relevant policy field
While in many countries, tax benefits are available for people using their car or public transport for their daily commute to work, fiscal incentives for cycling are only granted in a few countries. Monetary incentives are a powerful tool to steer beha viour; they have the potential to bring about a substantial modal shift, especially if subsidies for commuting by car (direct or indirect, e.g. favourable company car tax regimes) are abolished at the same time. Whether incentives for cycling are introduced or incentives for car use abolished, the result should be a fiscal system that is mode-neutral, providing a level playing field for all modes of transport.
The status quo of cycling in relevant EU policy
At the EU level, a study commissioned by the Dire ctorate-General for Taxation and Customs Union of the European Commission points out that direct revenue loss to state budgets linked to the under-taxation of company cars may approach 0.5% of EU GDP (€54 bill ion) and welfare losses from distortions of con sumer choice might be equal to 0.1 to 0.3 percent of GDP (€12 bill ion to €37 bil lion). 100 In its White Paper on Transport from 2011, the Commission set itself the goal of addressing these distortions during the first phase of the implementation of the White Paper by 2016: “Reassess transport taxation where necessary, namely by l inking vehicle taxation to environmental performance, reflecting on possible way forward to review the current VAT system concerning passenger transport, and revising company car taxa tion to eliminate distortions and favour the deployment of clean vehicles.” 101
Up until now, little has been done to realise these ambitions. The only time the EU has addressed the issue in the framework of the European Semester is in the Country -Specific Recommendations for Belgium for 2016; however, it is mentioned only in the recitals, fal ling short of being included in the concrete recommendations:
100 https://ec.europa.eu/taxation_customs/sites/taxation/files/docs/body/taxation_paper_22_en.pdf
101 http://eur-lex.europa.eu/legal-content/EN/TXT/HTML/?uri=CELEX:52011DC0144&from=EN

Blueprint for an EU Cycling Strategy - Chapter 7: A Financial + Fiscal Level Playing-Field for Cycling with Other Modes of Transport
Page 68/99
“(11) There is also considerable potential for a ‘green’ tax shift which stems from, among other things, the favourable tax treatment of company cars and fuel cards, which contribute to pollution, congestion and greenhouse gas emissions.” 102
The proposed changes in EU policy
EU LEVEL In the Country-Specific Recommendations on fiscal reform that are published o n a yearly basis in the framework of the European Semester, more focus should be put on environmentally friendly tax reform. In the field of mobility, this means that distortions and perverse incentives for unsustainable mobility behaviour should be elimin ated and sustainable modes of transport like cycling should be treated at least at the same level as others in the fiscal system.
NATIONAL LEVEL Depending on the national f iscal system, t he aim of a fiscal level playing field for mobility can be achieved in different ways:
Abolishing/not introducing subsidies for commuting by car: Since commuting is far less costly by bike than by car, abolishing (indirect) subsidies for commuting by car (l ike low taxation of company cars, low fuel taxation or commuting al lowances for car driving) can already have a significant steering impact on commuting behaviour towards cycling, even without the introduction of specific incentives.
Mobility budget: In countries where company cars that can be used for private purposes are an important part of salaries, the introduction of a tax -free “mobility budget” for employees could be an alternative to the complete abolishment of the tax subsidy for these cars. The mobility budget could be used for commuting by all means of transport , and the saved amount transformed into other fringe benefits. Cycling being the most cost-efficient form of commuting after walking, this would make taking the bike to work more attractive.
Tax-free kilometric reimbursement for cycling to work: The amount of the reimbursement should be high enough to provide a real incentive, and ideally higher for shorter distances since they represent the greatest potential for modal shift.
Tax incentives for bikes and cycling infrastructure offered to employees by compa nies: While company cars that can be used for commuting and private trips are offered as a fringe benefit with advantageous tax treatment to employees in many countries, offering bikes as an addition to the salary is much less common and there are few countries that incentivise such schemes through low taxation of the fringe benefit. Offering (high quality) bikes to employees as an alternative to company cars could prove highly beneficial for changing commuting habits. Tax benefits could be also be granted to companies for the instalment of cycling -friendly infrastructure like bike parking or showers.103
Using the bike for business tr ips should be as easy as using other transport modes and reimbursed at least at the same level.
102 http://eur-lex.europa.eu/legal-content/EN/TXT/HTML/?uri=CELEX:32016H0818(09)&from=EN 103 An overview of existing schemes that benefit cycling-friendly employers is given by the EU-funded “Bike2Work” project:
http://www.bike2work-project.eu/en/Cycle-friendly-employers/Grants-and-tax-breaks/Overview/

Blueprint for an EU Cycling Strategy - Chapter 7: A Financial + Fiscal Level Playing-Field for Cycling with Other Modes of Transport
Page 69/99
EU Added value (and/or cost of non-Europe)
The competence for changing tax regimes in this field lies mostly with Member States. However, action at the EU level could bring substantial benefits in terms of providing recommendations and exchanging best practices. It wil l help the EU to ac hieve the targets it has set itself regarding taxation in the 2011 Transport White Paper.
b. VAT on bike sales, bike repair
The status quo of cycling at EU and national level
Under the current EU VAT regime, Member States can grant reduced VAT rates on bik e repair services, but not on bike sales. Until recently, the threshold for adding new items on the l ist of reduced VAT rates has been very high, since unanimity is required in Council to change the list. However, in April 2016, the Commission adopted an a ction plan on VAT. 104 In this action plan, two options are proposed to reform the VAT rate regime: either an extension and regular review of the current l ist, or abolishing the list and giving Member States control over reduced rates and their level. In eith er of these two options, it would be easier for Member States to apply reduced rates on bicycle sales as well. The following Member States currently apply reduced VAT rates for bicycle repair: 105
Belgium
Ireland
Luxembourg
Malta
The Netherlands
Poland
Portugal
Slovenia
The proposed changes in EU policy
The options for reform in the VAT action plan go in the right direction. In case the reform is adopted, Member States should use this opportunity to review their system of reduced VAT rates, by abolishing redu ced rates or exemptions on highly polluting and CO 2-emitting modes of transport l ike flying and introducing reduced rates for bicycle sales. This would make high -quality bikes, which are more robust and adapted to daily use, and electric bikes, which can cover longer distances and make commuting by bike more attractive, more affordable for consumers.
EU Added value (and/or cost of non-Europe)
104 https://ec.europa.eu/taxation_customs/sites/taxation/files/com_2016_148_en.pdf 105http://ec.europa.eu/taxation_customs/sites/taxation/files/resources/documents/taxation/vat/how_vat_works/rates/va
t_rates_en.pdf

Blueprint for an EU Cycling Strategy - Chapter 7: A Financial + Fiscal Level Playing-Field for Cycling with Other Modes of Transport
Page 70/99
Applying reduced VAT rates to bicycle sales would make high -quality bikes, which are more robust and adapted to daily use, and electric bikes, which can cover longer distances and make commuting by bike more attractive, more affordable for EU consumers.
7.4 Internalisation of External Costs of Car Driving a. Congestion charges
The status quo of cycling in relevant policy field
Road congestion is a major issue for many European cit ies. The costs of road congestion are estimated at around EUR 100 bill ion, or 1% of the EU’s GDP, per year. 106 Congestion also creates numerous other problems, such as increased air and noise poll ution. To ease these problems, several cities in Europe have decided to introduce congestion charging, a system where users of motorised vehicles are charged a fee to enter a certain, heavily congested, zone of the city during times when there is most traf fic (usually daytime during weekdays). These schemes are a form of traffic demand management, because only vehicle users with a willingness to pay higher than the fee wil l enter the charging zone. They are also an application of the “user pays principle” in transport and a step towards the internalisation of external costs, because the external costs of car use in highly congested city centres are much higher than elsewhere. 107 In its White Paper on Transport from 2011, the Commission set itself the goals to develop guidelines for the application of internalisation charges to road vehicles, covering the social costs of congestion, CO 2 – i f not included in fuel tax – local pollution, noise and accidents and to create a framework for earmarking revenues from tra nsport for the development of an integrated and efficient transport system. The Commission is currently preparing non -binding guidance documents on urban vehicle access regulations, which include congestion charges.
The proposed changes in EU policy
EU LEVEL The guidance given by the Commission on congestion charges should be ambitious and include recommendations on how to use the revenues from charging schemes for making urban transport systems more sustainable, e.g. by financing measures to improve publi c transport or cycling. NATIONAL LEVEL Regulation at national level should facilitate the introduction of congestion charging schemes, for example by introducing common standards that ensure interoperability between the systems of different cities. Cit ies should be enabled and encouraged to spend revenues from the schemes on sustainable mobility projects, including cycling. REGIONAL AND LOCAL LEVEL For cities planning to introduce congestion charging in the future, the examples from cit ies which have already applied such schemes show that it is important to plan the use of the
106 http://ec.europa.eu/transport/themes/urban/urban_mobility/index_en.htm 107 http://www.epomm.eu/newsletter/v2/content/2015/0415/doc/eupdate_en.pdf
Blueprint for an EU Cycling Strategy - Chapter 7: A Financial + Fiscal Level Playing-Field for Cycling with Other Modes of Transport
Page 71/99
revenues from the charging scheme for measures improving sustainable mobility r ight from the beginning, both to make the reduction in car traffic more effective and permanent, and t o win public support for the scheme.
EU Added value (and/or cost of non-Europe)
Giving guidance at EU level wil l enable cities that plan to introduce congestion charging schemes to take advantage of best practices, meaning that they wil l not have to “reinv ent the wheel”. It also ensures that EU policy goals in terms of e.g. air quality or CO 2 emissions reductions are realised through these schemes.
b. Fuel taxes
The status quo of cycling in relevant policy field
Another fiscal issue, which favours the use o f diesel vehicles in particular, is the cost of fuel. Fuel taxes should be at the same level for all types of fuel and internalise the external costs of using these fuels. This is not the case today. The artif icially low cost of diesel represents a subsid y for this fuel, and as such adds another distortion in favour of this mode of transport. Removing this distortion would be another step towards achieving a more level playing field for cycling. Raising the cost of driving through increasing fuel tax on d iesel to reach the same level as taxes on petrol will, in parallel with other fiscal and infrastructural incentives, encourage more bike journeys and a greater switch away from cars. Reduced air pollution due to fewer diesel engines will also have a positive effect on cyclists’ overall health and l ifespan. In 2012 the World Health Organization confirmed the causal link between exhaust from diesel engines and lung cancer. 108 Diesel cars once produced lower CO 2 emissions compared to their petrol equivalents. D uring the 1990s and 2000s this offered some support for lower fuel taxes for diesel. Today, however, CO2 emissions from diesel and petrol cars are approximately equal and non -CO2 emissions such as soot (or “black carbon”) must also be weighed into the equa tion. Once CO2 and non-CO2 climate emissions are considered, diesel is, litre for l itre, 15 –18% worse for the cl imate than petrol, as established by the OECD in 2014. 109 A diesel car may travel further on a litre of fuel, the OECD acknowledged, but this i s typically a private gain, not a public one. Moreover, diesel cars emit significantly higher levels of other air pollutants, especially NOx and particulates. In summary, subsidies for diesel, of which the fuel tax gap is the most flagrant, have become increasingly problematic to justify at a public policy level as awareness grows of the damage to human health directly attributable to pollution from diesel combustion.
108 https://www.iarc.fr/en/media-centre/pr/2012/pdfs/pr213_E.pdf 109 Harding, M. (2014), "The Diesel Differential: Differences in the Tax Treatment of Gasoline and Diesel for Road Use",
OECD Taxation Working Papers, No. 21, OECD Publishing, Paris. DOI: http://dx.doi.org/10.1787/5jz14cd7hk6b-en

Blueprint for an EU Cycling Strategy - Chapter 7: A Financial + Fiscal Level Playing-Field for Cycling with Other Modes of Transport
Page 72/99
Status quo of cycling in relevant EU policy
In the US and Japan diesel cars account for less than 5% of new sales. In Europe, however, diesel cars make up over 50% of new sales. Europe’s unique posit ion in the world in this respect urgently needs to be redressed to incentivise a modal shift away from diesel -powered transport towards cleaner fuels. In 27 out of 28 EU Member States, diesel is sti ll taxed less per l itre than petrol. 110 In the EU the gap in tax levels for diesel and petrol paid by motorists is currently 14 cent/litre or 30% higher for petrol. Since a litre of diesel contains around 10% more energy than a litre of petrol, the tax gap per unit of energy is higher. Over the past 15 years, the gap has been coming down very slowly, at a rate of around half a cent per litre per year. Austria, Belgium, France, Finland, Hungary, Italy and Sweden are the main countries that have taken voluntary action to close the gap by several cents in recent years. Taking into account the full range of externalities associated with both main transport fuels, the OECD urged Member States to re -balance their tax systems to no longer favour diesel. The EEA’s “Air quality in Europe” report published in 2015 111 provides a detailed breakdown of how transport-related emissions contribute to the formation of secondary particulate matter in the atmosphere. The transp ort sector accounted for 46% of NOx emissions in the EU -28 in 2013. The EEA found that these emissions are not going down as quickly as had been projected with the introduction of the “Euro standards” (European emission standards), partly due to the disparity between laboratory testing and real -l ife driving emissions, as powerfully evidenced with the “Dieselgate” scandal that broke in September 2015 and raised public awareness around diesel’s noxious qualit ies.
The proposed changes in EU policy
There is a clear case to be made for urgently rebalancing the current disparity in fuel taxes between petrol and diesel across EU Member States. For this to be achieved most effectively, there needs to be a revision of the Energy Tax Directive, where it would be stat ed that the gaps must be closed over a certain t ime period: e.g. “ … where a gap of more than 3c exists, action has to be taken to close the gap by 2020 …” As Transport and Environment pointed out in their report, “Europe’s tax deals for diesel 2015”, 112 relatively low oil prices and commitments made on 2030 energy and cl imate targets make for an opportune time to achieve this reform. While recognising the thwarting of previous attempts to introduce amendments due to the requirement for unanimity voting on ta x issues, it is crucial to achieve the trend towards convergence.
EU Added value (and/or cost of non-Europe)
Drawing up stricture rules on fuel taxation and closing the fuel tax gap would help to remove current imbalances and distortions between different fuels, but also between modes of
110 https://www.transportenvironment.org/sites/te/files/publications/2015_10_Europes_tax_deals_for_diesel_FINAL.pdf 111 EEA Report No 5/2015. Air Quality in Europe 2015 Report 112 https://www.transportenvironment.org/sites/te/files/publications/2015_10_Europes_tax_deals_for_diesel_FINAL.pdf

Blueprint for an EU Cycling Strategy - Chapter 7: A Financial + Fiscal Level Playing-Field for Cycling with Other Modes of Transport
Page 73/99
transport, thus helping to create a level playing field for cycling. It would also support the EU's wider environmental, cl imate and energy goals.
7.5 Cycling-friendly competition and trade policy measures
The status quo of cycling in relevant policy field (generally)
The total EU Market in 2015: 20 mil lion bicycles, 1,5 million Pedal Assist E -bikes and 3 bil lion Euro of bicycle parts and accessories. Of these 12 mil lion bicycles, 1,1 mil l ions Pedal -Assist E-bikes and 1,5 billion Euro worth of bicycle parts and accessories were produced in Europe, a market share of 61% for EU produced bicycles and EPACs and 50% of the market value of parts. Since 1993 the EU industry has benefitted from European Commission antidumping measu res against the unfair competition from China’s exporters of bicycles and has successfully had the measures renewed, along with anti -circumvention measures applied to some other countries. 113 With this protection the EU Bicycle Industry has stabilised loss of market share to Chinese producers and been able to maintain a critical mass of manufacturing in the EU, unlike countries like the USA and Japan that have lost almost al l local manufacturing in the same time period. There has been a sustainable climate encouraging the development of SMEs in the whole territory of Europe, to create much needed long term Manufacturing Jobs. According to the EU Commission a robust European industrial base is central for creating good long term Manufacturing Jobs and Growth in Europe 114 115 Manufacturing in Europe means:
1. long term industrial jobs for the young generations: each billion worth of EU production means in average from 10 to 15.000 Industrial Jobs. Industrial output must go back to 20% of GDP, encouraging in particula r local production of Consumers goods of SMES;
2. Innovation 3. Safe products and satisfied Consumers; 4. The most posit ive carbon footprint which only sustainable local production can
guarantee; 5. Respect of CSRs, anti -pollution rules, quality standards like Reach, CEE marking and EN
Norms; 6. IP rights respect; 7. Industrial investments.
With the stable regime of product standards and antidumping protection the industry has become the largest employers, investors and innovators of the Green Industries in the EU. Two
113 http://trade.ec.europa.eu/tdi/case_history.cfm?init=1532 114 https://ec.europa.eu/commission/commissioners/2014-2019/bienkowska/announcements/reindustrialisation-europe-industry-40-innovation-growth-and-jobs-forum-europe-conference_en
115 https://ec.europa.eu/commission/commissioners/2014-2019/bienkowska/announcements/keynote-speech-avio-aero-conference-development-growth-and-innovation-strategic-high-tech-sectors_en
Blueprint for an EU Cycling Strategy - Chapter 7: A Financial + Fiscal Level Playing-Field for Cycling with Other Modes of Transport
Page 74/99
of the most important innovations of the EU Bicycle Industry have been public bike sharing systems and the very successful Pedal -Assist E-bikes, which brought back to cycling millions of EU citizens and where EU originated technologies are competit ive at a g lobal level.
The status quo of cycling in relevant EU Policy
Anti-dumping measures are in place due to decisions recognised in the EU Official Journal 116 The ruling recognised a number of policy implications for which the application of anti -dumping duties were the appropriate fiscal measure. Mentioned outcomes from the imposit ion of duties include that the EU industry will be maintained; it will be able to continue investment in new product development and sustainable transport innovation; maintain assoc iated production of parts and accessories in the EU supply chain. Industry actors propose extension of the anti -dumping and circumvention measures to include electric pedal assisted bicycles and all ied technologies such as cargo -bikes.
Cost of non-action at an EU level
LOSS OF SMES DUE TO LOSS OF CRITICAL MASS IN PRODUCTION At SMEs level, innovation is generated by production: this is a sine qua non condition. In fine-mechanics industrial SMEs, the know-how which comes from production is vital to develop safe & innovative products. The most important innovations of the last 50 years in the cycling industry were made worldwide by Manufacturing SMEs, among which EU SMEs played a dominant and decisive role to new inventions to benefit r iders worldwide. As an important example:
- If the EU Bicycle Industry didn't exist anymore, - And if the European Commission didn't impose the Antidumping in the past 20 years,
The Pedal-Assist E-bikes would not have been developed. RISK TO HIGH-TECH AND INVESTMENT/INNOVATION -INTENSIVE INDUSTRIES Modern Industry has more and more workforce upstream, like in the R&D, Moulds/Machines and production transfers preparation: a direct job often corresponds to 3.5 indirect jobs upstream In modern industry the impact of investments/ autom ation/ digitalized production/ innovations is so much higher than in the past 117 it can reach 30-40% of the price of a new product So, i f such investments/innovations are not maintained by the EU Industry (the EU Bicycle, Pedal Assist Ebikes and Components Industry invested over one bill ion Euro in 2016), there is a loss of al lied high-tech Industries in the EU and damage to important new industrial developments in the next 10 years. SUBSTITUTION OF EU MADE BIKES BY BIKES FROM CHINA WILL HAVE A NEGATIVE CO₂ BALANCE
116 on 5th June 2013: http://eur-lex.europa.eu/legal-content/EN/TXT/HTML/?uri=OJ:L:2013:153:FULL&from=EN 117https://static1.squarespace.com/static/5537b2fbe4b0e49a1e30c01c/t/55fc0373e4b09a69209aa9c2/1443621109236/U
nilateral+grant+of+Market+Economy+Status+to+China+would+put+millions+of+EU+jobs+at+risk.pdf(Study Scott – EPI)

Blueprint for an EU Cycling Strategy - Chapter 7: A Financial + Fiscal Level Playing-Field for Cycling with Other Modes of Transport
Page 75/99
Politecnico of Milano confirms in their benchmark Study that a bicycle produced in China generates up to 123 Kg CO₂ more than a bicycle produced in Europe. Compared with European production, the Chinese production for the EU market causes additional emissions of min. 61.5 and max. 123 Kg CO₂ per bicycle. Therefore the average value of additional emissions is 92 Kg CO₂ per bicycle coming from PRC. If 20 mill ion bicycles and 1,5 million Pedal-Assist E-bikes would all come from China total additiona l annual emission of over 2 million tons of C0₂, which could be spared thanks to the local EU sustainable production 118.
118 source: politecnico of milano estimation of co2 emissions from the production
of bicycles in china and in europe

Blueprint for an EU Cycling Strategy - Chapter 7: A Financial + Fiscal Level Playing-Field for Cycling with Other Modes of Transport
Page 76/99
The example of Japan: cheap low-quality bicycles reduce sales
In Japan, China is by far the largest country of origin with a 95.6% market share and domestic production has almost ended.
If you have a look at the above chart, after peaking at 11.5 million units in 2004, the sales of completed bicycles in Japan have been on a downward trend and one of the main factors relates to the cheap, low-quality bicycles which are therefore seen as consumable goods rather than durable goods – as stated by the Bicycle Association Japan during its presentation at the meeting of the Asian Bicycle Association in Chandigarh on 8 December 2016. Moreover, with an increase in the number of cheap, low-quality imported bicycles, accidents involving such bicycles also increased.
0
1,000
2,000
3,000
4,000
5,000
6,000
7,000
8,000
9,000
10,000
1950 1955 1960 1965 1970 1975 1980 1985 1990 1995 2000 2005 2010 2011 2012 2013 2014 2015
Domestic production and imports of bicycles (completed bicycles)
国内生産 輸入

Chapter 8 - Intermodality and Intelligent Transport
Systems (ITS)
Summary
Intermodal transport involves using two or more modes of transportation in a seamless door-to-door journey, hereby combining the strengths and/or offsetting the weaknesses of various transportation options. A major goal of int ermodal transport is to reduce the dependence on the automobile as the major mode of ground transportation by combining walking, cycling (and bike sharing), publ ic transport (bus, underground, light rail, train, ferries) and car/ride sharing. Mobil ity as a Service (MaaS) aims at becoming an on -demand one-stop shop for transport services by systematically integrating these modes. Most transport has intrinsic stren gths and weaknesses. The bicycle is a fast and efficient mode of transport for distances up to 10 -15km, with the potential to cover longer distances by using pedelecs and speed pedelecs. The bicycle plays an important role in the intermodal chain. It is a significant feeder for public transport and can considerably increase its catchment, certainly in rural areas. In the Netherlands, more than 40% of railway passengers use the bicycle to get to the station; whereas about 10% use the bicycle to get from the railway station to the point of destination, hereby often using the Dutch railway companies shared bicycle scheme, OV -fiets119. Several other railway companies have also set up a bike -sharing system. 120 In total, 524 bike-sharing schemes were said to be operat ing in Europe by the end of 2016. 121 As for freight purposes, more and more cities are experimenting with setting up inner -city logistic consolidation centres, with the last mile being completed by cargo bikes. 122 Making cycling a successful part of the int ermodal transport chain requires (at least) 3 main elements:
Data and technology: Better data collection on cycling; developing the right technological standards as to fully integrate private cycling and public bike sharing in mapping, multi -modal real-t ime journey planning as well as reservation and ticketing service schemes;
Improved passenger rights for customers wishing to carry their bicycle, under certain conditions, on road, rail, maritime and air transport modes as to al low the carriage of bicycles;
And secure and easily accessible bike parking facilities, most notably at transport hubs, but also at private houses, companies, public entities (schools, universit ies, hospitals, etc.).123
Main recommendations to the EU: Sub-chapter 1: Smart cycling, ITS and digital agenda
119 http://www.fietsberaad.nl/library/repository/bestanden/fietsen-en-lopen_de-smeerolie-van-onze-mobiliteit.pdf, p24 -25 120 E.g. Deutsche Bahn: Call a Bike; NMBS/ SNCB: Blue Bike. 121 MetroBike, LLC (Washington, D.C., USA), The Bike-sharing Blog, http://bike-sharing.blogspot.be/ 122 See Chapter 3 Behavioural change. 123 Needs cross-References: See Chapter 4 Infrastructure

Blueprint for an EU Cycling Strategy - Chapter 8 - Intermodality and Intelligent Transport Systems (ITS)
Page 78/99
Inclusion of cycling and Public Bike Sharing data and services within the standardisation and harmonisation of multi -modal and real time transport data
Inclusion of cycling stakeholders within the on -going work being carried by the E uropean Commission and European Standardisation Bodies (ESOs) on urban ITS and C -ITS data and services
Sub-chapter 2: Passenger rights
Improve significantly the conditions for bicycle carriage when existing passenger rights’ regulations will be revised an d define the general terms and conditions under which this provision should be met;
Establish good practice guidance material to National Enforcement Bodies and transport operators on how to improve services to customers with bicycles. 124 This shall apply to the provision of information with regards bicycle carriage, prices of bicycle tickets, ticket reservation schemes and sales channels;
8.1 Smart Cycling, ITS and Digital Agenda
The status quo of cycling in relevant policy field
The transport sector experi ences a surge in the use of new technology, and new technologies are being applied more and more to the transport sector. Connection between modes, between infrastructure and between users is seen as a way of improving sustainability and safety. Most of this is being led by the car industry that has been investing bil lions in what it sees as the next generation of motorised transport. This includes links to traditional ITS, the development of C-ITS (connected/cooperative ITS). This will inevitably constitut e the future of the transport system. Although cycling has been slow to come to the technology revolution, nowadays many companies are exploit ing ways to utilise new tech. New cycling technologies include, for instance, travel and journey planning; placi ng sensors on bicycles to pick up air, light, surface, environmental information; connectivity; electric mobility; Public Bike Share; and data sharing. The rise of electric bicycles and public authorities adapting to new technologies, brought about a heightened interest of established bicycle manufacturers as well as new big players, such as Bosch, Cisco and various car manufacturers, want to establish their known technologies within the bicycle sector. This becomes increasingly significant due to the rise of Mobil ity as a Service (MaaS). Connectivity and data constitute the cornerstone of any Maas system, therefore it is essential that cycling is not locked out from these technologies. Despite the rise of interest from big players used to dealing with a r egulated and stable technology sector, the technology associated with the bicycle sector is st ill a patchwork, unregulated and difficult to compartmentalise industry. This causes potential problems considering the regulation, growth and clear comprehension of strengths and weaknesses in the sector. Cit ies and local authorities necessitate for data from active modes, which is often lacking. Similarly, a huge amount of data is generated by individual data collectors (cyclists) who create localised data, howev er this is not formed into big enriched data sets focused on
124 E.G. ECF, Bike and Trains: 7 Basic Services that Give Cyclists a Smile. A Collection of good practice examples of integrating cycling with long-distance and international rail services. 2nd edition, Dec 2016; BiTiBi.
Blueprint for an EU Cycling Strategy - Chapter 8 - Intermodality and Intelligent Transport Systems (ITS)
Page 79/99
leverage modal share and user safety and comfort. This small localised data collected on various apps and devices would be exceptionally useful as ‘Big Data’ to authorities if collated together. (Cross-reference: Please see also the Chapter 5 on vehicle regulations to see cycling and autonomous vehicles)
The status quo of cycling in relevant EU policy
EU Commissioner for Transport, Violeta Bulc, has commented on the l ink between cycling and new technologies; “The development of cycling is steering several technological innovations. We want to effectively incorporate cycling into connected and smart transport networks of the future. Smart cities wil l be driven by technology, which, if properly impl emented, has the power to introduce a behavioural change.” 125 Under the current goals of the European Commission White Paper to reduce emissions, fossil -fuelled vehicles and a move towards a safe, efficient and multimodal transport system, Intelligent Transport Systems and ICT in transport, were seen as a major tool in this development. A legal framework (Directive 2010/40/EU the ITS Directive 126) was adopted on 7 July 2010 to accelerate the deployment of innovative transport technologies across Europe as part of its Action plan on Intell igent Transport Systems ITS 127). It was unveiled in 2010 and was to last 7 years; however there has been an extension to its continued implementation. In 2016 the Commission published its Low Emissions strategy 128 including the objective to increase the efficiency of the transport system by implementing digital technologies, smart pricing and further encouraging the shift to lower emission transport modes. There are delegated acts in place from the ITS Directive, including; the pro vision of EU-wide multimodal travel information services129; the provision of EU-wide real-t ime traffic information services 130; data and procedure for the provision, where possible of road safety related minimum universal traffic information free of charge for users131. The Commission has given a mandate to the European Standards Organisation CEN (under M/546132 and Commission Implementing Decision 2016/209 133) to develop and review Multimodal Travel Information data and services standards. This work ranges from co llating and defining data sets and models, working groups looking into creating urban access data portals , to making sure that legacy and new services and systems are compatible with public authorities’ standards. Furthermore, the Commission has identifie d the need for a new harmonised regulatory framework for automated, and semi -automated, motor vehicles at EU level. To deliver this goal
125 https://ec.europa.eu/commission/2014-2019/bulc/blog/cycling-green-and-efficient-transport-future_sl 126 Full details and links to all aspects of the Directive can be found here http://ec.europa.eu/transport/themes/its/road/action_plan/ 127 http://ec.europa.eu/transport/themes/its/road/action_plan_en 128 https://ec.europa.eu/transport/themes/strategies/news/2016-07-20-decarbonisation_en 129 This is upcoming during 2017 130 http://eur-lex.europa.eu/legal-content/EN/ALL/?uri=CELEX:32015R0962 131 http://eur-lex.europa.eu/legal-content/EN/ALL/?uri=CELEX:32013R0886 132http://ec.europa.eu/growth/tools-databases/mandates/index.cfm?fuseaction=refSearch.search 133 http://eur-lex.europa.eu/legal-content/EN/TXT/?uri=CELEX%3A32016D0209

Blueprint for an EU Cycling Strategy - Chapter 8 - Intermodality and Intelligent Transport Systems (ITS)
Page 80/99
there are initiatives and research including Gear 2030 134, the C-ITS Platform and its roadmap and deployment strategy for C-ITS in the EU 135. The second phase of the C-ITS working group is under way in 2017 with a working group on urban areas which will have a broader remit and will be looking specifically into ‘Urban’ technologies and services related to connectivity and will include input on the needs and requirements of cycling, walking and public transport to understand how cycling data collection and sharing wil l be incorporated into C -ITS technology eco-systems according to the European Strategy on C -ITS.
The proposed changes in EU policy
It is important that the ESO bodies and Commission encourages and promotes ITS and smart transport technologies, not merely among the cyclist community, yet equally amongst the cycling industry, commercial and user stakeholders. These st akeholders include those bringing new devices or apps to the market; new service providers; and data producers and users that provide data for services. Concern exists (amongst users and the ESOs 136) that there are gaps in the current coverage of cycling and Public Bike Share. Input is needed from cycling stakeholders as to how new cycling technologies will respond or be incorporated into the latest transport technologies. Those that are providing services and products need to be brought in from the shadows and into the EU work that is being done with regards to the regulation, harmonisation and facil itation of ITS services. This becomes important in particular considering the rise of Mobil ity as a Service (MaaS). One-stop shop for transport services must incl ude active modes and as part of this inclusion cycling data and services must be interoperable and easily available for public authorit ies. The EU report on C-ITS from the C-ITS platform, which received input from ECF, highlighted the challenge posed by unequipped users, including cyclists 137, and concluded that more research is required 138. In the newly formed ‘Urban’ C -ITS working Group there is a broader remit than the typical C-ITS type technologies and wil l include many more connected services. On -going cycling stakeholder participation should continue to be encouraged to bring a broader network of cycling services into the process. EU LEVEL
Include cycling and Public Bike Sharing data and services within the standardisation and harmonisation of multi -modal and real time transport data.
Include cycling stakeholders within the on -going work being carried by the ESOs on urban ITS and C-ITS data and services.
NATIONAL LEVEL
To include Public Bike Share and private cycling within public Mobil ity as a Serv ice MaaS projects.
134Gear 2030 http://ec.europa.eu/growth/tools-databases/newsroom/cf/itemdetail.cfm?item_id=8507 135 European Commission (2016) C-ITS Final Report https://ec.europa.eu/transport/sites/transport/files/themes/its/doc/c-its-platform-final-report-january-2016.pdf 136 http://www.urbanits.eu/ “There are a number of existing mature standards….However, many of these standards overlap or are not harmonised and there are gaps, particularly in the coverage of the new modes” 137European Commission (2016) C-ITS Final Report https://ec.europa.eu/transport/sites/transport/files/themes/its/doc/c-its-platform-final-report-january-2016.pdf 138Hynd, D., et al. (2015) Benefit and Feasibility of a Range of New Technologies and Unregulated Measures in the fields of Vehicle Occupant Safety and Protection of Vulnerable Road Users. http://goo.gl/tmwYqp

Blueprint for an EU Cycling Strategy - Chapter 8 - Intermodality and Intelligent Transport Systems (ITS)
Page 81/99
REGIONAL AND LOCAL LEVEL
To include Public Bike Share and private cycling within public Mobil ity as a Service MaaS projects.
To encourage data collection from cyclists, to use this data to improve urban cycling and to allow access to da ta for individual cyclists
Use data from cyclists apps/devices to improve cycling environment in urban areas.
8.2 Passenger Rights
The status quo of cycling in relevant policy field
Passenger rights are common rules that have been drawn up in an effort to ensure that passengers receive at least a minimum level of service on public transport. Some requirements are set by individual Member States but there are also overarching regulations that cover the EU (see below). Many of the general aspects of passenger rights are relevant for people wishing to combine cycling with other modes (e.g. compensation for delays or damage), however there are also some specific conditions relating to this user group. These apply to the type and configuration of the bicycle (folding bicycle, dis -/assembled, bagged/boxed, etc.), as well as ticket fares, time, etc. Passenger rights cover the customers of a wide set of transport modes both in an urban and local context (buses, trams/ l ight rail, underground, etc.) as well as f or long-distance and international journeys (coaches, rai lways, ferries, airplanes, etc.). Current rules in regard to bicycle carriage across these modes are patchwork at best. However, some general conclusions can be drawn with considering bicycle carri age of assembled bicycles:
Many public transport operators al low the carriage of assembled bicycles on trams and light rail during off -peak hours on workdays and on weekends;
On long-distance coaches bicycle carriage it is often possible in the cargo ar eas underneath;
On most train services carriage of assembled bicycles is possible, with the exception of many (international) high -speed trains;
Most airl ines accept bicycle cargo against a fee and have to be put in a bag or box. Handlebars usually have to be turned and pedals removed;

Blueprint for an EU Cycling Strategy - Chapter 8 - Intermodality and Intelligent Transport Systems (ITS)
Page 82/99
From the perspective of the railway operators, different solutions which do not involve the carriage of a complete bike are also widely offered, as this allows the railway operators to continue to serve the needs of cycl ists even when assembled bike carriage currently is not possible. Among the different solutions proposed by railway operators, first- and last-mile solutions facilitating bike journeys to and from railways stations should be further supported, in particular via local policy measures aimed at improving cycle -train infrastructure, such as safe bicycle parking at stations or shared bicycle systems.
The status quo of cycling in relevant EU Policy
To protect citizens and support the Commission’s goal of a comple ting the internal market in products and services the EU has adopted rules covering:
Air passenger r ights
Road passenger r ights
Rail passenger rights
Maritime passenger rights The Commission is also currently considering introducing Multimodal passenge r’s rights139. Regulation (EC) No 1371/2007 on rail passenger rights’ and obligations, Point 5 stipulates: “Railway undertakings shall enable passengers to bring bicycles on to the train, where appropriate for a fee, if they are easy to handle, if this does not adversely affect the specific rail service, and if the rolling -stock so permits.” 140 However, Commission services concluded in response to a parliamentary question that no legal obligation for mandatory bicycle carriage can be derided from this regula tion.141
139 http://ec.europa.eu/transport/themes/passengers/consultations/2017-pax-rights-multimodal-transport_en 140 REGULATION (EC) No 1371/2007 OF THE EUROPEAN PARLIAMENT AND OF THE COUNCIL of 23 October 2007 on rail passengers’ rights and obligations; http://eur-lex.europa.eu/legal-content/EN/TXT/PDF/?uri=CELEX:32007R1371&from=EN 141 Written Question by Bart Staes (Verts/ALE) to the Commission (E-010116-15; 24th June 2014): http://www.europarl.europa.eu/sides/getDoc.do?pubRef=-%2f%2fEP%2f%2fTEXT%2bWQ%2bE-2015-010116%2b0%2bDOC%2bXML%2bV0%2f%2fEN&language=EN
Why assembled bikes are so important
It is possible to transport folded or dissembled bikes in nearly all transport services in
Europe (the requirements and conditions vary). Wheareas this is an option for some
cyclists and we support,is supported, it should not substitute the possibility to transport
assembled / complete cycles. Folding bikes account for a relatively small amount of the
market and a large number of cyclists are not comfortable dissembling their cycles. If we
want to encourage intermodal journeys then it should be made as easy as possible to
combine these modes.

Blueprint for an EU Cycling Strategy - Chapter 8 - Intermodality and Intelligent Transport Systems (ITS)
Page 83/99
The Regulation also includes a requirement under Annex II to pre -journey information relating to cycle carriage being made available. Currently, the other exiting EU Passenger Rights Regulations - relating to road transport, maritime and air - have no provisions on bicycle carriage.
The proposed changes in EU policy
EU LEVEL
Improve significantly the conditions for bicycle carriage when existing passenger rights’ regulations will be revised and define the general terms and conditions under which this provision should be met;
Establish good practice guidance material to National Enforcement Bodies and transport operators on how to improve services to customers with bicycles. 142 This shall apply to the provision of information with regards bicycle c arriage, prices of bicycle tickets, ticket reservation schemes and sales channels;
NATIONAL LEVEL
Establish good practice guidance material to National Enforcement Bodies and transport operators on how to improve services to customers with bicycles. 143 This shall apply to the provision of information with regards bicycle carriage, prices of bicycle tickets, ticket reservation schemes and sales channels;
Encourage transport operators to introduce/ improve bicycle carriage; REGIONAL AND LOCAL LEVEL
Encourage transport operators to introduce/ improve bicycle carriage.
The EU added value
Improving intermodality will reduce dependence on car ownership, hence reduce the number of car trips and hereby contribute to the decarbonisation of the transport system, impr ove air quality, reduce noise, etc. Improving the conditions for carriage of assembled bicycles wil l also boost cycle tourism and thereby create green jobs in related industries.
142 E.G. ECF, Bike and Trains: 7 Basic Services that Give Cyclists a Smile. A Collection of good practice examples of integrating cycling with long-distance and international rail services. 2nd edition, Dec 2016; BiTiBi. 143 E.G. ECF, Bike and Trains: 7 Basic Services that Give Cyclists a Smile. A Collection of good practice examples of integrating cycling with long-distance and international rail services. 2nd edition, Dec 2016; BiTiBi.

Chapter 9: Governance
Summary
Austria, Belgium, Czech Republic, Denmark, Finland, France, Germany, Hungary, Ireland, Luxembourg, Germany, Slovakia, Slovenia and the Netherlands created a national cycling policy strategic document and/or appointed a national cycling officer in the public administriation. On the regional and loca l level this kind of coordination exists in nearly all Member States for several years, but the EU Institutions merely took their f irst steps recently. Following the ministerial declaration of Luxembourg on cycling as a climate friendly transport mode, the Commission took its f irst steps, notably by appointing a cycling coordinator in DG MOVE and creating a dedicated page on the website of DG MOVE in the section on urban transport matters.144 Such init iatives by the Commission are pivotal and highly posit i ve. Nonetheless, the current set -up does not deliver a functioning system that al lows the posit ive potential of cycling to fully prosper in numerous crucial EU policy areas. In particular, cycling is in relation to the environment, an ideal f it by being a zero emission transport mode. Considering health it is an easy way to tremendously reduce costs induced by a lack of physical activity. Vis -a-vis mobil ity it is an efficient tool to alleviate congestion, and in regard to the economy, it creates a great number of local jobs and businesses. Despite that cycling might not be the panacea in itself to all aforementioned issues, it contributes significantly to the success of the final solution. Hence, cycling ought to be included into the EU decision -making process at the earliest possible stage to attain the greatest positive impact possible. Currently, by their own initiative, NGOs, Members States, MEPs and other institutions already advocate cycling within the EU, national and regional policymaking process, h owever this is insufficient to provide a systematic, coherent and efficient inclusion of interests relevant for cycling into the EU policies and regulation. In order to cover cycling -specific interests and benefits adequately, it requires consideration at the earliest possible phase in the process and thus in the internal Commission preparation of its initiatives. This chapter on governance highlights the organisational solution that helps the EU institutions, and national, regional and local bodies to mak e a real difference. It consists of f ive sub -chapters:
1. Cycling Check in Policies and Inter -Service Consultation The EU ought to look at what cycling can contribute to the implementation of its main objectives. When deciding on policies and measures, an in ternal scan should be performed wherein cycling specific interests are to be taken into account in the inter -service consultations in the Commission.
2. Cycling Focal Point In order to implement many of the elements of the cycling strategy at EU level an operational and dedicated focal point is indispensable.
3. Cooperation with THE PEP, National Focus Points and Stakeholders Among the many tasks of such focal point feature the cooperation with national cycling officers and stakeholders.
4. Cycling Clearing House and Expertise Centre
144 (https://ec.europa.eu/transport/themes/urban/cycling_en).

Blueprint for an EU Cycling Strategy - Chapter 9: Governance
Page 85/99
The running of a cycling clearing house/expert centre. 5. Cycling Friendly Institutions as a Role Model
As the EU institutions should implement what they advocate in order to rely on cycling friendly EU Institutions as a role model for o thers to follow.
9.1 Cycling Check in Policies and Inter-Service Consultation
The status quo of cycling in relevant policy field
There is no coordination in the EU decision -making process with respect to cycling and EU measures are not systematically checked with respect to their impact on cycling. This circumstance causes an unnecessary wait of resources and efficiency and might generate unintentional obstacles to a more cycling friendly environment.
The status quo of cycling in relevant EU Policy
For now, the EU (and some Member States) do not take cycling into account as a genuine transport mode in their policy decisions. Cycling could make a real contribution in many policy areas l ike urban mobil ity, fight against obesity, and low and zero carbon trans port, however is often overlooked by the ones in charge. Cycling as a clean, sustainable transport mode is not considered at any level when policy decisions are taken or specific measures proposed by the EU. The EU policy check is intimately linked to the Commission inter-service consultation mechanism, which is the institutional tool to make sure that departments with “legitimate interests” are involved or at least consulted in the elaboration of EU initiatives.
The proposed changes in EU policy
EU LEVEL
There should be a systematic approach to check if new EU policies and proposals are improving or deteriorating the conditions for cycling and to suggest, if necessary, amendments aiming at creating a cycling friendly regulatory framework.
DG MOVE (represented by the EU Cycling Focal Point) should be involved in the consultation on all initiatives which are relevant from a cycling perspective. The EU Cycling Focal Point should furthermore be included in consultations on issues, which might not otherwise be of a legit imate interest to DG MOVE, for instance, initiatives launched by DG SANTE against obesity and the like.
NATIONAL LEVEL
Member States should adopt the same approach based on a policy check and inter -ministerial consultation mechanism for national policies, initiatives and measures which could possibly have an impact on cycling with the aim to have a cycling friendly regulatory framework in place at the national level.
REGIONAL AND LOCAL LEVEL

Blueprint for an EU Cycling Strategy - Chapter 9: Governance
Page 86/99
As far as relevant, regional and local bodies should us e a similar approach to take into account cycling in the decision making process for measures in their respective competencies.
In this context, relying on best practices from other regional or local experiences is highly recommended.
EU Added value (and/or cost of non-Europe)
The benefit of such a new internal Commission set -up is to make sure that the EU becomes aware of the impact of its policies and measures on cycling. Furthermore, the EU could avoid unintentional negative external effects, increase t he posit ive external effects and establish a cycling friendly regulatory framework.
9.2 Cycling Focal Point
The status quo of cycling in relevant policy field
Without anyone in charge of implementation, there is l ittle chance for any strategy, policy or measure to succeed. Actions and spending relating to cycling are not coordinated and thus subjected to possible losses in efficiency and consistency.
The status quo of cycling in relevant EU Policy
The appointment of a cycling coordinatior in DG MOVE is a p ositive development. A critical note, however, is that the resources al located to the coordinator are nonetheless largely insufficent and diminish the potential impact.
The proposed changes in EU policy
EU LEVEL
The EU Cycling Focal Point should be a full y dedicated assignment and granted suitable resources and access to meetings and documents. The EU Cycling Focal Point would be best based within DG MOVE.
The main tasks of the EU Cycling Focal Point ought to be the following: - act as a one-stop-shop for cycling related questions, - facil itate the exchange of best practices among Member States, - check all relevant EU policies and measures and participate in inter-service consultations on initiatives with a possible impact on cycling, and - monitor the implementation and the impact of the EU cycling strategy.
The Commission would be able to rely to a certain extend and progressively on its own growing expertise, increase its efficiency and enhance consistency in its work involving cycling.
NATIONAL LEVEL
Member States should appoint their own cycling officers or institutions acting as such.
Such national cycling officers could be in charge of the similar tasks as their EU colleague but emphasize on the national situation. The national cycling officers cou ld be in charge

Blueprint for an EU Cycling Strategy - Chapter 9: Governance
Page 87/99
of implementing and monitoring the national cycling action plans and of exchanging best practices (two-way) with the EU Cycling focal point.
EU Added value (and/or cost of non-Europe)
The role of the EU Cycling Focal Point is essential for the successful implementation of the EU Cycling Strategy. The efforts put into coordinating all relevant issues and tasks in a non -centralized manner create an unnecessary administrative burden in the Commission and obstruct gains in efficiency and consistency. Many opportunities would be lost without a fully operatinal EU Cycling Focal Point.
9.3 Cooperation with THE PEP, National Focal Points and Stakeholders
The status quo of cycling in relevant policy field
Cooperation is the key to a successful, consistent and in time elaboration and implementation of cycling strategies and action plans. ECF (together with two national cycling officers) initiated the informal network of national cycling officers, which was taken over by the PEP, and organises the cities for cyclists, scientists for cycling networks. The EU and the Commission are not sufficently involved in this processes and the l imited resources do not allow to take up the full potential of the networks or to establish new ones.
The status quo of cycling in relevant EU Policy
The Transport, Health, Environment Pan -European Programme (THE PEP) has been established in 2001 in Geneva. Meetings in this format are held regularly on the development of a pan -European Master Plan for Cycling Promotion wit h a scope beyond the EU since 2010. Not all EU member states have adopted a national cycling plan or strategy and appointed cycling officers and not all EU member states have joined THE PEP nor is the EU as such or the Commission member to the partnership. All these initiatives with different scopes need to be coordinated.
The focal role for implementation
Luxembourg has had a national cycling action plan in place but measures planned in the
action plan have only been properly implemented since a specific unit dedicated to cycling
has been established at the ministry in charge of transport.

Blueprint for an EU Cycling Strategy - Chapter 9: Governance
Page 88/99
The proposed changes in EU policy
EU LEVEL
A network of national cycling officers should be official ly established and include all Member States.
Such a network should hold regular meeti ngs with the objective of monitoring the implementation of the EU and national cycling strategies.
The EU Cycling Focal Point should manage the cooperation with THE PEP, the national cycling officers and all relevant stakeholders as he wil l be the central character for the EU cycling policy. Cooperation with national focal points and stakeholders shall not necessarily be in the sole hands of the EU Cycling Focal Point but could be structured so that all available resources are used an efficent way (knowing that some national cycling officers and orgnaisations will have more experience and resources than others). The EU Cycling Focal Point should always be involved and kept in the loop.
NATIONAL LEVEL
The Member States should be encouraged to consider the EU cycling officers’ network and THE PEP positively, to nominate national cycling officers and take part in the works and meetings of both.
EU Added value (and/or cost of non-Europe)
A coordination between the different levels of strategies and action/master plans is required in order to guarantee a consistent, efficient and effective elaboration and implementation of measures throughout the EU and beyond.
9.4 Cycling Clearing House and Expertise Centre
The status quo of cycling in relevant policy field
The European Cyclists’ Federation and ELTIS among other init iatives operates currently as an expertise centre and a cycling clearing house. The premier cycling conference of the world (Velo-city) is organised by a host a city and ECF every year in a different place (in Europe and every second year might be outside Europe).
The status quo of cycling in relevant EU Policy
EU funded and supported projects and programs are coming to an end leaving the current initiatives with l imited resources which might not be s ufficient to continue fulfi lling such tasks. To maintain the collection of best practices and exchange of expertise (after the end of the projects) and to transform it into “paying” service leaves the less resourced countries, regions, cities without access and limits the use of the knowledge.
The proposed changes in EU policy
EU LEVEL

Blueprint for an EU Cycling Strategy - Chapter 9: Governance
Page 89/99
The EU should recognize the European cycling expertise centre and provide continuous financial support to it.
A user-friendly online tool should be available which could pro vide access to all relevant information, contact details and best practices. It could furthermore host a forum for exchange, notably on best practices.
The EU Cycling Focal Point should be in charge of the online tool even though outside sources may provide the content and run its technical operation.
NATIONAL LEVEL
Member States should make best use of the expertise centre and share their own expertise and experiences.
REGIONAL AND LOCAL LEVEL
Regional and local bodies should be encouraged to make the best use of the expertise centre and share their own expertise and experiences.
EU Added value (and/or cost of non-Europe)
A european expertise centre and cycling clearing house are essential tools to avoid unnecessary waste of resources at al l and would contribute to a better, more consistent and efficient policy making and implementation. They hence support the spreading the positive effects of cycling policies and furthermore help to reduice the risk of repeating mistakes already made previously by others.
9.5 Cycling Friendly Institutions as a Role Model
The status quo of cycling in relevant policy field
The EU institutions should be a real role model when it comes to implementing policy measures that they promote and this should apply as well for cycling as a transport mode.
The status quo of cycling in relevant EU Policy
An association of cyclists working for the EU Institutions called the European Union Cyclists’ Group (EUCG) advocates for their employers to become more cycling friendly. The EU Institutions have indeed already implemented several recommendations.
Learning from bad experiences
A city might understand that introducing a bike sharing scheme without other
interventions e.g. enhancing the infrastructure for cyclists is likely not to become a success
story. Therefore the possibility to learn form others is essential.

Blueprint for an EU Cycling Strategy - Chapter 9: Governance
Page 90/99
The proposed changes in EU policy
EU LEVEL
The EU institutions should continue to put in practice the recommendations from the EUCG and provide a cycling friendly environment work and c ommuting movements.
The EU Cycling Focal Point could be involved in the implementation and monitoring of the measures in the EU Institutions.
NATIONAL LEVEL
Member States hosting EU institutions should support the recommendations for improvements and provide a cycling friendly environment.
EU Added value (and/or cost of non-Europe)
The EU institutions would be less credible if they wold not be showing the good example with respect to the implementation of measures which are recommended or mandatory to othe r entit ies and stakeholders. With their positive action the EU Institutions contribute directly to fulfi ll some of the essential EU policy objectives e.g. lowering the carbon footprint of transportation or providing growth and jobs for the EU economy.
Successful measures at the EU institutions
The Commission provides service bikes and e-bikes to its agents for trips in Brussels.
The Council, the EP and the Commission have created dedicated parking areas for bicycles
in their garages.
The EU Institutions have launched a comprehenive information campagne covering all
essential questions relating to the use of bicycles in Brussels.

Chapter 10 – Monitoring and evaluation
Summary
Launching an ex-ante evaluation as soon as possible, now that options are sti ll open in the EUCS, will improve the quality, relevance and comprehensiveness of the proposed programme design. The first step, presented here, consists of identifying indicators related to the proposed policies. The next step should be to further elaborate what types (ex -ante; mid-term, final or ex post) of evaluations are needed for each of the chapters of the cycling strategy, in cluding what should be the main focus of these exercises, when they are needed, and who is responsible for carrying them out. Key performance indicators are needed to assess cycle use, bicycle business performance, safety and health effects of cycling, an d the cycling environment in terms of infrastructure and quality of life, capacity building and governance. Cycle use refers to the achieved mobility targets and their impacts. The business performance indicates the importance cycling contribution to the European economy. Safety and health indicators are primarily a matter of accountability of authorities towards the cycling population. Infrastructure quality is not a set of standard measures, but needs to be addressed in terms of user needs and is therefor e an indicator of quality of life in European communities. Governance can be measured in terms of the number and success of good practices, and the uptake by follower communities, authorities, businesses and research. There is a need for common definition s of cycling, tr ips, mobile population etcetera, in order to allow comparison between statist ics produced by national and local travel surveys in Europe. This should be accompanied by harmonisation strategies, in order to keep existing time series in countries and cit ies having a tradit ion of measuring cycling. A more harmonised approach would also allow to produce more relevant indicators, such as exposure instead of fatalities per 1000 inhabitants. Better al ignment of existing European data collections an d processing initiatives such as the Health Interview Surveys, the Quality of Life survey, and Eurostat transport statistics, could produce more comparable, complementary statistics. The potential of crowd sourcing data collection on cycling infrastructur e could be improved through stimulation and better guidelines of the community. Concerning statistics on cycling use, privacy issues prevent the use of smartphone and GPS tracking to produce cycling statistics. European policy could resolve this by identif ying conditions to be met by algorithms to extract cycling trips from location data. Ult imately, a framework should be developed providing a comprehensive menu of indicators that can be used to diagnose strengths and weaknesses in cycling governance. Good governance is not only a matter of performance, but includes principles such as transparency, participation, and accountability.
10.1 Policy Evaluation
The status quo of cycling in the relevant policy field
The policies discussed in the previous chapters are in different stages of the policy cycle, varying forms of agenda setting, policy formulation, legit imation, implementation to evaluation

Blueprint for an EU Cycling Strategy - Chapter 10 – Monitoring and evaluation
Page 92/99
and maintenance. This implies ex -ante, mid-term and ex-post evaluation of the current EUCS, and of national, regional strategies, policies, and even projects. The main motive for evaluation of the European Cycling Strategy is to help identify and prepare EU policy. This chapter is intended for conceptual use, to help European policy makers identify short, medium and lo ng term cycling monitoring and evaluation strategies.
The proposed changes in EU policy
The evaluation of the European cycling strategy consists of assessing how far the policy measures contribute to local, national, regional, and global targets. This req uires monitoring based on indicators capable of reflecting the current situation and progress towards achieving objectives from local to global level. The monitoring efforts are complementary; effective global monitoring relies on periodic country reportin g,145 regional monitoring and evaluation is needed to stimulate interoperabil ity, regional collaboration and coherence in pursued strategies, 146 and each community collects, analyses, and communicates data on progress on dealing with local challenges. 147 Each of these monitoring efforts builds on existing data collection and processing mechanisms and processes, and may include official and unofficial data. While local level monitoring may be very context specific, the global scale requires universal indicators ba sed on standardised data collection and processing methods, ensuring harmonisation.
EU Added Value
Progress in one area often depends on progress in other areas; the goals and targets are interdependent and must be pursued together. Therefore indicators ma y serve the monitoring of progress towards more than one goal and target. By tracking cross -cutting issues the cycling strategy indicators help to evaluate policies in terms of the level of integration and systems -based approaches to implementation. In lin e with this, indicators identified for monitoring and evaluation of the EU cycling strategy are discussed from the perspective of their contribution to inform about progress in multiple goals and targets.
10.2 Monitoring Through Key Performance Indicators
In this subchapter, key performance indicators are suggested based on their role in the monitoring and assessment of EU cycling policies proposed in the cycling strategy. Each indicator can be measured and calculated in different ways. The current data an d statistics in Europe are briefly presented, without further elaboration of technical issues. Each key performance indicator needs EU policies for adequate monitoring and assessment. These are further elaborated in the following subchapters.
The status quo of cycle use indicators
Increasing cycle use is the ultimate goal of the EU cycling strategy; indicators of cycle use are the most important key performance indicators of the EU Cycling strategy. The most common
145 (UN Secretary-General, 2015) 146 (European Commission, 2011) 147 (World Business Council for Sustainable Development, 2015)

Blueprint for an EU Cycling Strategy - Chapter 10 – Monitoring and evaluation
Page 93/99
indicators of cycle use are: average dista nce cycled per person, cycling frequency, modal split and share of the population that cycles regularly. Related indicators are: people trained in cycling and cycle use statistics by age. The person-kilometres cycled are the basis for calculation of envi ronmental and cl imatic benefits, fuel and resource savings, congestion reduction, connectivity in terms of inter -and multimodality (chapter 2), and are needed for the impact assessment of behaviour change efforts (chapter 3). LINK TO GLOBAL SCALE Monitoring cycle use is thus needed to assess the contribution of EU cycling policies to UN Sustainable Development goals (UN -SDG):
Ensure sustainable consumption and production patterns (UN -SDG Goal 12). Strategic environmental and social impact assessments (U N-SDG Goal 12). Develop and implement tools to monitor sustainable development impacts for sustainable tourism which creates jobs, promotes local culture and products (UN -SDG Goal 12.b) Indicator on policies for sustainable tourism (UN -SDG Goal 12.5)
Ensure healthy lives and promote well -being for al l at all ages (UN-SDG Goal 3). By 2030 halve global deaths from road traffic accidents (UN -SDG Goal 3.6.)
Take urgent action to combat cl imate change and its impacts (UN -SDG Goal 3). Integrate climate change measures into national policies, strategies, and planning. (UN -SDG Goal 13.2). Improve education, awareness raising and human and institutional capacity on climate change mitigation, adaptation, impact reduction, and early warning (UN -SDG Goal 13.3). Promote mechanisms for raising capacit ies for effective climate change related planning and management, in LDCs, including focusing on women, youth, local and marginalized communities (UN -SDG Goal 13.b)
LINK TO LOCAL SCALE At local scale, cycle use measures allow cit ies to perform a standardized evaluation of their mobility system and measure the improvements result ing from the implementation of new mobility practices or policies in terms of:
Energy efficiency: Total energy consumed for city transport (annual, tot al over al l modes)
Emissions of greenhouse gases: Tonne CO2 equivalent well -to-wheel emissions by urban transport per annum per capita
Commuting travel time: Average duration of the combined outward journey and return journey to work or an educational esta blishment expressed in minutes per person per day.
Access to mobil ity services.
The proposed changes in EU policy
In Europe cycle use indicators are currently calculated from data collected through travel surveys organised at European level such as the Eu robarometers (European Commission, DG Regio, 2015, Eurostat, 2013) and the Health Interview surveys, 148 or through harmonisation initiatives of national statistics obtained mostly from national travel surveys. 149 National,
148 (Eurostat, 2014) 149 (Eurostat, 2014)

Blueprint for an EU Cycling Strategy - Chapter 10 – Monitoring and evaluation
Page 94/99
regional and local cycle use statisti cs are available throughout Europe 150 which could better inform European policy, yet require common definitions ( See 10.3 Common Definitions for Data CollectionError! Reference source not found. ) and harmonisation methods (See 10.4 Develop ethods for Harmonisation and Improve Synergy among Data Collection Initiatives ). More synergies are possible among these data collection initiatives and policy measures could also improve the possibil ities of big data collection (See 10.5 Stimulate + Harmonise Data Crowdsourcing and Use Possibilities of Big Data Collection ).
The status quo of bicycle business performance indicators
The bicycle market contributes to the European economy in many ways. Indicators proposed here refer to the (micro-)economic benefits in terms of turnover and jobs created by the cycling economy, from the manufacturing of bikes and of a wide range of related accessories and storage equipment, to services in sales and repair (chapter 2). These are the bas is for monitoring and assessment of policies on VAT regimes on bikes sales and bike repairs (chapter 7). They are also related to the performance assessment of policies on vehicle technology and standards (chapter 5). LINK TO GLOBAL SCALE These indicators can help to demonstrate Europe’s contribution to ‘strengthening the means of implementation and revitalize the global partnership for sustainable development’ (UN -SDG Goal 17), which is assessed in terms of domestic revenues allocated to sustainable deve lopment as percent of GNI, by sector (97) LINK TO LOCAL SCALE According to the World Business Council for Sustainable Development, the economic success is demonstrated by:
Economic opportunity: Citizens ’ perception of potential diff iculties in accessing t he job
market and/or education system due to mobility network.
Net public f inance: net results of government and other public authorities ’ revenues and
expenditures related to city transport
The proposed changes in EU policy
The main current indicators are: bicycle production and sales in Europe, jobs in bicycle production, sales and repair. Transportation Satell ite Accounts provide a means for measuring the contribution of transportation services to the national economy. The development of Transportation Satell ite Accounts in Europe, including cycling is a suggested medium term EU policy. This requires short term policies towards common definitions (See 10.3 Common Definit ions for Data CollectionError! Reference source not found. ), harmonisation methods and more synergies mong data collection initiatives ( See 10.4 Develop Methods for Harmonisation and Improve Synergy among Data Collection Initiatives ).
150 (Steenberghen, Tavares, Richardson, Himpe, & Crabbé, 2017)

Blueprint for an EU Cycling Strategy - Chapter 10 – Monitoring and evaluation
Page 95/99
The status quo of safety and health indicators
In the field of road safety in general, and of cycling in particular, there is a tremendous gap between the scientific state of the art 151 and the state of play reflected in official statistics (dee e.g. Eurostat, CARE database, in chapter 1). The use of accident stati stics such as the number of fatalities in absolute numbers or by population, has been known for many years to be inadequate to support pro-active approaches to traffic safety: “ Don’t wait for accidents to happen” (ICTCT, 1988 - present). Bicycles are a unique mode in that they are a vulnerable non -motorized mode, but often share the same space with cars. As a result, bicycles are essentially doubly exposed to risk both as a bicyclist, but also as a roadway user. 152 Exposure data based on actual cycling ki lo metres and on where people cycle (corridors etc.), are urgently needed. These risks are not l imited to road accidents. Studies have demonstrated that ventilator parameters (minute ventilation (VE), breathing frequency and tidal volume) while riding a bicycle, is 4.3 times higher compared to car passengers. 153 These increased VE in cyclists significantly increases their exposure to traffic exhausts. The assessment of health impacts of behaviour changes (chapter 5) therefore needs to be related to an evaluatio n of air quality improvement measures (chapter 2) and of exposure of cyclists to pollutants. LINK TO GLOBAL SCALE This is needed to prove a pro-active approach to ensuring healthy lives and promote well -being for al l at al l ages (UN -SDG Goal 3), more spec ifically towards the objective, by 2030, to halve global deaths from road traffic accidents (UN -SDG Goal 3.6.). It also allows to monitor the progress towards making cities and human settlements inclusive, safe, resi lient and sustainable (UN-SDG Goal 11). LINK TO LOCAL SCALE The local scale is the level needed to properly monitor and assess exposure of cyclists, both to traffic accident risk levels and to clean air.
The proposed changes in EU policy
Comparable statist ics on cycle use in person kilometres, and in terms of modal split, combined with cycling accident statistics, are urgently needed for a better statistics on cycling safety. However, this is only a starting point. Exposure also needs to be addressed from the perspective of where people cycle, in relation to motorized traffic and infrastructure characteristics. The way forward is to simulate and harmonise data crowdsourcing and use possibilit ies of big data collection (See 10.5 Stimulate + Harmonise Data Crowdsourcing and Use Possibilities of Bi g Data Collection).
The status quo in cycling infrastructure and quality of life indicators
151 (Fournier, Christofa, & Knodler, 2017) 152 (Fournier, Christofa, & Knodler, 2017) 153 (IntPanis, et al., 2010)

Blueprint for an EU Cycling Strategy - Chapter 10 – Monitoring and evaluation
Page 96/99
Harmonisation of cycling infrastructure definit ions proves to be difficult, and may soon be outdated, considering the growth rate of pedelecs, speed pedelecs, (e -) cargo bikes, etc. types of e-bikes. As presented in chapter 5, it is an EU level task to update General Safety Regulations and include safety of cyclists. Minimum quality criteria for vehicles need to be developed (chapter 4). Comparabil ity of infrastruct ure quality requires harmonisation beyond suggesting minimum width of cycle tracks and maximum speed zones. Ult imately, the quality of infrastructure has to meet the needs of the users, i.e. cyclists. These users include different groups, such as age grou ps, commuters, tourism and leisure (chapter 3). Their needs are context dependent: topography, cl imate, modal split, congestion, and etcetera. Therefore indicators of quantity and quality of cycling infrastructure should be expressed in terms of user satisfaction and are related to quality of l ife indicators. LINK TO GLOBAL SCALE Develop quality, reliable, sustainable and resil ient infrastructure, including regional and trans -border infrastructure, to support economic development and human well -being, with a focus on affordable and equitable access for all (UN -SDG Goal 9.1) LINK TO LOCAL SCALE At local scale, mobil ity space usage is an important indicator of quality of life, in cit ies it is expressed as the proportion of land use taken by all city transpo rt modes, including direct and indirect uses. This can be compared to the modal split to monitor the balance between space usage and mobil ity behaviour. The length of roads and streets with sidewalks and bike lanes and 30 or 25 km/h zones and pedestrian zones related to total length of city road network (excluding motorways) may be an indication of opportunities for active mobil ity in a city. When assessing the presence of cycling infrastructure through such indicators it is important to include commuting zones and different degrees of urbanisation.
The proposed changes in EU policy
In Europe, an attempt to collect cycling infrastructure statistics based on official statistics, resulted in some statistics in 12 of the 30 countries analysed, and in 24 of th e 30 cities. 154 Although these produced good practise examples, they were not sufficiently harmonised for a comparative overview. Crucial for comparable data on infrastructure is the use of comparable definitions, guidelines for qualitative drawing and cons istent tagging of one-way and two-way cycling infrastructure to allow comparable calculation of the length ( See 10.3). Because of the link between infrastructure, user satisfaction and quality of life, synergies among data collections should be addressed in EU policy (See 10.4).
The status quo in governance
154 (Steenberghen, Tavares, Richardson, Himpe, & Crabbé, 2017)

Blueprint for an EU Cycling Strategy - Chapter 10 – Monitoring and evaluation
Page 97/99
Measuring governance is a major challenge because of its multi -dimensional character, as well as its conceptual and definitional issues. Good governance is often associated with principles such as transparency, participation, and accountability. These are inherent to all the policies proposed in the European Cycling Strategy. Therefore the key performance indicators proposed concern the policy stages achieved in all the previous chapters, for example, the number of cycle friendly highway codes in European countries, the number and implementation level of national cycling strategies, the number and implementation levels of sustainable urban mobility plans, etc.
The proposed changes in EU policy
Set up init iatives to stimulate sharing of best practices among communities, authorities, businesses and research. Stimulate cross -border, trans-national co-operation and networking to combine complementary expertise, strategies, policies and projects in differen t countries.
10.3 Common Definitions for Data Collection
Status quo
The Eurostat guidelines on Passenger Mobility Statistics 155 give indications on data collection, processing and reporting, but they are not detailed in terms of cycling, and the implementati on in national travel surveys takes years to produce comparable statistics. None of the travel surveys reported in the country reports of the ‘Support Study on data collection and analysis of active modes use and infrastructure in Europe have a definit ion ‘bike’ in the guidelines. Some mention examples to be in –or excluded, but that is the most guidance given to the respondents. Only in the Netherlands, e -bikes are recorded separately since 2015. ’The EN ISO standard 4210 ‘Cycles — Safety requirements for bicycles’, also listed as a harmonised standard (GPSD) and different types of pedelecs have not yet found their way to travel surveys.
The proposed changes in EU policy
This absence of definition is an opportunity for short term change: provide countries , region and cities with an operational definition of cycling, allowing travel survey respondents to record their trips in a standardized way. Guidelines are also needed on how to record trips and take into account trip stages in data processing, to overcome the underestimation of cycling trips. The aggregation and publication of cycling statistics in Europe, needs to be calculated by degree of urbanisation, city and commuting zones.
155 (Eurostat, 2014)
Blueprint for an EU Cycling Strategy - Chapter 10 – Monitoring and evaluation
Page 98/99
EU Added Value
Comparable statist ics over the whole EU
10.4 Develop Methods for Harmonisation and Improve Synergy among Data Collection Initiatives
Status Quo
The country research conducted in 2016 for the support study on data collection and analysis of active modes use and infrastructure in Europe 156 showed that in countries having statist ics on daily cycling activity and trips, the national averages differ from those at city (capital) level. Also, there are more cit ies collecting these data than countries. In several country reports, the need for comparisons between cit ies is mentioned. The city statistics could not be compared to European statist ics, because there is no systematic active modes data collection in European cit ies. When indicators such as average daily cycling distances and numbers of trips are calculated, in some cases the population refers to the entire population, in other to the mobile population, or to the share of the population that actually cycles. There is a lack of standard approaches to calculate the mobile population, the share of the population cycling regularly etcetera. The most common calculation is to divide the number of cycling trips reported in travel surveys by the total sample population, which gives lower distances and numbers of trips than the calculations for the mobile population. When only the main mode of trips are reported in travel surveys, the trip stages such as cycling to a bus or railway station are excluded from the statistics.
The proposed changes in EU policy
A short term synergy with existing init iatives could be the “Qualit y of Life in cities” survey conducted every three years since 2004 (DG REGIO). Adding questions on active modes use in this survey could provide harmonised satisfaction data for 80 cities, and be comparable with other urban data, because the definition of the city and of the population would be the same, as well as the sampling method. By adding questions on where and why people walk and cycle, the relation between levels of urbanisation and active modes use can be researched, which can then further lead to comparable approaches to data collection by degree of urbanisation, city and commuting zones. Develop guidelines for harmonising statist ics, create database of definit ions and data collections methods used. MS’s policies: Provide comprehensive information on definit ions and methods used in statist ics. Medium term: replace rigid cycling infrastructure guidelines by an indicator of user satisfaction with cycling infrastructure, combined with modal split and standard mapping guidelines for crowd sourced data on cycling tracks and lanes (see subchapter 1.5). In the long term, a monitoring of active modes is needed, combining indicators based on official and unofficial data.
156 (Steenberghen, Tavares, Richardson, Himpe, & Crabbé, 2017)

Blueprint for an EU Cycling Strategy - Chapter 10 – Monitoring and evaluation
Page 99/99
EU Added value
Statist ics can be compared without having to change national and local d ata collection methods, thus allowing countries and cit ies to keep time series, while improving comparabil ity.
10.5 Stimulate + Harmonise Data Crowdsourcing and Use Possibilities of Big Data Collection
Status Quo
There are some successful examples of how crowdsourcing can provide reliable data on cycling (e.g. Fietstelweek Netherlands + Flanders). However, in their current stage of development, big data collection methods tend to be biased when used to produce cycling statistics due to their reliance on users agreeing to upload apps that monitor their mobility. Although algorithms exist to extract cycling trips from location data, privacy issues prevent the use of smartphone and GPS tracking to produce cycling statistics. The comparison of statistics deriv ed from the OpenCycleMap with official statistics in the Netherlands shows that it is possible to extract reliable cycling infrastructure statist ics from volunteer contributions. This initiative might not be transferable to other countries where the cycling associations have fewer members and resources. The quality of OSM cycling infrastructure data varies, thus impeding its use to monitor and evaluate the cycling infrastructure across Europe. However, the fact that there are contributions all over Europe, indicates that cyclists are will ing to volunteer in crowd sourcing initiatives. The main shortcomings of crowd sourced data on cycling infrastructure, are inconsistencies due to different interpretations of mapping guidelines. As guidelines are incremental ly developed, these open data from crowd sourcing wil l gradually improve.
The proposed changes in EU policy
In order to stimulate further implementation of the good practice example identified in the Netherlands for cycling infrastructure statistics, a nu mber of initiatives are possible:
Further standardize the definit ions of cycling infrastructure in the European Cycling Lexicon, for example by taking into account traffic calming measures;
Harmonise definit ions used for cycling infrastructure in Europe;
Make the mapping rules in crowd sourcing initiatives such as OSM evolve towards these definit ions for mapping cycling infrastructure in Europe;
Stimulate participation in mapping cycling infrastructure. This could be combined with successful init iatives such as the European Cycling challenge.
There is a need to develop a legal framework and guidelines for harmonised data collection from big data sources like smartphone GPS sources. EU policies could resolve this in the medium term.