bme 2006 preliminary results - bme bolsas y mercados ... · 5 outstanding q4 results leading to...
TRANSCRIPT
BME 2006 Preliminary Results
February 27th, 2007
2
DISCLAIMER>THIS INFORMATION IS STRICTLY CONFIDENTIAL AND IS BEING FURNISHED TO YOU SOLELY FOR YOUR INFORMATION. IT MAY NOT BE REPRODUCED OR REDISTRIBUTED TO ANY OTHER PERSON, AND IT MAY NOT BE PUBLISHED, IN WHOLE OR IN PART, FOR ANY PURPOSE. BY RECEIVING THIS INFORMATION, YOU BECOME BOUND BY THE ABOVE-REFERRED CONFIDENTIALITY OBLIGATION. FAILURE TO COMPLY WITH SUCH CONFIDENTIALITY OBLIGATION MAY RESULT IN CIVIL, ADMINISTRATIVE OR CRIMINAL LIABILITIES.
>NEITHER THIS INFORMATION NOR ANY COPY OF IT MAY BE TAKEN, TRANSMITTED INTO, DISCLOSED ORDISTRIBUTED IN THE UNITED STATES, CANADA, AUSTRALIA OR JAPAN. THE DISTRIBUTION OF THIS INFORMATION IN OTHER JURISDICTIONS MAY ALSO BE RESTRICTED BY LAW AND PERSONS INTO WHOSE POSSESSION THIS INFORMATION COMES SHOULD INFORM THEMSELVES ABOUT AND OBSERVE ANY SUCH RESTRICTIONS.
>THIS INFORMATION DOES NOT CONSTITUTE OR FORM PART OF ANY OFFER FOR SALE OR SOLICITATION OF ANY OFFER TO BUY ANY SECURITIES NOR SHALL IT OR ANY PART OF IT FORM THE BASIS OF OR BE RELIED ON IN CONNECTION WITH ANY CONTRACT OR COMMITMENT TO PURCHASE SHARES. BOLSAS Y MERCADOS ESPAÑOLES, SOCIEDAD HOLDING DE MERCADOS Y SISTEMAS FINANCIEROS, S.A. (“BME”) IS CONDUCTING ITS INITIAL OFFERING OF SHARES COMPRISING (1) A PUBLIC OFFERING OF SHARES IN SPAIN BY WAY OF OF A SPANISH LANGUAGE PROSPECTUS (“FOLLETO”) WHICH HAS BEEN APPROVED BY AND REGISTERED WITH THE COMISIÓN NACIONAL DEL MERCADO DE VALORES (“CNMV”) IN SPAIN ON JUNE 22, 2006, AND (2) AN INTERNATIONAL OFFERING OUTSIDE OF SPAIN TO INSTITUTIONAL INVESTORS. ANY DECISION TO PURCHASE SHARES IN THE OFFERING SHOULD BE MADE SOLELY ON THE BASIS OF THE INFORMATION CONTAINED IN THE FOLLETO (AS SUPPLEMENTED FROM TIME TO TIME) OR TO BE CONTAINED IN THE FINAL INTERNATIONAL OFFERING MEMORANDUM TO BE PUBLISHED IN DUE COURSE IN RELATION TO THE OFFERING.
>THE INFORMATION CONTAINED IN THIS DOCUMENT HAS BEEN PROVIDED BY BME.
3
Index
> 2006 highlights
> Business Areas
> Business drivers
> Financials

4
2006 - Highlights
> Record profits = 130.5 M (+27.8%)
> Record activity in main business units
> Strong business drivers
> Interim dividend doubled
> Technology developments – trading capacity increased
> Dynamic product strategy
> 2006 - a year to remember : IPO & New organisation
5
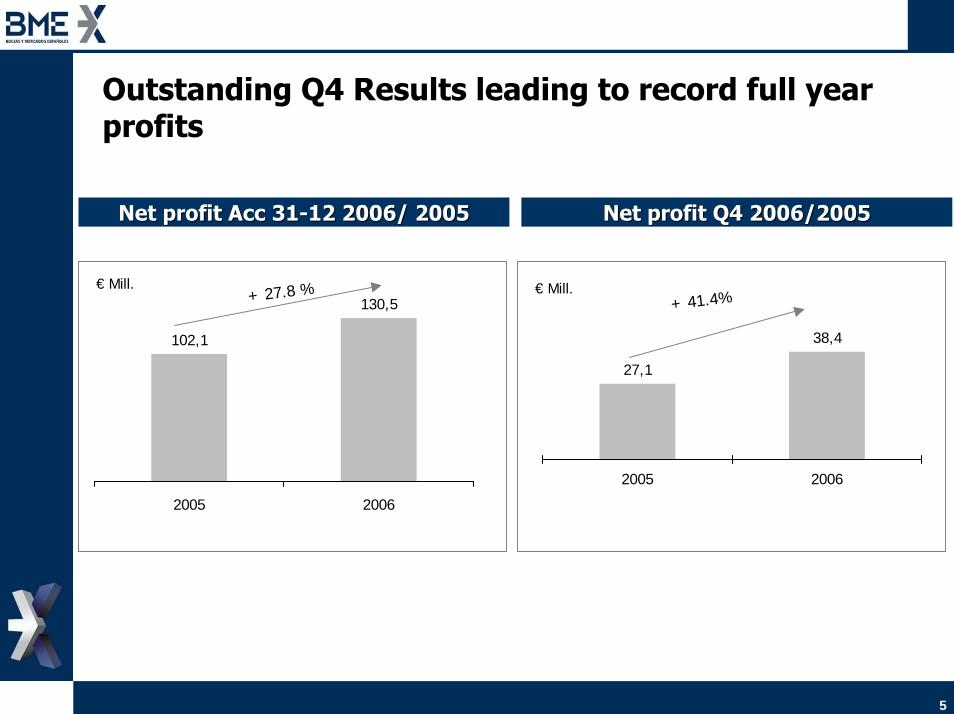
Outstanding Q4 Results leading to record full year profits
Net Net profitprofit AccAcc 3131--12 2006/ 200512 2006/ 2005 Net Net profitprofit Q4 2006/2005Q4 2006/2005
102,1
130,5
2005 2006
€ Mill.
27,1
38,4
2005 2006
€ Mill.+ 27.8 %+ 41.4%
6
Business Areas
7
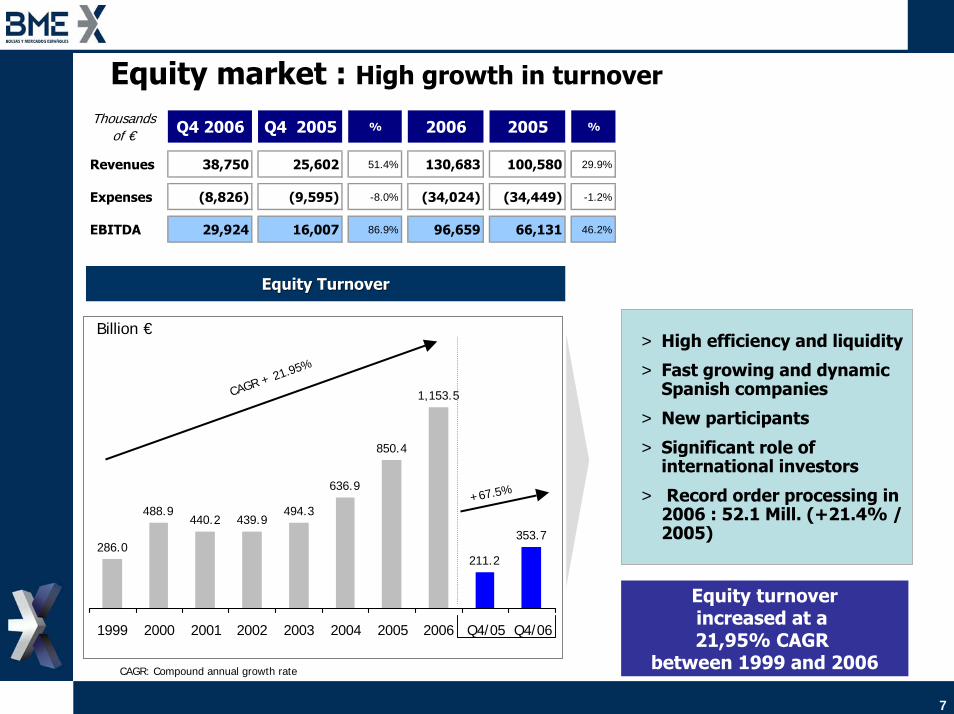
Equity market : High growth in turnoverThousands
of € Q4 2006 Q4 2005 % 2006 2005 %
Revenues 38,750 25,602 51.4% 130,683 100,580 29.9%
Expenses (8,826) (9,595) -8.0% (34,024) (34,449) -1.2%
EBITDA 29,924 16,007 86.9% 96,659 66,131 46.2%
EquityEquity TurnoverTurnover
> High efficiency and liquidity
> Fast growing and dynamic Spanish companies
> New participants
> Significant role of international investors
> Record order processing in 2006 : 52.1 Mill. (+21.4% / 2005)
286.0
488.9440.2 439.9
494.3
636.9
850.4
1,153.5
211.2
353.7
1999 2000 2001 2002 2003 2004 2005 2006 Q4/05 Q4/06
CAGR + 21.95%
+67.5%
Billion €
Equity turnoverincreased at a 21,95% CAGR
between 1999 and 2006CAGR: Compound annual growth rate
8
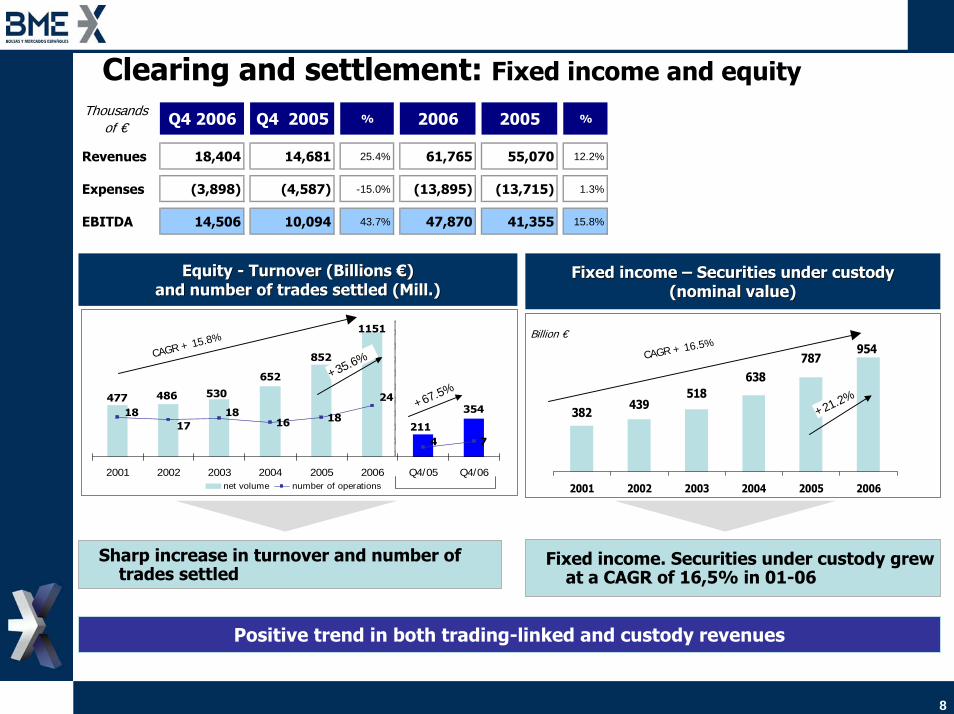
Clearing and settlement: Fixed income and equityThousands
of € Q4 2006 Q4 2005 % 2006 2005 %
Revenues 18,404 14,681 25.4% 61,765 55,070 12.2%
Expenses (3,898) (4,587) -15.0% (13,895) (13,715) 1.3%
EBITDA 14,506 10,094 43.7% 47,870 41,355 15.8%
FixedFixed incomeincome –– Securities under custody Securities under custody (nominal value)(nominal value)
354
852
652
530486477
211
1151
16 18
7
181817
4
24
2001 2002 2003 2004 2005 2006 Q4/05 Q4/06net volume number of operations
CAGR + 15.8%
+35.6%
+67.5%
Fixed income. Securities under custody grew at a CAGR of 16,5% in 01-06
EquityEquity -- TurnoverTurnover ((BillionsBillions €) €) and number of trades settled (Mill.)and number of trades settled (Mill.)
Sharp increase in turnover and number of trades settled
382439
518638
787954
2001 2002 2003 2004 2005 2006
Billion €
CAGR + 16.5%
+21.2%
Positive trend in both trading-linked and custody revenues
9
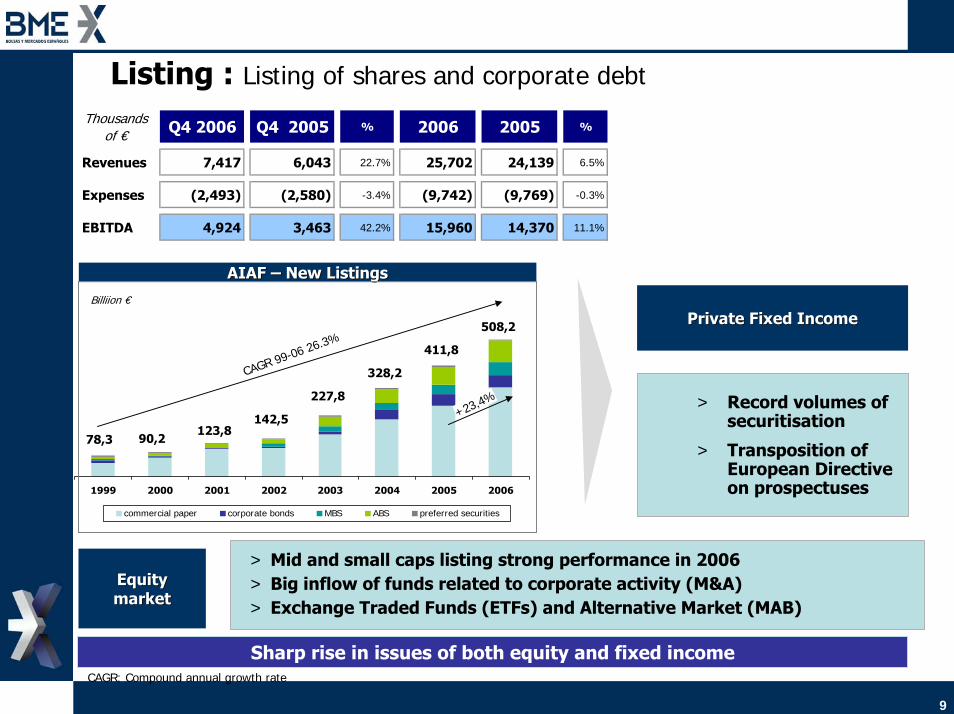
Listing : Listing of shares and corporate debtThousands
of € Q4 2006 Q4 2005 % 2006 2005 %
Revenues 7,417 6,043 22.7% 25,702 24,139 6.5%
Expenses (2,493) (2,580) -3.4% (9,742) (9,769) -0.3%
EBITDA 4,924 3,463 42.2% 15,960 14,370 11.1%
1999 2000 2001 2002 2003 2004 2005 2006
commercial paper corporate bonds MBS ABS preferred securities
AIAF AIAF –– New ListingsNew Listings
78,3 90,2123,8
142,5
227,8
328,2CAGR 99-06 26.3%411,8
+23,4%
Billiion €
508,2 Private Fixed IncomePrivate Fixed Income
> Record volumes of securitisation
> Transposition of European Directive on prospectuses
Sharp rise in issues of both equity and fixed incomeCAGR: Compound annual growth rate
> Mid and small caps listing strong performance in 2006> Big inflow of funds related to corporate activity (M&A)> Exchange Traded Funds (ETFs) and Alternative Market (MAB)
Equity Equity marketmarket

10
Derivatives
> BME is the fourth largest derivatives market in Europe
> MEFF is the leading market in single equities futures in Europe (21 Mill. Contracts traded in 2006)
> In spite of intense competition, the new fee structure and membership policy have enhanced growth since 2003
> More than 47 million contracts traded in 2006BME reversed downward trend to show positive growth of over 10%
OpenOpen interestinterest
0
1.000
2.000
3.000
4.000
5.000
6.000
7.000
8.000
1999 2000 2001 2002 2003 2004 2005 2006
Fut. Ibex 35 Fut. Mini Ibex 35 Op. Ibex 35 Fut. Accs. Op. Accs.
Th. contracts
Fuente: BME
+7.9%
TurnoverTurnover
05.000
10.00015.00020.00025.00030.00035.00040.00045.00050.00055.00060.000
1999 2000 2001 2002 2003 2004 2005 2006 Q4/05 Q4/06
Fut. Ibex 35 Fut. Mini Ibex 35 Op. Ibex 35 Fut. Accs. Op. Accs.
Th. contracts
Fuente: BME
+17.5%
+20.8%
Thousands of € Q4 2006 Q4 2005 % 2006 2005 %
Revenues 6,434 5,400 19.1% 23,955 20,602 16.3%
Expenses (2,659) (2,859) -7.0% (11,097) (11,205) -1.0%
EBITDA 3,775 2,541 48.6% 12,858 9,397 36.8%
11
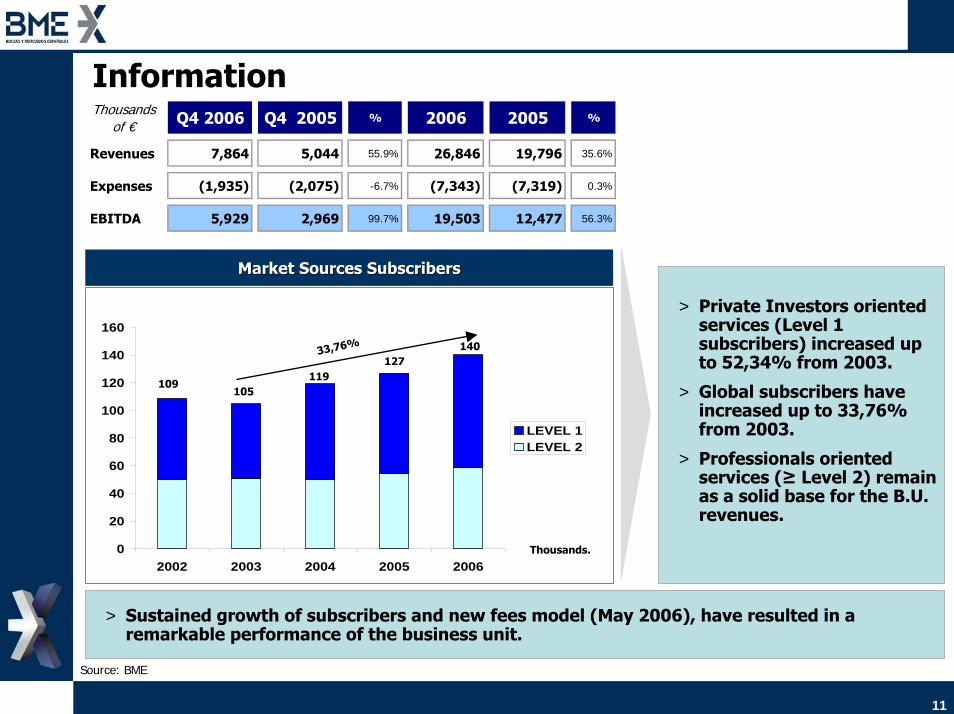
InformationThousands
of € Q4 2006 Q4 2005 % 2006 2005 %
Revenues 7,864 5,044 55.9% 26,846 19,796 35.6%
Expenses (1,935) (2,075) -6.7% (7,343) (7,319) 0.3%
EBITDA 5,929 2,969 99.7% 19,503 12,477 56.3%
Market Sources SubscribersMarket Sources Subscribers
> Private Investors oriented services (Level 1 subscribers) increased up to 52,34% from 2003.
> Global subscribers have increased up to 33,76% from 2003.
> Professionals oriented services (≥ Level 2) remain as a solid base for the B.U. revenues.
Source: BME
0
20
40
60
80
100
120
140
160
2002 2003 2004 2005 2006
LEVEL 1LEVEL 2
33,76%
109105
119127
140
Thousands.
> Sustained growth of subscribers and new fees model (May 2006), have resulted in a remarkable performance of the business unit.
12
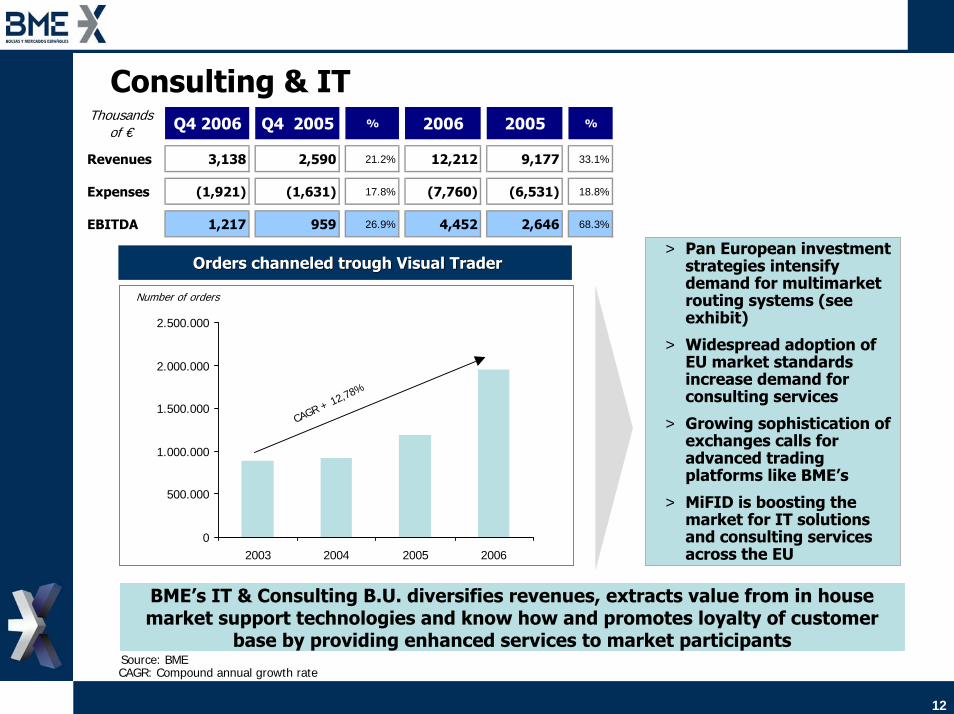
Consulting & IT
0
500.000
1.000.000
1.500.000
2.000.000
2.500.000
2003 2004 2005 2006
CAGR + 12,78%
Orders channeled trough Visual TraderOrders channeled trough Visual Trader> Pan European investment
strategies intensify demand for multimarket routing systems (see exhibit)
> Widespread adoption of EU market standards increase demand for consulting services
> Growing sophistication of exchanges calls for advanced trading platforms like BME’s
> MiFID is boosting the market for IT solutions and consulting services across the EU
BME’s IT & Consulting B.U. diversifies revenues, extracts value from in house market support technologies and know how and promotes loyalty of customer
base by providing enhanced services to market participants
CAGR: Compound annual growth rate
Number of orders
Source: BME
Thousands of € Q4 2006 Q4 2005 % 2006 2005 %
Revenues 3,138 2,590 21.2% 12,212 9,177 33.1%
Expenses (1,921) (1,631) 17.8% (7,760) (6,531) 18.8%
EBITDA 1,217 959 26.9% 4,452 2,646 68.3%
13
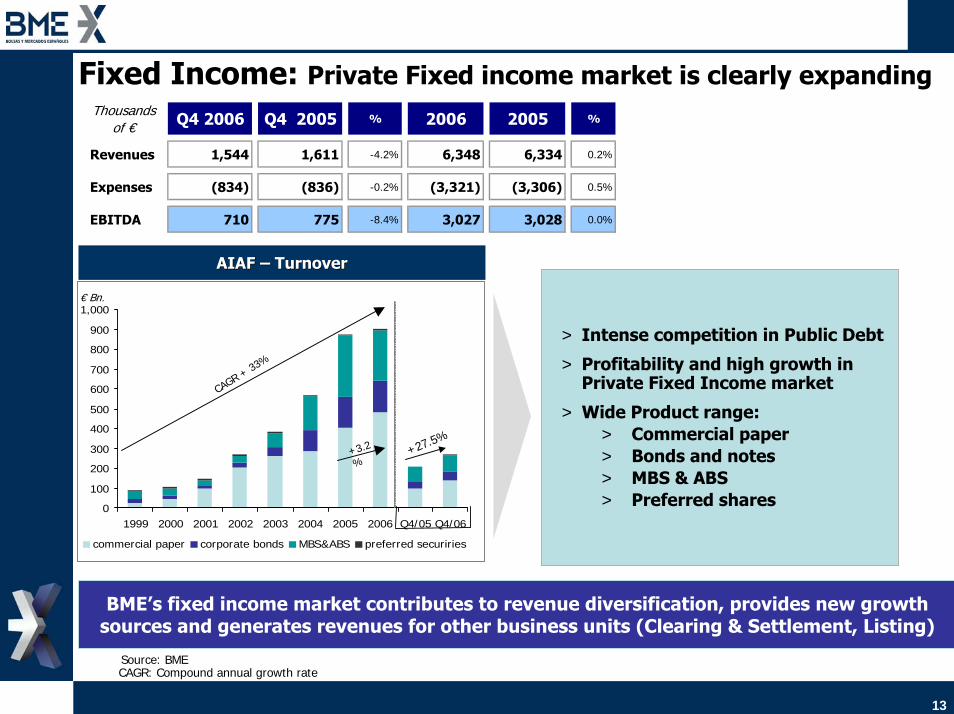
Fixed Income: Private Fixed income market is clearly expandingThousands
of € Q4 2006 Q4 2005 % 2006 2005 %
Revenues 1,544 1,611 -4.2% 6,348 6,334 0.2%
Expenses (834) (836) -0.2% (3,321) (3,306) 0.5%
EBITDA 710 775 -8.4% 3,027 3,028 0.0%
AIAF AIAF –– TurnoverTurnover
> Intense competition in Public Debt
> Profitability and high growth in Private Fixed Income market
> Wide Product range: > Commercial paper> Bonds and notes> MBS & ABS> Preferred shares0
100
200
300
400
500
600
700
800
900
1,000
1999 2000 2001 2002 2003 2004 2005 2006 Q4/05 Q4/06
commercial paper corporate bonds MBS&ABS preferred securiries
CAGR + 33%
+3.2
%
€ Bn.
+27.5%
BME’s fixed income market contributes to revenue diversification, provides new growth sources and generates revenues for other business units (Clearing & Settlement, Listing)
CAGR: Compound annual growth rateSource: BME

14
Business Drivers

15
Business Drivers
> High liquidity Blue Chips traded in Spain
> Increasing contribution from mid caps in clear expansion mode (gaining size and liquidity)
> Almost 100% of equity trading in Spanish stocks made in local markets
> Competitive and In-House Developed Technology
> Dynamic product strategy
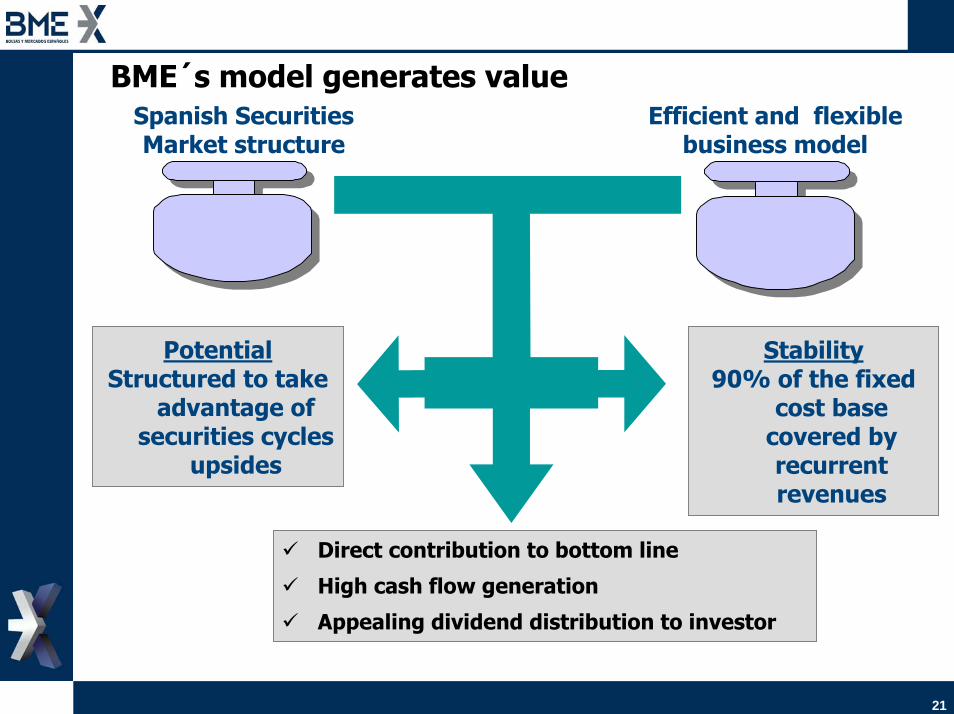
> BME´s model generates value
16
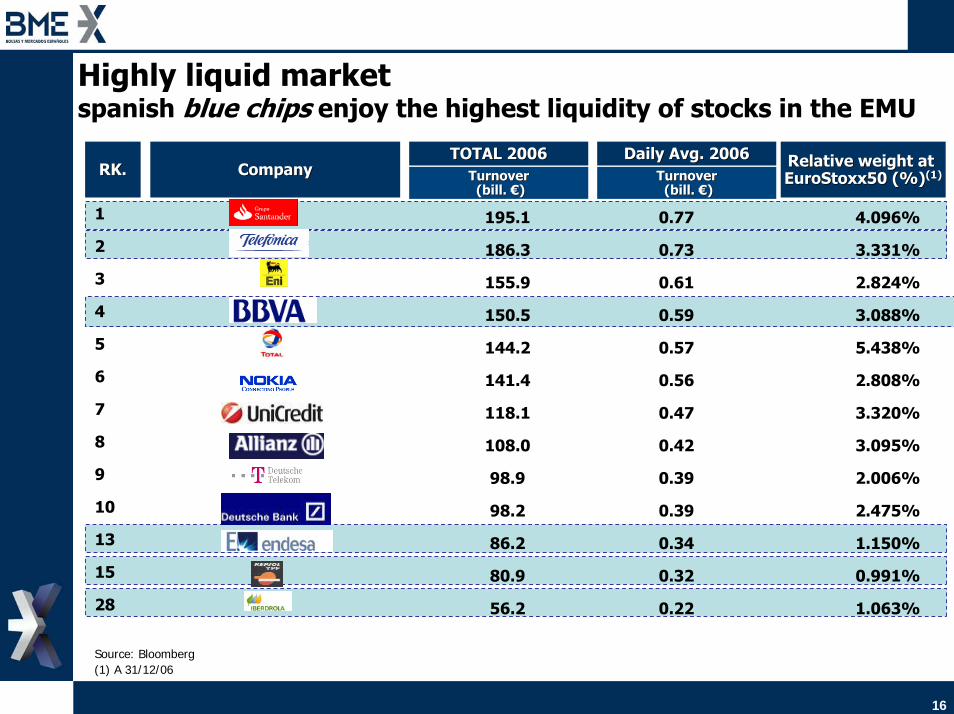
Highly liquid market spanish blue chips enjoy the highest liquidity of stocks in the EMU
RK.RK. CompanyCompanyTOTAL 2006TOTAL 2006
TurnoverTurnover((billbill. €). €)
DailyDaily AvgAvg. 2006. 2006TurnoverTurnover((billbill. €). €)
RelativeRelative weightweight at at EuroStoxx50EuroStoxx50 (%)(%)(1)(1)
1 195.1 0.77 4.096%
2 186.3 0.73 3.331%
3 155.9 0.61 2.824%
4 150.5 0.59 3.088%
5 144.2 0.57 5.438%
6 141.4 0.56 2.808%
7 118.1 0.47 3.320%
8 108.0 0.42 3.095%
9 98.9 0.39 2.006%
10 98.2 0.39 2.475%
13 86.2 0.34 1.150%
15 80.9 0.32 0.991%
28 56.2 0.22 1.063%
Source: Bloomberg(1) A 31/12/06
17
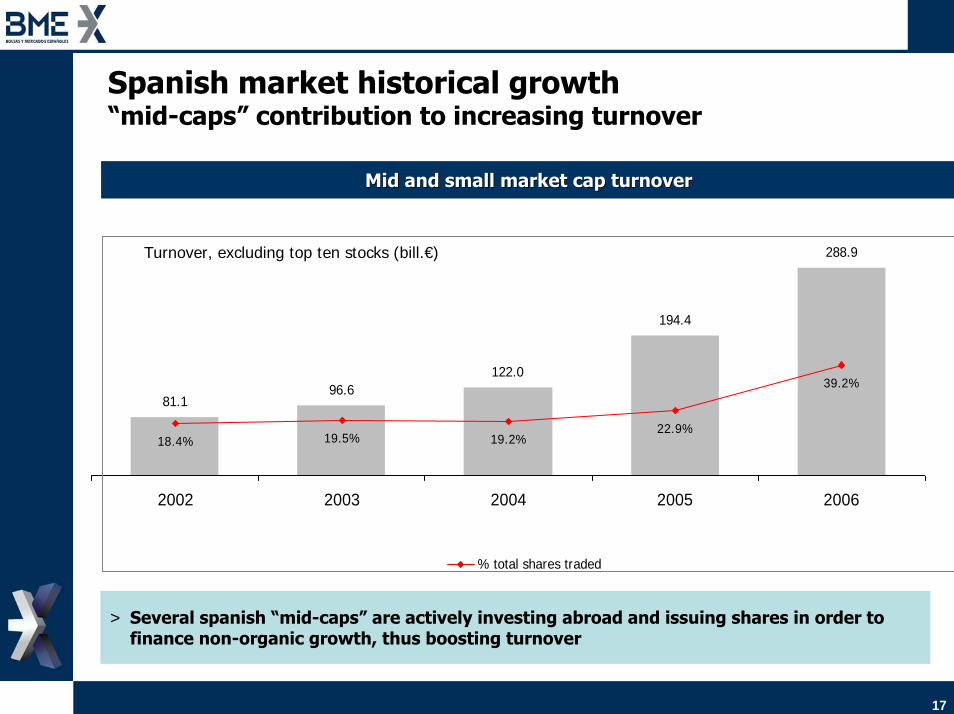
Spanish market historical growth “mid-caps” contribution to increasing turnover
81.196.6
122.0
194.4
288.9
18.4% 19.5% 19.2%22.9%
39.2%
2002 2003 2004 2005 2006
% total shares traded
> Several spanish “mid-caps” are actively investing abroad and issuing shares in order to finance non-organic growth, thus boosting turnover
Turnover, excluding top ten stocks (bill.€)
Mid and small market cap turnoverMid and small market cap turnover
18
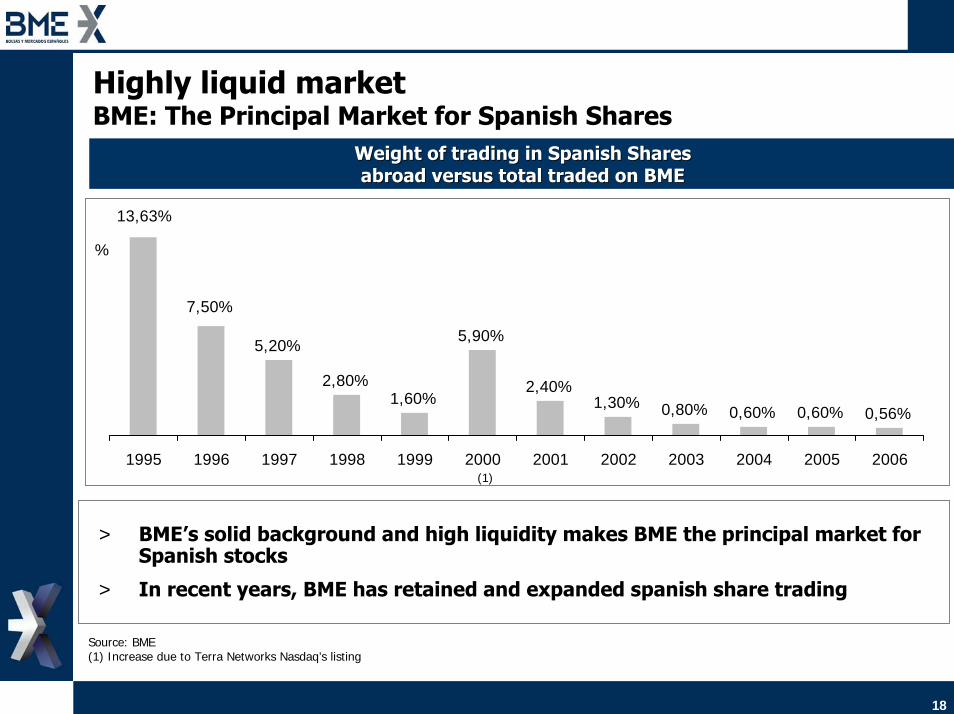
Highly liquid market BME: The Principal Market for Spanish Shares
Weight of trading in Spanish SharesWeight of trading in Spanish Sharesabroad versus total traded on BMEabroad versus total traded on BME
5,20%
2,80%1,60%
5,90%
2,40%1,30% 0,80% 0,60% 0,60% 0,56%
13,63%
7,50%
1995 1996 1997 1998 1999 2000 2001 2002 2003 2004 2005 2006
%
(1)
> BME’s solid background and high liquidity makes BME the principal market for Spanish stocks
> In recent years, BME has retained and expanded spanish share trading
Source: BME(1) Increase due to Terra Networks Nasdaq’s listing
19
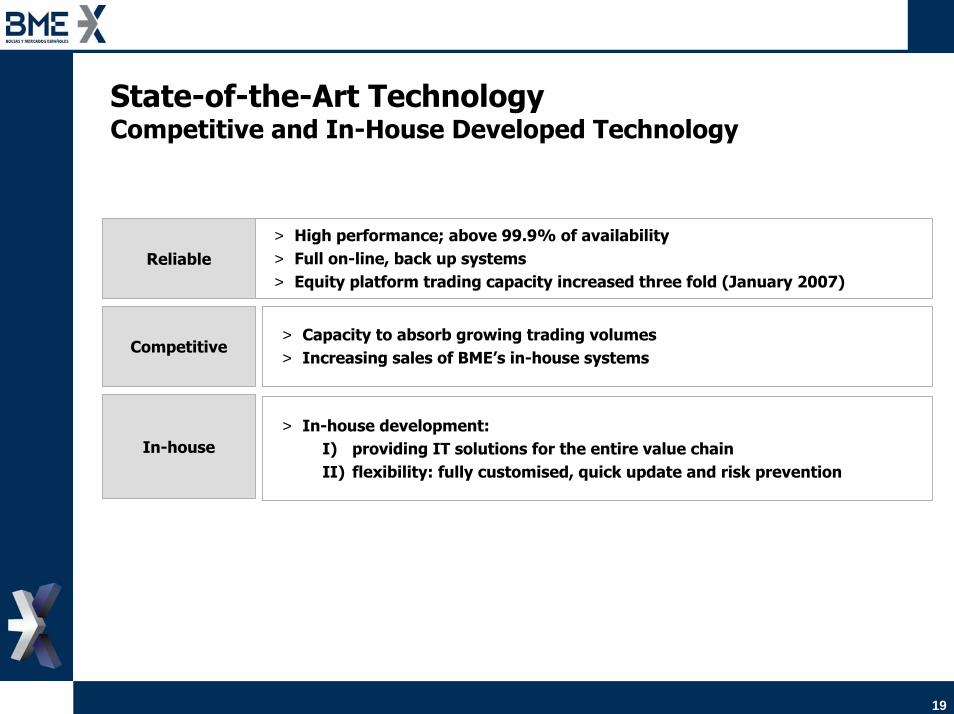
State-of-the-Art TechnologyCompetitive and In-House Developed Technology
> High performance; above 99.9% of availability> Full on-line, back up systems> Equity platform trading capacity increased three fold (January 2007)
Reliable
> Capacity to absorb growing trading volumes> Increasing sales of BME’s in-house systems
Competitive
> In-house development:I) providing IT solutions for the entire value chainII) flexibility: fully customised, quick update and risk prevention
In-house
20
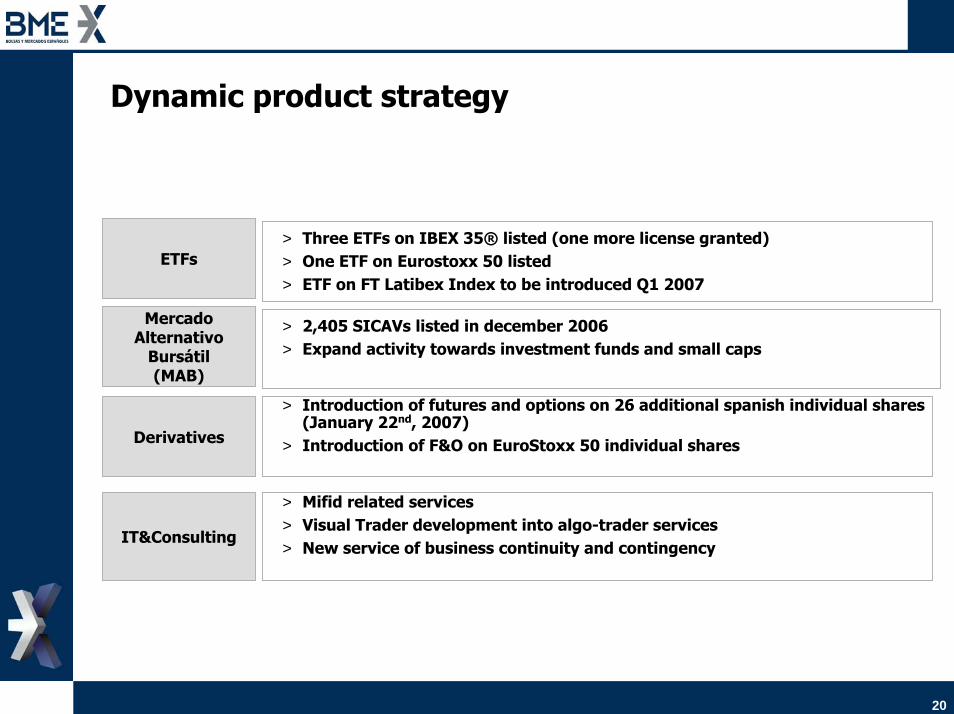
Dynamic product strategy
> Three ETFs on IBEX 35® listed (one more license granted)> One ETF on Eurostoxx 50 listed> ETF on FT Latibex Index to be introduced Q1 2007
ETFs
> 2,405 SICAVs listed in december 2006> Expand activity towards investment funds and small caps
Mercado Alternativo
Bursátil(MAB)
> Introduction of futures and options on 26 additional spanish individual shares (January 22nd, 2007)
> Introduction of F&O on EuroStoxx 50 individual sharesDerivatives
IT&Consulting
> Mifid related services> Visual Trader development into algo-trader services> New service of business continuity and contingency
21
BME´s model generates valueEfficient and flexible
business modelSpanish SecuritiesMarket structure
Stability90% of the fixed
cost base covered by recurrentrevenues
PotentialStructured to take
advantage ofsecurities cycles
upsides
Direct contribution to bottom line
High cash flow generation
Appealing dividend distribution to investor

22
Financials

23
P&L
Thousands of € Q4 2006 Q4 2005 % 2006 2005 %
Revenues 83,668 62,005 34.9% 287,745 236,963 21.4%
Expenses (27,448) (25,488) 7.7% (96,394) (90,555) 6.4%
EBITDA 56,220 36,517 54.0% 191,351 146,408 30.7%
EBIT 54,323 33,462 62.3% 184,613 138,485 33.3%
Financial results 3,292 2,662 23.7% 11,098 11,235 -1.2%
EBT 57,615 36,124 59.5% 195,711 149,720 30.7%
Net Profit 38,377 27,143 41.4% 130,528 102,120 27.8%

24
P&L - evolution
Growth…Growth… …with profitability…with profitability
RevenuesRevenues EBITDA EBITDA
€ Mill. € Mill.
56.2
36.5
191.4
146.4
109.1
2004 2005 2006 Q4-05 Q4-06
83.762.0
287.7
237.0201.6
2004 2005 2006 Q4-05 Q4-06
CAGR (04-06): 17.9%
34.9%
CAGR (04-06): 29.1%
54%
CAGR: Compound annual growth rate
Fuente: Cuentas anuales auditadas de 2004-2006 en base a las NIIF.
25
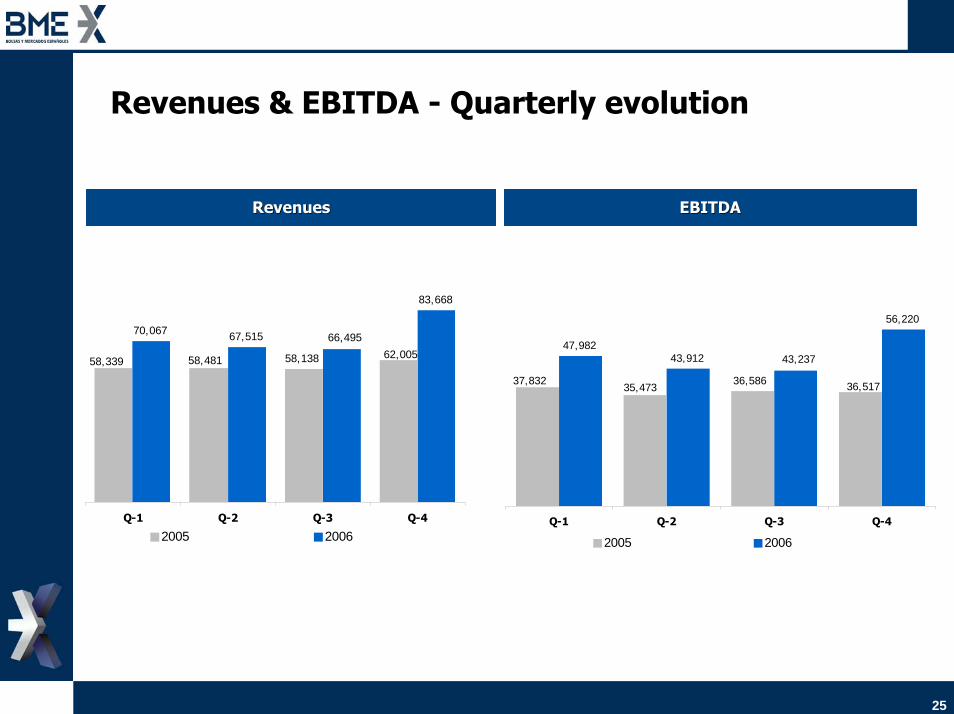
Revenues & EBITDA - Quarterly evolution
RevenuesRevenues EBITDA EBITDA
70,067 67,515
83,668
58,339 58,481 58,138 62,00566,495
Q-1 Q-2 Q-3 Q-4
2005 2006
47,98243,912
56,220
37,83235,473
36,586 36,517
43,237
Q-1 Q-2 Q-3 Q-4
2005 2006
26
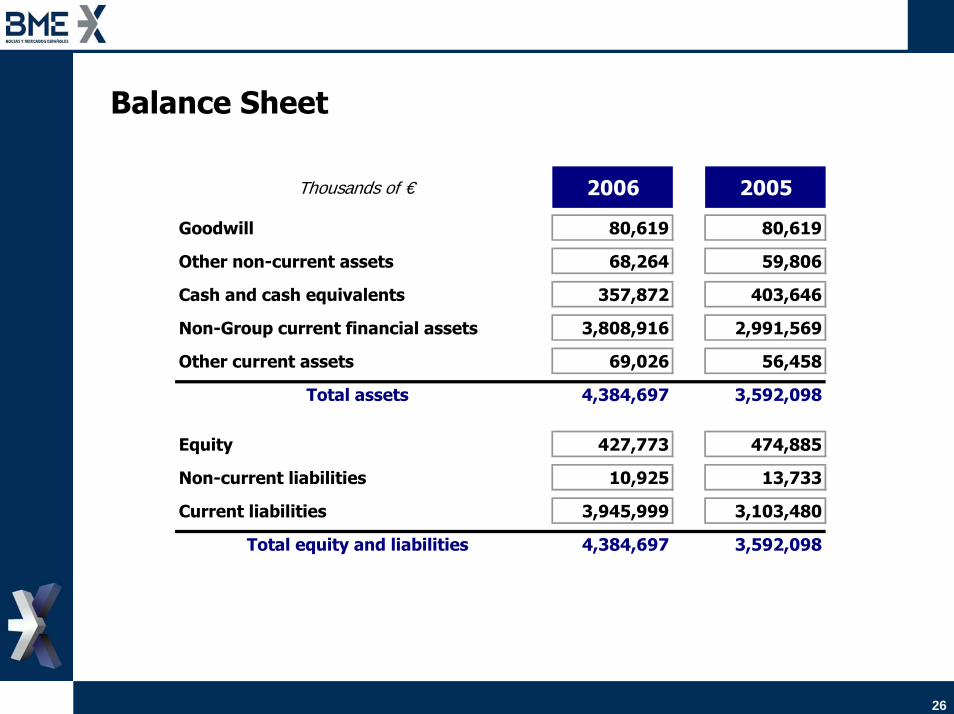
Balance Sheet
Thousands of € 2006 2005
Goodwill 80,619 80,619
Other non-current assets 68,264 59,806
Cash and cash equivalents 357,872 403,646
Non-Group current financial assets 3,808,916 2,991,569
Other current assets 69,026 56,458
Total assets 4,384,697 3,592,098
Equity 427,773 474,885
Non-current liabilities 10,925 13,733
Current liabilities 3,945,999 3,103,480
Total equity and liabilities 4,384,697 3,592,098
27
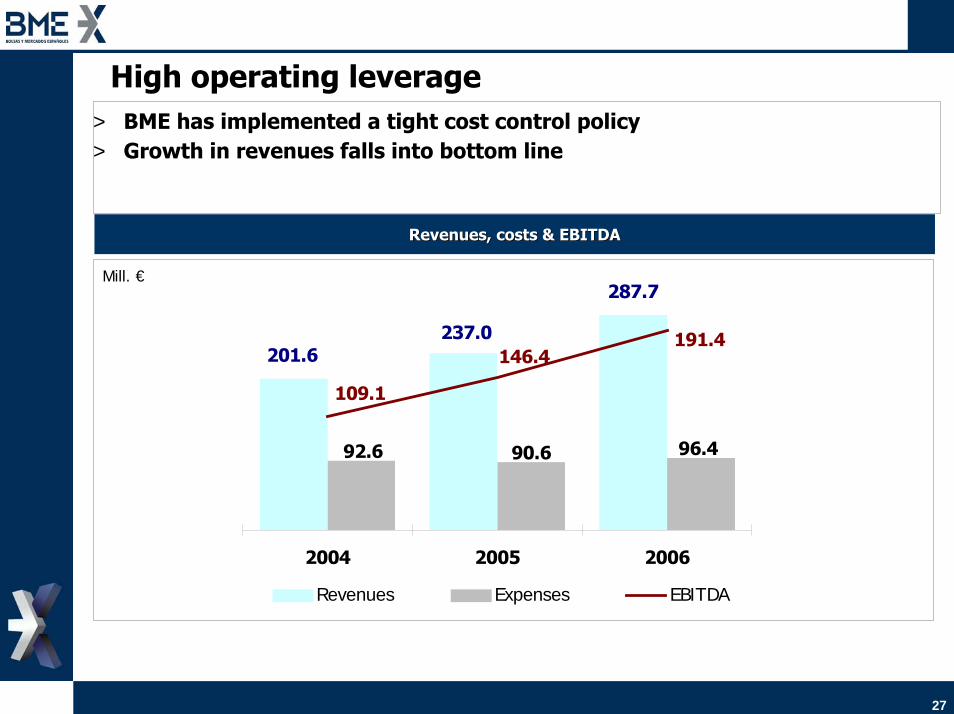
High operating leverage
201.6237.0
287.7
92.6 90.6 96.4
109.1
146.4191.4
2004 2005 2006
Revenues Expenses EBITDA
> BME has implemented a tight cost control policy > Growth in revenues falls into bottom line
Revenues, costs & EBITDARevenues, costs & EBITDA
Mill. €

28
Breakdown by Business Areas
€ Million 2006 2005 2004 CAGR 2006 2005 2004 CAGR
Equity 130.7 100.6 81.1 26.9% 96.7 66.1 46.2 44.7%
Settlement 61.8 55.1 43.7 18.9% 47.9 41.4 30.0 26.4%
Listing 25.7 24.1 23.8 3.9% 16.0 14.4 13.5 8.9%
Information 26.8 19.8 17.6 23.4% 19.5 12.5 10.3 37.6%
Derivatives 24.0 20.6 18.6 13.6% 12.9 9.4 6.8 37.7%
Consulting & IT 12.2 9.2 8.5 19.8% 4.5 2.6 1.8 58.1%
Fixed income 6.3 6.3 6.7 -3.0% 3.0 3.0 3.0 0.0%
REVENUES EBITDA
29
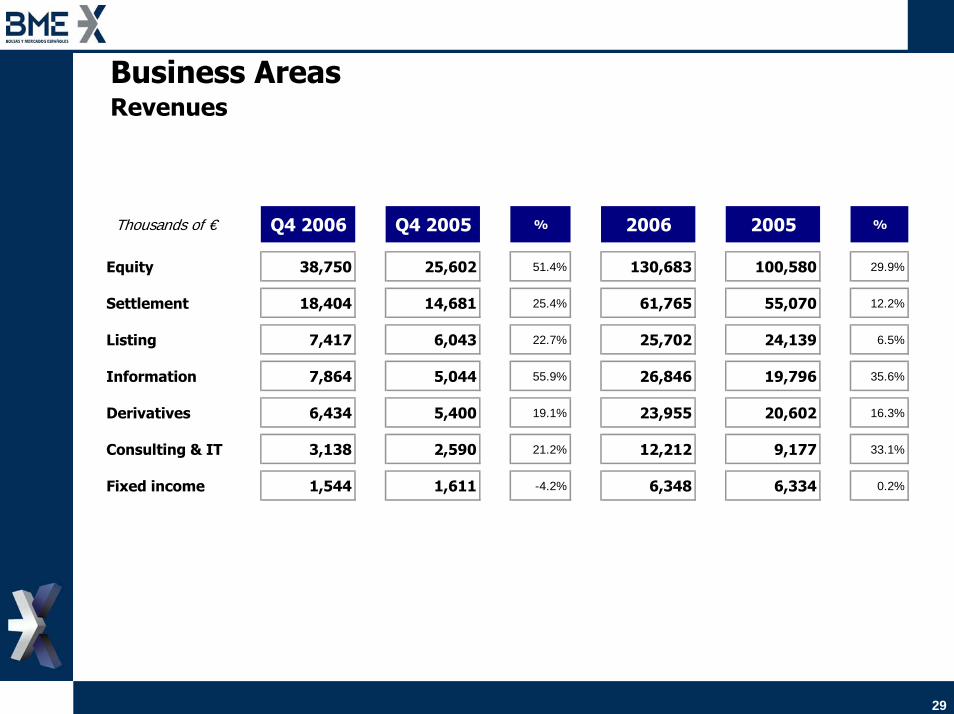
Business AreasRevenues
Thousands of € Q4 2006 Q4 2005 % 2006 2005 %
Equity 38,750 25,602 51.4% 130,683 100,580 29.9%
Settlement 18,404 14,681 25.4% 61,765 55,070 12.2%
Listing 7,417 6,043 22.7% 25,702 24,139 6.5%
Information 7,864 5,044 55.9% 26,846 19,796 35.6%
Derivatives 6,434 5,400 19.1% 23,955 20,602 16.3%
Consulting & IT 3,138 2,590 21.2% 12,212 9,177 33.1%
Fixed income 1,544 1,611 -4.2% 6,348 6,334 0.2%
30
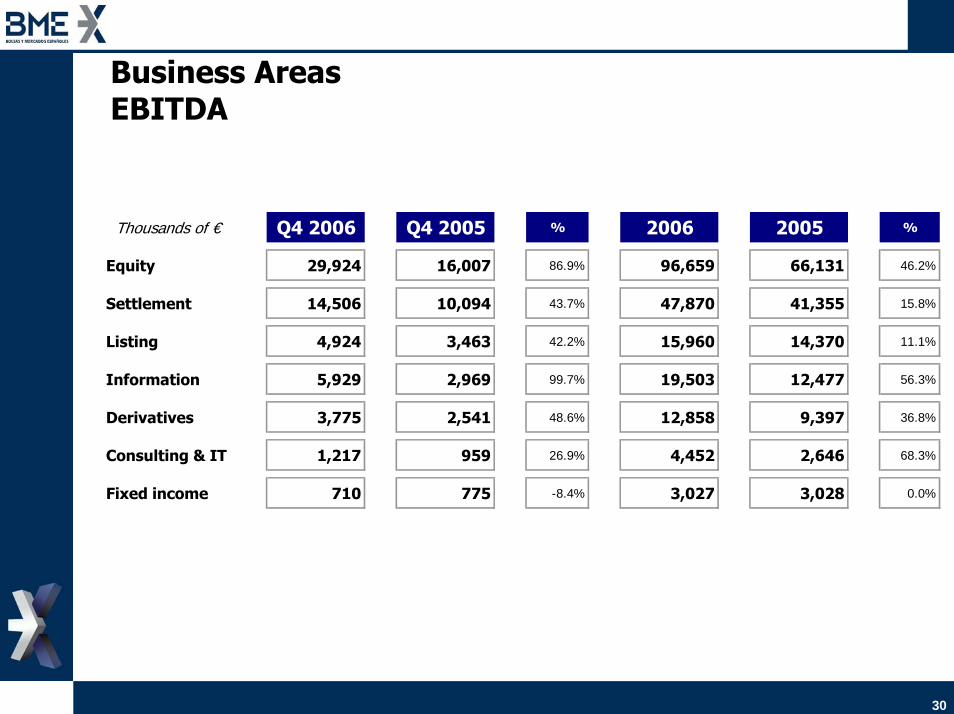
Business AreasEBITDA
Thousands of € Q4 2006 Q4 2005 % 2006 2005 %
Equity 29,924 16,007 86.9% 96,659 66,131 46.2%
Settlement 14,506 10,094 43.7% 47,870 41,355 15.8%
Listing 4,924 3,463 42.2% 15,960 14,370 11.1%
Information 5,929 2,969 99.7% 19,503 12,477 56.3%
Derivatives 3,775 2,541 48.6% 12,858 9,397 36.8%
Consulting & IT 1,217 959 26.9% 4,452 2,646 68.3%
Fixed income 710 775 -8.4% 3,027 3,028 0.0%
31
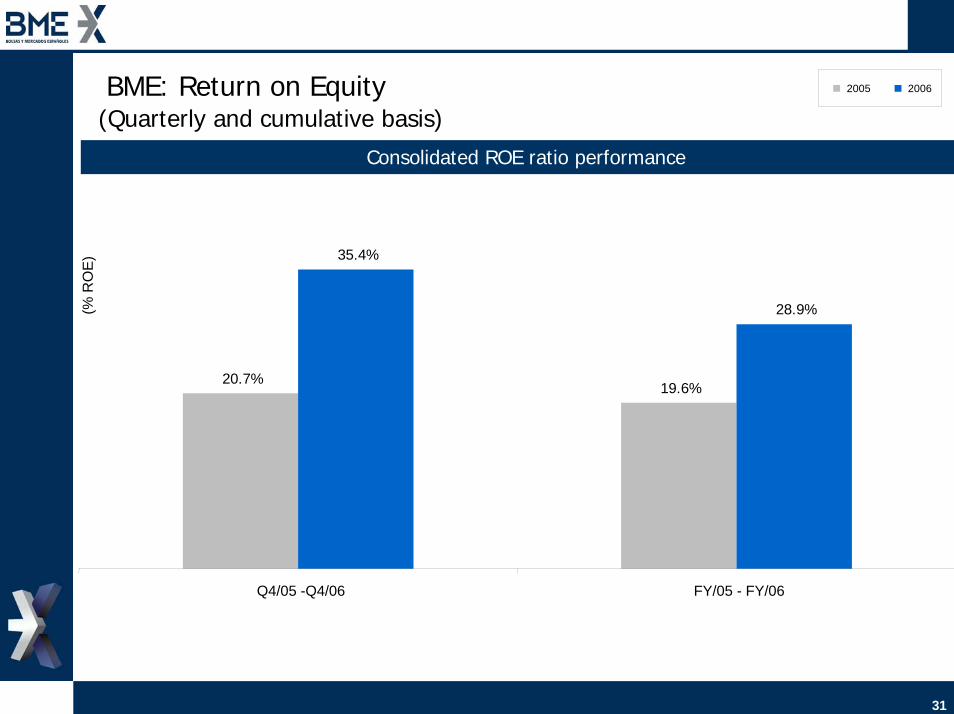
BME: Return on Equity(Quarterly and cumulative basis)
2005 2006
Consolidated ROE ratio performance
20.7%19.6%
35.4%
28.9%(% R
OE
)
Q4/05 -Q4/06 FY/05 - FY/06
32
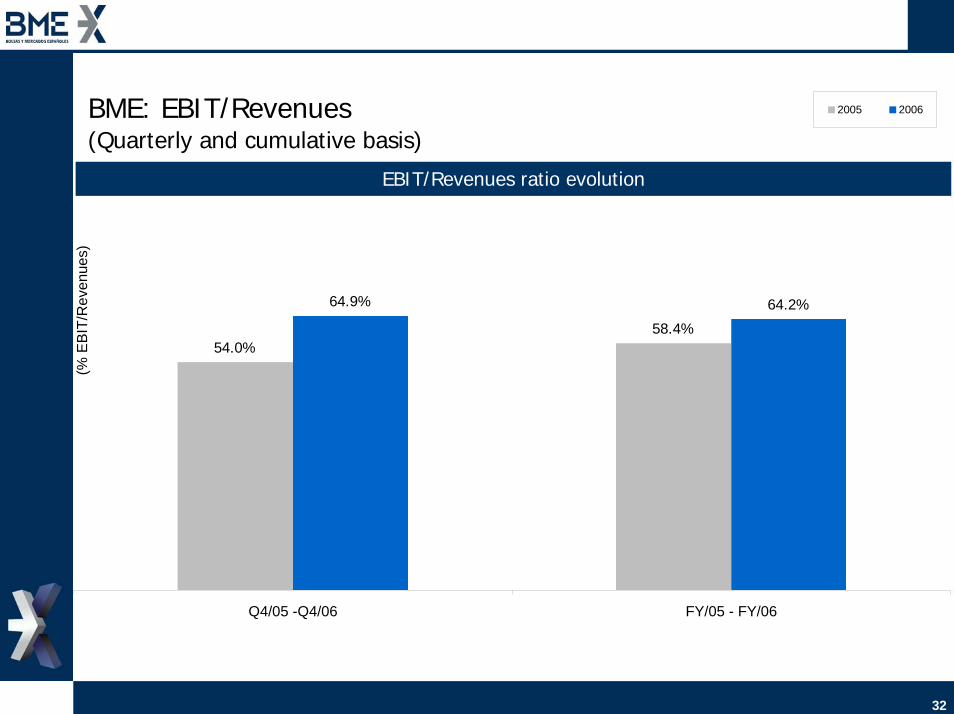
54.0%58.4%
64.9% 64.2%
Q4/05 -Q4/06 FY/05 - FY/06
(% E
BIT/
Rev
enue
s)
2005 2006
EBIT/Revenues ratio evolution
BME: EBIT/Revenues(Quarterly and cumulative basis)
33
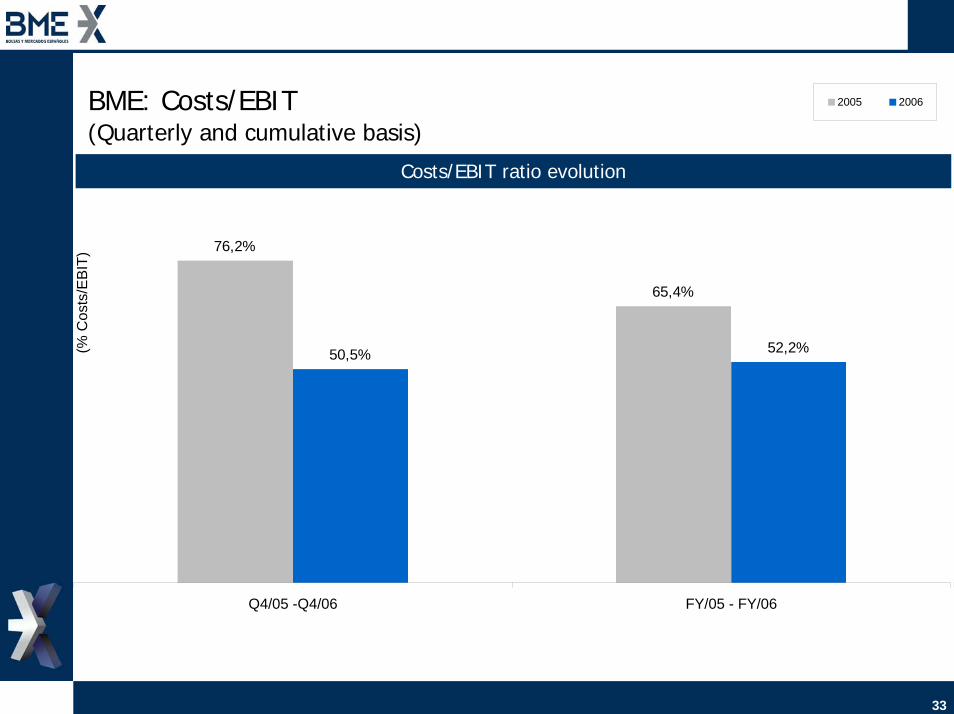
76,2%
65,4%
50,5% 52,2%
Q4/05 -Q4/06 FY/05 - FY/06
(% C
osts
/EB
IT)
2005 2006
Costs/EBIT ratio evolution
BME: Costs/EBIT(Quarterly and cumulative basis)
34
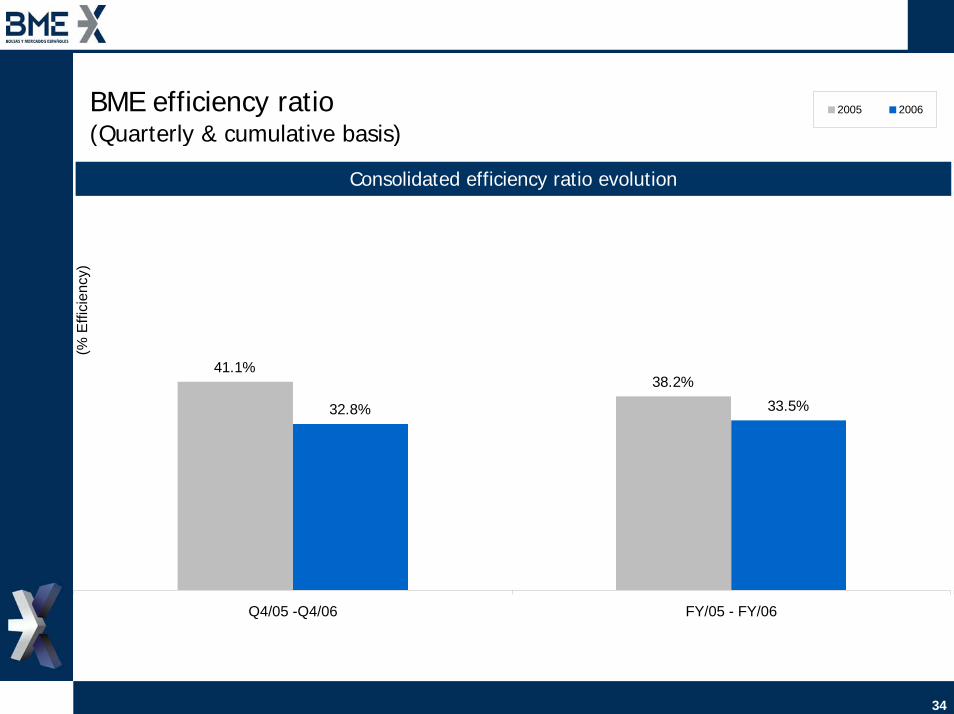
41.1%38.2%
32.8% 33.5%
Q4/05 -Q4/06 FY/05 - FY/06
(% E
ffici
ency
)
2005 2006
Consolidated efficiency ratio evolution
BME efficiency ratio (Quarterly & cumulative basis)
35
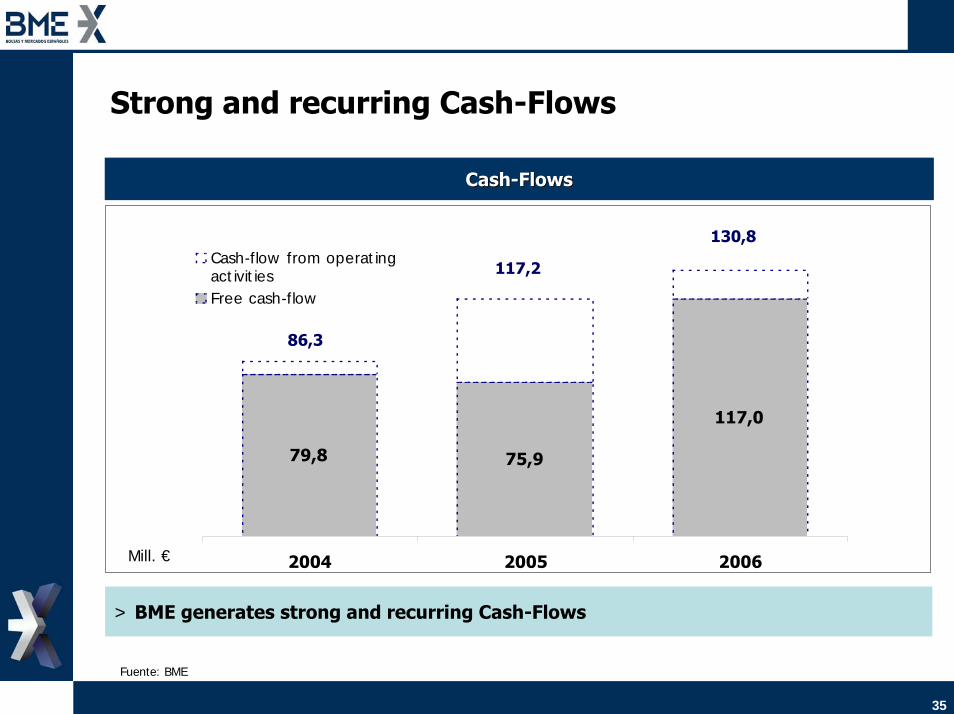
Strong and recurring Cash-Flows
79,8 75,9
117,0
2004 2005 2006
Cash-flow from operat ingact ivit iesFree cash-flow
CashCash--FlowsFlows
Mill. €
> BME generates strong and recurring Cash-Flows
86,3
117,2
130,8
Fuente: BME

36
Sources of EBITDA growth
146.4
30.56.5
1.67.0 3.5
1.8191.4
-5.9
2005 Equity C&S Listing Information Derivatives Consulting &IT
Adjust 2006
€ Mill.

37
Dividend Policy
0,2 0,3
0,60,20,3
0,6
2004 2005 2006
Complementary dividend per share
Interim dividend per share€ Mill.
Pending AGM approval
> Ordinary pay-out stood at 55% for 2003, 2004 and 2005
> 2006 Interim dividend doubled
38
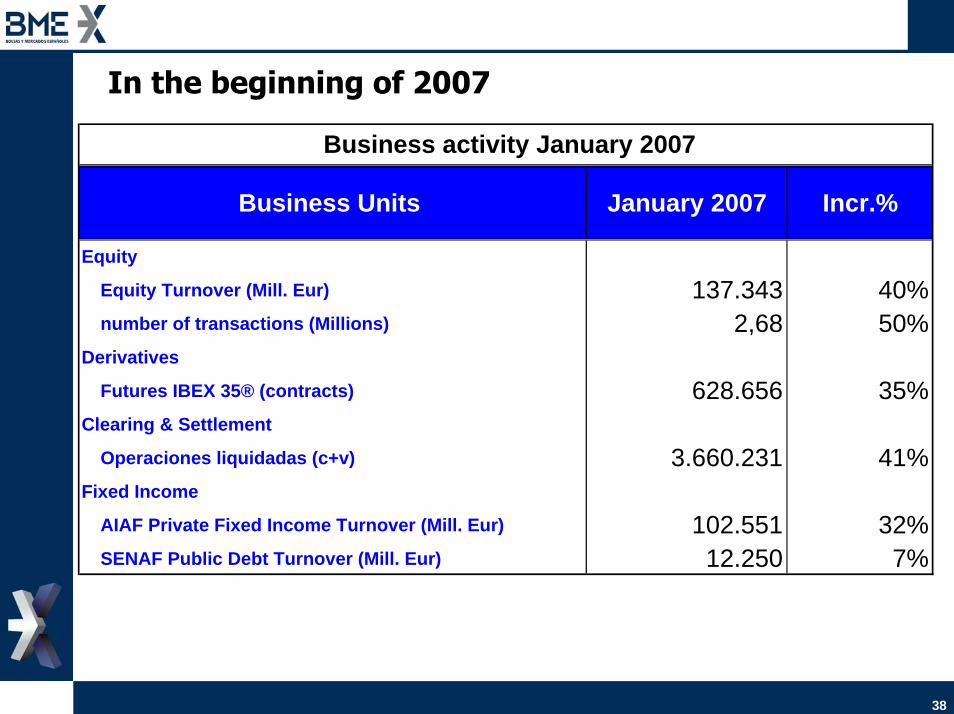
In the beginning of 2007
Business Units January 2007 Incr.%
Equity
Equity Turnover (Mill. Eur) 137.343 40%number of transactions (Millions) 2,68 50%
Derivatives
Futures IBEX 35® (contracts) 628.656 35%Clearing & Settlement
Operaciones liquidadas (c+v) 3.660.231 41%Fixed Income
AIAF Private Fixed Income Turnover (Mill. Eur) 102.551 32%SENAF Public Debt Turnover (Mill. Eur) 12.250 7%
Business activity January 2007

Q & A