bmo investments ii (ireland) plc
TRANSCRIPT
BMO INVESTMENTS II (IRELAND) PLC
(an investment company with variable capital incorporated with limited liability in Ireland with registered number 457359 and operating as an umbrella fund with segregated liability between sub-funds pursuant to the European Communities (Undertakings for Collective Investment in
Transferable Securities) Regulations 2011, as amended (“UCITS Regulations”)
Annual Report and Audited Financial Statements for the financial year ended 31 December 2015
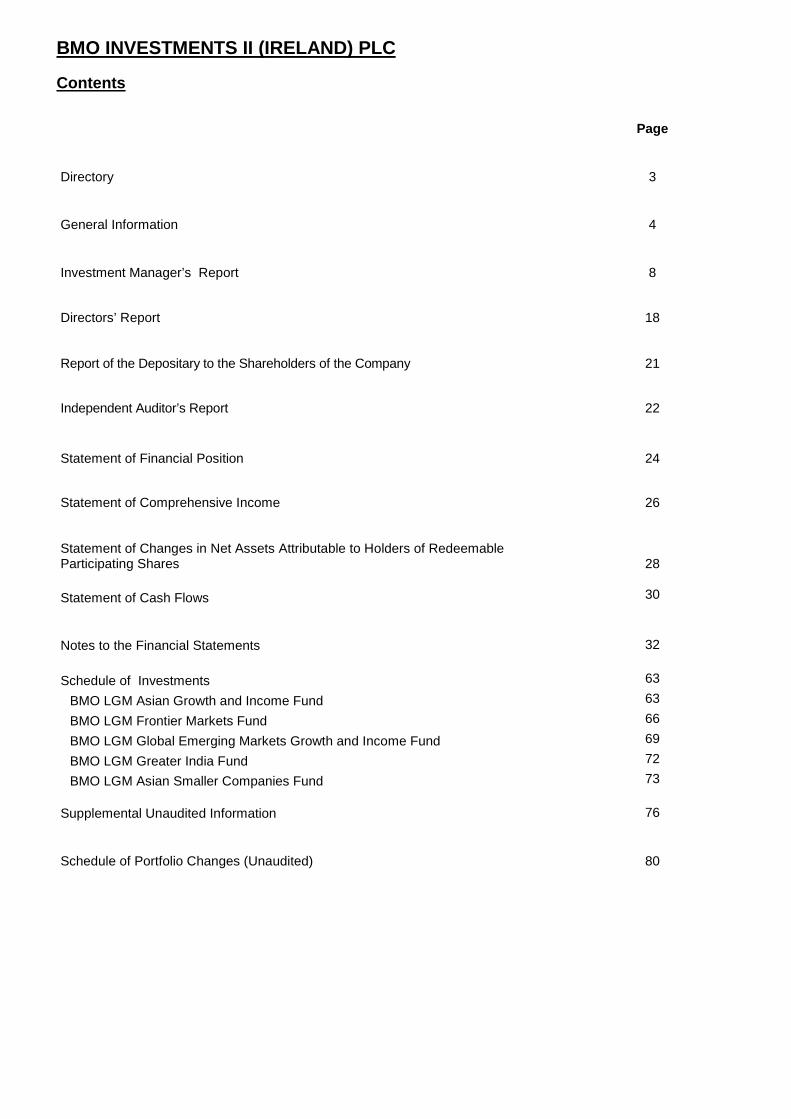
BMO INVESTMENTS II (IRELAND) PLC
Contents
Page
Directory 3
General Information 4
Investment Manager’s Report 8
Directors’ Report 18
Report of the Depositary to the Shareholders of the Company 21
Independent Auditor’s Report 22
Statement of Financial Position 24
Statement of Comprehensive Income 26
Statement of Changes in Net Assets Attributable to Holders of Redeemable Participating Shares
28 Statement of Cash Flows 30
Notes to the Financial Statements
32
Schedule of Investments 63
BMO LGM Asian Growth and Income Fund 63
BMO LGM Frontier Markets Fund 66
BMO LGM Global Emerging Markets Growth and Income Fund 69
BMO LGM Greater India Fund 72
BMO LGM Asian Smaller Companies Fund 73
Supplemental Unaudited Information
76
Schedule of Portfolio Changes (Unaudited) 80

BMO INVESTMENTS II (IRELAND) PLC
3
Directory BOARD OF DIRECTORS AUDITOR
Anthony Cousins (British)* KPMG Eimear Cowhey (Irish)ǂ 1-2 Harbourmaster Place Barry McInerney (Canadian) International Financial Services Centre Paul McNaughton (Irish)ǂ* Dublin 1
Liam Miley (Irish)ǂ** Ireland Hugh Moir (British)** Lars Nielsen (Danish)** LEGAL ADVISERS Drew Newman (British) (Chairman) Diane Seymour-Williams (British)* Arthur Cox Earlsfort Centre ǂIndependent Directors Earlsfort Terrace *Resigned 1 April 2016 Dublin 2 **Appointed 1 April 2016 Ireland REGISTERED OFFICE COMPANY SECRETARY
78 Sir John Rogerson’s Quay Bradwell Limited Dublin 2 Arthur Cox Building Ireland Earlsfort Terrace Dublin 2 Ireland INVESTMENT MANAGER & DISTRIBUTOR GOVERNANCE SERVICE PROVIDER LGM Investments Limited KB Associates 95 Wigmore Street Ground Floor London 5 Georges Dock W1U 1FD IFSC United Kingdom Dublin 1 Ireland ADMINISTRATOR REGISTRATION NUMBER State Street Fund Services (Ireland) Limited 457359 78 Sir John Rogerson’s Quay Dublin 2
Ireland DEPOSITARY State Street Custodial Services (Ireland) Limited
78 Sir John Rogerson’s Quay Dublin 2 Ireland

BMO INVESTMENTS II (IRELAND) PLC
4
General Information
The Company is an open-ended investment company with variable capital and was incorporated in Ireland on 14 May 2008 and is organised under the laws of Ireland with registration number 457359. The Company was formerly known as Lloyd George Investment Company Plc and, on 8 September 2014, the Company changed its name to BMO Investments II (Ireland) Plc. The Company has been authorised by the Central Bank of Ireland (the “Central Bank”) as an Undertaking for Collective Investment in Transferable Securities (“UCITS”) pursuant to the provisions of the European Communities (Undertakings for Collective Investment in Transferable Securities) Regulations 2011, as amended (the “UCITS Regulations”). All capitalised terms used but not defined herein shall have the meaning ascribed thereto in the Company’s Prospectus dated 9 December 2015 (the “Prospectus”).
The Company is structured as an umbrella fund consisting of different sub-funds (“Funds”) each comprising one or more classes of shares and with segregated liability between Funds in accordance of with the provisions of Part 24 of the Companies Act 2014 and as such, as a matter of Irish law, the assets of a Fund will not be exposed to the liabilities of the Company’s other Funds. Each Fund of the Company will be responsible for paying its own fees and expenses regardless of the level of its profitability. Notwithstanding the foregoing, there can be no assurance that, should an action be brought against the Company in the courts of another jurisdiction, the segregated nature of the Funds would necessarily be upheld.
The Shares issued in each Fund will rank pari passu with each other in all respects, provided that they may differ as to certain matters including currency of denomination, hedging strategies, if any, applied to the currency of a particular Class, dividend policy, voting rights, return of capital, the level of fees and expenses to be charged, or the Minimum Subscription and Minimum Holding applicable. The assets of each Fund will be invested separately on behalf of each Fund in accordance with the investment objective and policies of each Fund. A separate portfolio of assets is not maintained for each Class within a Fund.
Fund Share Classes
Name of Fund Currency Class BMO LGM Asian Growth and Income Fund
USD Class A Income Shares Class A Accumulating Shares Class B Income Shares* Class B Accumulating Shares* Class E Income Shares Class E Accumulating Shares Class S Income Shares Class S Accumulating Shares Class W Income Shares Class W Accumulating Shares
BMO LGM Frontier Markets Fund USD Class A Income Shares* Class A Accumulating Shares Class B Income Shares* Class B Accumulating Shares* Class E Income Shares Class E Accumulating Shares*
BMO LGM Global Emerging Markets Growth and Income Fund
USD
Class A Income Shares Class A Accumulating Shares Class B Income Shares* Class B Accumulating Shares* Class D Income Shares Class D Accumulating Shares Class E Income Shares Class E Accumulating Shares* Class F Income Shares Class F Accumulating Shares Class S Income Shares Class S Accumulating Shares Class W Income Shares Class W Accumulating Shares
*These Classes of Shares are active as at 31 December 2015.

BMO INVESTMENTS II (IRELAND) PLC
5
General Information cont/d
Fund Share Classes cont/d Name of Fund Currency Class BMO LGM Greater India Fund USD Class A Income Shares
Class A Accumulating Shares Class B Income Shares* Class B Accumulating Shares Class E Income Shares Class E Accumulating Shares*
BMO LGM Asian Smaller Companies Fund
USD Class A Income Shares Class A Accumulating Shares Class B Income Shares Class B Accumulating Shares* Class E Income Shares Class E Accumulating Shares
* These Classes of Shares are active as at 31 December 2015. There are currently five active Funds in operation as at 31 December 2015, BMO LGM Asian Growth and Income Fund, BMO LGM Frontier Markets Fund, BMO LGM Global Emerging Markets Growth and Income Fund, BMO LGM Greater India Fund and BMO LGM Asian Smaller Companies Fund. Investment Objectives and Policies The following is a summary of the investment objectives and policies of the active Funds. It does not purport to be a complete account of the investment objectives and policies and you should refer to the Prospectus in case of any uncertainty. Investment Objective and Policies of the BMO LGM As ian Growth and Income Fund The Fund aims to achieve long-term capital growth through investment in an actively managed portfolio, primarily invested in equity and equity-related securities of companies in the Asian region with the potential for capital appreciation and a growing stream of dividends. The Fund will invest primarily in equity and equity-related securities of companies in the Asian region which are listed or traded on a Recognised Exchange and which have, in the opinion of the Investment Manager, the potential for growth appreciation and a growing steam of dividends. The Fund may also invest in companies that have, in the opinion of the Investment Manager, substantial economic activities in the Asian region. The Asian region may include, but is not limited to, Hong Kong, Singapore, Malaysia, Thailand, Taiwan, China, Indonesia, South Korea and the Philippines. Investment may be made in developed and emerging markets and Frontier Markets in the Asian region and exposure to countries that do not form part of the MSCI AC Asia ex Japan Index (Net Dividends Reinvested), such as Japan and Vietnam, is permitted up to a maximum of 20% of the Fund’s Net Asset Value. In addition to the above, in constructing the portfolio, the Investment Manager will focus on the selection of securities of quality companies and consider factors including but not limited to sustainable business models, robust balance sheets, proven management teams with disciplined capital management, clear and fair alignment between majority and minority shareholders, share valuations, market capitalisation, liquidity and dividend yield.
Investment Objective and Policies of the BMO LGM Fr ontier Markets Fund
The Fund aims for long-term capital growth through investment in an actively managed portfolio, primarily invested in equity and equity-related securities of companies in Frontier Markets worldwide. In exceptional circumstances, the Fund may invest in debt securities.
The Fund will invest primarily in equities and equity-related securities of companies which are listed or traded on a Recognised Exchange in countries of Frontier Markets and companies which have, in the opinion of the Investment Manager, substantial economic activities in Frontier Markets, but whose stock listing may only be on a Recognised Exchange outside Frontier Markets region.
BMO INVESTMENTS II (IRELAND) PLC
6
General Information cont/d
Investment Objective and Policies of the BMO LGM Fr ontier Markets Fund cont/d In constructing the portfolio, the Investment Manager will focus on the selection of securities of quality companies and consider factors, including, but not limited to, sustainable business models, robust balance sheets, proven management teams with disciplined and fair alignment between majority and minority shareholders, share valuations, market capitalisation, liquidity and dividend yield. Investment Objective and Policies of the BMO LGM Gl obal Emerging Markets Growth and Income Fund
The Fund aims for long-term capital growth through investment in an actively managed portfolio, primarily invested in equity and equity-related securities of companies in emerging markets worldwide with the potential for capital appreciation and a growing steam of dividends. The Fund will invest primarily in equity and equity related securities of companies which are listed or traded on a Recognised Exchange in emerging market countries worldwide, including Russia, which have, in the opinion of the Investment Manager, the potential for both capital appreciation and a growing steam of dividends.
Investment Objective and Policies of the BMO LGM Gr eater India Fund
The Fund aims to achieve long-term capital growth through investment in an actively managed portfolio, primarily invested in equity and equity-related securities of companies in India and may include investment in other countries in the Indian sub-continent such as Sri Lanka and Bangladesh.
The Fund will invest primarily in equity securities and equity-related securities of companies in India or other countries in the Indian sub-continent that are listed or traded on a Recognised Exchange. The Fund may also invest in companies that, in the opinion of the Investment Manager, have substantial economic activities in India or other countries in the Indian sub-continent, but that are listed or traded on a Recognised Exchange outside of India or other countries in the Indian sub-continent.
Investment Objective and Policies of the BMO LGM As ian Smaller Companies Fund
The Fund aims to achieve long-term capital growth through investment in an actively managed portfolio, primarily invested in equity and equity-related securities of smaller companies in the Asian region.
The Fund will invest primarily in equity and equity-related securities smaller companies in the Asian region which are listed or traded on a Recognised Exchange. In this context, smaller companies generally mean companies which are, at the time of investment, of a market capitalisation within a small company sector benchmark market capitalisation range. Investments in companies which subsequently outgrow the small company sector benchmark will not be sold unless, in the opinion of the Investment Manager, this is in the best interests of Shareholders.
Redemption of Shares
The redemption price per Share shall be the Net Asset Value per Share. A redemption fee of up to 3% of the Net Asset Value per Share being redeemed may be charged in respect of Class E Income Shares and Class E Accumulating Shares of BMO LGM Frontier Markets Fund. Other than as set forth below or in the section of The Prospectus titled “Redemption of Shares” it is not the intention to charge a redemption fee in respect of any other Class of any Fund.
The Directors are empowered to charge a redemption fee of up 3% of the Net Asset Value per Share of any Class of any Fund and may exercise their discretion to charge the redemption fee if they have reason to believe that any Shareholder requesting redemption is attempting any form of arbitrage on the yield of Shares in the Fund. In addition, in respect of BMO LGM Frontier Markets Fund only, if a Shareholder requests redemption within six months of the initial investment, then the Directors may exercise their discretion to charge a redemption fee. The Directors will give not less than one month’s notice to Shareholders of their intention to introduce a redemption fee generally. In the event of a redemption fee being charged, Shareholders should view their investment as medium to long term. A redeeming Shareholder of Shares may also receive additional redemption proceeds if any Equalisation Credit paid at the time of subscription has not been fully applied.

BMO INVESTMENTS II (IRELAND) PLC
7
General Information cont/d
Dividends and Distributions
The Directors are empowered to declare and pay dividends on Shares issued in any Class or Fund in the Company.
Income Share Classes: Dividends will be declared and paid on these Shares. Dividends will normally be declared in respect of the financial year end (i.e., 31 December in each year) and paid to Shareholders as of 31 December within four months of the financial year end and will usually be paid to the Shareholder’s bank account as detailed on the Application Form. Dividends which are not claimed or collected within six years of payment shall revert to and form part of the assets of the relevant class. The Directors will declare dividends in respect of any Shares in the Company out of the net income (i.e., income less expenses) of the Company (whether in the form of dividends, interest or otherwise), subject to certain adjustments.
Accumulating Share Classes: Dividends will be declared on these Shares but automatically reinvested and will be reflected in the Net Asset Value of the Share class. Dividends will normally be declared in respect of the financial year end (i.e., 31 December in each year). The Directors will declare dividends in respect of any Shares in the Company out of the net income (i.e., income less expenses) of the Company (whether in the form of dividends, interest or otherwise), subject to certain adjustments.
With effect from 1 October 2013, all Classes of Shares will be permitted to operate equalisation. Where the Classes of Shares operate equalisation, distributions made by such Classes of Shares will include an amount of income equalisation. This amount corresponds to the equalisation income included in the Net Asset Value per Share of such Classes.
All investors, including UK investors, should seek their own tax advice in relation to the implications (if any) of these distribution policies. Any change to the dividend policy will be provided in an updated Prospectus and all Shareholders will be notified in advance.
Reporting to investors – UK Reporting Fund Regime
It is the intention of each Fund to continue to meet its annual obligations to be a “reporting fund”, as defined in the Offshore Funds (Tax) Regulations 2009 (SI 2009 No. 3001). The Fund will report income to investors via the company’s website at www.bmo.com/lgminvestments and this is expected to be made available to investors by 30 June in each year.
Net Asset Value and Valuation of Assets
The Net Asset Value of each Fund or, if there are different classes within a Fund, each class, will be calculated by the Administrator as at the Valuation Point on or with respect to each Dealing Day in accordance with the Articles of Association. The Net Asset Value of a Fund shall be determined as at the Valuation Point for the relevant Dealing Day by valuing the assets of the relevant Fund (including income accrued but not collected) and deducting the liabilities of the relevant Fund (including a provision for duties and charges, accrued expenses and fees and other liabilities). The Net Asset Value attributable to a class shall be determined as at the Valuation Point for the relevant Dealing Day by calculating that portion of the Net Asset Value of the relevant Fund attributable to the relevant class as at the Valuation Point, subject to adjustment to take account of assets and/or liabilities attributable to the class.
The Net Asset Value of a Fund will be expressed in the Base Currency of the Fund, or in such other currency as the Directors may determine either generally or in relation to a particular class or in a specific case.
The Net Asset Value per share shall be calculated as at the Valuation Point on or with respect to each Dealing Day by dividing the Net Asset Value of the relevant Fund or attributable to a class by the total number of shares in issue in the Fund or class at the relevant Valuation Point and rounding the resulting total to four decimal places.
For further information regarding the method and principles by which the Net Asset Value is determined and the circumstances under which the Directors may temporarily suspend the determination of the Net Asset Value, please refer to the Prospectus.

BMO INVESTMENTS II (IRELAND) PLC
8
Investment Manager’s Report
BMO LGM Asian Growth and Income Fund
2015 was a challenging year for Asian equities. The MSCI Asia ex-Japan benchmark fell 9.2% in US dollar terms. The Fund closed the year down 10.8%, which was clearly disappointing. 2015 was dominated by macroeconomic events, with the collapsing oil price, a stronger U.S. Dollar, worries about rising U.S. interest rates and mounting concerns over both the health of the Chinese economy and the erratic nature of Chinese policy-making all creating a deeply unfavourable backdrop for Asian equity markets. Many of these problems are cyclical, but others are more structural in nature. Amongst the latter we would include: the issue of chronic deflation in China caused by manufacturing overcapacity and capital misallocation; debt problems in China and other parts of Asia; weak export demand; and the maturing of the tech super-cycle that had been the main growth driver for Korea and Taiwan over the last 4-5 years. We continue to believe that the key to investing in Asian markets is to ignore most of the set menu provided by the index. We take a bottom-up view, focusing on quality companies with defensive characteristics such as high returns and strong cash flows. This approach tends to produce a bias towards dominant companies that operate in the less developed markets of the Asian region. The long-term demand outlook in these countries is supported by low penetration rates for many goods and services, whilst generally poor infrastructure creates significant barriers for new entrants. This tends to promote a relatively benign competitive environment, allowing many of the dominant companies (which have distribution or scale advantages) to generate high margins, high returns and strong free cash flows. We typically find more of these companies in markets such as India, Indonesia and the Philippines, which explains why 54% of the portfolio is currently invested in these and similar emerging or frontier Asian markets (up from 43% at the start of the 2015). By contrast, we can identify fewer of these quality companies in markets like China, Hong Kong, Korea or Taiwan. These markets are more developed, which means the competitive environment tends to be tougher and the ability to generate supernormal profits and returns tends to be significantly lower. In China, these difficulties are compounded by state intervention, opaque company structures, stretched balance sheets and an almost total lack of transparency in the strategic decision making process. The portfolio currently has just 10% of its NAV invested in Chinese companies, which is down from 16% at the start of 2015. The main detractor from performance in 2015 was Advance Info Services (AIS), which is the leading mobile telecoms provider in Thailand. The entire sector was shaken by the arrival of a new competitor in the latter part of the year when the auction for new mobile spectrum was won by the least favoured outsider. We commend AIS for its admirable capital discipline in not chasing new capacity at any price, but the competitive landscape has clearly deteriorated, meaning that costs and capex will rise and returns will fall. AIS pays a 9% dividend yield and this should sustain investor interest for now. The second key detractor from performance was the Macau casino operator, SJM Holdings, which has struggled alongside the rest of the Macau gaming sector in the face of China’s pervasive anti-corruption campaign. This campaign has effectively removed the “high-roller” segment from the gaming market. Paradoxically, this is actually good news longer term, because the high-rollers generate a lower margin for casino operators when compared to the mass market segment. Whether SJM is best placed to benefit from this trend is another question, of course, and we are reviewing the Fund’s investment in this name. At the other end of the spectrum the Fund’s best performers in 2015 included Sino Biopharm and Tencent in China, and Bank Rakyat and Sampoerna in Indonesia (see below). 2015 was a busy year for the portfolio, with the addition of nine new companies and the disposal of eleven. The total number of holdings consequently dropped to 43 by year end. Despite these changes, portfolio turnover for the year was just 25%, which we believe is still consistent with the Fund’s long-term investment philosophy. As indicated above, the net effect of these changes was to increase the Fund’s exposure to India and Indonesia, whilst reducing the exposure to China, Hong Kong and Korea.

BMO INVESTMENTS II (IRELAND) PLC
9
Investment Manager’s Report cont/d
BMO LGM Asian Growth and Income Fund cont/d
Rakyat and Sampoerna were two of the Fund’s new acquisitions in 2015 and, as indicated above, both were among the portfolio’s top five contributors during the year. Founded in 1985, Bank Rakyat (BRI) is Indonesia’s oldest financial institution and second biggest bank. BRI pioneered the concept of micro-lending in Indonesia, targeting the under-banked, rural and semi-urban communities. Micro loans, retail loans and small commercial loans together account for more than 70% of the book. BRI thus operates what is probably the world’s largest micro-banking operation. Micro-lending is not for the faint hearted. It requires the right network, the right people and, above all, a “boots-on-the-ground” knowledge of borrowers, their businesses and their ability to repay. BRI’s expertise, network and high level of consumer trust were built over decades and cannot be copied easily. We therefore expect BRI to continue compounding excellent returns for shareholders. Founded in 1913, Sampoerna started as a producer of unfiltered, hand-rolled kretek cigarettes. Kretek is a mixture of cloves and tobacco, which is highly popular in Indonesia and dominates the domestic cigarette market to this day. Sampoerna is the largest cigarette manufacturer in Indonesia, with five of the top ten brands and 35% market share. Since Philip Morris International (PMI) acquired a majority stake in 2005, Sampoerna has increased its market share by 1% per annum, doubled volumes, improved profitability, reduced working capital needs and boosted free cash flow generation. The Indonesian cigarette industry is the biggest single contributor to government tax revenues, which helps ensure a relatively benign regulatory environment. The company is in a net cash position, annual capex needs are modest, and the return on invested capital exceeds 50%.
Markets began 2016 in sombre mood, hit by Middle East tensions and yet more worries over the Chinese economy. Most attention is currently focused on the gradual, but seemingly entrenched depreciation of the Chinese Yuan, as well as the rapid fall in the price of oil. It would appear that most markets are interpreting the weak oil price as a negative macro-economic indicator. We generally try to avoid getting involved in these “top down” issues but, since most of Asia relies heavily on oil imports for the bulk of its energy needs, the weaker oil price can only mean significant windfall gains for consumers, lower input costs for manufacturers and an improving current account position for many of Asia’s economies. The weak oil price is a good thing for Asia and we shall see increasing evidence of this as companies across the region begin reporting their fourth quarter earnings. For the year as a whole, we believe that most of our companies will successfully grow their cash flows at a high single digit or even low double digit level. But at what point the market gets round to recognising these encouraging bottom-up fundamentals is frankly anyone’s guess. References to benchmark (MSCI Asia Pacific ex Japan Index) are for illustrative purposes only. There is no guarantee that the Fund will outperform its benchmark. LGM Investments Limited February 2016
BMO INVESTMENTS II (IRELAND) PLC
10
Investment Manager’s Report cont/d
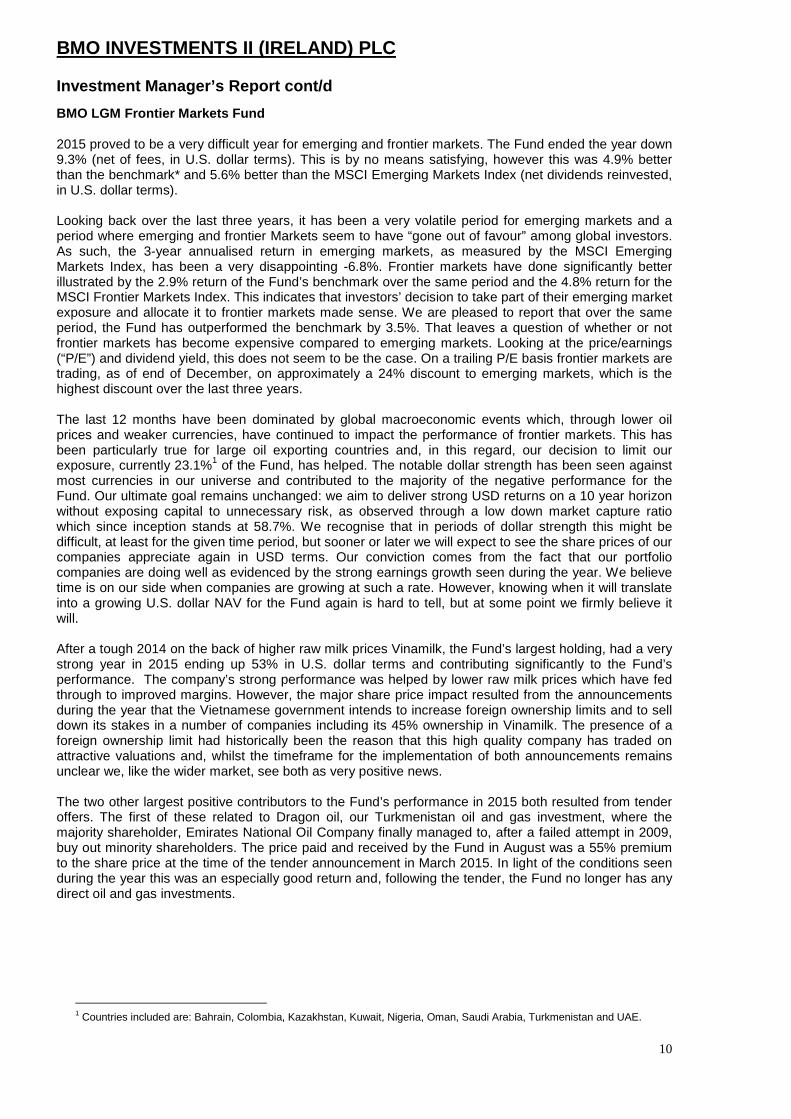
BMO LGM Frontier Markets Fund 2015 proved to be a very difficult year for emerging and frontier markets. The Fund ended the year down 9.3% (net of fees, in U.S. dollar terms). This is by no means satisfying, however this was 4.9% better than the benchmark* and 5.6% better than the MSCI Emerging Markets Index (net dividends reinvested, in U.S. dollar terms). Looking back over the last three years, it has been a very volatile period for emerging markets and a period where emerging and frontier Markets seem to have “gone out of favour” among global investors. As such, the 3-year annualised return in emerging markets, as measured by the MSCI Emerging Markets Index, has been a very disappointing -6.8%. Frontier markets have done significantly better illustrated by the 2.9% return of the Fund’s benchmark over the same period and the 4.8% return for the MSCI Frontier Markets Index. This indicates that investors’ decision to take part of their emerging market exposure and allocate it to frontier markets made sense. We are pleased to report that over the same period, the Fund has outperformed the benchmark by 3.5%. That leaves a question of whether or not frontier markets has become expensive compared to emerging markets. Looking at the price/earnings (“P/E”) and dividend yield, this does not seem to be the case. On a trailing P/E basis frontier markets are trading, as of end of December, on approximately a 24% discount to emerging markets, which is the highest discount over the last three years. The last 12 months have been dominated by global macroeconomic events which, through lower oil prices and weaker currencies, have continued to impact the performance of frontier markets. This has been particularly true for large oil exporting countries and, in this regard, our decision to limit our exposure, currently 23.1%1 of the Fund, has helped. The notable dollar strength has been seen against most currencies in our universe and contributed to the majority of the negative performance for the Fund. Our ultimate goal remains unchanged: we aim to deliver strong USD returns on a 10 year horizon without exposing capital to unnecessary risk, as observed through a low down market capture ratio which since inception stands at 58.7%. We recognise that in periods of dollar strength this might be difficult, at least for the given time period, but sooner or later we will expect to see the share prices of our companies appreciate again in USD terms. Our conviction comes from the fact that our portfolio companies are doing well as evidenced by the strong earnings growth seen during the year. We believe time is on our side when companies are growing at such a rate. However, knowing when it will translate into a growing U.S. dollar NAV for the Fund again is hard to tell, but at some point we firmly believe it will. After a tough 2014 on the back of higher raw milk prices Vinamilk, the Fund’s largest holding, had a very strong year in 2015 ending up 53% in U.S. dollar terms and contributing significantly to the Fund’s performance. The company’s strong performance was helped by lower raw milk prices which have fed through to improved margins. However, the major share price impact resulted from the announcements during the year that the Vietnamese government intends to increase foreign ownership limits and to sell down its stakes in a number of companies including its 45% ownership in Vinamilk. The presence of a foreign ownership limit had historically been the reason that this high quality company has traded on attractive valuations and, whilst the timeframe for the implementation of both announcements remains unclear we, like the wider market, see both as very positive news. The two other largest positive contributors to the Fund’s performance in 2015 both resulted from tender offers. The first of these related to Dragon oil, our Turkmenistan oil and gas investment, where the majority shareholder, Emirates National Oil Company finally managed to, after a failed attempt in 2009, buy out minority shareholders. The price paid and received by the Fund in August was a 55% premium to the share price at the time of the tender announcement in March 2015. In light of the conditions seen during the year this was an especially good return and, following the tender, the Fund no longer has any direct oil and gas investments.
1 Countries included are: Bahrain, Colombia, Kazakhstan, Kuwait, Nigeria, Oman, Saudi Arabia, Turkmenistan and UAE.
BMO INVESTMENTS II (IRELAND) PLC
11
Investment Manager’s Report cont/d
BMO LGM Frontier Markets Fund cont/d
The other Fund investment involved in a tender offer was Desnoes and Geddes, our Jamaican beer company. The last quarter of the year saw a number of mergers and acquisitions (“M&A”) transactions announced globally within the brewing industry but the most important for us was the deal between, Heineken and Diageo, which saw the latter continue to clean up its global operations with a transfer of ownership between the two in a number of countries of operations. The change that mattered for us was the agreement by Heineken to purchase Diageo’s 57.9% ownership in Desnoes and Geddes, the leading beer company in Jamaica, and in which we had been building our shareholding during the course of the year. The takeover price was at a 340% premium to the share price at the time and, following the announcement of an intention to initiate a tender offer at such a valuation, markets quickly reflected this. It was somewhat disappointing we were not able to build a bigger stake in Desnoes and Geddes before this happened but it does illustrate the difference we believe we can make. The largest negative contributors to the Fund’s performance this year were Guaranty Trust Bank, our Nigerian Bank, and Grupo Exito, our Colombian retailer. Given they are both located in oil exporting countries, the decline in commodities was a large driver of their performance. In Nigeria, the decline in oil prices naturally raises concern over both the economic outlook and the asset quality of the banking system. However. Guaranty Trust Bank has proven itself in the past to be significantly better at managing credit risk than the majority of its peers and its superior profitability provides it with more room to absorb any higher provisioning expenses needed. While the successful transition of political power during the year was very positive. Nigeria’s decision to put off a devaluation of its currency was not as they are simply delaying the inevitable. Colombia, on the other hand, let its currency reflect the reality of a lower oil price environment and the 34% depreciation of the currency strongly impacted the U.S. dollar performance of our two Colombian holdings. Exito’s performance was also significantly impacted during the year by their decision to acquire stakes in the Brazilian and Argentinian operations of its parent group, Casino, a decision widely opposed by minority shareholders including ourselves. 2015 was a more active year for the Fund in terms of new investment decisions with 8 new companies added to the Fund. However despite these new investments and 7 companies leaving the Fund the turnover remains low, reflecting our process of investing long-term in high quality companies. As of December 2015, the turnover** stands at 20.5%. Alongside Desnoes and Geddes, the other new investments included 3 further consumer companies: Alicorp in Peru, EDITDA in Egypt and Ceylon Tobacco in Sri Lanka. The Fund also made new investments in 3 banks: BBVA in Argentina, Commercial bank of Ceylon in Sri Lanka, UBL in Pakistan and one Healthcare company, Georgia Healthcare group. *The benchmark is a composite index comprising 50% MSCI Frontier Markets Index and 50% MSCI Frontier Markets ex GCC Index. **Measured as the lesser of purchases or sales divided by the average Fund size during the year. References to benchmark are for illustrative purposes only. There is no guarantee that the Fund will outperform its benchmark. All index data referred to in this report is copyright and propriety to MSCI. LGM Investments Limited February 2016

BMO INVESTMENTS II (IRELAND) PLC
12
Investment Manager’s Report cont/d
BMO LGM Global Emerging Markets Growth and Income F und 2015 proved to be a difficult year for emerging markets with the MSCI Emerging Markets Index (USD terms, net of dividends reinvested) losing about 14.9%. The Fund ended the year down 11.6% (net of fees in U.S. dollar terms). While this is better than the benchmark, this is by no means satisfying. 2015 was dominated by macroeconomic events with lower oil prices and a stronger U.S. Dollar, which continued to have a negative impact on the performance of emerging markets. The emerging markets asset class is clearly facing a number of issues from a headline perspective, such as: a slowing China; policy paralysis in major markets such as Brazil, South Africa and Turkey; as well as the maturing of the tech super cycle which has been driving earnings in particular in South Korea and Taiwan for the last 4-5 years. We continue to believe that the key to investing in emerging markets is to sidestep the default exposure embedded in the Index. Given our bottom-up focus on quality companies with defensive characteristics such as high returns and recurring cash flows, we tend to favour dominant companies in less developed countries. Not only are penetration rates low for many goods and services, providing a favourable long-term secular demand outlook, but also challenging infrastructure in many of these countries raises entry barriers substantially which often facilitates a benign competitive environment that allows many of the dominant companies (with a distribution or scale advantage) to generate high margins and high returns and, as a result, strong free cash flow. Typically, these kinds of companies are found in the less developed parts of emerging markets such as India, Indonesia, Philippines, Vietnam, Kenya, Egypt and Peru which explains why we have the majority of the portfolio invested in these markets. In 2015 the Fund’s main performance contributors included Vietnam Dairy Products (Vinamilk) and PT Hanjaya Mandala Sampoerna Tbk (Sampoerna). Vinamilk, the leading dairy producer in Vietnam, continued to enjoy increasing profitability and cash flow generation following a rebound in consumer spending and favorable raw material price environment. The Company’s performance was further supported by the Vietnamese government’s decision to open up the country to foreign investments through increasing Foreign Ownership limits as well as gradually divesting its 45% stake in Vinamilk. Sampoerna, the leading Indonesian tobacco company, benefited from strong operational results in a difficult consumer environment, clarity regarding excise taxes for 2016 as well as inclusion into JCI Index and MSCI Index following its capital raising. Among the detractors to both absolute and relative performance in 2015 were SJM holdings, our casino operator in Macau, and Bank Mandiri. We met Mandiri back in August when the overall sentiment was quite grim as a result of slowing growth and continued Rupiah depreciation prompting questions on future loan growth and asset quality deterioration. We exploited the weakness in the share price to increase our position as it can pay off to be greedy when others are fearful. Mandiri is a quality bank in the attractive Indonesian banking sector which is one of the most profitable globally with return on assets (ROA) for leading banks well above 2%. This is a result of a benign competitive environment and a fundamentally sound system that is well capitalised as regulators are still heavily influenced by the Asian crisis back in 1998 and therefore focus on stability and profitability. The next couple of quarters will most likely continue to be difficult due to lower asset quality but as long-term investors we continue to view Mandiri as one of the best positioned financial institutions in Indonesia, well placed to take advantage of the significant opportunities that we expect will arise over the next decade. During 2015, six new companies were added to the Fund while seven companies were sold. Despite this portfolio turnover was approximately 18%, reflecting the Fund’s investment philosophy of investing long-term in high quality companies. Alongside our Indonesian tobacco company Sampoerna we invested in two other consumer companies: the Egyptian snack producer, Edita, and the pan-Asian retailer Dairy Farm. The Fund also made investments in two financial companies: the Indian Mahindra & Mahindra Financial Services and the Indonesian Bank Rakyat. Lastly, we made an investment in a materials company, the Indian market leader in consumer and specialty industrial chemicals, Pidilite.

BMO INVESTMENTS II (IRELAND) PLC
13
Investment Manager’s Report cont/d
BMO LGM Global Emerging Markets Growth and Income F und cont/d A key attribute in our definition of quality companies is the focus on sustainable business models that are not only attractive from a one to two year perspective, but also more importantly throughout the entire business cycle. While market noise and news flows tend to drive share prices in the short run, in the long run - beyond two or three years - the primary driver for share price movements is true operating profit growth (i.e., cash flow driven, not accounting driven). As such, our investment horizon and thus analysis is focused on identifying quality companies, protected by strong moats, which will continue to create strong free cash flows over the next 5 to 10 years. Given the indiscriminate selling we have witnessed across the board in global emerging markets in 2015, valuations are now attractive for our holdings and we believe currencies are cheap. Despite volatile stock markets, a difficult economic environment and U.S. dollar strengthening, consumers will continue to use and purchase basic goods such as shampoo, milk and crisps which should continue to benefit the cash flows of our holdings. As such we believe that most of our holdings should be able to grow their free cash flow by high single digits/low double digits in 2016. Whether these encouraging bottom-up fundamentals will be reflected in share price performance in 2016 or at a later stage is anyone’s guess. References to benchmark (MSCI Emerging Markets Index) are for illustrative purposes only. There is no guarantee that the Fund will outperform its benchmark. LGM Investments Limited February 2016

BMO INVESTMENTS II (IRELAND) PLC
14
Investment Manager’s Report cont/d
BMO LGM Greater India Fund* Despite favourable macro-economic fundamentals such as improvements in twin deficits, interest rate cuts triggered by fall in inflation and acceleration in GDP growth, the equity markets declined. The benchmark S&P Bombay Stock Exchange 100 Index declined 7.7% in U.S. dollar terms for the 12-month period ended December 31, 2015 compared with a spectacular 29.6% rise in the previous year. The fund declined 14.7% (net of fees, in US$ terms) for the period under review, since inception on 20th January 2015 to 31 December 2015, underperforming the benchmark S&P BSE100 Index by 0.81% which declined 13.9%. India became the fastest growing major economy in the world with reported GDP growth of 6.9% for the nine months ending September 2015. India is no longer part of the infamous “fragile 5” as lower crude oil prices are favourable not only to improve current account deficit and fiscal deficit but also to lower inflation. Decline in inflation prompted the Reserve Bank of India to cut interest rates by 125bps even as the U.S. Federal Reserve hiked interest rates by 25bps towards the end of the year. With respect to institutional flows, the net foreign buying was at a modest US$3.3bn in contrast to an average of US$20bn in the preceding 3 years but, more importantly, after a gap of 4 years it was lower than net domestic mutual fund buying at US$10.8bn. The key detractor to performance was ICICI Bank, the largest private sector bank in India offering traditional banking and a gamut of financial services businesses including life and general insurance, asset management, and brokerage. ICICI Bank's exposure to infrastructure and metal sectors has weighed heavily on its asset quality, further exasperated by the central bank’s push to downgrade loans to select leveraged corporates. The bank is focused on retail and high-rated corporates, and has taken steps to reduce exposures to legacy stressed assets. Among the key contributors to performance was Zee Entertainment, one of the largest broadcasting houses in India with a portfolio of more than 30 channels. The company should benefit from the digitisation of cable television in India through improved realisation and subscriber growth, benign content costs, and increase in advertising revenues. Strong balance sheet and growing cash flows enables Zee to invest in content, new channels and digital platform laying the foundation for future growth. India, the 7th country largest by size, 2nd largest by population and the 9th largest economy is a “true” emerging market with rising but low per capita GDP below US$2000. With the largest young population, rising per capita GDP and low per capita consumption levels should translate into large domestic demand potential for products and services. India is a large and complex country with many ‘mini-countries’ where distribution is a challenge but importantly a competitive advantage for incumbent companies focused on domestic consumption. As a consequence, the Fund is focused on companies which will benefit from India’s domestic consumption boom as opposed to export sectors such as information technology and health care where the drivers of growth reside outside India. The Fund is a “true” India fund focused on a “true” emerging market, India, which presents significant long-term investment opportunities in high quality companies focused on a large domestic economy. References to benchmark (S&P BSE 100) are for illustrative purposes only. There is no guarantee that the Fund will outperform its Benchmark. BSE® is a registered trademark of BSE Limited (“BSE”); Dow Jones® is a registered trademark of Dow Jones Trademark Holdings LLC (“Dow Jones”); and these trademarks have been licensed for use by AIPL and sublicensed for certain purposes by BMO Global Asset Management (Asia) Ltd. © Asia Index Private Limited 2015. All rights reserved. Redistribution, reproduction and/or photocopying in whole or in part are prohibited without written permission of AIPL. For more information on any of AIPL’s indices please visit http://www.asiaindex.com/. None of AIPL, BSE, Dow Jones Trademark Holdings LLC, their affiliates nor their third party licensors make any representation or warranty, express or implied, as to the ability of any index to accurately represent the asset class or market sector that it purports to represent and none of AIPL, BSE, S&P Dow Jones Indices LLC, Dow Jones Trademark Holdings LLC or their affiliates nor their third party licensors shall have any liability for any errors, omissions, or interruptions of any index or the data included therein. *The BMO LGM Greater India Fund launched on 20 January 2015. LGM Investments Limited February 2016

BMO INVESTMENTS II (IRELAND) PLC
15
Investment Manager’s Report cont/d
BMO LGM Asian Smaller Companies Fund*
2015 was a challenging year for Asian equities. The MSCI Asia ex-Japan Small Cap benchmark fell 7.5% in US dollar terms since the Fund’s inception on March 6, 2015. The Fund closed the year down 11.9% over the same period, which is clearly disappointing. 2015 was an extremely volatile year, largely dominated by macroeconomic events such as the collapse in the oil price, the strengthening of the U.S. Dollar, worries about rising U.S. interest rates and mounting concerns over both the health of the Chinese economy and the erratic nature of Chinese policy-making. All of these factors created a deeply unfavourable backdrop for Asian equity markets. Many of these problems are cyclical, but others are more structural in nature. Amongst the latter we would include: the issue of chronic deflation in China caused by manufacturing overcapacity and capital misallocation; debt problems in China and other parts of Asia; weak export demand; and the maturing of the tech super-cycle that had been the main growth driver for Korea and Taiwan over the last 4-5 years. We continue to believe that the key to investing in Asian markets is to ignore most of the index. We take a bottom-up view, focusing on quality companies with defensive characteristics such as high returns and strong cash flows. This approach tends to produce a bias towards companies that operate in the less developed markets of the Asian region. The long-term demand outlook in these countries is supported by low penetration rates for many goods and services, whilst generally poor infrastructure creates significant barriers for new entrants. This tends to promote a relatively benign competitive environment, allowing certain companies to generate high margins, high returns and strong free cash flows. We typically find more of these companies in markets such as India, Indonesia and Thailand, which explains why 52% of the portfolio is currently invested in these and similar emerging or frontier Asian markets. By contrast, we can identify fewer of these quality companies in markets like China, Hong Kong, Korea or Taiwan. These markets are more developed, which means the competitive environment tends to be tougher and the ability to generate supernormal profits and returns tends to be significantly lower. In China, these difficulties are compounded by state intervention, opaque company structures, stretched balance sheets and an almost total lack of transparency in the strategic decision making process. The portfolio currently has just 6% of its NAV invested in Chinese companies. The main detractor from performance in 2015 was Silverlake Axis, which fell foul of an anonymous short-selling report alleging various malpractices with regard to related party transactions. An independent report prepared by Deloittes largely vindicated the company, but a more energetic response from the company would certainly have mitigated at least part of the damage. Silverlake provides operating software for banks and other financial institutions, with around two thirds of ASEAN’s biggest banks on its client list. Since listing on the Singapore market in 2003, Silverlake has generated S$598.4m in Free Cash Flow and paid out S$280m in dividends. The company has continued to win new customers despite the recent adverse publicity, but we reserve judgement on the stock’s future position in the portfolio until the management takes more active steps to engage with shareholders and to improve transparency. Bata also detracted from performance in 2015, especially in the earlier part of the earlier part of the year when problems associated with the roll out of new SAP software impacted sales performance. The worst of these problems now seem to be behind us. Bata India has been operating in India for over eight decades and is the market leader in footwear retailing with an estimated 16% share of the organised sector. Bata’s key strength is its distribution network, with over 1,400 retail stores and an urban wholesale division comprising 180 large distributors and 30,000 direct dealers across India. The company continues to expand the network, with a target of 100 new store openings each year. Bata is also investing in developing an e-commerce platform, digital marketing and a customer loyalty programme. Over the years, Bata India has transformed itself from a rather staid retailer of black shoes for men into a contemporary lifestyle brand catering to a much broader customer base. The company has a strong balance sheet, impressive free cash flows and generates and a return on invested capital in excess of 30%.
BMO INVESTMENTS II (IRELAND) PLC
16
Investment Manager’s Report cont/d
BMO LGM Asian Smaller Companies Fund* cont/d Top contributors over the period included Beauty Community in Thailand and Ikang in China. Beauty was one of the portfolio’s strongest performers in 2015, with a gain of more than 70% in local currency terms over the year as a whole. The company is on track to produce record fourth quarter earnings, supported by solid same stores sales growth, continuing network expansion and falling SG&A expenses as scale benefits materialise. The company will enjoy further strong growth in 2016 as the store network expands and the structural shift away from traditional kiosks towards branded and conceptual cosmetic retail stores gathers momentum. Overseas expansion in the largely underpenetrated markets of Laos, Cambodia, Vietnam and Burma will provide additional growth impetus. The company has no debt and generates a return on invested capital of more than 40%. Beauty’s 90% pay-out ratio will also generate a dividend yield of around 3% this year and 4% next. Ikang is particularly worthy of note because the company is presently the subject of two takeover bids. Ikang is the largest player the Chinese private healthcare market. The company operates a network of 80 self-owned medical centres covering 22 of the most affluent cities in China and has contractual arrangements with 400 third-party service provider facilities in another 150 cities. Their market share is about 13%. The number of self-owned centres has doubled in the last two years, partly through organic growth and partly through acquisition. The company provides a wide variety of medical examination and disease screening services, primarily for corporate customers. Ikang handled more than 2.2m customer visits in the first six months of the current fiscal year, which is a 29% increase on the same period last year. All of which has attracted the attention of a company called Jiangsu Sanyou, which is in exactly the same line of business with an approximately equal market share. Jiangsu is working together with Ping An Insurance and several private equity investors. What makes the situation fascinating is the fact that the Chairman and founder of iKang is himself trying to take the company private – we presume with the aim of re-listing in the A-share market at four or five times the current valuation. We currently expect the Chairman to respond with a higher privatisation offer in due course. In terms of portfolio activity during the quarter, we completely sold Sa Sa in Hong Kong and Biostime in China. Like Beauty Community, Sa Sa is also a cosmetics retailer. Unlike Beauty, however, Sa Sa is experiencing significant structural headwinds that the management seems in no way able to address. Mainland tourist arrivals into Hong Kong – the company’s chief revenue source – continue to decline, consumer preferences are shifting, the tax arbitrage that encouraged mainland visitors to shop in Hong Kong rather than China is under threat and, finally, the on-line channel is starting to take significant market share. Because of the company’s formerly excellent execution track record and impeccable history of free cash flow generation, we gave Sa Sa the benefit of the doubt for perhaps longer than we really should have. In the absence of any tangible turnaround strategy from the management, we were left with no option to sell the position. Biostime International grabbed the headlines in late September after announcing that it was to buy an 83% stake in an Australian vitamin and health supplement maker called Swisse Wellness (SW). The price tag of A$1.3bn appeared relatively rich based on the scant financials available (SW is a privately-owned company). Biostime already has its hands full sorting out a variety of distribution and inventory issues arising from the recent launch of new products in the China market, so we were left wondering if management really had the bandwidth to cope with this new acquisition. Biostime will be taking on significant debt to finance this purchase, increasing the gearing ratio from a negative 50% to a positive 160% in the process. This represents a major deterioration in the balance sheet position for Biostime. Debt servicing will clearly become the priority for Biostime’s management and we now worry about the sustainability of the company’s previously rather attractive dividend pay-out ratio. We therefore sold the Fund’s entire position in Biostime.

BMO INVESTMENTS II (IRELAND) PLC
17
Investment Manager’s Report cont/d
BMO LGM Asian Smaller Companies Fund* cont/d We added one new position, Bajaj Corp in India, which has a 60% market share in the relatively fast growing market category of light hair oils. The company’s leading brand, “Almond Drops Hair Oil” is positioned in the upper segment of the hair care market, commanding a premium price over more commoditised categories like coconut oil. The company has doubled its market share over the last decade despite annual price increases. Bajaj Corp has delivered 26% and 58% growth in sales and profits respectively over the past decade with gross margins and Earnings Before Interest, Taxes, Depreciation, and Amortization margins averaging 53% and 22%, respectively. The company operates with low to negative working capital, it has cash on the books and minimal capital expenditure needs. The company’s dividend pay-out has averaged 50% and the return on invested capital is close to 100%. We expect the company to sustain the excellent performance over the coming years. Markets began 2016 in sombre mood, hit by Middle East tensions and yet more worries over the Chinese economy. Most attention is currently focused on the gradual, but seemingly entrenched depreciation of the Chinese Yuan, as well as the rapid fall in the price of oil. It would appear that most markets are interpreting the weak oil price as a negative macro-economic indicator. We generally try to avoid getting involved in these “top down” issues but, since most of Asia relies heavily on oil imports for the bulk of its energy needs, the weaker oil price can only mean significant windfall gains for consumers, lower input costs for manufacturers and an improving current account position for many of Asia’s economies. The weak oil price is a good thing for Asia and we shall see increasing evidence of this as companies across the region begin reporting their fourth quarter earnings. For the year as a whole, we believe that most of our companies will successfully grow their cash flows at a high single digit or even low double digit level. But at what point the market gets round to recognising these encouraging bottom-up fundamentals is frankly anyone’s guess. *The BMO LGM Asian Smaller Companies Fund launched on 6 March 2015. LGM Investments Limited February 2016

BMO INVESTMENTS II (IRELAND) PLC
18
Directors’ Report for the year ended 31 December 20 15
The Directors present herewith the annual report and audited financial statements of BMO Investments II (Ireland) Plc (the “Company”) for the year ended 31 December 2015.
The financial statements of the Company have been prepared in accordance with International Financial Reporting Standards ("IFRS") as adopted by the European Union, the Companies Act 2014 and the European Communities (Undertakings for Collective Investment in Transferable Securities) Regulations 2011 as amended (the “UCITS Regulations”), and the Central Bank (Supervision and Enforcement) Act 2013 (Section 48(1)) (Undertakings for Collective Investment in Transferable Securities) Regulations 2015 (“the Central Bank UCITS Regulations”). Statement of Compliance on Corporate Governance The Company has adopted in full the voluntary Corporate Governance Code for Collective Investment Schemes and Management Companies (the “Code”) as published by Irish Funds (formerly the Irish Funds Industry Association), the text of which is available from the Irish Funds website, www.irishfunds.ie. The Company has been fully complaint with the Code for the year ended 31 December 2015. Statement of Directors’ Responsibilities The Directors are responsible for overseeing the preparation of the directors’ report and the financial statements in accordance with applicable Irish laws and regulations. Irish company law requires the Directors to oversee the preparation of financial statements for each financial year. Under that law the Directors have prepared the financial statements in accordance with International Financial Reporting Standards (“IFRS”), as adopted by the European Union, and applicable law. Under Irish company law, the Directors shall not approve the financial statements unless they are satisfied that they give a true and fair view of the Company’s assets, liabilities, financial position as at the end of the financial year and of the changes in net assets attributable to holders of redeemable participating shares of the Company for the financial year.
In preparing these financial statements, the Directors are required to:
• oversee the selection of suitable accounting policies and that such policies are consistently applied;
• ensure that judgements and estimates that are reasonable and prudent; • state whether the financial statements have been prepared in accordance with IFRS and ensure
that they contain the additional information required by the Companies Act 2014; and • oversee the preparation of the financial statements on the going concern basis unless it is
inappropriate to presume that the company will continue in business. The Directors are responsible for ensuring that adequate accounting records are kept which disclose with reasonable accuracy at any time the assets, liabilities, financial position and profit or loss of the Company and enable them to ensure that its financial statements comply with the Companies Act 2014. They have general responsibility for taking such steps as are reasonably open to them to safeguard the assets of the Company. In this regard they have entrusted the assets of the Company to a depositary for safe-keeping. They have general responsibility for taking such steps as are reasonably open to them to prevent and detect fraud and other irregularities. The Directors are also responsible for preparing a directors’ report that complies with the requirements of the Companies Act 2014. Results The results for the year are set out in the Statement of Comprehensive Income on page 26. Distributions Distributions declared for the year ending 31 December 2015 are disclosed under note 11.
BMO INVESTMENTS II (IRELAND) PLC
19
Directors’ Report for the year ended 31 December 20 15 cont/d Review of Business and Future Developments The investment objectives and policies of the active Funds are outlined on pages 5 to 6 and the performance of the active Funds is set out in the Investment Manager’s Report on pages 8 to 17. The Directors do not anticipate any significant change in the structure or investment objectives of the Funds. The results of the operations are set out on page 26. A detailed review of the development of the business and future developments is included in each Fund's Investment Manager's Report on pages 8 to 17. The Company will continue to act as an investment vehicle as set out in the Prospectus. Risk Management Objectives and Policies Details of the Company’s risk management objectives and policies are included in note 6 to the financial statements. Key Performance Indicators The Directors consider that the change in net asset value (“NAV”) per share is a key indicator of the performance of the Company. Key performance indicators (“KPIs”) monitored by the Directors for each Fund include: the month to month movement in the NAV per share; and the share capital movements. Connected party transactions Regulation 41(1) of the Central Bank UCITS Regulations states that “a responsible person shall ensure that any transaction between a UCITS and a connected person is conducted a) at arm’s length; and b) in the best interest of the unit-holders of the UCITS”. As required under Regulation 78 (4) of the Central Bank UCITS Regulations, the Directors are satisfied that there are in place arrangements, evidenced by written procedures, to ensure that the obligations that are prescribed by Regulation 41(1) are applied to all transactions with a connected party; and all transactions with connected parties that were entered into during the period to which the report relates complied with the obligations that are prescribed by Regulation 41(1). Significant events during the year KB Associates were appointed as governance service provider from 1 January 2015.
The BMO LGM Greater India Fund was launched on 20 January 2015.
The BMO LGM Asian Smaller Companies Fund was launched on 6 March 2015.
The Memorandum and Articles of Association of the Company were amended by special resolution of the members on 28 May 2015.
The BMO LGM Greater India Fund Class E Accumulating Shares was launched on 25 August 2015.
A revised Prospectus was noted by the Central Bank on 9 December 2015. Among the main changes were the creation of Class S and Class W share classes of the BMO LGM Asian Growth and Income Fund and BMO LGM Global Emerging Markets Growth and Income Fund, updates to reflect the introduction of the Central Bank’s UCITS Regulations and the restructuring of the Central Bank’s UCITS guidance, updates to refer to the Companies Act 2014 and updates to the Irish taxation disclosure to reflect recent changes in Irish tax legislation.
Significant events since year end The European Union (Undertakings for Collective Investment and Transferable Securities)(Amendment) Regulations 2016 became effective on 18 March 2016.
Effective 1 April 2016, the following Directors resigned as Directors of the Company: Anthony Cousins, Paul McNaughton and Diane Seymour-Williams. Effective the same date, the following appointments were made as Directors of the Company: Liam Miley, Hugh Moir and Lars Nielsen.
There were no other significant events affecting the Company’s financial statements since the year end.


BMO INVESTMENTS II (IRELAND) PLC
22
Independent Auditor’s Report to the Members of BMO II Investments (Ireland) Plc
We have audited the financial statements of BMO Investments (Ireland) PLC (“the Company”) for the year ended 31 December 2015 which comprise Statement of Financial Position, Statement of Comprehensive Income, Statement of Changes in Net Assets Attributable to Holders of Redeemable Participating Shares, Statement of Cash Flows, Schedule of Investments and the related notes. The financial reporting framework that has been applied in their preparation is Irish law and International Financial Reporting Standards (IFRS) as adopted by the European Union.
Opinions and conclusions arising from our audit 1 Our opinion on the financial statements is unmod ified In our opinion the financial statements:
• give a true and fair view of the assets, liabilities and financial position of the Company as at 31 December 2015 and of its decrease in net assets attributable to holders of redeemable participating shares for the year then ended;
• have been properly prepared in accordance with IFRS as adopted by the European Union; and
• have been properly prepared in accordance with the requirements of the Companies Act 2014, the European Communities (Undertakings for Collective Investment in Transferable Securities) Regulations 2011 and the Central Bank (Supervision and Enforcement) Act 2013 (Section 48(1)) (Undertakings for Collective Investment in Transferable Securities) Regulations 2015.
2 Our conclusions on other matters on which we are required to report by the Companies Act 2014 are set out below We have obtained all the information and explanations which we consider necessary for the purposes of our audit. In our opinion the accounting records of the Company were sufficient to permit the financial statements to be readily and properly audited and the financial statements are in agreement with the accounting records. In our opinion the information given in the Directors’ Report is consistent with the financial statements.
3 We have nothing to report in respect of matters o n which we are required to report by exception International Standards on Auditing ("ISAs") (UK & Ireland) require that we report to you if, based on the knowledge we acquired during our audit, we have identified information in the annual report that contains a material inconsistency with either that knowledge or the financial statements, a material misstatement of fact, or that is otherwise misleading. In addition, the Companies Act 2014 requires us to report to you if, in our opinion, the disclosures of directors’ remuneration and transactions required by sections 305 to 312 of the Act are not made. Basis of our report, responsibilities and restricti ons on use As explained more fully in the Statement of Directors’ Responsibilities set out on page 18, the Directors are responsible for the preparation of the financial statements and for being satisfied that they give a true and fair view and otherwise comply with the Companies Act 2014. Our responsibility is to audit and express an opinion on the financial statements in accordance with Irish law and International Standards on Auditing (UK and Ireland). Those standards require us to comply with the Financial Reporting Council’s Ethical Standards for Auditors. An audit undertaken in accordance with ISAs (UK & Ireland) involves obtaining evidence about the amounts and disclosures in the financial statements sufficient to give reasonable assurance that the financial statements are free from material misstatement, whether caused by fraud or error.
BMO INVESTMENTS II (IRELAND) PLC
23
Independent Auditor’s Report to the Members of BMO II Investments (Ireland) Plc cont/d Basis of our report, responsibilities and restricti ons on use cont/d This includes an assessment of: whether the accounting policies are appropriate to the Company’s circumstances and have been consistently applied and adequately disclosed; the reasonableness of significant accounting estimates made by the directors; and the overall presentation of the financial statements. In addition, we read all the financial and non-financial information in the Directors’ Report to identify material inconsistencies with the audited financial statements and to identify any information that is apparently materially incorrect based on, or materially inconsistent with, the knowledge acquired by us in the course of performing the audit. If we become aware of any apparent material misstatements or inconsistencies we consider the implications for our report. Whilst an audit conducted in accordance with ISAs (UK & Ireland) is designed to provide reasonable assurance of identifying material misstatements or omissions it is not guaranteed to do so. Rather the auditor plans the audit to determine the extent of testing needed to reduce to an appropriately low level the probability that the aggregate of uncorrected and undetected misstatements does not exceed materiality for the financial statements as a whole. This testing requires us to conduct significant audit work on a broad range of assets, liabilities, income and expense as well as devoting significant time of the most experienced members of the audit team, in particular the engagement partner responsible for the audit, to subjective areas of the accounting and reporting. Our report is made solely to the Company’s members, as a body, in accordance with section 391 of the Companies Act 2014. Our audit work has been undertaken so that we might state to the Company’s members those matters we are required to state to them in an auditor’s report and for no other purpose. To the fullest extent permitted by law, we do not accept or assume responsibility to anyone other than the Company and the Company’s members as a body, for our audit work, for this report, or for the opinions we have formed.
Darina Barrett for and on behalf of KPMG Chartered Accountants, Statutory Audit Firm
19 April 2016
1 Harbourmaster Place International Financial Services Centre Dublin1

BMO INVESTMENTS II (IRELAND) PLC
25
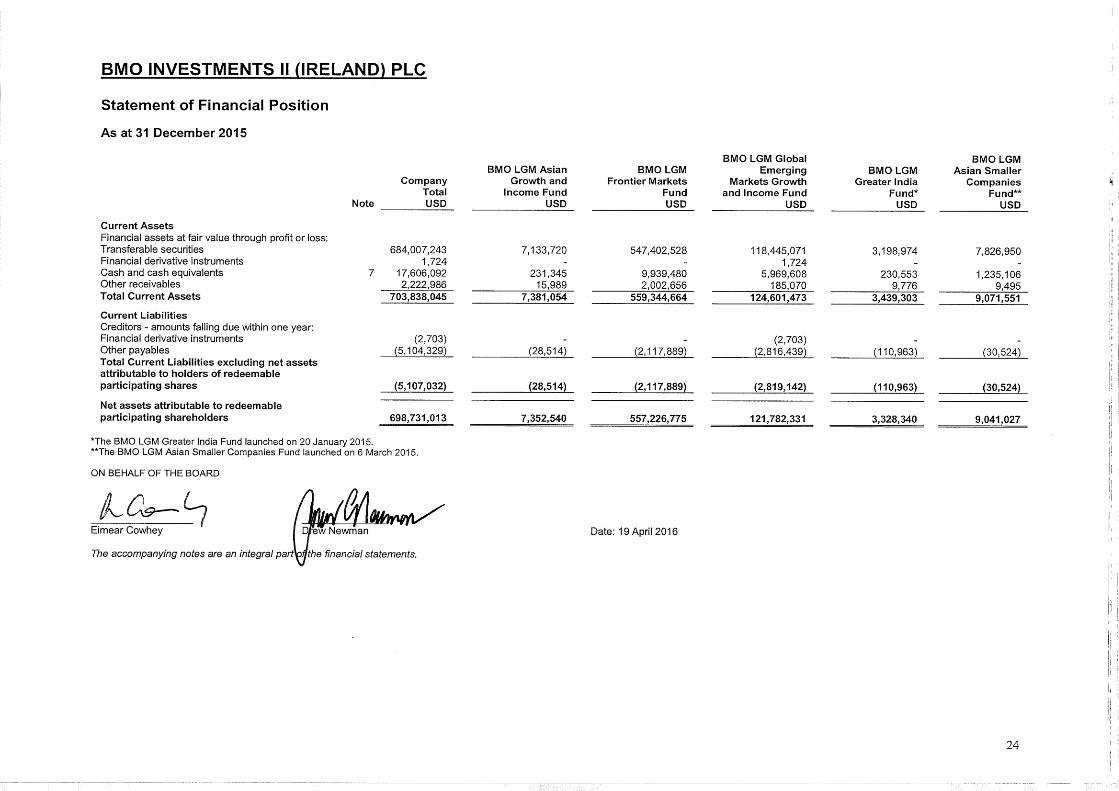
Statement of Financial Position
As at 31 December 2014
Note
Company Total USD
BMO LGM Asian
Growth and Income Fund USD
BMO LGM Frontier Markets Fund
USD
BMO LGM Global Emerging
Markets Growth and Income Fund
USD
Current Assets Financial assets at fair value through profit or loss: Transferable securities 730,839,653 8,809,604 608,343,627 113,686,422 Cash and cash equivalents 7 20,068,015 362,055 16,487,031 3,218,929 Other receivables 418,742 15,305 266,522 136,915 Total Assets 751,326,410 9,186,964 625,097,180 117,042,266 Current Liabilities Creditors - amounts falling due within one year: Other payables (1,615,156) (39,308) (1,372,016) (203,832) Total Current Liabilities excluding net assets attributable to holders of redeemable participating shares
(1,615,156)
(39,308)
(1,372,016)
(203,832) Net assets attributable to redeemable participating shareholders
749,711,254
9,147,656
623,725,164
116,838,434
The accompanying notes are an integral part of the financial statements.

BMO INVESTMENTS II (IRELAND) PLC
26
Statement of Comprehensive Income
For the year ended 31 December 2015
Note
Company Total USD
BMO LGM Asian
Growth and Income Fund
USD
BMO LGM
Frontier Markets Fund
USD
BMO LGM Global
Emerging Markets Growth
and Income Fund USD
BMO LGM Greater India
Fund* USD
BMO LGM Asian Smaller
Companies Fund**
USD Income Investment income 1(c) 25,459,172 197,244 22,009,593 3,044,031 16,239 192,065 Other income 97,032 21,579 - - 75,453 - Net loss on investment activities 4, 1(c) (84,243,148) (923,681) (63,754,802) (18,024,470) (265,961) (1,274,234) Total investment expense (58,686,944) (704,858) (41,745,209) (14,980,439) (174,269) (1,082,169) Expenses Operating Expenses 5 (7,115,776) (128,763) (6,292,377) (457,375) (105,846) (131,415) Net expense (65,802,720) (833,621) (48,037,586) (15,437,814) (280,115) (1,213,584) Finance Costs
Distributions 11 (16,691,483) (57,903) (13,963,598) (2,669,982) - - Taxation
Capital gain tax 2 (510,998) - (413,263) (97,506) (229) - Withholding tax 2 (1,432,284) (19,376) (1,175,473) (227,760) - (9,675) Net decrease in net assets attributable to holders of Redeemable Participating Shares resulting from operations
(84,437,485) (910,900) (63,589,920) (18,433,062) (280,344) (1,223,259) *The BMO LGM Greater India Fund launched on 20 January 2015. **The BMO LGM Asian Smaller Companies Fund launched on 6 March 2015. The accompanying notes are an integral part of the financial statements.

BMO INVESTMENTS II (IRELAND) PLC
27
Statement of Comprehensive Income
For the period ended 31 December 2014
Note
Company Total USD
BMO LGM Asian
Growth and Income Fund USD
BMO LGM
Frontier Markets Fund USD
BMO LGM Global Emerging Markets
Growth and Income Fund
USD Income Investment income 1(c) 25,776,205 166,648 22,251,546 3,358,011 Other income 38,738 9,864 - 28,874 Net gain on investment activities 28,429,316 53,441 18,202,346 10,173,529 Total investment i ncome 54,244,259 229,953 40,453,892 13,560,414 Expenses
Operating expenses 5 (7,872,117) (110,017) (7,311,843) (450,257) Net Income 46,372,142 119,936 33,142,049 13,110,157 Finance Costs
Bank interest expense - - - - Distributions 11 - - - - Taxation Capital gains tax 2 (37,100) - - (37,100) Withholding tax
2 (1,556,216)
(12,280)
(1,264,911)
(279,025) Net movement in net assets attributable to redeemab le participating shareholders resulting from operation s
44,778,826 107,656 31,877,138 12,794,032
The accompanying notes are an integral part of the financial statements.

BMO INVESTMENTS II (IRELAND) PLC
28
Statement of Changes in Net Assets Attributable to Holders of Redeemable Participating Shares
For the year ended 31 December 2015
BMO LGM Asian Growth and
Income Fund USD
BMO LGM Frontier
Markets Fund USD
BMO LGM Global Emerging Markets
Growth and Income Fund USD
BMO LGM Greater India Fund*
USD
BMO LGM Asian Smaller Companies
Fund** USD
Net assets attributable to redeemable participating shareholders at beginning of year 9,147,656 623,725,164 116,838,434 - - Net movement in net assets attributable to redeemable participating shareholders resulting from operations
(910,900) (63,589,920) (18,433,062) (280,344) (1,223,259) Proceeds from the issuance of redeemable participating shares
55,600 12,262,568 21,712,726 3,604,327 10,264,286 Distributions reinvested 11 57,684 13,622,482 2,664,390 - - Anti – dilution levy 2,500 331,646 51,501 4,357 - Cost of redeemable participating shares redeemed
(1,000,000) (29,125,165) (1,051,658) - - Movement in net assets resulting from share transactions (884,216) (2,908,469) 23,376,959
3,608,684
10,264,286
Net assets attributable to redeemable participating shareholders at end of year 7,352,540 557,226,775 121,782,331 3,328,340 9,041,027 *The BMO LGM Greater India Fund launched on 20 January 2015. **The BMO LGM Asian Smaller Companies Fund launched on 6 March 2015.
The accompanying notes are an integral part of the financial statements.

BMO INVESTMENTS II (IRELAND) PLC
29
Statement of Changes in Net Assets Attributable to Holders of Redeemable Participating Shares For the period ended 31 December 2014
BMO LGM Asian Growth and Income Fund
USD
BMO LGM Frontier
Markets Fund USD
BMO LGM Global Emerging Markets Growth
and Income Fund USD
Net assets attributable to redeemable participating shareholders at beginning of period - 320,981,065 8,233,385 Net movement in net assets attributable to redeemable participating shareholders resulting from operations 107,656 31,877,138 12,794,032 Proceeds from the issuance of redeemable participating shares
9,029,900
321,329,005 100,321,067 Cost of redeemable participating shares redeemed - (53,772,651) (4,793,849) Anti – dilution levy 10,100 3,310,607 283,799 Movement in net assets resulting from share transactions
9,040,000
270,866,961
95,811,017
Net assets attributable to redeemable participating shareholders at end of period 9,147,656 623,725,164 116,838,434
The accompanying notes are an integral part of the financial statements.

BMO INVESTMENTS II (IRELAND) PLC
30
Statement of Cash Flow
For the year ended 31 December 2015
Company Total USD
BMO LGM Asian Growth
and Income Fund USD
BMO LGM Frontier
Markets Fund USD
BMO LGM Global Emerging
Markets Growth and Income Fund
USD
BMO LGM Greater India Fund*
USD
BMO LGM Asian Smaller Companies
Fund** USD
Cash flows from operating activities Net decrease in net assets attributable to holders of redeemable participating shares (67,746,002) (852,997) (49,626,322) (15,763,080)
(280,344)
(1,223,259)
Adjustments for: Movement in financial assets at fair value through profit or loss 47,427,153
1,675,884
59,163,047
(2,486,808)
(3,098,020)
(7,826,950)
Unrealised movement on derivative assets and liabilities 979
-
-
979
-
-
Operating cash flows before movements in working capital (20,317,870)
822,887
9,536,725
(18,248,909)
(3,378,364)
(9,050,209)
Movement in receivables 641,803 674 253,380 407,020 (9,776) (9,495) Movement in payables 428,093 (12,152) 514,121 (114,409) 10,009 30,524 Cash inflow/(outflow) from operations 1,069,896 (11,478) 767,501 292,611 233 21,029 Net cash (outflow)/inflow from operating activities (19,247,974) 811,409 10,304,226 (17,956,298) (3,378,131) (9,029,180) Cash flows from financing activities Proceeds from subscriptions 48,287,973 58,100 12,592,676 21,764,227 3,608,684 10,264,286 Payment of redemptions (31,154,995) (1,000,000) (29,103,337) (1,051,658) - - Distributions paid (346,927) (219) (341,116) (5,592) - - Net cash inflow/(outflow) from financing activities 16,786,051 (942,119) (16,851,777) 20,706,977 3,608,684 10,264,286 Net (decrease)/increase in cash and cash equivalents (2,461,923)
(130,710)
(6,547,551)
2,750,679
230,553
1,235,106
Cash and cash equivalents at the start of the year 20,068,015 362,055 16,487,031 3,218,929 - - Cash and cash equivalents at the end of the year 17,606,092 231,345 9,939,480 5,969,608 230,553 1,235,106 Cashflows from operating activities include:
Interest received - - - - - -
Dividends received 22,417,642 - 22,232,236 - - 185,406
*The BMO LGM Greater India Fund launched on 20 January 2015. **The BMO LGM Asian Smaller Companies Fund launched on 6 March 2015. The accompanying notes are an integral part of the financial statements.

BMO INVESTMENTS II (IRELAND) PLC
31
Statement of Cash Flow
For the period ended 31 December 2014
Company
Total USD
BMO LGM Asian Growth and Income
Fund USD
LG Global Investment Fund
USD
BMO LGM Frontier Markets Fund
USD
BMO LGM Global Emerging Markets
Growth and Income Fund
USD Cash flows from operating activities Net increase in net assets attributable to holders of redeemable participating shares 44,778,826
107,656
-
31,877,138
12,794,032 Adjustments for: Movement in financial assets at fair value through profit or loss (422,805,726)
(8,809,604)
-
(316,824,983)
(97,171,139)
Operating cash flows before movements in working capital
(378,026,900) (8,701,948) (284,947,845) (84,377,107)
Movement in receivables (75,528) (15,305) - (55,243) (4,980) Movement in payables 545,662 39,308 (21,468) 467,103 60,719 Cash inflow /(outflow) from operations 470,134 24,003 (21,468) 411,860 55,739 Net cash outflow from operating activities (377,556,766) (8,677,945) (21,468) (284,535,985) (84,321,368) Cash flows from financing activities Proceeds from subscriptions 457,707,981 9,040,000 - 348,063,115 100,604,866 Payment of redemptions (67,786,917) - - (54,432,418) (13,354,499) Net cash provided by financing activities 389,921,064 9,040,000 - 293,630,697 87,250,367 Net increase /(decrease) in cash and cash equivalents 12,364,298 362,055 (21,468) 9,094,712 2,928,999 Cash and cash equivalents at the start of the period 7,703,717 - 21,468 7,392,319 289,930 Cash and cash equivalents at the end of the period 20,068,015 362,055 - 16,487,031 3,218,929
Cashflows from operating activities include: Interest received 4,578 - - 4,166 412 Dividends received 25,686,715 151,578 - 22,183,345 3,351,791
The accompanying notes are an integral part of the financial statements.

BMO INVESTMENTS II (IRELAND) PLC
32
Notes to the Financial Statements for the year ende d 31 December 2015
1. Significant Accounting Policies
The principal accounting policies and estimation techniques applied in the preparation of these financial statements are set out below.
a) Basis of Preparation The financial statements of the Company have been prepared in accordance with International Financial Reporting Standards ("IFRS"), as adopted by the European Union (“EU”). The financial statements have been prepared under the historical cost basis except for financial instruments at fair value through profit or loss which are measured at fair value. The financial statements have been prepared on a going concern basis.
b) Functional and Presentation Currency Items included in the Company's financial statements are measured using the currency of the primary economic environment in which the relevant Fund operates (the “functional currency”). The functional currency of each Fund is USD. The Company also has adopted these functional currencies as the presentation currency of each of the Funds. The functional and presentation currency of the Company is USD. The majority of the Funds' investments and transactions are denominated in USD. Investor subscriptions and redemptions are determined based on the net asset value, and are received and paid in USD. Transactions in foreign currencies are translated into USD at the exchange rate at the dates of the transactions. Monetary assets and liabilities denominated in foreign currencies at the reporting date are retranslated into USD at the exchange rate at that date. Non-monetary assets and liabilities denominated in foreign currencies that are measured at fair value are retranslated into USD at the exchange rate at the date on which fair value was determined. Foreign currency differences arising on retranslation are recognised in profit or loss as net foreign exchange losses, except for those arising on financial instruments at fair value through profit or loss (“FVTPL”), which are recognised as a component of net gain from financial instruments at FVTPL.
c) Investments at Fair Value Through Profit or Loss
Classification The Company classifies financial assets and financial liabilities into the following categories: Financial assets at fair value through profit or loss: Held for trading: equity investments, participation notes and derivative financial instruments. Financial assets at amortised cost: Loans and receivables: cash and cash equivalents and other assets. Financial liabilities at fair value through profit or loss: Held for trading: derivative financial instruments. Financial liabilities at amortised cost: Other liabilities. A financial instrument is classified as held for trading if:
• it is acquired or incurred principally for the purpose of selling or repurchasing it in the near term;
• on initial recognition, it is part of a portfolio that is managed together and for which there is evidence of a recent pattern of a short term profit taking; or
• it is a derivative, other than a designated and effective hedging instrument.

BMO INVESTMENTS II (IRELAND) PLC
33
Notes to the Financial Statements for the year ende d 31 December 2015 cont/d 1. Significant Accounting Policies cont/d
c) Investments at Fair Value Through Profit or Loss cont/d
Fair Value Measurement Fair value is the price that would be received to sell an asset or paid to transfer a liability in an orderly transaction between market participants at the measurement date in the principal or, in its absence, the most advantageous market to which the relevant Fund has access at that date. The fair value of a liability reflects its non-performance risk. When available, the Funds measure the fair value of an investment using the quoted price in an active market for that instrument. A market is regarded as ‘active’ if transactions for the asset or liability take place with sufficient frequency and volume to provide pricing information on an ongoing basis. Funds measure instruments quoted in an active market at a last traded price, because this price provides a reasonable approximation of exit price.
If there is no quoted price in an active market, then a Fund uses valuation techniques that maximise the use of relevant observable inputs and minimise the use of unobservable inputs. The chosen valuation technique incorporates all of the factors that market participants would take into account in pricing a transaction. A Fund recognises transfers between levels of the fair value hierarchy as at the end of the reporting period during which the change has occurred. Participation Notes The Funds may invest in warrants, notes or other structured investments commonly referred to as participation notes designed to provide a return which is directly linked to the performance of a security as a means of gaining exposure to Asian securities markets. These are identified in the Schedule of Investments. Participation notes are valued based on the fair value of the underlying security. Forward Foreign Exchange Contracts The Funds may employ forward currency exchange contracts to purchase or sell a specific currency at a future date at a price set at the time of the contract. The Base Currency of each Fund is USD but securities in a Fund may be denominated in large range of currencies. Consequently, a Fund may enter into forward currency contracts to hedge against exchange rate risk. Performance may be significantly influenced by movements in foreign exchange rates because currency positions held by a Fund may not correspond with the currency of the securities invested in.
The unrealised gain or loss on open forward foreign currency exchange contracts is calculated as the difference between the contract price and the spot price as at year end. Any changes in fair value are recognised in the Statement of Comprehensive Income. Amortised Cost Financial assets and financial liabilities other than those held for trading are held at amortised cost. The amortised cost of the financial asset or financial liability is the amount at which the financial asset or financial liability is measured at initial recognition, minus principal repayments, plus or minus the accumulative amortisation using the effective interest method of any difference between the initial amount recognised and the maturity amount, minus any reduction for impairment. Right of Offset Financial assets and liabilities are offset and the net amount presented in the Statement of Financial Position when, and only when, the Company has a legal right to set off the amounts and intends either to settle on a net basis or to realise the asset and settle the liability simultaneously. Income and expenses are presented on a net basis for gains and losses from financial instruments at fair value through profit and loss and foreign exchange gains and losses. The Company’s financial assets and liabilities are not subject to offsetting, enforceable master netting arrangements and similar agreements.
BMO INVESTMENTS II (IRELAND) PLC
34
Notes to the Financial Statements for the year ende d 31 December 2015 cont/d 1. Significant Accounting Policies cont/d c) Investments at Fair Value Through Profit or Loss cont/d
Recognition and Initial Measurement Purchases and sales of investments are recognised as of the day the transaction takes place, i.e., the trade date – the date on which the Company commits to purchase or sell the asset. Other financial assets and liabilities are recognised on the date in which they originated. Investments are initially recognised at fair value, and costs for all financial assets and financial liabilities carried at fair value through profit or loss are expensed as incurred. Financial assets and liabilities not at FVTPL are initially recognised at fair value plus transaction costs that are directly attributable to their acquisition or issue.
De-recognition Investments are de-recognised when the rights to receive cash flows from the investments have expired or the Company has transferred substantially all risks and rewards of ownership. On derecognition of a financial asset, the difference between the carrying amount of the asset and consideration received is recognised in the Statement of Comprehensive Income. Financial liabilities are derecognised when the contractual obligations are discharged, cancelled or expired.
d) Dividend Income Dividend income arising on the underlying equity investments of the Company is recognised as income of the Company on the ex-dividend date. Income is shown gross of any non-recoverable withholding taxes, which is disclosed separately in the Statement of Comprehensive Income, and net of any tax credits.
e) Interest Income Deposit interest is recognised as income of the Company on an effective interest basis in line with the contractual terms.
f) Expenses
All expenses, including management fees, are recognised in the Statement of Comprehensive Income on an accruals basis.
g) Realised Gains & Losses
Realised gains and losses on sales of investments are calculated based on the average book cost of the investment in local currency and are included in net gains/(losses) on investment activities at fair value in the Statement of Comprehensive Income. Realised gains and losses on investments include interest received on debt securities.
h) Unrealised Gains & Losses Unrealised gains and losses on investments arising during the year are included in net gains/(losses) on investment activities in the Statement of Comprehensive Income.
i) Redeemable Participating Shares The Company issues redeemable participating shares, which are redeemable at the holder's option and are classified as financial liabilities. Redeemable participating shares can be put back to the Company at any time for cash equal to a proportionate share of the Company's Net Asset Value.
The Company's Net Asset Value per Share is calculated by dividing the net assets attributable to the holders of redeemable participating shares with the total number of outstanding redeemable participating shares. In accordance with the provisions of the Company's Prospectus, investment positions are valued based on the last traded market price for the purpose of determining the Net Asset Value per Share for subscriptions and redemptions and organisational fees are deferred and amortised over 5 years.
j) Taxation
Dividend and interest income received by the Company may be subject to withholding tax imposed in the country of origin. Investment income is recorded gross of such taxes and the corresponding withholding tax is recognised as a tax expense.

BMO INVESTMENTS II (IRELAND) PLC
35
Notes to the Financial Statements for the year ende d 31 December 2015 cont/d 1. Significant Accounting Policies cont/d
j) Taxation cont/d
Withholding tax reclaims receivable are recorded as receivables in the Statement of Financial Position.
k) Transaction Costs
Transaction costs are defined as the incremental costs that are directly attributable to the acquisition, issue or disposal of a financial asset or a financial liability. An incremental cost is one that would not have been incurred if the entity had not acquired, issued or disposed of the financial instrument. When a financial asset or a financial liability is recognised initially, an entity shall measure it at its fair value through profit or loss plus transaction costs that are directly attributable to the acquisition or issue of the financial asset or financial liability. Transaction costs on purchases and sales of equities are included in net realised or unrealised gains/ (losses) on investments in the Statement of Comprehensive Income account and transaction costs on custody transactions are included in Depositary fees in the Statement of Comprehensive Income for each Fund. These costs are separately identifiable transaction costs and the total costs incurred by each Fund during the year are disclosed in note 5.
l) Distribution Policy
The Company may issue either or both income share classes and accumulating share classes. In the case of Funds with income share classes, the Company intends to distribute net income and realised and unrealised gains net of realised and unrealised losses attributable to such classes annually. In the case of Funds with accumulating share classes, dividends will be declared on these Shares but automatically reinvested and will be reflected in the Net Asset Value of the Share class.
m) Significant Accounting Estimates and Assumptions The preparation of financial statements in conformity with IFRS requires management to make judgments, estimates and assumptions that affect the application of policies and reported amounts of assets and liabilities, income and expenses. The estimates and associated assumptions are based on historical experience and various other factors that are believed to be reasonable under the circumstances, the results of which form the basis of the judgments about carrying values of assets and liabilities that are not readily apparent from other sources. Actual results may differ from these estimates.
Critical accounting estimates are those which involve the most complex or subjective judgments or assessments. The areas of the Company’s business that typically require such estimates are the determination of the fair value of financial assets and liabilities.
Management also made the assessment on the functional and presentation currency as outlined in note 1(b). Management has also made the assessment on uncertain tax liabilities with respect to foreign capital gains taxes as outlined in note 2.
n) Anti-Dilution Levy Where the Company deems there to be large net subscriptions and net redemptions and to prevent any adverse effect on the value of the assets of a Fund, the Company may charge an anti-dilution levy for retention as part of the assets of the Fund. The levy will be calculated to cover the dealing costs and to preserve the value of underlying investments of the Fund. Such costs will include any dealing spreads, commissions, transfer taxes and other dealing costs relating to the acquisition or disposal of assets and to preserve the value of the underlying assets of a Fund in the event of receipt for processing of net subscription or net redemption requests.
If charged, such anti-dilution levy will be based on estimated actual costs up to a maximum of 0.5% of the value of any net subscription or net redemption of each Class of Shares of each Fund (other than BMO LGM Frontier Markets Fund in respect which the anti-dilution levy may be up to 1.25% of the value of any net subscription or net redemption of each Class of Shares of such Fund and the BMO LGM Greater India Fund in respect which the anti-dilution levy may be up to 1% of the value of any net subscription or net redemption of each Class of Shares of such Fund). Such Anti-Dilution Levy shall be added/deducted from the subscription amount and the redemption proceeds, respectively.
BMO INVESTMENTS II (IRELAND) PLC
36
Notes to the Financial Statements for the year ende d 31 December 2015 cont/d
1. Significant Accounting Policies cont/d
o) Cash and Cash Equivalents Cash comprises current deposits with banks. Cash and cash equivalents are short-term highly liquid investments that are readily convertible to known amounts of cash, are subject to an insignificant risk of changes in value and are held for the purpose of meeting short-term cash commitments rather than for investment or other purposes. Cash and cash equivalents are carried at amortised cost which approximates its fair value.
p) New Accounting Standards
New standards, amendments and interpretations issue d but not effective for the financial year beginning 1 January 2015 and not early adopted IFRS 9, published in July 2014, will replace the existing guidance in IAS 39. It includes revised guidance on the classification and measurement of financial instruments, including a new expected credit loss model for calculating impairment on financial assets, and the new general hedge accounting requirements. It also carries forward the guidance on recognition and de-recognition of financial instruments from IAS 39. IFRS 9 is effective for annual reporting periods beginning on or after 1 January 2018, with early adoption permitted. Based on the initial assessment, this standard is not expected to have a material impact on the Company. This is because the financial instruments currently measured at FVTPL will continue to be measured at FVTPL under IFRS 9 and those currently measured at amortised cost will continue to be measured at amortised cost under IFRS 9. There are no other standards, interpretations or amendments to existing standards that are not yet effective that would be expected to have a significant impact on the Company.
2. Taxation The Directors have been advised that the Company is an investment undertaking as defined in Section 739B of the Taxes Consolidation Act, 1997. The Company will not be liable to Irish tax in respect of its income and gains, other than on the occurrence of a chargeable event. Generally a chargeable event arises on any distribution, redemption, repurchase, cancellation, transfer of shares or on the ending of a “Relevant Period”. A “Relevant Period” being an eight year period beginning with the acquisition of the shares by the Shareholder and each subsequent period of eight years beginning immediately after the preceding relevant Period. A gain on a chargeable event does not arise in respect of:
(i) a shareholder who is not Irish resident and not ordinarily resident in Ireland at the time of the chargeable event, provided the necessary signed statutory declarations are held by the Company; or
(ii) certain exempted Irish resident investors who have provided the Company with the necessary signed statutory declarations; or
(iii) any transactions in relation to shares held in a recognised clearing system as designated by the order of the Revenue Commissioners of Ireland; or
(iv) an exchange of shares representing one Fund for another Fund of the Company; or
(v) an exchange of shares arising on a qualifying amalgamation or reconstruction of the Company with another Company; or
(vi) certain exchanges of shares between spouses and former spouses.
In the absence of an appropriate declaration, the Company will be liable to Irish tax on the occurrence of a chargeable event.
There were no chargeable events during the year under review. The Company is exposed to tax risks with regard to the imposition of taxes in the jurisdictions in which it invests (including but not limited to capital gains tax and withholding tax), and has put in place a process for the identification of its obligations in this regard including periodic updates to its tax database and external, third party validation of this database at regular intervals.
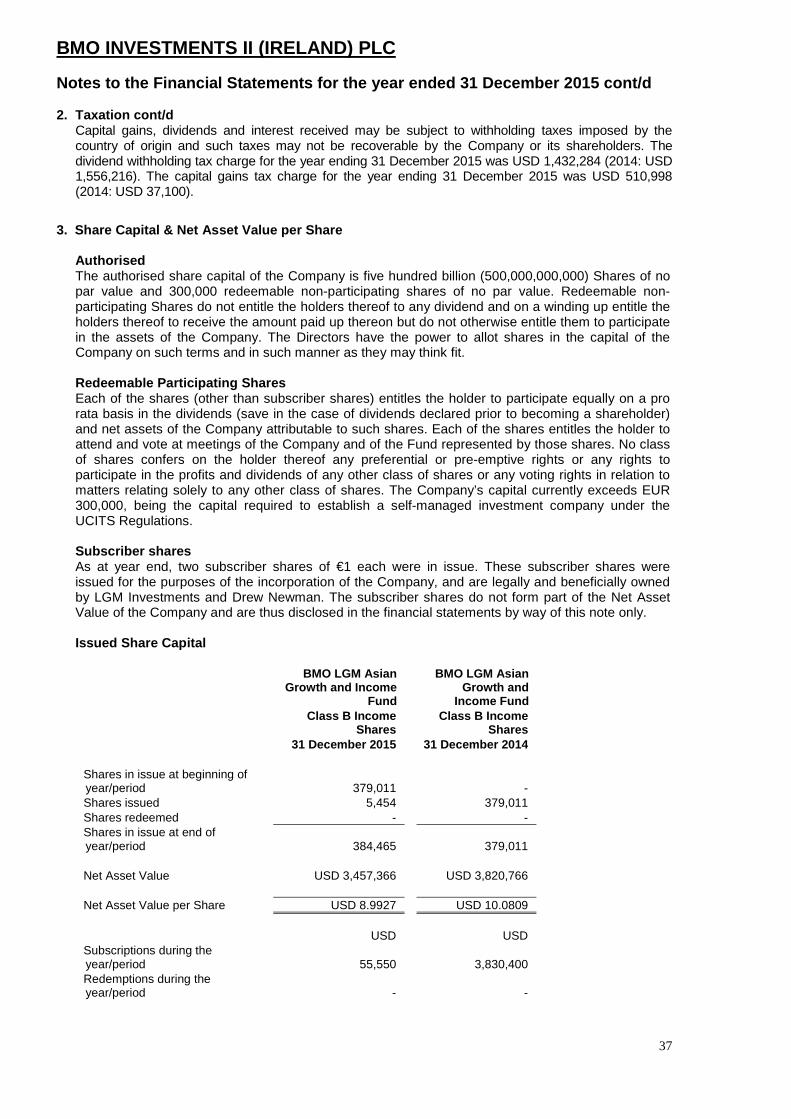
BMO INVESTMENTS II (IRELAND) PLC
37
Notes to the Financial Statements for the year ende d 31 December 2015 cont/d 2. Taxation cont/d
Capital gains, dividends and interest received may be subject to withholding taxes imposed by the country of origin and such taxes may not be recoverable by the Company or its shareholders. The dividend withholding tax charge for the year ending 31 December 2015 was USD 1,432,284 (2014: USD 1,556,216). The capital gains tax charge for the year ending 31 December 2015 was USD 510,998 (2014: USD 37,100).
3. Share Capital & Net Asset Value per Share
Authorised The authorised share capital of the Company is five hundred billion (500,000,000,000) Shares of no par value and 300,000 redeemable non-participating shares of no par value. Redeemable non-participating Shares do not entitle the holders thereof to any dividend and on a winding up entitle the holders thereof to receive the amount paid up thereon but do not otherwise entitle them to participate in the assets of the Company. The Directors have the power to allot shares in the capital of the Company on such terms and in such manner as they may think fit.
Redeemable Participating Shares Each of the shares (other than subscriber shares) entitles the holder to participate equally on a pro rata basis in the dividends (save in the case of dividends declared prior to becoming a shareholder) and net assets of the Company attributable to such shares. Each of the shares entitles the holder to attend and vote at meetings of the Company and of the Fund represented by those shares. No class of shares confers on the holder thereof any preferential or pre-emptive rights or any rights to participate in the profits and dividends of any other class of shares or any voting rights in relation to matters relating solely to any other class of shares. The Company’s capital currently exceeds EUR 300,000, being the capital required to establish a self-managed investment company under the UCITS Regulations.
Subscriber shares As at year end, two subscriber shares of €1 each were in issue. These subscriber shares were issued for the purposes of the incorporation of the Company, and are legally and beneficially owned by LGM Investments and Drew Newman. The subscriber shares do not form part of the Net Asset Value of the Company and are thus disclosed in the financial statements by way of this note only. Issued Share Capital
BMO LGM Asian Growth and Income
Fund
BMO LGM Asian Growth and
Income Fund
Class B Income
Shares Class B Income
Shares
31 December 2015 31 December 2014 Shares in issue at beginning of year/period 379,011
-
Shares issued 5,454 379,011 Shares redeemed - - Shares in issue at end of year/period 384,465
379,011
Net Asset Value USD 3,457,366 USD 3,820,766 Net Asset Value per Share USD 8.9927 USD 10.0809 USD USD Subscriptions during the year/period
55,550
3,830,400
Redemptions during the year/period
-
-
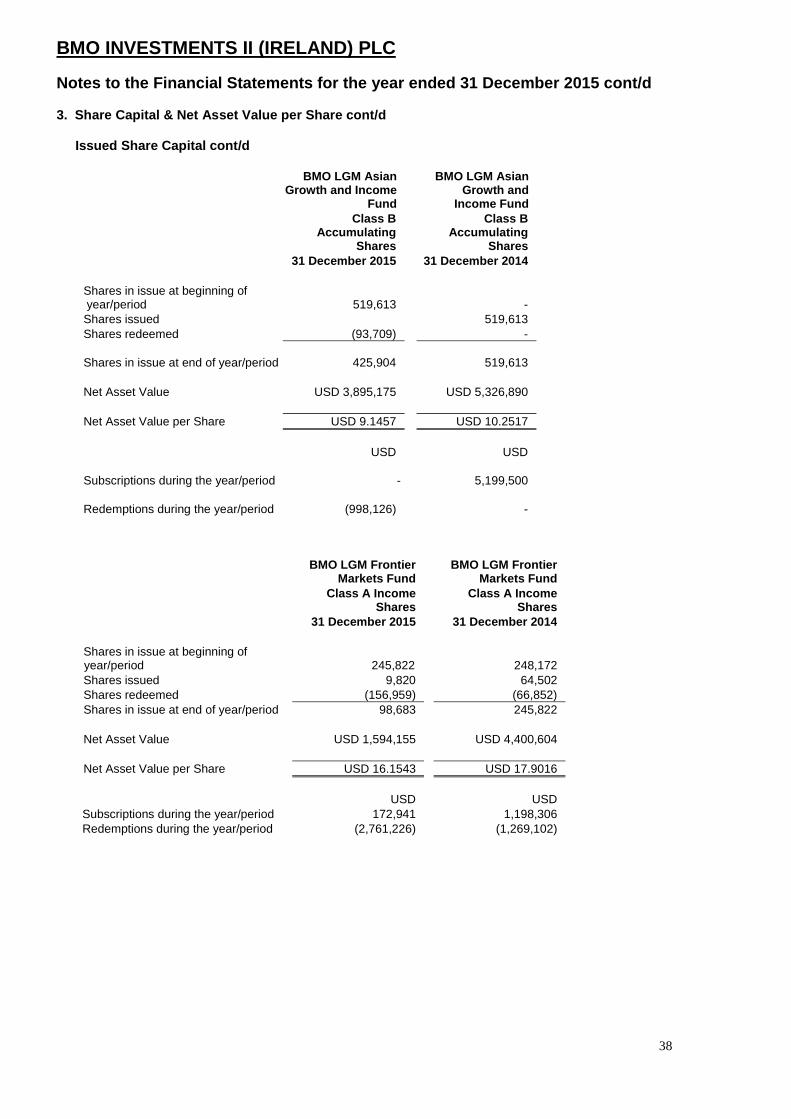
BMO INVESTMENTS II (IRELAND) PLC
38
Notes to the Financial Statements for the year ende d 31 December 2015 cont/d
3. Share Capital & Net Asset Value per Share cont/ d Issued Share Capital cont/d
BMO LGM Asian Growth and Income
Fund
BMO LGM Asian Growth and
Income Fund
Class B Accumulating
Shares
Class B Accumulating
Shares
31 December 2015 31 December 2014 Shares in issue at beginning of year/period 519,613
-
Shares issued 519,613 Shares redeemed (93,709) -
Shares in issue at end of year/period
425,904
519,613
Net Asset Value USD 3,895,175 USD 5,326,890 Net Asset Value per Share USD 9.1457 USD 10.2517 USD USD
Subscriptions during the year/period
-
5,199,500
Redemptions during the year/period
(998,126)
-
BMO LGM Frontier
Markets Fund BMO LGM Frontier
Markets Fund
Class A Income
Shares Class A Income
Shares
31 December 2015 31 December 2014 Shares in issue at beginning of year/period 245,822
248,172
Shares issued 9,820 64,502 Shares redeemed (156,959) (66,852) Shares in issue at end of year/period 98,683 245,822 Net Asset Value USD 1,594,155 USD 4,400,604 Net Asset Value per Share USD 16.1543 USD 17.9016 USD USD Subscriptions during the year/period 172,941 1,198,306 Redemptions during the year/period (2,761,226) (1,269,102)

BMO INVESTMENTS II (IRELAND) PLC
39
Notes to the Financial Statements for the year ende d 31 December 2015 cont/d 3. Share Capital & Net Asset Value per Share cont/ d
Issued Share Capital cont/d
BMO LGM Frontier
Markets Fund BMO LGM Frontier
Markets Fund
Class B Income
Shares Class B Income
Shares
31 December 2015 31 December 2014 Shares in issue at beginning of year/period
2,755,958
800,086
Shares issued 32,950 2,033,040 Shares redeemed (223,651) (77,168) Shares in issue at end of year/period 2,565,257 2,755,958 Net Asset Value USD 36,578,019 USD 43,597,612 Net Asset Value per Share USD 14.2590 USD 15.8194 USD USD Subscriptions during the year/period 500,266 32,565,847 Redemptions during the year/period (3,381,354) (1,441,693)
BMO LGM Frontier
Markets Fund BMO LGM Frontier
Markets Fund
Class B Accumulating
Shares
Class B Accumulating
Shares
31 December 2015 31 December 2014 Shares in issue at beginning of year/period
9,953,533
4,674,597
Shares issued 660,251 7,992,708 Shares redeemed (1,326,850) (2,713,772) Shares in issue at end of year/period 9,286,934 9,953,533 Net Asset Value USD 149,383,201 USD 176,478,383 Net Asset Value per Share USD 16.0853 USD 17.7302 USD USD Subscriptions during the year/period 11,513,289 143,249,520 Redemptions during the year/period (22,894,628) (47,751,249)
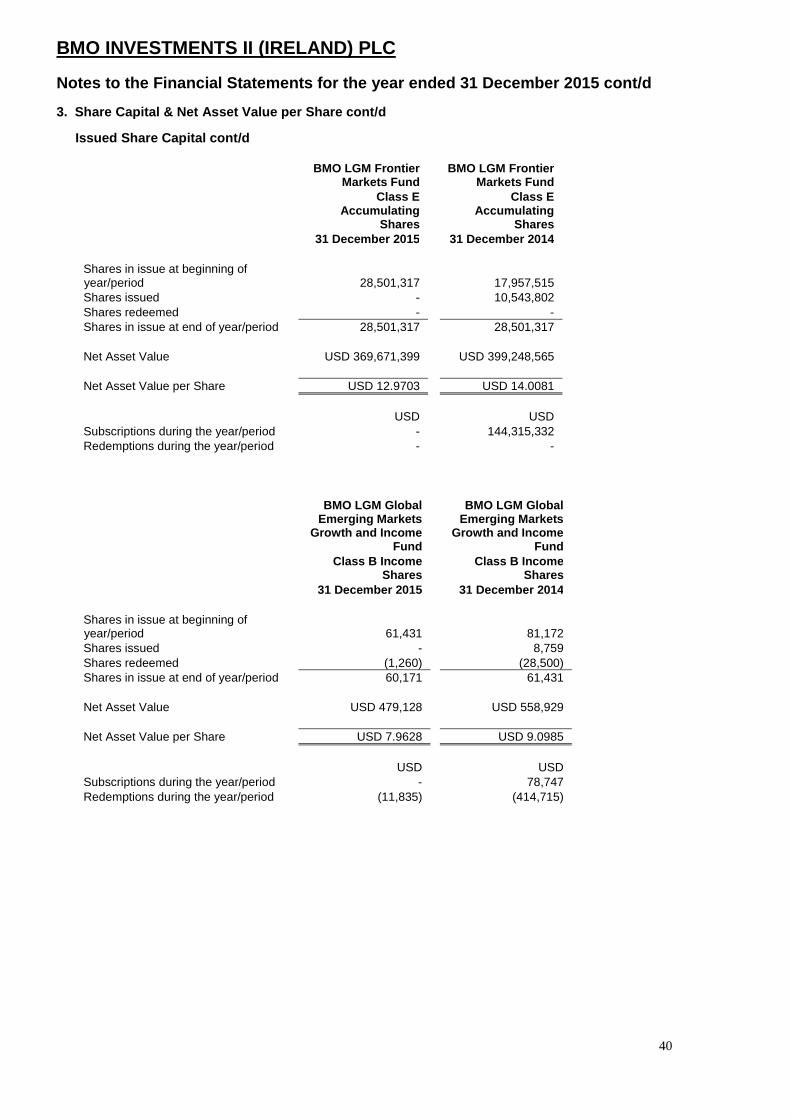
BMO INVESTMENTS II (IRELAND) PLC
40
Notes to the Financial Statements for the year ende d 31 December 2015 cont/d 3. Share Capital & Net Asset Value per Share cont/ d
Issued Share Capital cont/d
BMO LGM Frontier
Markets Fund BMO LGM Frontier
Markets Fund
Class E Accumulating
Shares
Class E Accumulating
Shares
31 December 2015 31 December 2014 Shares in issue at beginning of year/period
28,501,317
17,957,515
Shares issued - 10,543,802 Shares redeemed - - Shares in issue at end of year/period 28,501,317 28,501,317 Net Asset Value USD 369,671,399 USD 399,248,565 Net Asset Value per Share USD 12.9703 USD 14.0081 USD USD Subscriptions during the year/period - 144,315,332 Redemptions during the year/period - -
BMO LGM Global Emerging Markets
Growth and Income Fund
BMO LGM Global Emerging Markets
Growth and Income Fund
Class B Income
Shares Class B Income
Shares
31 December 2015 31 December 2014 Shares in issue at beginning of year/period 61,431
81,172
Shares issued - 8,759 Shares redeemed (1,260) (28,500) Shares in issue at end of year/period 60,171 61,431 Net Asset Value USD 479,128 USD 558,929 Net Asset Value per Share USD 7.9628 USD 9.0985 USD USD Subscriptions during the year/period - 78,747 Redemptions during the year/period (11,835) (414,715)

BMO INVESTMENTS II (IRELAND) PLC
41
Notes to the Financial Statements for the year ende d 31 December 2015 cont/d
3. Share Capital & Net Asset Value per Share cont/ d
Issued Share Capital cont/d
BMO LGM Global Emerging Markets
Growth and Income Fund
BMO LGM Global Emerging Markets
Growth and Income Fund
Class B
Accumulating Shares Class B
Accumulating Shares
31 December 2015 31 December 2014 Shares in issue at beginning of year/period 273,711
603,858
Shares issued 86,468 39,049 Shares redeemed (80,116) (369,196)
Shares in issue at end of year/period 280,063
273,711
Net Asset Value USD 3,265,741 USD 3,611,248 Net Asset Value per Share USD 11.6607 USD 13.1937 USD USD Subscriptions during the year/period 1,163,891 492,320 Redemptions during the year/period (1,033,633) (4,095,335)
BMO LGM Global Emerging Markets
Growth and Income Fund
BMO LGM Global Emerging Markets
Growth and Income Fund
Class E Accumulating
Shares
Class E Accumulating
Shares
31 December 2015 31 December 2014 Shares in issue at beginning of year/period
9,975,000
-
Shares issued 1,760,721 9,975,000 Shares redeemed - - Shares in issue at end of year/period 11,735,721 9,975,000 Net Asset Value USD 118,037,826 USD 112,668,257 Net Asset Value per Share USD 10.0580 USD 11.2951 USD USD Subscriptions during the year/period 20,460,464 99,750,000 Redemptions during the year/period - -

BMO INVESTMENTS II (IRELAND) PLC
42
Notes to the Financial Statements for the year ende d 31 December 2015 cont/d
3. Share Capital & Net Asset Value per Share cont/ d
Issued Share Capital cont/d
BMO LGM Greater
India Fund*
Class B Income
Shares
31 December 2015 Shares in issue at beginning of year -
Shares issued
181,440
Shares redeemed - Shares in issue at end of year 181,440 Net Asset Value USD 1,547,868 Net Asset Value per Share USD 8.5310 USD
Subscriptions during the year
1,793,125
Redemptions during the year -
*The BMO LGM Greater India Fund launched on 20 January 2015.
BMO LGM Greater
India Fund*
Class E Accumulating
Shares**
31 December 2015 Shares in issue at beginning of year - Shares issued 181,120 Shares redeemed - Shares in issue at end of year 181,120 Net Asset Value USD 1,780,472 Net Asset Value per Share USD 9.8303 USD Subscriptions during the year 1,811,203 Redemptions during the year -
*The BMO LGM Greater India Fund launched on 20 January 2015.
**The BMO LGM Greater India Fund Class E Accumulating Shares launched on 25 August 2015.

BMO INVESTMENTS II (IRELAND) PLC
43
Notes to the Financial Statements for the year ende d 31 December 2015 cont/d
3. Share Capital & Net Asset Value per Share cont/ d Issued Share Capital cont/d
BMO LGM Asian Smaller Companies
Fund*
Class B Accumulating
Shares
31 December 2015 Shares in issue at beginning of year - Shares issued 1,026,486 Shares redeemed - Shares in issue at end of year 1,026,486 Net Asset Value USD 9,041,027 Net Asset Value per Share USD 8.8077 USD Subscriptions during the year 10,264,226 Redemptions during the year -
*The BMO LGM Asian Smaller Companies Fund launched on 6 March 2015.
Significant Shareholders The following table details the number of shareholders with significant holdings of at least 20% of the relevant Fund and the percentage of that holding as at 31 December 2015.
Fund Number of significant
shareholders
Total Holding as at 31 Dec
2015
Aggregate Shareholding as a % of the sub fund as
at 31 Dec 2015
Total Holding as at 31
Dec 2014
Aggregate Shareholding as a % of the sub fund as
at 31 Dec 2014
BMO LGM Asian Growth and Income Fund 1 406,292 95.40% 879,011 97.82% BMO LGM Frontier Markets Fund 1 11,454,492 28.46%
11,454,492 27.74%
BMO LGM Global Emerging Markets Growth and Income Fund 1 11,735,721 97.18% 9,975,000 96.75% BMO LGM Greater India Fund* 2 341,458 94.18% - - BMO LGM Asian Smaller Companies Fund** 1 1,026,486 100.00% - -
*The BMO LGM Greater India Fund launched on 20 January 2015.
**The BMO LGM Asian Smaller Companies Fund launched on 6 March 2015
Share Rights The rights attaching to the Shares issued in any class or Fund may, whether or not the Company is being wound up, be varied or abrogated with the consent in writing of the Shareholders of three-quarters of the issued Shares of that Class or Fund, or with the sanction of an ordinary resolution passed at a general meeting of the Shareholders of that Class or Fund.
A resolution in writing signed by all the Shareholders for the time being entitled to attend and vote on such resolution at a general meeting of the Company shall be as valid and effective for all purposes as if the resolution had been passed at a general meeting of the Company duly convened and held and if described as a special resolution shall be deemed to be a special resolution.

BMO INVESTMENTS II (IRELAND) PLC
44
Notes to the Financial Statements for the year ende d 31 December 2015 cont/d 3. Share Capital & Net Asset Value per Share cont/ d
Share Rights cont/d The rights attaching to the Shares shall not, unless otherwise expressly provided by the terms of issue of the shares of that class or a Fund, be deemed to be varied by the creation, allotment or issue of any further Shares ranking pari passu with Shares already in issue. Pursuant to the Prospectus, where the Company deems there to be large net subscriptions and net redemptions and to prevent any adverse effect on the value of the assets of a Fund, the Company may charge an anti-dilution levy for retention as part of the assets of the Fund. The levy will be calculated to cover the dealing costs and to preserve the value of underlying investments of the Fund. Such costs will include any dealing spreads, commissions, transfer taxes and other dealing costs relating to the acquisition or disposal of assets and to preserve the value of the underlying assets of a Fund in the event of receipt for processing of net subscription or net redemption requests. If charged, such anti-dilution levy will be based on estimated actual costs up to a maximum of 0.5% of the value of any net subscription or net redemption of each Class of Shares of each Fund (other than BMO LGM Frontier Markets Fund in respect which the anti-dilution levy may be up to 1.25% of the value of any net subscription or net redemption of each Class of Shares of such Fund and the BMO LGM Greater India Fund in respect which the anti-dilution levy may be up to 1% of the value of any net subscription or net redemption of each Class of Shares of such Fund). Such Anti-Dilution Levy shall be added/deducted from the subscription amount and the redemption proceeds respectively. Redemption of Shares As detailed in the Prospectus, requests for a redemption received prior to the Dealing Deadline for any Dealing Day will be processed on that Dealing Day (save during any period when the calculation of the Net Asset Value is suspended). Requests for a redemption received after the Dealing Deadline for any Dealing Day will be processed on the next Dealing Day, unless the Company, in its absolute discretion, determines otherwise.
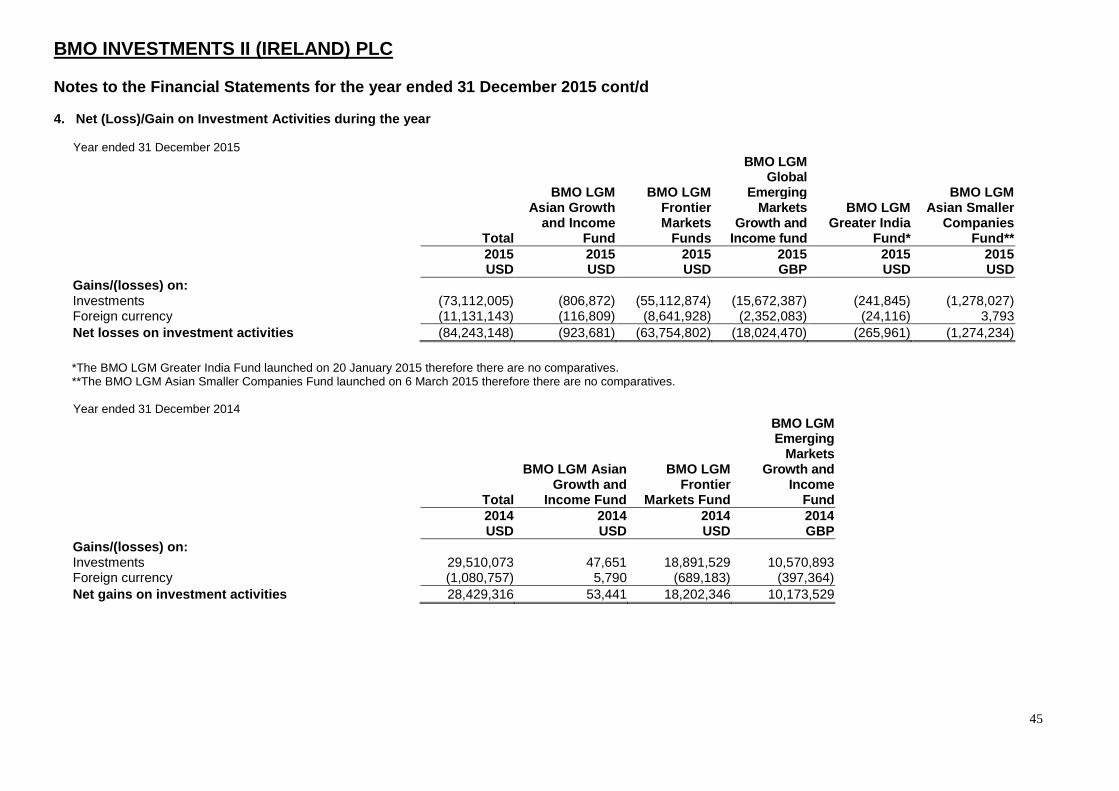
BMO INVESTMENTS II (IRELAND) PLC
45
Notes to the Financial Statements for the year ende d 31 December 2015 cont/d
4. Net (Loss)/Gain on Investment Activities durin g the year
Year ended 31 December 2015
Total
BMO LGM Asian Growth
and Income Fund
BMO LGM Frontier Markets
Funds
BMO LGM Global
Emerging Markets
Growth and Income fund
BMO LGM Greater India
Fund*
BMO LGM Asian Smaller
Companies Fund**
2015 2015 2015 2015 2015 2015 USD USD USD GBP USD USD Gains/(losses) on: Investments (73,112,005) (806,872) (55,112,874) (15,672,387) (241,845) (1,278,027) Foreign currency (11,131,143) (116,809) (8,641,928) (2,352,083) (24,116) 3,793 Net losses on investment activities (84,243,148) (923,681) (63,754,802) (18,024,470) (265,961) (1,274,234)
*The BMO LGM Greater India Fund launched on 20 January 2015 therefore there are no comparatives. **The BMO LGM Asian Smaller Companies Fund launched on 6 March 2015 therefore there are no comparatives.
Year ended 31 December 2014
Total
BMO LGM Asian Growth and
Income Fund
BMO LGM Frontier
Markets Fund
BMO LGM Emerging
Markets Growth and
Income Fund
2014 2014 2014 2014 USD USD USD GBP Gains/(losses) on: Investments 29,510,073 47,651 18,891,529 10,570,893 Foreign currency (1,080,757) 5,790 (689,183) (397,364) Net gains on investment activities 28,429,316 53,441 18,202,346 10,173,529

BMO INVESTMENTS II (IRELAND) PLC
46
Notes to the Financial Statements for the year ende d 31 December 2015 cont/d 5. Fees
Directors' Fees The Articles of Association authorise the Directors to charge a fee for their services at a rate determined by the Directors and which is not expected to exceed EUR 70,000. The Directors may be entitled to special remuneration if called upon to perform any special or extra services to the Company. All Directors will be entitled to reimbursement by the Company of expenses properly incurred in connection with the business of the Company or the discharge of their duties. Directors’ fees charged for the year ended 31 December 2015 were USD 35,814 (31 December 2014: USD 55,382) of which USD 18,660 (31 December 2014: USD 18,700) was outstanding at the year end. Administration Fee The Company pays to the Administrator out of the assets of the Company an annual fee, accrued at each Valuation Point and payable monthly in arrears at a rate which shall not exceed 0.07% per annum of the Net Asset Value of each Fund subject to a minimum annual fee of USD 72,000 (plus VAT, if any thereon), which may be negotiated from time to time. Shareholders will be notified in advance of any proposed increase in the Administrator’s annual fee. The Administrator is also entitled to be repaid out of the assets of the Company all of its reasonable out-of-pocket expenses incurred on behalf of a Fund.
The Administrator’s fees charged during the year were USD 481,742 (31 December 2014: USD 543,931) of which USD 77,272 (31 December 2014: USD 142,971) was payable at year end 31 December 2015. Depositary’s Fees The Depositary is entitled to receive out of the assets of the Company an annual fee, accrued at each Valuation Point and payable monthly in arrears, which shall not exceed 0.02% per annum of the average monthly Net Asset Value of each Fund thereon. The Depositary is also entitled to be repaid all of its disbursements out of the assets of the Funds, including couriers’ fees and telecommunication costs and expenses and the fees, transaction charges and expenses of any sub-custodian appointed by it which shall be at normal commercial rates together with VAT, if any, thereon. The Depositary’s fees charged during the year were USD 2,046,417 (31 December 2014: USD 2,277,186) of which USD 301,198 (31 December 2014: USD 673,867) was payable at year end 31 December 2015.
Investment Manager’s Fees The Investment Manager is entitled to receive the following annual investment management fees, out of the assets of the relevant Fund pursuant to the Prospectus.
Fund Share Class Annual Fee
BMO LGM Asian Growth and Income Fund
Class A Income Shares
Class A Accumulating Shares
Class B Income Shares
Class B Accumulating Shares
Class E Income Shares
Class E Accumulating Shares
Class S Income Shares
Class S Accumulating Shares
Class W Income Shares
Class W Accumulating Shares
1.00%
1.00%
0.75%
0.75%
0.00%
0.00%
0.75%
0.75%
1.50%
1.50%

BMO INVESTMENTS II (IRELAND) PLC
47
Notes to the Financial Statements for the year ende d 31 December 2015 cont/d 5. Fees cont/d
Investment Manager’s Fees cont/d Fund Share Class Annual Fee BMO LGM Frontier Markets Fund** Class A Income Shares
Class A Accumulating Shares
Class B Income Shares
Class B Accumulating Shares
Class E Income Shares
Class E Accumulating Shares
2.00%*
2.00%*
1.50%*
1.50%*
0.00%
0.00%
BMO LGM Global Emerging Markets Growth and Income Fund***
Class A Income Shares
Class A Accumulating Shares
Class B Accumulating Shares
Class B Income Shares
Class D Income Shares
Class D Accumulating Shares
Class E Income Shares
Class E Accumulating Shares
Class F Income Shares
Class F Accumulating Shares
Class S Income Shares
Class S Accumulating Shares
Class W Income Shares
Class W Accumulating Shares
1.00%
1.00%
0.75%
0.75%
0.75%
0.75%
0.00%
0.00%
0.75%
0.75%
0.75%
0.75%
1.50%
1.50%
BMO LGM Greater India Fund ** Class A Income Shares
Class A Accumulating Shares
Class B Income Shares
Class B Accumulating Shares
Class E Income Shares
Class E Accumulating Shares
1.50%
1.50%
1.00%
1.00%
0.00%
0.00%
BMO LGM Asian Smaller Companies Fund***
Class A Income Shares
Class A Accumulating Shares
Class B Income Shares
Class B Accumulating Shares
Class E Income Shares
Class E Accumulating Shares
1.50%
1.50%
1.00%
1.00%
0.00%
0.00%
*For these share classes, in addition to the investment management fees detailed above, the Investment Manager is also entitled to receive annual performance fees out of the assets of the Fund, as disclosed below. **The BMO LGM Greater India Fund launched on 20 January 2015. ***The BMO LGM Asian Smaller Companies Fund launched on 6 March 2015.

BMO INVESTMENTS II (IRELAND) PLC
48
Notes to the Financial Statements for the year ende d 31 December 2015 cont/d
5. Fees cont/d
Investment Manager’s Fees cont/d The Investment Manager’s fees charged during the year were USD 3,243,120 (31 December 2014: USD 4,097,220) of which USD 505,275 (31 December 2014: USD 575,701) was payable at year end 31 December 2015. Governance Service Provider’s Fees KB Associates was appointed by the Company in January 2015 as governance service provider to the Company. The fees charged by KB Associates for services provided since date of appointment and charged to the Company during the financial year ended 31 December 2015 amounted to USD17,914. Auditor Remuneration The remuneration for all work carried out by the statutory audit firm in respect of the financial year 31 December 2015 and 31 December 2014 is as follows:
31 December 2015 31 December 2014 USD USD
Statutory Audit* 34,000 25,411 Total 34,000 25,411
*The fees for statutory audit of the accounts disclosed in the table above are exclusive of VAT and inclusive of out of pocket expenses. There were no fees for other assurance services or other non-audit services during the year ended 31 December 2015 and 31 December 2014. Transaction Costs For the year ended 31 December 2015, and 31 December 2014, the Funds incurred transaction costs as follows:
Fund Name 31 December 2015 31 December
2014 USD USD BMO LGM Asian Growth and Income Fund 25,969 42,957 BMO LGM Frontier Markets Fund 2,375,077 3,909,834 BMO LGM Global Emerging Markets Growth and Income Fund 394,351 512,966 BMO LGM Greater India Fund * 71,903 - BMO LGM Asian Smaller Companies Fund** 29,755 - *The BMO LGM Greater India Fund launched on 20 January 2015. **The BMO LGM Asian Smaller Companies Fund launched on 6 March 2015.
Performance Fee The Investment Manager is entitled to receive a performance fee out of the assets of the Fund in respect of certain of the classes as listed in the table above (the “performance fee”). The performance fee is calculated in respect of each year ending 31 December (or the immediately preceding Business Day if it is not a Business Day) in each year (a “calculation period” with each end date being a “calculation day”). The first calculation period is the period commencing on the business day immediately following the close of the Initial Offer Period and ending on 31 December of the same year. The performance fee accrues on each Dealing Day. The performance fee is normally be payable to the Investment Manager in arrears within 14 days of the end of each calculation period. However, in the case of shares redeemed during a calculation period, the accrued performance fee in respect of those shares are payable within 14 days after the date of repurchase as though the date of redemption was the end of the relevant calculation period. The Depositary verifies the calculation of any performance fee paid to the Investment Manager.

BMO INVESTMENTS II (IRELAND) PLC
49
Notes to the Financial Statements for the year ende d 31 December 2015 cont/d
5. Fees cont/d Performance Fee cont/d
The performance fee is calculated separately for each shareholder as set out below. The performance fee is payable at the rate of 20% of the amount by which the Net Asset Value per share on the calculation day without deduction of any accrued performance fee, exceeds the Benchmark Value. In order for a performance fee to be payable in respect of a calculation period, the Net Asset Value per share on the relevant calculation date, without deduction of any accrued performance fee (the “final net asset value per share”) must exceed the Benchmark Value. Where the Benchmark Value is exceeded, the performance fee payable per share is equal to 20% of the amount by which the final net asset value per share exceeds the Benchmark Value.
For the purpose of calculating the performance fee, the Net Asset Value per Share is calculated without accounting for the performance fee payable in respect of the relevant calculation period. If the determination of the Net Asset Value per Share is suspended on any calculation day, the calculation of the performance fee on that date is based upon the next available determination of the Net Asset Value per share and the amount of any performance fee accrued is adjusted accordingly. Any underperformance of the Benchmark Index in preceding periods is claimed back (cleared) before a fee becomes due in subsequent periods. If the Investment Manager receives a performance fee with respect to the performance of a Fund during a calculation period, and the Fund suffers losses in a subsequent calculation period, the Investment Manager is under no obligation to, and will not, refund such performance fee. If the Investment Management Agreement is terminated during a calculation period, the performance fee in respect of the current calculation period will be calculated and paid as though the date of termination were the end of the relevant calculation period. Upon termination of the Fund the Investment Manager will receive the performance fee for the calculation period in which the termination occurs. If the termination occurs prior to the end of a month, the Investment Manager shall receive the amount of the investment management fee prorated through the effective date of the termination of the Fund, as appropriate. Where performance fees are payable by a Fund, these fees will be based on net realised and net unrealised gains and losses as at the end of each calculation period. As a result, performance fees may be paid on unrealised gains which may subsequently never be realised. The performance fees charged during the year were USD 1,021,720 (31 December 2014: USD 636,439) of which USD 996,057 (31 December 2014: USD Nil) was payable at year end 31 December 2015.

BMO INVESTMENTS II (IRELAND) PLC
50
Notes to the Financial Statements for the year ende d 31 December 2015 cont/d
5. Fees cont/d
Operating expenses
For the year ended 31 December 2015 and 31 December 2014, the Funds incurred the following operating expenses: Year ended 31 December 2015
Company Total USD
BMO LGM
Asian Growth
and Income
Fund USD
BMO LGM Frontier Markets
Fund USD
BMO LGM Global
Emerging Markets Growth
and Income
Fund USD
BMO LGM
Greater India Fund* USD
BMO LGM Asian
Smaller Companies Fund** USD Expenses
Investment Management fees (3,243,120) (62,510) (3,052,296) (33,255) (14,643) (80,416) Performance fees (1,021,720) - (1,021,196) (524) - - Administration fees (481,472) (32,261) (310,696) (108,181) (13,863) (16,471) Depositary fees (2,046,417) (24,624) (1,685,181) (241,741) (71,926) (22,945) Audit Fees (25,614) (153) (19,626) (3,882) (419) (1,534) Directors' fees (35,184) (435) (28,645) (5,574) (73) (457) Legal fees (109,751) (674) (89,135) (19,125) (111) (706) Registration fees (12,379) (42) (4,317) (7,968) (7) (45) Other expenses (140,119) (8,064) (81,285) (37,125) (4,804) (8,841) Operating Expenses (7,115,776) (128,763) (6,292,377) (457,375) (105,846)
(131,415)
*The BMO LGM Greater India Fund launched on 20 January 2015. **The BMO LGM Asian Smaller Companies Fund launched on 6 March 2015.
Year ended 31 December 2014
Company Total USD
BMO LGM Asian
Growth and
Income Fund USD
BMO LGM Frontier Markets
Fund USD
BMO LGM Global
Emerging Markets
Growth and Income Fund
USD Expenses Investment Management fees
(4,097,220) (58,338) (3,973,033) (65,849)
Performance fees (636,439) - (636,439) - Administration fees (543,931) (17,580) (395,914) (130,437) Depositary fees (2,277,186) (26,839) (2,023,608) (226,739) Audit Fees (70,433) (1,313) (69,120) - Directors' fees (55,382) (428) (54,954) - Legal fees (67,397) (488) (57,002) (9,907) Registration fees (8,077) (37) (5,347) (2,693) Other expenses (116,052) (4,994) (96,426) (14,632) Operating Expenses
(7,872,117) (110,017) (7,311,843) (450,257)

BMO INVESTMENTS II (IRELAND) PLC
51
Notes to the Financial Statements for the year ende d 31 December 2015 cont/d 6. Risks Derivatives and Other Financial Instrumen ts
Strategy in Using Financial Instruments The Company is exposed to a variety of financial risks in pursuing its stated investment objective and policy such as: including credit risk, liquidity risk and market risk (which in turn includes currency risk, interest rate risk and price risk). The Company takes exposure to certain of these risks to generate investment returns on its portfolio, although these risks can also potentially result in a reduction in the Company’s net assets. The Investment Manager will use its best endeavours to minimise the potentially adverse effects of these risks on the Company’s performance where it can do so while still managing the investments of the Company in a way that is consistent with the Company’s investment objective and policy.
(a) Market Price Risk Market price risk is defined as risk that the fair value of a financial instrument or its future cash flows will fluctuate because of changes in market prices. The management of market risk is effected through asset allocation and diversification based on the Funds’ investment objective’s as well as the Investment Manager’s developed investment process, which includes in-depth research as well as continuing analysis of invested companies and the macroeconomics of the invested areas.
The maximum risk arising from an investment in a financial instrument is determined by the fair value of the financial instruments, except for short positions in derivatives and securities where the loss may potentially be unlimited. As at 31 December 2015, the overall market exposure is disclosed in the Schedule of Investments on pages 64 to 76. For the purposes of IFRS 7, market price sensitivity is measured using Beta. Market Beta is defined as the "line of least squares" between the relevant Fund's performance and the Index. The following table provides an analysis of the Fund's equity exposure and the Company’s best estimate of the impact on the Net Asset Value of a 5% increase in the value of each Index (detailed below). A 5% decrease would have an equal but opposite effect.
Fund Index
Beta as at 31
December 2015
Monetary Impact on NAV as at
31 December
2015 USD
Beta as at 31
December 2014
Monetary Impact on NAV as at
31 December
2014 USD
BMO LGM Asian Growth and Income Fund
MSCI Asia Pacific ex Japan
Index 0.93 341,893 0.99 452,809
BMO LGM Frontier Markets Fund
50% MSCI Frontier Markets
Index, 50% MSCI Frontier Markets
Index ex. GCC Countries Index 0.93 25,911,045 0.85 26,508,319
BMO LGM Global Emerging Markets Growth and Income Fund
MSCI Emerging Markets Index 0.90 5,480,205 0.95 5,549,826
BMO LGM Greater India Fund* 0.87 144,783 - - BMO LGM Asian Smaller Companies Fund** 0.84 379,723 - -
*The BMO LGM Greater India Fund launched on 20 January 2015. **The BMO LGM Asian Smaller Companies Fund launched on 6 March 2015.

BMO INVESTMENTS II (IRELAND) PLC
52
Notes to the Financial Statements for the year ende d 31 December 2015 cont/d
6. Risks Derivatives and Other Financial Instrumen ts cont/d
(a) Market Price Risk cont/d
Some limitations of sensitivity analysis are: • the models are based on historical data and cannot take account of the fact that future market
price movements, correlations between markets and levels of market liquidity in conditions of market stress may bear no relation to historical patterns;
• the market price risk information is a relative estimate of risk rather than a precise and accurate number;
• the market price information represents a hypothetical outcome and is not intended to be predictive; and
• future market conditions could vary significantly from those experienced in the past.
b) Foreign Currency risk
Currency risk is defined as the risk that the fair value or future cash flows of a financial instrument will fluctuate because of changes in foreign exchange rates. Each Fund is exposed to currency risk as monetary assets and liabilities of a Fund may be denominated in a currency other than the functional currency of the Fund which is its base currency, the US Dollar. Currency risk on non-monetary assets i.e. equities, is included in market price risk.
The fluctuations in the rate of exchange between the currency in which the asset or liability is denominated and the functional currency could result in an appreciation or depreciation in the fair value of that asset. The Investment Manager may attempt to mitigate this risk by using financial derivative instruments. In accordance with each Fund’s investment policy, the Investment Manager monitors each Fund’s currency exposures on a daily basis and reports monthly to the relevant designated person and to the Board of Directors, which reviews the information provided by the Investment Manager on any significant exposures at its periodic meetings.
The following table sets out each Fund’s total exposure to foreign currency risk at last traded market prices as at 31 December 2015 and 31 December 2014: BMO LGM Asian Growth and Income Fund 31 December 2015 31 December 2014 Net Monetary Assets Net Monetary Assets USD USD Hong Kong Dollar 58 2,043 Indonesian Rupiah - 1,557 Malaysian Ringgit 70 1,221 Singapore Dollar - 4,596 South Korea Won - 9,094 Taiwan Dollar - 10,280 Vietnamese Dong 3,150
3,278 28,791

BMO INVESTMENTS II (IRELAND) PLC
53
Notes to the Financial Statements for the year ende d 31 December 2015 cont/d
6. Risks Derivatives and Other Financial Instrumen ts cont/d
b) Foreign Currency Risk cont/d
BMO LGM Frontier Markets Fund 31 December 201 5 31 December 2014 Net Monetary Assets Net Monetary Assets USD USD Bangladeshi Taka - 26,964 CFA Franc BCEAO (584,092) 684 Costa Rican Colon 82 22 Croatian Kuna 11,340 7,588 Egyptian Pound 921,393 645,343 Kenyan Shilling - 225,150 Mauritian Rupee - 199,183 Nigerian Naira 329 - Omani Rial 1,987,976 - Peruvian Nuevo Sol - 69 UAE Dirham (210,481) - Vietnamese Dong - 3,073,806
2,126,547 4,178,809 BMO LGM Global Emerging Markets Growth and Income Fund
31 December 2015 31 December 2014 Net Monetary Assets Net Monetary Assets USD USD Brazilian Real (58,394) 8,558 Chilean Peso (135,040) - Hong Kong Dollar (18,531) - Indonesia Rupiah (302,046) - Malaysian Ringgit (69,856) - Mexican Peso (652,540) - Philippine Peso (81,595) - Singapore Dollar (379,347) 28,737 South African Rand (90,277) 289 South Korea Won (132,910) 36,970 Taiwan New Dollar - 550 Thai Baht (57,227) - Vietnamese Dong 183 111
(1,977,580) 75,215
BMO LGM Asian Smaller Companies Fun d* 31 December 2015 31 December 201 4 Net Monetary Assets Net Monetary Assets USD USD Hong Kong Dollar 5,841 - Singapore Dollar 692 - Taiwan New Dollar 4,131 -
10,664 - *The BMO LGM Asian Smaller Companies Fund launched on 6 March 2015
At 31 December 2015, had the exchange rate between the US Dollar and other currencies increased or decreased by 1% with all other variables held constant, the increase or decrease in the value of the net assets attributable to holders of redeemable participating shares would be as follows: BMO LGM Asian Growth and Income Fund: USD 33, BMO LGM Frontier Markets Fund: USD 21,265, BMO LGM Global Emerging Markets Growth and Income Fund USD (19,778), and BMO LGM Asian Smaller Companies Fund USD 107.

BMO INVESTMENTS II (IRELAND) PLC
54
Notes to the Financial Statements for the year ende d 31 December 2015 cont/d
6. Risks Derivatives and Other Financial Instrumen ts cont/d
b) Foreign Currency Risk cont/d At 31 December 2014, had the exchange rate between the US Dollar and other currencies increased or decreased by 1% with all other variables held constant, the increase or decrease in the value of the net assets attributable to holders of redeemable participating shares would be as follows: BMO LGM Asian Growth and Income Fund: USD 288, BMO LGM Frontier Markets Fund: USD 41,788 and BMO LGM Global Emerging Markets Growth and Income Fund USD 752.
A majority of the monetary assets and liabilities of BMO LGM Greater India Fund were denominated in USD and therefore is not exposed to foreign currency risk as at 31 December 2015
c) Interest Rate Risk
The majority of the Company’s financial assets and financial liabilities are non-interest bearing and any excess cash and cash equivalents are invested at short-term market interest rates. There was no significant exposure to interest rate risk at 31 December 2015 or 31 December 2014.
d) Credit Risk
Credit risk is defined as the risk that one party to a financial instrument will cause a financial loss for the other party by failing to discharge an obligation. Investments in equity securities are not exposed to credit risk except for exposure to custody risk as detailed in note 6 (g). The Company has counterparty risk in relation to transactions with brokers, banks and other third parties if the counterparty fails to complete any transaction to which the Company is a party. Risk relating to unsettled transactions is considered small due to short settlement period involved and the high credit quality of the brokers used.
The Funds are exposed to credit risk on participation notes ("p-notes"). This risk is mitigated through the careful evaluation of counterparties across several key areas such as credit rating, strength and depth of the organisation and the ability to provide the desired exposure. The counterparty risk on participation notes held at 31 December 2015 and 31 December 2014 for the relevant Funds are detailed in the below table.
31 December 2015:
BMO LGM Asian
Growth and Income
Fund
BMO LGM Frontier Markets
Fund
BMO LGM Global
Emerging Markets
Growth and Income
Fund
BMO LGM Greater
India Fund*
BMO LGM Asian
Smaller Companies
Fund**
% of NAV % of NAV % of NAV % of NAV % of NAV Citigroup 7.35 - 0.16 - 8.23 Deutsche Bank AG 9.26 - - - 9.76 HSBC - 4.33 - - - Merrill Lynch - 1.30 - - - Morgan Stanley - - - - 3.47 *The BMO LGM Greater India Fund launched on 20 January 2015.
**The BMO LGM Asian Smaller Companies Fund launched on 6 March 2015. 31 December 2014:
BMO LGM
Asian Growth and Income
Fund
BMO LGM Frontier Markets
Fund
BMO LGM Global Emerging Markets Growth
and Income Fund
% of NAV % of NAV % of NAV Citigroup 9.83 - 0.11 Deutsche Bank AG 10.39 - - HSBC - 4.84 - Merrill Lynch - 2.65 -

BMO INVESTMENTS II (IRELAND) PLC
55
Notes to the Financial Statements for the year ende d 31 December 2015 cont/d
6. Risks Derivatives and Other Financial Instrumen ts cont/d d) Credit Risk cont/d
The long-term credit ratings of the counterparties as at 31 December 2015, as rated by Moody’s rating agency are as follows: Citigroup Baa1; Deutsche Bank AG A2, HSBC Aa2; Merrill Lynch Baa1; Morgan Stanley A3 (31 December 2014: Citigroup A2; Deutsche Bank AG A; HSBC Aa3; Merrill Lynch A). The long term credit rating of State Street Bank and Trust Company as at 31 December 2015 was Aa2 as rated by Moody’s rating agency (31 December 2014: A1). All cash at bank balances and bank overdrafts are held by State Street Bank, London which had a credit rating of AA at the year end (31 December 2014: A+). The Investment Manager uses forward foreign currency exchange contracts to hedge over-valued foreign currency exposure. These have a similar credit or default risk to a regular currency spot transaction. Forward foreign currency exchange contracts are ‘Over the Counter’ traded and therefore have counterparty risk which arises from the potential failure of counterparties to meet their obligations under the contract or arrangement. Forward contracts also carry roll risk, which is the risk that when a forward contract expires, a new forward to replace the expired one cannot be put into place at the same cost or on the same hedge basis. This may occur due to changes in market liquidity or interest rates, resulting in a potential slippage or loss in the hedge position due to the contract expiration and roll. The Company has entered into forward foreign currency exchange contracts in respect of the BMO LGM Global Emerging Markets Growth and Income Fund during the year. As at 31 December 2015, the Fund had open forward foreign exchange contracts with State Street Bank and Trust Company as the counterparty. The credit rating of State Street Bank and Trust Company is Aa1 as at 31 December 2015. The forward foreign currency exchange contracts outstanding at the year-end are listed in the relevant Fund’s Schedule of Investments. As at 31 December 2015, there was no cash collateral or any other security held or pledged as collateral by the Company.
e) Liquidity Risk
Liquidity risk is the risk that an entity will encounter difficulty in meeting obligations associated with financial liabilities as they fall due. Not all securities or instruments invested in by the Funds will be listed or rated and consequently liquidity may be low. Moreover, the accumulation and disposal of holdings in some investments may be time consuming and may need to be conducted at unfavourable prices. The Funds may also encounter difficulties in disposing of assets at their fair price due to adverse market conditions leading to limited liquidity. Specific liquidity reports are sent to the Investment Manager for review on a monthly basis but on a daily basis, the Investment Manager also reviews and monitors the investments of the Funds, including their liquidity status. Liquidity is currently managed within each Fund by investing in relatively liquid securities within the asset class. All investments made by a Fund must be in transferable securities in accordance with the UCITS regulations and the Central Bank UCITS Regulations. If a Fund is established which allows investment in markets which may not have the same degree of liquidity as those in which the other Funds invest, the requirement of the UCITS Regulations for stress testing will be addressed by reviewing liquidity against average market trading volumes over extended periods of time, as well as under current conditions. Liquidity issues will be reported to the relevant designated person as part of the Investment Manager’s compliance reporting.
The Prospectus provides for daily creation and cancellation of shares and, therefore, the Funds are exposed to daily cash redemptions of redeemable participating shares at any time. The Funds invest the majority of their assets in securities and other instruments that are traded on an active market and which are considered to be liquid as they can be readily disposed of in an event that cash needs to be raised to meet redemptions or to pay expenses.

BMO INVESTMENTS II (IRELAND) PLC
56
Notes to the Financial Statements for the year ende d 31 December 2015 cont/d
6. Risks Derivatives and Other Financial Instrumen ts cont/d
e) Liquidity Risk cont/d
As at 31 December 2015 and 31 December 2014, each Fund’s financial liabilities, including net assets attributable to redeemable participating shareholders, are all due in less than one month, with the exception of directors' fees, audit fees, legal fees, taxation fees and other fees which fall due between three months to one year. None of the Funds held forward currency contracts at 31 December 2014.
As at 31 December 2015 BMO LGM Global Emerging Markets Growth and Income F und
Currency Less than 3 months Inflows…………………….. USD 428,997
Outflows…………………... USD 429,976
f) Fair Value Hierarchy
The Company is required to classify fair value measurements using a fair value hierarchy that reflects the significance of the inputs used in making the measurements. The amendment to the standard requires an entity to provide a quantitative and qualitative analysis of those instruments recognised at fair value based on a three-level measurement hierarchy. The fair value hierarchy has the following levels:
• Level 1 - Quoted prices (unadjusted) in active markets for identical assets or liabilities. • Level 2 - Inputs other than quoted prices included within level 1 that are observable for the asset
or liability, either directly (that is, as prices) or indirectly (that is, derived from prices). • Level 3 - Inputs for the asset or liability that are not based on observable market data (that is,
unobservable inputs).
Furthermore, for those instruments which have significant unobservable inputs (Level 3), the amendment requires disclosures on the transfers into and out of Level 3, a reconciliation of the opening and closing balances, total gains and losses for the period split between those recognised in the Statement of Comprehensive Income and recognised through the statement of total recognised gains and losses, purchases, sales issues and settlements. The level in the fair value hierarchy within which the fair value measurement is categorised in its entirety is determined on the basis of the lowest level input that is significant to the fair value measurement in its entirety.
For this purpose, the significance of an input is assessed against the fair value measurement in its entirety. If a fair value measurement uses observable inputs that require significant adjustment based on unobservable inputs, that measurement is a Level 3 measurement. Assessing the significance of a particular input to the fair value measurement in its entirety requires judgement, considering factors specific to the asset or liability.
The determination of what constitutes ‘observable’ requires significant judgement by the Funds. The Funds consider observable data to be that market data that is readily available, regularly distributed or updated, reliable and verifiable, not proprietary, and provided by independent sources that are actively involved in the relevant market.
The following tables analyse within the fair value hierarchy the Funds’ financial assets and financial liabilities measured at fair value at 31 December 2015 and 31 December 2014.
December 2015:
BMO LGM Asian Growth and Income Fund Level 1 Level 2 Level 3 Total USD USD USD USD Financial Assets: Equities 4,982,529 149,433 - 5,131,962 Participation notes - 2,001,758 - 2,001,758 4,982,529 2,151,191 - 7,133,720

BMO INVESTMENTS II (IRELAND) PLC
57
Notes to the Financial Statements for the year ende d 31 December 2015 cont/d
6. Risks Derivatives and Other Financial Instrumen ts cont/d
f) Fair Value Hierarchy cont/d
BMO LGM Frontier Markets Fund Level 1 Level 2 Level 3 Total USD USD USD USD Financial Assets: Equities 458,089,281 57,959,957 - 516,049,238 Participation notes - 31,353,290 - 31,353,290 458,089,281 89,313,247 - 547,402,528
BMO LGM Global Emerging Markets Growth and Income Fund Level 1 Level 2 Level 3 Total USD USD USD USD Financial Assets and Liabilities: Equities 113,424,745 4,821,963 - 118,246,708 Participation notes - 198,363 - 198,363 Forwards - (979) - (979) - 5,019,347 - 118,444,092
BMO LGM Greater India Fund* Level 1 Level 2 Level 3 Total USD USD USD USD Financial Assets: Equities 3,198,974 - - 3,198,974 3,198,974 - - 3,198,974 *The BMO LGM Greater India Fund launched on 20 January 2015
BMO LGM Asian Smaller Companies Fund* Level 1 Level 2 Level 3 Total USD USD USD USD Financial Assets: Equities 5,886,514 - - 5,886,514 Participation notes - 1,940,436 - 1,940,436 5,886,514 1,940,436 - 7,826,950 *The BMO LGM Asian Smaller Companies Fund launched on 6 March 2015
December 2014:
BMO LGM Asian Growth and Income Fund Level 1 Level 2 Level 3 Total USD USD USD USD Financial Assets: Equities 6,959,911 - - 6,959,911 Participation notes - 1,849,693 - 1,849,693 6,959,911 1,849,693 - 8,809,604
BMO LGM Frontier Markets Fund Level 1 Level 2 Level 3 Total USD USD USD USD Financial Assets: Equities 524,146,317 37,462,801 - 561,609,118 Participation notes - 46,734,509 - 46,734,509 524,146,317 84,197,310 - 608,343,627

BMO INVESTMENTS II (IRELAND) PLC
58
Notes to the Financial Statements for the year ende d 31 December 2015 cont/d
6. Risks Derivatives and Other Financial Instrumen ts cont/d f) Fair Value Hierarchy cont/d
BMO LGM Global Emerging Markets Growth and Income Fund Level 1 Level 2 Level 3 Total USD USD USD USD Financial Assets: Equities 110,795,712 2,761,865 - 113,557,577 Participation notes - 128,845 - 128,845 110,795,712 2,890,710 - 113,686,422
Investments whose values are based on quoted market prices in active markets, and therefore classified within level 1, are for the Company, predominantly listed equities.
Financial instruments that are not listed but are valued based on quoted market prices, dealer quotations or alternative pricing sources supported by observable inputs are classified within level 2. For the Company at the year end these are Participation Notes on the BMO LGM Global Emerging Markets Growth and Income Fund, the BMO LGM Asian Growth and Income Fund, BMO LGM Frontier Markets Fund and the BMO LGM Asian Smaller Companies Fund. For the BMO LGM Frontier Markets Fund, BMO LGM Asian Growth and Income Fund and BMO LGM Global Emerging Markets Growth and Income Fund positions held with Vietnam Dairy Products JSC were fair valued in accordance with the Prospectus by the Directors of the Company (in consultation with the Investment Manager) and with the approval of the Depositary. Participation Notes are identified in the relevant Schedules of Investments.
There were no transfers between levels of the fair value hierarchy during the year ended 31 December 2015.
There were no level 3 securities held on the Funds as at 31 December 2015 or 31 December 2014.
For each class of assets and liabilities not measured at fair value in the Statement of Financial Position but for which fair value is disclosed, IFRS 13 requires the Company to disclose the level within the fair value hierarchy which the fair value measurement would be categorised and a description of the valuation technique and inputs used in the technique. As this is a new requirement of IFRS 13 no comparative disclosure is required in the year of initial application. Assets and liabilities not carried at fair value are carried at amortised cost; their carrying values are a reasonable approximation of fair value.
Cash and cash equivalents include deposits held with banks and other short-term investments in an active market and they are categorised as Level 2.
Receivable for investments sold and other receivables include the contractual amounts for settlement of trades and other obligations due to the Company. Payable for investments sold and other payables represent the contractual amounts and obligations due by the Company for settlement of trades and expenses. All receivable and payable balances are categorised as Level 2. The puttable value of redeemable shares is calculated based on the net difference between total assets and all other liabilities of each Fund within the Company in accordance with the Prospectus. A demand feature is attached to these shares, as they are redeemable at the holders’ option and can be put back to the Funds at any dealing date for cash equal to a proportionate share of the relevant Fund’s net asset value attributable to the share class. The fair value is based on the amount payable on demand. As such, Level 2 is deemed to be the most appropriate categorisation for net assets attributable to holders of redeemable shares.
g) Custody Risk
The Company’s Depositary is State Street Custodial Services (Ireland) Limited (“Depositary”). Substantially all of the assets and cash of the Funds are held within the custodial network of the Depositary.
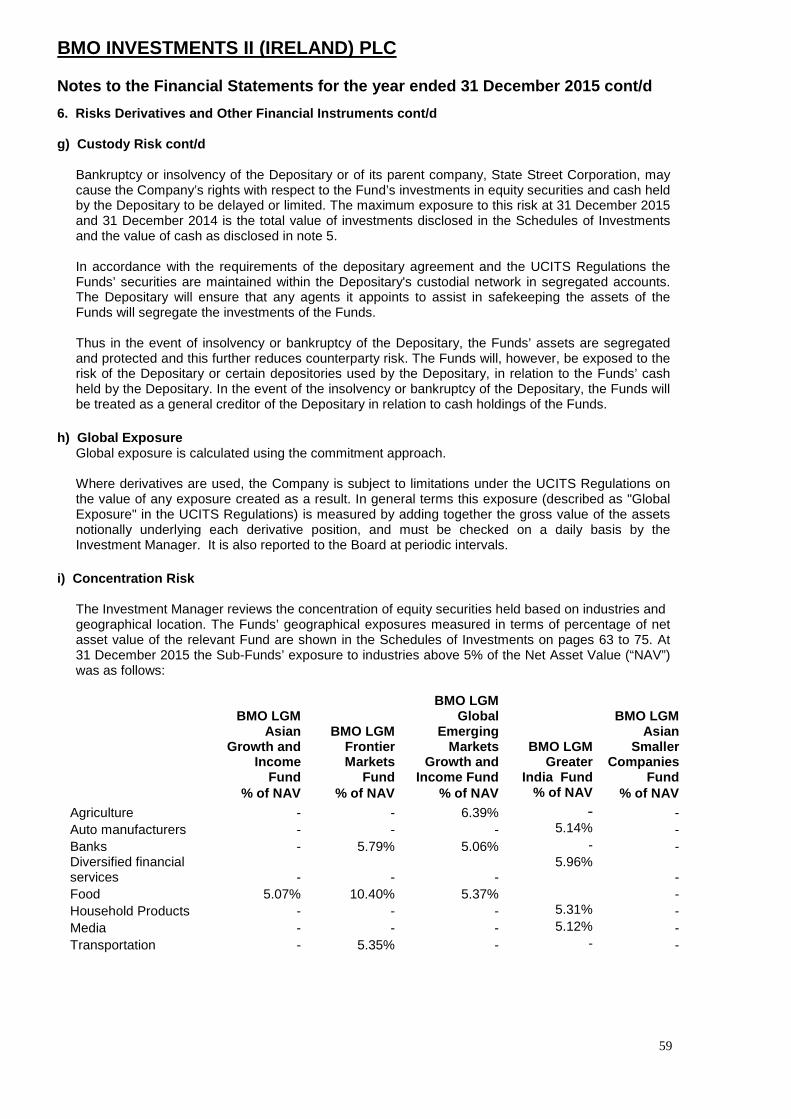
BMO INVESTMENTS II (IRELAND) PLC
59
Notes to the Financial Statements for the year ende d 31 December 2015 cont/d
6. Risks Derivatives and Other Financial Instrumen ts cont/d g) Custody Risk cont/d
Bankruptcy or insolvency of the Depositary or of its parent company, State Street Corporation, may cause the Company’s rights with respect to the Fund’s investments in equity securities and cash held by the Depositary to be delayed or limited. The maximum exposure to this risk at 31 December 2015 and 31 December 2014 is the total value of investments disclosed in the Schedules of Investments and the value of cash as disclosed in note 5.
In accordance with the requirements of the depositary agreement and the UCITS Regulations the Funds’ securities are maintained within the Depositary's custodial network in segregated accounts. The Depositary will ensure that any agents it appoints to assist in safekeeping the assets of the Funds will segregate the investments of the Funds. Thus in the event of insolvency or bankruptcy of the Depositary, the Funds’ assets are segregated and protected and this further reduces counterparty risk. The Funds will, however, be exposed to the risk of the Depositary or certain depositories used by the Depositary, in relation to the Funds’ cash held by the Depositary. In the event of the insolvency or bankruptcy of the Depositary, the Funds will be treated as a general creditor of the Depositary in relation to cash holdings of the Funds.
h) Global Exposure Global exposure is calculated using the commitment approach. Where derivatives are used, the Company is subject to limitations under the UCITS Regulations on the value of any exposure created as a result. In general terms this exposure (described as "Global Exposure" in the UCITS Regulations) is measured by adding together the gross value of the assets notionally underlying each derivative position, and must be checked on a daily basis by the Investment Manager. It is also reported to the Board at periodic intervals.
i) Concentration Risk
The Investment Manager reviews the concentration of equity securities held based on industries and geographical location. The Funds’ geographical exposures measured in terms of percentage of net asset value of the relevant Fund are shown in the Schedules of Investments on pages 63 to 75. At 31 December 2015 the Sub-Funds’ exposure to industries above 5% of the Net Asset Value (“NAV”) was as follows:
BMO LGM Asian
Growth and Income
Fund
BMO LGM Frontier Markets
Fund
BMO LGM Global
Emerging Markets
Growth and Income Fund
BMO LGM Greater
India Fund
BMO LGM Asian
Smaller Companies
Fund % of NAV % of NAV % of NAV % of NAV % of NAV
Agriculture - - 6.39% - - Auto manufacturers - - - 5.14% - Banks - 5.79% 5.06% - - Diversified financial services - - -
5.96% -
Food 5.07% 10.40% 5.37% - Household Products - - - 5.31% - Media - - - 5.12% - Transportation - 5.35% - - -

BMO INVESTMENTS II (IRELAND) PLC
60
Notes to the Financial Statements for the year ende d 31 December 2015 cont/d
6. Risks Derivatives and Other Financial Instrumen ts cont/d i) Concentration Risk cont/d
At 31 December 2014 the Sub-Funds’ exposure to industries above 5% of the Net Asset Value (“NAV”) was as follows:
BMO LGM Asian
Growth and Income
Fund
BMO LGM Frontier Markets
Fund
BMO LGM Global
Emerging Markets
Growth and Income Fund
% of NAV % of NAV % of NAV Agriculture - - 5.59% Food 5.11% 5.66% 5.30%
j) Leverage Risk
It is not the intention of the Company that the Funds be leveraged for investment or efficient portfolio management purposes. Any leverage resulting from the use of financial derivative instruments and efficient portfolio management techniques are in accordance with the requirements of the Central Bank and will not exceed 100% of the net asset value of the relevant Fund.
k) Legal and Regulatory Risk
Legal and regulatory changes could occur during the duration of the Company which may adversely affect the Company.
7. Cash & Cash Equivalents
All cash & cash equivalents are held with State Street Bank and Trust Company. The State Street Time Deposit is an overnight facility. The long-term credit rating of State Street Bank and Trust Company as at 31 December 2015 was Aa2 as rated by Moody’s rating agency (31 December 2014: A1).
8. Offsetting and Master Netting Agreements
There is no master netting arrangement in place. 9. Related Party Disclosures
Page 3 discloses the Company’s Directors and LGM Investments Limited as the Investment Manager and Distributor of the Company. Amounts earned by the Directors and amounts payable to the Directors are disclosed in the Statement of Comprehensive Income and Statement of Financial Position.
Transactions with entities with significant influen ce As at 31 December 2015, Pyrford International Limited held 406,292 BMO LGM Asian Growth and Income Fund B Accumulating Class shares (31 December 2014: 500,000). Pyrford International Limited and LGM Investments Limited are wholly owned subsidiaries of Bank of Montreal and are therefore deemed to be related parties. Performance fees paid to the Investment Manager are disclosed in the Statement of Comprehensive Income and Statement of Financial Position.
Transactions with key management personnel The interests of the Directors in related parties are as follows:
Diane Seymour-Williams, and Barry McInerney are Directors of the Investment Manager and Distributor, LGM Investments Limited and, shall be deemed to be interested in any contract entered into by the Company with LGM Investments Limited.

BMO INVESTMENTS II (IRELAND) PLC
61
Notes to the Financial Statements for the year ende d 31 December 2015 cont/d 9. Related Party Disclosures cont/d
Transactions with Key Management Personnel cont/d The Investment Manager charged USD 3,243,120 (December 2014: USD 4,097,220) during the year of which USD 505,275 (December 2014: USD 575,701) was payable at year end. Diane Seymour-Williams and connected parties have subscribed for shares in the BMO LGM Frontier Markets Fund Class B Accumulating Shares under the nominee Smith & Williamson Nominees Limited. At 31 December 2015 they held 5,720 shares (31 December 2014: 24,669 shares) and 2,030 shares, respectively, (31 December 2014: 3,006 shares).
10. Efficient Portfolio Management
The Company may, on behalf of each Fund, engage in techniques and instruments (such as in financial derivative instruments, repurchase/reverse repurchase and stocklending agreements and when issued/delayed delivery securities) for the purposes of efficient portfolio management, including as part of a cash management strategy and reduction of risk or cost or the generation of additional capital or income for each Fund with an appropriate level of risk, taking into account the risk profile of each Fund and the general provisions of the UCITS Directive. Such transactions may include foreign exchange transactions which alter the currency characteristics of transferable securities held by each Fund. There were no such derivatives held during the year ended 31 December 2015 or 31 December 2014.
11. Distributions
The following distributions were declared by the funds during the year ended 31 December 2015. The distributions relating to accumulating share classes were reinvested.
BMO LGM Frontier Markets Fund
Value Per
Share Ex-date
US$ US$
Class B Accumulating Shares* 798,952 0.08 30 Jan 2015 Class A Income Shares 7,635 0.03 30 Jan 2015 Class B Income Shares 333,481 0.12 30 Jan 2015 Class E Accumulating Shares* 12,823,530 0.45 30 Jan 2015 Total
13,963,598
BMO LGM Global E merging Markets Growth and Income Fund
Value
Per Share
US$ US$ Class E Accumulating Shares* 2,627,729 0.26 30 Jan 2015 Class B Income Shares 5,592 0.09 30 Jan 2015 Class B Accumulating Shares* 36,661 0.13 30 Jan 2015 Total
2,669,982
BMO LGM Asian Growth and Income Fund
Value
Per Share
US$ US$
Class B Income Shares 219 0.00 30 Jan 2015 Class B Accumulating Shares* 57,684 0.11 30 Jan 2015 Total
57,903
*Dividends declared to accumulating shares were automatically re-invested to the Fund.

BMO INVESTMENTS II (IRELAND) PLC
62
Notes to the Financial Statements for the year ende d 31 December 2015 cont/d
12. Significant Events During the Year KB Associates were appointed as governance service provider from 1 January 2015. The BMO LGM Greater India Fund was launched on 20 January 2015. The BMO LGM Asian Smaller Companies Fund was launched on 6 March 2015. The revised Memorandum and Articles of Association of the Company were amended by special resolution of the members on 28 May 2015. The BMO LGM Greater India Fund Class E Accumulating Shares was launched on 25 August 2015. A revised Prospectus was noted by the Central Bank on 9 December 2015. Among the main changes were the creation of Class S and Class W share classes of the BMO LGM Asian Growth and Income Fund and BMO LGM Global Emerging Markets Growth and Income Fund, updates to reflect the introduction of the Central Bank’s UCITS Regulations and the restructuring of the Central Bank’s UCITS guidance, updates to refer to the Companies Act 2014 and updates to the Irish taxation disclosure to reflect recent changes in Irish tax legislation.
13. Significant Events Since Year End
The European Union (Undertakings for Collective Investment and Transferable Securities) (Amendment) Regulations 2016 became effective on 18 March 2016. Effective 1 April 2016, the following Directors resigned as Directors of the Company: Anthony Cousins, Paul McNaughton and Diane Seymour-Williams. Effective the same date, the following appointments were made as Directors of the Company: Liam Miley, Hugh Moir and Lars Nielsen.
There were no other significant events affecting the Company since the year end.
14. Comparative Figures
The comparative figures are for the financial period from 30 September 2013 to 31 December 2014.
15. Approval of the Financial Statements
The Financial Statements were approved by the Board of Directors on 19 April 2016.
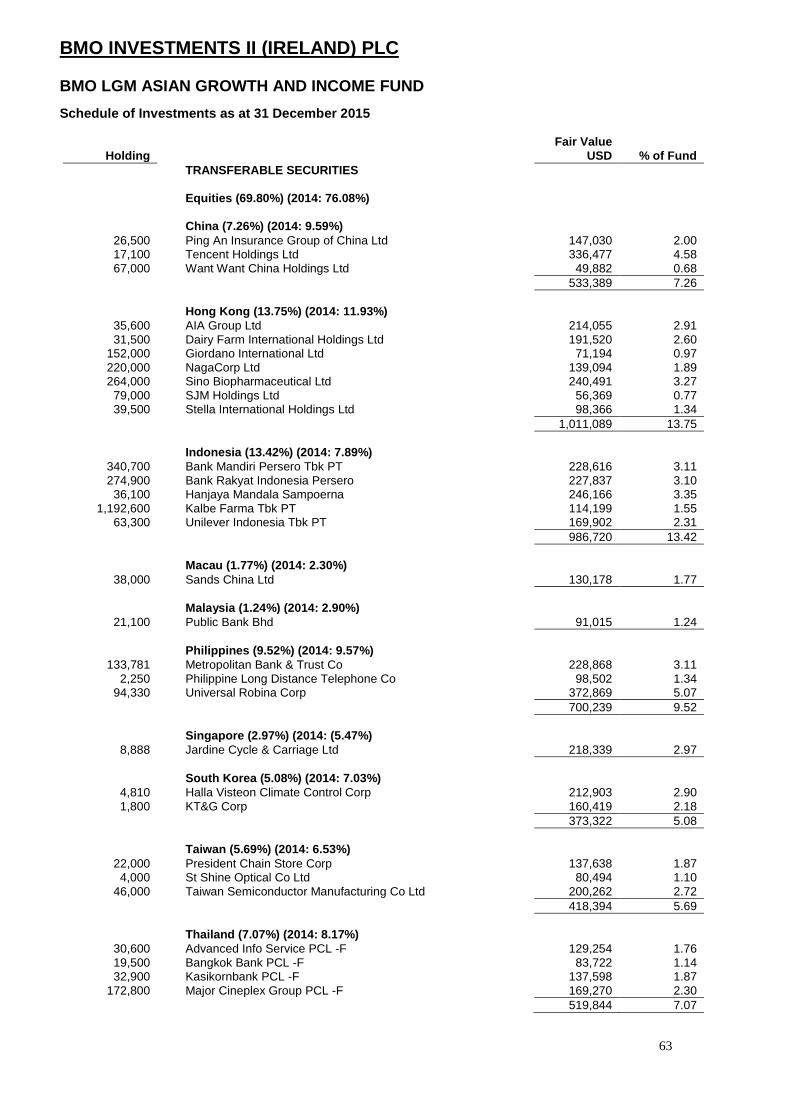
BMO INVESTMENTS II (IRELAND) PLC
63
BMO LGM ASIAN GROWTH AND INCOME FUND
Schedule of Investments as at 31 December 2015
Fair Value Holding USD % of Fund
TRANSFERABLE SECURITIES
Equities (69. 80%) (2014: 76.08%)
China (7.2 6%) (2014: 9.59%) 26,500 Ping An Insurance Group of China Ltd 147,030 2.00 17,100 Tencent Holdings Ltd 336,477 4.58 67,000 Want Want China Holdings Ltd 49,882 0.68
533,389 7.26
Hong Kong (13.75%) (2014: 11.93%) 35,600 AIA Group Ltd 214,055 2.91 31,500 Dairy Farm International Holdings Ltd 191,520 2.60
152,000 Giordano International Ltd 71,194 0.97 220,000 NagaCorp Ltd 139,094 1.89 264,000 Sino Biopharmaceutical Ltd 240,491 3.27
79,000 SJM Holdings Ltd 56,369 0.77 39,500 Stella International Holdings Ltd 98,366 1.34
1,011,089 13.75
Indonesia (13.42%) (2014: 7.89%) 340,700 Bank Mandiri Persero Tbk PT 228,616 3.11 274,900 Bank Rakyat Indonesia Persero 227,837 3.10
36,100 Hanjaya Mandala Sampoerna 246,166 3.35 1,192,600 Kalbe Farma Tbk PT 114,199 1.55
63,300 Unilever Indonesia Tbk PT 169,902 2.31
986,720 13.42
Macau (1.77%) (2014: 2.30%) 38,000 Sands China Ltd 130,178 1.77
Malaysia (1.24%) (2014: 2.90%) 21,100 Public Bank Bhd 91,015 1.24
Philippines (9.52%) (2014: 9.57%) 133,781 Metropolitan Bank & Trust Co 228,868 3.11
2,250 Philippine Long Distance Telephone Co 98,502 1.34 94,330 Universal Robina Corp 372,869 5.07
700,239 9.52
Singapore (2.97%) (2014: (5.47%) 8,888 Jardine Cycle & Carriage Ltd 218,339 2.97
South Korea (5.08%) (2014: 7.03%) 4,810 Halla Visteon Climate Control Corp 212,903 2.90 1,800 KT&G Corp 160,419 2.18
373,322 5.08
Taiwan (5.69%) (2014: 6.53%) 22,000 President Chain Store Corp 137,638 1.87 4,000 St Shine Optical Co Ltd 80,494 1.10
46,000 Taiwan Semiconductor Manufacturing Co Ltd 200,262 2.72
418,394 5.69
Thailand (7.0 7%) (2014: 8.17%) 30,600 Advanced Info Service PCL -F 129,254 1.76 19,500 Bangkok Bank PCL -F 83,722 1.14 32,900 Kasikornbank PCL -F 137,598 1.87
172,800 Major Cineplex Group PCL -F 169,270 2.30 519,844 7.07

BMO INVESTMENTS II (IRELAND) PLC
64
BMO LGM ASIAN GROWTH AND INCOME FUND
Schedule of Investments as at 31 December 2015 cont /d
Fair Value Holding USD % of Fund
Equities (69. 80%) (2014: 76.08%) cont/d
United Kingdom Nil (2014: 3.02%)
Vietnam (2.03%) (2014: Nil) 25,000 Vietnam Dairy Products JSC 149,433 2.03
Total Equities 5,131,962 69.80
Participation Notes (27.2 2%) (2014: 20.22%)
India (27.2 2%) (2014: 20.22%) 9,420 Bata India Ltd due 08/02/2022 - Deutsche
Bank AG (Participation Note) 74,320 1.01 5,210 Colgate-Palmolive India Ltd due 15/05/2017 - Morgan Stanley
Asia Products (Participation Note) 76,615 1.04 5,878 Container Corp India Ltd 26/06/2017 - Morgan
Stanley Asia Products (Participation Note) 116,661 1.59 8,610 Emami Ltd due 07/05/2020 - Deutsche
Bank AG (Participation Note) 130,081 1.77 6,129 Hindustan Unilever Ltd due 07/12/2016 - Morgan Stanley
Asia Products (Participation Note) 79,929 1.09 15,405 ICICI Bank Ltd due 12/02/2016 - Citigroup
Global Markets Holdings (Participation Note) 60,857 0.83 10,330 ICICI Bank Ltd due 17/01/2017 - Deutsche
Bank AG (Participation Note) 40,809 0.55 15,660 ICICI Bank Ltd due 19/03/2018 - Morgan Stanley
Asia Products (Participation Note) 61,865 0.84 11,960 ITC Ltd due 01/07/2016 - Morgan Stanley
Asia Products (Participation Note) 59,261 0.80 69,720 ITC Ltd due 12/02/2016 - Citigroup
Global Markets Holdings (Participation Note) 345,458 4.70 71,564 Mahindra & Mahindra Financial Services Ltd
due 17/03/2017 - Morgan Stanley Asia Products (Participation Note) 261,944 3.56 1,527 Nestle India Ltd due 30/07/2021 - Citigroup
Global Markets Holdings (Participation Note) 133,531 1.82 11,733 Pidilite Ltd 17/03/2017 - Morgan Stanley
Asia Products (Participation Note) 97,979 1.33 5,080 Titan Industries Ltd due 02/05/2017 - Morgan Stanley
Asia Products (Participation Note) 26,657 0.36 30,780 Titan Industries Ltd due 30/06/2021 - Deutsche
Bank AG (Participation Note) 161,516 2.20 25,000 Yes Bank Ltd due 12/08/2018 - Deutsche
Bank AG (Participation Note) 274,275 3.73 Total Participation Notes 2,001,758 27.22 Total Value of Investments in Transferable Securities (97.02%) (2014: 96.30%) 7,133,720 97.02 Other Net Assets (2.98%) (2014: 3.70%) 218,820 2.98 Net Assets Attributable To Redeemable Participating Shareholders (At Dealing NAV) (100.00%) 7,352,540 100.00

BMO INVESTMENTS II (IRELAND) PLC
65
BMO LGM ASIAN GROWTH AND INCOME FUND
Schedule of Investments as at 31 December 2015 cont /d Analysis of Total Assets % of Total
Assets Transferable securities admitted to an official stock exchange listing 69.52 Transferable securities dealt with in a regulated market (Participation Notes) 27.15
Current Assets 3.33 Total Assets 100.00
The counterparties for the Participation Notes are: HSBC Bank Plc (Moody’s: A3; December 2015: Aa3) Merrill Lynch International & Co (Moody’s: Baa1; December 2015: A) Country classifications are based upon country of incorporation and/or country of domicile.

BMO INVESTMENTS II (IRELAND) PLC
66
BMO LGM FRONTIER MARKETS FUND
Schedule of Investments as at 31 December 2015
HoldingFair Value
USD % of Fund Transferable Securities Equities (92.61%) (2014: 90.04%) Argentina (2.93%) (2014: Nil ) 856,590 BBVA Banco Frances SA (ADR)* 16,343,737 2.93 Bangladesh (1.63%) (2014: 1.44%) 241,340 British American Tobacco Bangladesh Co Ltd 9,073,892 1.63 Botswana (1.55%) (2014: 1.40%) 33,440,335 Letshego Holdings Ltd 8,621,253 1.55 Cambodia (3.56%) (2014: 4.12%) 31,406,000 Nagacorp Ltd 19,856,313 3.56 Colombia (1.84%) (2014: 2.67%) 1,460,921 Almacenes Exito SA 6,212,769 1.12 751,831,831 Bolsa De Valores De Colombia 4,026,190 0.72
10,238,959 1.84
Costa Rica (2.54%) (2014: 0.99%) 11,601,847 Florida Ice & Farm Co SA 14,143,327 2.54 Croatia (1.70%) (2014: 1.17%) 7,391 Ledo Dd 9,475,048 1.70 Egypt (11.55%) (2014: 10.85%) 7,507,046 Commercial International Bank Egypt SAE (GDR)** 32,280,298 5.79 801,617 Eastern Tobacco 17,915,974 3.22 148,679 Edita Food Industries SAE (GDR)** 2,750,561 0.49 11,194,059 Juhayna Food Industries 11,408,432 2.05
64,355,265 11.55
Ghana (0.58%) (2014: 0.32%) 1,675,100 FAN Milk Ltd 3,231,492 0.58 Ireland (0.00%) (2014: 2. 94%) Jamaica (0.48%) (2014: NIL) 10,708,796 Desnoes & Geddes Ltd 2,677,757 0.48 Kenya (6.06%) (2014: 6.20%) 46,297,420 Barclays Bank Of Kenya Ltd 6,087,002 1.09
1.822.900.25
1,318,200 British American Tobacco Kenya Ltd 10,115,220 6,084,700 East African Breweries Ltd 16,178,284 14,058,020 Uchumi Supermarkets Ltd 1,415,421
33,795,927 6.06
Mauritius (2.56%) (2014: 2.04%) 2,455,711 MCB Group Ltd 14,245,176 2.56 Netherlands (0.00%) (2014: 1.35%) Nigeria (7.34%) (2014: 10.82%) 14,533,972 Cadbury Nigeria PLC 1,252,236 0.22 250,475,248 Guaranty Trust Bank PLC 22,876,865 4.11 1,347,129 Nestle Nigeria PLC 5,820,301 1.04

BMO INVESTMENTS II (IRELAND) PLC
67
BMO LGM FRONTIER MARKETS FUND Schedule of Investments As At 31 December 2015 cont /d
Holding Fair Value
USD % of Fund Transferable Securities cont/d Equities (92.61%) (2014: 90.04%) cont/d Nigeria (7.34%) (2014: 10.82%) cont/d 16,034,919 Nigerian Breweries PLC 10,955,785 1.97
40,905,187 7.34
Oman (2.36%) (2014: 4.50%) 4,606,880 Bank Muscat SAOG 5,647,182 1.01 1,849,111 Oman Telecommunications Co SAOG 7,515,540 1.35
13,162,722 2.36
Pakistan (2.76%) (2014: 2.76%) 3,037,200 Lucky Cement Ltd 14,355,616 2.57 708,700 United Bank Ltd 1,048,485 0.19
15,404,101 2.76
Peru (2.97%) (2014: 2.48%) 4,193,451 Alicorp SAA 7,129,524 1.28 11,557,060 BBVA Banco Continental SA 9,417,880 1.69
16,547,404 2.97
Philippines (2.90%) (2014: 3.29%) 4,082,450 Universal Robina Corp 16,137,195 2.90 Romania (2.14%) (2014: 4.02%) 61,290,330 Fondul Proprietatea SA 11,927,340 2.14 Senegal (4.04%) (2014: 3.81%) 543,285 Sonatel 22,492,727 4.04 Sri Lanka (1.37%) (2014: Nil ) 107,203 Ceylon Tobacco Co Plc 737,601 0.13 7,093,915 Commercial Bank Of Ceylon PLC 6,894,745 1.24
7,632,346 1.37 Tunisia (1.55%) (2014: 1.70%) 1,304,775 Delice Holding 8,641,488 1.55 United Arab Emirates (5.89%) (2014: 5.30%) 34,631,535 Aramex PJSC 29,794,623 5.35 875,310 First Gulf Bank PJSC 3,014,613 0.54
32,809,236 5.89
United Kingdom (5.30%) (2014: 5.16%) 782,630 BGEO Group PLC 21,962,992 3.94 3,311,133 Georgia Healthcare Group PLC 7,564,433 1.36
29,527,425 5.30
United States (4.01%) (2014: 2.46%) 269,463 Pricesmart Inc 22,362,734 4.01

BMO INVESTMENTS II (IRELAND) PLC
68
BMO LGM FRONTIER MARKETS FUND Schedule of Investments As At 31 December 2015 cont /d
Holding Fair Value
USD % of Fund Transferable Securities cont/d Equities (92.61%) (2014: 90.04%) cont/d Vietnam (11.52%) (2014: 6.33%) 3,262,723 Phu Nhuan Jewelry JSC 6,225,075 1.12 9,696,649 Vietnam Dairy Products JSC 57,959,957 10.40
64,185,032 11.52
Zimb abwe (1.48%) (2014: 1.92%) 11,710,858 Delta Corp Ltd 8,256,155 1.48 Total Equities 516,049,238 92.61 Participation Notes (5.63%) (2014: 7.49%) Saudi Arabia (5.63%) (2014: 7.49%)
530,931
Herfy Foods Due 06/07/2017 - HSBC Bank PLC (Participation Note) 14,228,312 2.55
169,635
Jarir Marketing 02/03/2017 - Merrill Lynch International & Co (Participation Note) 7,227,077 1.30
331,718
Saudi Dairy & Foodstuff Due 04/06/2018 - HSBC Bank PLC (Participation Note) 9,897,901 1.78
Total Participation Notes
31,353,290 5.63
Total Value Of Investments In Transferable Securitie s (98.24%) (2014: 97.53%) 547,402,528 98.24
Other Net Assets (1.76%) (2014: 2.47%) 9,824,247 1.76
Net Assets Attributable To Redeemable Participating Shareholders (At Dealing NAV) (100.00%) 557,226,775 100.00
*American Depository Receipt **Global Depository Receipt
The counterparties for the Participation Notes are: HSBC Bank Plc (Moody’s: A3; December 2015: Aa2) Merrill Lynch International & Co (Moody’s: Baa1; December 2015: Baa1) Country classifications are based upon country of incorporation and/or country of domicile.
Analysis of Total Assets % of Total
Assets Transferable securities admitted to an official stock exchange listing 92.26 Transferable securities dealt with in a regulated market (Participation Notes) 5.60 Current Assets 2.14 Total Assets 100.00

BMO INVESTMENTS II (IRELAND) PLC
69
BMO LGM GLOBAL EMERGING MARKETS GROWTH AND INCOME F UND
Schedule of Investments as at 31 December 2015
Fair Valu e Holding USD % of Fund
TRANSFERABLE SECURITIES
Equities (97.10%) (2014: 97.19%)
Brazil (0.63%) (2014: 1.56%) 240,800 CCR SA 763,865 0.63
Chile (2.13%) (2014: 2.07%) 3,418,046 Aguas Andinas SA 1,753,787 1.44
582,002 Coca-Cola Embonor SA - Pref 837,767 0.69
2,591,554 2.13
China (1.09%) (2014: 1.39%) 1,774,000 Want Want China Holdings Ltd 1,320,746 1.09
Egypt (4.36%) (2014: 3.65%) 990,245 Commercial International Bank Egypt SAE (GDR*) 4,258,054 3.49
57,016 Edita Food Industries SAE (GDR*) 1,054,796 0.87
5,312,850 4.36
Hong Kong (2.84%) (2014: 5.59%) 222,100 Dairy Farm International Holdings Ltd 1,350,368 1.11
2,590,000 Giordano International Ltd 1,213,099 1.00 1,255,000 SJM Holdings Ltd 895,486 0.73
3,458,953 2.84
India (29.10%) (2014: 27.73%) 186,474 Bata India Ltd 1,471,216 1.21 127,043 Container Corp Of India Ltd 2,521,416 2.07 368,890 Emami Ltd 5,573,253 4.58 289,691 ICICI Bank Ltd 1,144,423 0.94
1,569,426 ITC Ltd 7,776,406 6.38 1,046,727 Mahindra & Mahindra Financial Services Ltd 3,831,308 3.15
30,990 Nestle India Ltd 2,730,048 2.24 285,319 Pidilite Industries Ltd 2,382,609 1.96 351,583 Titan Co Ltd 1,844,906 1.51 561,760 Yes Bank Ltd 6,163,067 5.06
35,438,652 29.10
Indonesia (13.81%) (2014: 8.08%) 7,205,900 Bank Mandiri Persero Tbk PT 4,835,297 3.97 3,796,000 Bank Rakyat Indonesia Persero Tbk PT 3,146,123 2.58
463,393 Hanjaya Mandala Sampoerna Tbk PT 3,159,880 2.59 29,699,000 Kalbe Farma Tbk PT 2,843,865 2.34 1,056,400 Unilever Indonesia Tbk PT 2,835,459 2.33
16,820,624 13.81
Kenya (0.86%) (2014: 0.49%) 392,900 East African Breweries Ltd 1,044,661 0.86
Macau (1.84%) (2014: 2.42%) 653,600 Sands China Ltd 2,239,064 1.84
Malaysia (0.74%) (2014: 1.38%) 210,200 Public Bank Bhd 906,697 0.74

BMO INVESTMENTS II (IRELAND) PLC
70
BMO LGM GLOBAL EMERGING MARKETS GROWTH AND INCOME F UND
Schedule of Investments as at 31 December 2015 cont /d
Fair Value Holding USD % of Fund
TRANSFERABLE SECURITIES
Equities (97.10%) (2014: 97.19%) cont/d
Mexico (8.27%) (2014: 8.36%) 1,556,410 Bolsa Mexicana de Valores SAB de CV 2,060,056 1.69
706,175 Grupo Financiero Banorte SAB de CV 3,883,908 3.19 434,175 Grupo Herdez SAB de CV 1,125,461 0.93
1,191,289 Wal-Mart de Mexico SAB de CV 2,999,752 2.46 10,069,177 8.27
Nigeria (1.04%) (2014: 1.19%) 13,898,674 Guaranty Trust Bank PLC 1,269,419 1.04
Peru (2.68%) (2014: 2.54%) 33,560 Credicorp Ltd 3,266,059 2.68
Philippine s (8.53%) (2014: 9.88%) 2,245,653 Metropolitan Bank & Trust Co 3,841,782 3.16 1,655,770 Universal Robina Corp 6,544,963 5.37
10,386,745 8.53
Singapore (6.23%) (2014: 3.87%) 200,833 Jardine Cycle & Carriage Ltd 4,933,585 4.05
54,496 Jardine Matheson Holdings Ltd 2,655,590 2.18
7,589,175 6.23
South Africa (3.01%) (2014: 4.76%) 16,388 Cashbuild Ltd 317,279 0.26
231,840 Clicks Group Ltd 1,331,597 1.09 65,423 Discovery Ltd 561,323 0.46
644,131 Life Healthcare Group Holdings Ltd 1,457,822 1.20
3,668,021 3.01
South Korea (1.39%) (2014: 0.89%) 19,049 KT&G Corp 1,697,685 1.39
Taiwan (0.83%) (2014: 1.80%) 161,000 President Chain Store Corp 1,007,261 0.83
Thailand (0.61%) (2014: 4.27%) 176,200 Kasikornbank PCL -F 736,921 0.61
Turkey (3.15%) (2014:2.91%) 218,082 BIM Birlesik Magazalar AS 3,836,617 3.15
Vietnam (3.96%) (2014: 2.36%) 806,710 Vietnam Dairy Products JSC 4,821,962 3.96
Total Equities 118,246,708 97.10
Participation Notes (0.16%) (2014: 0.11%) 33,186 Vietnam Dairy Products JSC due 17/01/2017
Citigroup Global Markets Holdings (Participation
Note) 198,363 0.16
Total Participation Notes 198,363 0.16
Total Value of Investments in Transferabl e
Securities (97.26%) (2014: 97.30%) 118,445,071 97.26

BMO INVESTMENTS II (IRELAND) PLC
71
BMO LGM GLOBAL EMERGING MARKETS GROWTH AND INCOME F UND
Schedule of Investments as at 31 December 2015 cont /d
Financial Derivative Instruments (0.00%) (2014: Nil )
Forward Foreign Curre ncy Exchange Contracts (0.00%) (2014: Nil)
Settlement Date Currency Bought Amount Bought Currency Sold Amount Sold
UnrealisedGain (Loss)
USD % of Fund05/01/2016 BRL 242,536 USD 61,230 74 0.0006/01/2016 IDR 162,103,104 USD 11,761 (4) 0.0004/01/2016 USD 52,352 ZAR 801,400 633 0.0006/01/2016 USD 67,371 ZAR 1,029,535 942 0.0007/01/2016 USD 10,052 ZAR 156,107 (19) 0.0008/01/2016 USD 4,367 ZAR 67,830 (8) 0.0006/01/2016 ZAR 1,147,593 USD 75,096 (1,049) 0.0006/01/2016 ZAR 1,775,121 USD 116,160 (1,623) 0.0007/01/2016 ZAR 514,771 USD 33,134 75 0.00 ____________ _______
Unrealised gain on forward foreign currency exchan ge contracts 1,724 0.00
Unrealised loss on forward foreign currency exchan ge contracts (2,703) 0.00
Net unrealised loss on forward foreign currency exc hange contracts (979) 0.00
Total Value of Investments 118,444,092 97.26
Other Net Assets (2.74%) 3,338,239 2.74
Net Assets Attributable To Redeemable Participating Shareholders (At Dealing NAV) (100.00%) 121,782,331 1 00.00
Analysis of Total Assets % of Total Assets Transferable securities admitted to an official stock exchange listing 94.90 Transferable securities dealt with in a regulated market (Participation Notes) 0.16 Over the counter financial derivative instruments 0.00 Current Assets 4.94 Total Assets 100.00 The counterparties for the Participation Notes are: HSBC Bank Plc (Moody’s: A3; December 2014: Aa3) Merrill Lynch International & Co (Moody’s: Baa1; December 2014: A) Country classifications are based upon country of incorporation and/or country of domicile. The counterparty for the Forward Foreign Currency Exchange Contracts is State Street Bank and Trust Company.
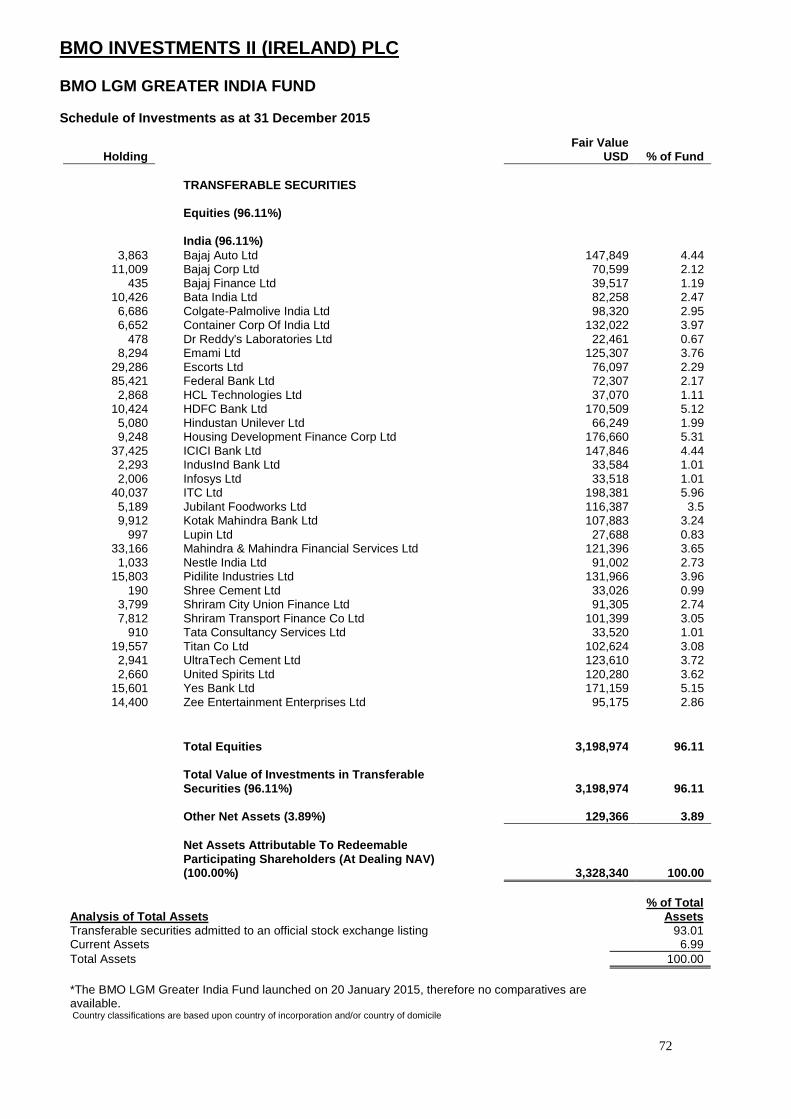
BMO INVESTMENTS II (IRELAND) PLC
72
BMO LGM GREATER INDIA FUND Schedule of Investments as at 31 December 2015
Analysis of Total Assets % of Total
Assets Transferable securities admitted to an official stock exchange listing 93.01 Current Assets 6.99 Total Assets 100.00 *The BMO LGM Greater India Fund launched on 20 January 2015, therefore no comparatives are available.
Country classifications are based upon country of incorporation and/or country of domicile
Fair Value Holding USD % of Fund
TRANSFERABLE SECURITIES
Equities (96.11%) India (96.11%)
3,863 Bajaj Auto Ltd 147,849 4.44 11,009 Bajaj Corp Ltd 70,599 2.12
435 Bajaj Finance Ltd 39,517 1.19 10,426 Bata India Ltd 82,258 2.47 6,686 Colgate-Palmolive India Ltd 98,320 2.95 6,652 Container Corp Of India Ltd 132,022 3.97
478 Dr Reddy's Laboratories Ltd 22,461 0.67 8,294 Emami Ltd 125,307 3.76
29,286 Escorts Ltd 76,097 2.29 85,421 Federal Bank Ltd 72,307 2.17 2,868 HCL Technologies Ltd 37,070 1.11
10,424 HDFC Bank Ltd 170,509 5.12 5,080 Hindustan Unilever Ltd 66,249 1.99 9,248 Housing Development Finance Corp Ltd 176,660 5.31
37,425 ICICI Bank Ltd 147,846 4.44 2,293 IndusInd Bank Ltd 33,584 1.01 2,006 Infosys Ltd 33,518 1.01
40,037 ITC Ltd 198,381 5.96 5,189 Jubilant Foodworks Ltd 116,387 3.5 9,912 Kotak Mahindra Bank Ltd 107,883 3.24
997 Lupin Ltd 27,688 0.83 33,166 Mahindra & Mahindra Financial Services Ltd 121,396 3.65 1,033 Nestle India Ltd 91,002 2.73
15,803 Pidilite Industries Ltd 131,966 3.96 190 Shree Cement Ltd 33,026 0.99
3,799 Shriram City Union Finance Ltd 91,305 2.74 7,812 Shriram Transport Finance Co Ltd 101,399 3.05
910 Tata Consultancy Services Ltd 33,520 1.01 19,557 Titan Co Ltd 102,624 3.08 2,941 UltraTech Cement Ltd 123,610 3.72 2,660 United Spirits Ltd 120,280 3.62
15,601 Yes Bank Ltd 171,159 5.15 14,400 Zee Entertainment Enterprises Ltd 95,175 2.86
Total Equities 3,198,974 96.11 Total Value of Investments in Transferable Securities (96.11%) 3,198,974 96.11 Other Net Assets (3.89%) 129,366 3.89 Net Assets Attributable To Redeemable Participating Shareholders (At Dealing NAV) (100.00%) 3,328,340 100.00

BMO INVESTMENTS II (IRELAND) PLC
73
BMO LGM ASIAN SMALLER COMPANIES FUND
Schedule of Investments as at 31 December 2015
Holding Fair Value
USD % of Fund TRANSFERABLE SECURITIES Equities (65.11%) Bermuda (5.43%) 112,000 PAX Global Technology Ltd 115,466 1.28 455,520 Silverlake Axis Ltd 211,922 2.34 250,271 Skyworth Digital Holdings Ltd 163,400 1.81
490,788 5.43
Cayman Is lands (9.71%) 13,135 iKang Healthcare Group (ADR)* 268,479 2.97 608,000 NagaCorp Ltd 384,406 4.25 90,500 Stella International Holdings Ltd 225,370 2.49
878,255 9.71
Hong Kong (2.52%) 45,600 Dah Sing Financial Holdings Ltd 227,996 2.52 India (5.98%) 33,524 Bajaj Corp Ltd 214,984 2.38 55,000 Escorts Ltd 142,912 1.58 3,287 Jubilant Foodworks Ltd 73,726 0.82 29,727 Mahindra & Mahindra Financial Services Ltd 108,809 1.20
540,431 5.98
Indonesia (7.28%) 5,969,100 Ace Hardware Indonesia Tbk PT 357,237 3.95 3,307,300 Clipan Finance Indonesia Tbk PT 65,978 0.73 106,300 Mayora Indah Tbk PT 235,194 2.60
658,409 7.28
Malaysia (5.77%) 595,400 Dialog Group Bhd 221,880 2.45 394,200 Oldtown Bhd 145,983 1.62 511,900 Tune Protect Group Bhd 153,802 1.70
521,665 5.77
Singapore (5.60%) 98,200 OSIM International Ltd 74,758 0.83 72,300 Petra Foods Ltd 107,534 1.19 161,500 Singapore Post Ltd 186,699 2.07 231,200 Super Group Ltd 136,896 1.51
505,887 5.60
South Korea (3.37%) 770 CJ O Shopping Co Ltd 125,296 1.39 2,720 Hotel Shilla Co Ltd 179,315 1.98
304,611 3.37
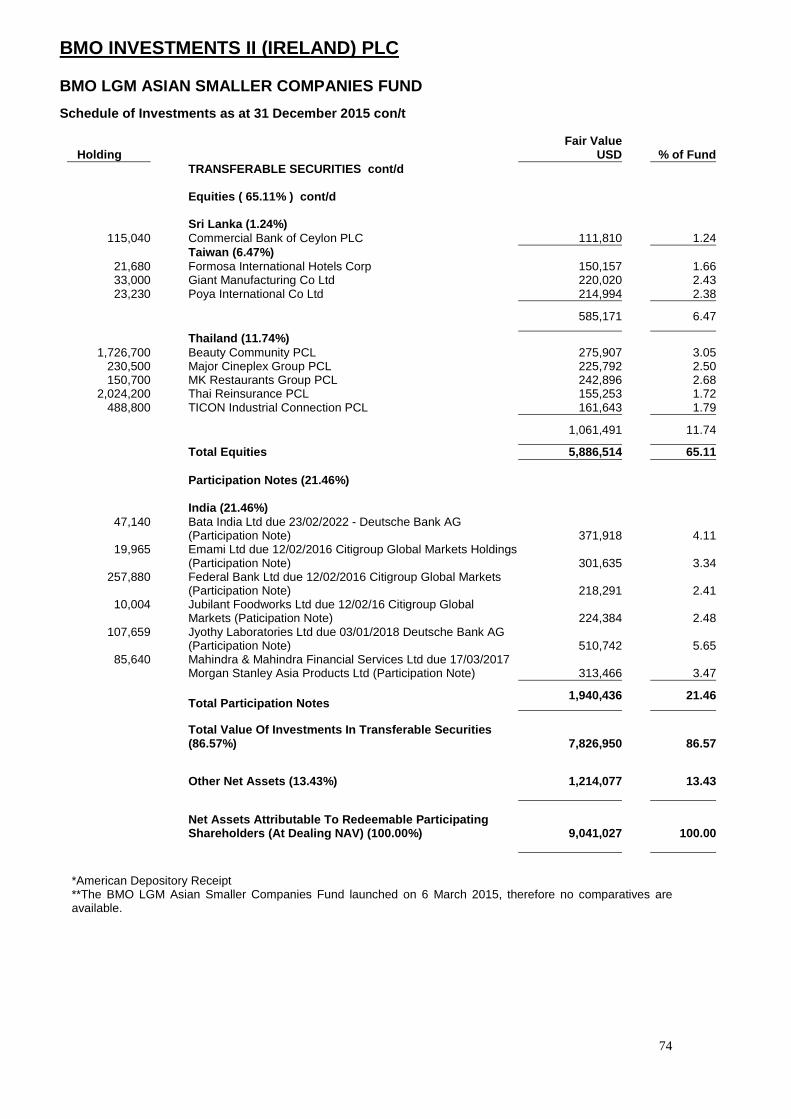
BMO INVESTMENTS II (IRELAND) PLC
74
BMO LGM ASIAN SMALLER COMPANIES FUND
Schedule of Investments as at 31 December 2015 con/ t
*American Depository Receipt **The BMO LGM Asian Smaller Companies Fund launched on 6 March 2015, therefore no comparatives are available.
Holding Fair Value
USD % of Fund TRANSFERABLE SECURIT IES cont /d Equities ( 65.11% ) cont/d Sri Lanka (1.24%) 115,040 Commercial Bank of Ceylon PLC 111,810 1.24 Taiwan (6.47%) 21,680 Formosa International Hotels Corp 150,157 1.66 33,000 Giant Manufacturing Co Ltd 220,020 2.43 23,230 Poya International Co Ltd 214,994 2.38
585,171 6.47
Thailand (11.74%) 1,726,700 Beauty Community PCL 275,907 3.05 230,500 Major Cineplex Group PCL 225,792 2.50 150,700 MK Restaurants Group PCL 242,896 2.68 2,024,200 Thai Reinsurance PCL 155,253 1.72 488,800 TICON Industrial Connection PCL 161,643 1.79
1,061,491 11.74
Total Equities 5,886,514 65.11 Participation Notes (21.46%) India ( 21.46%)
47,140
Bata India Ltd due 23/02/2022 - Deutsche Bank AG (Participation Note) 371,918 4.11
19,965
Emami Ltd due 12/02/2016 Citigroup Global Markets Holdings (Participation Note) 301,635 3.34
257,880
Federal Bank Ltd due 12/02/2016 Citigroup Global Markets (Participation Note) 218,291 2.41
10,004
Jubilant Foodworks Ltd due 12/02/16 Citigroup Global Markets (Paticipation Note) 224,384 2.48
107,659
Jyothy Laboratories Ltd due 03/01/2018 Deutsche Bank AG (Participation Note) 510,742 5.65
85,640
Mahindra & Mahindra Financial Services Ltd due 17/03/2017 Morgan Stanley Asia Products Ltd (Participation Note) 313,466 3.47
Total Participation Notes 1,940,436 21.46
Total Value Of Investments In Transferable Securitie s (86.57%) 7,826,950 86.57
Other Net Assets (13.43%) 1,214,077 13.43
Net Assets Attributable To Redeemable Participating Shareholders (At Dealing NAV) (100.00%) 9,041,027 10 0.00

BMO INVESTMENTS II (IRELAND) PLC
75
BMO LGM ASIAN SMALLER COMPANIES FUND
Schedule of Investments as at 31 December 2015 cont /d
Analysis of Total Assets % of Total
Assets Transferable securities admitted to an official stock exchange listing 64.89 Transferable securities dealt with in a regulated market (Participation Notes) 21.39 Current Assets 13.72 Total Assets 100.00 The counterparties for the participation notes are: Citigroup Global Markets Holdings (Moody’s: Baa1) Deutsche Bank AG (Moody’s: A3) Morgan Stanley Asia Products (Moody’s: A3) Country classifications are based upon country of incorporation and/or country of domicile.

BMO INVESTMENTS II (IRELAND) PLC
76
Supplemental Unaudited Information 1. Exchange Rates
The rates of exchange ruling at 31 December 2015 and 31 December 2014 are as follows:
31 December 2015 31 December 2014
USD1 = Currency Rate USD1 = Currency Rate AED 3.6730 AED 3.6730 BDT 78.4750 BDT 77.9250 BRL 3.9563 BRL 2.6582 BWP 11.2486 BWP 9.5102 CLP 708.6000 CLP 606.8500 COP 3,174.5000 COP 2,376.5000 CRC 537.3000 CRC 539.4200 EGP 7.8301 EGP 7.1501 EUR 0.9206 EUR 0.8264 GBP 0.6785 GBP 0.6413 GHS 3.8100 GHS 3.2150 HKD 7.7502 HKD 7.7549 HRK 7.0337 HRK 6.3263 IDR 13,785.0000 IDR 12,385.0000 INR 66.1563 INR 63.1225 KES 102.3000 KES 90.5500 KRW 1,172.5500 KRW 1,099.1500 MUR 35.9000 MUR 31.7500 MXN 17.2712 MXN 14.7398 MYR 4.2935 MYR 3.4965 NGN 199.0500 NGN 183.0000 OMR 0.3851 OMR 0.3850 PEN 3.4115 PEN 2.9765 PHP 47.0550 PHP 44.7325 PKR 104.7350 PKR 100.5250 RON 4.1623 RON 3.7054 SGD 1.4187 SGD 1.3251 THB 35.9850 THB 32.9000 TND 2.0369 TND 1.8665 TRY 2.9189 TRY 2.3378 TWD 32.8470 TWD 31.6020 VND 22,485.0000 VND 21,387.5000 XOF 603.8452 XOF 542.0908 ZAR 15.4955 ZAR 11.5688
2. Soft Commission
There were no soft commission arrangements entered into in relation to any Fund by either the Company or the Investment Manager during the year ended 31 December 2015 or year ended 31 December 2014.
3. Securities Lending
No securities lending took place during the year ended 31 December 2015 (2014: Nil).
4. Off balance sheet transactions
There were no off balance sheet transactions for the Company at 31 December 2015 (2014: Nil).
5. Contingent Liabilities
There were no contingent liabilities as at 31 December 2015 (31 December 2014: Nil).
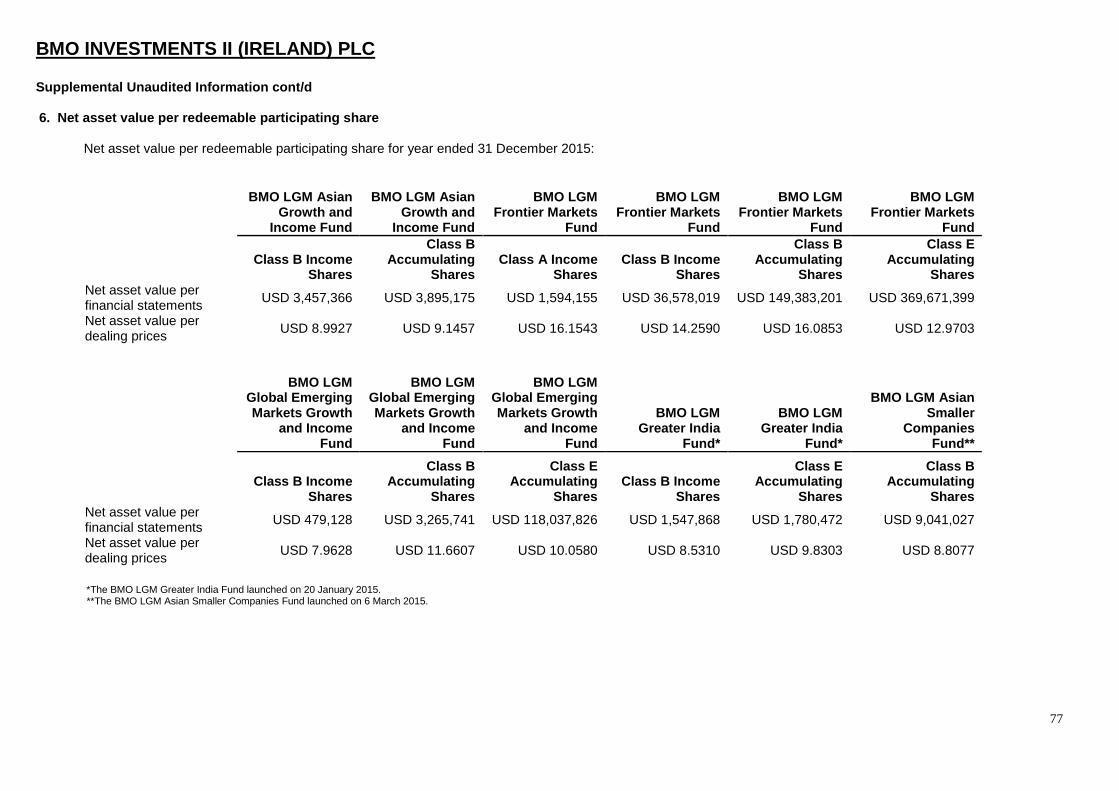
BMO INVESTMENTS II (IRELAND) PLC
77
Supplemental Unaudited Information cont/d
6. Net asset value per redeemable participating sh are Net asset value per redeemable participating share for year ended 31 December 2015:
BMO LGM Asian Growth and
Income Fund
BMO LGM Asian Growth and
Income Fund
BMO LGM Frontier Markets
Fund
BMO LGM Frontier Markets
Fund
BMO LGM Frontier Markets
Fund
BMO LGM Frontier Markets
Fund
Class B Income
Shares
Class B Accumulating
Shares Class A Income
Shares Class B Income
Shares
Class B Accumulating
Shares
Class E Accumulating
Shares Net asset value per financial statements
USD 3,457,366 USD 3,895,175 USD 1,594,155 USD 36,578,019 USD 149,383,201 USD 369,671,399
Net asset value per dealing prices
USD 8.9927 USD 9.1457 USD 16.1543 USD 14.2590 USD 16.0853 USD 12.9703
BMO LGM Global Emerging Markets Growth
and Income Fund
BMO LGM Global Emerging Markets Growth
and Income Fund
BMO LGM Global Emerging Markets Growth
and Income Fund
BMO LGM Greater India
Fund*
BMO LGM Greater India
Fund*
BMO LGM Asian Smaller
Companies Fund**
Class B Income Shares
Class B Accumulating
Shares
Class E Accumulating
Shares Class B Income
Shares
Class E Accumulating
Shares
Class B Accumulating
Shares Net asset value per financial statements
USD 479,128 USD 3,265,741 USD 118,037,826 USD 1,547,868 USD 1,780,472 USD 9,041,027
Net asset value per dealing prices
USD 7.9628 USD 11.6607 USD 10.0580 USD 8.5310 USD 9.8303 USD 8.8077
*The BMO LGM Greater India Fund launched on 20 January 2015. **The BMO LGM Asian Smaller Companies Fund launched on 6 March 2015.
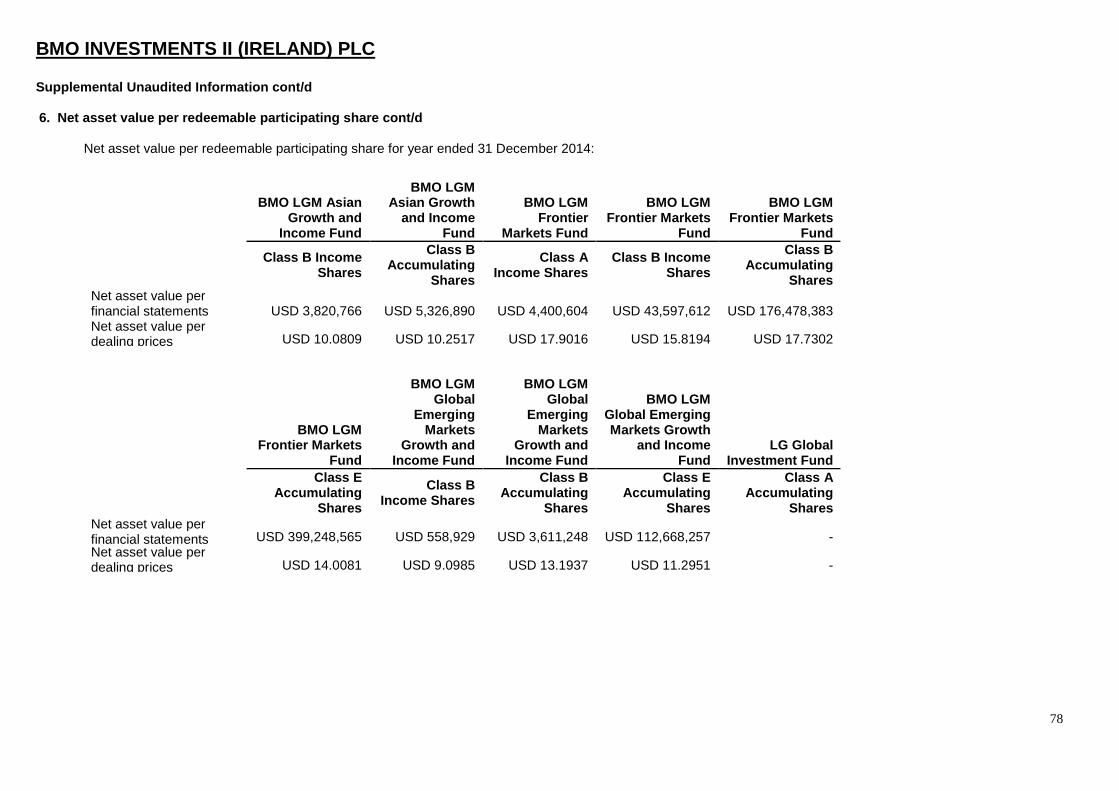
BMO INVESTMENTS II (IRELAND) PLC
78
Supplemental Unaudited Information cont/d
6. Net asset value per redeemable participating sh are cont/d Net asset value per redeemable participating share for year ended 31 December 2014:
BMO LGM Asian Growth and
Income Fund
BMO LGM Asian Growth
and Income Fund
BMO LGM Frontier
Markets Fund
BMO LGM Frontier Markets
Fund
BMO LGM Frontier Markets
Fund
Class B Income
Shares
Class B Accumulating
Shares
Class A Income Shares
Class B Income Shares
Class B Accumulating
Shares Net asset value per financial statements USD 3,820,766 USD 5,326,890 USD 4,400,604 USD 43,597,612 USD 176,478,383 Net asset value per dealing prices USD 10.0809 USD 10.2517 USD 17.9016 USD 15.8194 USD 17.7302
BMO LGM Frontier Markets
Fund
BMO LGM Global
Emerging Markets
Growth and Income Fund
BMO LGM Global
Emerging Markets
Growth and Income Fund
BMO LGM Global Emerging Markets Growth
and Income Fund
LG Global Investment Fund
Class E Accumulating
Shares
Class B Income Shares
Class B Accumulating
Shares
Class E Accumulating
Shares
Class A Accumulating
Shares Net asset value per financial statements USD 399,248,565 USD 558,929 USD 3,611,248 USD 112,668,257 - Net asset value per dealing prices USD 14.0081 USD 9.0985 USD 13.1937 USD 11.2951 -

BMO INVESTMENTS II (IRELAND) PLC
79
Supplemental Unaudited Information cont/d
6. Net asset value per redeemable participating sh are cont/d Net asset value per redeemable participating share for period ended 30 September 2013:
BMO LGM Frontier
Markets Fund
BMO LGM Frontier
Markets Fund
BMO LGM Frontier
Markets Fund
BMO LGM Frontier Markets
Fund
BMO LGM Global
Emerging Markets
Growth and Income
Fund
BMO LGM Global Emerging Markets Growth and Income Fund
Class A Income
Shares Class B Income
Shares
Class B Accumulating
Shares
Class E Accumulating
Shares
Class B Income Shares
Class B Accumulating Shares
Net asset value per financial statements USD 4,151,394 USD 11,755,467 USD 77,059,006 USD 228,015,198 USD 699,244 USD 7,534,141 Net asset value per dealing prices USD 16.7279 USD 14.6928 USD 16.4846 USD 12.6975 USD 8.6143 USD 12.4767
7. Data All index data referred to in this report is copyright and propriety to MSCI.

BMO INVESTMENTS II (IRELAND) PLC
80
BMO LGM Asian Growth and Income Fund Listed below is the 1% of the total value of purchases and sales during the year ended 31 December 2015.
Major Purchases Shares Cost USD Mahindra & Mahindra Financial Services Ltd due 17/03/2017 - Morgan Stanley Asia Products (Participation Note) 71,564 294,225
AIA Group Ltd 35,600 219,827
Hanjaya Mandala Sampoerna 36,100 191,808
Bank Rakyat Indonesia Persero 274,900 189,238
Dairy Farm International Holdings Ltd 31,500 188,634
Vietnam Dairy Products JSC 25,000 145,850
Pidilite Ltd due 17/03/2017 - Morgan Stanley Asia
Products (Participation Note) 11,733 114,224
ICICI Bank Ltd due 19/03/2018 - Morgan Stanley
Asia Products (Participation Note) 15,660 97,581 Colgate-Palmolive India Ltd due 22/05/2017 - Morgan Stanley Asia Products (Participation Note) 5,210 75,978
Hindustan Unilever Ltd due 07/12/2016 - Morgan Stanley
Asia Products (Participation Note) 6,129 75,656
ITC Ltd due 01/07/2016 - Morgan Stanley Asia
Products (Participation Note) 11,960 69,910
Kasikornbank PCL-F 9,200 49,616
NagaCorp Ltd 62,000 41,185 Titan Industries Ltd due 02/05/2017 - Morgan Stanley Asia Products (Participation Note) 5,080 35,617
ICICI Bank Ltd due 12/02/2016 - Citigroup Global
Markets Holdings (Participation Note) 6,905 33,925 Nestle India Ltd due 17/01/2017 - Citigroup Global Markets Holdings (Participation Note) 169 15,854 Mahindra & Mahindra Ltd due 12/02/2016 - Citigroup Global Markets Holdings (Participation Note) 680 14,072 Major Sales Shares Proceeds USD
HSBC Holdings Plc 29,822 235,352
China Mobile Ltd 19,000 225,827
Lenovo Group Ltd 184,000 222,854 Mahindra & Mahindra Ltd due 12/02/2016 - Citigroup Global Markets Holdings (Participation Note) 8,975 181,180
Sino Biopharmaceutical Ltd 120,000 142,933
Hyundai Motor Co 1,010 132,865
Jardine Matheson Holdings Ltd 2,458 126,407 Yes Bank Ltd due 12/08/2018 - Deutsche Bank AG (Participation Note) 9,030 116,898
Taiwan Semiconductor Manufacturing Co Ltd 26,000 110,364
Tencent Holdings Ltd 5,700 105,784
Television Broadcasts Ltd 20,500 87,670
Ping An Insurance Group Co of China Ltd 11,000 81,110
OSIM International Ltd 89,000 74,196

BMO INVESTMENTS II (IRELAND) PLC
81
BMO LGM Asian Growth and Income Fund cont/d Major Sales (cont/d) Shares Proceeds USD
CJ O Shopping Co Ltd 450 73,628
Media Prima Bhd 132,300 60,933
Universal Robina Corp 12,440 58,375
Oldtown Bhd 171,000 57,633
Parkson Retail Asia Ltd 130,000 57,529 Mahindra & Mahindra Ltd due 12/02/2016 - Citigroup Global Markets Holdings (Participation Note) 10,770 54,537
Emami Ltd due 17/01/2017 - Citigroup Global
Markets Holdings (Participation Note) 2,814 53,443
Nestle India Ltd due 17/01/2017 - Citigroup Global
Markets Holdings (Participation Note) 462 47,404
Bank Mandiri Persero Tbk PT 44,900 37,696
Metropolitan Bank & Trust 17,650 36,731
Jardine Cycle & Carriage Ltd 1,000 30,820

BMO INVESTMENTS II (IRELAND) PLC
82
BMO LGM Frontier Markets Fund Listed below is the 1% of the total value of purchases and sales during the year ended 31 December 2015. Major Purchases Shares Cost USD
BBVA Banco Frances SA (ADR) 856,590 14,758,683
Commercial International Bank Egypt SAE (GDR) 2,251,061 12,882,990 Saudi Dairy & Foodstuff due 04/06/2018 - HSBC Bank PLC (Participation note) 331,718 12,560,038
Aramex PJSC 13,269,879 11,804,673
PriceSmart Inc 120,220 9,706,807
Florida Ice & Farm Co SA 6,930,612 9,179,506
Commercial Bank of Ceylon PLC 7,082,697 8,944,834
Georgia Healthcare Group PLC 3,429,233 8,807,505
Alicorp SAA 4,193,451 7,922,610
East African Breweries Ltd 1,339,700 3,977,538
Eastern Tobacco 110,990 3,169,969
Phu Nhuan Jewelry JSC 1,418,690 3,167,608
Almacenes Exito SA 547,475 3,115,394
Letshego Holdings Ltd 11,794,950 3,013,467
Edita Food Industries SAE (GDR) 148,679 2,724,945
MCB Group Ltd 415,700 2,471,599
Nestle Nigeria PLC 551,220 2,461,922
Ledo dd 1,774 2,166,627
Commercial International Bank Egypt SAE (GDR) 311,288 2,118,657
BGEO Group PLC 64,617 1,815,094 Major Sales Shares Proceeds USD Saudi Dairy & Foodstuff due 26/06/2015 - HSBC Bank PLC (Participation Note) 427,470 15,916,518
Herfy Foods 08/10/2015-HSBC Bank PLC (Participation Note) 444,621 11,997,508
First Gulf Bank PJSC 2,874,603 9,946,697
Fondul Proprietatea SA 42,451,672 8,889,017
OCI NV 241,667 7,518,287
Etihad Etisalat due 02/03/2017 - Merrill Lynch 718,844 7,424,042
Zenith Bank PLC 82,487,167 7,321,998
Bank Muscat SAOG 4,941,277 6,683,284
Dragon Oil PLC 702,880 5,972,875
Oman Telecommunications Co SAOG 1,357,880 5,905,236
BGEO Group PLC 188,417 5,853,301
Eastern Tobacco 188,210 5,673,027
Letshego Holdings Ltd 9,254,889 3,272,818
Universal Robina Corp 607,750 2,970,993
Lucky Cement Ltd 425,900 2,298,086
Commercial International Bank Egypt SAE (GDR) 241,948 1,740,752
PriceSmart Inc 19,000 1,679,001
Access Bank PLC 50,827,444 1,532,593
Orascom Construction Ltd 115,943 1,330,306
Commercial International Bank Egypt SAE (GDR) 233,359 1,216,978
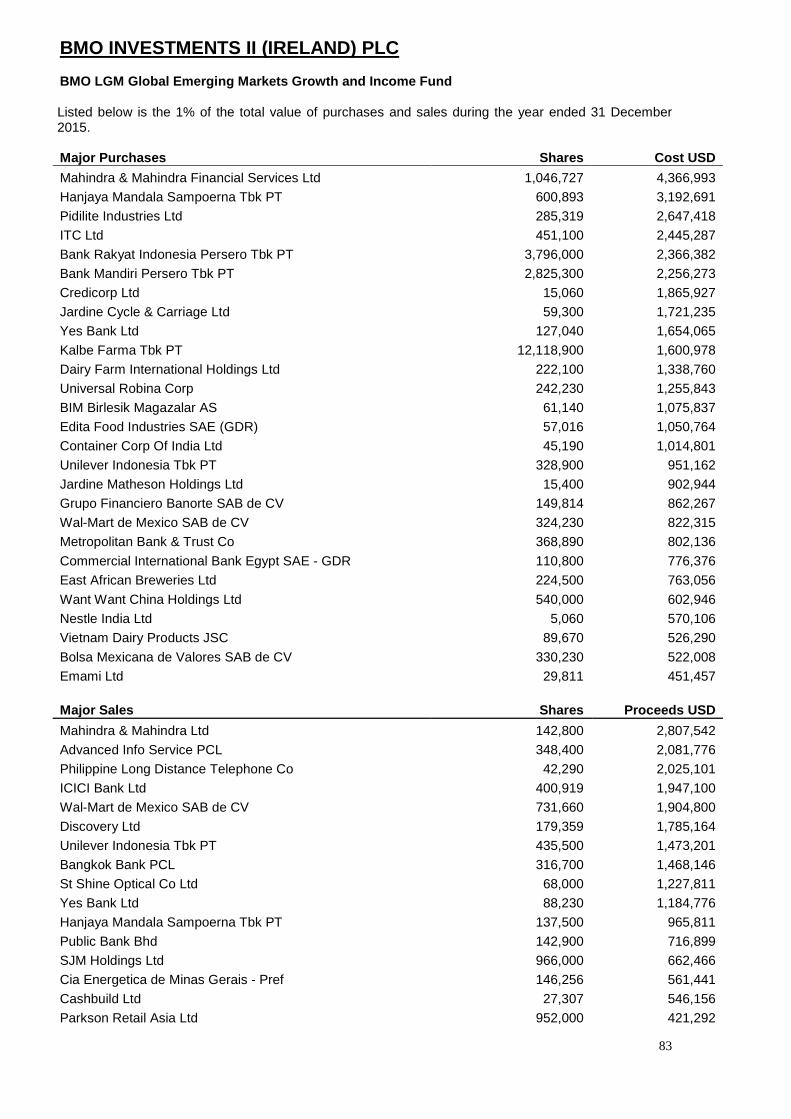
BMO INVESTMENTS II (IRELAND) PLC
83
BMO LGM Global Emerging Markets Growth and Income F und Listed below is the 1% of the total value of purchases and sales during the year ended 31 December 2015. Major Purchases Shares Cost USD
Mahindra & Mahindra Financial Services Ltd 1,046,727 4,366,993
Hanjaya Mandala Sampoerna Tbk PT 600,893 3,192,691
Pidilite Industries Ltd 285,319 2,647,418
ITC Ltd 451,100 2,445,287
Bank Rakyat Indonesia Persero Tbk PT 3,796,000 2,366,382
Bank Mandiri Persero Tbk PT 2,825,300 2,256,273
Credicorp Ltd 15,060 1,865,927
Jardine Cycle & Carriage Ltd 59,300 1,721,235
Yes Bank Ltd 127,040 1,654,065
Kalbe Farma Tbk PT 12,118,900 1,600,978
Dairy Farm International Holdings Ltd 222,100 1,338,760
Universal Robina Corp 242,230 1,255,843
BIM Birlesik Magazalar AS 61,140 1,075,837
Edita Food Industries SAE (GDR) 57,016 1,050,764
Container Corp Of India Ltd 45,190 1,014,801
Unilever Indonesia Tbk PT 328,900 951,162
Jardine Matheson Holdings Ltd 15,400 902,944
Grupo Financiero Banorte SAB de CV 149,814 862,267
Wal-Mart de Mexico SAB de CV 324,230 822,315
Metropolitan Bank & Trust Co 368,890 802,136
Commercial International Bank Egypt SAE - GDR 110,800 776,376
East African Breweries Ltd 224,500 763,056
Want Want China Holdings Ltd 540,000 602,946
Nestle India Ltd 5,060 570,106
Vietnam Dairy Products JSC 89,670 526,290
Bolsa Mexicana de Valores SAB de CV 330,230 522,008
Emami Ltd 29,811 451,457 Major Sales Shares Proceeds USD
Mahindra & Mahindra Ltd 142,800 2,807,542
Advanced Info Service PCL 348,400 2,081,776
Philippine Long Distance Telephone Co 42,290 2,025,101
ICICI Bank Ltd 400,919 1,947,100
Wal-Mart de Mexico SAB de CV 731,660 1,904,800
Discovery Ltd 179,359 1,785,164
Unilever Indonesia Tbk PT 435,500 1,473,201
Bangkok Bank PCL 316,700 1,468,146
St Shine Optical Co Ltd 68,000 1,227,811
Yes Bank Ltd 88,230 1,184,776
Hanjaya Mandala Sampoerna Tbk PT 137,500 965,811
Public Bank Bhd 142,900 716,899
SJM Holdings Ltd 966,000 662,466
Cia Energetica de Minas Gerais - Pref 146,256 561,441
Cashbuild Ltd 27,307 546,156
Parkson Retail Asia Ltd 952,000 421,292

BMO INVESTMENTS II (IRELAND) PLC
84
BMO LGM Global Emerging Markets Growth and Income F und cont/d
Major Sales (cont/d) Shares Proceeds USD
Titan Co Ltd 55,860 375,522
Nestle India Ltd 3,620 337,577
Emami Ltd 15,816 279,741
Bata India Ltd 12,706 245,423

BMO INVESTMENTS II (IRELAND) PLC
85
BMO LGM Greater India Fund Listed below is the 1% of the total value of purchases and sales during the year ended 31 December 2015.
Major Purchases Shares Cost USD
ITC Ltd 41,507 221,834
Housing Development Finance Corp Ltd 10,778 206,664
HDFC Bank Ltd 10,424 190,843
ICICI Bank Ltd 38,225 189,207
Yes Bank Ltd 15,601 178,756
Container Corp Of India Ltd 6,652 151,444
Pidilite Industries Ltd 15,803 136,728
Bajaj Auto Ltd 3,863 136,672
Emami Ltd 8,294 135,591
United Spirits Ltd 2,660 135,417
Mahindra & Mahindra Financial Services Ltd 33,166 135,317
UltraTech Cement Ltd 2,941 133,218
Jubilant Foodworks Ltd 5,189 125,796
Kotak Mahindra Bank Ltd 8,502 110,644
Titan Co Ltd 19,557 110,547
Shriram Transport Finance Co Ltd 7,812 107,748
Shriram City Union Finance Ltd 3,799 105,283
Nestle India Ltd 1,033 104,969
Colgate-Palmolive India Ltd 3,343 101,541
Bata India Ltd 5,213 99,467
Federal Bank Ltd 71,784 86,457
Zee Entertainment Enterprises Ltd 14,400 84,218
Bajaj Corp Ltd 11,009 81,281
Escorts Ltd 29,286 69,440
Hindustan Unilever Ltd 5,080 65,943
Infosys Ltd 1,873 64,619
Tata Consultancy Services Ltd 1,590 64,482
HCL Technologies Ltd 2,364 64,181
Larsen & Toubro Ltd 1,845 48,763
Lupin Ltd 1,900 47,515 Major Sales Shares Proceeds USD
Larsen & Toubro Ltd 1,845 39,762
Housing Development Finance Corp Ltd 1,530 31,514
Mahindra & Mahindra Ltd 1,490 29,607
LIC Housing Finance Ltd 4,030 29,499
HCL Technologies Ltd 1,620 27,330
State Bank of India 6,230 27,067
Infosys Ltd 870 26,862
Tata Consultancy Services Ltd 680 26,821
Hero MotoCorp Ltd 700 25,753
Sun Pharmaceutical Industries Ltd 2,270 25,432
Tata Motors Ltd 3,819 24,097
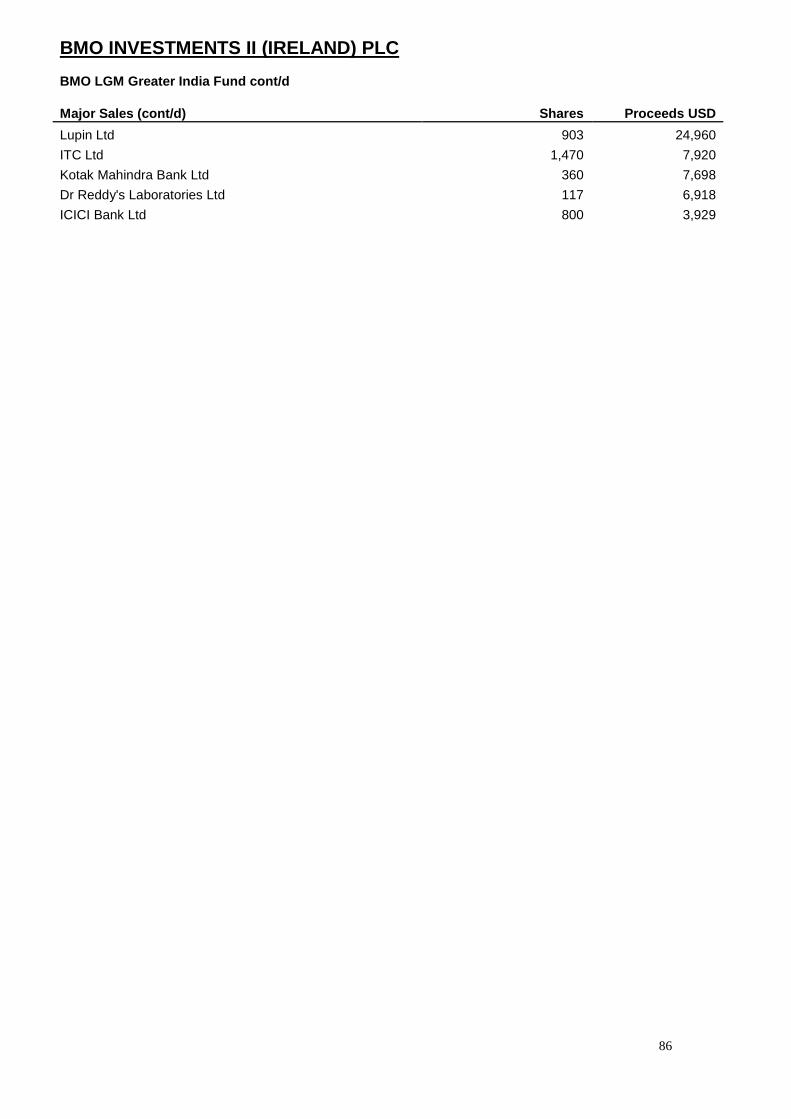
BMO INVESTMENTS II (IRELAND) PLC
86
BMO LGM Greater India Fund cont/d Major Sales (cont/d) Shares Proceeds USD
Lupin Ltd 903 24,960
ITC Ltd 1,470 7,920
Kotak Mahindra Bank Ltd 360 7,698
Dr Reddy's Laboratories Ltd 117 6,918
ICICI Bank Ltd 800 3,929

BMO INVESTMENTS II (IRELAND) PLC
87
BMO LGM Asian Smaller Companies Fund Listed below is the 1% of the total value of purchases and sales during the year ended 31 December 2015.
Major Purchases Shares Cost USD Jyothy Laboratories Ltd due 03/01/2018 Deutsche Bank AG (Participation Note) 120,150 537,266
Bata India Ltd due 23/02/2022 - Deutsche Bank AG (Participation Note) 23,570 459,530
NagaCorp Ltd 608,000 380,045 Emami Ltd due 12/02/2016 Citigroup Global Markets Holdings (Participation Note) 21,910 371,495 Mahindra & Mahindra Financial Services Ltd due 17/03/2017 Morgan Stanley Asia Products Ltd (Participation Note) 85,640 360,399
Ace Hardware Indonesia Tbk PT 5,969,100 347,632
Silverlake Axis Ltd 379,600 337,950
OSIM International Ltd 207,900 308,995
Giant Manufacturing Co Ltd 33,000 305,643 Federal Bank Ltd due 12/02/2016 Citigroup Global Markets (Participation Note) 159,840 286,746
MK Restaurants Group PCL 150,700 280,078
Tune Protect Group Bhd 511,900 274,635 Jubilant Foodworks Ltd due 12/02/16 Citigroup Global Markets (Paticipation Note) 11,080 272,383
Dah Sing Financial Holdings Ltd 45,600 258,032
TICON Industrial Connection PCL 488,800 256,843
Sa Sa International Holdings Ltd 504,000 256,517
Dialog Group BHD 595,400 255,310
Super Group Ltd 231,200 231,916
Singapore Post Ltd 161,500 230,773
Hotel Shilla Co Ltd 2,720 229,973
Stella International Holdings Ltd 90,500 229,697
iKang Healthcare Group (ADR) 13,135 225,920
Bajaj Corp Ltd 33,524 216,080
Mayora Indah Tbk PT 106,300 212,815
Petra Foods Ltd 72,300 208,157
Formosa International Hotels Corp 20,000 202,849
Major Cineplex Group PCL 230,500 199,245
Poya International Co Ltd 23,000 197,528
Oldtown Bhd 394,200 189,435
PAX Global Technology Ltd 186,000 185,747
Thai Reinsurance PCL 2,024,200 181,185
Skyworth Digital Holdings Ltd 244,000 179,882
Commercial Bank of Ceylon Plc 113,900 158,415
Biostime International Holdings Ltd 48,000 157,846
CJ O Shopping Co Ltd 770 152,566
Beauty Community PCL 119,000 151,614
Escorts Ltd 55,000 123,700

BMO INVESTMENTS II (IRELAND) PLC
88
BMO LGM Asian Smaller Companies Fund cont/d Major Purchases (cont/d) Shares Cost USD
Mahindra & Mahindra Financial Services Ltd 29,727 109,434
Clipan Finance Indonesia Tbk PT 3,307,300 102,007 Major Sales Shares Proceeds USD
Sa Sa International Holdings Ltd 504,000 167,179
Biostime International Holdings Ltd 48,000 134,183
OSIM International Ltd 109,700 131,796
PAX Global Technology Ltd 74,000 109,411 Jyothy Laboratories Ltd due 03/01/2018 Deutsche Bank AG (Participation Note) 12,491 60,986 Emami Ltd due 12/02/2016 Citigroup Global Markets Holdings (Participation Note) 1,945 36,939 Jubilant Foodworks Ltd due 12/02/16 Citigroup Global Markets (Paticipation Note) 1,076 30,734