bo becker stockholm school of economics, cepr and ecgi
TRANSCRIPT

DISRUPTION AND CREDIT MARKETS
Bo Becker
Stockholm School of Economics, CEPR and ECGI
Victoria Ivashina Harvard University, CEPR and NBER
This draft: January 30, 2019
Abstract
In the past thirty years, defaults on corporate bonds have been substantially higher than the historical average. We show that this increase in credit risk can be largely attributed to an increase in the rate at which new and fast-growing firms displace incumbents (a phenomenon sometimes referred to as ‘disruptive innovation’). Industries with a lager presence of firms newly listed on the stock market, as well as industries that receive funding from venture capital, have a higher loss of revenue market share for established firms and subsequently see a rise in corporate bond defaults. Patent filings by individuals as opposed to corporations also predict defaults. These results are not affected by inclusion of controls for industry exposure to offshore manufacturing.
Keywords: Disruption, default, corporate bonds.
JEL Codes: G32, G30, G12.
_______________________________________
We thank participants at the seminars and conferences held at Federal Reserve Bank of Boston, Stockholm School of Economics, Lancaster University and Cass Business School, as well as Ramin Baghai, Miguel Ferreira, Paolo Fulghieri, Mariassunta Giannetti, Marcus Opp, Dennis Sosyura, and Per Strömberg for their feedback. Dmitry Kurochkin and Terrance Shu provided remarkable assistance with the analysis. Harvard Business School Private Capital Project provided support for this project. All errors and omissions are our own.
Electronic copy available at: https://ssrn.com/abstract=3327798

1. Introduction
According to Moody’s Annual Default study, in the 1950s, the average annual default rate on
corporate debt was 0.53%. The same figure for in 1970s was 2.06%, and in the new millennium,
4.31% (Moody’s, 2017). In part, this increase was driven by economic cycles and the depth of
recessions. But, as Figure 1 illustrates, even after removing periods of economic recessions, there
is a significant difference in corporate default rates between the three decades starting in 1960
and the three decades that followed. The magnitude of the rise in default risk is economically
large, comparable to that of cyclical swings. Moreover, the pattern holds across credit ratings and
credit types including loans and bonds, instruments with different call protections, and senior as
well as subordinated debt.1 We propose that rising disruption—a phenomenon when new or less-
established firms gain an advantage in terms of commercial and/or technological innovation
(Bower and Christensen 1995, 1996)2—is a fundamental driver behind the rise in corporate debt
defaults.
[FIGURE 1]
Indeed, disruption has accelerated in recent decades. In its “Internet Trends 2018” report,
Kleiner Perkins’—a leading venture capital (VC) firm—shows that the time it takes for new
1 This is also consistent with other aggregate trends in the debt market such as the rise in the use of short-term debt (Custόdio, Ferreira and Laureano, 2012). 2 We mostly use the term “disruption” to represent the general process of less established firms (new entrants or firms with initially low market share, e.g., JetBlue and Southwest in case of the commercial airlines industry) replacing old market leaders (Bower and Christensen, 1995). “Creative destruction” (Schumpeter 1942) and other terms have similar meaning, and we do not attempt to sort out the exact relationship between these concepts.
Electronic copy available at: https://ssrn.com/abstract=3327798

2
technologies to become widely adopted has been systematically shrinking since the late 1960s,
with a very fast and near-universal adoption of social media and smart phones (some of the recent
technology-related innovations) illustrating this phenomenon.3 Although several aggregate
indicators, including the rate of start-up growth and the share of scalable companies among start-
ups, suggest a decline in entrepreneurial activity (www.kauffman.org/kauffman-index), recent
efforts to account for entrepreneurial quality indicate substantial heterogeneity across firms and
an overall rise in start-up quality (Guzman and Stern, 2015). In line with this observation,
academic research has identified several factors that have contributed to the acceleration of
disruption in the recent decades, including the information-technology revolution (Greenwood
and Jovanovic, 1999; Brynjolfson and McAffee, 2012), rise in VC funding (Kortum and Lerner,
2000; Gompers and Lerner, 2001), the rising importance of intangible assets (Lev, 2017), and
globalization (Melitz, 2003; Mayer, Melitz and Ottaviano, 2014).
The time-series pattern in disruption offers a possible explanation for the aggregate trend in
credit risk. However, a convincing test of the link between disruption and defaults must rely on
cross-sectional evidence. There is simply not enough variation in the time series, and too many
parallel long-term trends, to take the time-series correlation seriously as an identification of causal
relationships. Instead, we test the connection between disruption and credit risk by exploiting the
fact that industries differ in the intensity with which they experience the arrival of disruptive
firms, and that this intensity varies over time. Although the rate of technological change in many
industries is likely to have increased after the arrival of information technology (IT), there has
3 https://www.kleinerperkins.com/perspectives/internet-trends-report-2018/.
Electronic copy available at: https://ssrn.com/abstract=3327798

3
been considerable variation in the rate and depth of the impact across industries. Similarly, VC
firms are known to have concentrated portfolios and often focus on certain industries (e.g.,
Hochberg, Mazzeo, and McDevitt, 2015).
By design, our analysis is constrained to disruption that occurs among firms operating in the
same industry, but we acknowledge that the scope of disruption phenomenon transcends
industry definitions. One example is Google’s online advertising which “stole” the advertising
market that previously supported local newspapers. Kamarck and Gabriele (2015) report that US
newspaper advertising revenue dropped by about half from 2005 to 2010. Also, to the extent that
assigning firms to industries is imperfect—industries do not necessarily have clean borders with
each other, firms often operate in several industries at once, and so on—our various identification
strategies using industries will introduce noise and bias coefficients of interest toward zero.4
We use two main measures of successful firm entry (or expansion) at the industry level. First,
we compute the fraction of listed firms in an industry that had an initial public offering (IPO) in
the last (i) five-years and (ii) three-years. Our main variable uses the number of IPOs to compute
the share of the new firms. As a robustness test, we also look at the revenue share and enterprise-
value share of recently listed firms. Our main alternative measure of new firm arrival is the
amount of VC investment in each industry. Whereas only large and successful new firms tend to
IPO, VC funding typically backs firms with significant growth potential in their initial stages of
operation, including brand new firms. Thus, VC investments allow us to specifically focus on the
4 For much of the analysis we will use Fama-French 30 as industry classification, but our results are not sensitive to the industry definition that we use.
Electronic copy available at: https://ssrn.com/abstract=3327798

4
fastest growing start-ups. In addition, mature leading companies can be taken private and re-
listed repeatedly (e.g., HCA, First Data Corp., JCrew, to name a few); using VC funding as a
measure of disruption helps us to distance our results from this issue. However, the fact that our
benchmark variable uses number of IPOs in the industry and not a value-weighted measure also
ameliorates this issue. Furthermore, multiple sources indicate that IPOs as an exit are actually
rather infrequent in the private equity industry in general.
Using IPO- and VC- based measures of disruption, we relate new firm arrival to future
defaults on corporate bonds issued by firms in the industry. Since most bonds are issued by
mature firms, whereas new firms predominantly use equity, this analysis captures the impact of
new firms on more mature firms. But, in addition, we also explicitly restrict the sample to older
firms.
We document a positive relation between credit risk and measures of new firm arrival:
industries with the highest share of IPOs for the 1970-2017 period have higher defaults. More
importantly, this connection holds within industries and years, i.e., in a panel setting with fixed
effects for both dimensions. The magnitudes are large: for a given industry, if IPO share is
increased by one standard deviation, the corresponding annual default rates go up by about half.
Thus, for a ten year bond, the likelihood of ending in a default would increase from around 4.2%
(sample mean) to 7.5% (adjusted for the estimated effect of higher IPO share). Using the cross-
industry average increase in IPO share in this period, our estimate implies that disruption may
explain most (80%) of the long-term trend documented in Figure 1. Using VC activity as a
measure of disruption renders even stronger results.
Electronic copy available at: https://ssrn.com/abstract=3327798

5
We examine whether our results are sensitive to industry exposure to globalization, an
important alternative explanation to long-term drivers of disruption. Econometrically, industry
exposure to offshoring is not related to future defaults, and controlling for it does not change the
coefficient estimates on our main variables of interest. We also examine the relationship between
the disruption associated with IPOs and VC funding and the broader phenomenon of
technological change. Specifically, we look at research and development (R&D) activity in listed
firms, as well as innovation activity as measured by patent counts by firms in an industry, in
relation to defaults. Both variables have negative relationships with default rates, perhaps
reflecting that innovation by incumbents produces barriers to entry (e.g., Bain, 1954). This
relationship does not appear to alter the estimated effect of VC investments and IPOs, suggesting
that technological change driven by incumbents does not explain our findings on disruption and
default.
One possible identification challenge to our results is reverse causality: it is possible that the
decline of incumbents is not driven by the disruptive growth of less-established firms; instead,
entry of new firms and growth opportunities for smaller firms in the industry are spurred by
anticipation of the decline of the industry leaders. In this scenario, Google would have been
started in part to exploit future challenges that local newspapers were going to face, and the
founders of Uber and Lyft would have been motivated by expected performance problems in
rental car firms and local taxi systems. This explanation of the origins of entrepreneurship differs
from standard accounts, which tend to highlight technological opportunities (e.g., Gompers and
Lerner, 2001), capital supply (e.g., Gompers and Lerner, 2000; Kortum and Lerner, 2000, Mollica
and Zingales, 2007) and demographics (e.g., Hopenhayn, Neira and Singhania, 2018) as its core
Electronic copy available at: https://ssrn.com/abstract=3327798

6
drivers. Moreover, the extent of the entrepreneurs’ foresight would have to have been
considerable: our analysis documents correlation between IPOs and VC funding and defaults five
years out.5 On the other hand, lagged default rates in industries are not correlated with incidence
of IPOs and VC investments.
Additional support for the arrival of new firms triggering problems for older firms comes
from evidence on patent rates. If there are more patents filed by new entrants, we expect that
incumbents firms will be disadvantaged (and vice versa). We proxy for the type of patent by
separating individual patent filers (proxying for entrants) from corporate patents filers (proxying
for incumbents). We find that future default rates are higher when many patents are filed by
individuals, but lower when many patents are filed by firms. Given that patenting activity is
unlikely to be directly caused by future problems in incumbent firms, these results are most
supportive of a model where causality runs from technological opportunities captured by
entering firms, to trouble for incumbent firms, observed through defaults.
The results on patenting activity also point to the role of technology as the root cause of
disruption. Technology in general, and the internet specifically, has played a large role in the
disruption and increased firm turnover many industries have been experiencing recently.
Examples include bookstores, newspapers, taxis and rental cars, telecommunications, and travel
agents. However, other channels of disruption are possible, and we ultimately do not take a stand
5 Our key results use cumulative disruption activity measured over [t-4, t] to predict default in year t+1. (The highest correlation is with defaults at t+2, e.g., between IPOs in years 1991-1995 and defaults in 1998). If instead we use lagged defaults—e.g., defaults in t-2—the regression do not hold.
Electronic copy available at: https://ssrn.com/abstract=3327798

7
on the exact founts of disruption. For example, in the airline industry, the conventional wisdom
is that many legacy airlines suffered from high labor costs, lack of flexibility, and poor operating
efficiency, which was sustainable in part due to low competition created by regulatory barriers
to entry. The success of some of the new entrants, therefore, was at least in part facilitated by
deregulation. We will explore some of these other channels later in the paper.
The central contribution of our paper is the connection between the rise in industries
disruption as a key cause behind long-term rise in defaults of mature firms. There are several
reasons why this insight is important. First, our results suggest that disruption has different
impact on different classes of investors and securities markets. While entrepreneurs benefit from
innovation (Kaplan and Rauh, 2009; Kogan, Papanikolau and Stoffman, 2017), and investors in
startups do as well (Kaplan and Schoar, 2005), investors more broadly may not. For retail
investors who have limited opportunity to invest in young firms and startups (because VC funds
do not raise funding from public sources), the greatest financial impact of disruption may be
losses in publicly traded securities to which their access is not restricted. Greenwood and
Jovanovic (1999) make a similar point, comparing the distribution of public stock equity returns
to entrepreneurial rents. Overall, this implies that financial markets may amplify the
distributional impact of disruption on labor markets (Acemoglu and Autor 2011; Autor et al.,
2017). Just as low-skilled workers may see unfavorable labor income trends as technology drives
Electronic copy available at: https://ssrn.com/abstract=3327798
8
disruption, small investors who invest in public bond markets but not VC may lose out financially
for the same reasons.6
Second, our results have implications for corporate credit markets. Higher rates of disruption
may help explain seemingly tougher corporate credit rating standards (Blume, Lim, Mackinlay,
1998; Baghai, Servaes, Tamayo, 2014). Tougher ratings standards in terms of financial ratios may
reflect an increased risk of disruption: for any current performance indicator (low leverage, high
interest coverage, and so on), the risk that an issuers’ market position and earnings power will
deteriorate due to entry of new firms has increased. Rating agencies do in fact consider business
risk. For example, in 2013, Fitch claimed that Apple did not deserve an AA credit rating because
of the “inherent business risk that overshadows a significant liquidity cushion.” Higher
background risk might also explain why corporate leverage has not changed much (Lemmon,
Roberts, Zender, 2008), despite generally favorable credit market conditions and rising debt levels
in the public sector (e.g., Kalemli-Özcan, Reinhart, Rogoff 2016) and for households (Mian, Sufi,
Verner 2017).7
Third, our results have implications for fixed income portfolios and their returns. If disruption
has an economy-wide component, for example, reflecting broad technological shifts, fixed income
markets may face structurally higher default rates when disruption accelerates. This may be
reflected in broader portfolio return structures.
6 Although pension funds (as a group) are the largest fund contributors to the private equity industry and VC in particular. There is substantial heterogeneity across pension funds in their engagement, choices of allocations, and investment success in the private equity field. For review see Ivashina and Lerner (2019). 7 See also Campbell and Taklser (2003), who connect firm risk with debt pricing.
Electronic copy available at: https://ssrn.com/abstract=3327798

9
The rest of this paper is structured as follows: Section 2 describes the data used in the analysis,
Section 3 presents the results and explores alternative explanations, and the final section
concludes the paper.
2. Data
In this study, we use multiple data sources including Mergent FISD, Compustat, CapitalIQ,
VentureXpert, and data from the U.S. Patent and Trademark Office.
Our main analysis covers the sample between 1970 and 2017. Data on corporate bond histories
comes from Mergent FISD. We collect a number of variables measuring bond characteristics: the
amount of the bond (issued amount, in millions of dollars), callability, the presence of covenants,
and seniority. We drop all convertible bonds from the sample. We construct a bond-year panel of
every issued bond that is not matured, reorganized, called, or exchanged. Default is defined by
Mergent as a bond being “reorganized”; this includes bankruptcy but also other types of defaults.
Common bond exchanges do not classify as reorganization.
To analyze time-trend in corporate default we complement Mergent data with Moody’s
annual data on default rates by industry and rating class from Moody’s “Annual Default Study:
Corporate Default and Recovery Rates, 1920-2016 - Excel data”. These data have overlap with the
Mergent series, with the exception that defaults here include loans and exclude bonds not rated
by Moody’s. Much of the early period is hard to assess using corporate bonds, since that market
was less developed. Because the Moody’s dataset also covers other corporate debt (i.e., loans), it
offers better visibility on the earliest post-WWII period.
Electronic copy available at: https://ssrn.com/abstract=3327798

10
Industry classifications are central to our analysis as they underpin the incumbent market
leaders and the entry/growth activity of their disruptors (as a group). The limitations of the
standard industry classifications might be particularly problematic for our analysis. For example,
large, established companies likely operate in more than one segment. This could result in
superficial industry reclassifications (Chen, Cohen, and Dong, 2016), or erroneous assignments,
leading us to associate a firm with the wrong level of disruption activity. To minimize these
problems, we use risk-based industry groupings downloaded from Kenneth French’s website. In
the regression analysis, we will use Fama-French 30 industry classifications. This approach has
its own caveats, however, we find it to be a more credible way to identify companies that might
compete against each other.
We calculate the expansion of newer, fast-growing firms in each industry using data on IPO
dates from Compustat. The main variable, IPO share, is the fraction of listed firms in an industry
with an IPO date in the previous five years. This is not the same as the number of IPOs in the
industry over the preceding years, as it relies on firms remaining alive and listed. In addition, we
calculate two alternative versions of this variable using preceding three- and five-year windows:
(i) IPO firms’ revenue share and (ii) IPO firms’ share of enterprise value (market value of equity
plus long-term and short-term debt).
We measure venture capital and growth equity investment by industry using data from
CapitalIQ. We collect all unique, closed transactions with targets located in the U.S., classified as
“Venture Capital Equity Investments”. CapitalIQ has a large number of deals and provides
additional details such as VC fund stage. However, it is less used in the literature, and we
complement it with venture investment data from Thomson One/VentureXpert which has been
Electronic copy available at: https://ssrn.com/abstract=3327798

11
used in multiple studies (e.g., Kaplan and Lerner, 2016). The two data sources produce very
similar results across industry-years: the correlation is in the range of 0.85 to 0.97, depending on
whether logs are used and whether deal count or deal value is being assessed. On average, Capital
IQ contains more deals (about twice as many in aggregate) and has more data in early years of
the sample.
We use a number of variables that vary by industry or by industry-year, including firm-level
controls from Compustat. Summary statistics for these and other variables are reported in Table
1. We lag all time-varying independent variables relative to bond default outcomes.
[TABLE 1]
To tie our results closer to innovation, we calculate R&D spending by public firms as a fraction
of total assets. As an alternative measure of the role of technology, we use patent filings. We collect
data on US patents from U.S. Patent and Trademark Office. There were more than 7 million
patents filed in the 1955-2016 period. We categorize patents into NAICS industry codes using a
process described in Appendix 1. We assign patents to the year in which they are filed (not
granted). We also count citations to patents, with truncation at year five. Over the long timespan
our sample covers, there are trends in patent filings, grants, and citations, as well as cross-
industry differences (Lerner and Seru, 2017). Since we include year- and industry-fixed effects,
we believe this procedure produces a useful measurement of innovation. We divide patents into
those filed by a business firm and those only naming individual inventors (firm patent
applications often mention individuals as well). We do this by developing a dictionary of terms
identifying firms, which we use to classify firms.
Electronic copy available at: https://ssrn.com/abstract=3327798

12
Finally, to distinguish our hypothesis from globalization effects, we use offshoring potential
from Bretscher (2017).8 This measure is based on occupational content and indicates to which
extent an industry has production that can be moved from the US to other countries. This variable
has wider firm coverage than a similar variable in Acemoglu and Autor (2011).
3. Empirical tests
3.1 Corporate performance and default risk
The core insight of our paper is the connection between industry disruption and the structural
shift in corporate defaults. However, we start by providing evidence for the underlying channel.
It is well known (and it ought to be the case) that credit quality deterioration is a function of a
firm’s financial health (e.g., Altman, 1968). Several factors might drive a firm’s poor financial
performance, such as shrinking demand or industry-wide rising costs. For our hypothesis,
however, it is important to show that loss of market share to new entrants lies at the heart of the
drop in revenues. To see this more clearly, we can decompose EBITDA growth for firm 𝑖𝑖 operating
in industry 𝐽𝐽 in the following way:
∆𝐸𝐸𝐸𝐸𝐸𝐸𝐸𝐸𝐸𝐸𝐸𝐸 𝑖𝑖 = ∆(𝑅𝑅𝑅𝑅𝑅𝑅𝑅𝑅𝑅𝑅𝑅𝑅𝑅𝑅 𝑖𝑖 ∗ 𝑀𝑀𝑀𝑀𝑀𝑀𝑀𝑀𝑖𝑖𝑅𝑅𝑖𝑖)
= ∆�𝑀𝑀𝑀𝑀𝑀𝑀𝑀𝑀𝑅𝑅𝑀𝑀 𝑠𝑠𝑖𝑖𝑠𝑠𝑅𝑅𝐽𝐽 ∗ 𝑅𝑅𝑅𝑅𝑅𝑅𝑅𝑅𝑅𝑅𝑅𝑅𝑅𝑅 𝑚𝑚𝑀𝑀𝑀𝑀𝑀𝑀𝑅𝑅𝑀𝑀 𝑠𝑠ℎ𝑀𝑀𝑀𝑀𝑅𝑅𝑖𝑖 ∗ 𝑀𝑀𝑀𝑀𝑀𝑀𝑀𝑀𝑖𝑖𝑅𝑅𝑖𝑖�
≈ ∆𝑀𝑀𝑀𝑀𝑀𝑀𝑀𝑀𝑅𝑅𝑀𝑀 𝑠𝑠𝑖𝑖𝑠𝑠𝑅𝑅𝐽𝐽 + ∆𝑅𝑅𝑅𝑅𝑅𝑅𝑅𝑅𝑅𝑅𝑅𝑅𝑅𝑅 𝑚𝑚𝑀𝑀𝑀𝑀𝑀𝑀𝑅𝑅𝑀𝑀 𝑠𝑠ℎ𝑀𝑀𝑀𝑀𝑅𝑅 𝑖𝑖 + ∆𝑀𝑀𝑀𝑀𝑀𝑀𝑀𝑀𝑖𝑖𝑅𝑅𝑖𝑖.
(1)
For disruption to have an effect on corporate defaults, it is not essential to look at growing
markets (i.e., ∆𝑀𝑀𝑀𝑀𝑀𝑀𝑀𝑀𝑅𝑅𝑀𝑀 𝑠𝑠𝑖𝑖𝑠𝑠𝑅𝑅𝐽𝐽 > 0). Reallocation of revenue share from incumbents to disruptors
8 We thank Lorenzo Bretscher for generously sharing this data with us.
Electronic copy available at: https://ssrn.com/abstract=3327798

13
could take place in a stale or declining industry. Indeed, the tobacco industry is one example of
this.9 The prediction for the EBITDA margin (∆𝑀𝑀𝑀𝑀𝑀𝑀𝑀𝑀𝑖𝑖𝑅𝑅𝑖𝑖) is also ambiguous. Disruptors could be
more efficient at cost management, however, it is likely that to a large degree this is passed to the
consumer. Notably, despite consistent and staggering revenue growth, Amazon’s profit margin
was miniscule until recently. But, ultimately, disruptive changes have to be reflected in the rising
leader’s gain in market share at the expense of the incumbent (∆𝑀𝑀𝑀𝑀𝑀𝑀𝑀𝑀𝑅𝑅𝑀𝑀 𝑠𝑠ℎ𝑀𝑀𝑀𝑀𝑅𝑅 𝑖𝑖 > 0).
The US commercial airline industry illustrates the connection between the entry of new firms,
incumbents’ loss of market share and profitability, and subsequent defaults of those
incumbents.10 The airline industry is a good case because the main service of passenger airlines
is homogenous, the market size is relatively inflexible, and market shares are accurately tracked
with the US Department of Transport reporting passenger miles flown. It also happens to be an
industry that has experienced considerable disruption. Many US airlines, including United
(founded 1926), TWA (founded 1924), American (founded 1936), Delta (founded 1924), Northwest
(founded 1926), ATA (founded 1973), and World Airways (founded 1948) have defaulted on their
debt, historically. Importantly, this happened after they lost market share to the new entrants to
the industry: Southwest (founded in 1968) and JetBlue (founded in 1998). This is shown in Figure
2.
9 See “Big Tobacco Has Caught Startup Fever,” Bloomberg, March 8, 2017. 10 Another tangible examples of industries experiencing disruption when new firms introduce new technologies or new business models is book selling: off-line bookstores suffered considerably from Amazon’s growth (Borders filed for bankruptcy in 2011).
Electronic copy available at: https://ssrn.com/abstract=3327798
14
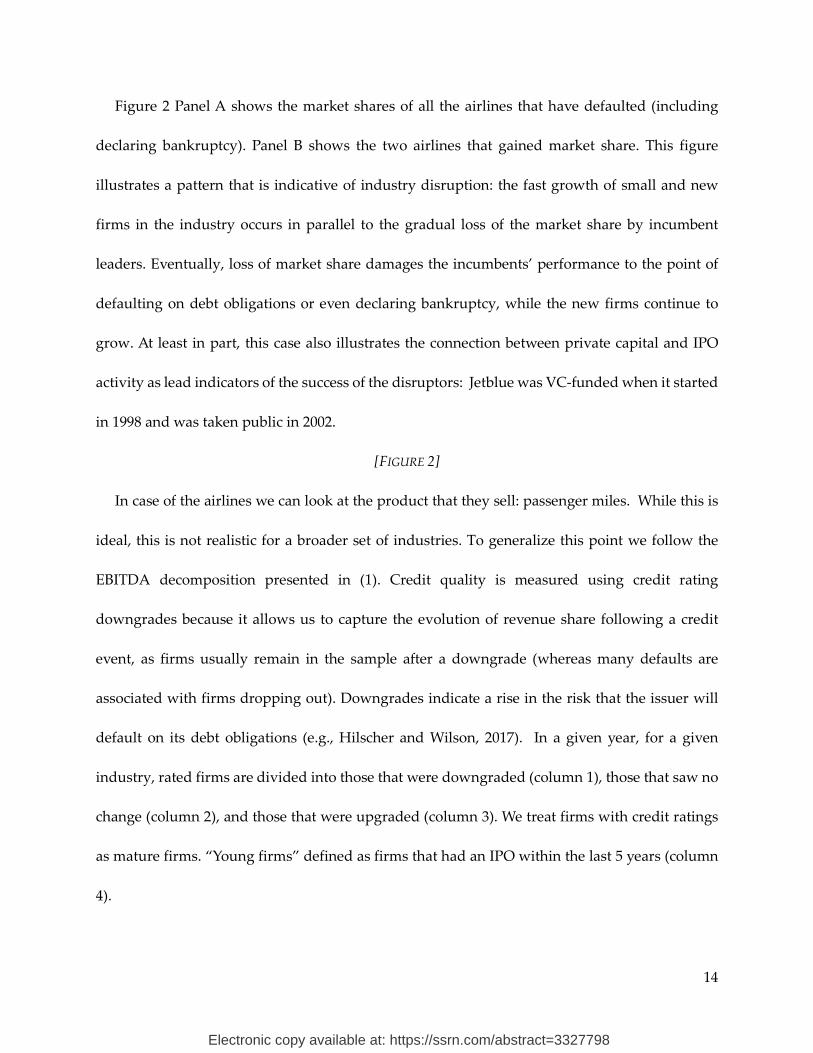
Figure 2 Panel A shows the market shares of all the airlines that have defaulted (including
declaring bankruptcy). Panel B shows the two airlines that gained market share. This figure
illustrates a pattern that is indicative of industry disruption: the fast growth of small and new
firms in the industry occurs in parallel to the gradual loss of the market share by incumbent
leaders. Eventually, loss of market share damages the incumbents’ performance to the point of
defaulting on debt obligations or even declaring bankruptcy, while the new firms continue to
grow. At least in part, this case also illustrates the connection between private capital and IPO
activity as lead indicators of the success of the disruptors: Jetblue was VC-funded when it started
in 1998 and was taken public in 2002.
[FIGURE 2]
In case of the airlines we can look at the product that they sell: passenger miles. While this is
ideal, this is not realistic for a broader set of industries. To generalize this point we follow the
EBITDA decomposition presented in (1). Credit quality is measured using credit rating
downgrades because it allows us to capture the evolution of revenue share following a credit
event, as firms usually remain in the sample after a downgrade (whereas many defaults are
associated with firms dropping out). Downgrades indicate a rise in the risk that the issuer will
default on its debt obligations (e.g., Hilscher and Wilson, 2017). In a given year, for a given
industry, rated firms are divided into those that were downgraded (column 1), those that saw no
change (column 2), and those that were upgraded (column 3). We treat firms with credit ratings
as mature firms. “Young firms” defined as firms that had an IPO within the last 5 years (column
4).
Electronic copy available at: https://ssrn.com/abstract=3327798

15
The results in Table 2 indicate that downgraded firms tend to have declining market shares
and falling profitability. As one would expect, upgraded firms perform better on all dimensions.
The focus is on younger firms which—in line with our hypothesis—show a substantial gain in
revenue market share. While the annual revenue market share growth for downgraded firms is -
4.2%, recently listed firms show an average gain of 12.2%, substantially exceeding the 6.5%
market share gain for upgraded firms.
[TABLE 2]
To understand better whether the loss of market share by mature firms is tied to the market
share gained by younger firms, in Figure 3, we look at the change in revenue market share for
young (on the left) and mature (on the right) firms. Firms are sorted in terciles based on the
distribution of years since IPO. The figure is further broken down by the degree to which
industries have been disrupted; light bars indicate stable industries, and dark bars indicate
disrupted industries. To classify the degree of industry disruption, for every year, we do a sort
based on the fraction of firms that had an IPO in the past five years. For example, in 1995, for each
industry, we take the number of firms that had an IPO between 1991 and 1995 and scale it by the
total number of firms in that industry in 1995. We then group the industries in terciles. The
exercise is repeated for each year from 1970 to 2014, so the same industry could be allocated to
different terciles over time. The size of the bars correspond to the average three-year forward
change in revenue market share. That is, for each firm we compute:
𝑅𝑅𝑅𝑅𝑅𝑅𝑅𝑅𝑅𝑅𝑅𝑅𝑅𝑅𝑠𝑠𝑖𝑖,𝑡𝑡+3 �𝑅𝑅𝑅𝑅𝑅𝑅𝑅𝑅𝑅𝑅𝑅𝑅𝑅𝑅𝑠𝑠𝑖𝑖,𝑡𝑡+3 − 𝑅𝑅𝑅𝑅𝑅𝑅𝑅𝑅𝑅𝑅𝑅𝑅𝑅𝑅𝑠𝑠𝑖𝑖,𝑡𝑡 �𝑅𝑅𝑅𝑅𝑅𝑅𝑅𝑅𝑅𝑅𝑅𝑅𝑅𝑅𝑠𝑠𝑖𝑖,𝑡𝑡𝐽𝐽
� 𝐽𝐽
� .
Electronic copy available at: https://ssrn.com/abstract=3327798

16
Figure 3 indicates that, in high-IPO industries, disrupting firms gain market share, while the
stake of the more mature firms shrinks. This is in sharp contrast to firms in industries with low
IPO share. This relates to Hsu, Reed and Rocholl (2010) who document that IPOs are associated
with a loss of market value for incumbents in the same industry.
[FIGURE 3]
3.2 Cross-sectional drivers of default risk
We now turn to establishing the ability for successful firm entries (or expansions), measured
using within-industry IPO and VC funding activity, to predict defaults. Our main hypothesis is
that ascending firms put pressure on incumbents, thereby producing more frequent defaults
going forward. We start by using IPO industry share computed using the number of IPOs that
took place in a given industry over [t-4, t] period; defaults are measured in t+1. The source of
identification is variation in disruption across industries and within a particular industry over
time; that is, all regressions include year- and industry-fixed effects. As mentioned earlier, the
dependent variable, “default,” (𝐸𝐸𝑖𝑖) is dummy equal to 100 if a bond is restructured, according to
Mergent, and 0 otherwise.
Throughout, we double cluster errors on industry-year (the key dimension, as our explanatory
variable of interest varies at this level) and issuer (for a given firm, defaults tend to coincide in
time for all its outstanding bonds).
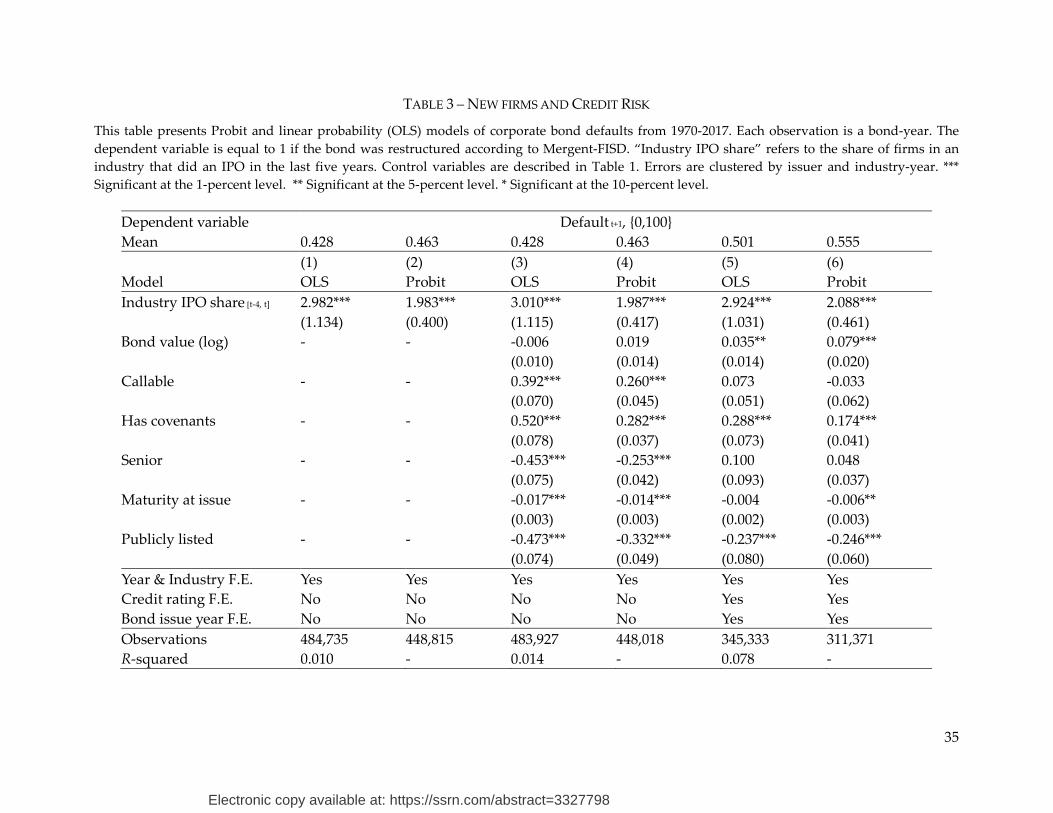
In Table 3 we report estimated coefficients using linear probability model (column 1, 3 and 5)
and probit model (2, 4 and 6). Linear probability models are easy to interpret but offer poor fit
(since the left-hand side variable is zero in around 99.5% of observations). We start with minimal
Electronic copy available at: https://ssrn.com/abstract=3327798
17
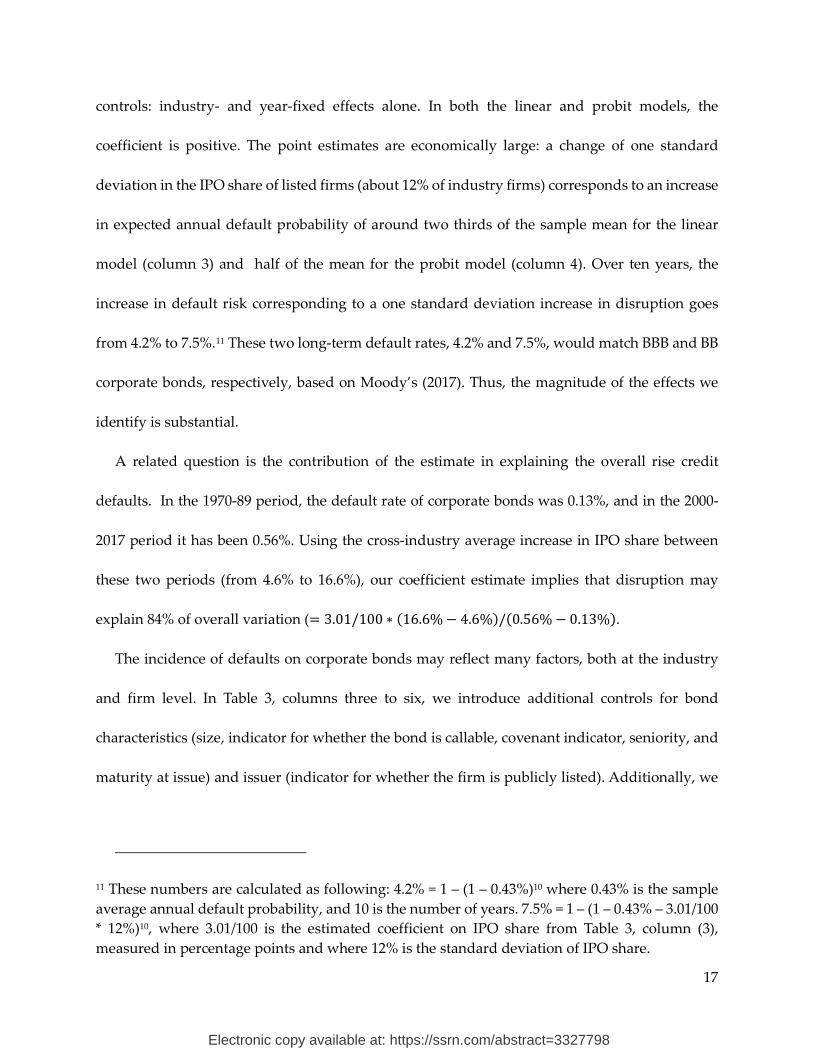
controls: industry- and year-fixed effects alone. In both the linear and probit models, the
coefficient is positive. The point estimates are economically large: a change of one standard
deviation in the IPO share of listed firms (about 12% of industry firms) corresponds to an increase
in expected annual default probability of around two thirds of the sample mean for the linear
model (column 3) and half of the mean for the probit model (column 4). Over ten years, the
increase in default risk corresponding to a one standard deviation increase in disruption goes
from 4.2% to 7.5%.11 These two long-term default rates, 4.2% and 7.5%, would match BBB and BB
corporate bonds, respectively, based on Moody’s (2017). Thus, the magnitude of the effects we
identify is substantial.
A related question is the contribution of the estimate in explaining the overall rise credit
defaults. In the 1970-89 period, the default rate of corporate bonds was 0.13%, and in the 2000-
2017 period it has been 0.56%. Using the cross-industry average increase in IPO share between
these two periods (from 4.6% to 16.6%), our coefficient estimate implies that disruption may
explain 84% of overall variation (= 3.01/100 ∗ (16.6%− 4.6%)/(0.56%− 0.13%).
The incidence of defaults on corporate bonds may reflect many factors, both at the industry
and firm level. In Table 3, columns three to six, we introduce additional controls for bond
characteristics (size, indicator for whether the bond is callable, covenant indicator, seniority, and
maturity at issue) and issuer (indicator for whether the firm is publicly listed). Additionally, we
11 These numbers are calculated as following: 4.2% = 1 – (1 – 0.43%)10 where 0.43% is the sample average annual default probability, and 10 is the number of years. 7.5% = 1 – (1 – 0.43% – 3.01/100 * 12%)10, where 3.01/100 is the estimated coefficient on IPO share from Table 3, column (3), measured in percentage points and where 12% is the standard deviation of IPO share.
Electronic copy available at: https://ssrn.com/abstract=3327798

18
introduce fixed effects for bond credit ratings and bond issue year, which may capture time
variation in bond quality. Many of the controls are significantly related to default rates, and
controls raise the OLS R-squared by about a third. Rating dummies quintuple the R-squared OLS.
The coefficient on the IPO variable is positive and significant in all the regressions with more
controls.
[TABLE 3]
In Table 4, we examine the robustness of benchmark results (Table 3, column 4) to sample
restrictions. The first three columns make sure that the effects we identify are not isolated to
peculiar and unrepresentative bond categories. Column (1) restricts the sample to bonds with a
credit rating. Column (2) restricts the sample the sample to bonds with face value (in 2015 dollars)
in excess of $500 million. Column (3) looks at older firms (listed at least five years). These results
help pinpoint losses in the more established firms in each industry, making sure we don’t pick
up losses in startups. In all these regressions, the coefficient on IPO share is positive and
significantly different from zero. The magnitude is similar to, or somewhat larger than, the
baseline result.
The last two columns in Table 4 are more focused on the source of the disruption. While, as
indicated in the introduction, we do not take a firm stand on causes of disruption, here and in
what follows we provide some evidence on this matter. In particular, in column (4), we exclude
industries that experienced considerable deregulation, that is, Fama-French 30 industries
classifications “Transportation”, “Petroleum and Natural Gas”, and “Communication”. In
column (5), we exclude “Banking, Insurance, Real Estate, Trading”. Although banking is heavily
regulated, and, most recently, many new regulations have been imposed on the sector, there have
Electronic copy available at: https://ssrn.com/abstract=3327798

19
been also important instances of deregulation over the long sample period used in this study. The
results with these exclusions still show a strong connection between IPO share and defaults. This
indicates that deregulation is not the sole nor the main factor behind our findings.
[TABLE 4]
In Table 5, we explore alternative ways to measure industry disruption. Using the benchmark
model, we first replace the number-based share of firms that had an IPO in the previous five years
with the share of industry enterprise value (defined as the sum of equity market value and book
value of debt) and revenues from firms with an IPO in the last five years (columns 1 and 2,
respectively). We also consider a three-year IPO window as an alternative (column 3). The results
remain economically and statistically strong.
In the remaining columns in Table 5, we depart from IPOs and instead look at start-up activity,
as measured by VC investments in the industry compiled from S&P’s CapitalIQ (column 5) and
Thompson’s VentureXpert (column 6). Once again, results using alternative IPO variables are
similar throughout. The VC variables individually predict defaults with slightly larger
magnitudes: an increase of one standard deviation in VC investments is associated with an
increase in the annual default risk of between one third (Capital IQ) and one half (VentureXpert).
The two measures are correlated but exhibit differences in level and cross-industry variation. For
a 10-year bond, this approximately doubles the risk of default during life from 4.5% to 7.0-9.0%.
Column (6) shows that the two venture variables are sufficiently uncorrelated to independently
predict defaults (the joint significance of the two variables is better than 1% in this regression).
This likely reflects differences in coverage for different sources of venture capital. Finally, while
the connection between disruption and venture capital is clear, the connection with other types
Electronic copy available at: https://ssrn.com/abstract=3327798

20
of private investment is less clear. To examine this, we add data buyout activity by industry for
each industry in column (7). The coefficient on venture capital is similar, while that on buyout is
imprecisely estimated and not very significant (p=8%).
[TABLE 5]
The results on default prediction show that industry-years with more new firms, measured by
recent IPOs or VC activity, are followed by elevated default rates for bonds issued by firms in the
industry. The parameter estimates are economically large. This is consistent with the hypothesis
that exposure to industry disruption is an important driver of credit risk.
3.3 Alternative drivers of default risk
We next examine broad trends that may affect the rate of disruption or directly impact defaults,
including technology and globalization.
There is little doubt that technological opportunities enable and encourage startup activity,
VC investment, IPOs and, eventually, the product market success of new firms. For example,
many successful new businesses from the last few years rely on information technology such as
the internet and smartphones. Some theories suggest that new firms should be more willing to
embrace new technologies (e.g., Bower and Christensen, 1996; and Brezis, Krugman and Tsiddon,
1991). However, the new technologies are likely to be used by incumbents, and one potential
mechanism is that technological advances might directly impact default rates. For example, this
could happen due to the risk in the adaptation of new technologies (Pástor and Veronesi, 2009),
change in the extent of the economies of scale (Kretschmer, Miravete and Pernías, 2012), or change
the need to standardize output (Katz and Shapiro, 1986).
Electronic copy available at: https://ssrn.com/abstract=3327798

21
One way to examine the direct channel of new technologies is to measure technological change
itself and include it in default prediction models. We start with the most conventional proxy of
technological development: R&D spending. While the variable is readily available for public firms
from Compustat, R&D spending is not reported by all public firms, and we are missing R&D data
for private incumbents and rising firms. With that limitation in mind, we aggregate R&D
spending by industry-year and normalize by industry sales (the results when using alternative
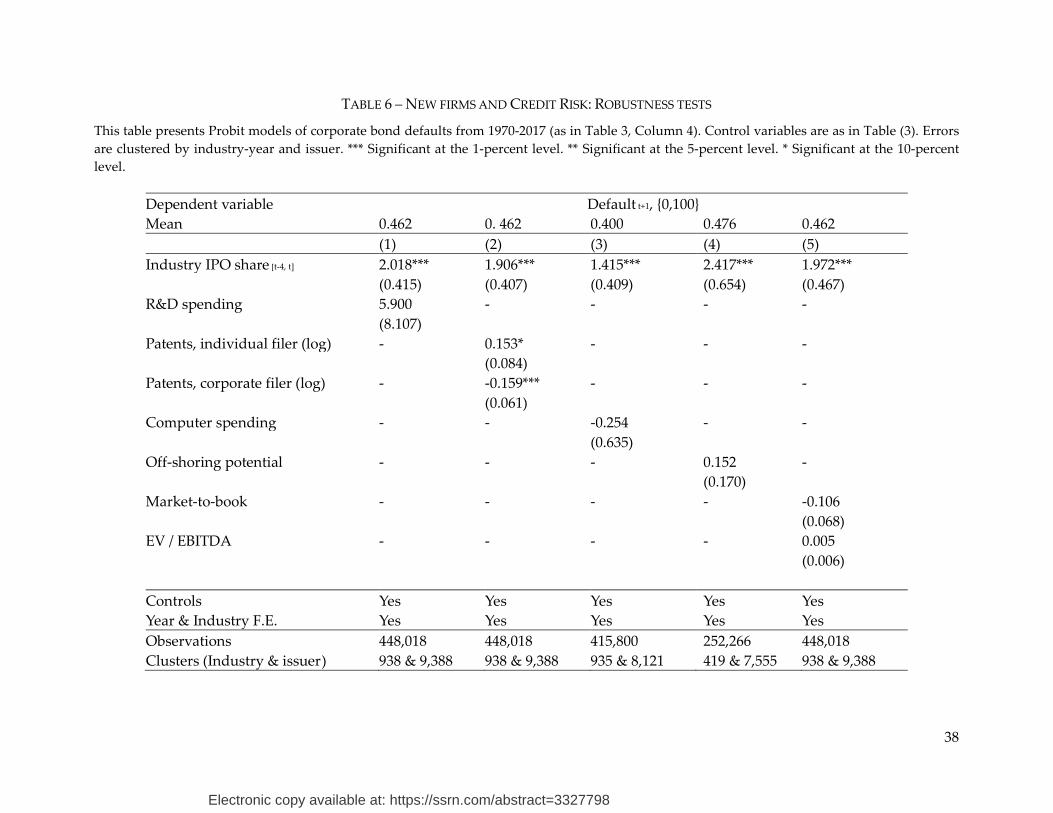
normalizations such as industry assets and EBIDTA are very similar). Table 6, column (1) reports
the result when lagged R&D spending is included. In addition to measurement noise, there are
clearly conflicting predictions here. If R&D spending is a sign of technological change that enables
entry and competition for incumbents, it will be associated with turnover and defaults. On the
other hand, if R&D spending erects barriers to entry, it may be associated with incumbent market
power (see, e.g., Autor et al., 2017). Presumably, both types of R&D may be captured in our
variable. Perhaps not surprisingly, the estimated coefficient (Table 6, column 1) is not statistically
different from zero.
Another important caveat of R&D spending is that it is a measure of effort, not results (e.g.,
Lerner and Seru, 2017). We are able to overcome several of the shortcomings using patent data to
construct a proxy for technological innovations. We associate patents to industries through
product classification codes, and since many patents are potentially associated with many
industries, we have a very large count of patents for each industry. The number of patents filed
has a strong positive time trend, but since we include time-fixed effects, this should not itself
impact results. Following the procedure described in the appendix, we separate patents filed by
individuals and those filed by firms. We think of patents filed by individuals as more likely to
Electronic copy available at: https://ssrn.com/abstract=3327798

22
generate disruption, whereas firm-filed patents are more likely to help incumbents protect their
competitive position. The results reported in column (2) are consistent with this observation: the
estimated coefficient is negative for patents filed by firms, but positive for patents filed by
individuals.
Finally, a large amount of disruption is connected to information technology, and R&D may
not capture this well. For example, a significant portion of spending may be on purchases of IT
equipment rather than R&D expenses. Thus, we collect data on IT spending from input-output
tables for the US economy. These data start in 2002, and in the reported results we compare 2002
IT spending levels to defaults in years preceding 2002, but the results are similar if we just restrict
the sample to 2002 forward. Similar to R&D spending, the level of IT spending in a given industry
is not a strong predictor of defaults.
[TABLE 6]
We next consider globalization as an alternative explanation to disruption. It is possible that
some globalization effects are tied to innovations in other countries, or that globalization opens
an opportunity for different, and more efficient supply chain management. However, more direct
implications of globalization appear to be rise in competition from foreign producers. Given that
globalization had been a major development over the period of our analysis, our concern is that
it is an important driver of deterioration in credit quality of previously protected market leaders.
To reflect on this possibility, in Table 6, column (4) we use the offshoring-potential measure
constructed by Bretscher (2017) to capture industry exposure to globalization. The variable has
time-series variation as well as cross-sectional variation, and starts in 2002. We do not find a
Electronic copy available at: https://ssrn.com/abstract=3327798

23
significant relation between this variable and corporate defaults. This suggests that, at the level
of variation we use (within industry and year), offshoring does not seem to explain defaults.
The final tests in Table 6 examines valuation ratios by industry. Industries with high valuations
experience more IPO activity (e.g. Schultz 2003). If high market prices are associated with higher
defaults, IPO activity might simply proxy for stock market price levels in our regressions. By
controlling for price levels, we can more confidently ascribe our results to the arrival of new firms
to the stock market, and not aggregate conditions. We include two common measures of
valuation, market-to-book and enterprise value to EBITDA, using aggregate data for all firms in
an industry in a given year (averages or medians give similar results). Valuation ratios are not
related to defaults in this sample, while IPOs remain a positive predictor. Thus, we conclude that
IPOs in our regressions likely does not capture overall market conditions.
3.4 The pricing of credit risk associated with disruption
Does the corporate bond market understand the risks associated with industries experiencing
disruption and, if so, does it adjust bond prices accordingly? This is the focus of our last set of
results. If financial markets appreciate the risks associated with the arrival of new firms, we expect
bonds issued by firms in industries with many IPOs to fetch higher yields. We test this prediction
in a cross-sectional regression of yields to maturity at issue, controlling for the level and slope of
yield curves with fixed effects as well as for bond characteristics such as seniority and credit rating
at issue. Specifically, we interact year-fixed effects with bond maturity, maturity squared, and
ratings. These controls should capture variation in the market pricing of bonds affecting the slope
and shape of the yield curve as well as variation in risk premia for bonds with different horizons
Electronic copy available at: https://ssrn.com/abstract=3327798

24
(see, e.g., Helwege and Turner 1999). We also include separate fixed effects for the exact month of
issue to capture creation in overall market conditions. We control for bond size as well as
indicators for whether the bond is callable, has covenants, and is senior.
The dependent variable is yield spread as reported by Mergent FISD and relate the issue yield
of a bond to that of a treasury bond with similar maturity. If disruption raises credit risk, we
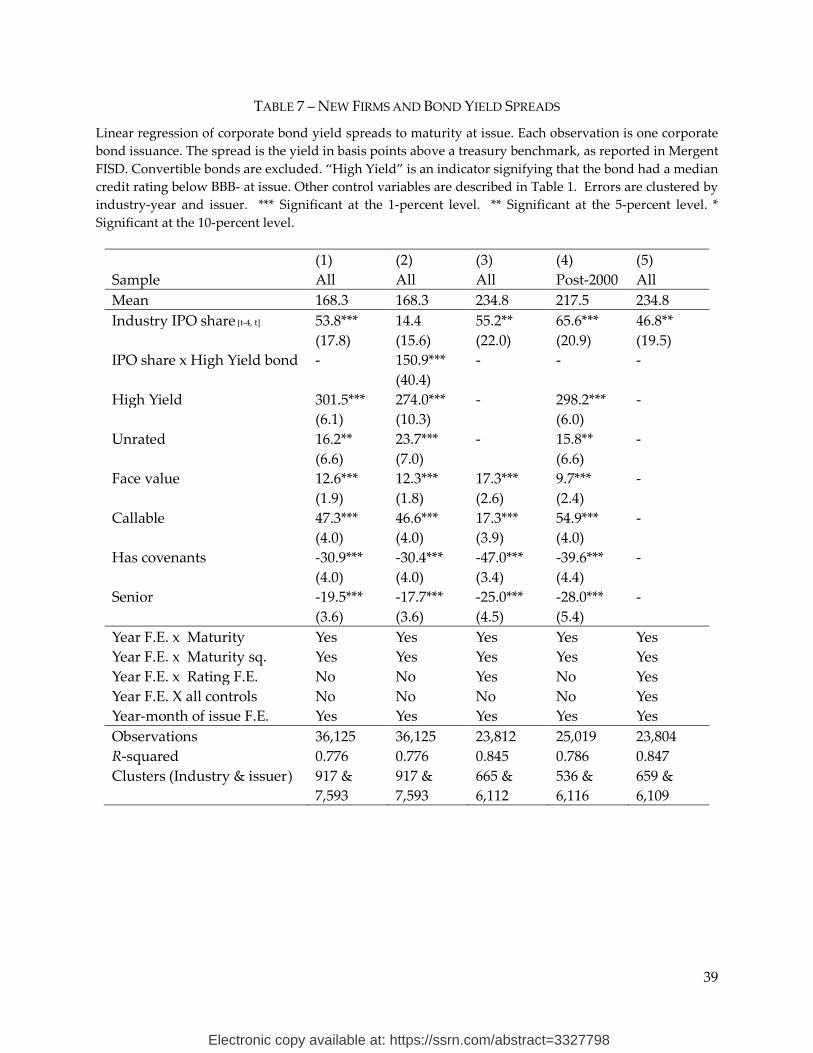
expect the coefficient on the IPOs to be negative. Results are presented in Table 7. Overall, the
bond pricing model performs fairly well: the R-squared is above 70% in all specifications. The
regression reported in column (1) indicates that bonds in high-IPO industries have moderately
higher yields at issue: increasing IPO variable by one standard deviation is associated with a 6.2
basis points higher yield spread (= 53.8 bps ∗ 0.115 ). A positive association between IPOs and
bond yields is consistent with the view that the arrival of new firms raise default risk, and that
the bond market prices this. Controls for bond characteristics enter with the predicted sign:
unrated and callable bonds have higher yields while bonds with covenants and senior bonds have
lower yields.
[TABLE 7]
In column (2), we allow the coefficient on IPOs to vary between investment-grade and high-
yield bonds. Since the majority of defaults happen in high yield, we may expect the price impact
to be larger there. Indeed, in this specification, we cannot reject zero pricing impact for
investment-grade bonds, whereas the effect is large and significant for high-yield bonds: 14 basis
points higher yield per standard deviation of IPOs.
Perhaps rating agencies realized how credit risk is affected by disruption and adjusted their
ratings downward for bonds in highly exposed industries. If so, controlling for credit ratings
Electronic copy available at: https://ssrn.com/abstract=3327798
25
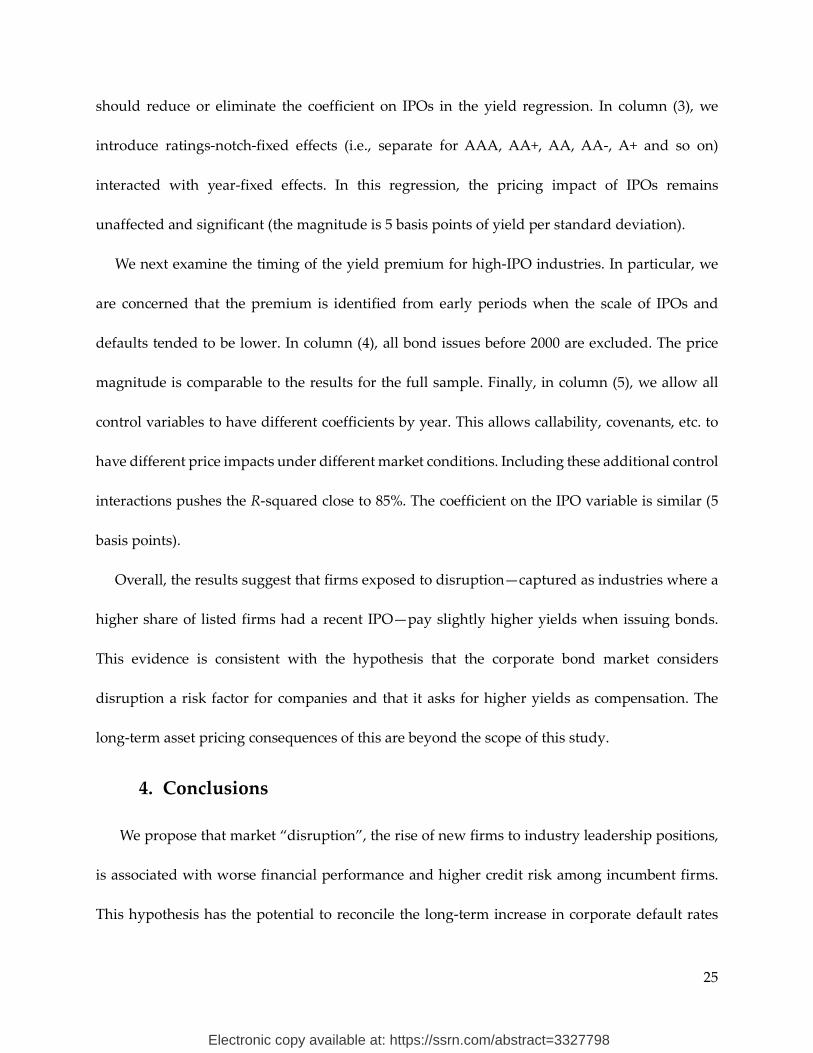
should reduce or eliminate the coefficient on IPOs in the yield regression. In column (3), we
introduce ratings-notch-fixed effects (i.e., separate for AAA, AA+, AA, AA-, A+ and so on)
interacted with year-fixed effects. In this regression, the pricing impact of IPOs remains
unaffected and significant (the magnitude is 5 basis points of yield per standard deviation).
We next examine the timing of the yield premium for high-IPO industries. In particular, we
are concerned that the premium is identified from early periods when the scale of IPOs and
defaults tended to be lower. In column (4), all bond issues before 2000 are excluded. The price
magnitude is comparable to the results for the full sample. Finally, in column (5), we allow all
control variables to have different coefficients by year. This allows callability, covenants, etc. to
have different price impacts under different market conditions. Including these additional control
interactions pushes the R-squared close to 85%. The coefficient on the IPO variable is similar (5
basis points).
Overall, the results suggest that firms exposed to disruption—captured as industries where a
higher share of listed firms had a recent IPO—pay slightly higher yields when issuing bonds.
This evidence is consistent with the hypothesis that the corporate bond market considers
disruption a risk factor for companies and that it asks for higher yields as compensation. The
long-term asset pricing consequences of this are beyond the scope of this study.
4. Conclusions
We propose that market “disruption”, the rise of new firms to industry leadership positions,
is associated with worse financial performance and higher credit risk among incumbent firms.
This hypothesis has the potential to reconcile the long-term increase in corporate default rates
Electronic copy available at: https://ssrn.com/abstract=3327798

26
seen since 1960 with the acceleration of disruption driven among other factors by the digital
revolution, rise in VC funding, and globalization. Using a panel of US corporate bonds we show
that industries with higher IPO and VC activity subsequently see higher default rates, controlling
for time- and industry-fixed effects. Neither globalization nor technological development led by
listed firms (as measured by either R&D activity or patent counts) explain this patterns. Moreover
patenting activity in the disrupted industry, and particularly patenting activity by independent
inventors contributes to the decline of the incumbents. The bond market at least in part appears
to agree with this view of disruption as a risk, with high-IPO industries seeing bonds issued at
higher yield spreads.
The consequences of these patterns are numerous and diverse: first, they suggest that the rise
in bond credit risk may continue as long as current trends in disruption continue. Second,
disruption, apart from producing large gains for entrepreneurs and for investors who have access
to VC funds, may also have large negative return implications for bond investors. To the extent
that bonds are held very widely, often by pension funds and retirees, the distributional
consequences if this would appear adverse. Just as disruption may exacerbate inequality through
labor markets, it may do so through financial markets. Third, our findings suggest that time-series
patterns in aggregate default rates at longer horizons than business cycles are economically
important.
Electronic copy available at: https://ssrn.com/abstract=3327798

27
References
Acemoglu, Daron and David H. Autor, 2011, “Skills, tasks and technologies: Implications for employment and earnings,” Handbook of Labor Economics, 4, 1043–1171.
Altman, Edward, 1968, “Financial Ratios, Discriminant Analysis and the Prediction of Corporate Bankruptcy,” Journal of Finance, 189–209.
Autor, David, David Dorn, Lawrence F. Katz, Christina Patterson, and John van Reenen, 2017, “The Fall of the Labor Share and the Rise of Superstar Firms,” working paper.
Baghai, Ramin P., Henri Servaes, and Ane Tamayo, 2014, “Have Rating Agencies Become More Conservative? Implications for Capital Structure and Debt Pricing,” Journal of Finance, 69(5), 1961-2005.
Bain, Joe S., 1954, “Conditions of Entry and the Emergence of Monopoly,” Monopoly and Competition and Their Regulation, E. H. Chamberlin, ed., London: Macmillan.
Bartelsman, Eric J., and Mark Doms, 2000, “Understanding Productivity: Lessons from Longitudinal Microdata,” Journal of Economic Literature, 38(3), September, 569-594.
Blume, Marshall E., Felix Lim and A. Craig Mackinlay, 1998, “The Declining Credit Quality of U.S. Corporate Debt: Myth or Reality?” Journal of Finance, 53(4), August, 1389-1413.
Bower, Joseph L. and Clayton M. Christensen, 1995, “Disruptive Technologies: Catching the Wave,” Harvard Business Review, 1, 43-53.
Bower, Joseph L. and Clayton M. Christensen, 1996, “Customer Power, Strategic Investment, and the Failure of Leading Firms,” Strategic Management Journal, 17, 197-218.
Bretscher, Lorenzo, 2017, “From Local to Global: Offshoring and Asset Prices,” working paper. Brezis, Elise, Paul Krugman, Daniel Tsiddon, “Leapfrogging: A Theory of Cycles in National
Technological Leadership,” NBER working paper 3886. Brynjolfsson, Erik and Andrew McAffee, 2012, Race Against the Machine: How the Digital
Revolution is Accelerating Innovation, Driving Productivity, and Irreversibly Transforming Employment and the Economy, Digital Frontier Press.
Campbell, John Y. and Glen B. Taksler, 2003, “Equity Volatility and Corporate Bond Yields,“ Journal of Finance, 58(6), December, 2321-2350.
Chen, Huaizhi, Lauren Cohen, and Dong Lou, 2016, “Industry Window Dressing,” Review of Financial Studies 29(12), 3354–3393.
Custόdio, Claudia, Miguel A. Ferrerira, and Luis Laureano, 2012, Why are US Firms Using More Short-Term Debt?” Journal of Financial Economics 108(1), 182-212.
Gompers, Paul and Joshua Lerner, 2000, “Money chasing deals? The impact of fund inflows on private equity valuation,” Journal of Financial Economics, 55(2), 281-325.
Gompers, Paul and Joshua Lerner, 2001, “The Venture Capital Revolution,” Journal of Economic Perspectives, 15(2), 145-168.
Greenwood, Jeremy and Boyan Jovanovic, 1999, “The Information-Technology Revolution and the Stock Market,” American Economic Review, 89(2), May, 116-122.
Guzman, Jorge and Scott Stern, 2015, “Nowcasting and Placecasting Entrepreneurial Quality and Performance,” NBER Working Paper 20954.
He, Kathy S., Randall Morck and Bernard Yeung, 2003, “Corporate Stability and Economic Growth,” working paper.
Electronic copy available at: https://ssrn.com/abstract=3327798

28
Helwege, Jean and Christopher J. Turner, 1999, “The Slope of the Credit Yield Curve for Speculative-Grade Issuers,” Journal of Finance, 54(5), 1869-1884.
Hilscher, Jens and Mungo Wilson, 2017, “Credit ratings and risk: is one measure enough?” Management Science, 63(10), 3414-3437.
Hochberg, Yael, Michael Mazzeo, and Ryan McDevitt, 2015, “Specialization and Competition in the Venture Capital,” Review of Industrial Organization, 46, 323-347.
Hopenhayn, Hugo, Julian Neira, and Rish Singhania, 2018, “From Population Growth to Firm Demographics: Implications for Concentration, Entrepreneurship and the Labor Share,” NBER Working Paper No. 25382.
Ivashina, Victoria and Josh Lerner, 2019, Patient Capital: The Challenges and Promises of Long-Term Investing, Princeton University Press.
Kalemli-Özcan, Sebnem, Carmen Reinhart, and Kenneth Rogoff, 2016, “Sovereign Debt and Financial Crises: Theory and Historical Evidence,” Journal of the European Economic Association, 14(1), 1–6.
Kamarck, Elaine C. and Ashley Gabriele, 2015, “The news today: 7 trends in old and new media,” Center for Effective Public Management at Brookings Institution, November.
Kaplan, Steven N. and Josh Lerner, 2010, “It Ain’t Broke: The Past, Present, and Future of Venture Capital,” Journal of Applied Corporate Finance, 22(2), 1-12.
Kaplan, Steven N. and Rauh, Joshua, 2009, “Wall Street and Main Street: What Contributes to the Rise in the Highest Incomes?” Review of Financial Studies, 23(3), 1004-1050.
Kaplan, Steven N. and Antoinette Schoar, 2005, “Private Equity Performance: Returns, "Persistence, and Capital Flows,” Journal of Finance, 60(4), 1791-1823.
Katz, Michael L. and Carl Shaprio, 1986, “Technology Adoption in the Presence of Network Externalities,” Journal of Political Economy, 94(4), 822-841.
Kogan, Leonid, Dimitris Papanikolau, and Noah Stoffman, 2012, “Technological Innovation: Winners and Losers,” working paper.
Kortum, Samuel and Joshua Lerner, 2000, “Assessing the Contribution of Venture Capital to Innovation,” RAND Journal of Economics, 31(4), 674-692.
Kretschmer, Tobias, Eugenio J. Miravete, and José C. Pernías, 2012, ”Competitive Pressure and the Adoption of Complementary Innovations,” American Economic Review, 102(4), 1540-1570.
Lemmon, Michael L., Michael R. Roberts, and Jaime F. Zender, “Back to the Beginning: Persistence and the Cross-Section of Corporate Capital Structure,” Journal of Finance, 63(4), 1575-1608.
Lerner, Joshua and Amit Seru, 2017, “The Use and Misuse of Patent Data: Issues for Corporate Finance and Beyond,” NBER working paper 24,053.
Lev, Baruch, 2017, “Evaluating Sustainable Competitive Advantage,” Journal of Applied Corporate Finance, 29(2), 69-75.
Mayer, Thierry, Marc J. Melitz, and I. P. Ottaviano, 2014, “Market Size, Competition, and the Product Mix of Exporters,” American Economic Review, 104(2), 495–536.
Melitz, Marc, 2003, “The impact of trade on intra-industry reallocations and aggregate industry productivity,” Econometrica, 71(6), 1695-1725.
Electronic copy available at: https://ssrn.com/abstract=3327798

29
Mian, Atif, Amir Sufi, and Emil Verner, 2017, “Household Debt and Business Cycles Worldwide,” Quarterly Journal of Economics, 132(4), November, 1755–1817.
Mollica, M., and Luigi Zingales, 2007, “The Impact of Venture Capital on Innovation and the Creation of New Businesses,” Unpublished working paper, University of Chicago.
Moody’s Investor Service, 2017, Annual Default Study: Corporate Default and Recovery Rates, 1920-2016, February, 15.
Pástor, Ĺuboš, and Pietro Veronesi, 2009, “Technological Revolutions and Stock Prices,” American Economic Review, 99(4), 1451-1483.
Schultz, Paul, 2003, “Pseudo Market Timing and the Long-Run Underperformance of IPOs”, Journal of Finance, 63(2), 483-517.
Schumpeter, Josef A., 1942, Capitalism, Socialism and Democracy, London: Routledge.
Electronic copy available at: https://ssrn.com/abstract=3327798

30
Figure 1: Corporate Defaults Trends, 1960-2017. Annual US loan and bond default. The Moody’s sample includes rated debt by Moody’s, both bonds and loans. The Mergent FISD sample includes all corporate bonds. The FDIC data covers loan and lease charge offs minus recoveries, normalized by loans. The series excludes NBER recession years.
0
0.005
0.01
0.015
0.02
0.025
0.03
0.035
1960
1962
1964
1966
1968
1970
1972
1974
1976
1978
1980
1982
1984
1986
1988
1990
1992
1994
1996
1998
2000
2002
2004
2006
2008
2010
2012
2014
2016
Mergent FISDMoody's: all corp debtUS Bank Loan Losses (FDIC)
Electronic copy available at: https://ssrn.com/abstract=3327798

31
Figure 2: U.S. Airline Industry Market Shares. The figure shows market shares of domestic US passenger airline routes for publicly listed airline companies, based on Department of Transportation statistics for passenger miles. Panel A shows airlines which have defaulted on debt obligations (including bankruptcies). Panel B shows the two airlines without defaults. After default, market shares are no longer tracked. Data on defaults and bankruptcy filings are from Mergent FISD and Compustat.
Panel A. Incumbent airline market shares (until date of default)
Panel B. New airline market shares
0%
2%
4%
6%
8%
10%
12%
14%
16%
18%
1990 1992 1994 1996 1998 2000 2002 2004 2006 2008 2010 2012 2014 2016
United Air Lines Inc.Delta Air Lines Inc.American Airlines Inc.Northwest Airlines Inc.Trans World Airways LLCWorld Airways Inc.ATA Airlines d/b/a ATA
0%
5%
10%
15%
20%
1990 1992 1994 1996 1998 2000 2002 2004 2006 2008 2010 2012 2014 2016
Southwest Airlines Co.JetBlue Airways
Electronic copy available at: https://ssrn.com/abstract=3327798

32
Figure 3: Firm Revenue Market Share Changes (percentage points) in High and Low-Entry Industries. The figure shows revenue market share changes over a 3-year window for Compustat firms sorted by: (i) the fraction of firms in the industry with recent IPO dates, and (ii) firm age (defined as time since IPO). Market share changes are aggregated for all firms in a size group.
-1.3-0.9
1.2
0.2
1.10.7
1.2 1.1
-1.6-2.0
-1.5
-1.0
-0.5
0.0
0.5
1.0
1.5
2.0
Young firms(<5 years since IPO) Medium age firms
Old firms(>12 years since IPO)
Δ R
even
ue m
arke
t sha
re (p
p)
Low IPO activity (<7.4%)Medium IPO activityHigh IPO activity (>20.7%)
Electronic copy available at: https://ssrn.com/abstract=3327798

33
TABLE 1 – SAMPLE OVERVIEW
Summary statistics for data sets used in regressions. Convertible bonds and public bonds are always excluded. Panel A reports bond features and Panel B reports data from the panel regressions of default risk and variables collected at the industry level. The data set starts in 1970. Bond rating at issue is the median of ratings issued by S&P, Moody’s, and Fitch. Bond restructuring includes bankruptcies, distressed exchanges, and other default outcomes. “VC investment” is total industry VC funds as reported in CapitalIQ or VentureXpert over the preceding five years [t-5;t-1]. “IPO rate” is the fraction of industry enterprise value attributable to firms whose IPO date is in the last five years. “R&D” is total spending on research and development by firms in a FF48 industry as a fraction of total sales, averaged by decade. “Offshoring” potential refers to the extent to which an industry has production that can be moved from the US to other countries and is from Bretscher (2017). Panel A. Bond cross-section
Variable 10th percent.
25th percent. Mean
75th percent.
90th percent. Std dev. Obs.
Treasury spread (bps) 0 0 165 225 455 201 37,718 Value (M$) 0.25 1.5 211.2 210 500 1,489 139,742 Callable 0 0 0.511 1 1 0.500 139,742 Covenants 0 0 0.204 0 1 0.403 139,742 Senior 0 1 0.890 1 1 0.313 139,742 Maturity at issue 0.5 1.0 6.7 10.0 15.0 8.2 139,641 Rating at issue (num.) 1 4 7.2 9.5 14.5 4.4 74,746 Rating at issue AAA AA- A- BBB- B - 74,746
Panel B. Bond panel
Variable 10th percent.
25th percent. Mean
75th percent.
90th percent. Std dev. Obs.
Restructuring [t;t+1] 0 0 0.0044 0 0 0.066 501,461 IPO share 0.041 0.103 0.140 0.219 0.321 0.115 484,735 IPO share (Enterpr. Value) 0.013 0.033 0.081 0.126 0.152 0.066 484,735 IPO share (Revenue) 0.012 0.036 0.084 0.128 0.178 0.066 484,735 IPO share (three years) 0.033 0.062 0.121 0.159 0.239 0.092 484,735 VC investment ($M), CIQ 25 934 16,989 20,708 68,166 25,451 498,200 VC investment ($M), VE 60 1,185 12,266 21,457 29,442 16,329 481,556 VC investment, log, CIQ 3.26 6.84 7.72 9.94 11.22 3.12 498,200 VC investment, log, VE 4.11 7.08 8.06 9.97 10.29 2.32 481,556 R&D 0.000 0.000 0.006 0.003 0.022 0.014 474,704 Offshoring potential -0.712 -0.223 1.032 1.878 2.527 1.233 255,399
Electronic copy available at: https://ssrn.com/abstract=3327798

34
TABLE 2 – CREDIT QUALITY AND CHANGES IN FINANCIAL PERFORMANCE
This table shows a decomposition of earnings before interest, tax, depreciation, and amortization (EBITDA) for Compustat firms. All changes are one-year. Columns (1) to (3) separate firms into those that experience a downgrade, no change, or upgrade in their S&P long–term credit rating (unrated firms are excluded). The “young firms” sample in column (4) includes firms (both rated and unrated) within five years of IPO. All changes are in real terms (adjusted with the CPI deflator from the US Bureau of Labor Statistics). Market size is the log of total industry sales (all Compustat firms in the same FF30 industry). Market share refers to the log of the firm’s share of the total sales of all Compustat firms in the same FF 30 industry. EBITDA margins is the log of EBITDA divided by revenue. *** Significant at the 1-percent level. ** Significant at the 5-percent level. * Significant at the 10-percent level.
Variable Downgrade No change Upgrade t-stat. Young firms t-stat. (1) (2) (3) (3) – (1) (4) (4) – (1) EBITDA decomposition: ∆ Market size (log) 0.2% 2.8% 3.6% 15.8 *** 3.8% 27.4 *** ∆ Market share (log) – 4.2% 2.3% 6.5% 9.8 *** 12.2% 45.0 *** ∆ EBITDA margin (log) – 10.5% 0.5% 519% 14.8 *** -3.5% 10.5 ***
Electronic copy available at: https://ssrn.com/abstract=3327798
35
TABLE 3 – NEW FIRMS AND CREDIT RISK
This table presents Probit and linear probability (OLS) models of corporate bond defaults from 1970-2017. Each observation is a bond-year. The dependent variable is equal to 1 if the bond was restructured according to Mergent-FISD. “Industry IPO share” refers to the share of firms in an industry that did an IPO in the last five years. Control variables are described in Table 1. Errors are clustered by issuer and industry-year. *** Significant at the 1-percent level. ** Significant at the 5-percent level. * Significant at the 10-percent level.
Dependent variable Default t+1, {0,100} Mean 0.428 0.463 0.428 0.463 0.501 0.555 (1) (2) (3) (4) (5) (6) Model OLS Probit OLS Probit OLS Probit Industry IPO share [t-4, t] 2.982*** 1.983*** 3.010*** 1.987*** 2.924*** 2.088***
(1.134) (0.400) (1.115) (0.417) (1.031) (0.461) Bond value (log) - - -0.006 0.019 0.035** 0.079*** (0.010) (0.014) (0.014) (0.020) Callable - - 0.392*** 0.260*** 0.073 -0.033 (0.070) (0.045) (0.051) (0.062) Has covenants - - 0.520*** 0.282*** 0.288*** 0.174*** (0.078) (0.037) (0.073) (0.041) Senior - - -0.453*** -0.253*** 0.100 0.048 (0.075) (0.042) (0.093) (0.037) Maturity at issue - - -0.017*** -0.014*** -0.004 -0.006** (0.003) (0.003) (0.002) (0.003) Publicly listed - - -0.473*** -0.332*** -0.237*** -0.246*** (0.074) (0.049) (0.080) (0.060) Year & Industry F.E. Yes Yes Yes Yes Yes Yes Credit rating F.E. No No No No Yes Yes Bond issue year F.E. No No No No Yes Yes Observations 484,735 448,815 483,927 448,018 345,333 311,371 R-squared 0.010 - 0.014 - 0.078 -
Electronic copy available at: https://ssrn.com/abstract=3327798

36
TABLE 4 – NEW FIRMS AND CREDIT RISK: SUBSAMPLES
This table presents Probit models of corporate bond defaults from 1970-2017 (as in Table 3, column 4). “Industry IPO share” refers to the share of listed firms in an industry that did an IPO in last five years. Control variables are described in Table 1. Column (1) includes bonds with a credit rating. Column (2) includes bonds with face value at issue in excess of $500 million (in 2015 dollars). Column (3) includes bonds issued by older firms (listed at least five years). Column (4) excludes deregulated industries (Fama-French industries “Transportation”, “Petroleum and Natural Gas” and “Communication”). Column (5) excludes the Fama French industry ‘Banking, Insurance, Real Estate, Trading’ (29). Errors are clustered by issuer and industry-year. *** Significant at the 1-percent level. ** Significant at the 5-percent level. * Significant at the 10-percent level.
Dependent variable Default t+1, {0,100} Mean 0.501 0.519 0.318 0.570 0.651 (1) (2) (3) (4) (5) Sample Rated bonds $500M+ face Older firms No deregulation Non-finance Industry IPO share [t-4, t] 1.777*** 2.863*** 1.492** 1.907*** 1.722***
(0.416) (0.778) (0.673) (0.441) (0.340) Bond value (log) 0.023 0.034 -0.058** 0.015 0.034* (0.014) (0.052) (0.026) (0.015) (0.019) Callable 0.267*** 0.153* 0.064 0.2958*** 0.237*** (0.052) (0.087) (0.107) (0.045) (0.060) Has covenants 0.302*** 0.261*** -0.018 0.291*** 0.247*** (0.042) (0.055) (0.077) (0.037) (0.041) Senior -0.248*** -0.455*** -0.325*** -0.275*** -0.271*** (0.045) (0.082) (0.087) (0.041) (0.045) Maturity at issue -0.015*** -0.011** -0.014** -0.010*** -0.017*** (0.003) (0.005) (0.006) (0.003) (0.004) Publicly listed -0.365*** -0.332*** - -0.356*** -0.311*** (0.055) (0.087) (0.055) (0.048) Year & Industry F.E. Yes Yes Yes Yes Yes Observations 336,616 74,086 46,599 387,707 235,868 Clusters (Industry & issuer) 834 & 8,286 670 & 3,520 1,704 812 & 7,671 879 & 6,868
Electronic copy available at: https://ssrn.com/abstract=3327798

37
TABLE 5 – NEW FIRMS AND CREDIT RISK: ALTERNATIVE MEASURES OF NEW FIRMS
This table presents Probit models of corporate bond defaults from 1970-2017 (as in Table 3, Column 4). Control variables are bond face value (log) and maturity at issue, as well as identifiers for callable bonds, bonds with covenants, convertible bonds, senior bonds, and publicly listed issuers. In column (1), the IPO variable is the share of industry enterprise value (market cap plus book value debt) from firms with an IPO in last five years. In column (2), the IPO variable is the share of industry revenue from firms with a recent IPO. In column (3), the IPO variable is the share of listed firms in the industry with an IPO in last three years. In columns (4) to (6), the key variable measures VC investment in a given industry in the preceding five years. In column (4), VC funding data are from Capital IQ. In column (5), VC funding data is from VentureXpert. Errors are clustered by industry-year and issuer. *** Significant at the 1-percent level. ** Significant at the 5-percent level. * Significant at the 10-percent level. Dependent variable Default t+1, {0,100} Mean 0.428 0.462 0.462 0.440 0.440 0.440 0.440 (1) (2) (3) (4) (5) (6) (7) Industry IPO share [t-4, t], EV 1.535*** - - - - - - (0.493) Industry IPO share [t-4, t], Revenue - 2.291*** - - - - - (0.596) Industry IPO share [t-2, t] - - 1.840*** - - - - (0.440) VC funding[t-4, t], Capital IQ (log) - - - 0.045*** - 0.040** 0.046*** (0.017) (0.018) (0.018) VC funding[t-4, t], Venture Expert (log) - - - - 0.102** 0.089** - (0.046) (0.046) Buyout volume, CapitalIQ (log) - - - - - - 0.040* (0.023) Controls Yes Yes Yes Yes Yes Yes Yes Year & Industry F.E. Yes Yes Yes Yes Yes Yes Yes Observations 448,018 448,018 448,018 447,821 447,794 447,794 437,599 Clusters (Industry & issuer) 938 & 9,388 938 & 9,388 938 & 9,388 921 & 9,388 918 & 9,388 918 & 9,388 856 & 9,377
Electronic copy available at: https://ssrn.com/abstract=3327798
38
TABLE 6 – NEW FIRMS AND CREDIT RISK: ROBUSTNESS TESTS
This table presents Probit models of corporate bond defaults from 1970-2017 (as in Table 3, Column 4). Control variables are as in Table (3). Errors are clustered by industry-year and issuer. *** Significant at the 1-percent level. ** Significant at the 5-percent level. * Significant at the 10-percent level.
Dependent variable Default t+1, {0,100} Mean 0.462 0. 462 0.400 0.476 0.462 (1) (2) (3) (4) (5) Industry IPO share [t-4, t] 2.018*** 1.906*** 1.415*** 2.417*** 1.972*** (0.415) (0.407) (0.409) (0.654) (0.467) R&D spending 5.900 - - - - (8.107) Patents, individual filer (log) - 0.153* - - - (0.084) Patents, corporate filer (log) - -0.159*** - - - (0.061) Computer spending - - -0.254 - - (0.635) Off-shoring potential - - - 0.152 - (0.170) Market-to-book - - - - -0.106 (0.068) EV / EBITDA - - - - 0.005 (0.006) Controls Yes Yes Yes Yes Yes Year & Industry F.E. Yes Yes Yes Yes Yes Observations 448,018 448,018 415,800 252,266 448,018 Clusters (Industry & issuer) 938 & 9,388 938 & 9,388 935 & 8,121 419 & 7,555 938 & 9,388
Electronic copy available at: https://ssrn.com/abstract=3327798
39
TABLE 7 – NEW FIRMS AND BOND YIELD SPREADS
Linear regression of corporate bond yield spreads to maturity at issue. Each observation is one corporate bond issuance. The spread is the yield in basis points above a treasury benchmark, as reported in Mergent FISD. Convertible bonds are excluded. “High Yield” is an indicator signifying that the bond had a median credit rating below BBB- at issue. Other control variables are described in Table 1. Errors are clustered by industry-year and issuer. *** Significant at the 1-percent level. ** Significant at the 5-percent level. * Significant at the 10-percent level.
(1) (2) (3) (4) (5) Sample All All All Post-2000 All Mean 168.3 168.3 234.8 217.5 234.8 Industry IPO share [t-4, t] 53.8*** 14.4 55.2** 65.6*** 46.8** (17.8) (15.6) (22.0) (20.9) (19.5) IPO share x High Yield bond - 150.9*** - - - (40.4) High Yield 301.5*** 274.0*** - 298.2*** - (6.1) (10.3) (6.0) Unrated 16.2** 23.7*** - 15.8** - (6.6) (7.0) (6.6) Face value 12.6*** 12.3*** 17.3*** 9.7*** - (1.9) (1.8) (2.6) (2.4) Callable 47.3*** 46.6*** 17.3*** 54.9*** - (4.0) (4.0) (3.9) (4.0) Has covenants -30.9*** -30.4*** -47.0*** -39.6*** - (4.0) (4.0) (3.4) (4.4) Senior -19.5*** -17.7*** -25.0*** -28.0*** - (3.6) (3.6) (4.5) (5.4) Year F.E. x Maturity Yes Yes Yes Yes Yes Year F.E. x Maturity sq. Yes Yes Yes Yes Yes Year F.E. x Rating F.E. No No Yes No Yes Year F.E. X all controls No No No No Yes Year-month of issue F.E. Yes Yes Yes Yes Yes Observations 36,125 36,125 23,812 25,019 23,804 R-squared 0.776 0.776 0.845 0.786 0.847 Clusters (Industry & issuer) 917 &
7,593 917 & 7,593
665 & 6,112
536 & 6,116
659 & 6,109
Electronic copy available at: https://ssrn.com/abstract=3327798

40
APPENDIX 1: CLASSIFYING FIRM AND INDIVIDUAL PATENT APPLICANTS
Patent filings were collected from the U.S. Patent and Trademark Office database. Our starting sample of US patents published from 1955-2016 had 7,349,389 observations. All patents are assigned International Patent Classification (IPC) codes, which, according to the World Intellectual Property Organization, “[provide] for a hierarchical system of language independent symbols for the classification of patents and utility models according to the different areas of technology to which they pertain.” IPC codes are different from the SIC, NAICS, and Fama-French industry codes we use in our analysis, so to use IPC codes in the analysis, we need to map each IPC code to a standard industry classification. Another challenge is that individual patents are often associated with more than one IPC code (the average is 20), reflecting the multiple possible commercial uses of the fundamental ideas captured in patents. We translate IPC codes to the International Standard Industrial Classification (ISIC) Rev. 2 codes, which we then translate in successive steps to ISIC Rev. 3, ISIC Rev.4, and eventually to NAICS codes. We sum the number of patents by 2-digit NAICS code and year. While this process contains multiple steps, several of them are fairly simple (involving very similar industry categories).
We also classified patents into those filed by individuals and those filed by business firms (corporations). We classify filers as corporations if the name of the filer includes any of the following terms:
AIRCRAFT HOLDING OPTICAL AMERICA INC PETROLEUM AMERICAN IND PRODUCTS AUTOMATIC INDUSTRIES RESEARCH CHEM INSTRUMENTS SEMICONDUCTOR CHEMICAL INTELLECTUAL SOLUTIONS CO INTERNACIONAL SYSTEMS COMPANY INTERNATIONAL TECH CORP LABORATORIES TECHNOLOGIES DEVELOPMENT LIMITED TECHNOLOGY DEVICES LLC TELEGRAPH ELECTRIC LTD TELEPHONE ELECTRONICS MATERIALS TRUST ENERGY MEDICAL TRUSTEES ENG MFG UNION ENGINEERING MICROELECTRONICS UNITED GLOBAL MICROSOFT UNIV GMBH MOTORS USA GROUP OPERATIONS
This list was developed manually by looking at the three hundred most frequent terms in the name field.
Electronic copy available at: https://ssrn.com/abstract=3327798