board structure and price informativeness structure and price informativeness ∗ daniel ferreira...
TRANSCRIPT

Board Structure and Price Informativeness∗
Daniel FerreiraLondon School of Economics
CEPR and ECGI
Miguel A. FerreiraISCTE Business School
Clara C. RaposoISCTE Business School
This Version: April 2008
Abstract
We develop and test the hypothesis that private information incorporated into stockprices affects the structure of corporate boards. We find a negative relation betweenmeasures of the amount of private information incorporated into stock prices (priceinformativeness) and measures of board independence. This finding is robust to theinclusion of many firm-level controls − including firm fixed effects − and to the choice ofthe measure of price informativeness. Consistent with the hypothesis that price infor-mativeness and board monitoring are substitutes, this relationship is particularly strongfor firms more exposed to both external and internal governance mechanisms, and firmsfor which firm-specific knowledge is relatively unimportant. Our results suggest thatfirms with more informative stock prices have less demanding board structures.
JEL classification: G32, G34Keywords: Corporate boards, Independent directors, Price informativeness, Moni-toring
∗We thank Art Durnev, Carola Frydman, José-Miguel Gaspar, Itay Goldstein, Jeffrey Gordon, AntoineFaure-Grimaud, Walter Novaes, Wayne Mikkelson, Raghu Rau, Pedro Santa-Clara, Antoinette Schoar, andLaura Starks; seminar participants at University of Texas-Austin, City University of London, EBRD, LSE,Tilburg University, University of Bristol, Universidade de Évora, Universidade Nova de Lisboa; and par-ticipants at the Lisbon-Sloan MIT corporate finance and governance workshop, the Luso-Brazilian FinanceMeeting (Lubrafin), and the Hitotsubashi University conference on Corporate Governance for helpful com-ments and suggestions.

1. Introduction
The view that prices aggregate information that is dispersed among market participants
dates back to at least Hayek (1945). The modern version of such an idea is found in, among
others, the works of Grossman and Stiglitz (1980) and Kyle (1985), in which the main role of
stock markets is the production and aggregation of information as a consequence of trading
between speculators and other types of (perhaps less informed) investors. The idea that this
type of information can also be useful for the provision of incentives in firms and for the
design of corporate governance mechanisms is a more recent one. Articles by Holmstrom
and Tirole (1993) and Faure-Grimaud and Gromb (2004) examine the role of stock prices
in disciplining managers and providing incentives to insiders. There is also a set of related
studies on the role of stock prices in guiding corporate investment decisions (Dow and Gorton
(1997) and Dow, Goldstein, and Guembel (2007)).
Our most important contribution is to document a robust negative relation between
proxies for price informativeness and board independence. This is a novel and surprising
finding, and one that deserves further scrutiny. In most of our empirical specifications, our
measure of price informativeness is the probability of informed trading (PIN), which was
developed in a series of papers beginning with Easley, Kiefer, and O’Hara (1996) and Easley,
Kiefer, and O’Hara (1997). But the results are unchanged when we use alternative proxies
for the impact of private information on prices, such as firm-specific stock return variation
(Morck, Yeung, and Yu (2000)) and a measure of illiquidity or price impact of order flow
(Amihud (2002)). We also investigate the impact of price informativeness on additional
characteristics of the board of directors. We find that price informativeness is positively
related to the number of directors with attendance problems and negatively related to the
number of board meetings. These results are compatible with board monitoring and price
informativeness being substitutes.
The most natural reaction to unexpected empirical findings is to consider the possibility of
omitted variables. We show that the negative correlation between price informativeness and
1

board independence remains strong after controlling for a long list of possible covariates. This
correlation is not explained by firm size and complexity, performance, governance variables,
and ownership structure variables, among others. In fact, the results are unchanged after the
inclusion of firm fixed effects, suggesting that time-invariant unobserved firm characteristics
cannot explain our empirical findings. Thus, we are able to rule out many of the possible
explanations for such a finding, mainly the ones associated with omitted variables.
After ruling out most omitted variables explanations, the next question we turn to is
whether we can say anything about the direction of causality. We use instrumental variables
(IV) methods to estimate the effect of price informativeness on board independence. As in-
struments, we use variables that are known to be correlated with price informativeness, such
as share turnover, analyst coverage, and S&P 500 membership, but have never been used as
explanatory variables in board independence regressions in previous studies. Alternatively,
we show that using lagged versions of the price informativeness variable also yields similar
results. Although it is not possible to prove the validity of the instruments, our findings
suggest that at least part of this correlation can be explained by price informativeness af-
fecting board structure. However, we cannot rule out the possibility that causation runs in
both directions, because they are not mutually exclusive. It would be interesting to investi-
gate whether board structure also affects price informativeness, but in the absence of good
instruments for board structure, this may not be feasible.
We also develop a simple model that rationalizes the evidence. The role of the model
is simply to clarify the role of price informativeness in the choice of board structures. We
argue that the information revealed by stock prices should affect how directors perform their
monitoring of management. We identify two intuitive mechanisms by which prices may
affect board monitoring. On the one hand, the information revealed by stock prices allows
external monitoring mechanisms to operate more efficiently. For example, if prices fall due
to the announcement of value-decreasing investments, the firm becomes a cheaper takeover
target. Managers who value control would thus avoid undertaking such value-destroying
2

projects. Thus, stock markets play an important monitoring role. On the other hand, more
informative prices bring new information to both markets and boards. Directors may use
the information revealed by stock prices as an input to their monitoring task. Arguably, a
better informed board of directors should be a better monitor.
Our model predicts that price informativeness matters for board monitoring, but that the
sign of this relationship is ambiguous. Changing board structure in the direction preferred
by shareholders may be difficult (i.e. costly), especially when ownership is dispersed, in
which case coordination costs arise. More informative prices make boards more effective,
but also reduce the need for board independence. Thus, whether price informativeness and
board independence are substitutes or complements is in the end an empirical question. Our
model, however, has some unambiguous predictions that we also explore in our empirical
analysis. We find that the negative relationship between price informativeness and board
independence is particularly strong for firms with few takeover defenses, for firms with a high
concentration of institutional ownership, for firms with low R&D expenses, and for firms in
which CEO pay-performance sensitivities are high. These findings are all consistent with
the theory and, considered together, they increase our confidence in the interpretation of the
results.
A crucial assumption behind both our theoretical analysis and our empirical strategy is
that different stocks have different amounts (in a relative sense) of information incorporated
into them. This heterogeneity in price informativeness arises due to the different costs of
collecting and producing private information. Grossman and Stiglitz (1980) predict that
improving the cost-benefit trade-off of private information collection encourages more exten-
sive informed trading and leads to more informative pricing. They suggest that in a market
with many risky stocks, those which can be investigated more cheaply are more attractive
to traders. As traders acquire more information about such stocks, their prices become
naturally more informative.
The measure of price informativeness that we use in most of our specifications − PIN −
3

has strong theoretical foundations, since it comes from a structural microstructure model. A
high PIN indicates that relatively more of the information incorporated into a stock’s price
is coming from private sources than public ones. Previous empirical work generally supports
the use of PIN as a valid measure of the probability of informed trading and a proxy for stock
price informativeness. Easley, Hvidkjaer, and O’Hara (2002) find that the risk of private in-
formation trading is priced. Vega (2006) shows that stocks with higher PIN have smaller
reactions following an earnings announcement. Chen, Goldstein, and Jiang (2007a) adopt
this measure to assess the impact of price informativeness on corporate investment. Our
work provides complementarity evidence on the importance of price information for corpo-
rate decisions by focusing on the relationship between price informativeness and governance
mechanisms, which ultimately determine investment decisions.1
Overall, our results suggest that, empirically, board independence and price informa-
tiveness are substitutes rather than complements. There are few empirical studies on the
interaction between different governance mechanisms. Mikkelson and Partch (1997) find
evidence consistent with the effectiveness of board oversight being enhanced by an active
takeover market. More recent examples include the work of Cremers and Nair (2005), who
find a complementary effect between openness to the market for corporate control and large
institutional investors presence, and Gillan, Hartzell, and Starks (2006), who find that an
independent board can act as a substitute for the market for corporate control. Our paper
adds to this growing literature.
Our results are also consistent with the idea that the optimal board structure depends on
the characteristics of the firm; that is, “one size” does not fit all firms. In particular, there is
some evidence consistent with board structure being affected by the degree of complexity of
firms’ operations and the trade-off between the costs and benefits of advising and monitoring
management (Boone, Field, Karpoff, and Raheja (2007), Coles, Daniel, and Naveen (2008),
1Kau, Linck, and Rubin (2008) also provide evidence that stock prices provide information for managers.They show that managers are more likely to cancel investments decisions when the announcement effect ofsuch investments is negative.
4

and Linck, Netter, and Yang (2008)).
On the theoretical side, our model integrates two independent lines of research. The first
one explains board structure as the result of optimal shareholder choices under incomplete
contracts (Hermalin and Weisbach (1998), Raheja (2005), Song and Thakor (2006), Adams
and Ferreira (2007), and Harris and Raviv (2007)). The second one examines the role of
stock prices in disciplining managers and providing incentives to insiders (Holmstrom and
Tirole (1993), Faure-Grimaud and Gromb (2004), and Almazan, Banerji, and Motta (2007)).
To the best of our knowledge, these two strands of the literature have never before been put
together.
The remainder of the paper is organized as follows. In Section 2 we present a simple
model to motivate the relationship between stock price informativeness and board indepen-
dence. The model is used to derive the hypotheses that we test in subsequent sections.
Section 3 describes the sample, the data, and the construction of variables. In Section 4 we
present our core evidence on the relationship between board independence and stock price
informativeness, while in Section 5 we perform many robustness checks. In Section 6 we
further investigate some of the additional implications of the model. Section 7 concludes.
2. The Model
Using a simple model, we show that there can be a link between the board’s monitoring
role and the information revealed by stock prices. On the one hand, more informative
prices can reinforce the internal monitoring activity performed by the board of directors.
On the other hand, higher price informativeness can enhance the effectiveness of external
monitoring mechanisms, such as disciplining takeovers. Hence, board independence and price
informativeness can interact as either complements or substitutes. We examine this trade-off
and discuss some empirical predictions that are tested later in the paper.
In what follows, we take the degree of price informativeness as exogenously given and
5

focus on the optimal choice of board monitoring. This is not for realism, but for simplicity.
Although there might be feedback effects from board structure to price informativeness, we
do not explore this route in our empirical work. Thus, we choose to keep the model as simple
as possible by focusing only on what is essential for the empirical analysis.
2.1. Setup
We model the need for monitoring the CEO in a simple adverse selection setting (see for
example Hermalin and Weisbach (1998)) with three dates (0, 1 and 2) and four types of
participants: Shareholders, a Board of Directors, a CEO, and a Stock Market. The sequence
of events is as follows. At date 0, the shareholders choose the composition of the board of
directors (i.e., its level of independence i) and hire a CEO of an unknown type. At date 1,
the type of the incumbent CEO may be revealed. With probability p (which we interpret
as the degree of price informativeness), stock prices reveal the CEO’s type to everyone. If
prices do not reveal the CEO’s type, the board alone can learn it with probability β. If
the board is informed, it may replace the CEO with a new one. Likewise, if the market is
informed, an external raider might take over the firm and replace the CEO.2 At date 2, the
value of the firm is revealed to everyone. The value of the firm depends on the type of the
CEO in charge.
There are two types j ∈ {H,L} of CEOs in this market. At date 0, the type of the CEOis not known by anyone. For simplicity, we assume that both types are equally likely in the
population. The value of the firm, V j, will depend on the quality j of its CEO. We assume
V H > V L. The unconditional expected value of the firm when a new CEO is appointed is
then V E = 12
¡V H + V L
¢.
The Board of Directors is characterized by its level of independence i. This level i
corresponds to the probability that the board monitors and replaces a CEO who is revealed
2Alternative interpretations are also possible. For example, the CEO could have made wrong decisionsthat could be reversed only if monitors intervene at this stage.
6

to be of type L at time 1.3 The board can learn about the CEO’s type at date 1 from
two sources: (1) stock prices or (2) its own assessment. We assume that, if the market is
uninformed, the board unilaterally learns the CEO’s type at date 1 with probability β. This
is a very natural assumption: Insiders (i.e., the board) know more than outsiders.
Shareholders are risk-neutral agents who care about the market value of the firm and
delegate firm management to the CEO. Shareholders choose the composition of the firm’s
board of directors, i.e., its level of independence i ∈ [0, 1]. This choice is non-trivial sincea more independent board is assumed to be costlier, but also generates more monitoring of
the CEO. We assume that board independence has an ex ante cost k i2
2to shareholders.4 As
we will discuss below, this cost may arise due to the fact that dispersed shareholders may
find it difficult to influence board composition.
The stock price will be informative at date 1 with probability p, in which case it reveals
the CEO’s type, which becomes public information. If the price does not reveal the type
of the CEO (with probability (1− p)), or if it reveals that the CEO is of type H (with
probability p2), the probability of a takeover taking place is zero.5 Conditional on the market
being informed that the CEO is of type L (with probability p2), an external raider takes over
the firm and replaces its CEO with probability τ ∈ [0, 1], which we interpret as a measureof takeover threat (or an inverse measure of takeover defenses). If the market is informed
that the CEO is of type L, the board may also directly monitor and replace the CEO with
probability i.6 For simplicity, we assume that, at date 1, τ and i are independent from
each other. If both the board and the market wish to replace the CEO simultaneously, we
assume that they flip a coin. Because the outcome for the firm is the same regardless of who
monitors, it is not relevant to know the ultimate identity of the successful monitor.
3More independent boards are likely to perform their monitoring role more effectively and there is evidencethat outside directors can affect crucial decisions such as hiring and firing the CEO (Weisbach (1988)).
4For models that endogenize the cost of board independence, see Song and Thakor (2006) and Adamsand Ferreira (2007).
5This assumption is not crucial. The model could easily accommodate a positive probability of a raideracquiring information and placing a takeover bid, even if prices are uninformative.
6If prices reveal that the CEO is of type H, neither the market nor the board are interested in monitoringand replacing the incumbent CEO.
7

In case the CEO is replaced at date 1, his successor is randomly drawn from the popula-
tion. Thus, conditional on the market and/or the board being informed, the firm’s expected
value is V M = 12
¡V H + V E
¢.
2.2. Board Independence and Price Informativeness
The shareholders’ problem at date 0 is to choose the level of monitoring of the board of
directors according to:
maxi∈[0,1]
p£(i+ τ − iτ)V M + (1− i− τ + iτ)V E
¤+(1− p)
£βiV M + β (1− i)V E + (1− β)V E
¤− ki2
2. (1)
Assuming an interior solution, the optimal board structure is characterized by:
i∗ =1
k[p (1− τ) + (1− p)β]
¡V M − V E
¢. (2)
Proposition 1 The optimal degree of board independence varies with the degree of price
informativeness according to:
∂i∗
∂p=1
k(1− τ − β)
¡V M − V E
¢. (3)
The sign of the relationship between board independence and price informativeness is
ambiguous, depending on the values of the parameters. This result is explained by the
interaction of two intuitive effects.
On the one hand, price informativeness and board monitoring can be complements —
the better informed the board is, the more effective board monitoring becomes. This effect
arises because price informativeness is a non-rival good that can be used by both insiders and
outsiders. This result is a robust one, and not specific to our model: The public good nature
of price informativeness would always generate a complementarity effect in any realistic
8

model.7
On the other hand, price informativeness can be a substitute for board monitoring. A
better informed market can directly perform external monitoring via takeovers. This result
arises because both internal and external monitoring mechanisms perform the same task of
disciplining the CEO. Any model in which internal monitoring is costly should predict a
lower level of board monitoring when there is an increase in the level of external monitoring
(due to more information being available in the market).
If τ + β > 1, board independence and price informativeness are substitutes, i.e., there is
a negative relationship between price informativeness and board independence. Intuitively,
the substitution effect is more likely when the probability of takeovers is higher and when
the board’s knowledge of firm-specific information is higher. Conversely, if τ + β < 1, board
independence and price informativeness are complements. Ultimately, finding out which
effect dominates is an empirical question.
2.3. Takeover Threats
The model allows us to predict, without ambiguity, the effect of the degree of exposure to
takeover threats on the relationship between board independence and price informativeness.
Proposition 2 The higher is the likelihood of a takeover, the stronger (weaker) is the substi-
tution (complementarity) effect of price informativeness on the choice of board independence:
∂2i∗
∂p∂τ= −1
k
¡V M − V E
¢. (4)
More external monitoring makes the substitution effect between price informativeness
and board independence stronger. If a disciplining takeover is more likely when the market
is informed, there is less need for boards to monitor. Hence, we expect the level of board7Gordon (2007) proposes the hypothesis that board independence and stock price informativeness are
complements. He claims that the monitoring advantages of independent directors are more clear in anenvironment with increasing stock price informativeness as insiders lose their information advantage aboutthe firm’s prospects.
9

independence of those firms that are more exposed to the market for corporate control to
exhibit higher sensitivity to stock price informativeness. In sum, the substitution effect is
stronger when takeover threats are more likely. This implication could be tested by using
takeover defenses as a proxy for the likelihood of takeovers. In the empirical section, we use
the Gompers, Ishii, and Metrick (2003) governance index as a proxy for takeover defenses.
In sum, although our model implies that the complementarity and the substitution effects
are both possible, the substitution effect is more likely to dominate when the firm has fewer
takeover defenses in place.
2.4. Institutional Investors
There is evidence that institutional investors also perform an active role in corporate gover-
nance (e.g., Hartzell and Starks (2003)). Here we examine the role played by institutional
investors in the relationship between board structure and price informativeness. We interpret
parameter k as a measure of how costly internal monitoring is. When institutional investors
are present as large shareholders (i.e., there is high concentration of institutional holdings),
it is likely that this cost of board monitoring is lower.
Proposition 3 The relationship between board independence and price informativeness is
stronger when the marginal cost of internal monitoring is higher:
∂2i∗
∂p∂k= −1
k
∂i∗
∂p. (5)
We can see that (in absolute values) the relation between board independence and price
informativeness is less pronounced when the marginal cost of external monitoring k is higher
(i.e., when ∂i∗∂p
> 0, then ∂2i∗∂p∂k
< 0, reducing the complementarity effect; and when ∂i∗∂p
< 0,
then ∂2i∗∂p∂k
> 0, reducing the substitution effect). These results suggest that price informa-
tiveness only significantly affects board independence when the board can effectively act as
an internal monitoring mechanism (low monitoring cost k).
10

Our interpretation here is that k measures the costs to shareholders of changing the
board structure. If ownership is dispersed, coordination costs are high, so k is high. On the
other hand, if there is significant ownership concentration, we expect k to be low (Shleifer
and Vishny (1986) and Carleton, Nelson, and Weisbach (1998)). Empirically, we use the
concentration of institutional investors as a (inverse) proxy for k.
2.5. Firm-Specific Knowledge
If we consider β, the likelihood that the board learns information that is not revealed by
prices, as a parameter that reflects how easy it is for the board to gather firm-specific
information to assess the ability of the CEO, we can offer the following interpretation for
the effect of β on the board independence-informativeness relation:
Proposition 4 The higher is the probability that the board learns firm-specific information,
the stronger (weaker) is the substitution (complementarity) effect of price informativeness
on the choice of board independence:
∂2i∗
∂p∂β= −1
k
¡V M − V E
¢. (6)
Arguably, the board should find it easier to acquire firm-specific information in firms that
undertake simple, well-known projects. In more innovative firms, outside board members
should find it harder to acquire firm-specific knowledge that is needed to assess the CEO’s
ability. According to our interpretation, these firms would have low β. This result suggests
that the (absolute value of the) effect of price informativeness on board independence should
be stronger in firms undertaking simple and well-known projects in case the overall effect
is negative, but weaker in case the overall effect is positive. Empirically, we use R&D
expenditures as a (inverse) proxy for β.
11

2.6. Discussion of the Main Assumptions
Our model is quite simple and stylized. We believe that the most relevant ingredients are
present, but acknowledge that in some instances they are oversimplified. One of the main
simplifications is the formation of stock prices, which we treat as a black box. We could have
developed a detailed microstructure model with endogenous price formation, but we believe
that the current simple structure is sufficient to model the link between the composition of
the board of directors and price informativeness.
The way in which we model the board of directors is also simplified. We could have
followed the existing board literature by endogenizing all the costs and benefits of board
monitoring. However, since most of those results are now well known, we believe that
replicating their underlying analysis is unnecessary.
Finally, regarding the relationship between the firm and the CEO, we formulate the
agency problem as an adverse selection problem (as in Hermalin and Weisbach (1998)).
Alternatively, we could have presented a moral hazard problem (as in Dow and Raposo
(2005) and Adams and Ferreira (2007)), in which the incentives given to the CEO would be
an additional concern. Once again, since these results are well established in the literature,
we have chosen the current approach for its simplicity. A more complicated setup would
only distract us from the main goal of the theory, which is to provide us with some clear
implications that can be tested in our data.
3. Sample and Variables
3.1. Measures and Determinants of Board Structure
Our main dependent variable is the fraction of independent directors, which is a proxy for
the monitoring intensity of the board. In order for a director to qualify as independent, he
or she must not be an employee, a former executive, or a relative of a current corporate
12

executive of the company. In addition, the director must not have any business relations
with the company.
In a later section, we also consider other board structure variables. As alternative proxies
for the monitoring activity performed by the board of directors, we use the annual number of
regular board meetings and the fraction of directors with attendance problems (i.e. directors
who attended less than 75% of board meetings).
In order to identify the effect of price informativeness on the structure of corporate
boards, we need to control for other possible determinants of board structure. The literature
provides many suggestions in this regard. A useful classification to organize our choice of
control variables is provided by Boone et al. (2007). They group the different theories of
the determinants of board structure into three broadly-defined hypotheses: The scope of
operations hypothesis, the monitoring hypothesis, and the negotiation hypothesis.
The scope of operations hypothesis suggests that the size and complexity of a firm’s oper-
ations affect its board structure (Fama and Jensen (1983)). As a firm grows and diversifies,
it faces an increasing demand for specialized board members who can perform tasks such
as managerial compensation and auditing. Under this hypothesis, more complex firms face
larger agency costs and thus require additional board monitoring (Coles et al. (2008)).
We consider three proxies to capture firms’ operational complexity: firm size (as measured
by equity market capitalization), firm age (the number of years since the firm’s stock is
exchange-listed), and the number of business segments. We expect larger, older, and more
diversified firms to have a higher fraction of independent directors, which is consistent with
the findings in Boone et al. (2007), Coles et al. (2008), and Linck et al. (2008). We also add
leverage to this list, because Coles et al. (2008) argue that more leveraged firms are more
dependent on external resources and thus leverage can be considered as a proxy for firm
complexity and the CEO’s need for advice.
Boone et al. (2007) call the monitoring hypothesis the group of formal and informal
theories emphasizing the importance of a firm’s business environment for the optimal design
13

of its board structure (e.g., Demsetz and Lehn (1985), Raheja (2005), Adams and Ferreira
(2007), and Harris and Raviv (2007), among others). We use several control variables to
capture some of the elements of these theories. To control for the costs of outside monitoring,
we take into account growth opportunities as proxied by the market-to-book ratio and R&D
expenditures, stock price volatility as proxied by the variance of stock returns, and CEO
stock ownership. We also consider free cash flow, profitability, and industry concentration,
because these variables could be related to agency conflicts and other opportunities for the
CEO to extract private benefits. Similarly, we include the governance index of Gompers
et al. (2003) (GIM) as a measure of the number of takeover defenses in the firm’s charter.
Finally, the theories in the group called the negotiation hypothesis emphasize the role of
the negotiation between the CEO and outside directors as an important determinant of board
composition (Hermalin and Weisbach (1998)). We include two measures of CEO influence:
CEO’s tenure and stock ownership.
We also introduce institutional ownership variables as additional controls in our empir-
ical specifications. Because the trading activity of large institutional investors may have a
direct effect on the amount of private information revealed by stock prices, we expect insti-
tutional ownership to be correlated with price informativeness. There is also evidence that
institutional investors also perform an active role in corporate governance (e.g., Hartzell and
Starks (2003)). Thus, omitting the institutional ownership variables may lead to spurious
correlations between price informativeness and board structure.8 Institutional investors are
expected to have more influence when they are large shareholders, because they have easier
access to board members (Carleton et al. (1998)) and benefit from economies of scale in
monitoring activities. Thus, we consider two measures of concentrated holdings: the concen-
tration of institutional ownership (as measured by the Herfindahl index) and institutional
blockholder ownership (defined as stock holdings by the firm’s largest institutional investors
8There is some discussion in the literature over whether some types of institutions specialize in monitoringand activism rather than trading. Research by Chen, Harford, and Li (2007b) shows that “independent in-stitutions” (mutual fund managers and investment advisors) are effective monitors, while “grey” institutions(bank trusts, insurance companies, and other institutions) are not.
14

with at least 5% of shares outstanding, following Cremers and Nair (2005)). We also control
for the total institutional ownership (defined as the percentage of shares outstanding held
by institutions).9
A more comprehensive discussion of some of these variables and their relationships to
board structures can be found in Boone et al. (2007), Coles et al. (2008), Gillan et al. (2006),
and Linck et al. (2008). Our goal in this paper is not to replicate these works, but rather to
make sure that the new results in our paper are not being driven by omitted variables that
have been found to be correlated with board structure.
3.2. Measures of Price Informativeness
Our primary measure of stock price informativeness is the probability of information-based
trading (PIN) developed by Easley et al. (1996). This measure is based on a structural
market microstructure model, where trades may come from “noise traders” or from “informed
traders.” Easley et al. (2002) provide a detailed theoretical description of the PIN variable.
Here we simply explain its intuition.
The trading process is modeled in the following way. At the beginning of each day, there is
a probability λ that some traders acquire new (private) information about the fundamental
value of the firm. Trading orders arrive throughout the day according to three different
Poisson distributions: informed trade orders come in at the average rate μ, uninformed
buy orders come in at the rate b, and uninformed sell orders come in at the rate s. The
probability that the opening trade of the day is information-based is given by
PIN =λμ
λμ+ b + s, (7)
where λμ is the arrival rate for informed orders and λμ + b + s is the arrival rate for all
9We obtain similar results using alternative measures of concentrated holdings: ownership by the fivelargest institutional investors; ownership by institutional blockholders (defined as stock holdings by institu-tional investors with at least 5% of shares outstanding); ownership by all blockholders; and ownership byoutside blockholders. We present some these results in the robustness section.
15

orders.
Easley et al. (2002) use intra-day transaction data to estimate the above parameters and
thus the probability of informed trading in a stock. Notice that PIN should be low for stocks
with little fluctuation in their daily buy and sell orders, which are more likely to come from
liquidity or noise trading. Likewise, PIN should be high for stocks that display frequent large
deviations from their normal order flows.
Previous empirical work generally supports the use of PIN as a valid measure of the prob-
ability of informed trading and a proxy for stock price informativeness. Easley et al. (2002)
find that the risk of private information trading is priced, and find that it carries a positive
risk premium, i.e. stocks with higher PIN have higher expected returns. Vega (2006) shows
that stocks with higher PIN have smaller reactions following an earnings announcement,
which is consistent with the idea that these stocks incorporate more private information and
track their fundamental values more closely. PIN also seems to be related to managerial
decisions. Chen et al. (2007a) find a positive relation between PIN and the sensitivity of
firm investment to stock prices, which supports the hypothesis that managers learn from the
private information incorporated into stock prices. Ferreira and Laux (2007) find a positive
relation between strong corporate governance (few takeover defenses) and PIN, suggesting
that strong shareholder protection induces private information collection and trading by in-
formed market participants. All this empirical evidence supports the interpretation of PIN
as a valid measure of stock price informativeness.10
Although we use PIN as our main proxy for the amount of private information that is
incorporated into prices, we acknowledge that this measure is imperfect. PIN might capture
some illiquidity effects that are not related to asymmetric information. If PIN is a noisy
measure of asymmetric information, this will lead to an attenuation bias that is likely to
reduce both the size and the statistical significance of the estimated effects of PIN on board
10A recent paper by Duarte and Young (2007) questions some of these interpretations. Their findingssuggest that the relation between PIN and expected returns is explained by the fact that PIN is also a proxyfor illiquidity that is not related to private information.
16

structure (under the null that there exists a relation between price informativeness and board
independence). Thus, the noise in PIN is likely to work against us finding any result. We
find some evidence that this attenuation bias indeed affects the estimates of the effect of
PIN on board independence in our data; we discuss this issue in more detail later in the
paper. Nevertheless, it is important to keep in mind that there is no reason to believe that
measurement error in PIN can explain our findings; if anything, it makes it harder to detect
any underlying relationship between the latent variables.
As an alternative to PIN, we also consider other price informativeness variables to corrob-
orate our interpretation of the results. We first consider firm-specific stock return variation
as a measure of price informativeness. Considerable research establishes that firm-specific
stock return variation and price informativeness are closely related. French and Roll (1986)
and Roll (1988) show that a significant portion of stock return variation is not explained by
market movements. They suggest that firm-specific return variation measures the rate of
private information incorporation into prices via trading. Although both uniformed trading
and trading on the basis of public information can in principle explain firm-specific return
variation, there is considerable empirical evidence supporting the use of firm-specific return
variation as a measure of stock price informativeness and particularly of private information
about firms. High levels of firm-specific return variation are associated with more efficient
capital allocation (Durnev, Morck, and Yeung (2004)), and with more information about
future earnings embedded in stock prices (Durnev, Morck, Yeung, and Zarowin (2003)).11
We estimate annual firm-specific return variation by regressing stock returns on the three
factors from Fama-French. For each firm-year, firm-specific return variation is estimated by
1−R2 from the regression:
rit = αi + β1iRMt + β2iSMBt + β3iHMLt + eit, (8)
11Cross-country patterns of firm-specific return variation also correspond to likely patterns of price infor-mativeness. Morck et al. (2000) and Jin and Myers (2006) find high firm-specific stock return variation indeveloped markets, but low firm-specific return variation in emerging markets.
17

using daily return data, where rit is the return of stock i in day t in excess of the risk-free
rate, RMt is the value-weighted excess local market return, SMBt is the small-minus-big
size factor return, and HMLt is the high-minus-low book-to-market factor return.12 Given
the bounded nature of R2, we conduct our tests using a logistic transformation of 1−R2:
Ψ = log
µ1−R2
R2
¶= log
µσ2e
σ2 − σ2e
¶. (9)
The variable Ψ measures firm-specific stock return variation relative to market-wide varia-
tion, or lack of synchronicity with the market.13
Finally, as an alternative measure of price informativeness or private information incor-
porated into stock prices, we use the illiquidity ratio of Amihud (2002). This measure is
defined as the annual average of the daily ratio between a stock’s absolute return and its
dollar volume (multiplied by 106):
ILLIQ =1
Di
DiXt=1
|rit|VOLDit
, (10)
where Di is the annual number of valid observation days for stock i and VOLDit is the
dollar volume of stock i on day t. The illiquidity ratio gives the absolute (percentage) price
change per dollar of daily trading volume and is a proxy for the price impact of order flow.
The magnitude of the price impact should be a positive function of the perceived amount of
informed trading on a stock (Kyle (1985)), although illiquidity will also reflect the inventory
costs associated with trading a given order size, and thus it is also a noisy proxy for the
private information content of prices.
12The daily returns for the small-minus-big (SMB) and high-minus-low (HML) factors are drawn fromFrench’s website: http://mba.tuck.dartmouth.edu/pages/faculty/ken.french/data_library.html13Alternative estimates of firm-specific return variation are provided by the market model that assumes
β2i = β3i = 0 in equation (8) and by a two-factor (market and industry) model. We obtain similar findingsusing these alternative estimates.
18

3.3. Sample
We start with firms in the Investor Responsibility Research Center (IRRC) database between
1990 and 2001.14 The IRRC database contains detailed information on governance and
director characteristics for a large number of U.S. firms. We obtain board data for these
firms from Compact Disclosure for the 1990-1995 period and from IRRC for the 1996-2001
period.15 We exclude financial firms (SIC codes 6000-6999). We winsorize variables at the
bottom and top 1% level.16 After these adjustments the number of firms in the sample is
2,188. Next we merge the IRRC database with our main variable of price informativeness
— the probability of information-based trading (PIN) for each firm-year, based on data from
Easley et al. (2002).17 The final sample contains 1,443 firms and a total of 9,447 firm-year
observations.
We obtain financial and segment data from Compustat and stock returns and turnover
data from CRSP. The governance index of Gompers et al. (2003) (GIM) and board atten-
dance problems are available from the IRRC database. We obtain data on institutional
holdings and the number of analysts covering each firm from Thomson CDA/Spectrum In-
stitutional 13f Holdings and IBES. Blockholder ownership is based on data from Dlugosz,
Fahlenbrach, Gompers, and Metrick (2006). Finally, we obtain additional director character-
istics such as CEO ownership and tenure and number of board meetings from ExecuComp.
Table 1 defines in detail the variables used in this study and describes their sources.
Table 2 presents descriptive statistics of our data. The median fraction of independent
directors is 0.778. Board size ranges from 3 to 17 directors, with a median of 10 directors.
14Our sample ends in 2001 because PIN estimates are less reliable when short sales represent a significantfraction of the trading volume. In fact, PIN relies upon trade classification algorithms that fail to classifyshort sales correctly (Asquith, Oman, and Safaya (2007)).15We thank Tina Yang for helping us with the Compact Disclosure board data. While IRRC provides
detailed information on affiliation of directors, Compact Disclosure identifies only whether the director isan officer of the firm. Thus, board composition is only described in terms of the percentage of executivedirectors (insiders or officers) and non-executive directors on the board. In the robustness section, we reportresults using only IRRC data that are consistent with our primary findings.16We obtain similar findings when we winsorize variables at the bottom and top 5% level.17The estimates of PIN are obtained from Soeren Hvidkjaer’s website:
http://www.smith.umd.edu/faculty/hvidkjaer/data.htm.
19

There are on average 7.3 board meetings a year and 2.5% of the directors have attendance
problems (attend less than 75% of board meetings). The mean PIN is 0.162 and the standard
deviation is 0.056. These statistics are comparable to those reported in Easley et al. (2002).
The mean firm-specific return variation (1−R2) from the three-factor model is 0.738, indi-
cating that the Fama-French factors account only for 26.2% of total stock return variation.
The mean illiquidity ratio (ILLIQ) is 0.165.
The median firm in our sample has a market capitalization of $1.1 billion, an age of
39.9 years, and a leverage ratio of 27.0%. The mean number of business segments is 2.2,
the mean R&D expenditures-to-assets ratio is 1.9%, and the mean CEO ownership is 1.5%.
The median firm has 10 takeover defenses (out of a maximum of 24). The mean total
institutional ownership is 47.2% and the mean institutional blockholder ownership is 6.9%.
These statistics are comparable to those found in similar studies, such as those of Gillan
et al. (2006) and Coles et al. (2008).
4. Main Evidence
In this section we present our main results on the relationship between board independence
and probability of informed trading (PIN). In the next sections, we provide additional evi-
dence and perform several robustness checks.
Figure 1 presents a visual summary of the relationship between board independence
and PIN. We first sort firms into quintile portfolios ranked by PIN. We then calculate the
average board independence within each quintile portfolio of PIN. The main finding in this
paper is clear from the figure: The average board independence for the lowest PIN (low
market monitoring) portfolio (Q1) is greater than the one for the highest PIN (high market
monitoring) portfolio (Q5). The low-PIN portfolio displays board independence of about
80%, while the corresponding figure for the high-PIN portfolio is about 70%. The difference
between the two extreme quintile portfolios is highly statistically significant (t-statistic of
20

22.1). Moreover, all intermediate PIN portfolios present lower board independence than
the low-PIN portfolio. Although the impact of PIN on board independence may appear
economically small, we show later that it is actually quite large if compared to the analogous
effects of other well-known determinants of board structure.
In Table 3, we present the outcome of several ordinary least squares (OLS) panel regres-
sions, where the dependent variable y is a logistic transformation (or the log odds ratio) of
the fraction of independent directors z (i.e. y = ln(z/1 − z)). We use a logistic transfor-
mation because the fraction of independent directors is bounded between zero and one.18
Our explanatory variable of interest is PIN. Table 3 presents the results from several speci-
fications of the board independence regression, including one restricted to the PIN and one
with the full set of control variables. We always include industry (two-digit SIC) and year
dummy variables.19 In our setting, cross-correlation and autocorrelation are likely to occur
in our dependent variable. When this happens, conventional standard errors may be biased
downwards. All reported t-statistics are therefore adjusted for heteroskedasticity and within-
firm correlation using clustered standard errors. In addition, the inclusion of year dummies
accounts for some forms of cross-sectional dependence (Petersen (2007)).
Column (1) presents the coefficients of a univariate regression between the fraction of
independent directors and PIN. There is strong evidence of a negative and significant re-
lationship. The PIN coefficient is -3.1376, with a high t-statistic of -13.60. This effect is
economically significant: an increase in PIN from the 20th percentile to the 80th percentile
(i.e., an increase in PIN from 0.11 to 0.21) predicts a decrease of roughly 6 percentage points
in board independence (for a board with average independence).
Controlling for other firm characteristics does not change this result qualitatively. In
column (2) we present estimates for a specification that does not include CEO ownership
and tenure as controls because these variables are not available for the 1990-1991 period. The
18In the robustness section, we obtain similar results using the fraction of independent directors or thelogarithm of the fraction of independent directors as dependent variables.19We obtain similar results when we do not include industry or year dummies in the regression specification.
21

PIN coefficient is -1.9860 with a t-statistic of -7.76. In column (3) we add CEO ownership
and tenure as controls, but the PIN estimate and t-statistic are barely affected. Overall,
we find that the probability of informed trading displays a statistically and economically
significant negative relationship with board independence.
With respect to the other explanatory variables, we find that leverage, firm age, and the
number of business segments are all positively and significantly related to board indepen-
dence. Firm size enters with a positive but insignificant coefficient (at the 5% level) in the
majority of specifications. These findings are consistent with the scope of the operations
hypothesis that more complex firms require more independent boards.
Consistent with the findings of Boone et al. (2007) and Coles et al. (2008), we find no
statistically significant relationships between board independence and market-book ratio,
R&D expenditures, return-on-assets, and stock return variance. The free cash flow variable
also does not have a statistically significant point estimate. In contrast, we find that the
coefficients of CEO ownership and tenure are both negative and statistically significant, which
is consistent with the suggestion of Hermalin and Weisbach (1998) that board structure is
influenced by the negotiations between CEOs and outside directors. The evidence indicates
that board independence is negatively related to the degree of CEO influence.
Although the impact of PIN on board independence may appear small at first inspection,
it is rather large if compared to the effects of other variables. Using the specification in
column (2), a one-standard deviation increase in PIN reduces board independence by roughly
2.1 percentage points (at the averages of the data). If we perform the same experiment
with the other variables that also enter significantly in the regression, we get effects of 1.4
percentage points for increasing leverage by one standard deviation, 1.4 percentage points for
increasing firm age, and 1.3 percentage points for increasing the number of business segments
by one standard deviation (always at the averages of the data). The bottom line here is that
most variables that have been found to correlate with board independence can explain just
a small part of the variation in board structures.
22

In columns (4) - (6) we control for the governance index (GIM), total institutional owner-
ship, and institutional ownership concentration. The GIM coefficient is positive and statisti-
cally significant, which is consistent with the idea that board independence is higher in firms
that are insulated from the market for corporate control. This finding is consistent with the
empirical evidence of Gillan et al. (2006), who show that an independent board can act as
a substitute for the market for corporate control. The institutional ownership variables are
not significantly related to board independence.
So far we have treated PIN as a continuous variable. We now take an alternative approach
and classify firms as either low PIN or high PIN. Specifically, we define a dummy variable
that is equal to one for firm-years with PINs above the 80th percentile (Q5) and zero for firm-
years with PINs below the 20th percentile (Q1). Notice that observations with intermediate
values of PIN are not included in this regression. We re-estimate the board independence
regressions in Table 3 using this dummy variable. The estimated coefficient on the PIN
dummy variable measures the difference in board independence between firms with high and
low PIN. This procedure tackles some possible of measurement errors problems in the PIN
variable. If PIN is measured with error, focusing only on the extreme values of PIN might
improve the precision of our estimates. Table 4 presents the results.
Column (1) presents the coefficients of a univariate regression of the fraction of indepen-
dent directors on the PIN dummy variable (Q5 - Q1). There is strong evidence of a negative
and significant relationship. The PIN dummy variable coefficient is -0.5193, with a high
t-statistic of -13.08. This effect is economically significant: a move from the PIN bottom
quintile (Q1) to the top quintile (Q5) predicts a decrease of roughly 10 percentage points
in board independence (for a board with average independence). Controlling for other firm
characteristics again does not change this result. In column (2), the PIN coefficient is -0.3404
with a t-statistic of -6.33.
The magnitude and significance of the effects suggest that, if anything, measurement
errors in PIN seem to work against us finding any result. Despite the drop in the number
23

of observations, the statistical precision of our estimates is not affected. Furthermore, after
eliminating the intermediate values of PIN from the regression, the point estimates of the
effect of PIN on board independence are roughly increased by a factor of two.
In summary, we find that the probability of informed trading displays a statistically and
economically significant negative relationship with board independence. This relationship is
robust to the inclusion of many plausible variables that are likely to correlate with board
independence.
5. Robustness
In this section, we check the robustness of our main results. We first present several al-
ternative estimation methods, such as firm fixed effects and instrumental variables (2SLS).
These alternative estimation methods address several concerns with our estimates, such as
omitted variables, reverse causality, and measurement errors. We then present additional
robustness checks such as sample variations and additional control variables. In the two
final subsections, we present results using alternative measures of price informativeness and
additional board-related variables.
5.1. Endogeneity: Omitted Variables and Reverse Causality
Endogeneity problems are ubiquitous in empirical research on corporate governance. In our
setting, this problem is accentuated by recent findings showing that CEO decision-making
power and board size both have direct effects on corporate performance, in particular the
variability of stock returns (Adams, Almeida, and Ferreira (2005) and Cheng (2007)).20
Furthermore, there could be other reasons for board structure and price informativeness to
be jointly determined.
20We have already dealt with some of these issues in this paper. In order to be sure that our measure ofprice informativeness is not simply capturing the effect of stock return volatility, we have included the totalstock return variance as a control variable in all specifications. More importantly, the effect of PIN is robusteven when stock return variance is one of the controls.
24

We first address the potential endogeneity problems using firm fixed effects methods that
control for unobserved sources of firm heterogeneity. Fixed-effects methods solve “joint de-
termination” problems in which an unobserved time-invariant variable simultaneously deter-
mines both PIN and board independence. It is also equivalent to looking only at within-firm
changes in PIN.
Columns (1) and (2) of Table 5 present the firm fixed effects estimates (with t-statistics
adjusted for firm-level clustering). There is still evidence of a negative relation between
board independence and PIN. In column (2), the estimate of the PIN coefficient is -0.5812
with a significant t-statistic of -2.62.
The fixed effects results go a long way towards dismissing omitted variables explanations
as sources of endogeneity. Because only the effects of within-firm changes in board inde-
pendence are taken into account, firm-specific omitted variables cannot explain the observed
relationship between PIN and board independence. An issue here is whether there is enough
variation in PIN and board independence over time so that one can estimate this relationship
with precision. The short answer is yes; although t-statistics are lower, suggesting a lower
precision in the estimates, they are still quite high by traditional standards.21
We also use instrumental variables as an alternative method to fixed effects, in order to
address the potential endogeneity of PIN. Instrumental variables methods allow us to address
omitted variables and reverse causality issues simultaneously. The caveat is that, unlike the
fixed-effects method, it requires stronger assumptions that are usually not possible to test
for. Under standard identification assumptions, we apply two-stage least squares (2SLS)
methods to isolate the effect of PIN on board independence. To this end, we need a good
instrument for PIN: a variable that is correlated with PIN (this assumption can be tested),
but uncorrelated with board structure except indirectly through other independent variables.
That is, the instrument should be a variable that can be “excluded” from the original list
21Interestingly, the idea that board structure does not change much over time may be more a myth thanreality. Cicero, Wintoki, and Yang (2008) find that in the 1991-2003 period, two-thirds of the firms in theirsample change either board size or independence during a two-year period. They also find that firms close63% of the gap between their actual and target board independence over a two-year period.
25

of control variables without affecting the results. This last requirement cannot be tested by
statistical methods; it is, in the end, an act of faith.
We use analyst coverage, share turnover, and S&P 500 membership as instruments.
Easley, O’Hara, and Paperman (1998) suggest that analysts may serve to turn private
information into public information and do not have significant firm-specific information.
Analysts may attract additional uninformed order flow to a stock, an effect that would also
reduce PIN. Empirical evidence seems to support a negative relation between price infor-
mativeness and analyst coverage (Piotroski and Roulstone (2004) and Chan and Hameed
(2006)). Furthermore, Chen et al. (2007a) find a negative relation between PIN and the
sensitivity of firm investment to stock prices, which suggests that information released by
analysts and impounded in the stock price does not have much effect on managers’ invest-
ment decisions. Share turnover is also likely to be negatively related to PIN, again consistent
with the notion that stocks with greater trading activity tend to have more uninformed order
flow (Easley et al. (2002)). We use as an additional instrument a dummy variable that takes
the value of one if a stock included in the S&P 500 index as these firms tend to attract
more investor attention. Thus, our instrumental variables have been previously found to be
significantly correlated with price informativeness, but have never been used as explanatory
variables in board independence regressions in previous studies.22
Columns (3) and (4) of Table 5 present the results of the first stage regressions that uses
PIN as dependent variable. The results support the conclusion that analyst coverage and
share turnover are negatively and significantly related to PIN, while S&P 500 membership
is positively related to PIN. F -tests that the instruments can be excluded from the first
stage regressions are strongly rejected (F -statistics are 13.7 and 9.8 in columns (3) and (4)).
Thus, we conclude that our instruments are not only associated with PIN in the predicted
direction, but also that our specifications do not appear to suffer from “weak instruments”
22Following Agarwal and O’Hara (2006), we also use lagged PIN as an instrument and obtain consistentresults (not tabulated here). See Aslan, Easley, Hvidkjaer, and O’Hara (2006) for a discussion of alternativeinstruments for PIN.
26

concerns.23
Columns (5) and (6) present the 2SLS coefficients of the second-stage regression that uses
board independence as the dependent variable. There is still evidence of a negative relation
between board independence and PIN after taking into account the possibility that PIN is
endogenous. Assuming that our instruments are valid, the evidence suggests the existence
of a causal link from price informativeness to board structure. To assess the quality of the
instruments formally, we also perform a Hansen X 2-test of instrument orthogonality. This
statistic jointly tests the null hypotheses of correct model specification and orthogonality
between the instruments and the errors. Our instruments perform adequately in our tests
(p-value is 0.63 and 0.57 in the specifications of columns (5) and (6) respectively), indicating
that we cannot reject the null hypothesis of instrument suitability.
A final approach to address endogeneity concerns is to use lagged PIN as an explanatory
variable. Columns (7) and (8) present the results of these estimations, confirming a negative
relation between board independence and PIN. Although the finding that past PIN predicts
future board structure cannot rule out all reverse causality stories, it addresses some of the
most obvious ones.
Our conclusion here is twofold. Omitted variables are unlikely to explain the relationship
between PIN and board independence: on top of our long list of control variables, firm
fixed effects should take care of most invariant unobserved variables. We also find some
evidence consistent with a causal effect from price informativeness to board independence.
This evidence is less conclusive because the assumptions needed for our IV estimation are
somewhat stronger than the ones needed for fixed effects. One has to keep in mind, however,
that providing evidence for causality in one direction does not rule out causality running
in both directions. We make no claim that board structure does not affect PIN as well,
although we cannot test this hypothesis directly due to the lack of reasonable instruments
for board independence.
23The S&P 500 dummy appears “weaker” than the other two instruments. Our results are practically thesame if we exclude the S&P 500 dummy from the set of instruments.
27

5.2. Alternative Estimation Methods
All of our specifications so far have been estimated by least squares. Least squares methods
are known to over-weight outliers. To address the concern that outliers may drive our core
results, we winsorize financial ratios at the bottom and top 1% levels. In this subsection, we
also use least-absolute deviation (median) regressions as an alternative means of addressing
the difficulties associated with outliers. The results are presented in columns (1) and (2)
of Table 6, and remain consistent with a negative relationship between board independence
and PIN. As one can see from the point estimates, if anything, outliers seem to reduce the
magnitude of the estimated effects.
The presence of time dependence and cross-sectional dependence in our data is also a
potential concern. Our results so far account for cross-sectional and time dependence using
industry and year dummies, firm fixed effects, and by computing firm-clustered standard
errors. An alternative solution is to use the Fama-MacBeth procedure. Specifically, we
estimate the relationship between board structure and PIN separately for each sample year
and report the average of the yearly estimated coefficients.
Columns (3) and (4) of Table 6 present the results of the Fama-MacBeth procedure. The
coefficients are qualitatively similar to those reported in Table 3. In column (3), the PIN co-
efficient is -1.1203, with a t-statistic of -7.71. The coefficients of the other firm characteristics
are also consistent with the OLS panel regression estimates.
5.3. Additional Robustness Checks
This subsection discusses several additional robustness checks. These results appear in Table
7. With these results, we check whether our findings are robust to the sample period, to
functional form assumptions, and to the inclusion of additional control variables. To save
space, we only present the results for our most complete specification (column (5) in Table
3), but the results are also similar for other specifications.
Column (1) uses the 1996-2001 sample period, rather than 1990-2001. The 1996-2001
28

period corresponds to the period for which the IRRC directorship data are available. There-
fore, column (1) uses only IRRC directorship data, rather than both Compact Disclosure
(1990-1995) and IRRC data (1996-2001). This issue is a potential concern because Compact
Disclosure classifies each director as either executive or non-executive, while IRRC uses a
finer definition of independence. In addition, column (2) uses board data from Compact Dis-
closure for the whole sample period (1990-2001) as an alternative to the IRRC directorship
data.
Column (3) uses the logarithm of board independence, rather than the logistic transfor-
mation, as the dependent variable. Column (4) uses the fraction of independent directors (i.e.
restricted to [0, 1]) as the dependent variable. These confirm that our results are not driven
by our particular functional form assumptions in the construction of the board independence
variable.
Column (5) reports results after controlling for blockholder ownership, considering all
types of blockholders rather than institutional investors only. Column (6) reports results
after controlling for outside blockholders ownership rather than 13F institutional investors
only. These blockholder ownership data are taken from Dlugosz et al. (2006) and cover the
1996-2001 sample period only.
Column (7) presents results that take into account product market competition. Shleifer
and Vishny (1997) suggest that product market competition is one of the most effective
mechanism to eliminate managerial inefficiency. We try to capture the competitive structure
of an industry using the industry Herfindahl index, calculated as the sum of squared market
shares of all firms in each industry (two-digit SIC) in each year. Industries with lower
Herfindahl indices possess more competitive product markets. The industry Herfindahl index
has indeed a positive coefficient but insignificant at the 5% level.
Column (8) presents results that control for earnings quality. Earnings quality is mea-
sured by the annual absolute value of firm-specific residuals from an industry regression of
total accruals on lagged, contemporaneous, and leading cash flow from operations (Dechow
29

and Dichev (2002)). This variable is an inverse index of accounting quality, in that they
increase in the magnitude of unexpected accruals. There is some evidence of a positive
association between board independence and accounting quality.
Column (9) includes lag board size as an additional control variable following Boone et al.
(2007) and Coles et al. (2008), Gillan et al. (2006).
Finally, in order to control for the potential differences in liquidity and governance re-
quirements between stock exchanges, in column (10) we include a dummy variable that takes
the value of one if a firm’s stock is listed on the New York Stock Exchange (NYSE).
In all models, the estimated coefficient on the probability of informed trading remains
negative and strongly significant. Our basic result is thus confirmed: more private informa-
tion trading is strongly associated with less board independence, or in other words, with less
need for board monitoring.
5.4. Alternative Measures of Price Informativeness
Is the empirical relationship between board independence and PIN driven by the private
informational content of stock prices? In this section, we use two alternative measures of
private information incorporated into prices as determinants of board structure. First, we use
firm-specific stock return variation, or non-synchronicity of stock returns, as an alternative
to the probability of informed trading in proxying for the intensity of private information
incorporated into prices (Morck et al. (2000)). Firm-specific return variation is measured by
the annual estimate of 1−R2 of the three-factor model of Fama-French using daily return datawithin each year as detailed in the data section. Although in principle non-synchronicity
may also be due to trading on the basis of public information or noise trading, previous
research has generally supported the view that non-synchronicity is mostly due to informed
trading (Durnev et al. (2003) and Durnev et al. (2004)).
Secondly, we use the illiquidity ratio of Amihud (2002). This ratio gives the absolute
(percentage) price change per dollar of daily trading volume and is a proxy for the price im-
30

pact of order flow. In theory, trading is linked to the quality or extent of private information
(e.g., Blume, Easley, and O’Hara (1994)), and thus the price impact is a natural measure
of private information flow. However, this measure is also likely to capture liquidity effects
that are unrelated to information-based trading.24
We estimate board independence regressions similar to those in Table 3 using firm-specific
return variation and the illiquidity ratio, as measures of private information incorporated
into stock prices. We report the results in Table 8. Columns (1) and (2) show results
for the regressions using the logistic transformation of firm-specific return variation (Ψ) as
the measure of price informativeness. We find that the coefficients on Ψ are negative and
statistically significant. Thus, board independence is lower in firms whose stock returns are
less synchronized with the market.
Columns (3) and (4) in Table 8 present estimates using the annual illiquidity ratio (ILLIQ)
as a measure of private information flow. ILLIQ is also negatively related to board inde-
pendence, which supports the hypothesis that firms with a higher price impact of order flow
(perhaps due to private information trading) have less independent boards.
In sum, the results using alternative proxies of price informativeness confirm our basic
finding: Stock market monitoring and board monitoring appear to be substitutes.
5.5. Additional Board Monitoring Variables
It is natural to ask whether price informativeness also affects other variables that are likely
to be associated with the monitoring intensity of the board. Here we focus on the number of
board meetings and the fraction of directors with attendance problems as alternative proxies
for the monitoring intensity of the board. We also analyze the impact of PIN on board
size, although previous research has found that size does not have a one-to-one relation to
monitoring intensity and is likely to be influenced by firms’ need for board advice (Coles24In a recent paper Bharath, Pasquariello, and Wu (2008) construct a firm-level index of information asym-
metry based on four direct measures of information asymmetry (including PIN) and three broad measures ofmarket liquidity (including the illiquidity ratio) to study capital structure decisions. The findings are robustto the inclusion of the broad measures of liquidity.
31

et al. (2008) and Linck et al. (2008)).
We first use the annual number of board meetings as the dependent variable. It has been
argued that a board that meets more often is likely to be a better monitor (e.g., Vafeas
(1999)). In Table 9, columns (1) and (2) present the estimates of OLS panel regressions
in which the logarithm of the annual number of board meetings is the dependent variable.
We find a negative relationship between the number of board meetings and PIN. If board
meetings are seen as increasing in the board’s monitoring intensity, this result is compatible
with board monitoring and price informativeness being substitutes.
The Securities Exchange Act of 1934 requires corporations to list in their proxy state-
ments the name of each director who attended fewer than 75% of the number of board
meetings and board committees meetings on which he serves. A board with a higher frac-
tion of directors with attendance problems is likely to be a poor monitor. Columns (3) and
(4) present the estimates of regressions in which the annual fraction of directors with atten-
dance problems is the dependent variable. We find a positive relationship between board
attendance problems and PIN. Again, this result is compatible with board monitoring and
price informativeness being substitutes.
Finally, columns (5) and (6) present the outcome of regressions in which the dependent
variable is the logarithm of board size. We use the log transformation because board size
is bounded below by zero. There is evidence of a negative and statistically significant rela-
tionship between board size and PIN. The statistical precision of such estimates are however
much lower than the ones reported for the board independence regressions. Most of the other
firm-level characteristics enter with their expected signs, and are usually consistent with the
literature on board structure determinants (e.g., Boone et al. (2007) and Linck et al. (2008)).
It has been argued that larger boards are poor monitors (Lipton and Lorsch (1992) and
Jensen (1993)). However, some also argue that larger boards are more diverse and produce
more specialized advice to managers (Coles et al. (2008) and Linck et al. (2008)). Thus,
although the evidence that we find is interesting, it is difficult to interpret. It should also be
32

noted that size and independence are positively correlated in the sample.
6. Interpreting the Relationship between Board Inde-
pendence and the Probability of Informed Trading
In the previous sections, we have found strong evidence of a negative correlation between
board independence and the probability of informed trading (PIN). Our findings suggest
that when more information flows to the market (via trading on private information), firms
tend to choose less independent boards. The interpretation is that when stock prices are
more revealing, the stock market acts as a substitute for corporate boards in its monitoring
role.
In this section, we present additional results that strengthen this interpretation, i.e. that
price informativeness and board independence are substitutes.25 We do so by focusing on the
implications of our theoretical model. However, the empirical results are very intuitive and
can also be understood without a direct reference to the model.
6.1. Takeover Defenses
If a firm adopts a large number of takeover defenses, it might become partially insulated
from the market for corporate control (Field and Karpoff (2002) and Masulis, Wang, and
Xie (2007)). In such cases, the takeover market cannot play an effective disciplinary role.
Our hypothesis is that the trade-off between board independence and price informativeness is
more relevant when there are few takeover defenses. This hypothesis is implied by Proposition
2.
We use the governance index of Gompers et al. (2003) (GIM) as a proxy for the number
of takeover defenses a firm has in place. Columns (1) and (2) of Table 10 present the results
of separate estimations on two subsets of the sample: firms whose GIM index is above 13
25Notice that this interpretation does not require us to take a stand on the direction of causality.
33

(column (1)) and firms whose GIM index is below 6 (column (2)).26 Note that these two
subsamples do not include all observations in the sample, but only the extreme cases.27 We
find that the relationship between board independence and PIN is negative and statistically
significant for low GIM firms, but positive and statistically insignificant for high GIM firms.
The difference between the two coefficients is statistically significant at the 5% level.
We conclude that the market for corporate control does have an important role to play
in shaping the relation between board independence and price informativeness. Price infor-
mativeness can only substitute for the role of independent directors when the firm is open to
the market for corporate control. This finding is also consistent with the evidence provided
by Gillan et al. (2006), who show that if a disciplining takeover is more likely, then there is
less need for board monitoring.
6.2. Institutional Ownership Concentration
If our theory is correct, shareholders should frequently intervene to change the board struc-
ture in response to exogenous changes in price informativeness.28 Our theory is thus less
plausible in dispersed ownership structures where shareholders have no incentives to engage
in activism. That is, shareholders in dispersed ownership structures will face a high k, which
is the marginal cost of changing board independence. Unlike individual investors, institu-
tional investors (especially if they hold large blocks of stock) may have a clear incentive to
maximize the firm value by changing the board structure whenever necessary. Thus, our
hypothesis is that the trade-off between board independence and price informativeness is
more relevant when there are large shareholders or when there is a higher concentration of
institutional ownership. This is implied by Proposition 3. We use institutional ownership
26We choose to run separate regressions because it is easier to interpret the results. Results are similar ifwe implement our tests with interactions. To save space, we only present the results of our most completespecification (column (5) in Table III), but results are consistent for other specifications.27Most firms have GIM indices that are clustered at the intermediate values.28See Karpoff (2001) and Gillan and Starks (2007) for a summary of the evidence on shareholder activism
and governance structure. The evidence suggests that active shareholders do affect governance structures,although the effect of activism on firm performance is not clear cut.
34

concentration as a (inverse) proxy for k.
Columns (3) and (4) of Table 5 present results by splitting the sample into firms with
more or less concentrated institutional ownership: firms whose institutional Herfindahl in-
dex is above the 80th percentile (column (3)) and firms whose institutional Herfindahl index
is below the 20th percentile (column (4)). We find a negative and statistically significant
relationship between board independence and PIN for the high institutional ownership con-
centration sample, but this relationship is statistically insignificant for firms with a low con-
centration of institutional ownership. In other words, the probability of informed trading is
only (robustly) negatively related to board independence for those firms with a high concen-
tration of institutional ownership. The difference between the two coefficients is statistically
significant at the 5% level.29
These results suggest that price informativeness can only be an effective substitute for
internal monitoring (by the board) when large institutional shareholders supervise the board
themselves. Without a substantial concentration of institutional ownership, perhaps the
board only plays a minor role. In such cases, it would be natural to find a weak or no
relationship between board independence and stock price informativeness.
6.3. Firm-Specific Knowledge
When firm-specific knowledge is important, a board that is too independent may fail to
obtain crucial information. Perhaps there are few informed insiders (Raheja (2005)), or
perhaps the CEO refuses to communicate with the board (Adams and Ferreira (2007)).
We thus expect that costs associated with the acquisition of firm-specific knowledge may
affect the relationship between board structure and price informativeness. Specifically, if
stock markets can substitute for corporate boards as monitors of management, we expect to
find a stronger negative relationship between board independence and price informativeness
when firm-specific knowledge is less important. The idea is simply that CEOs and inside29We obtain similar findings when we split the sample using the institutional blockholder ownership vari-
able.
35

directors possess more firm-specific knowledge than outside directors (Fama and Jensen
(1983)). Consequently, the trade-off between board independence and price informativeness
becomes less effective when this type of knowledge is more important. This hypothesis is
formally derived in Proposition 4.
Measuring the importance of firm-specific knowledge is a difficult task. Following Coles
et al. (2008), we use R&D expenditures as a proxy for the importance of firm-specific knowl-
edge. Firm-specific knowledge is harder for outsiders to acquire in firms with high levels of
R&D expenditure. If the kind of information that market prices convey cannot substitute
for the knowledge that insiders possess, the substitution effect should be weaker for firms
with high R&D.
Columns (5) and (6) in Table 5 present the results of separate regressions for two sub-
samples that differ from each other according to their R&D expenditures. In one set of
firms, the ratio of R&D expenditures to assets is above the 80th percentile (column (5)); all
other firms (low R&D and firm-specific knowledge) are placed in the other category (column
(6)).30 The evidence shows that the relationship between board independence and PIN is
negative and statistically significant in low R&D firms, but statistically insignificant in high
R&D firms. The difference between the two coefficients is statistically significant at the 5%
level.
This evidence is consistent with the hypothesis that when firm-specific knowledge is less
important, the private information revealed by stock prices can substitute for the monitor-
ing role of corporate boards. No such a trade-off is possible, however, when firm-specific
knowledge is important.
30The 80th percentile actually corresponds to the median for firms with positive R&D expenditures asonly 40% of the observations have positive R&D. The findings are similar if we use the 75th percentile asthe cut-off.
36

6.4. Pay-Performance Sensitivity
Finally, we also estimate the impact of PIN on board independence after splitting the sample
according to the intensity of equity-based pay for the CEO. Executive compensation plans
can help to align the interests of managers with those of shareholders. Although our model
does not have any prediction with respect to equity-based incentives, previous models on the
monitoring role of stock prices (Holmstrom and Tirole (1993)) have focused on the role of
executive compensation as the main mechanism through which stock prices discipline man-
agers. Thus, we expect to find a stronger relationship between price informativeness and
board independence in firms in which pay-performance sensitivities (PPS) of CEO compen-
sation contracts is high. PPS is defined as the change in dollar value of a CEO’s holdings of
stock options per $1,000 change in the firm’s market value of equity.
Columns (7) and (8) of Table 10 present the results of separate regressions for two sub-
samples that differ from each other according to their CEO pay-performance sensitivities
(PPS): firms whose PPS is above the 80th percentile (column (7)) and firms whose PPS
is below the 20th percentile (column (8)). We find a negative and statistically significant
relationship between board independence and PIN for the high PPS sample, but this rela-
tionship is statistically insignificant for firms with low PPS. The difference between the two
coefficients is statistically significant at the 5% level.
These results suggest that price informativeness can only be an effective substitute for
internal monitoring (by the board) when managerial incentives are closely tied to the share-
holder value.
7. Conclusion
In this paper, we add a new and important element to the list of determinants of board
structure − price informativeness. We develop and test the hypothesis that the amount ofprivate information incorporated into stock prices affects the structure of corporate boards,
37

in particular board independence.
We find robust empirical evidence that stock price informativeness, as measured by the
probability of informed trading (PIN) and other proxies, is negatively related to board inde-
pendence. The correlation between price informativeness and board independence is at least
as strong − in both economic and statistical senses − as the ones between board indepen-dence and other firm-level variables that have been documented in the literature on corporate
boards. Given our long list of control variables and the use of fixed-effects methods, it is
unlikely that price informativeness is capturing the effects of omitted variables.
Consistent with the theory that we propose, the negative relationship between price
informativeness and board monitoring is particularly strong for firms with few takeover
defenses. We also find that ownership concentration seems to be a condition for the existence
of a trade-off between board monitoring and price informativeness. Finally, the negative
relationship between board independence and price informativeness is particularly strong
for firms with less firm-specific knowledge and more pay-perfomance sensitivity in CEO
compensation.
One possible interpretation for our results suggests that if stock prices are informative,
stock markets are able to perform a monitoring role like that normally associated with the
board of directors. Our results are thus consistent with the hypothesis that board monitoring
and stock market monitoring are substitutes. The evidence that more informative prices
are associated with a lower degree of board independence, fewer board meetings, weaker
attendance at board meetings, and smaller board size all point in a similar direction: Firms
with more informative stock prices require less demanding board structures.
38

References
Adams, Renee, Heitor Almeida, and Daniel Ferreira, 2005, Powerful CEOs and their impact
on corporate performance, Review of Financial Studies 18, 1403—1432.
Adams, Renee, and Daniel Ferreira, 2007, A theory of friendly boards, Journal of Finance
62, 217—250.
Agarwal, Prasun, andMaureen O’Hara, 2006, Information risk and capital structure, working
paper, Cornell University.
Almazan, Andres, Sanjay Banerji, and Adolfo Motta, 2007, Attracting attention: Cheap
managerial talk and costly market monitoring, Journal of Finance, forthcoming.
Amihud, Yakov, 2002, Illiquidity and stock returns: Cross-section and time-series effects,
Journal of Financial Markets 5, 31—56.
Aslan, Hadiye, David Easley, Soeren Hvidkjaer, and Maureen O’Hara, 2006, Firm charac-
teristics and informed trading: Implications for asset pricing, working paper, Cornell
Unversity.
Asquith, Paul, Rebecca Oman, and Christopher Safaya, 2007, Short sales and trade classifi-
cation algorithms, working paper, MIT.
Bharath, Sreedhar, Paolo Pasquariello, and Guojun Wu, 2008, Does asymmetric information
drive capital structure decisions?, Review of Financial Studies, forthcoming.
Blume, Lawrence, David Easley, and Maureen O’Hara, 1994, Market statistics and technical
analysis: The role of volume, Journal of Finance 49, 153—181.
Boone, Audra, Laura Field, Jonathan Karpoff, and Charu Raheja, 2007, The determinants
of corporate board size and composition: An empirical analysis, Journal of Financial
Economics 85, 66—101.
39

Carleton, Willard, James Nelson, and Michael Weisbach, 1998, The influence of institutions
on corporate governance through private negotiations: Evidence from TIAA-CREF,
Journal of Finance 53, 1335—1362.
Chan, Kaloc, and Allaudeen Hameed, 2006, Stock price synchronicity and analyst coverage
in emerging markets, Journal of Financial Economics 80, 115—147.
Chen, Qi, Itay Goldstein, and Wei Jiang, 2007a, Price informativeness and investment sen-
sitivity to stock price, Review of Financial Studies 20, 619—650.
Chen, Xia, Jarrad Harford, and Kai Li, 2007b, Monitoring: Which institutions matter?,
Journal of Financial Economics 86, 279—305.
Cheng, Shijun, 2007, Board size and the variability of corporate performance, Journal of
Financial Economics, forthcoming.
Cicero, David, M. Babajide Wintoki, and Tina Yang, 2008, Do firms adjust to a target board
structure?, working paper, University of Georgia.
Coles, Jeffrey, Naveen Daniel, and Lalitha Naveen, 2008, Boards: Does one size fit all?,
Journal of Financial Economics 87, 329—356.
Cremers, K. J. Martinj, and Vinay Nair, 2005, Governance mechanisms and equity prices,
Journal of Finance 60, 2859—2894.
Dechow, Patricia, and Ilia Dichev, 2002, The quality of accruals and earnings, Accounting
Review 77, 35—59.
Demsetz, Harold, and Kenneth Lehn, 1985, The structure of corporate ownership: Causes
and consequences, Journal of Political Economy 93, 1155—1177.
Dlugosz, Jen, Ruediger Fahlenbrach, Paul Gompers, and AndrewMetrick, 2006, Large blocks
of stock: Prevalence, size, and measurement, Journal of Corporate Finance 12, 594—618.
40

Dow, James, Itay Goldstein, and Alexander Guembel, 2007, Incentives for information pro-
duction in markets where prices affect real investment, working paper, London Business
School.
Dow, James, and Gary Gorton, 1997, Stock market efficiency and economic efficiency: Is
there a connection?, Journal of Finance 52, 1087—1129.
Dow, James, and Clara Raposo, 2005, CEO compensation, change, and corporate strategy,
Journal of Finance 60, 2701—2727.
Duarte, Jefferson, and Lance Young, 2007, Why is PIN priced?, Journal of Financial Eco-
nomics, forthcoming.
Durnev, Artyom, Randall Morck, and Bernard Yeung, 2004, Value-enhancing capital bud-
geting and firm-specific stock return variation, Journal of Finance 59, 65—105.
Durnev, Artyom, Randall Morck, Bernard Yeung, and Paul Zarowin, 2003, Does greater
firm-specific return variation mean more or less informed stock pricing?, Journal of
Accounting Research 41, 797—836.
Easley, David, Soeren Hvidkjaer, and Maureen O’Hara, 2002, Is information risk a determi-
nant of asset returns?, Journal of Finance 57, 2185—2221.
Easley, David, Nicholas Kiefer, and Maureen O’Hara, 1996, Cream-skimming or profit-
sharing? the curious role of purchased order flow, Journal of Finance 51, 811—833.
Easley, David, Nicholas Kiefer, and Maureen O’Hara, 1997, One day in the life of a very
common stock, Review of Financial Studies 10, 805—835.
Easley, David, Maureen O’Hara, and Joseph Paperman, 1998, Financial analysts and
information-based trade, Journal of Financial Markets 1, 175—201.
Fama, Eugene, and Michael Jensen, 1983, Separation of ownership and control, Journal of
Law and Economics 26, 301—325.
41

Faure-Grimaud, Antoine, and Denis Gromb, 2004, Public trading and private incentives,
Review of Financial Studies 17, 985—1014.
Ferreira, Miguel, and Paul Laux, 2007, Corporate governance, idiosyncratic risk and infor-
mation flow, Journal of Finance 62, 951—989.
Field, Laura, and Jonathan Karpoff, 2002, Takeover defenses of IPO firms, Journal of Fi-
nance 57, 1857—1889.
French, Kenneth, and Richard Roll, 1986, Stock return variances: The arrival of information
and the reaction of traders, Journal of Financial Economics 17, 5—26.
Gillan, Stuart, Jay Hartzell, and Laura Starks, 2006, Evidence on corporate governance:
The joint determinantion of board structure and charter provisions, working paper,
University of Texas at Austin.
Gillan, Stuart, and Laura Starks, 2007, The evolution of shareholder activism in the United
States, Journal of Applied Corporate Finance 19, 55—73.
Gompers, Paul, Joy Ishii, and Andrew Metrick, 2003, Corporate governance and equity
prices, Quarterly Journal of Economics 118, 107—155.
Gordon, Jeffrey, 2007, Independent directors and stock market prices: The new corporate
governance paradigm, Stanford Law Review 59, 1465—1568.
Grossman, Sanford, and Joseph Stiglitz, 1980, On the impossibility of informationally effi-
cient markets, American Economic Review 70, 393—408.
Harris, Milton, and Artur Raviv, 2007, A theory of board control and size, Review of Finan-
cial Studies, forthcoming.
Hartzell, Jay, and Laura Starks, 2003, Institutional investors and executive compensation,
Journal of Finance 58, 2351—2374.
42

Hayek, Friedrich, 1945, The use of knowledge in society, American Economic Review 35,
519—530.
Hermalin, Benjamin, and Michael Weisbach, 1998, Endogenously chosen boards of directors
and their monitoring of the CEO, American Economic Review 88, 96—118.
Holmstrom, Bengt, and Jean Tirole, 1993, Market liquidity and performance monitoring,
Journal of Political Economy 101, 678—709.
Jensen, Michael, 1993, The modern industrial revolution, exit, and the failure of internal
control systems, Journal of Finance 48, 831—880.
Jin, Li, and Stewart Myers, 2006, R2 around the world: New theory and new tests, Journal
of Financial Economics 79, 257—292.
Karpoff, Jonathan, 2001, The impact of shareholder activism on target companies: A survey
of empirical findings, working paper, University of Washington.
Kau, James, James Linck, and Paul Rubin, 2008, Do managers listen to the market?, Journal
of Corporate Finance, forthcoming.
Kyle, Albert, 1985, Continuous auctions and insider trading, Econometrica 53, 1315—1336.
Linck, James, Jeffry Netter, and Tina Yang, 2008, The determinants of board structure,
Journal of Financial Economics 87, 308—328.
Lipton, Martin, and Jay Lorsch, 1992, Amodest proposal for improved corporate governance,
Business Lawyer 1, 59—77.
Masulis, Ronald, Cong Wang, and Fei Xie, 2007, Corporate governance and acquirer returns,
Journal of Finance 62, 1851—1889.
Mikkelson, Wayne, and Megan Partch, 1997, The decline of takeovers and disciplinary man-
agerial turnover, Journal of Financial Economics 44, 205—228.
43

Morck, Randall, Bernard Yeung, and Wayne Yu, 2000, The information content of stock
markets: Why do emerging markets have synchronous stock price movements?, Journal
of Financial Economics 58, 215—260.
Petersen, Mitchell, 2007, Estimating standard errors in finance panel data sets: Comparing
approaches, Review of Financial Studies, forthcoming.
Piotroski, Joseph, and Darren Roulstone, 2004, The influence of analysts, institutional in-
vestors, and insiders on the incorporation of market, industry, and firm-specific infor-
mation into stock prices, Accounting Review 79, 1119—1151.
Raheja, Charu, 2005, Determinants of board size and composition: A theory of corporate
boards, Journal of Financial and Quantitative Analysis 40, 283—306.
Roll, Richard, 1988, R2, Journal of Finance 43, 541—566.
Shleifer, Andrei, and Robert Vishny, 1986, Large shareholders and corporate control, Journal
of Political Economy 94, 461—488.
Shleifer, Andrei, and Robert Vishny, 1997, A survey of corporate governance, Journal of
Finance 52, 737—783.
Song, Fenghua Song, and Anjan Thakor, 2006, Information control, career concerns and
corporate governance, Journal of Finance 61, 1845—1896.
Vafeas, Nikos, 1999, Board meeting frequency and firm performance, Journal of Financial
Economics 53, 113—142.
Vega, Clara, 2006, Stock price reaction to public and private information, Journal of Finan-
cial Economics 82, 103—133.
Weisbach, Michael, 1988, Outside directors and CEO turnover, Journal of Financial Eco-
nomics 20, 421— 460.
44

Table 1Definitions of Variables
Variable DefinitionFraction of independent directors Ratio of number of independent directors to board size (1990-1995 data from Compact Disclosure
and 1996-2001 data from IRRC).Board size Number of board members (1990-1995 data from Compact Disclosure and 1996-2001 data from IRRC).Number of board meetings Number of board meetings by year (EXECUCOMP).Board attendance problems Ratio of directors that attended less than 75% of board/committee meetings to board size (IRRC).Probability of informed trading Probability of information-based trading (PIN) of Easley et al. (2002).Probability of informed trading dummy (Q5 - Q1) Dummy variable that takes the value of one if a firm-year is in the top (Q5) PIN quintile and zero in the
bottom (Q1) PIN quintile.Firm-specific return variation 1−R2 of the Fama-French three-factor regression model using daily stock returns.Illiquidity Average daily ratio of a stock’s absolute return by the dollar volume (Amihud (2002)).Firm size Market capitalization in $ millions (COMPUSTAT: item 25 × item 199).Leverage Ratio of total debt to total assets (COMPUSTAT: (item 9 + item 34) / item 6).Firm age Number of years since the stock inclusion in the CRSP database.Number of business segments Number of business segments in which a firm operates (COMPUSTAT).Market-to-book Ratio of market value of equity to book value of equity (COMPUSTAT: item 25 × item 199 / item 60).R&D expenditures Ratio of R&D expenditures by total assets (COMPUSTAT: item 46 / item 6).Stock return variance Stock return variance (annualized) estimated with daily stock returns (CRSP).Free cash flow Ratio of operating income before depreciation minus capital expenditures by total assets
(COMPUSTAT: (item 13 − item 128) / item 6).Return-on-assets Ratio of operating income before depreciation to total assets (COMPUSTAT: item 13 / item 6).CEO ownership Number of shares held by the CEO divided by number of shares outstanding (EXECUCOMP).CEO tenure Number of years since the director became CEO (EXECUCOMP).Governance index (GIM) Governance index of Gompers et al. (2003), which is based on 24 antitakeover provisions (IRRC).Institutional ownership Number of shares held by institutions divided by the number of shares outstanding (Thomson 13f Holdings).Institutional Herfindahl Institutional Herfindahl index calculated using institutional ownership (Thomson 13f Holdings).Institutional blockholder ownership Number of shares held by the firm’s largest institution with at least 5% of shares divided by the number of shares
outstanding (Thomson 13f Holdings)Blockholder ownership Number of shares held by all blockholders divided by the number of shares outstanding (Dlugosz et al. (2006)).Outside blockholder ownership Number of shares held by outside blockholders divided by the number of shares outstanding (Dlugosz et al. (2006)).Industry Herfindahl Industry Herfindahl index calculated as the sum of squared market shares of firms’ sales (COMPUSTAT: item 12)
in a firm’s industry (two-digit SIC).CEO pay-performance sensitivity (PPS) Change in the dollar value of a CEO’s holdings of stock options per $1,000 change in firm’s market value of equity.Earnings quality Absolute value of firm-specific residuals from an annual industry regression (two-digit SIC) of total accruals on
lagged, contemporaneous, and leading cash flow from operations; variables scaled by total assets.NYSE dummy Dummy variable that takes the value of one if a firm’s stock is traded on the NYSE, zero otherwise (CRSP).Number of analysts Number of analysts covering a firm (IBES).Share turnover Number of shares traded divided by the number of shares outstanding (CRSP).S&P 500 membership Dummy variable that takes the value of one if a firm is a member of the S&P 500 index, zero otherwise (CRSP).
45
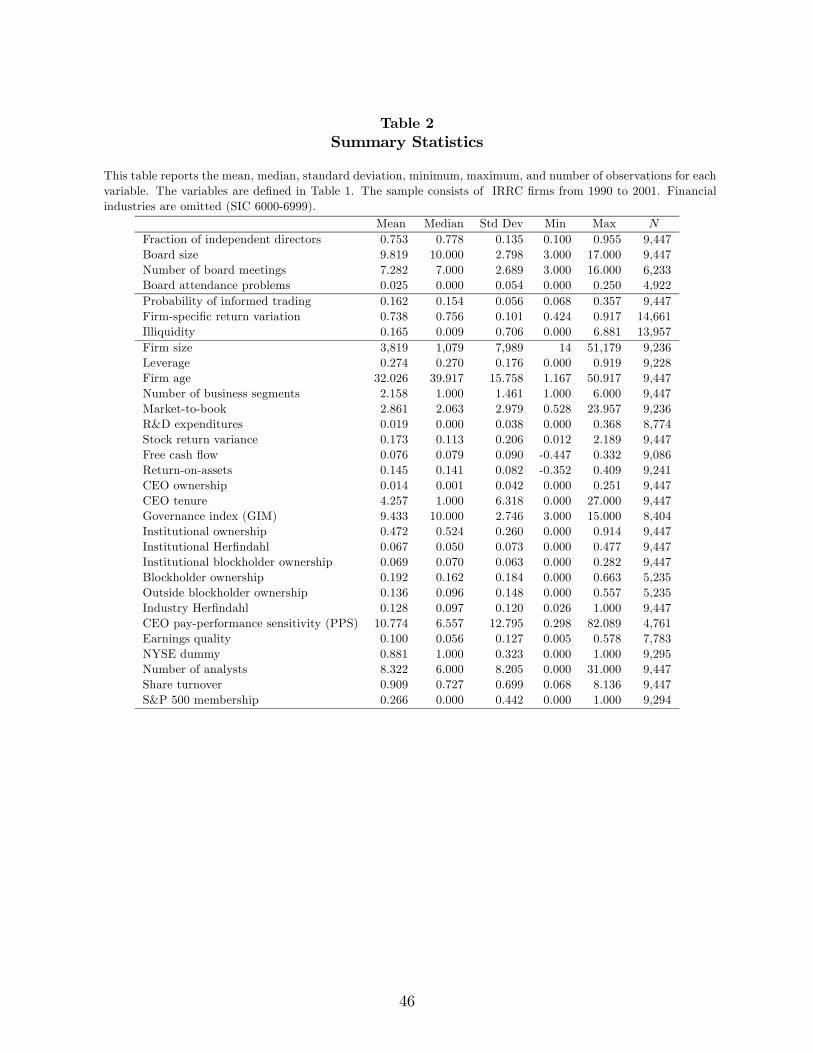
Table 2Summary Statistics
This table reports the mean, median, standard deviation, minimum, maximum, and number of observations for eachvariable. The variables are defined in Table 1. The sample consists of IRRC firms from 1990 to 2001. Financialindustries are omitted (SIC 6000-6999).
Mean Median Std Dev Min Max N
Fraction of independent directors 0.753 0.778 0.135 0.100 0.955 9,447Board size 9.819 10.000 2.798 3.000 17.000 9,447Number of board meetings 7.282 7.000 2.689 3.000 16.000 6,233Board attendance problems 0.025 0.000 0.054 0.000 0.250 4,922Probability of informed trading 0.162 0.154 0.056 0.068 0.357 9,447Firm-specific return variation 0.738 0.756 0.101 0.424 0.917 14,661Illiquidity 0.165 0.009 0.706 0.000 6.881 13,957Firm size 3,819 1,079 7,989 14 51,179 9,236Leverage 0.274 0.270 0.176 0.000 0.919 9,228Firm age 32.026 39.917 15.758 1.167 50.917 9,447Number of business segments 2.158 1.000 1.461 1.000 6.000 9,447Market-to-book 2.861 2.063 2.979 0.528 23.957 9,236R&D expenditures 0.019 0.000 0.038 0.000 0.368 8,774Stock return variance 0.173 0.113 0.206 0.012 2.189 9,447Free cash flow 0.076 0.079 0.090 -0.447 0.332 9,086Return-on-assets 0.145 0.141 0.082 -0.352 0.409 9,241CEO ownership 0.014 0.001 0.042 0.000 0.251 9,447CEO tenure 4.257 1.000 6.318 0.000 27.000 9,447Governance index (GIM) 9.433 10.000 2.746 3.000 15.000 8,404Institutional ownership 0.472 0.524 0.260 0.000 0.914 9,447Institutional Herfindahl 0.067 0.050 0.073 0.000 0.477 9,447Institutional blockholder ownership 0.069 0.070 0.063 0.000 0.282 9,447Blockholder ownership 0.192 0.162 0.184 0.000 0.663 5,235Outside blockholder ownership 0.136 0.096 0.148 0.000 0.557 5,235Industry Herfindahl 0.128 0.097 0.120 0.026 1.000 9,447CEO pay-performance sensitivity (PPS) 10.774 6.557 12.795 0.298 82.089 4,761Earnings quality 0.100 0.056 0.127 0.005 0.578 7,783NYSE dummy 0.881 1.000 0.323 0.000 1.000 9,295Number of analysts 8.322 6.000 8.205 0.000 31.000 9,447Share turnover 0.909 0.727 0.699 0.068 8.136 9,447S&P 500 membership 0.266 0.000 0.442 0.000 1.000 9,294
46

Table 3Board Independence and Probability of Informed Trading
Estimates of OLS panel regressions of the logistic transformed fraction of independent directors are shown. Referto Table 1 for variables definition. The sample consists of IRRC firms from 1990 to 2001. Financial industriesare omitted (SIC 6000-6999). Regressions include industry and year dummies. Robust t-statistics adjusted forfirm-level clustering are in parentheses.
(1) (2) (3) (4) (5) (6)Probability of informed trading -3.1376 -1.9860 -1.8604 -1.5294 -1.5383 -1.5299
(-13.60) (-7.76) (-6.81) (-5.08) (-5.15) (-5.08)Firm size (log) 0.0259 0.0193 0.0226 0.0224 0.0226
(1.79) (1.34) (1.48) (1.44) (1.47)Leverage 0.4392 0.3749 0.3177 0.3214 0.3214
(4.33) (3.81) (3.01) (3.01) (3.01)Firm age (log) 0.1566 0.1521 0.1030 0.1063 0.1068
(7.05) (7.01) (3.98) (4.11) (4.12)Number of business segments (log) 0.0997 0.1059 0.0854 0.0854 0.0860
(4.14) (4.62) (3.64) (3.65) (3.67)Market-to-book (log) 0.0066 0.0136 0.0164 0.0171 0.0178
(0.28) (0.56) (0.64) (0.67) (0.70)R&D expenditures 0.1626 -0.1125 -0.1309 -0.1113 -0.1119
(0.40) (-0.29) (-0.30) (-0.25) (-0.26)Stock return variance -0.0723 -0.0453 -0.0246 -0.0292 -0.0240
(-1.27) (-0.76) (-0.40) (-0.47) (-0.39)Free cash flow 0.3023 0.3778 0.1244 0.1178 0.1204
(1.05) (1.34) (0.41) (0.39) (0.40)Return-on-assets -0.5283 -0.5507 -0.3896 -0.3930 -0.3977
(-1.56) (-1.67) (-1.13) (-1.14) (-1.15)CEO ownership -2.3059 -1.8691 -1.8684 -1.8792
(-6.54) (-4.91) (-4.89) (-4.95)CEO tenure -0.0044 -0.0058 -0.0059 -0.0058
(-1.73) (-2.24) (-2.30) (-2.28)Governance index (GIM) 0.0400 0.0402 0.0399
(6.03) (6.03) (5.97)Institutional ownership 0.0755 0.0390
(1.25) (0.53)Institutional Herfindahl 0.1893
(0.74)Institutional blockholder ownership 0.2929
(0.96)R2 0.082 0.144 0.166 0.163 0.164 0.164N 9,447 8,610 7,504 6,740 6,740 6,740
47

Table 4Board Independence and Probability of Informed Trading Quintiles
Estimates of OLS panel regressions of the logistic transformed fraction of independent directors are shown. Referto Table 1 for variables definition. The sample consists of IRRC firms from 1990 to 2001. Financial industriesare omitted (SIC 6000-6999). Regressions include industry and year dummies. Robust t-statistics adjusted forfirm-level clustering are in parentheses.
(1) (2) (3) (4) (5) (6)Probability of informed trading dummy (Q5 − Q1) -0.5193 -0.3404 -0.3399 -0.2708 -0.2746 -0.2702
(-13.08) (-6.33) (-6.12) (-4.59) (-4.66) (-4.57)Firm size (log) 0.0187 0.0115 0.0205 0.0211 0.0203
(1.06) (0.65) (1.09) (1.11) (1.08)Leverage 0.3937 0.3896 0.3286 0.3319 0.3328
(3.25) (3.07) (2.42) (2.42) (2.43)Firm age (log) 0.1965 0.1881 0.1518 0.1572 0.1576
(7.25) (6.76) (4.49) (4.60) (4.61)Number of business segments (log) 0.0707 0.0683 0.0418 0.0413 0.0418
(2.48) (2.48) (1.53) (1.51) (1.53)Market-to-book (log) 0.0084 0.0124 0.0103 0.0100 0.0112
(0.29) (0.42) (0.32) (0.32) (0.35)R&D expenditures 0.4071 0.3513 0.5496 0.5686 0.5564
(0.73) (0.64) (0.89) (0.92) (0.90)Stock return variance -0.0606 0.0069 0.0329 0.0243 0.0302
(-0.77) (0.08) (0.33) (0.25) (0.31)Free cash flow 0.3559 0.4728 0.1206 0.1139 0.1219
(1.06) (1.36) (0.31) (0.30) (0.32)Return-on-assets -0.6032 -0.8197 -0.6705 -0.6639 -0.6833
(-1.58) (-2.05) (-1.61) (-1.58) (-1.64)CEO ownership -1.9879 -1.6861 -1.7101 -1.7090
(-3.74) (-3.03) (-3.06) (-3.06)CEO tenure -0.0041 -0.0066 -0.0066 -0.0066
(-1.31) (-2.13) (-2.15) (-2.15)Governance index (GIM) 0.0396 0.0394 0.0389
(4.93) (4.88) (4.83)Institutional ownership 0.0694 0.0441
(0.89) (0.46)Institutional Herfindahl 0.2539
(0.87)Institutional blockholder ownership 0.2308
(0.58)R2 0.137 0.199 0.204 0.186 0.188 0.187N 3,815 3,471 3,044 2,735 2,735 2,735
48

Table 5Board Independence and Probability of Informed Trading: Endogeneity
Estimates of regressions of the logistic transformed fraction of independent directors using alternative estimation methodsare shown. Columns (1) and (2) present estimates of panel regressions with firm fixed effects. The two-stage least squares(2SLS) panel regression uses analyst coverage, share turnover, and S&P 500 membership as instruments for PIN. Columns(3) and (4) present first stage regression estimates with PIN as dependent variable. Columns (5) and (6) present second stageregression estimates with the logistic transformed fraction of independent directors as dependent variable. Columns (7) and(8) present estimates of regressions using lagged PIN as explanatory variable. Refer to Table 1 for variables definition. Thesample consists of IRRC firms from 1990 to 2001. Financial industries are omitted (SIC 6000-6999). Regressions includeindustry and year dummies. Robust t-statistics adjusted for firm-level clustering are in parentheses.
(1) (2) (3) (4) (5) (6) (7) (8)Firm fixed Two-stage least squares (2SLS) Lag PINeffects First First Second Second
stage stage stage stageProbability of informed trading (PIN) -0.6940 -0.5812 -8.8139 -10.3296 -1.6905 -1.3691
(-3.58) (-2.62) (-2.70) (-2.30) (-6.47) (-4.76)Firm size (log) 0.0738 0.0683 -0.0232 -0.0221 -0.1375 -0.1736 0.0297 0.0258
(3.02) (2.60) (34.67) (32.52) (-1.75) (-1.70) (2.08) (1.71)Leverage 0.3394 0.2417 -0.0154 -0.0171 0.3395 0.2351 0.4344 0.3130
(3.14) (2.05) (3.42) (3.77) (3.16) (1.98) (4.18) (2.89)Firm age (log) 0.4413 0.6101 -0.0045 -0.0044 0.1303 0.1198 0.1595 0.1042
(8.09) (6.11) (4.92) (4.73) (5.02) (4.12) (6.97) (3.99)Number of business segments (log) 0.0150 0.0118 -0.0056 -0.0056 0.0645 0.0614 0.1024 0.0853
(0.77) (0.60) (5.77) (5.78) (2.15) (1.83) (4.27) (3.61)Market-to-book (log) 0.0098 -0.0120 0.0042 0.0055 0.0370 0.0620 0.0080 0.0194
(0.44) (-0.53) (3.64) (4.75) (1.43) (1.87) (0.32) (0.76)R&D expenditures -0.4203 -0.5590 0.0191 0.0163 0.2163 -0.0500 0.0910 -0.2403
(-0.88) (-0.83) (1.00) (0.85) (0.51) (-0.12) (0.22) (-0.54)Stock return variance 0.2085 0.1374 -0.0277 -0.0275 -0.3181 -0.3338 -0.0746 -0.0339
(3.91) (2.10) (8.10) (7.83) (-2.58) (-2.11) (-1.23) (-0.54)Free cash flow -0.1143 -0.2661 -0.0135 -0.0103 0.2832 0.3591 0.2094 0.0630
(-0.59) (-1.06) (1.38) (1.04) (0.98) (1.26) (0.69) (0.21)Return-on-assets 0.0063 0.1705 0.0091 -0.0002 -0.5447 -0.6301 -0.4355 -0.3423
(0.02) (0.55) (0.75) (0.01) (-1.60) (-1.85) (-1.23) (-0.98)CEO ownership 0.4657 0.0283 -2.0518 -1.8711
(1.23) (1.68) (-4.84) (-4.86)CEO tenure -0.0051 -0.0004 -0.0085 -0.0061
(-2.34) (4.72) (-2.54) (-2.35)Governance index (GIM) 0.0416 -0.0007 0.0309 0.0397
(3.53) (2.78) (2.65) (5.94)Institutional ownership 0.0338 -0.0085 -0.0460 0.0837
(0.42) (2.81) (-0.35) (1.37)Institutional Herfindahl 0.2565 0.0657 1.0457 0.1218
(1.61) (5.34) (1.23) (0.48)Number of analysts -0.0013 -0.0013
(2.10) (2.16)Share turnover -0.0059 -0.0042
(5.37) (3.98)S&P 500 membership 0.0034 0.0022
(2.12) (1.35)R2 0.095 0.088 0.462 0.449 0.139 0.161N 8,610 6,740 8,610 6,740 8,610 6,740 7,927 6,658
49

Table 6Board Independence and Probability of Informed Trading: Alternative
Estimation Methods
Estimates of regressions of the logistic transformed fraction of independent directors using alternative estimationmethods are shown. Columns (1) and (2) present estimates of median (least-absolute deviation) panel regression.Columns (3) and (4) present estimates of cross-sectional regressions using the Fama-MacBeth procedure. Referto Table 1 for variables definition. The sample consists of IRRC firms from 1990 to 2001. Financial industriesare omitted (SIC 6000-6999). Regressions in columns (1) and (2) include industry and year dummies. Robustt-statistics adjusted for firm-level clustering (columns (1) and (2)) are in parentheses .
(1) (2) (3) (4)Median Fama-regression MacBeth
Probability of informed trading (PIN) -2.2345 -1.8275 -1.1203 -0.8144(-9.36) (-6.14) (-7.71) (-3.37)
Firm size (log) 0.0115 -0.0024 0.0175 0.0126(1.17) (-0.20) (2.74) (1.60)
Leverage 0.5376 0.3759 0.4690 0.3486(9.04) (5.38) (13.19) (7.78)
Firm age (log) 0.1736 0.1252 0.1562 0.1042(12.97) (6.87) (13.55) (11.59)
Number of business segments (log) 0.0766 0.0638 0.0926 0.0798(4.54) (3.41) (8.70) (6.00)
Market-to-book (log) 0.0137 0.0238 -0.0078 0.0237(0.79) (1.17) (-0.45) (1.59)
R&D expenditures -0.1276 -0.2050 0.7357 0.4601(-0.46) (-0.61) (4.35) (4.53)
Stock return variance -0.0068 -0.0229 -0.3434 -0.4132(-0.13) (-0.36) (-4.57) (-3.69)
Free cash flow 0.0793 0.0606 -0.0061 -0.2502(0.45) (0.29) (-0.05) (-1.38)
Return-on-assets -0.3578 -0.5427 -0.3193 -0.2341(-1.78) (-2.26) (-2.33) (-1.83)
CEO ownership -2.0375 -1.9228(-7.31) (-6.79)
CEO tenure -0.0066 -0.0063(-3.60) (-4.97)
Governance index (GIM) 0.0359 0.0393(8.03) (18.56)
Institutional ownership 0.0865 -0.0046(1.88) (-0.12)
Institutional Herfindahl 0.0661 -0.0798(0.36) (-0.41)
R2 0.105 0.156N 8,610 6,740 8,610 6,740
50

Table 7Board Independence and Probability of Informed Trading: Additional Robustness Checks
Estimates of OLS panel regressions of the logistic transformed fraction of independent directors, the log fraction of independent directors (column (3)), and the fraction of independentdirectors (column (4)) are shown. Refer to Table 1 for variables definition. The sample consists of IRRC firms from 1990 to 2001. Financial industries are omitted (SIC 6000-6999).Regressions include industry and year dummies. Robust t-statistics adjusted for firm-level clustering are in parentheses.
(1) (2) (3) (4) (5) (6) (7) (8) (9) (10)IRRC Compact Board Board All Outside Industry Earnings Board NYSE
1996-2001 Disclosure indep. (log) indep. blockholders blockholders Herfindahl quality sizeProbability of informed trading (PIN) -0.9069 -0.8999 -0.3606 -0.1909 -0.8460 -0.9136 -1.5469 -1.2802 -1.5258 -1.4974
(-2.52) (-3.17) (-4.06) (-2.86) (-2.30) (-2.47) (-5.18) (-4.43) (-4.94) (-5.00)Firm size (log) 0.0201 0.0228 0.0054 0.0055 0.0190 0.0223 0.0214 0.0254 0.0053 0.0190
(1.21) (1.47) (1.24) (1.66) (1.15) (1.35) (1.38) (1.57) (0.31) (1.24)Leverage 0.2787 0.3029 0.0879 0.0735 0.2771 0.2737 0.3264 0.4203 0.2973 0.3268
(2.52) (2.85) (2.75) (3.24) (2.51) (2.47) (3.06) (3.85) (2.63) (3.06)Firm age (log) 0.1123 0.0957 0.0205 0.0138 0.1128 0.1204 0.1066 0.1079 0.1026 0.1094
(4.01) (3.62) (2.59) (2.46) (3.96) (4.21) (4.13) (3.81) (3.60) (4.26)Number of business segments (log) 0.0684 0.1082 0.0258 0.0127 0.0683 0.0675 0.0849 0.1098 0.0988 0.0842
(2.93) (4.30) (4.18) (2.55) (2.91) (2.88) (3.63) (4.38) (4.08) (3.60)Market-to-book (log) 0.0078 0.0434 0.0081 0.0059 0.0074 0.0098 0.0185 0.0102 0.0261 0.0184
(0.28) (1.78) (1.17) (1.14) (0.26) (0.34) (0.73) (0.40) (0.98) (0.72)R&D expenditures 0.2971 0.2050 -0.0451 -0.0270 0.2939 0.2938 -0.0779 -0.0544 0.1237 -0.0815
(0.64) (0.45) (-0.35) (-0.28) (0.63) (0.63) (-0.18) (-0.12) (0.29) (-0.19)Stock return variance -0.0925 -0.0869 0.0227 -0.0071 -0.0856 -0.0903 -0.0325 -0.0031 0.0320 -0.0055
(-1.44) (-1.35) (1.30) (-0.50) (-1.34) (-1.42) (-0.52) (-0.04) (0.48) (-0.09)Free cash flow 0.2321 -0.2222 0.0303 -0.0206 0.2401 0.2377 0.1363 0.0227 0.0833 0.1184
(0.77) (-0.72) (0.32) (-0.31) (0.79) (0.79) (0.45) (0.07) (0.27) (0.39)Return-on-assets -0.3563 -0.1136 -0.0615 -0.0117 -0.3836 -0.3784 -0.4132 -0.1770 -0.3244 -0.4480
(-1.03) (-0.32) (-0.57) (-0.15) (-1.11) (-1.09) (-1.20) (-0.47) (-0.92) (-1.30)CEO ownership -2.0585 -1.7194 -0.5215 -0.3082 -2.0476 -1.9487 -1.8687 -1.7319 -1.6205 -1.8471
(-4.36) (-4.68) (-4.10) (-3.74) (-4.34) (-4.12) (-4.90) (-3.83) (-4.28) (-4.87)CEO tenure -0.0092 -0.0006 -0.0012 -0.0009 -0.0092 -0.0091 -0.0059 -0.0060 -0.0059 -0.0061
(-3.05) (-0.24) (-1.47) (-1.64) (-3.08) (-3.06) (-2.29) (-2.20) (-2.27) (-2.38)Governance index (GIM) 0.0392 0.0512 0.0113 0.0071 0.0386 0.0377 0.0400 0.0416 0.0396 0.0400
(5.14) (7.64) (5.81) (4.95) (5.09) (4.93) (6.01) (5.90) (5.69) (6.05)Institutional ownership 0.0120 0.0756 0.0278 0.0149 0.0741 0.1257 0.1189 0.0677
(0.19) (1.21) (1.81) (1.14) (1.22) (1.96) (1.85) (1.11)Institutional Herfindahl 0.2839 0.1286 0.0557 0.0655 0.1868 0.3304 0.1748 0.1905
(1.15) (0.49) (0.75) (1.31) (0.73) (1.02) (0.67) (0.74)Blockholders ownership 0.0195
(0.20)Outside blockholders ownership 0.3024
(2.73)Industry Herfindahl 0.1286
(1.02)Earnings quality -0.1665
(-1.99)Board size (lag) 0.0172
(2.14)NYSE dummy 0.1045
(1.82)R2 0.169 0.153 0.143 0.088 0.168 0.172 0.164 0.185 0.170 0.165N 4,504 6,029 6,896 7,034 4,504 4,504 6,740 5,710 6,175 6,740
51

Table 8Board Independence and Alternative Measures of Price Informativeness
Estimates of OLS panel regressions of alternative price informativeness measures are shown. Columns (1) and (2)use the logistic transformed relative firm-specific return variation as dependent variable. Columns (3) and (4) usethe logarithm of the illiquidity measure of Amihud (2002). Refer to Table 1 for variables definition. The sampleconsists of IRRC firms from 1990 to 2001. Financial industries are omitted (SIC 6000-6999). Regressions includeindustry and year dummies. Robust t-statistics adjusted for firm-level clustering are in parentheses.
(1) (2) (3) (4)Firm-specific return variation (logistic) -0.0877 -0.0699
(-4.88) (-3.74)Illiquidity (log) -0.0829 -0.0722
(-6.96) (-4.46)Firm size (log) 0.0748 0.0549 -0.0208 -0.0285
(7.23) (4.83) (-1.07) (-1.25)Leverage 0.2839 0.1913 0.3264 0.2227
(3.79) (2.29) (4.46) (2.72)Firm age (log) 0.1417 0.0942 0.1500 0.1059
(8.64) (4.68) (9.22) (5.19)Number of business segments (log) 0.0996 0.0676 0.1111 0.0825
(4.92) (3.29) (5.42) (4.10)Market-to-book (log) 0.0137 0.0292 -0.0262 0.0063
(0.85) (1.60) (-1.40) (0.30)R&D expenditures 0.9549 0.6470 0.6232 0.3124
(4.47) (2.58) (2.85) (1.23)Stock return variance -0.0266 -0.0209
(-0.83) (-0.57)Free cash flow 0.4644 0.2125 0.6486 0.4124
(2.09) (0.88) (2.94) (1.70)Return-on-assets -0.9283 -0.5958 -1.0350 -0.7580
(-3.80) (-2.28) (-4.17) (-2.85)CEO ownership -1.9371 -1.9263
(-6.52) (-6.28)CEO tenure -0.0048 -0.0056
(-2.26) (-2.63)Governance index (GIM) 0.0404 0.0394
(7.49) (7.29)Institutional ownership 0.0890 0.0504
(1.76) (0.97)Institutional Herfindahl 0.0600 0.3010
(0.29) (1.41)R2 0.151 0.159 0.159 0.162N 11,755 9,460 12,964 9,168
52

Table 9Additional Board Monitoring Variables and Probability of Informed Trading
Estimates of OLS panel regressions of the logarithm of the number of board meetings, the fraction of directors withboard attendance problems, and the logarithm of board size are shown. Refer to Table 1 for variables definition. Thesample consists of IRRC firms from 1990 to 2001. Financial industries are omitted (SIC 6000-6999). Regressionsinclude industry and year dummies. Robust t-statistics adjusted for firm-level clustering are in parentheses.
(1) (2) (3) (4) (5) (6)Number of board Board attendance Boardmeetings (log) problems size (log)
Probability of informed trading -0.3878 -0.3773 0.0477 0.0500 -0.2942 -0.2514(-2.08) (-1.99) (2.11) (2.12) (-2.51) (-1.97)
Firm size (log) 0.0415 0.0390 0.0018 0.0018 0.0844 0.0870(5.06) (4.57) (2.30) (2.22) (16.84) (15.61)
Leverage 0.0965 0.0984 0.0050 0.0032 0.1183 0.0735(1.82) (1.77) (0.96) (0.59) (3.37) (2.03)
Firm age (log) 0.0316 0.0147 -0.0002 -0.0008 0.0676 0.0581(2.87) (1.05) (-0.19) (-0.61) (8.19) (5.86)
Number of business segments (log) 0.0272 0.0161 0.0011 0.0013 0.0295 0.0182(2.15) (1.26) (0.84) (0.98) (3.19) (2.00)
Market-to-book (log) 0.0054 -0.0024 0.0001 0.0004 -0.0457 -0.0415(0.47) (-0.20) (0.10) (0.28) (-5.11) (-4.43)
R&D expenditures 0.0571 0.2602 0.0249 0.0370 -0.5089 -0.6790(0.24) (1.06) (0.99) (1.34) (-2.89) (-3.57)
Stock return variance 0.1895 0.1618 0.0023 0.0005 -0.1330 -0.1184(3.98) (3.45) (0.52) (0.11) (-4.54) (-3.59)
Free cash flow 0.0262 0.0297 0.0257 0.0253 0.0892 0.0984(0.17) (0.17) (1.97) (1.77) (0.86) (0.85)
Return-on-assets -0.4269 -0.4495 -0.0279 -0.0189 -0.3287 -0.3241(-2.51) (-2.43) (-1.78) (-1.11) (-2.73) (-2.49)
CEO ownership -0.5782 -0.0568 -0.5043(-2.59) (-2.94) (-2.95)
CEO tenure -0.0045 0.0003 0.0006(-3.14) (2.28) (0.62)
Governance index (GIM) 0.0043 -0.0003 0.0107(1.17) (-0.90) (4.25)
Institutional ownership -0.0878 -0.0118 -0.0486(-2.52) (-3.25) (-2.13)
Institutional Herfindahl -0.0524 0.0331 0.1663(-0.36) (2.22) (1.79)
R2 0.091 0.110 0.006 0.011 0.329 0.333N 4,827 4,236 5,031 4,744 8,923 7,034
53

Table 10Board Independence and Probability of Informed Trading: Takeover Defenses,Institutional Ownership, Firm-Specific Knowledge, and Pay-Performance
Sensitivity
Estimates of OLS panel regressions of the logistic transformed fraction of independent directors are shown. The high and lowgovernance index (GIM) samples consist of those firms whose GIM is above 13 and below 6. The high and low institutionalownership Herfindahl index samples consist of those firms whose institutional ownership Herfindahl index is above the 80thpercentile and below the 20th percentile. The high (low) R&D sample consists of those firms whose ratio of R&D expendituresto assets is above (below) the 80th percentile. The high and low CEO pay-performance sensitivity (PPS) samples consist ofthose firms whose PPS is above the 80th percentile and below the 20th percentile. Refer to Table 1 for variables definition.The sample consists of IRRC firms from 1990 to 2001. Financial industries are omitted (SIC 6000-6999). Regressions includeindustry and year dummies. Robust t-statistics adjusted for firm-level clustering are in parentheses.
(1) (2) (3) (4) (5) (6) (7) (8)High Low High inst. Low inst. High Low High LowGIM GIM Herfindahl Herfindahl R&D R&D PPS PPS
Probability of informed trading 0.1013 -1.4477 -1.2607 -0.2797 -0.7576 -1.4648 -1.4779 -0.1044(0.08) (-2.08) (-2.72) (-0.50) (-1.21) (-5.05) (-2.58) (-0.14)
Firm size (log) 0.0506 0.0269 0.0164 0.0520 0.0311 0.0439 0.0244 0.0067(0.98) (0.67) (0.63) (1.63) (1.02) (2.66) (0.83) (0.22)
Leverage 0.6190 0.5675 0.4331 -0.0773 -0.0648 0.3444 0.2760 0.5776(1.77) (2.46) (2.90) (-0.39) (-0.34) (2.89) (1.76) (2.29)
Firm age (log) -0.0633 0.1009 -0.0199 0.1365 0.1208 0.0945 0.1333 0.1912(-0.54) (1.52) (-0.46) (2.46) (2.00) (3.21) (3.32) (2.61)
Number of business segments (log) 0.1299 0.1851 0.1720 0.0418 0.1571 0.0592 0.1347 -0.0188(1.44) (2.55) (3.95) (0.92) (3.10) (2.30) (3.16) (-0.42)
Market-to-book (log) 0.0046 0.0324 0.0821 -0.0017 0.0275 0.0327 -0.0032 0.1030(0.06) (0.61) (2.18) (-0.04) (0.69) (1.31) (-0.08) (1.91)
R&D expenditures 3.8049 0.2791 -0.4451 1.1160 0.1360 3.8646 -0.1081 -0.1665(1.81) (0.21) (-0.60) (1.34) (0.18) (1.62) (-0.19) (-0.18)
Stock return variance -0.0877 -0.0210 0.1380 -0.2239 -0.0423 0.0237 -0.0505 -0.1552(-0.24) (-0.07) (1.74) (-1.49) (-0.25) (0.36) (-0.41) (-0.58)
Free cash flow 0.5184 -0.9381 -0.2632 0.4504 0.2941 -0.0154 0.7072 0.5388(0.48) (-1.37) (-0.61) (0.84) (0.38) (-0.05) (1.28) (0.88)
Return-on-assets -0.2561 1.1769 0.2768 -0.3990 -0.4283 -0.2363 -0.8135 -2.2678(-0.18) (1.45) (0.55) (-0.67) (-0.54) (-0.60) (-1.47) (-3.06)
CEO ownership -3.2201 -1.8107 -1.1028 -3.3888 -2.4752 -1.7124 -2.5069 -0.8020(-2.03) (-2.72) (-2.25) (-2.38) (-1.51) (-4.31) (-4.82) (-0.88)
CEO tenure -0.0043 0.0001 0.0081 0.0005 -0.0083 -0.0050 -0.0098 -0.0113(-0.57) (0.02) (1.48) (0.09) (-1.43) (-1.74) (-2.28) (-2.43)
Governance index (GIM) 0.1700 0.0887 0.0636 0.0206 0.0378 0.0392 0.0328 0.0229(2.24) (1.36) (5.27) (1.72) (3.13) (5.06) (2.75) (1.68)
Institutional ownership 0.3807 0.0856 0.1868 -0.2233 0.1975 0.0446 0.0313 0.2167(1.91) (0.46) (1.46) (-0.80) (1.56) (0.66) (0.31) (1.71)
Institutional Herfindahl -1.4804 -0.3847 0.4562 1.4879 0.3998 0.2157 0.6879 -0.9390(-1.90) (-0.86) (1.77) (0.19) (0.88) (0.86) (1.68) (-1.43)
R2 0.409 0.424 0.282 0.234 0.260 0.203 0.195 0.186N 437 615 1,342 1,255 1,305 5,433 1,241 1,241
54

Figure 1. Board Independence by Probability of Informed Trading Quintiles.This figure plots the mean fraction of independent directors by probability of informed trading(PIN) quintiles for the period from 1990 to 2001.
55