the informativeness of recycled items: evidence from
TRANSCRIPT

The Informativeness of Recycled Items: Evidence from Pension Accounting
Marc Cussatt#*
Troy Pollard^
Mary Stone^
December 1, 2017
# Carson School of Business, Washington State University, Pullman, WA 99164 ^ Culverhouse School of Accountancy, Culverhouse College of Commerce and Business Administration, University of Alabama, Tuscaloosa, AL 35847-0220 * Corresponding author: Marc Cussatt, Carson School of Business, Washington State University, Pullman, WA 99164. Email: [email protected] Telephone: (509) 335-5391.

The Informativeness of Reclassified Items: Evidence from Pension Accounting
Abstract
Employers sponsoring defined benefit pension plans recognize remeasurement gains/losses (GL) and adjustments to prior service costs (PSC) in other comprehensive income (OCI), close them to accumulated other comprehensive income (AOCI), and subsequently reclassify them to earnings (RECLASS). Researchers and standard setters question the appropriateness of this practice since reclassification adjustments affect earnings several periods after the economic event that gave rise to them. We use hand-collected data to assess the usefulness of pension-related OCIGL and PSC, AOCIGL and PSC, and RECLASSGL and PSC in predicting year-ahead pension expense and cash contributions to the pension fund. We find that RECLASSGL, OCIGL, and AOCIGL are useful predictors of year-ahead pension expense and cash contributions. Interestingly, we find that RECLASSGL and OCIGL amounts exhibits incremental explanatory power for firms’ market value of equity, but AOCIGL does not. We find very weak evidence of predictive ability and relevance for RECLASSPSC, OCIPSC, and AOCIPSC, a finding likely attributable to the small size and rarity of these adjustments in our sample. To the extent that a persistent, incrementally predictive and value relevant item is decision useful and decision-usefulness is a desired quality of accounting information, our results support continuing the practice of reclassifying remeasurement gains/losses. In contrast, it appears that the practice of reclassifying PSC adjustments likely provides little information. Our study contributes to the debate among researchers and standard setters regarding the appropriateness of reclassifying items from AOCI to earnings. Keywords: other comprehensive income, reclassification adjustments, pension accounting, FASB Invitation to Comment
1. Introduction
This paper investigates the predictive usefulness and value relevance of defined benefit
pension plan remeasurement gains/losses (GL) and adjustments to prior service costs (PSC)
included other comprehensive income (OCIGL and OCIPSC, respectively), closed to accumulated
other comprehensive income (AOCIGL and AOCIPSC), and subsequently recognized in net income
(RECLASSGL and RECLASSPSC). The transfer of amounts from AOCI to earnings is referred to
as a reclassification adjustment.1 Reclassification of net gains (losses) and decreases (increases) to
prior service costs decrease (increase) current year pension expense. Reclassification adjustments
are an application of historical cost accounting that results in a smoother time series of earnings.
Questions about the decision-usefulness of pension-related reclassification adjustments
arise because of the time lag between when an economic event occurs (e.g., actual and expected
returns on pension assets differ) and when an amount related to the event is reclassified to the
income statement. Critics argue that reclassification adjustments “make it difficult to understand
the entity’s performance for a reporting period because the amounts reported in earnings are not
correlated to the economic performance of the current periods” [FASB 2016, Invitation To
Comment (ITC): 20]. However, a recent survey of professional financial statement users suggests
that they find the pension footnote, where pension expense is disaggregated into its various
components (including reclassifications), useful in their analysis (Drake, Hales, and Rees 2017).
Rees and Shane (2012), Black (2016) and Bradbury (2016) review research assessing the
predictive ability and value relevance of OCI and its components.2 All three reviews characterize
1 ASC 220-10-45-15 states “reclassification adjustments shall be made to avoid double counting of items in comprehensive income that are presented as part of net income for a period that also had been presented in other comprehensive income in that period or earlier period.” 2 The referenced articles do not review studies of the pricing of amounts recognized in OCI related to cash flow hedges (Bratten, Causholli, Khan 2016; Campbell 2015; Makar, Wang, and Alan 2013) or translation adjustments (Bratten et al. 2016; Setyaningrum and Siregar 2015; Makar et al. 2013; Louis 2003). These studies are not directly relevant to
2

research findings as inconclusive and call for additional research. Rees and Shane (2012: 58)
assert the reclassification issue “represents the key to whether the current practice of OCI reporting
can be justified. If recycling3 does not provide better information to users, then we believe this
complex accounting method should be scrapped in favor of the more straightforward practice of
reporting comprehensive income in one performance statement with EPS based on comprehensive
income.” In order to assess whether reclassification of pension amounts provides useful
information to users, we assess whether, after controlling for pension related AOCI balances and
current period pension-related adjustments included in OCI, reclassification adjustments are useful
in predicting year-ahead pension expense and cash contributions to the pension fund. We also
examine potential pricing implications.
We are aware of only two studies (Dong, Ryan, and Zhang 2014; Badertscher, Burks, and
Easton 2014) that examine the decision usefulness of reclassification adjustments. Both examine
banks’ reclassifications of unrealized gains/losses on available-for-sale securities (AFS). In Dong
et al. (2014) the trigger for reclassification is a sale. In Badertscher et al. (2014) the trigger is the
arrival of new information that leads management to conclude there is significant doubt that the
firm can hold the security until the fair value recovers to amortized cost. These studies provide
evidence the market values reclassification adjustments, a finding that is at odds with the
expectation the market would value AFS-related unrealized gains/losses recognized in OCI but
not necessarily the reclassification to NI when AFS securities are sold (Dong et al. 2014) or
management determines securities are other-than-temporarily impaired (OTTI) (Badertscher et al.
our work. They do, however, provide evidence suggesting the market may have difficulty interpreting amounts recognized in OCI. For example, Makar et al. (2013) interpret the results of their tests of the market pricing of net gains/losses on cash flow hedges as consistent with mixed attribute pricing theory (Gigler, Kanodia, and Venugopalan 2007) and with the mixed attribute accounting model providing inadequate information on the net economic effects of foreign exchanges cash flow hedges. 3 The terms reclassify and recycle have been used interchangeably in the literature. Our use of reclassify is consistent with the FASB’s current usage.
3

2014). Dong et al. (2014) suggests that reclassifications are likely priced because they help
investors predict banks’ future performance. Badertscher et al. (2014) find that OTTIs are priced
more for banks with strong reported earnings performance, suggesting that investors question
whether the strong reported performance accurately reflects the quality of the bank’s assets.
In contrast to market-triggered AFS reclassifications,4 the triggers for pension-related
reclassifications are mechanical. Remeasurement gains/losses, which are recognized in OCIGL and
closed to AOCIGL, arise from changes in the value of either the plan liability (projected benefit
obligation) or plan assets resulting from experience different from that assumed or from a change
in an actuarial assumption (ASC 715-50-1).5 A portion of these gains/losses are reclassified from
AOCI only if the total amount of gains/losses stored in AOCI exceeds a materiality threshold.6
Once reclassification is triggered, firms must continue to reclassify a portion of the gains/losses
until the amount stored in AOCI no longer exceeds the threshold. PSC adjustments are
systematically reclassified over the average remaining service life of employees affected by the
amendment. Thus, pension-related reclassifications (RECLASSGL and RECLASSPSC) typically
will affect multiple periods. In contrast, the reclassifications studied in Dong et al. (2014) only
arise when a sale takes place, and each reclassification affects only one period (the period of the
sale). Similarly, while the OTTIs studied in Badertscher et al. (2014) must be re-evaluated every
reporting period, reclassification only takes place in subsequent periods if the market value falls
even further below amortized cost (recovery of OTTIs are not allowed). Lastly, while Dong et al.
4 The triggers for reclassification for the other two components of OCI are also market-related: settlement of the hedged transaction for cash flow hedges and the sale or liquidation of foreign investment for translation adjustments. 5 ASC 715 does not define the expression actuarial gains and losses. It confines the use of that expression to the reconciliation of the beginning and ending balances of the benefit obligation (ASC 715-50-1). 6The materiality threshold is determined by applying the corridor method, which requires reclassification of net gains/losses, if as the beginning of the year, the net actuarial gain/loss exceeds 10% of the greater of the PBO or market-related value of plan assets. The amount in excess of the 10% threshold is amortized over the average remaining service lives of employees accruing benefits under the plan (ASC 715-30-35-24).
4

(2014) and Badertscher (2014) focus on banks’ due to the prevalence of AFS securities held by
these firms, our sample contains firms from 37 different industry groupings (2-digit SICs). Given
these differences, the results of prior research cannot be generalized to pension-related
reclassifications.
Due to the time required to hand-collect RECLASSGL and RECLASSPSC we focus on firms
with economically significant pension plans. Specifically, we create a ratio of the pension liability
scaled by total assets to identify the size of the pension plan relative to the size of the company.
We restrict our initial sample to the 200 firms with the largest average ratio during our sample
period. We hand collect RECLASSGL and RECLASSPSC for the years 2008-2015. Using
RECLASSGL (RECLASSPSC) and AOCIGL (AOCIPSC), which is available via the COMPUSTAT
pension database, we compute OCIGL (OCIPSC).
We find that RECLASSGL, OCIGL, and AOCIGL are all predictive of year-ahead pension
expense and cash contributions to the pension fund. Exploring potential pricing implications, we
find that RECLASSGL and OCIGL exhibits incremental explanatory power for firms’ market value
of equity, but AOCIGL does not. We also utilize hand collected data regarding management
estimates of RECLASSGL and find that the unexpected portion of RECLASSGL (the difference
between management’s stated expectations and actual amount) is useful in explaining short
window market-adjusted returns, providing further evidence of the market pricing of RECLASSGL.
Turning to prior service costs, we find that RECLASSPSC has predictive ability for year-ahead
pension expense, while OCIPSC and AOCIPSC do not. We find no evidence of predictive ability of
RECLASSPSC, OCIPSC, AOCIPSC in predicting year-ahead cash contributions. We also find no
evidence that the market prices prior service cost amounts. The lack of predictive ability and
relevance of prior service cost amounts are potentially attributable to the small size and rarity of
5

PSC adjustments in our sample. We discuss our progress in the exploration of the pricing of
AOCIGL.
We contribute to the literature by providing empirical evidence relevant to the debate
among accounting scholars and standard setters regarding reclassification. We are the first paper
to assess the usefulness of pension-related reclassification amounts, which have vastly different
qualities relative to AFS-related reclassification amounts studied in prior literature. In addition, for
firms that sponsor defined benefit pension plans the pension-related components of AOCI are
several time larger than the AOCI balances for AFS securities examined in prior literature (Dong
et al. 2014 and Badertscher 2014), highlighting the economic significance of these amounts.
We provide evidence that reclassification of remeasurement gains/losses, but not prior
service cost adjustments, satisfy Marshall and Leonard’s (2016) criterion of enhancing profit or
loss because they predict future pension expense and cash contributions, and are also value
relevant. However, because a given pension plan’s obligations extend decades into the future,
reclassifications of remeasurement gains/losses do not fulfill Marshall and Leonard’s criterion of
completing the depiction of an event that is recognized in the current period.
Our research provides insight concerning a recent exposure draft in which the FASB notes
that, “Differences between earnings and comprehensive income of business enterprises exist
because past standards have required or permitted several types of items to be excluded from net
income and later reclassified into net income. Currently, there is no conceptual basis for
determining which items qualify for that treatment” (FASB 2016: PR32).7 To the extent that
persistence, predictive ability and value relevance are indicators that amounts generated by
application of an accounting method are decision useful, our results provide some support for
7 The FASB’s ‘notion’ that AOCI gains (losses) should be reclassified is consistent with clean surplus theory (Ohlson 1995, 1999) and the all-inclusive concept of income (Edwards and Bell 1961).
6

continuing to reclassify remeasurement gains/losses. In contrast, it appears that the practice of
reclassifying PSC adjustments likely provides little information.
The rest of our paper is structured as follows. Section 2 describes pension-related
reclassification adjustments. Section 3 discusses prior literature. Section 4 develops hypotheses.
Section 5 explains the research design. Section 6 discusses the sample selection, descriptive
statistics, and results. Section 7 concludes.
2. Background on Reclassifications
Background on the FASB and Reclassifications
The FASB does not identify the qualitative characteristics that distinguish items included
in OCI from those included in earnings (FASB 1997). Instead, it provides a list of items currently
included in OCI: foreign currency translation adjustments, net gains/losses on cash flow hedges,
net unrealized gains/losses on available-for-sale-securities (AFS)8, and gains/losses and prior
service costs/credits9 associated with pension and other post-retirement benefit plans. These items
result from current period revaluations and deferred exchanges; preparers view them as beyond
management’s control and as inappropriately increasing volatility if included in net income (FASB
1997).
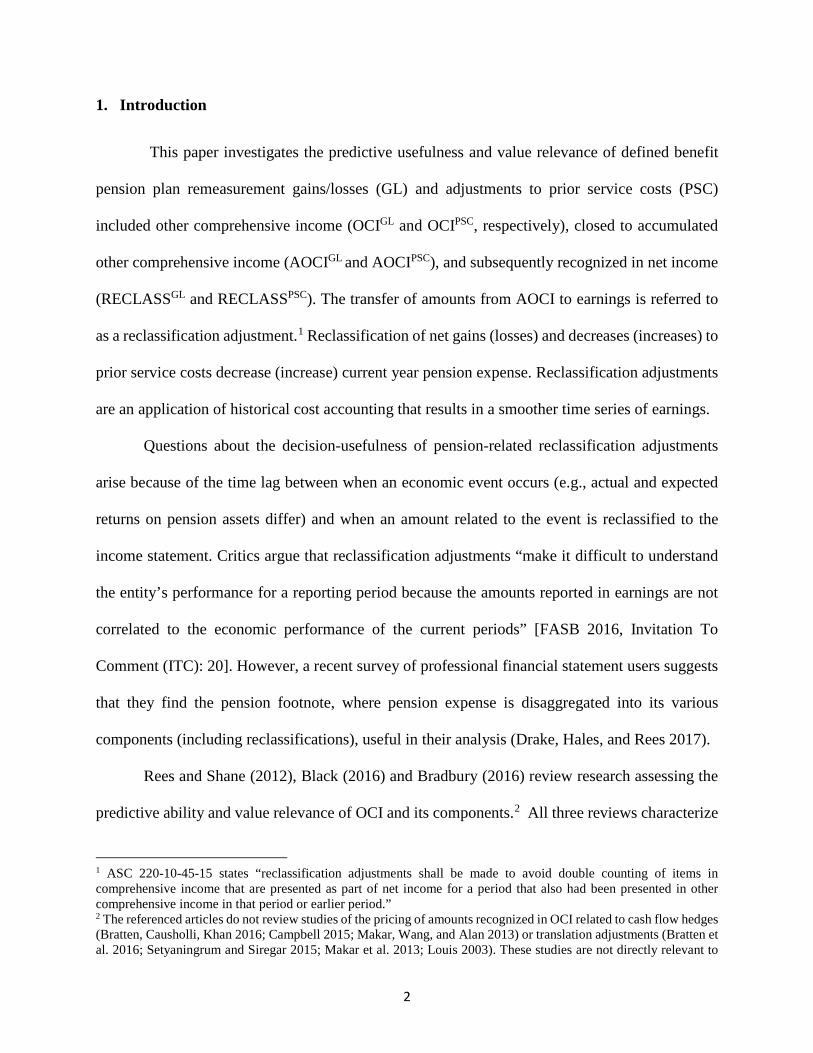
Figure 1 diagrams the relationship between the components of comprehensive income and
stockholders’ equity accounts. Pension-related re-measurement gains/losses and prior service cost
adjustments, two of the current period revaluations and deferred exchanges included in OCI by the
8 ASU No. 2016-01 (FASB 2016) supersedes guidance to classify equity securities with readily determinable fair values into trading and AFS categories. For fiscal years beginning after December 15, 2017, equity investments (except those accounted for using the equity method) are to be measured at fair value with changes in fair value recognized in net income. 9 Prior service credits are much less frequent than prior service costs. As such, for purposes of brevity, we refer to prior service costs/credits as prior service costs, except when used in quotations.
7

FASB, will be reclassified through net income in future periods. Thus, net income (NI) results
from the application of a mixed attributes model.
Insert Figure 1
In 1985, the FASB characterized its first major effort to improve pension measurement and
disclosure as continuing “the evolutionary search for more meaningful and useful pension
accounting” (FASB 1985: 6). The Board concluded that it “believes that it would be conceptually
appropriate and preferable to recognize a net pension liability or asset measured as the difference
between the projected benefit obligation and plan assets, either with no delay in recognition of
gains and losses, or perhaps with gains and losses reported currently in comprehensive income but
not in earnings.” (FASB 1985: 26).
The FASB (1985: 9) did not require immediate recognition of gains/losses as components
of pension expense because they “may reflect refinements in estimate as well as changes in
economic values and because some gains in one period may be offset by losses in another period
and vice versa.” The Board agreed to defer and reclassify gains/losses according to a materiality
threshold to allow “a reasonable opportunity for gains and losses to offset each other” without
affecting net income (FASB 1985: 38).10 The deferral of the income statement recognition of prior
service costs arising from plan amendments is rationalized based on the argument that costs should
be recognized in future periods when employees are more productive because of the amendment
(FASB 1985: 9).
The Calculation and Meaning of Reclassification Adjustments
Pension gains/losses arise because of differences between estimated and actual experience
and changes in plan assumptions. On the asset side, companies include the expected return on plan
10 Board member Arthur Wyatt characterized the corridor method as “a practical mechanism to mitigate volatility” (FASB 1985:20).
8

assets as a reduction in computing pension expense. Differences between expected and actual
returns and changes in the expected rate of return assumption are gains/losses recognized in OCI.
On the liability side, companies estimate the plan’s projected benefit obligation (PBO) as the
actuarial present value of benefits due to employees during retirement. The PBO is affected by
assumptions about inflation, future compensation levels, mortality, interest rates and employee
turnover. Changes in these assumptions lead to fluctuations in the calculated PBO, resulting in
gains/losses.
Although U.S. GAAP allows immediate recognition of gains/losses and prior service cost
increases/decreases, most companies continue to defer and reclassify them.11 The corridor method
of U.S. GAAP requires reclassification from AOCI if as of the beginning of the year the net
gain/loss exceeds 10 percent of the greater of the PBO or market-related value of plan assets. The
amount in excess of the 10 percent threshold is reclassified over the average remaining service
lives of employees who will receive benefits under the plan (ASC 715-30-35-24).
Prior service costs are recognized in OCI when a company retroactively amends a defined
benefit plan. The amendment increases the amount of prior service costs that will be amortized in
future periods. Proponents of current practice characterize the deferred cost of retroactive plan
amends as an unrecognized asset that will be realized through higher future employee productivity
(FASB 1985:34). Prior service costs accumulated in AOCI are amortized over the average
remaining service lives of employees affected by the amendment. These reclassifications are a
component of pension expense. In Figure 2, we diagram the impact of a mixed attributes model on
11Since the 2007-2009 financial crisis, forty-three companies have switched from deferred to immediate recognition (Burke, Chen and Eaton 2017), a small number compared to the population of U.S. single employer defined benefit plans (GOA 2009). Burke et al.’s comparison of matched switching and non-switching companies shows that the earnings of switching firms are less informative and there is an increased investment of plan assets in debt.
9
the calculation of pension expense, which aggregates three components: compensation (service
cost), net financing cost (return on plan assets and interest expense), and reclassifications of prior
period economic events from AOCI, and other items such as curtailments and settlements.
Insert Figure 2
Reclassifications under U.S. GAAP and IFRS
U.S. GAAP and IFRS guidance on reclassification diverges. We briefly discuss this
divergence to illustrate a difference in perspective in the importance and meaning of
reclassification adjustments. U.S. GAAP is based on the ‘notion’ that all items recognized in OCI
and closed to AOCI should be reclassified to income. In contrast, IFRS prohibits reclassification
of several items.
IAS 19R (2013) allows remeasurement gains/losses to be recognized in OCI when they
arise and subsequently closed to an owners’ equity account. Future gains/losses are netted with
the gains/losses already in owners’ equity. The balance in the account never is reclassified to
earnings. This treatment is consistent with research that argues transitory gains/losses are limited
in their usefulness for predicting future cash flows and firm value, and therefore should not
necessarily be included in earnings (Jones and Smith 2011; Linsmeier et al. 1997, Barker 2004;
Chambers, Linsmeier, Shakespeare, and Sougiannis 2007, Yen, Hirst, and Hopkins 2007; Bamber,
Jiang, Petroni, and Wang 2010).
U.S. GAAP and IFRS also differ in their treatment of prior service costs. IAS 19R requires
immediate recognition in the period the amendment occurs. It treats the cost of amendments as
period expenses for which the amount and timing of future benefit is uncertain. With immediate
recognition, there is no need for reclassification.
3. Review of relevant literature
10

Pricing of CI and unrealized gains/losses
The stated goal of most studies testing the predictive ability and value relevance of
comprehensive income (CI) and the components of OCI is to provide evidence useful to
accounting standard-setters (Rees and Shane 2012). Accordingly, the evolution of this body of
literature is closely aligned with proposed and actual changes in accounting standards. The first
studies are based on estimates of CI, (e.g., Dhaliwal, Subramanyan, and Trezevant 1999) and
conducted while the FASB was debating how CI and the components of OCI should be disclosed.
The second wave of research uses amounts of CI and its components reported after the issuance of
SFAS 130 (FASB 1997) when OCI could be reported either as a separate performance statement
or as an element of stockholders’ equity (e.g., Bamber et al. 2010). Rees and Shane (2012), Black
(2016) and Bradbury (2016) provide extensive reviews of this literature and call for further
research, including study of reclassifications adjustments.
Pricing of Reclassification Adjustments
To determine whether AFS reclassification adjustments are incrementally value relevant,
Dong et al. (2014) test a model in which AFS reclassifications and AFS gains/losses recognized
in OCI are valued separately. Their model decomposes: (1) book value into AFS-related cost, AFS-
related gains/losses included in AOCI, and non-AFS-related book values, (2) net income into AFS-
related amounts reclassified from AOCI and the remaining items of income, and (3) OCI into AFS-
related gains/losses and other OCI. They find significant differences in the coefficients of
reclassified gains/losses and AFS gains/losses recognized in OCI, with the coefficient on
reclassified gains/losses being close in size to the coefficients on other relatively permanent
components of net income. Dong et al. (2014) interpret their results as indicating that reclassified
gains/losses are incrementally value relevant. Based on further testing, they conclude that
11

reclassification gains/losses are valued because they help investors predict future bank
performance.
Dong et al. (2014) refer to the realization of a gain/loss triggered by sales of AFS securities
as an “economic realization” and distinguish it from “a realization for accounting purposes only”
(p. 258), the type of realization Badertscher et al. (2014) examine in their study of the returns-
relevance of amounts reclassified when AFS securities are determined to be OTTI.
Badertscher et al. (2014) argue that OTTI provides information about the recoverability of
unrealized losses. Under current U.S. GAAP, unrealized AFS securities losses are recognized in
OCI and closed to AOCI. The AOCI loss is reclassified when the underlying securities are sold or
management concludes there is significant doubt the securities can be held until their fair value
recovers to amortized cost (i.e., securities are OTTI). Opponents of reclassification assert that the
market reacts to unrealized losses and uses information about those losses to predict OTTI.
Accordingly, they expect investors to be able to predict OTTI and not to react significantly to the
reclassification of gains/losses previously recognized in OCI. Badertscher et al.’s (2014) results
do not support this conjecture. They find an incremental negative reaction to recognition of OTTI
charges and conclude that such charges explain abnormal stock returns incrementally to unrealized
gains/losses. They interpret their results as indicating OTTI charges provide investors with
information about the fundamental value of securities and/or insights into the probability of
regulatory intervention.
Pricing of the Components of Pension Expense
Barth, Beaver, and Landsman (1992) provides the earliest evidence of the value relevance
of the disaggregated components of pension expense. They find that during the period 1986 to
1988 the components of pension expense generally were valued differently from one another based
12

on the permanency of their impact on earnings. During that period, U.S. GAAP required disclosure
of four components: service cost, interest cost, actual return on plan assets, and ‘other’, an
aggregate of amounts of amortization related to past transactions. Because of increased U.S.
GAAP disclosure requirements, we are able to hand-collect the individual components of pension
expense.12
Pricing of Gains/Losses and Prior Service Cost Components of OCI
Jones and Smith (2011) compare OCI (the sum of unrealized gains and losses related to
available for sale securities, foreign currency translation, pensions, and cash flow hedges) and
special items (SIs) using a model that jointly estimates value relevance, predictive value and
persistence. Their objective is to determine whether the market treats SI and OCI differently
because SI is recognized on the income statement in the period incurred and OCI is stored in AOCI
until reclassified. Jones and Smith’s results show that both SI and OCI are value relevant and have
predictive value for year-ahead earnings and cash flows, with SIs having stronger predictive value.
4. Hypothesis Development
While the “primary source of information about an entity’s performance for the period” is
contained in the statement of profit and loss (IASB 2015), neither the IASB or FASB Conceptual
Frameworks provide cohesive guidance to differentiate components of earnings from components
of OCI (Rees and Shane 2012; Linsmeier 2016) or to determine why or when items should be
reclassified from AOCI into earnings.
In the absence of characteristics to distinguish items to be recognized in OCI rather than
earnings, Linsmeier (2016) proposes a statement of operating income followed by a statement of
12At the time of Barth et al.’s (1992) study the ‘other’ component consisted almost exclusively of amounts related to amortization of the net transition obligation/asset.
13
comprehensive income, which begins with operating income and is followed by a non-operating
section that includes the results of remeasurements and delayed exchanges. He argues that because
non-operating items generally never become operating items, the need for reclassification would
be eliminated.
On the other hand, Nishikawa et al. (2016) support an all-inclusive performance statement
where accumulated earnings and accumulated comprehensive income are equal over the lifetime
of the firm. Such an approach is consistent with Ohlson’s (1995) theory of clean surplus and
implies that reclassified amounts will be useful to stakeholders. Similarly, the IASB’s Exposure
Draft (IASB 2015) proposes that items originally recorded in OCI should subsequently be
reclassified to earnings unless there is a compelling reason not to do so.
Finally, Marshall and Lennard (2016) suggest something in between these two contrasting
viewpoints. They argue that, “items originally reported in other comprehensive income should
only be recycled to profit or loss when doing so enhances the relevance of profit or loss because it
represents an event of the period, or completes the depiction of an event that is recognized in the
period.” The Alternate View in the IASB’s Exposure Draft (IASB 2015) also supports this hybrid
approach by noting that reclassifying certain items would not meet the definition of income or
expenses, distort earnings, and be confusing to investors.
The goal of our research is to provide evidence whether a mixed attributes model which
reclassifies pension gains/losses and prior service costs enhances the relevance of profit or loss.
There are three reasons why we pursue this goal. First, regulators, practitioners, and accounting
scholars continue to debate what would constitute an appropriate performance statement, even at
a basic conceptual level (Rees and Shane 2012). In addition, the current and debated treatment of
14

reclassification adjustments impacts the most widely used performance metric derived from
financial reporting: EPS (Linsmeier 2016).
Second, while prior research has examined other reclassified items (Badertcher et al. 2014;
Dong et al. 2014), reclassified pension items have distinct characteristics. Marshall and Lennard
(2016) suggest that no item should be included in earnings if it would impede the achievement of
the performance statement’s objective. Whether the reclassification of gains/losses from a sale of
AFS (or an OTTI of AFS) achieves the objective of the performance statement is not indicative of
whether the reclassification of pension gains/losses achieves the same objective. Reclassified
gains/losses from the sale of AFS occur upon an economic realization from the sale of the securities
that is calculated by easily determinable market prices. OTTI reclassified amounts are triggered
by management’s assessment that significant doubt exists that the firm can hold the security until
fair value recovers to amortized cost. In contrast, pension-related reclassifications are formulaic
allocations of measurements of economic events that occurred in earlier periods.
Third, defined benefit (DB) pension plans continue to be an important component of
employee compensation and the related financial statement balances are substantial. Among the
S&P 500 Index, 299 companies maintain DB plans with aggregate pension assets of $1.4 trillion
(Wilshire 2015). A recent study by pension consulting firm Towers Watson concludes, “It’s
noteworthy that DB plans still serve certain industries and companies well, especially those with
particular talent and retention needs” (Towers Watson 2014). Descriptive statistics in Table 1
provide evidence that, on average, RECLASSGL is almost as large as pension expense itself. Thus
the income statements of firms sponsoring DB plans are impacted by the current accounting
standards and any potential future changes. The case against reclassifying pension-related amounts
15

is stronger if empirical results show these reclassified amounts do not have predictive value and
are not value relevant.
Our first research objective is to determine whether pension-related reclassifications have
predictive value. The FASB’s conceptual framework discusses the importance of financial
information that has predictive value. Proponents of the corridor approach to reclassification of
gains/losses assert that gains/losses are transitory, and would offset each other over time and
seldom would require reclassification (FASB 1985:10). Contrary to this expectation, evidence
presented later in this paper shows that reclassified gains/losses (RECLASSGL) are a large,
persistent component of pension expense. Because reclassified gains/losses appear to be a
permanent component of earnings, they may have predictive ability. We test the following
directional hypothesis in the alternative.
H1: RECLASSGL and RECLASSPSC predict future pension expense.
Next, we examine future cash contributions to the pension plan. In the United States,
companies are required to prepare two sets of pension accounting information: one set prepared
according to U.S. GAAP and filed with the U.S. Securities and Exchange Commission (SEC); and
the other prepared according to ERISA funding rules, and filed with the Department of Labor, the
Pension Benefit Guaranty Corporation and the Internal Revenue Service. Although the rules
governing pension plan accounting and funding are distinct and separate, there are similarities
between the two that could make persistent components of pension expense useful for predicting
cash contributions.
ERISA bases minimum pension contributions on the liabilities accrued during the year
and the “funding shortfall” (excess of plan liabilities over plan assets), which is amortized over
16
seven years. This is similar to the process of reclassifying gains and losses under U.S. GAAP.13
Thus, reclassification adjustments may be useful in predicting an employer’s cash contribution to
its pension plan. This is especially important given that ERISA information is not available to the
public until seven months after the plan year ends.
Analysts predict employers’ cash contributions as inputs to cash flow valuation models and
for assessing cash flow requirements and credit status (Ballester, Fried, and Livnat 1998). The
summary of SFAS 158 (FASB 2006) states “This Statement improves financial reporting
because… it will be easier for users of those financial statements to assess an employer’s financial
position and ability to satisfy postretirement benefit obligation.” Hence market participants may
view gain/loss reclassifications as an indicator that more (less) firm resources will be needed to
fund the pension plan. Reclassifications of prior service costs may be viewed as a permanent
component of earnings with predictive ability. We test the following directional hypothesis, stated
in the alternative.
H2: RECLASSGL and RECLASSPSC predict future cash contributions to pension plans.
At least three arguments exist as to why reclassified gains/losses may be priced. First, as
tables presented later show, reclassified gains/losses (RECLASSGL) are a persistent component of
earnings. Ohlson (1999) discusses persistence as contributing to value relevance.14
Second, investors pay significant attention to earnings (Linsmeier 2016). Earnings as a
performance measure is deeply ingrained in the economy (IASB 2013). Burke, Chen and Eaton
(2016: 43) provide evidence suggesting management’s desire to “avoid any dragging effect on
13 However, there also are differences. First, different assumptions are used. Second, under funding rules the entire “funding shortfall” is amortized, but under U.S. GAAP we only amortize gains/losses that exceed 10% threshold. Second, in pension funding the amortization period is 7 years, while for pension accounting it is the average remaining service life of employee. 14 We test for persistence and the predictive usefulness of reclassification adjustments before testing for value relevance.
17

future earnings” explains why firms with large, negative AOCIGL balances switched from deferred
to immediate recognition of pension gains/losses. Switching allowed firms to transfer the AOCIGL
balance to retained earnings, and thereby eliminate the need for future reclassification adjustments.
Burke et al.’s arguments and test results suggest that management believes the market prices
reclassification adjustments.15 Because the switch did not affect future cash flows or provide
previously undisclosed information, Burke et al.’s documentation of a positive market response to
standalone announcements of switching raises questions about whether the market processes
pension information efficiently. Picconi (2006) interprets his results as suggesting the market
inefficiently processes complex pension disclosures.
Third, because RECLASSGL quantifies differences between expectations and outcomes,
the magnitude of the cumulative gains/losses as well as the reclassified amount may provide
information about the forecasting ability and skill of management and its actuarial and investment
advisors.
As for reclassification of prior service costs (RECLASSPSC), the deferred cost of retroactive
plan amendments has been described as an asset that will be realized through higher future
employee productivity (FASB 1985: 34), in which case it could be helpful information to investors.
Alternatively, they could be valued because of investors’ fixation on amounts affecting earnings.
On the other hand, there are four reasons why RECLASSGL and RECLASSPSC may not be
priced. First, formulaic allocations of previously recognized amounts may have little to do with
economic fundamentals. For example, if the market prices gains/losses and increases/decreases in
15 Burke et al.’s results are based on comparisons of 38 switching firms and different control groups. AOCIGL equaled 12% of total assets for these firms. Twenty-seven of the firms switched to immediate recognition of gains/losses, eleven switched to immediate recognition of the gain/loss outside the 10% corridor with continued recognition in OCI of amounts within the corridor.
18

prior service costs when they originally are recognized in OCI, RECLASSGL and RECLASSPSC
may be viewed as stale measures with no incremental value.
Second, RECLASSGL and RECLASSPSC are not direct measures of performance from
events that occurred solely in the period they impact earnings. Therefore, their relation to the firm’s
current period performance is uncertain and perhaps ambiguous. It is not uncommon for a firm to
recognize a gain in OCI in the same period it is reclassifying a loss to earnings.
Third, pension gains/losses result from 1) differences between management’s estimates of
returns on plan assets and actual returns on plan assets and changes in actuarial assumptions, and
2) changes in the PBO due to experience different from expectations and changes in actuarial
assumptions, e.g. discount rates, retirement rates, mortality rates, employee turnover. As such,
market participants may disregard reclassified gains/losses because they could result from
opportunistically manipulated estimates (Anantharaman 2017).
Fourth, the IASB Financial Reporting Council (FRC 2014) asserts the objective of the
statement of profit and loss is, “to present income and expenses for the period in order to report
the returns of the period, and facilitate and assessment of accountability and future returns.”
RECLASSGL and RECLASSPSC may not meet this objective. For example, a current period
reclassified loss does not necessarily mean losses will be reclassified in future periods. A major
upturn (downturn) in the market that increases (decreases) plan assets and results in a large
gain/loss could reduce the cumulative loss/gain in AOCI below the threshold that triggers
reclassification.
Given the economic meaning of these reclassified items is unclear, it is an empirical
question whether they impact prices. We test the following hypothesis in the null.
H3: RECLASSGL and RECLASSPSC are not value relevant.
19

5. Research Design
To examine our hypotheses, we disaggregate pension-related amounts as described in
Appendix A. The FASB’s Accounting Standards Update No 2017-07 (FASB 2017) requires the
service cost component of net periodic pension cost be reported “in the same line item or items as
other compensation costs arising from services rendered by the pertinent employees during the
period.” The remaining components are to be reported below the subtotal of income from
operations (715-20-45-3A). Further, FASB (2017) permits reporting the interest cost and expected
return on plan assets separately or together as net financing cost (715-20-55-13), see Figure 2.
Thus, in our empirical tests we report service cost as COMP (compensation cost) and combine
interest cost and expected return on plan assets as FIN (net financing cost).
In order to test H1, we estimate equation (1), which examines the predictive ability of
pension-related book value and comprehensive amounts in predicting year-ahead pension expense.
In our estimation of equation (1) we only include pension-related book value and comprehensive
income amounts since our dependent variable is a pension specific measure. All variables, which
are defined in Appendix B, are winsorized at the 1% level. Year-fixed effects are included and
standard errors are clustered by firm.
PEXPt+1 = α + β1AOCIGLt + β2AOCIPSC
t + β3COMPt + β4FINt + β5RECLASSGLt +
β6RECLASSPSCt + β7Othert + β8OCIGL
t + β9OCIPSCt + εt (1)
H1 is supported if RECLASSGL and RECLASSPSC are predictive of future pension expense
(PEXP), β5 > 0 and β6 > 0). As with Model 1, we also evaluate AOCIGLt, AOCIPSC
t, OCIGLt, and
OCIPSCt as they could also have predictive power for PEXPt+1.
To examine H2, we estimate equation (2), which examines the predictive ability of
pension-related book value and comprehensive income amounts in predicting year-ahead cash
20

contributions to the pension fund. We also include lagged actual contributions as a control. All
variables, which are defined in Appendix B, are winsorized at the 1% level. Year-fixed effects are
included and standard errors are clustered by firm.
CCt+1 = α + β1CCt + β2AOCIGLt + β3AOCIPSC
t + β4COMPt + β5FINt + β6RECLASSGLt +
β7RECLASSPSCt + β8OTHERt + β9OCIGL
t + β10OCIPSCt + εt (2)
To be consistent with the interpretation of the sign of the coefficients, the dependent
variable (cash contributions to pension plans) is multiplied by negative one. Thus, H2 is supported
if RECLASSGL and RECLASSPSC are predictive of future cash contributions to plan assets (CC),
β6 > 0 and β7 > 0. As with Model 1, we also evaluate AOCIGLt, AOCIPSC
t, OCIGLt, and OCIPSC
t as
they could also have predictive power for CCt+1. For example, large losses/gains that continue to
accumulate in AOCI indicate more (less) firm resources will be needed to fund the pension plan.
In order to test H3, we estimate equation (3), which examines the incremental explanatory
power of book value and comprehensive income amounts in explaining market value of equity. In
our estimation of equation (3) we only include both pension-related and non-pension related book
value and comprehensive income amounts since our dependent variable based on overall firm
value. All variables, which are defined in Appendix B, are winsorized at the 1% level. Year-fixed
effects are included and standard errors are clustered by firm.
MVt = α + β1BVXOTHERt + β2AOCIGL
t + β3AOCIPSCt + β4NIXt + β5COMPt + β6FINt +
β7RECLASSGLt + β8RECLASSPSC
t + β9OTHERt + β10OCIGLt + β11OCIPSC
t +
β12OCIOTHERt + εt (3)
Rejection the null hypotheses of no value relevance, H3, would be demonstrated by a
positive and significant association between RECLASSGL and RECLASSPSC and MV (β7 > 0 and
β8 > 0). On the other hand, if reclassification of gains/losses and prior service costs through income
is redundant and provides no additional information, as implied by the IASB’s decisions, the
21

market would not value these items and β7 and β8 would be insignificantly different from zero.
While our objective is to evaluate reclassification amounts, other pension-related amounts
(AOCIGLt, AOCIPSC
t, OCIGLt, and OCIPSC
t) merit interpretation. For example, gains/losses (OCIGLt)
could be informative to investors as they are representative of current period economic outcomes.
Further, AOCIGLt represents the cumulative gains/losses that are the source of future
reclassifications to earnings and potentially predictive of future cash flows (cash contributions).
Next, we examine investors’ response to reclassification amounts in a short-window
returns model motivated by Kim, Wasley, and Wu (2015). We define overall unexpected earnings
(UE) as the difference between actual earnings per share and the median analyst EPS forecast as
reported in IBES scaled by end of fiscal period stock price. We define unexpected earnings
attributable to reclassified remeasurement gains/losses as UEGL. In order to calculate UEGL, we
utilize hand-collected management estimates of year-ahead RECLASSGL, which are provided in
the pension footnote. We define UEGL as RECLASSGL (actual per share) minus RECLASSGL
(forecasted per share) scaled by end of fiscal year stock price. UEnonGL is defined as UE - UEGL.
All variables, which are defined in Appendix B, are winsorized at the 1% level. Year-fixed effects
are included and standard errors are clustered by firm.
CAR-1,+1 = α + β1UEGL + β2UEnonGL + β3LNMVAL + β4MB + εt , (4)
CAR-1,+1 is the three-day cumulative abnormal return surrounding the earnings
announcement date. For our short-window returns model, H3 would be supported if reclassified
gains/losses provide useful information to market participants, β1 > 0.
6. Sample Selection, Descriptive Statistics, and Results
Sample Selection
22

We begin our sample selection process with all firms reporting on the COMPUSTAT
Pension Annual Database. We focus on the post SFAS 158 (ASC 715) time period (2008 to 2015)
because prior to SFAS 158 firms were not required to recognize gains/losses and prior service
costs in other comprehensive income. Further, by focusing on the post SFAS 158 time period, we
reduce the possibility that our results are impacted by a change in accounting standards. Next, we
sort the firms based on the ratio of the firm’s pension liability to total assets and select the top 200
firms. We drop two firms who utilized mark-to-market pension accounting in our sample. Thus,
our initial sample is 198 firms. Our sample selection procedure balances the cost of hand-
collecting data with the need for a relatively long time series for each company. After removing
firm-year observations with missing variables, we have a total sample population of 1,483 firm
years. For the prediction tests, our sample is reduced to 1,292 firm years as lagged data is not
available in the initial year following enactment of SFAS 158. See Table 1 Panel A for a sample
reconciliation.
Our primary data include financial statement data downloaded from the COMPUSTAT
annual database and pension data downloaded from the COMPUSTAT Pension Annual Database.
In order to test the usefulness of each reclassified amount, we hand collect RECLASSGL and
RECLASSPSC by reading disclosures pursuant to SFAS 158. We also collect the firm’s prediction
of next year’s RECLASSGL when it is available. Following the prior literature, all variables in our
regressions, except stock returns, are deflated by number of shares outstanding (Barth et al. 1992;
Hann, Heflin, and Subramanayam 2007; Dong et al. 2014). All variables used in our tests are
described in Appendix B.
Descriptive Statistics
23

Table 1 provides descriptive statistics pension expense, its disaggregated components, and
other variables used in empirical analysis. These statistics are unscaled in order to evaluate the
magnitude of these amounts. The mean values of each component of pension expense are in the
tens and hundreds of millions of dollars. Because we hand-collect the data, we are able to separate
the reclassified gains/losses (RECLASSGL) and prior service costs (RECLASSPSC) from the
remaining items included in the COMPUSTAT “other periodic pension costs” variable (PPOPCC).
To our knowledge, we are the first to conduct a large empirical study of these items. We note that
the average reclassified loss in our sample ($71.94 million) is nearly as large in magnitude as
average total pension expense ($84.77 million) and thus is a material component of pension
expense. Reclassified prior service costs represent a much smaller portion of pension expense
($1.44 million). We also note the average annual cash contributions to pension assets are
economically significant ($121.75 million).
Insert Table 1
Table 2 reports average reclassified gains/losses and prior service costs for each year in
our sample. It appears reclassified losses are growing larger in recent years with the largest average
loss of $113.86 million occurring in 2015. In contrast, reclassified prior service costs are
decreasing, indicating that in recent years firms have made fewer amendments to retroactively
increase pension benefits.
Insert Table 2
Ohlson’s (1999) discussion of value relevance identifies persistence (an item’s ability to
predict its own future value) as contributing to value relevance. Consistent with this notion, Rees
and Shane (2012) identify persistence as a characteristic that could be used to determine which
24

performance measures are included in net income.16 Further, Ohlson (1999) argues persistence
contributes to value relevance. Thus, before reporting regression results, we first discuss
descriptive statistics concerning the persistence of the disaggregated components of pension
expense.
In Table 3, we report autocorrelations up to six lags for each of the components of pension
expense. Not surprisingly, the service and interest cost components of pension expense exhibit a
highly persistent autocorrelation structure. Expected returns on plan assets are also very persistent.
This is in contrast to actual returns on plan assets, which are much less persistent. The persistence
patterns of expected, and actual returns on plan assets are consistent with the FASB’s willingness
to use expected returns instead of actual returns to smooth fluctuations in pension expense (reduce
volatility) (SFAS 87 para. 179).
Table 3 also shows that RELCASSGL, RELCASSPSC, and the remaining components of
pension expense (other) are each significantly persistent across all lags, although not of the same
magnitude as some of the other components of pension expense. This explains why the magnitude
of the autocorrelation of total pension expense is less than some of its components. Reclassified
gains/losses being less persistent than other components of pension expense is reasonable given
that firms’ gain/loss may net against each other in any given year before surpassing the corridor to
require reclassification. In sum, both reclassified components of pension expense are statistically,
positively persistent up to six lags. This is contrary to the expectations of standard setters and
commentators that over time gains and losses would rarely be reclassified (SFAS 87, paragraph
184).
Insert Table 3
16 Rees and Shane (2012) review other studies that identify persistence as a characteristic that could be used to determine which revenues, expenses, gains and losses should be included in net income.
25

Table 4 contains the correlation matrix of the variables used in empirical tests. We note
predictable correlations between stock price and book value and income statement variables. We
also note positive correlations between reclassification amounts and their respective OCI and
AOCI amounts.
Insert Table 4
Results
Predictive Value
Standard setters have stated that financial statements, among other things, provide
information that has predictive value. In Table 5 we examine H1 by estimating equation 1. Column
(1) contains only pension expense variables. Column (2) includes pension expense and pension-
related OCI amounts. Finally, column (3) contains all pension-related book value and
comprehensive income amounts. Across all three columns, we find RECLASSGL and
RECLASSPSC are useful in predicting future pension expense as evidenced by a positive and
significant association with year-ahead pension expense. Results are contrary to expectations of
standard setters and commentators that reclassification adjustments would seldom be necessary,
thus it is somewhat surprising they demonstrate predictive ability over a long time series.
Interestingly, the current period gains/losses (OCIGL) are also predictive of pension expense.
Further, the cumulative gain/loss remaining in AOCI, AOCIGL, also demonstrates a positive
association with pension expense. This appears reasonable given that future reclassified amounts,
which will impact net income, are determined from the cumulative gains/losses in AOCI from
prior periods.
Insert Table 5
26

In Table 6 we provide evidence for our empirical test of H2. Column (1) contains only
pension expense variables. Column (2) includes pension expense and pension-related OCI
amounts. Finally, column (3) contains all pension-related book value and comprehensive income
amounts. Table 6 indicates that lagged cash contributions are predictive of future cash
contributions. In columns 1 and 2 of Table 6, we find support for RECLASSGL being a useful
predictor of cash contributions. Column 2 also indicates that OCIGL also has predictive power for
year-ahead cash contributions. When we include pension-related AOCI amounts in column (3),
we find evidence of AOCIGL being a useful predictor of year-ahead pension expense. Interestingly,
the coefficient estimates for RECLASSGL and OCIGL become insignificant. This is potentially due
to collinearity between AOCIGL, RECLASSGL, and OCIGL.17
Results demonstrate the gains/losses that have accumulated over time are informative of
the firm’s future need to commit less (more) firm resources to fund the pension plan. This is
informative given Ballester et al.’s (1998) assertion that analysts need to predict a firm’s cash
contributions to pension funds as inputs to cash flow valuation models and to assess cash flow
requirements. It is also consistent with survey evidence from Drake, Hales, and Rees (2017) that
professionals find OCI very important in identifying red flags when assessing future cash flows.
We find no predictive power of AOCIPSC, RECLASSPSC, or OCIPSC in predicting year-
ahead cash contributions. In untabulated analyses we replace lagged cash contributions with
managements’ prediction of the year-ahead cash contributions. Interestingly, results remain
qualitatively similar suggesting that AOCIGL, RECLASSGL, and OCIGL have incremental
explanatory power for future cash flows, even after controlling for management expectations.18
17 An alternative research design when testing future cash contributions would be to control for the firm’s net funded pension position directly instead of the cumulative gains/losses in AOCI. Results are robust to this research design. 18 We examine whether our cash contribution prediction results hold after dropping years affected by the Moving Ahead for Progress in the 21st Century Act (MAP-21), a funding bill signed into law on July 6th, 2012 that provided
27

Insert Table 6
Pricing Implications
In Table 7 we examine H3. Table 7 Panel A presents the results of estimating equation (3).
Column (1) contains only income statement variables. Column (2) includes income statement and
OCI amounts. Finally, column (3) contains book value and comprehensive income amounts. All
three columns of Panel A indicate pricing implications for RECLASSGL but not RECLASSPSC.
More specifically, RECLASSGL demonstrates a positive and significant association with MV after
controlling for components of comprehensive income and book value amounts. In column (3), we
also find evidence that the current period pension gains/losses are informative to investors as
OCIGL is also positive and significant. Further, we find that the coefficient estimate for
RECLASSGL is significantly greater than the coefficient estimate for OCIGL.
We perform a dominance analysis to determine the relative importance of each of the
independent variables based on the contribution of each to the overall model fit statistic (Grömping
2007; Budescu 1993). Not surprisingly, NIX and BVXOTHER demonstrate the strongest relative
performance in explaining market value, followed by the net financing (FIN) and compensation
costs (COMP). Interestingly, RECLASSGL is the next highest ranked variable, exhibiting stronger
relative importance than OCIGL and AOCIGL, which fails to demonstrate a statistical association
with MV. Results are consistent with investors assigning greater weight to reclassified gains/losses
than to current period gains/losses. This finding is consistent with results reported in Dong et al.
(2014), who document that the market assigns greater weight to realized gains/losses on AFS
securities relative to unrealized gain/loss on AFS securities. In summary, results appear consistent
pension funding relief for firms sponsoring defined-benefit pension plans. After dropping the years affected by this bill, our cash contribution results remain qualitatively similar. Due to data limitations (small number of observations) in the post-MAP-21 period, we do not estimate our cash contribution model in the post-MAP-21 period.
28

with investors finding the current period gains/losses informative, however, they place greater
emphasis on the subsequent reclassification to earnings. Results are robust to multicollinearity
concerns as the variance inflation factor (VIF) is 2.22, well below the recommended threshold of
10.
Table 7 Panel B presents results from estimating equation (4). As described above, we
evaluate the market’s reaction to the difference between the firm’s expected reclassified amount
and that actual amount. Table 7 Panel B provides evidence of a positive and significant ERC for
the portion of unexpected earnings attributable to unexpected reclassified gain/loss, UEGL. Further,
the magnitude of the coefficient estimate is more positive for UEGL relative to unexpected earnings
not related to reclassification adjustments, UEnonGL. Thus, we find no evidence that reclassified
gains/losses are less informative than other components of earnings.
Insert Table 7
In summary of results for H3, we find that investors value reclassified gains/losses
(RECLASSGL) as evidenced by positive associations with stock price and short-window returns.
We also find some mixed evidence that current period gains/losses (OCIGL) are also associated
with stock price. However, we fail to note any association between cumulative gains/losses
(AOCIGL) and stock price.
7. Conclusion
Our paper investigates the predictive usefulness and value relevance of pension-related
remeasurement gains/losses and increases/decreases in prior service cost recognized in OCI,
closed to AOCI, and reclassified to earnings. Scholars who advocate clean surplus accounting
argue all items recognized in OCI and closed to AOCI should be reclassified to earnings.
Opponents argue against reclassification because of the time lag between when the economic event
29

occurs and when it affects net income. Unlike the AFS-related reclassifications triggered by the
occurrence of a market transaction or the arrival of new information (Dong et al. 2014 and
Badertscher et al. 2014, respectively), the pension-related adjustments we study are mechanical.
Gains/losses are reclassified only if a materiality threshold is passed, and prior service costs are
reclassified over the life of employees benefiting from the plan amendment.
We use hand-collected data to assess the persistence and usefulness of pension-related
reclassification adjustments for predicting future pension expense and cash contributions after
controlling for pension-related OCI and AOCI. We find that both are highly persistent. The
persistence of gain/loss adjustments contradicts the claims of advocates of deferral and
reclassification that over-time gains/ losses would offset each other so that the materiality threshold
for reclassification seldom would be triggered. The persistence of reclassification gains/losses
helps to explain why they are useful in predicting pension expense and, in turn, net income.
The link between pension-related reclassification adjustments, OCI, AOCI and cash
contributions is less direct. U.S. GAAP provides guidance for computing these amounts.
Minimum funding requirements are provided by the IRS. The two sets of guidance were developed
for different purposes, and therefore allow the use of different assumptions and computational
techniques, with IRS requirements changing whenever legislative agendas change. Minimum
cash contributions are based on liabilities accrued during the year and the “funding shortfall” (i.e.,
excess of plan liabilities over plan asset), which currently must be amortized over seven years. In
contrast, U.S. GAAP requires amortization only of the amount beyond the materiality threshold
and over a longer period (i.e. the average remaining service lives of plan participants). Results
indicate the cumulative gain/loss in AOCI is useful in predicting cash contributions.
30

As discussed earlier, arguments can be made for expecting (not expecting) pension-related
adjustments, OCI, and AOCI to be value relevant. We find that gain/loss reclassifications and OCI
both are priced, with the coefficient of the reclassification adjustment being significantly larger.
Finding that the market weights amounts recognized in earnings more heavily than amounts
recognized in OCI may be contrary to the expectations of proponents of eliminating
reclassification. Further evidence of the pricing implications of gain/loss reclassifications is
provided by short-window returns tests, which show that unexpected reclassification gains/losses
have incremental explanatory power.
Importantly, our research informs regulators and standard setters regarding the
appropriateness of items reclassified from AOCI to income. Our findings suggest that
reclassifications of prior service costs and remeasurement gains/losses are substantively different.
While prior service cost reclassifications are persistent and useful for predicting year-ahead
pension expense, they are not useful in predicting future contributions and are not priced by the
market. It may be that, as argued by critics of current practice, prior service cost is not useful
because it is a stale and garbled measure. Alternatively, it may be because during the last ten years
there have been few amendments increasing benefits for service already performed. Accordingly,
as Table 2 shows the magnitude of prior service cost reclassifications has decreased steadily, and
the amendments that have incurred in recent years have resulted in prior service cost credits rather
than prior service cost debits.
To the extent that persistence, predictive ability and value relevance indicate that amounts
generated by application of an accounting method are decision useful, our results provide some
support for continuing to defer and reclassify remeasurement gains/losses. The nagging question
that remains and has yet to be resolved empirically is whether an accounting method that results
31

in decision-useful information should be continued when the economic meaning of the resulting
measures is ambiguous. We continue to explore potential pricing implications of RECLASSGL,
AOCIGL, and OCIGL.
32

Appendix A
The paragraphs and equations that follow explain the disaggregation of comprehensive
income and the balance sheet to identify the amounts used in empirical analysis.
Net income (NI) during a period equals net income before reclassified amounts (NIBR)
plus the reclassified amounts, where RECLASSGL is positive (negative) for reclassified gains
(losses) and RECLASSPSC is positive (negative) for decreases (increases) in reclassified prior
service costs.
NIt = NIBRt + RECLASSGLt + RECLASSPSC
t (1A)
The change in retained earnings (RE) during a period equals NI minus dividends (DIV), which we
decompose as NIBR plus RECLASSGL plus RECLASSPSC minus DIV.
∆REt = NIt – DIVt = NIBRt + RECLASSGLt + RECLASSPSC
t - DIVt (2A)
Hence RE increases with reclassified gains and decreases with reclassified losses. Additionally,
RE increases with reclassified decreases to prior service cost and decreases with reclassified
increases to prior service cost.
The change in unrealized gain (loss) (∆AOCIGL) equals the total (i.e., unrealized plus
realized) gain or loss (TotalGL) minus RECLASSGL during the period.
∆AOCIGLt = TotalGL
t – RECLASSGLt (3A)
Hence, AOCIGL decreases with reclassified gains, and increases with reclassified losses.
The change in unrealized prior service cost (∆AOCIPSC) equals the total (i.e., unrealized
plus realized) change in prior service cost (TotalPSC) minus RECLASSPSC during the period.
∆AOCIPSCt = TotalPSC
t – RECLASSPSCt (4A)
Hence, AOCIPSC decreases with reclassified decreases to prior service cost, and increases with
reclassified increases to prior service cost.
33
The change in owners’ equity (OE) equals ∆RE plus the change in accumulated other
comprehensive income (∆AOCI) plus the change in contributed capital (∆CC) during the period.
∆RE is given in equation (2) and ∆AOCI equals ∆AOCIGL plus ∆AOCIPSC plus other
comprehensive income from sources other than gain (loss) and changes in prior service cost
(OCIOther) during the period, yielding:
∆OEt = ∆REt + ∆AOCIt + ∆CCt
= (NIBRt + RECLASSGLt + RECLASSPSC
t - DIVt) + (TotalGLt – RECLASSGL
t) +
(TotalPSCt – RECLASSPSC
t) + OCItOther + ∆CCt
= NIBRt + TotalGLt + TotalPSC
t – DIVt + OCItOther + ∆CCt (5A)
Hence, ∆OE is unaffected by RECLASSGL and RECLASSPSC.
Market Value Model
Our market value model is an expanded version of the frequently estimated regression of
market value of equity on book value of equity (BV) and comprehensive income, denoted (CI):
MVt = α + β1BVt + β2CIt + εt (6A)
We decompose both BV and CI into components, consistent with but somewhat more detailed than
in equations (1) through (5). In order to stay consistent with equations (1) through (5), all variables
in our research design are signed so that positive (negative) amounts correspond to increases
(decreases) in BV and CI. Therefore, we expect all relevant explanatory variables to be positively
associated with market value.
First, we decompose BV into the after-tax book value of gain (loss) (AOCIGL) plus the
after-tax book value of prior service cost (AOCIPSC) plus the after-tax book value of other net
assets (BVOther).
BVt = BVtOther + AOCIGL
t + AOCIPSCt (7A)
34

Next, we decompose comprehensive income (CI) into net income (NI) and other comprehensive
income (OCI).
CIt = NIt + OCIt (8A)
We further decompose NI into net income before pension expense (NIX) and pension expense
(PEXP).
NIt = NIXt + PEXPt (9A)
We then disaggregate pension expense into service cost (COMP), net financing costs (FIN)19,
reclassified gain (loss) (RECLASSGL), reclassified prior service costs (RECLASSPSC), and the
remaining pension expense components attributable to things such as settlements and curtailments
(OTHER). That is,
PEXPt = COMPt + FINt + RECLASSGLt + RECLASSPSC
t + Othert (10A)
We decompose OCI into OCIACT plus OCIPSC plus other comprehensive income from sources
other than gain (loss) and changes in prior service cost (OCIOther).
OCIt = OCIGLt + OCIPSC
t + OCItOther (11A)
Incorporating these variable decompositions into equation (6) yields the market value model:
MVt = α + β1BVtOther + β2AOCIACT
t + β3AOCIPSCt + β4NIXt + β5COMPt + β6FINt +
β7RECLASSGLt + β8RECLASSPSC
t + β9Othert + β10OCIGLt + β11OCIPSC
t + β12OCItOther
+ εt (12A)
19 FASB (2016) describes net financing costs as the sum of interest cost and expected return on plan assets.
35
Appendix B – Variable Descriptions
Variable Description MV Market value of equity
BVOther Book value purged of the effect of non-recycled actuarial gains/losses and prior service costs, scaled by common shares outstanding
AOCIGL The portion of AOCI attributable to non-recycled actuarial gains/losses, scaled by common shares outstanding AOCIPSC The portion of AOCI attributable to non-recycled prior service cost, scaled by common shares outstanding NIX Net Income purged of the effect of pension expense, scaled by common shares outstanding COMP Service cost component of pension expense, scaled by common shares outstanding INT Interest cost component of pension expense, scaled by common shares outstanding ERPLNA Expected return on plan assets component of pension expense, scaled by common shares outstanding ARPLNA Actual return on plan asset component of pension expense, scaled by common shares outstanding FIN Expected return on plan assets less interest cost components of pension expense, scaled by common shares outstanding RECLASSGL Recycled actuarial gain/loss component of pension expense, scaled by common shares outstanding RECLASSPSC Recycled prior service cost component of pension expense, scaled by common shares outstanding OTHER Remaining components of pension expense, scaled by common shares outstanding
OCIGL The portion of other comprehensive income attributable to unrealized gains/losses that arose during the period, scaled by common shares outstanding
OCIPSC The portion of other comprehensive income attributable to unrealized prior service cost that arose during the period, scaled by common shares outstanding
OCIOTHER The remaining portion of other comprehensive income, scaled by common shares outstanding CAR-1,+1 Cumulative market-adjusted abnormal return over the three days centered on the firm’s annual earnings announcement.
UEnonGL A firm's unexpected earnings measured as (actual EPS - unexpected amortized actuarial gains/losses per share - median analyst EPS forecast as reported in IBES)/End of Fiscal Period Stock Price
UEGL A firm's unexpected amortized actuarial gains/losses per share. Calculated as (actual recycled actuarial gain/loss per share - forecasted amortized gains/losses per share)/End of fiscal period stock price
LNMVAL The natural logarithm of a firm's market value of equity MB The ratio of a firm's market value of equity to its book value of equity CC Employer cash contribution to pension plan assets EXPECT CC Firm’s prediction of the following year’s cash contribution made at the end of the current year PEXP Pension expense PPX Pension expense purged of the effect of RECLASSGL and RECLASSPSC
36
Figure 1 Financial Statement Effects of Applying the Mixed Attributes Model of U.S. GAAP
Transactions, events,
remeasurements, reclassifications
Net Incomet Retained Earningst
Revaluations and deferred exchange
transactions
Other Comprehensive
Incomet
Accumulated Other
Comprehensive Incomet
37

Figure 2 Results of Applying a Mixed Attributes Model for Computing Net Periodic Pension Cost
Note: The FASB’s Accounting Standards Update No 2017-07 (FASB 2017) requires the service cost component of net periodic pension cost to be reported “in the same line item or items as other compensation costs arising from services rendered by the pertinent employees during the period.” The remaining components are to be reported below the subtotal of income from operations (715-20-45-3A). Further, FASB (2017) permits reporting the interest cost and expected return on plan assets separately or together as net financing cost (715-20-55-13).
Service Cost
Other (settlements
and curtailments)
Amortization of prior service
cost
Amortization of gains/losses
Net Financing Cost
Interest Cost
Expected Return on Plan
Compensation Cost
Other (settlements
and curtailments)
Historical cost allocations
(reclassifications from AOCI)
38

References
Anantharaman, D. 2017. The role of specialists in financial reporting: Evidence from pension accounting. Review of Accounting Studies (forthcoming).
Badertscher, B. A., J. L. Burks, and P. Easton. 2014. The market pricing of other-than-temporary
impairments. The Accounting Review 89(3): 811-838. Ballester, M., D. Fried, and J. Livnat. 1998. Pension plan cash flows: Estimation and motives.
Journal of Financial Statement Analysis 3 (3): 41-50. Bamber, L. S., J. Jiang, K. R. Petroni, and I. Y. Wang. 2010. Comprehensive income: Who’s
afraid of performance reporting? The Accounting Review 85 (1): 97–126. Barker, R. 2004. Reporting financial performance. Accounting Horizons 18 (2): 157–172. Barth, M., W. Beaver, and W. Landsman. 1992. The market valuation implications of net
periodic pension cost components. Journal of Accounting and Economics 15: 27-62. Black, D. 2016. Other comprehensive income: A review and directions for future research.
Accounting and Finance 56: 9-45. Bradbury, M. 2016. Discussion of ‘Other comprehensive income: A review and directions for
future research’. Accounting and Finance 56: 47-58. Bratten B., M. Causholli, and U. Khan. 2016. Usefulness of fair values for predicting banks’
future earnings: evidence from other comprehensive income and its components. Review of Accounting Studies 21 (1): 280-315.
Budescu, D. V. 1993. Dominance analysis: A new approach to the problem of relative
importance of predictors in multiple regression. Psychological Bulletin 114: 542-551. Burke, Q., P. Chen, and T. Eaton. 2017. An empirical examination of mark-to-market accounting
for corporate pension plans. Journal of Accounting and Public Policy 36 (1): 34-58. Campbell, J. 2015. The fair value of cash flow hedges, future profitability, and stock returns.
Contemporary Accounting Research 32 (1): 243-279. Chambers, D., T. J. Linsmeier, C. Shakespeare, and T. Sougiannis. 2007. An evaluation of SFAS
No. 130 comprehensive income disclosures. Review of Accounting Studies 12: 557–593. Dambra, M. 2017. Stakeholder conflicts and cash flow shocks: Evidence from changes in ERISA
pension funding rules. Working paper. University of Buffalo. Dhaliwal, D., K.R. Subramanyam, and R. Trezevant. 1999. Is comprehensive income superior to
net income as a measure of firm performance. Journal of Accounting and Economics
39

(26): 43-67. Dong, M., S. Ryan, and X-J Zhang. 2014. Preserving amortized costs within a fair-value-
accounting framework: reclassification of gains and losses on available-for-sale securities upon realization. Review of Accounting Studies 19: 242-280.
Edwards, E., and P. Bell. 1961. The Theory and Measurement of Business Income. University of
California Press Financial Accounting Standards Board (FASB). 2016. Financial Instruments – Overall (Subtopic
825-10). ASU 2016-01. Norwalk, CT: FASB. Financial Accounting Standards Board (FASB). 2016. Concepts Statement 8 – Conceptual
Framework for Financial Reporting: Chapter 7: Presentation. Norwalk, CT: FASB. Financial Accounting Standards Board (FASB). 2006. Statement of Financial Accounting
Standards No. 158: Employers’ Accounting for Defined Pension and Other Postretirement Plans. Norwalk, CT: FASB.
Financial Accounting Standards Board (FASB). 1997. Statement of Financial Accounting
Standards No. 130: Reporting Comprehensive Income. Norwalk, CT: FASB. Financial Accounting Standards Board (FASB). 1985. Statement of Financial Accounting
Standards No. 87: Employers’ Accounting for Pensions. Norwalk, CT: FASB. Gigler, F., C. Kanodia, and R. Venugopalan. 2007. Assessing the information content of mark-
to-market accounting with mixed attributes: The case of cash flow hedges. Journal of Accounting Research 45 (2): 257-276.
Government Accountability Office (GAO). 2009. Defined Benefit Pensions – Survey Results of
the Largest Private Defined Benefit Plan Sponsors. Washington D.C.: GAO. Grömping, U. 2007. Estimators of relative importance in linear regression based on variance
decomposition. The American Statistician 61 (2): 139-147. Hann, R., F. Heflin, and K. R. Subramanayam. 2007. Fair-value accounting. Journal of
Accounting & Economics (44): 328-358. Hodgson, A., and M. Russell. 2014. Comprehending comprehensive income. Australian
Accounting Review 24(2): 100-110. International Accounting Standards Board (IASB). 2015. Conceptual Framework for Financial
Reporting Exposure Draft. London, UK: IASB. International Accounting Standards Board (IASB). 2013. IAS 19 (revised) Employee Benefits.
London, UK: IASB.
40
Jones, D. A., and K. J. Smith. 2011. Comparing the value relevance, predictive value, and
persistence of other comprehensive income and special items. The Accounting Review 86 (6): 2047–2074.
Kim, J., C.E. Wasley, and J.S. Wu. 2015. Economic determinants of the decision to voluntarily
adopt mark-to-market accounting for pension gains and losses. University of Rochester, Simon Business School Working Paper No. FR 15-14. Available at: www.ssrn.com/abstract=2576826 (last accessed on 22 Feb 2016).
Linsmeier, T.J. 2016. Revised model for presentation in statements(s) of financial performance:
Potential implications for measurement in the conceptual framework. Accounting Horizons 30 (4): 485-498.
Linsmeier, T. J., J. Gribble, R. G. Jennings, M. H. Lang, S. H. Penman, K. R. Petroni, D. Shores,
J. H. Smith, and T. D. Warfield. 1997. An issues paper on comprehensive income. Accounting Horizons 11 (2): 120–126.
Louis, H. 2003. The value relevance of the foreign translation adjustment. The Accounting
Review 78 (4): 1027-1047. Makar, S., L. Wang, and P. Alam. 2013. The mixed attribute model in SFAS 133 cash flow
hedge accounting: implications for market pricing. Review of Accounting Studies 18: 66-94.
Marshall, R., and A. Lennard. 2016. The reporting of income and expense and the choice of
measurement bases. Accounting Horizons 30 (4): 499-510. Nishikawa, I., T. Kamiya, and Y. Kawanishi. 2016. The definitions of net income and
comprehensive income and their implications for measurement. Accounting Horizons 30 (4): 511-516.
Ohlson, J. A. 1995. Earnings, book values, and dividends in security valuation. Contemporary
Accounting Research 11: 161–182. Ohlson, J. A. 1999. On transitory earnings. Review of Accounting Studies 4 (3-4): 145-162. Picconi, M. 2006. The perils of pensions: Does pension accounting lead investors and analysts
astray? The Accounting Review 81(4): 925-955. Rees, L., and P. Shane. 2012. Academic research and standard-setting: The case of other
comprehensive income. Accounting Horizons 26: 789-815. Setyaningrum, D., and S. Siregar. 2015. The value relevance of foreign translation adjustment:
Case of Indonesia. Academy of Accounting and Financial Studies Journal 19 (2): 251-264.
41

Towers Watson. 2014. Retirement Plan Landscape Stabilizing as Fewer Fortune 500 Companies
Shifting Defined Benefit Plans to 401(k)s. Available at: https://www.towerswatson.com/en-US/Press/2014/09/retirement-plan-landscape-stabilizing-as-fewer-fortune500-companies-shift-defined-benefit-to-401ks (last accessed March 8, 2016).
Wilshire. 2015. Wilshire Consulting Report on Corporate Pension Funding Levels. Available at:
https://www.wilshire.com/media/41719/Wilshire_2015_Corp_Funding_Rpt.pdf (last accessed March 8, 2016).
Yen, A. C., D. E. Hirst, and P. E. Hopkins. 2007. A content analysis of the comprehensive
income exposure draft comment letters. Research in Accounting Regulation 19: 53–79.
42

TABLE 1 - Sample Description Panel A: Sample Selection Observations Beginning Sample 1782 Missing RECLASSGL or RECLASSPSC (53) Missing AOCIGL or AOCIPSC (187) Missing OCIGL or OCIPSC (59) Value Relevance Sample 1483
Missing lagged RECLASSGL or RECLASSPSC (3) Missing lagged OCIGL or OCIPSC (178) Missing cash contribution data (10) Prediction Sample 1292
43

Table 1 - Sample Description Panel B: Descriptive Statistics Variable N Mean Median p25 p75 MV 1,483 8,837.83 2,361.09 648.86 7,239.78 BVX 1,483 3,526.67 1,079.90 312.34 3,190.52 AOCIGL 1,483 (850.02) (166.75) (674.64) (40.53) AOCIPSC 1,483 (3.09) (0.20) (3.90) 0.04 NI 1,483 512.32 117.15 10.33 417.30 PEXP 1,483 (84.77) (15.18) (65.90) (2.99) SVC 1,483 (60.86) (10.60) (40.26) (2.48) INT 1,483 (191.39) (40.62) (165.00) (12.38) ERPLNA 1,483 245.53 52.48 14.80 199.40 ARPLNA 1,477 178.38 32.50 1.00 168.02 PPOPCC 1,483 (81.32) (13.62) (59.00) (3.33) RECLASSGL 1,483 (71.94) (11.02) (46.90) (2.63) RECLASSPSC 1,483 (1.44) (0.06) (1.20) 0.00 OTHER 1,483 (7.43) (0.00) (2.20) 0.00 OCI 1,483 (110.01) (6.21) (105.03) 27.00 OCIGL 1,483 (109.90) (10.73) (82.49) 5.55 OCIPSC 1,483 (0.35) 0.00 (0.42) 0.07 OCIOTHER 1,483 (0.00) 0.04 (0.40) 0.44 CASH CONTRIBUTIONS 1,473 121.75 24.90 5.21 107.09 Table 1 provides the sample composition and descriptive statistics. All variables are signed so that positive (negative) amounts correspond to increases (decreases) in book value and comprehensive income. All variables are unscaled (provided in millions). See Appendix B for variable descriptions.
44

TABLE 2 - Annual Statistics for RECLASSGL and RECLASSPSC
Panel A: RECLASSGL Year N Mean Median p25 p75 Std Dev 2007 138 (47.56) (6.38) (31.20) (1.11) 129.92 2008 168 (25.36) (3.05) (16.60) (0.47) 83.39 2009 169 (42.00) (8.10) (25.96) (1.60) 112.40 2010 171 (59.88) (9.20) (47.00) (3.00) 142.24 2011 173 (73.84) (12.30) (55.00) (3.92) 176.90 2012 175 (95.87) (17.00) (70.16) (5.36) 209.00 2013 173 (109.57) (19.90) (75.00) (6.30) 233.94 2014 171 (79.03) (12.00) (48.00) (2.89) 188.81 2015 145 (113.86) (19.41) (68.00) (6.29) 242.29 Total 1,483 (71.88) (11.93) (48.55) (3.44) 168.77
Panel B: RECLASSPSC Year N Mean Median p25 p75 Std Dev 2007 138 (3.06) (0.55) (3.00) 0.00 15.92 2008 168 (2.58) (0.40) (2.00) 0.00 14.53 2009 169 (2.55) (0.30) (1.64) 0.00 13.82 2010 171 (2.19) (0.10) (1.11) 0.00 12.79 2011 173 (2.03) (0.08) (1.04) 0.00 12.66 2012 175 (1.36) (0.02) (1.00) 0.00 13.15 2013 173 (0.38) (0.00) (1.00) 0.00 14.74 2014 171 0.13 0.00 (0.70) 0.01 13.20 2015 145 1.10 0.00 (0.40) 0.10 14.18 Total 1,483 (1.44) (0.16) (1.32) 0.01 13.89
Notes: Panel A and Panel B provide descriptive statistics for RECLASSGL and RECLASSPSC, respectively, for each year in our sample. RECLASSGL is positive (negative) for reclassified gains (losses). RECLASSPSC is positive (negative) for reclassified decreases (increases) to prior service cost. All variables are in millions.
45

TABLE 3 - Persistence of Net Income, Pension Expense, and Disaggregated Pension Components
Lag Net
Income Pension Expense
Service Cost
Interest Cost
Expected Return on
Plan Assets
Actual Return on
Plan Assets RECLASSGL RECLASSPSC OCIGL OCIPSC 1 0.8224* 0.8637* 0.9898* 0.9958* 0.9971* 0.3180* 0.9554* 0.8898* -0.1479* 0.0402 2 0.7679* 0.8138* 0.9763* 0.9926* 0.9939* 0.2177* 0.9169* 0.7899* 0.1381* -0.0188 3 0.7481* 0.7837* 0.9597* 0.9907* 0.9916* 0.6005* 0.8960* 0.7219* 0.5550* 0.2683* 4 0.7449* 0.7180* 0.9451* 0.9879* 0.9883* 0.3958* 0.8717* 0.6269* 0.3088* 0.0093 5 0.6953* 0.6852* 0.9319* 0.9853* 0.9858* 0.1557* 0.8602* 0.5552* -0.5151* -0.1294* 6 0.6244* 0.7197* 0.9154* 0.9834* 0.9823* 0.0365 0.8703* 0.4705* 0.8216* 0.0616
Notes: The table reports the autocorrelation structure of Net Income, Pension Expense and the disaggregated components of pension expense. All variables are unscaled (as defined in Table 1). * represents statistical significance at the 1% level.
46

Table 4 - Correlation Table (1) (2) (3) (4) (6) (7) (8) (9) (10) (11) (12) (13) (14) (15) (16)
(1) MV 1.00 (2) BVX 0.64 1.00 (3) AOCIGL (0.34) (0.43) 1.00 (4) AOCIPSC 0.07 0.04 0.00 1.00 (6) NIX 0.72 0.58 (0.34) 0.06 1.00 (7) PEXP (0.31) (0.39) 0.62 0.17 (0.31) 1.00 (8) SVC (0.58) (0.56) 0.53 0.20 (0.47) 0.67 1.00 (9) ERPLNA_INT 0.55 0.55 (0.74) (0.12) 0.43 (0.58) (0.80) 1.00 (10) FIN 0.58 0.49 (0.50) (0.02) 0.44 (0.33) (0.70) 0.87 1.00 (11) RECLASSGL (0.35) (0.46) 0.80 (0.03) (0.37) 0.73 0.56 (0.68) (0.55) 1.00 (12) RECLASSPSC (0.05) (0.07) 0.07 0.83 (0.05) 0.28 0.34 (0.24) (0.13) 0.06 1.00 (13) OTHER (0.12) (0.06) 0.07 0.10 (0.04) 0.42 0.14 (0.24) (0.24) 0.07 0.11 1.00 (14) OCIGL (0.07) (0.16) 0.43 (0.01) (0.07) 0.06 0.22 (0.29) (0.19) 0.12 0.02 (0.05) 1.00 (15) OCIPSC 0.09 0.06 (0.01) 0.37 0.08 (0.11) (0.06) 0.07 0.09 (0.08) 0.17 (0.20) 0.04 1.00 (16) OCIOTHER 0.04 0.12 (0.13) (0.09) 0.05 (0.25) (0.19) 0.15 0.09 (0.26) (0.14) 0.03 0.15 0.03 1.00 (17) CC (0.27) (0.40) 0.59 0.07 (0.30) 0.63 0.47 (0.52) (0.21) 0.55 0.15 0.12 0.17 (0.04) (0.18) Table 4 provides univariate correlations for all variables used in our analyses. Variables are defined as in Appendix B. Bolded correlations are significant at the 5% level.
47

TABLE 5 - Predict Pension Expense (1) (2) (3)
PEXPt+1 Coef P-Value Coef P-Value Coef P-Value AOCIGL 0.025 0.000 *** AOCIPSC 0.089 0.399 COMP 0.983 0.000 *** 0.910 0.000 *** 0.877 0.000 *** FIN 0.437 0.000 *** 0.484 0.000 *** 0.506 0.000 *** RECLASSGL 0.799 0.000 *** 0.809 0.000 *** 0.559 0.000 *** RECLASSPSC 1.722 0.000 *** 1.605 0.000 *** 1.168 0.024 ** OTHER 0.409 0.001 *** 0.509 0.000 *** 0.432 0.002 *** OCIGL 0.054 0.000 *** 0.032 0.005 *** OCIPSC 0.253 0.148 0.101 0.519 Constant 0.079 0.011 0.029 0.329 0.029 0.310 Firm-clustered standard errors Yes Yes Yes Year fixed effects Yes Yes Yes Observations 1,292 1,292 1,292 Adjusted R-squared 0.654 0.683 0.697 Notes: The table examines the ability of pension-related amounts to predict year-ahead pension expense. All variables are defined in Appendix B. *, **, and *** represent statistical significance at the 10%, 5%, and 1% levels, respectively.
48

TABLE 6 - Predict Cash Contributions 1 2 3
Cash Contributionst+1 Coef P-
Value Coef P-
Value Coef P-
Value Cash Contributionst 0.448 0.000 *** 0.424 0.000 *** 0.373 0.000 *** AOCIGL 0.063 0.002 *** AOCIPSC 0.114 0.683 COMP 0.757 0.002 *** 0.655 0.007 *** 0.628 0.014 ** FIN 0.390 0.000 *** 0.490 0.000 *** 0.589 0.000 *** RECLASSGL 0.688 0.000 *** 0.743 0.000 *** 0.199 0.479 RECLASSPSC 1.291 0.337 1.126 0.371 0.523 0.791 OTHER -0.631 0.143 -0.435 0.174 -0.555 0.124 OCIGL 0.096 0.000 *** 0.044 0.139 OCIPSC 0.394 0.526 0.076 0.891 Constant -0.153 0.009 *** Firm-clustered standard errors Yes Yes Yes Year fixed effects Yes Yes Yes Observations 1,292 1,292 1,292 Adjusted R-squared 0.464 0.486 0.506 Notes: The table examines the ability of pension-related amounts to predict year-ahead cash contributions to the firm's pension fund after controlling for current year contributions. All variables are as defined in Appendix B. *, **, and *** represent statistical significance at the 10%, 5%, and 1% levels, respectively.
49

TABLE 7 - Pricing Implications Panel A: Value Relevance (1) (2) (3)
MV Coef P-
Value Coef P-
Value Coef P-
Value Dominance BVXOTHER 0.629 0.000 *** 2 AOCIGL -0.526 0.468 6 AOCIPSC 19.419 0.320 7 NIX 5.528 0.000 *** 5.585 0.000 *** 4.609 0.000 *** 1 COMP -44.121 0.002 *** -44.165 0.001 *** -34.682 0.005 *** 4 FIN 20.135 0.023 ** 20.819 0.013 ** 19.176 0.017 ** 3 RECLASSGL 19.481 0.021 ** 20.491 0.022 ** 29.203 0.000 *** 5 RECLASSPSC 12.054 0.166 13.396 0.143 2.513 0.683 10 OTHER -4.756 0.590 -5.767 0.469 -6.437 0.363 8 OCIGL 0.702 0.128 1.524 0.054 * 9 OCIPSC -4.267 0.831 -14.433 0.366 11 OCIOTHER 1.068 0.235 0.722 0.329 12 Constant 15.069 0.000 13.566 0.000 *** 7.945 0.025 ** Firm-clustered standard errors Yes Yes Yes Year fixed effects Yes Yes Yes Observations 1,483 1,483 1,483 Adjusted R-squared 0.651 0.653 0.682
Panel B: Short-Window Returns CAR Coef P-Value UE_GL 4.263 0.001 *** UE_nonGL 0.761 0.002 *** LNMVAL -0.002 0.237 MB 0.000 0.218 Constant -0.019 0.202 Observations 869 Adjusted R-squared 0.066 Notes: Panel A and B examines the pricing implications of pension-related amounts. All variables are as previously defined. *, **, and *** represent statistical significance at the 10%, 5%, and 1% levels, respectively.
50