research.utwente.nl · book cover design: mansi jain and nainika verma printed by: ipskamp...
TRANSCRIPT


ENERGY TRANSITION IN THE INDIAN BUILDING SECTOR
- ASSESSING NET ZERO ENERGY BUILDINGS’ NICHE DEVELOPMENT
DISSERTATION
to obtain
the degree of doctor at the University of Twente,
on the authority of the rector magnificus,
Prof. dr. T.T.M. Palstra
on account of the decision of the graduation committee,
to be publicly defended
on Thursday 21st June 2018 at 14:45 hours
by
Mansi Jain
born on the 23rd June 1985,
in Ajmer, India

This dissertation has been approved by
Supervisor: Prof. dr. J.T. A. Bressers
Co-Supervisor: Dr. T. Hoppe

Graduation Committee:
Chairman/Secretary:
Prof. dr. T.A.J. Toonen University of Twente/BMS
Supervisor:
Prof. dr. J.T.A. Bressers University of Twente/BMS-CSTM
Co-Supervisor:
Dr. T. Hoppe TU Delft /TPM
Committee Member (Internal):
Prof. dr. S Kuhlmann University of Twente/BMS - STEPS
Committee Member(Internal):
Prof. dr. ir. J.I.M Halman University of Twente/ET-B/I
Committee Member (External):
Prof. dr. ir. V.H. Gruis TU Delft
Committee Member (External): Prof. dr. H. Rohracher Linkoping University
The work described in this thesis was performed at the Department of Governance and
Technology for Sustainability, Faculty of Behavioural, Management and Social sciences,
University of Twente, PO Box 217, 7500 AE, Enschede, the Netherlands

Colophon
© 2018 Mansi Jain, University of Twente, Faculty BMS/ CSTM
No part of this publication may be reproduced, stored in a retrieval system, or transmitted, in any form or by any means, electronic, mechanical, photocopying, recording or otherwise, without prior written permission of the author.
Book Cover design: Mansi Jain and Nainika Verma Printed by: Ipskamp Printing- Enschede ISBN: 978-90-365-4560-0 DOI: 10.3990/1.9789036545600
UNIVERSITY OF TWENTE Faculty of Behavioural, Management and Social sciences (BMS) Department of Governance and Technology for Sustainability (CSTM) Enschede, the Netherlands Email (for correspondence): [email protected]; [email protected]

ACKNOWLEDGEMENT
This PhD journey has been a shared achievement that could have not been possible
without the support of many people. I would like to take this opportunity to thank everyone
who were directly or indirectly part of this journey. To begin with special acknowledgements,
go to my wonderful supervisors Hans Bressers and Thomas Hoppe. This study would have not
been possible without the sincere and honest supervision from both. Thank you very much for
believing in my potential to do research and every time guiding me through this despite our
long distances and different time zones. I never felt that I was miles away from my supervisors.
Thank you, Thomas for always keeping a critical eye for perfection in all the conference papers,
publications and chapters we wrote together during this thesis and not to mention a very
prompt response to each text I wrote. Always guiding me to the right direction. Hans, words
are far less to thank you for firstly giving me the opportunity to pursue PhD with CSTM. Your
guidance throughout this process made my PhD journey a happy one, filled with purpose and
enthusiasm. I am deeply thankful to you both for the patience and encouragement throughout
the study.
I would like to extend my thanks to the CSTM colleagues, some of you have become
very close friends. Despite our brief interactions only during my visits to Netherlands, all of
you showed great warmth and support through the years of this study. I feel very lucky to
have met you all and hope to carry forward the friendship and bonding for further years. Most
importantly, Houda El Mustapha, as we both started our journey together and came to CSTM
in August 2014 exploring with our own doubts and fears and finally we both managed to pull
through it successfully. I will never forget our intense gym sessions after the busy workday and
going to supermarkets and exploring the city. Year one of my PhD became a memorable one
with your company. You will always be cherished. Not to mention Heksi Lestari Soewignyo
and Helmi Gunawan who warmly came to pick me up from the Enschede station on the first
day of my arrival. Thank you very much. Cesar Casiano Flores, Norma Contreras Hernandez,
Imke Lammers, Ewert Aukes, Monica Ramos Meija, Nthabiseng Mohlakoana for wonderful
lunch sessions where we all exchanged our PhD experiences and discussed endless topics. Leila
Niamir, you remind me of a lost friend from India, it was natural warmth that we shared, you
will be always cherished. Thank you very much for being a lovely friend.

My stay at CSTM would not have been so smooth without the assistance of Annemiek
van Breugel and Barbera van Dalm-Grobben. Annemiek I thank you for being my first point of
contact at CSTM and helping me in getting all the documents in order and advising me through
the visa and residence permits. You continued to assist me with my queries and needs
throughout the first three years and I appreciate that. Barbera, thank you very much for your
availability and for being always ready to assist with a warm smile. Luz Jimenez and Johan De
Meijere, thank you very much for being warm and welcoming hosts and providing me with a
home during my stay in the Netherlands. I really enjoyed staying at your place.
I would like to thank all the people I have interviewed as part of my case study data
collection. I highly appreciate their time and patience in wisely answering my research related
questions to the best of their knowledge. I would like to extend my heartfelt thanks to my
offices: Environmental Design Solutions (EDS) and International Institute for Energy
Conservation (IIEC) where I worked during my PhD journey. Firstly, I would like to thank
Tanmay Tathagat and Anamika Prasad, my employers from EDS, where I was working as
Senior Policy Analyst when I first started. I would like to thank them for providing a very
supportive environment in office and accommodating me with extended leaves whenever I
travelled to the Netherlands for my PhD work. Your support was incredible and gave me the
right impetus to kick start my PhD with ease. I would also like to thank Sanjay Dube from IIEC
who gave me extended leaves from office and encouraged me throughout my stay at IIEC.
Thank you very much.
Last but not the least; this PhD would have not been possible without the unflinching
support, encouragement and love of my dear friend and husband Ashutosh. Ashutosh, this is
our journey together and we have reached a milestone. Your constant inspiration, support and
unconditional love drove me to do this PhD and walk the path of fulfilling my dream. Today it
became a reality with the optimism and hope that I always got from you by believing in me.
Can’t thank you enough to be there by my side throughout this time as an anchor and giving a
rock-solid foundation to this endeavor. Hope we both tread on many more such fulfilling
dreams and endeavors in years to come. I am glad and overjoyed that with the end of this
journey we both stepped into a new journey of parenthood, which makes the end even more
joyful and memorable. Our little bundle of joy, Sarvagya (Savvy), came into our arms while

writing this thesis work, and hence this experience could not be more fulfilling and enriching.
Savvy, you became the love of our lives in a heartbeat. This work is all dedicated to you.
I would like to thank my parents-in-laws and sister-in-law, Akanksha for being a
supportive and encouraging family. Your support in taking care of our home during my
extended travel trips to the Netherlands and field visits for data collection is highly
appreciated.
I would like to thank my parents for always believing in me and providing me with the
right support and encouragement needed during my growing up years. A very special thanks
and love goes to my mother, who always encouraged me to pursue my dreams and taught me
to work hard to fulfill them. It would have not been possible without you. You were the first
one to smile and supported my wish to do a PhD, way back in 2009. Sadly, your life was only
short-lived, but what stayed was the hope that you gave to pursue my dreams no matter what.
This work is dedicated to you, and hope you are proud of me today. To my father, who always
felt proud of my achievements and encouraged me. I would also like to thank my siblings and
their better halves - Arunima, Aditya, Kush, and Divya for being a loving and supportive
family.


Table of Contents
Chapter 1: Introduction ............................................................................................................. 1
1.1 Research background .................................................................................................................... 3
1.2 Problem statement ......................................................................................................................... 5
1.3 Research objectives ........................................................................................................................ 8
1.4 Research questions ......................................................................................................................... 8
1.41 Sub-questions ............................................................................................................................. 9
1.5 Thesis outline .................................................................................................................................. 9
Chapter 2:Net zero energy buildings - an overview .......................................................... 15
2.1 The building sector in India – an overview .............................................................................. 17
2.1.1 Buildings and energy use .......................................................................................................... 18
2.1.2 Impacts of energy use by buildings .......................................................................................... 19
2.2 Programs towards energy efficient buildings in India ........................................................... 20
2.2.1 Energy conservation building code .......................................................................................... 21
2.2.2 BEE star rating for buildings ................................................................................................... 22
2.2.3 Green building rating systems ................................................................................................. 22
2.3 Net zero energy buildings: conceptualization ......................................................................... 25
2.3.1 Efforts toward NZEB concept in India .................................................................................... 28
2.3.2 Efforts for NZEB uptake in developed countries ...................................................................... 30
2.4 Existing challenges and barriers to NZEB market development in developed countries . 37
2.4.1 ZEBRA2020 project: ................................................................................................................ 37
2.4.2 PassREg project ........................................................................................................................ 39
2.5 Conclusions ................................................................................................................................... 40
Chapter 3: Theoretical framework ....................................................................................... 43
3.1 Introduction .................................................................................................................................... 45
3.1.1 Strategic niche management for NZEB’s: a theoretical approach ............................................ 45
3.1.2 Sectoral innovation systems – an innovation perspective ........................................................ 50

3.2 Integrated assessment framework for NZEB niche development ........................................ 54
3.2.1 Comparing SNM and SIS ........................................................................................................ 54
3.2.2 A comprehensive policy oriented ‘failure’ framework for transformative change .................... 58
3.3 Governance ................................................................................................................................... 61
3.3.1 Governance assessment tool ..................................................................................................... 62
3.4 Conclusions ................................................................................................................................... 68
Chapter 4: Analyzing sectoral niche formation: the case of net-zero energy buildings in India ....................................................................................................................................... 69
4.1 Introduction .................................................................................................................................. 71
4.2 Background to the sectoral system innovation assessment framework ............................... 73
4.2.1 Strategic niche management..................................................................................................... 74
4.2.2 Sectoral innovation systems ..................................................................................................... 75
4.3 Integration of concepts from the SNM and IS traditions in the literature ........................... 76
4.4. Integrated assessment framework to analyse sectoral niche formation ............................... 78
4.4.1 Shaping of expectations ........................................................................................................... 80
4.4.2 Actor network formation .......................................................................................................... 80
4.4.3 Learning process ....................................................................................................................... 81
4.4.4 Institutional alignment ............................................................................................................ 81
4.4.5 Market demand creation ........................................................................................................... 81
4.5 Research design and methodology ............................................................................................ 82
4.6 Results ............................................................................................................................................ 85
4.6.1 Market description of the Indian building sector ..................................................................... 85
4.6.2 Shaping of expectations ............................................................................................................ 88
4.6.3 Actor network formation .......................................................................................................... 89
4.6.4 Learning process ....................................................................................................................... 90
4.6.5 Institutional alignment (formal and informal) ......................................................................... 91
4.6.6 Market demand creation ........................................................................................................... 92
4.7 Overview of the main results ..................................................................................................... 93
4.8 Discussion ..................................................................................................................................... 95

4.9 Conclusions ................................................................................................................................. 100
Chapter 5: A Governance perspective on NZEB niche development in India: New Delhi ......................................................................................................................................... 103
5.1 Introduction ................................................................................................................................ 105
5.2 Theoretical framework .............................................................................................................. 107
5.2.1 Governance assessment tool ................................................................................................... 107
5.2.2 Strategic niche management................................................................................................... 111
5.3 Research design and methodology .......................................................................................... 113
5.3.1 Case selection .......................................................................................................................... 113
5.3.2 The building sector in New Delhi .......................................................................................... 114
5.3.3 Data collection ........................................................................................................................ 115
5.3.4 Data analysis .......................................................................................................................... 116
5.4 Results .......................................................................................................................................... 117
5.4.1 Governance assessment of the New Delhi case study ............................................................. 117
5.4.2 Overview ................................................................................................................................ 128
5.5 Discussion ................................................................................................................................... 130
5.6 Conclusions ................................................................................................................................. 132
Chapter 6:A Governance perspective: Ajmer .................................................................... 135
6.1 Introduction ................................................................................................................................ 137
6.2 Theoretical framework .............................................................................................................. 137
6.3 Research design and methodology .......................................................................................... 137
6.3.1 Case selection – Ajmer city..................................................................................................... 138
6.3.2 Data collection ........................................................................................................................ 140
6.4 Results .......................................................................................................................................... 141
6.4.1 Extent: Are all relevant elements taken into account? ........................................................... 141
6.4.2 Coherence: are the elements reinforcing rather than contradicting each other? .................... 143
6.4.3 Flexibility: are multiple roads to the goals permitted and supported? ................................... 145
6.4.4 Intensity: how strongly do the elements urge changes in the status quo or in current developments? .................................................................................................................................. 146

6.5 Overview ..................................................................................................................................... 147
6.6 Conclusion ................................................................................................................................... 148
Chapter 7: Transition to energy efficient buildings: comparing Singapore and India
7.1 Introduction ................................................................................................................................. 153
7.2 Green building sector in Singapore ......................................................................................... 154
7.1.1 Green building rating tools in Singapore ............................................................................... 155
7.2 SSIAf framework ........................................................................................................................ 156
7.3 Methods ....................................................................................................................................... 158
7.4 Results .......................................................................................................................................... 159
7.4.1 Actor networks and interactions ............................................................................................ 160
7.4.2 Institutions ............................................................................................................................. 163
7.4.3 Learning process ..................................................................................................................... 168
7.4.4 Market demand ....................................................................................................................... 170
7.4.5 Shaping of expectations , problem perceptions and goal setting ............................................ 173
7.5 Discussion and conclusions ...................................................................................................... 176
Chapter 8: Conclusion ........................................................................................................... 183
8.1 Introduction ................................................................................................................................ 185
8.2 Results .......................................................................................................................................... 185
8.2.1 Answering the sub-research question ..................................................................................... 185
8.3 Theoretical frameworks: lessons and limitations .................................................................. 192
8.3.1 Limitations and recommendations for future research ........................................................... 195
8.4 Societal Relevance ...................................................................................................................... 196
Bibliography ............................................................................................................................ 199
Annexure i ................................................................................................................................ 217
Annexure ii .............................................................................................................................. 223
SUMMARY .............................................................................................................................. 227
Summary (Dutch) ................................................................................................................... 231

List of Tables Table 1: Chronological listing of key policies and codes, Source: (AEEE, 2011) ______________ 24
Table 2 : Overview of European legislation addressing the building sector ( (Bürger, 2013) ___ 31
Table 3: Overview of German legislation addressing the building sector ( (Bürger, 2013) _____ 33
Table 4: Overview of UK legislation addressing the building sector ( (Bürger, 2013), (USAID,
www.nzeb.in, 2017) _______________________________________________________________ 35
Table 5: Identified barriers for uptake of the NZEB Concept in Europe and America (PassREg,
2015) ___________________________________________________________________________ 39
Table 6: Integrated assessment framework (Sectoral System Innovation Framework-SSIf) ____ 57
Table 7: Comparing the integrated sectoral system innovation assessment framework with
Weber and Rohracher’s Failure Framework (2012) _____________________________________ 60
Table 8 : The five dimensions of governance (Bressers et al., 2013) ________________________ 63
Table 9: Assessment criteria for sectoral niche formation _______________________________ 82
Table 10: Overview of analysed NZEB projects ________________________________________ 83
Table 11: Overview of the main results of the empirical analysis _________________________ 93
Table 12: Matrix of the Governance Assessment Tool (adapted from: Bressers et.al., 2016; Gana
& Hoppe,2017) __________________________________________________________________ 110
Table 13: Assessment of actor networks and interactions _______________________________ 162
Table 14 : Policy instruments and actions adopted by the BCA in Singapore ______________ 163
Table 15 : Assessing formal and informal institutions __________________________________ 167
Table 16 : Assessing learning process _______________________________________________ 169
Table 17 : Assessing market demand _______________________________________________ 172
Table 18 : Assessing shaping expectations and goal setting _____________________________ 174
Table 19 : Integrated Assessment Framework (Sectoral System Innovation Framework-SSIAf)
_______________________________________________________________________________ 219
Table 20 : Case study questionnaire for sector-level actors outside the NZEB niche _________ 221
Table 21 : GAT Questionnaire - Case study 2 ,3 _______________________________________ 225
List of Figures
Figure 1 : Thesis outline ___________________________________________________________ 12
Figure 2 : Research approach _______________________________________________________ 13
Figure 3 : Future trends in growth of buildings in India per type of building (NRDC & ASCI,
2012) ___________________________________________________________________________ 17
Figure 4 : Share –electricity use (by appliance) in Delhi, India (Manisha et.al, 2007) _________ 19
Figure 5 : Total final energy consumption by sector 2014 Source: (CEA, 2014-15) ____________ 19
Figure 6: Dimensions of sectoral patterns of environmental innovations ( Faber & Hoppe, 2013)
________________________________________________________________________________ 53
Figure 7: The Integrated Sectoral System Innovation Framework (SSIf) ____________________ 57
Figure 8: Five interrelated dimensions of governance (Bressers et al., 2013) ________________ 63
Figure 9 : Example of visualization of governance context diagnosis in score card adapted from
De Boer et al., 2013 ________________________________________________________________ 64
Figure 10 : Comparison of the GAT with the SSIAf. ____________________________________ 67
Figure 11 : SNM and SIS framework complementarities (Jain et al., 2014) __________________ 79
Figure 12 : Conditions enabling sectoral niche formation ________________________________ 80
Figure 13 : Locations of NZEB demonstration projects. _________________________________ 84
Figure 14: Estimated demand for real estate space for various sectors (2005-2030), Source:
(GBPN & CEU, 2014) ______________________________________________________________ 87
Figure 15 : Electricity Consumption in India (2012-13), _________________________________ 87
Figure 16: Electricity consumption pattern in residential (left) and commercial (right) buildings
(Source: BEE, 2014) _______________________________________________________________ 88
Figure 17 : Masterplan of New Delhi, 2021 (DDA, 2015)________________________________ 113
Figure 18 : GAT results for the New Delhi NZEB case study. ___________________________ 129
Figure 19 : Ajmer master plan 2033 (source: ADA, 2015) _______________________________ 139
Figure 20 : GAT results - Ajmer region ______________________________________________ 148
Figure 21: Singapore – quality of governance in SSIAf components ______________________ 176
Figure 22 : India – quality of governance in SSIAf components __________________________ 179

Abbreviations
ADA Ajmer Development Authority
AMC Ajmer Municipal Corporation
AMRUT Atal Mission for Rejuvenation and Urban Transformation
AVVNL Ajmer Vidyut Vitran Nigam limited
BCA Building Construction Authority
BEE Bureau of Energy Efficiency
BREEF Building Retrofit Energy Efficiency Financing
BRICS Brazil, Russia, India, China, and South Africa
CII Confederation of Indian Industry
CIT Contextual Interaction Theory
CPUC California Public Utilities Commission
CPWD Central Public Works Department
CTA Constructive Technology Assessment;
ECBC Energy Conservation Building Codes
ECO Energy Conservation and Commercialization
EERMC Energy Efficiency and Renewable Energy Management Centre
EIST Environmental Innovations and Societal Transitions
EPBD Energy Performance of Buildings
EPI Energy Performance Index
FAR Floor Area Ratio
GAT Governance Assessment Tool
GBIC Green Building Innovation Cluster
GDP Gross Domestic Product
GHG Greenhouse Gas
GoI Government of India
GRIHA Green Rating for Integrated Habitat Assessment
HRIDAY Heritage City Development and Augmentation Yojana
HVAC heating, ventilation and air conditioning
IGBC Indian Green Building Council
IMCSD Inter-Ministerial Committee on Sustainable Development

IS Innovation System
IST International Sustainability Transitions
LEED Leadership in Energy and Environmental Design
NAPCC National Action Plan on Climate Change
NBC National Building Code
NEEAP National Energy Efficiency Action Plans
NHB National Housing Bank
NMEEE National Mission for Enhanced Energy Efficiency
NMSH National Mission on Sustainable Habitat
NZEBs Net Zero Energy Buildings
MEP Mechanical, Electrical and Plumbing
MLP Multi-Level Perspective;
MNRE Ministry of New and Renewable Energy
MoEFCC Ministry of Environment, Forest and Climate Change
MoUD Ministry of Urban Development
OECD Organization for Economic Co-operation and Development
PACE-D TA Partnership to Accelerate Clean Energy – Technical Assistance
SDA State Designated Agency
SNA State Nodal Agency
SNM Strategic Niche Management
SIS Sectoral Innovation Systems
SSIAf Sectoral Systems Innovation Assessment framework
TIS Technological Innovation Systems
TER The Energy and Resource Institute
TM Transition Management
ULB’s Urban Local Bodies
USAID The United States Agency for International Development
USGBC US Green Building Council
UHBVN Uttar Haryana Bijli Vitran Nigam Ltd
WBP Whole Building Performance Method


3
1.1 Research background
As countries develop and living standards improve, demand for energy grows rapidly. For
instance, in nations experiencing fast-paced economic growth, the share of population
demanding improved housing—which requires more energy to construct and operate—often
increases (Vedala, et al., 2012). Across the world, the built environment accounts for the largest
proportion (approximately 40%) of energy consumption (mostly from fossil fuels) and is
considered the major contributor of greenhouse gas emissions among all other economic sectors
(Olivier, Janssens, & Jeroen, 2012).
Much of the world’s increase in energy demand occurs among the developing non-OECD
nations1, where strong economic growth and expanding population leads to an increase in
energy use (IEA, 2013). In these nations, consumption of energy in buildings is expected to
grow by 2.1% annually from 2012 to 2040, which comprises nearly three times the growth rate
of OECD nations (IEA, 2013). The five most emerging national economies namely Brazil,
Russia, India, China, and South Africa (BRICS)2 also promise massive growth and an increased
demand for new buildings due to their stable economic growth, increasing population, and
high pace of urbanization.
Among the BRICS nations, India is the second most populous country in the world, with
over 1.2 billion people (17% of world’s population) (GoI, 2011), and grows at the rate of 1.28%
per year (Bank, 2014). According to International Monetary Fund (2016) India’s economic
growth is expected to accelerate to 7.2% in 2017-18 and 7.7% in 2018-19 fiscal years. McKinsey
Global Institute (2010) projected that urban population in India could soar to 590 million people
by 2030 (which comprises nearly 40% of the country’s total population). It is estimated that
cities in India will contribute to 70% of the GDP of the country by 2030 (Sankhe, et al., 2010).
Thus far, economic growth has been accompanied by an increase in energy needs as an input to
sustained economic development. India’s existing energy structure is heavily dependent on
fossil fuels, primarily driven by coal and imported oil- which is a concern for the government
for the long-term energy security of the country (Jana & Malladi, 2015). According to BP energy
1 outside the Organization for Economic Cooperation and Development 2BRICS is the acronym for an association of five major emerging national economies: Brazil, Russia, India, China, and South Africa. (The BRICS idea was first conceived in 2001 by Goldman Sachs as part of an economic modelling exercise to forecast global economic trends over the next half century; the acronym BRICS was first used in 2001 by Goldman Sachs in their Global Economics Paper No. 66, “The World Needs Better Economic BRICS”.)

4
outlook (2017), India’s energy consumption is set to grow 4.2% a year till 2035, faster than that
of all major economies in the world (ET Bureau, 2017). As a result the country remains import
dependent despite increase in production, henceforth increasing the burden on existing energy
infrastructures (NRDC & ASCI, 2012).However, with increased attention given to renewable
energy production through government policies and other interventions, RE has witnessed an
increase in share of production and is expected to overtake oil as the second largest source,
increasing from 4% in 2016 to 14% in 2035 as oil drops from 10% in 2017 to 3% by 2035 (ET
Bureau, 2017).
With stable economy and urbanization, demand for new buildings is expected to rise in
cities in India. It is estimated that 70% of the buildings for 2030 are yet to be constructed
(Vedala, et al., 2012). Buildings account for up to 40% of the total energy consumption in India.
Commercial and residential real estate combined will account for more than 2,000 TWH of
energy consumption by 2030 (which will be more than double of the figure in 2012) (Akhaury,
2016). India’s growth could easily see an increase in building energy consumption and CO2
emissions of around 700% by 2050 if corrective measures are not taken (Sankhe, et al., 2010).
Currently, India has an energy deficit of around 12% which is likely to increase with the
government’s electrification drive in rural areas (Akhaury, 2016). The current energy
infrastructure is poor and incapable of coping with this exponential increase in energy demand.
This situation calls for a system change which focuses on increasing energy efficiency alongside
addressing other features such as improving the energy infrastructure in the country (Vedala,
et al., 2012).
For these reasons, it is imperative for the Indian building sector that projected energy
growth is managed in a feasible and a more sustainable manner. To cope with this, ambitious
efforts are required to introduce state-of-the-art policies and environmental regulations to push
the demand for low energy buildings targeting introduction and diffusion of new sustainable
technologies, energy efficiency in building design so that the potential energy savings are not
missed (IEA, 2013). Hence, there seems to be an urgent need to design and implement policy
instruments, and governance arrangements that influence key systemic conditions to overcome
5
barriers that are essential in the transition of the building sector towards low energy or low
carbon energy systems, and towards near zero energy goals.
1.2 Problem statement
Green buildings3 in India account for less than 5% of the current building stock in the
country (Analytics, 2016). However, in recent years, energy efficient and green buildings have
seen an increased uptake. According to the Smart Market Report (2016), by 2018 the green
building industry in India will have increased by 20 per cent, which is largely due to
environmental regulations and demand for healthier neighbourhoods (Analytics, 2016).
According to the findings of the report the country secured a third position in 2016 in the US
Green Building Council (USGBC) annual rankings of top 10 countries for LEED4, a green
building rating system. India has 15.90 million gross square meters (GSM) of LEED-certified
space and an additional 89.28 million cumulative GSM of LEED-certified and registered space
(Analytics, 2016). India is also among the top 10 countries outside the United States making
progress in sustainable building design, construction and operations. Despite this, green
building uptake also meets with several challenges such as lack of public awareness, lack of
public incentives, high perceived upfront costs, and lack of market demand to name but a few
(Analytics, 2016).
Green buildings with the highest energy efficiency level are now being projected as
‘near’ or ‘net zero energy buildings’ (NZEB) in the western world. They use renewable energy
for energy production. NZEBs are buildings with an extremely low energy demand, and in
which the remaining energy demand is met by on site renewable energy. Torcellini, et al. (2006),
define NZEB as: “a residential or commercial building with greatly reduced energy needs through
efficiency gains in such a way that the balance of energy needs can be supplied with renewable
technologies.” This concept has currently gained attention across the world by research
communities, early adopters of construction innovations, policy makers as well as green
building rating systems (such as LEED), setting ambitious targets to transform the building
sector by adopting low, near or net zero energy building goals. Such buildings offer a
3 Green building is the practice of increasing the efficiency with which resources that are used such as energy, water, materials and waste. This is ideally achieved through better siting, design, construction, operation and maintenance as well as in retrofits. i.e. through the complete building life cycle 4 LEED-certified buildings save energy and water, helping residents and businesses to make savings. Such spaces reduce carbon emissions and create a healthier environment for residents, workers and the larger community.

6
promising solution to deal with future energy challenges and have limited environmental
impact. Hence, large scale uptake of NZEBs in the Indian building sector may provide a long
term sustainable solution to the unprecedented demand for energy in the coming years. To
make this happen, it is required that NZEBs are to be tested, up scaled, and diffused. This
requires the development of the right public-sector interventions, as well as private sector
innovations.
Radical transformation and structural change is necessary to govern the innovation towards
this relatively new concept in India’s building sector. In general (socio-technical) transition
implies changes in structure, user practice, regulations, networks, infrastructure, culture and
technology (Loorbach & Rotmans, 2005). A transformation from the status quo (of conventional
building design and construction) is sure to face with huge resistance (Loorbach D. A., 2007).
This especially applies to pursuing ambitious NZEB goals.
Geels (2002) advocates the complete replacement of an entire (embedded) socio-technical
system (which may contain conventional building practices). This can only be achieved via the
niche development and breakthrough of radical innovations, and gradual breakdown of current
regime structures. However, it is typically considered as a complex and a difficult process. To
achieve this, a major systemic transformation is required to fundamentally change the way in
which buildings are designed, constructed, operated and refurbished throughout their lifecycles
to develop them as low energy or zero energy buildings. However, this is easier said than done,
as despite the efforts toward sustainable solutions for buildings, mainstreaming of energy
efficiency in the building sector still meets with many challenges worldwide including in India
(WEC, 2013).
At the same time –coupled with high growth - India faces many structural problems
emerging alongside a general situation of socio-economic stress; i.e., resource shortages,
institutional weakness and a general inability to deal with key issues (Ofori, 2002). Current
government policies based on traditional and outdated approaches are insufficient in solving
these problems. They mostly produce a sub-optimal level of solutions (Loorbach D. A., 2007).
Major revisions are required at the development process, restructuring of institutions and
societal functions to stabilize new innovations and technologies in society. The seriousness and
magnitude of problems make it clear that extra efforts are needed, and that solutions along

7
existing pathways do not offer enough perspectives (Olivier, Janssens, & Jeroen, 2012). Thus far,
research into sustainability transitions is mostly restricted to the global West. However, there
has been little attention on research into sustainable transition in emerging economies like
India, and particularly in economic sectors like the building sector.
Theoretical frameworks such as Strategic Niche Management (SNM; Hoogma et al., 2002;
Raven 2005) and Sectoral Innovation Systems (SIS; Malerba, 2004; Geels, 2004; Faber and
Hoppe 2013) provide insight into how to foster technological and social change, and at the
same time initiate sustainable transitions. SNM is an analytical tool designed to facilitate the
introduction and diffusion of new sustainable technologies through societal experiments (Schot
& Geels, 2008). SNM supports development of radical innovations and focuses on early
adoption of new technologies which will be instrumental in the wider diffusion of NZEBs in
India. SNM also concerns with how governments can foster introduction of these technologies,
initially through experiments within protected niches (Kemp, Loorbach, & Rotmans , 2007).
Similarly, another approach based on an innovation perspective highlights studies on
‘sustainable innovations’ taking a specific technology as a starting point (Malerba F. , 2002).
The SIS perspective provides understanding of the learning and innovation process specific
to an economic sector (e.g., the building sector). It supports analysis of technological change,
nature and dynamics of innovation (Malerba F. , 2004). Radical innovations are necessary
towards wider diffusion of NZEBs in the building sector. It is well argued that to understand
innovation activities at the niche level it is also important to understand sector level
innovations by using a conceptual SIS perspective (Weber & Hoogma, 1998).
Governments and governance systems play a special role as a facilitator in stimulating
innovation and supporting or obstructing the wider diffusion and adoption of new sustainable
technologies. The Governance assessment tool (GAT; Bressers et al., 2013) can be used to assess
the existing quality of a governance context. GAT can provide us with a vision towards current
and possible future pathways for the governance context. This can be helpful to assess the
introduction and innovation diffusion of NZEBs in the Indian building sector, as well as future
policy programs for sustainable innovations. The thesis also attempts to compare the integrated
assessment framework of SNM and SIS with GAT to further the understanding and analytical

8
approach to assess niche developments and deepen our understanding of innovation and
diffusion of sustainable technologies in a given sector.
For these reasons, the aim of this research project is to explore these theoretical frameworks
further, and to examine their use for assessing the status of niche formation of NZEBs in India.
The study will further focus on developing an integrated assessment framework for assessing
the NZEB niche development in India based on the combination of SNM and SIS theoretical
frameworks alongside using GAT.
1.3 Research objectives
The aim of this doctoral study is to understand the niche formation process of NZEBs and its
potential contribution to the sustainable transitions of the Indian building sector. The study
focuses on assessing the status of NZEB niche formation and development using appropriate
theoretical frameworks, especially SNM, SIS and the GAT.
The study has three primary objectives. Firstly, to develop an integrated assessment
framework using appropriate theoretical approaches to assess niche formation as well as
innovations for NZEBs in the building sector. Secondly, to assess the status of the NZEB niche
in India by evaluating demonstration projects by using the integrated framework. Thirdly, to
assess the governance context for NZEB niche formation in two selected cities in India, namely
New Delhi and Ajmer.
Further to this, the study also attempts to draw a comparative assessment of sustainable
innovations between the building sectors in India and Singapore. The study assesses the
applicability of using the same theoretical frameworks in distinct settings such as the building
sector in Singapore.
1.4 Research questions Based on the main research objectives, the doctoral thesis attempts to answer the following
research question.
What are the supportive and restrictive conditions for Net zero energy buildings (NZEBs)
niche development in the building sector in India?

9
The main research question is sub-divided into a set of initially four sub-research questions
each using an appropriate theoretical framework and most suitable research method resulting in
answering the main research question. Following is the set of sub-research questions:
1.41 Sub-questions
In addition, sectoral innovations are also explored for the building sector in Singapore
using integrated framework in sub-question 1. The study will further a comparative assessment
of the nature of building sector in two discrete and heterogeneous settings. This is considered
as a novel approach in which SSIAf is explored under the backdrop of both a developing and
developed country context
1.5 Thesis outline
This doctoral study is structured based on the publications (mostly refereed journal articles
and conference papers) that were delivered during this study. Each chapter is primarily
answering one of the sub-research questions 1 -5, and hence supporting the answering of the
main research question. This is achieved by conducting a set of case studies using appropriate
theoretical frameworks and research method (see figure 1 and 2). The study begins with
introducing the research background in this Chapter 1 along with identifying the problem
statement, key research objectives, the main research question and its sub-questions.
Chapter 2 presents an overview of NZEBs with their scientific and practical definitions,
state of the art in academic literature, the status of green buildings in India, and existing green
rating systems.
1. What integrated assessment framework suits best to assess NZEB niche development
in India?
2 What does the SSIA framework tell about NZEB niche formation in India?
3 What is the state of governance in New Delhi regarding NZEB niche formation?
4 What is the state of governance in Ajmer regarding NZEB niche formation?
5 What does SSIAf tell about green buildings innovation in Singapore when compared to
the building sector in India?

10
Chapter 3 focuses on the theoretical frameworks of SNM, SIS and GAT to explore the
conceptual basis and development of an appropriate assessment framework to answer the main
research question. The theoretical frameworks which are best suited to answer this were
selected and redeveloped as the integrated frameworks to suit the context of the study. This
chapter answers the sub-research question 1 where the study identifies the appropriate
theoretical framework to assess the status of NZEB niche formation in India. Findings of this
chapter were presented at a Netherlands Institute of Governments (NIG) conference in September
2014, at Delft University of Technology, in Delft, the Netherlands.
Chapter 4 comprises the presentation of the first case study designed to assess the status of
NZEB niche formation in India by evaluating seven demonstration projects (either completed
or on-going) using the assessment framework developed in chapter 3. This chapter answers the
sub-research question 2, what does this framework tell about NZEB niche formation in India?
This chapter is based on an article published in the refereed journal of Environmental Innovations
and Societal Transitions (EIST), published in November; 2016. The journal is dedicated to
research in sustainability transitions.
Chapter 5, the second case study, is designed to assess the state of governance for NZEB
uptake in the regional setting of New Delhi. This case study uses the GAT to evaluate the state
of governance along with drawing insights from SNM. This chapter answers the sub-research
question 3, what is the state of governance in New Delhi regarding NZEB niche formation?
This chapter is based on an article that was published in the refereed journal, Energies in
August, 2017.
Chapter 6, the third case study is designed to assess the state of governance for NZEB in
another selected region of India, namely Ajmer. This case study also uses GAT for assessing the
governance context in Ajmer along with drawing insights from SNM. The findings of this
article were presented at an international conference, International Sustainability Transitions (IST)
at the Wuppertal Institute of Climate and Energy, Germany in August 2016.

11
In Chapter 7, the results of the study are compared with a case study on transition in the
Singapore building sector, using a similar theoretical framework (i.e. SSIAf and GAT). The
comparisons are drawn to broaden the scope of this study and understand the applicability of
theoretical frameworks in a different country with distinct contextual settings for the building
sector. The chapter has been submitted as an independent research article to Journal of Cleaner
Production for publication.
Chapter 8 presents the results and conclusions of the doctoral study, which brings all the
cases studies together to assess the holistic outcome of the doctoral thesis answering the main
research question. This is done by drawing insights from chapters 3-7. The results of each of
the sub-studies will contribute to answering of the main research question. The synthesis will
be the culmination of all the sub-studies, providing a holistic picture about the phenomenon
under research (NZEB niche development in India). Further to the analysis, the study sets the
conclusions.
Some conceptual backgrounds are repeated in chapters which demand re-introduction of
theoretical frameworks before presenting the case study. The results of each of the mentioned
studies prepare ground work for subsequent studies. All in all, the studies contribute to
answering the primary research question.
Figure 1 and 2 below, presents the graphical representation of the flow of this thesis.

12
Man
si Ja
in
Figu
re 1
: Th
esis
out
line
Ch
1:
Intr
oduc
tion
Ch
3: T
heor
etic
al fr
amew
ork
Ch
4: C
ase
stud
y 1
N
ZEB
nich
e de
velo
pmen
t
Ch
5: C
ase
stud
y 2
Gov
erna
nce
in N
ew D
elhi
Ch
6: C
ase
stud
y 3
- G
over
nanc
e in
Ajm
er
Ch
8:
Con
clus
ions
Ch
2: N
ZEB
lite
ratu
re st
udy
Ch
7: C
ase
stud
y 4
C
ompa
ring
inno
vatio
n in
Si
ngap
ore
and
Indi
a

13
Figu
re 2
: R
esea
rch
appr
oach
Res
earc
h ap
proa
ch: D
evel
opin
g an
inte
grat
ed a
sses
smen
t fra
mew
ork
to a
sses
s N
ZEB
nich
e de
velo
pmen
t in
Indi
a
Theo
retic
al F
ram
ewor
k: S
trat
egic
Nic
he M
anag
emen
t, Se
ctor
al
Inno
vatio
n sy
stem
, Gov
erna
nce
Ass
essm
ent T
ool
D
ata
Col
lect
ion:
lit
erat
ure
revi
ew, T
heor
etic
al A
naly
sis
O
utpu
t: C
onfe
renc
e Pa
per –
NIG
Con
fere
nce,
201
4
Res
earc
h ap
proa
ch: A
sses
sing
nic
he d
evel
opm
ent o
f NZE
B is
Indi
a by
as
sess
ing
com
plet
ed a
nd o
n-go
ing
NZE
B de
mon
stra
tion
proj
ects
T
heor
etic
al F
ram
ewor
k: S
SIA
f fro
m q
uest
ion
1 is
app
lied
D
ata
Col
lect
ion:
Qua
litat
ive
Ana
lysi
s: D
esk
stud
y an
d lit
erat
ure
revi
ew,
Sem
i-str
uctu
red
inte
rvie
ws (
both
nic
he a
ctor
s and
regi
me
acto
rs)
Out
put:
Jour
nal A
rtic
le –
Env
ironm
enta
l Inn
ovat
ions
and
Sus
tain
abili
ty
Tran
sitio
ns
Res
earc
h ap
proa
ch: A
sses
sing
the
gove
rnan
ce c
ondi
tions
in A
jmer
Th
eore
tical
Fra
mew
ork:
Gov
erna
nce
Ass
essm
ent T
ool (
GA
T) a
nd S
NM
D
ata
Col
lect
ion:
Mix
ed M
etho
ds (Q
ualit
ativ
e)
D
esk
rese
arch
Sem
i-str
uctu
red
inte
rvie
ws (
bot
h pu
blic
and
pri
vate
act
ors,
emph
asis
on
the
publ
ic s
ecto
r)
Out
put:
Con
fere
nce
Pape
r -In
tern
atio
nal S
usta
inab
ility
Tra
nsiti
ons
Res
earc
h ap
proa
ch: C
ompa
ring
sus
tain
able
inno
vatio
ns in
Indi
a an
d Si
ngap
ore
gree
n bu
ildin
g se
ctor
Th
eore
tical
Fra
mew
ork:
SSI
Af a
nd G
AT
D
ata
Col
lect
ion:
Mix
ed M
etho
ds (Q
ualit
ativ
e)
D
esk
rese
arch
Sem
i-str
uctu
red
inte
rvie
ws (
key
sta
keho
lder
s )
Out
put:
Cha
pter
7 –
Sub
mitt
ed in
Jour
nal o
f Cle
aner
Pro
duct
ion
Res
earc
h ap
proa
ch: A
sses
sing
the
gove
rnan
ce c
ondi
tions
in N
ew D
elhi
Theo
retic
al F
ram
ewor
k: G
over
nanc
e A
sses
smen
t Too
l and
SN
M
Dat
a C
olle
ctio
n: M
ixed
Met
hods
(Qua
litat
ive)
Des
k re
sear
ch
Se
mi-s
truc
ture
d in
terv
iew
s ( k
ey s
take
hold
ers
) O
utpu
t: Jo
urna
l Art
icle
– E
nerg
ies
Sub
ques
tion
1
Sub-
ques
tion
2
Sub-
ques
tion
3
Sub-
ques
tion
4
Sub-
ques
tion
5

14


17
2.1 The building sector in India – an overview
The construction sector in India is expected to generate a huge demand for buildings.
Currently, this sector contributes 7.74 percent to the Indian GDP (20161-17) (Planning
Commission, 2017) and is the second largest employing economic sector in the country after
agriculture (TERI & Bank, 2014). Spatial areas used for buildings (i.e. land area covered by
constructed buildings) in India are speculated to increase five-fold from 1,858 million sqm in
2005 to over 9,292 million sqm in 2030 (TERI & Bank, 2014). By 2050, it is projected that India will
see an unprecedented escalation of floor area of around 400% (Urge-Vorsatz, et al., 2012).
The Indian building sector consists predominately of the residential and the commercial
sector. Nearly, 700 - 900 million sqm of commercial and residential space is projected to be built
each year until 2030, which is similar to building the city of Chicago (Sankhe, et al., 2010). Figure
3 presents future trends of the building sector in India (differentiated per type of building)
(Vedala, et al., 2012). The numbers of buildings are expected to increase rapidly for all types of
building. Most growth, however, is expected for residential buildings followed by the
commercial sector.
Figure 3 : Future trends in growth of buildings in India per type of building
Considering the scale of growth, it is imperative for the building sector to manage its
projected growth in a feasible and a sustainable manner as buildings consume huge amounts of
energy and contribute to GHG emissions causing adverse environmental impact.
18
A striking increase in energy demand will be difficult to manage due to existing resource
constraints and heavy dependence on fossil fuels for energy generation in India. Unconventional
or clean energy solutions need to be explored to manage the dramatic impact of energy
consumption on the growing building sector in India (Shnapp & Laustsen, 2013).
Most recently in India, increased efforts to advance energy efficiency in buildings have been
incorporated in various policies such as Energy Conservation Building Codes (ECBC) for
commercial buildings. Additionally, the government seeks to explore unconventional energy
resources and a big push to a wide uptake of solar energy (through government programs such
as National Solar Mission, development of solar parks and so-called ‘Ultra mega solar power
projects’) (Jana & Malladi, 2015). Key policy interventions which can further a sustainable energy
transition, include promoting appropriately regulated competitive energy markets, appropriate
pricing and efficient resource allocation, efficiency improvements and associated governance
reforms (Jana & Malladi, 2015).
The Government of India (GoI) is committed to a low carbon energy transition, while
simultaneously aiming to meet all the developmental challenges that the country faces.
Following the 2015 International Paris Agreement on Climate Change, India has pledged to
reduce emissions intensity of 33-35% by 2030 as compared to 2005 level. India has also set a
target to transition to non-fossil fuel-based energy for 40% of its cumulative electricity generation
capacity by 2030 (Ramji, et al., 2016).
2.1.1 Buildings and energy use
Buildings are large consumers of energy throughout their life cycles; i.e. from design,
construction, operation, maintenance, to retrofits and demolition (NHB & KFW, 2014). Energy
consumed by buildings predominantly concerns electricity and fuel use for cooking. Electricity
in buildings is used to provide a variety of services such as thermal comfort (space heating and
cooling), lighting, and water heating and electrical appliances. Figure 4 presents seasonal
differences in energy demand for New Delhi, India (Manisha, Gaba, & Srivastava, 2007). During
the summer months, air-conditioners and refrigerators each account for about 28% of total
monthly electricity consumption, while lighting accounts for about 9 % of annual electricity
consumption. In the winter, major electricity users are refrigerators (44%), water heating (e.g.
“geyser”, type 18%), and lighting (14%) (Manisha, Gaba, & Srivastava, 2007).

19
Figure 4 : Share –electricity use (by appliance) in New Delhi, India 5
The share of energy use in buildings in the total energy use increases with improved
standards of living. In India, building energy use has seen an increase from 14% in the 1970s to
nearly 33% of total primary energy use in 2004–2005, with a near-consistent 8% rise in annual
energy demand in residential and commercial sectors (Urge-Vorsatz et al., 2010; Rawal et al.,
2012). The residential sector accounted for about 22% of total electricity consumption, and the
commercial sector accounts for 8% (see Figure 5) (CEA, 2014-15)
Figure 5 : Total final energy consumption by sector 2014 Source:
2.1.2 Impacts of energy use by buildings
Buildings are the largest single contributor to global GHG emissions; accounting for around
one third of the global final energy use and 30 per cent of global energy-related carbon emissions
(Urge-Vorsatz, et al., 2012). Confronted by climate change, countries across the world are
searching for effective ways to reduce GHG emissions from buildings. India’s growth is
estimated to easily see an increase in building energy consumption and CO2 emissions of around
700% by 2050 if left unchecked (Shnapp & Laustsen, 2013). Such growth in the energy
5 Other: washing machine, computers and iron

20
consumption by buildings will likely have a large negative impact on the environment. In such a
situation, without a transformational change to low carbon buildings, energy consumption will
increase to levels that are unsustainable and threatening India’s energy security alongside
detrimental effects to the environment. Increased energy efficiency in the building sector and
utilization of renewable energy are very important to contain the rising energy demand and
dependence on the electricity grid without jeopardizing the growth of the Indian economy, and
the climate change commitments made by the GoI (Shnapp & Laustsen, 2013).
Notwithstanding the expected rise in energy consumption, the Indian building sector has a
great potential for significant energy savings. According to a study, the savings potential is more
than five times larger than the energy used by buildings in India today (NHB & KFW, 2014).
Improving the energy performance of new as well as existing buildings can have a major role in
managing energy, GHG emissions in the building sector, and securing its future energy needs.
To meet this, ambitious efforts are required to introduce state-of-the-art policies and sustainable
technologies to India so that the potential energy savings are not missed (IEA, 2013).
Energy efficient buildings, green buildings and high performing buildings such as NZEBs
have the potential to provide long term solutions to the challenging situation regarding future
energy demand. India has gradually started to introduce energy efficiency solutions in its
building sector with several tools and strategies, and by supporting green building market
growth in India with prevalent green building certification tools. If this is to be successful, these
efforts must be improved or scaled to realize the potential for energy savings in proportion to the
exponential rise in the building sector in India. Therefore, it is imperative that India’s building
sector is supported by strong policies and packages that include multiple facets of development
and scaling of energy efficiency and integration of renewable technologies in both new and
existing buildings (NHB & KFW, 2014).
2.2 Programs towards energy efficient buildings in India
In 2001, the Energy Conservation Act was introduced by the GoI to emphasize the national
priority on energy efficiency in all sectors. Under the provisions of the Act, the Bureau of Energy
Efficiency (BEE) was established in 2002 (BEE, 2015). The BEE is mandated to reduce the energy
intensity of the Indian economy by actively working with stakeholders to accelerate the adoption
of energy efficiency measures. One of the first initiatives of BEE was to prepare an Energy

21
Conservation Action Plan, which was released in August 2002. In June 2008, India released the
first National Action Plan on Climate Change (NAPCC) outlining existing and future policies
and programs addressing climate change mitigation and adaptation. The plan identified eight
major national missions including a National Mission for Enhanced Energy Efficiency (NMEEE)
(Ramesh & Khan, 2013). Over the past decade, the Ministry of New and Renewable Energy
(MNRE), the Ministry of Environment and Forests (MoEF), the Ministry of Power (MoP) and the
ministry of Urban Development (MoUD) have introduced sustainability components with
overarching policy objectives to promote energy conservation in buildings (Vasudevan, Cherail,
Bhatia, & Jayaram, 2011).
2.2.1 Energy conservation building code
BEE as a national agency has been introduces and monitors energy efficiencies of buildings
and appliances in India. For mainstreaming the energy efficiency in the building sector, the BEE
introduced the ECBC in May 2007. This is applicable to both new buildings and those
undergoing major renovation. The ECBC applies to buildings or building complexes with a
connected load of 100 kW or greater, or a contract demand of 120 kVA or more. Currently, the
ECBC is in a voluntary implementation phase and the compliance percentage is forecasted to
increase gradually from 10% until 2013 to 35% in 2015 and 65% by 2017 (BEEP, 2015). ECBC has
been amended in twenty states of India out of which ten states have also notified its
implementation (USAID, 2016). Currently, the ECBC provides both requisite and prescriptive
requirements for five building components, namely: (a) building envelope, (b) heating,
ventilation and air conditioning (HVAC), (c) service water heating and pumping (d) lighting,
and (e) electrical power. For compliance with ECBC, projects can either adopt the ‘prescriptive
method6’ or the ‘whole building performance method (WBP)’7. The trade-off method is available
only for the building envelope category (BEEP, 2015).
6 Prescriptive Method: A building complies with the Code using the Prescriptive Method if it meets the prescribed minimum (or maximum) values for envelope components, comfort systems and controls, and lighting and controls, in addition to meeting all the mandatory requirements.
7 Whole building performance method: A building complies with the Code using the Whole Building Performance (WBP) Method when the estimated annual energy use of the Proposed Design is less than that of the Baseline Design, even though it may not comply with the specific provisions of the prescriptive requirements. The mandatory requirements shall be met when using the WBP Method.

22
Under the 12th five-year plan (2012-17)8, one of the priority areas for BEE is to update the
existing ECBC in response to technological development, market changes, and the energy
demand and supply scenario in the country. The United States Agency for International
Development (USAID) - Partnership to Accelerate Clean Energy – Technical Assistance (PACE-D
TA) program is provided support to BEE on this initiative. An ECBC technical update document
was launched in June 2017 after it had been reviewed by the BEE and had been recommended by
core working group committees (USAID, 2016).
2.2.2 BEE star rating for buildings
The BEE introduced the Star labeling programme for existing commercial buildings, which
provides labels to the buildings based on their actual energy performance. This was done to
create demand in the market for energy efficient buildings. The BEE Star labeling is applicable to
buildings with the connected load of 100 kW or more or a contract demand of 120 kVA or more.
One to five stars are awarded to the buildings based on their specific energy use with the five-
star label recognized as indicating the most efficient building. A standardized format of data
collection of actual energy consumption of the building was developed to collect information
pertaining to the building built-up and floor area, conditioned and non-conditioned areas, type
of building, hours of operation of building in a day, climatic zone, and other information related
to facility (BEE, 2015). The star rating is based on actual energy performance of the buildings
expressed as an Energy Performance Index (EPI) measured in terms of annual electricity
consumption per unit of built up area (expressed in kWh/m2/yr.). Currently, this rating is
applicable to office buildings, business process outsourcing buildings, and shopping malls. In the
future, the BEE would like to extend the star labeling to hotels and hospitals (BEEP, 2015).
2.2.3 Green building rating systems
In recent years, India has emerged as one of the world’s top destination for green buildings
and has implemented several rating schemes, which opens up a wide range of opportunities for
innovation in construction, architecture and engineering design, building materials and as well
as in technology (Ramesh & Khan, 2013). Green building can be viewed as the practice of
increasing the efficiency with which resources are used such as energy, water, materials and
8 From 1947 to 2017, the Indian economy was premised on the concept of planning. This was carried through the Five-Year Plans, developed, executed, and monitored by the Planning Commission (1951 - 2014) and the NITI Aayog (2014 - 2017). From 2012-17 is the 12th five year plan in operation.

23
waste during construction as well as operation phase. This is ideally achieved through improved
site planning, design, construction, operation and maintenance as well as in retrofits, i.e. through
‘greening’ complete building life cycles. Green buildings aim to optimize the use of energy by
incorporating various design strategies, new energy efficient construction materials and
equipment, operation and maintenance resulting in reduced energy loads compared to the
conventional building design (Mamta, 2015). Working on green buildings is largely a multi-
stakeholder endeavor in which architects, engineers, builders, material manufactures as well as
occupants work to make a green building (Ramesh & Khan, 2013).
There are three voluntary rating systems applicable for building design in India. These are:
Indian Green Building Council (IGBC)/ LEED –India,
Leadership in Energy and Environmental Design (LEED) USGBC, and
Green Rating for Integrated Habitat Assessment (GRIHA).
The concept of green building landed in India in the late 1990s focusing on having a
minimal environmental impact. In India, the green buildings movement was accepted and
integrated by the Confederation of Indian Industry (CII) in the early 2000s. They formed the
Indian Green Building Council (IGBC) which is actively involved in promoting the green
building concept in India. Leadership in Energy and Environmental Design (LEED)-India is
associated with the internationally known LEED (USGBC) program, which was administered in
India by the IGBC until 2016. LEED India (IGBC) was launched in 2003 and since then has grown
exponentially (ReportBuyer, 2016). Currently IGBC and LEED operate as separate rating
systems. IGBC promotes a whole-building approach to sustainability by recognizing
performance in key areas such as: sustainable site planning, water efficiency, energy efficiency,
and renewable energy, conservation of materials and resources, and indoor air quality. This has
created a large network of smaller stakeholders which includes the construction industry
comprising corporate, government & local agencies, architects, project developers, builders,
product manufacturers and most interestingly green building consultants whose profession was
almost unheard of two decades ago. Since then the green building movement in India gained a
strong impetus (ReportBuyer, 2016).
24
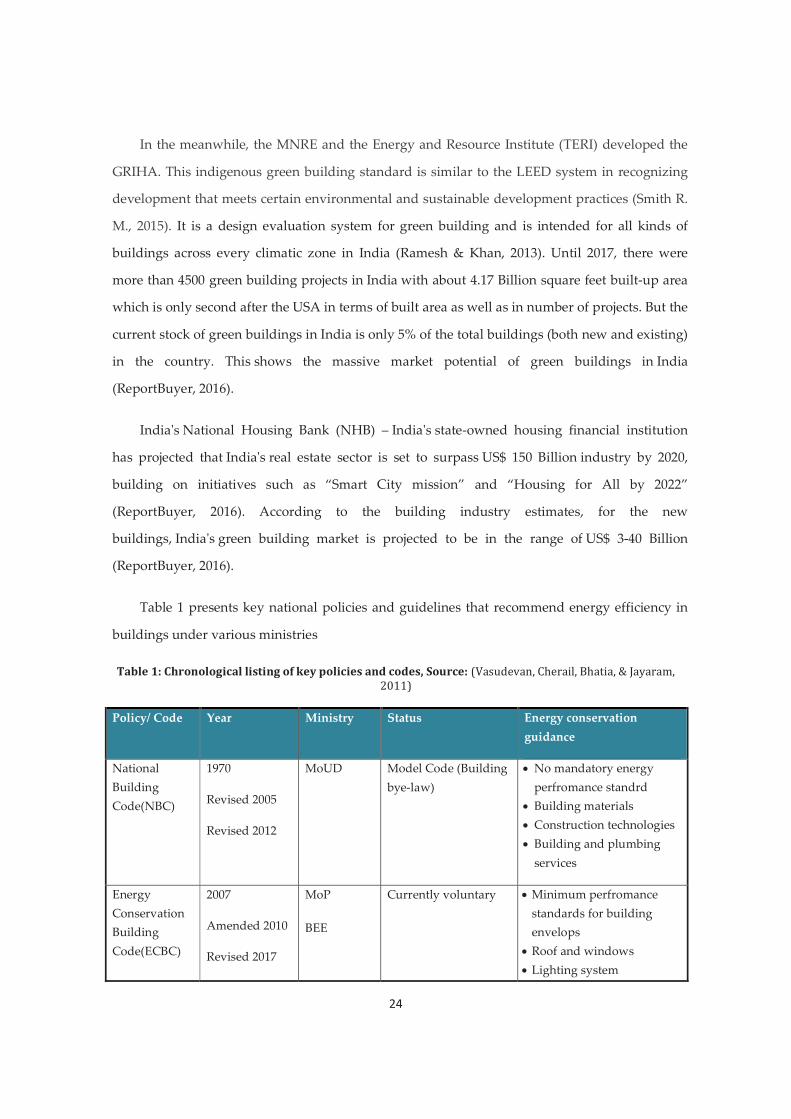
In the meanwhile, the MNRE and the Energy and Resource Institute (TERI) developed the
GRIHA. This indigenous green building standard is similar to the LEED system in recognizing
development that meets certain environmental and sustainable development practices (Smith R.
M., 2015). It is a design evaluation system for green building and is intended for all kinds of
buildings across every climatic zone in India (Ramesh & Khan, 2013). Until 2017, there were
more than 4500 green building projects in India with about 4.17 Billion square feet built-up area
which is only second after the USA in terms of built area as well as in number of projects. But the
current stock of green buildings in India is only 5% of the total buildings (both new and existing)
in the country. This shows the massive market potential of green buildings in India
(ReportBuyer, 2016).
India's National Housing Bank (NHB) – India's state-owned housing financial institution
has projected that India's real estate sector is set to surpass US$ 150 Billion industry by 2020,
building on initiatives such as “Smart City mission” and “Housing for All by 2022”
(ReportBuyer, 2016). According to the building industry estimates, for the new
buildings, India's green building market is projected to be in the range of US$ 3-40 Billion
(ReportBuyer, 2016).
Table 1 presents key national policies and guidelines that recommend energy efficiency in
buildings under various ministries
Table 1: Chronological listing of key policies and codes, Source:
Policy/ Code Year Ministry Status Energy conservation guidance
National Building Code(NBC)
1970
Revised 2005
Revised 2012
MoUD Model Code (Building bye-law)
No mandatory energy perfromance standrd
Building materials Construction technologies Building and plumbing services
Energy Conservation Building Code(ECBC)
2007
Amended 2010
Revised 2017
MoP
BEE
Currently voluntary Minimum perfromance standards for building envelops
Roof and windows Lighting system
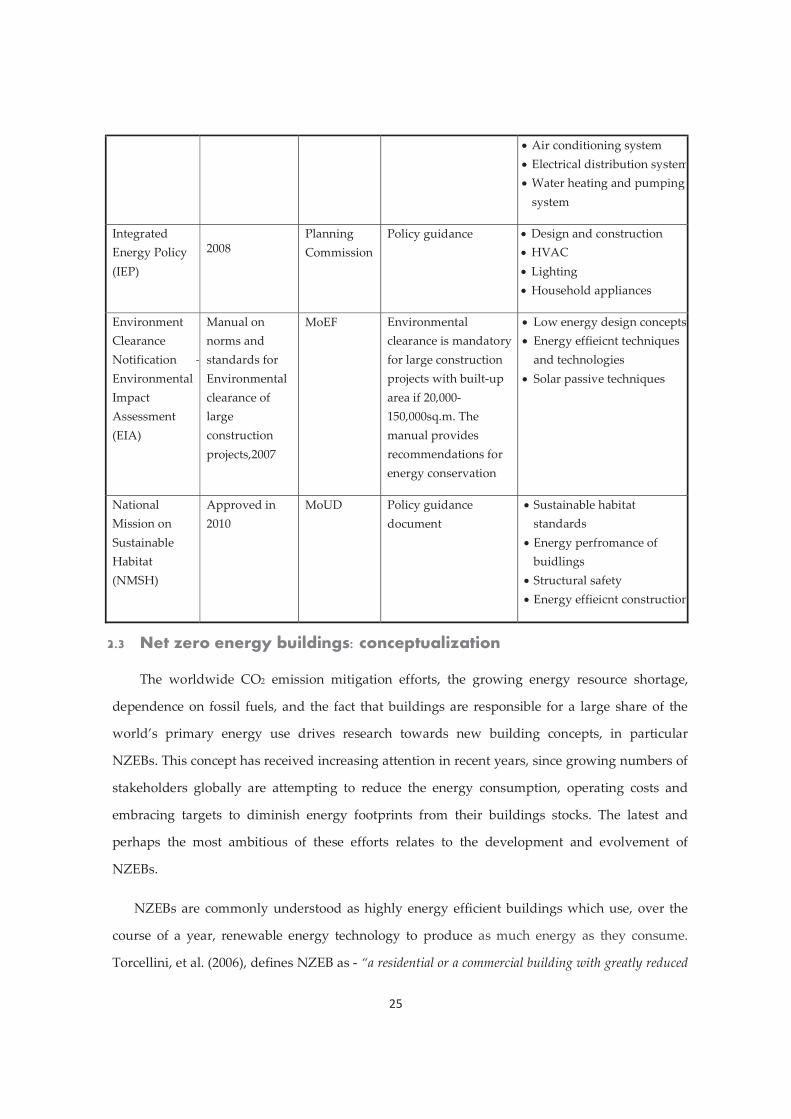
25
Air conditioning system Electrical distribution system Water heating and pumping system
Integrated Energy Policy (IEP)
2008 Planning Commission
Policy guidance Design and construction HVAC Lighting Household appliances
Environment Clearance Notification –Environmental Impact Assessment (EIA)
Manual on norms and standards for Environmental clearance of large construction projects,2007
MoEF Environmental clearance is mandatory for large construction projects with built-up area if 20,000-150,000sq.m. The manual provides recommendations for energy conservation
Low energy design concepts Energy effieicnt techniques and technologies
Solar passive techniques
National Mission on Sustainable Habitat (NMSH)
Approved in 2010
MoUD Policy guidance document
Sustainable habitat standards
Energy perfromance of buidlings
Structural safety Energy effieicnt construction
2.3 Net zero energy buildings: conceptualization
The worldwide CO2 emission mitigation efforts, the growing energy resource shortage,
dependence on fossil fuels, and the fact that buildings are responsible for a large share of the
world’s primary energy use drives research towards new building concepts, in particular
NZEBs. This concept has received increasing attention in recent years, since growing numbers of
stakeholders globally are attempting to reduce the energy consumption, operating costs and
embracing targets to diminish energy footprints from their buildings stocks. The latest and
perhaps the most ambitious of these efforts relates to the development and evolvement of
NZEBs.
NZEBs are commonly understood as highly energy efficient buildings which use, over the
course of a year, renewable energy technology to produce as much energy as they consume.
Torcellini, et al. (2006), defines NZEB as - “a residential or a commercial building with greatly reduced

26
energy needs through efficiency gains such that the balance of energy needs can be supplied with renewable
technologies.” Most commonly demonstrated examples illustrate the path of optimizing energy
use, taking a “reduce, then produce” approach: driving down the building’s energy demand as
far as possible, then filling the remainder with renewable power generated on the property or
purchased on the market (Marszal & Heiselberg, 2009).
However, a lack of common understanding and ambiguity over the definition of NZEBs has
become noticeable since this concept can be described in wide range of terms and expressions.
Torcellini et al. (2006) indicate that the definition of NZEB can be framed in several ways,
depending on the project goals, intentions of the investor, concern about climate change or
finally the energy costs, thus making NZEB a complex concept. The term is used commercially
without a sound academic understanding. As such, countries are enacting policies and national
targets based on the concept without having a clear definition in place. In the recast of the EU
Directive on Energy Performance of Buildings (EPBD) it is specified that by the end of 2020 all
new buildings shall be “nearly zero energy buildings” (EPBD Recast , 2010). For the Building
Technologies Program of the US Department of Energy (DOE), the strategic goal is to achieve
“marketable zero energy homes in 2020 and commercial zero energy buildings in 2025” (US DOE , 2008).
Research reveals that NZEB is not a very new concept; though; literature on NZEBs goes
back to the late 1970s and the early 1980s. The reviewed literature has indicated that there is
wide diversity among NZEB definitions. Esbensen and Korsgaard (1977) describes an
experimental NZEB house in Denmark including only heating demand “With energy conservation
arrangements, such as high-insulated constructions, heat recovery equipment’s and a solar heating system,
the Zero Energy House is dimensioned to be self-sufficient in space heating and hot-water supply during
normal climatic conditions in Denmark.” Followed by Gilijamse (1995) describing NZEB as; “A
house in which no fossil fuels are consumed, and the annual electricity consumption equals annual
electricity production. Unlike the autarkic situation, the electricity grid acts as a virtual buffer with
annually balanced delivers and returns”. Later Iqbal (2003), elaborated NZEBs as; “Zero energy home
is the term used for a home that optimally combines commercially available renewable energy technology
with the state of the art energy efficiency construction techniques. In a zero-energy home no fossil fuels are
consumed, and its annual electricity consumption equals annual electricity production. A zero-energy
home may or may not be grid connected”. As stated, many approaches to NZEB have been

27
documented and published in articles in the past few decades, in which phrases such as ‘a zero-
energy house’, ‘a neutral energy autonomous house’ or ‘an energy-independent house’ were
used.
Additionally, the published academic literature and documented demonstration projects
have highlighted that the path of achieving the ‘zero energy’ goal is affected significantly by the
specific NZEB definition that has been adopted. Torcellini et al. (2006), proposed four different
definitions based on various approaches to NZEB(i) site ZEB, (ii) source ZEB, (iii) cost ZEB and
(iv)emissions ZEB.
Site ZEB: A site ZEB produces at least as much energy as it uses in a year, when accounted for
at the site.
Source ZEB A source ZEB produces at least as much energy as it uses in year, when
accounted for at the source. Source energy refers to the primary energy used to generate and
deliver the energy to the site. To calculate a building’s total source energy, imported and
exported energy is multiplied by the appropriate site-to-source conversion multipliers.
Cost ZEB: In a cost ZEB, the amount of money the utility pays the building owner for the
energy the building exports to the grid or feeds into the grid is at least equal to the amount the
owner pays the utility for the energy services and energy used over the year.
Emissions ZEB: A net-zero emissions building produces at least as much emissions-free
renewable energy than it uses from emissions-producing energy sources.
Following this, the proposed definitions were further discussed in various publications.
Kilkis (2007) defines a NZEB as; “a building, which has a total annual sum of zero energy transfer
across the building-district boundary in a district energy system, during all electric and any other
transfer that is taking place in a certain period of time”. At the same time Mertz, et al. (2007) and
Laustsen (2008) distinguish two approaches towards the NZEB: zero energy and zero emission
(CO2 neutral) building. In the definition for zero energy building the authors stress that the
house generates the same amount of energy as it consumes. Furthermore, in a zero emission or
a carbon neutral home is a complex concept, in which no CO2 is emitted to the atmosphere due
to the operation of the buildings. In addition, the home could generate all its energy on-site like

28
a net-zero energy home. The review has shown that NZEB is a complex concept but still poorly
understood conceptually.
Developing a NZEB definition applicable for all cases is not a simple task as it is clouded by
a variety of complex approaches. These approaches have created a list of main topics, which
should be considered, when developing a new NZEB definition ( Marszal & Heiselberg, 2010). In
many publications (Torcellini et.al. 2006; Laustsen 2008; Marszal and Heisenberg 2009), authors
present the wide variety of zero-energy working definitions and highlight the significance of
these definitions in the framework of final design and actual performance. Strategies towards
NZEB should reflect the climate, the building standard and energy system as well as the
associated (future) energy grid infrastructure (Hermelink, et al., 2013). Therefore, the NZEB
approach in a country can differ depending on the climate, the resources for (green) electricity in
the grid, the heating and cooling grid infrastructures (Hermelink, et al., 2013).
Marszal & Heiselberg (2010) focus on the review of the most relevant existing definitions for
NZEBs and various approaches towards possible calculation methodologies (e.g. the metric of
the balance, the balancing period, the type of energy use included in the balance, the type of
energy balance, the accepted renewable energy supply options, the used primary energy, the
connection to the grid and unique features like requirements for energy efficiency, indoor
climate or the building–grid interaction). The authors present and discuss possible answers to
the above-mentioned issues in order to facilitate the development of a consistent NZEB
definition and a robust energy calculation methodology.
2.3.1 Efforts toward NZEB concept in India
Thus far, the building’s sector energy-efficiency related policy framework in India addresses
and recognizes reductions in energy-use (see table 1). It recognizes the need for developing a
long-term strategy for meeting energy demands of buildings primarily through increasing
energy efficiency levels and the use of renewable resources. This concerns new buildings; which
mean that most of the potential energy savings could come through the construction of novel,
extremely energy efficient buildings or NZEBs. This means that all new constructed buildings
must have much higher levels of energy performance to achieve this potential.

29
The GoI showed interest towards developing a long-term roadmap for NZEBs through
bilateral project agreements between the BEE and the USAID. The Energy Conservation and
Commercialization (ECO) was implemented in three phases in which the NZEB concept was
introduced in ECO III (the ECO III project worked towards identification and development of a
collaboration framework between the US DOE National Research Laboratories, U.S. academic
institutes and research centers, and the CEPT University in India (PACE-R)) during phase II
(2006-12). The USAID PACE-D TA program phase three 2012-17, collaborated with BEE
(Ministry of Power) for a technical update of the ECBC as per market changes and technological
advancement (towards super ECBC buildings) ready to integrate RE goals and a vision for
NZEB. Next, a set of following key initiatives have been undertaken in India to spur NZEB
market uptake: (i) NZEB portal and industry alliance, (ii) NZEB demonstration projects, (iii) Net
Zero certification.
NZEB portal and industry alliance
The Ministry of Power and USAID launched India’s first integrated web portal designed to
promote and mainstream NZEBs in India in May 2017. The portal provides complete
information about NZEBs– those that generate as much energy as they use – as well as how to
achieve near-zero energy status using efficient lighting and equipment, integration of renewable
energy technologies and best practice design strategies. In addition, the portal hosts the Indian
NZEB Alliance, an industry-wide body setup to drive the Indian construction market towards
the uptake of highly energy-efficient buildings (GoI, 2017). These efforts were largely initiated
via afore mentioned agreements through international partnerships and government efforts.
NZEB demonstration projects
Recently, few NZEB demonstration projects have been built by both private and public-
sector stakeholders. These projects were constructed with the aim to showcase how NZEBs are
designed, constructed and operated using new methods and technologies. One such example is
Indira Paryavaran Bhawan, the new office building for Ministry of Environment, Forest and
Climate Change (MoEFCC) which embarks on a radical change from a conventional building
design and claims to be the first net zero energy building in India. The project team has paid
special attention to strategies for reducing energy demand by providing adequate natural light,
shading, landscaping to reduce the ambient temperature, and energy efficient active building

30
systems. Several energy conservation measures were adopted to reduce the energy loads of the
building. The remaining demand was met by producing energy from on-site installed high
efficiency solar panels to achieve net zero criteria. Indira Paryavaran Bhawan uses 70% less
energy compared to a conventional building. The project adopted green building concepts
including conservation and optimization of water by recycling waste water from the site.
Currently, it is India’s highest green rated building. The project has received both GRIHA 5 Star
and LEED Platinum certificate ratings. Moreover, the building constructed in the project has
already won awards such as the Adarsh/GRIHA of MNRE for exemplary demonstration of
Integration of Renewable Energy Technologies (USAID, 2017).
In addition, the USAID PACE –D TA program also supported NZEB pilot projects in India
providing technical assistance namely to Nalanda University in Bihar and public office building -
Uttar Haryana Bijli Vitran Nigam Ltd (UHBVN), Haryana. In a similar vein, few other
demonstration projects (see chapter 4) are working towards the ambitious target of achieving a
Net Zero Status.
Net zero certification
IGBC has announced to launch a net zero energy certification by mid-2017. IGBC also plans
to promote demonstration NZEBs to prove their business case and is likely to work closely with
the GoI to mainstream NZEBs in the country. This certification program by IGBC is designed to
achieve the World Green Building Council’s vision of reducing GHG emissions from buildings
to zero by converting new and existing global building stock into net zero energy buildings
(USAID, 2017).
2.3.2 Efforts for NZEB uptake in developed countries
While NZEB is seen as a new concept in a developing country such as India, many
developed nations have experimented, exhibited and endorsed the concept of NZEB as a doable
and practical solution to long term energy challenges in the building sector. Innovation and
socio-technological transformations have been showcased in building sectors in several countries
by implementation of government policies and other instruments supporting the uptake of the
NZEB concept. These ambitious targets show that the countries are making serious efforts to
transform their building sector towards low energy, low carbon and sustainable building stock.
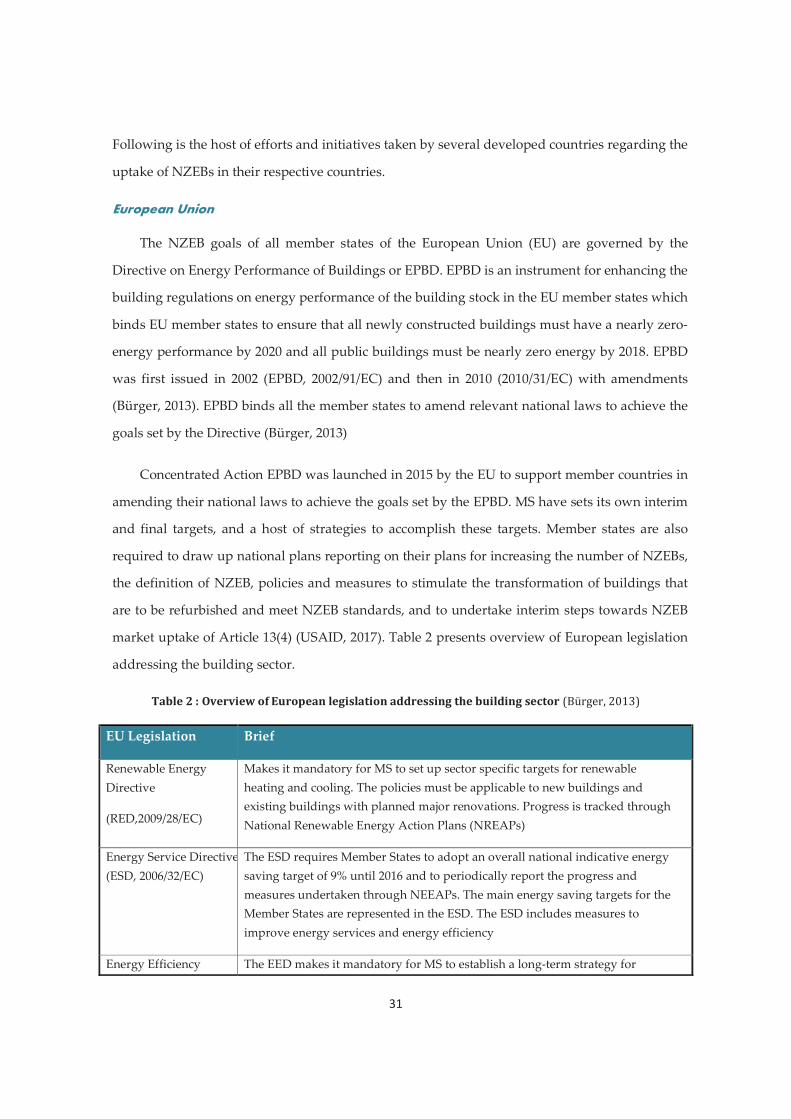
31
Following is the host of efforts and initiatives taken by several developed countries regarding the
uptake of NZEBs in their respective countries.
European Union
The NZEB goals of all member states of the European Union (EU) are governed by the
Directive on Energy Performance of Buildings or EPBD. EPBD is an instrument for enhancing the
building regulations on energy performance of the building stock in the EU member states which
binds EU member states to ensure that all newly constructed buildings must have a nearly zero-
energy performance by 2020 and all public buildings must be nearly zero energy by 2018. EPBD
was first issued in 2002 (EPBD, 2002/91/EC) and then in 2010 (2010/31/EC) with amendments
(Bürger, 2013). EPBD binds all the member states to amend relevant national laws to achieve the
goals set by the Directive (Bürger, 2013)
Concentrated Action EPBD was launched in 2015 by the EU to support member countries in
amending their national laws to achieve the goals set by the EPBD. MS have sets its own interim
and final targets, and a host of strategies to accomplish these targets. Member states are also
required to draw up national plans reporting on their plans for increasing the number of NZEBs,
the definition of NZEB, policies and measures to stimulate the transformation of buildings that
are to be refurbished and meet NZEB standards, and to undertake interim steps towards NZEB
market uptake of Article 13(4) (USAID, 2017). Table 2 presents overview of European legislation
addressing the building sector.
Table 2 : Overview of European legislation addressing the building sector
EU Legislation Brief
Renewable Energy Directive
(RED,2009/28/EC)
Makes it mandatory for MS to set up sector specific targets for renewable heating and cooling. The policies must be applicable to new buildings and existing buildings with planned major renovations. Progress is tracked through National Renewable Energy Action Plans (NREAPs)
Energy Service Directive(ESD, 2006/32/EC)
The ESD requires Member States to adopt an overall national indicative energy saving target of 9% until 2016 and to periodically report the progress and measures undertaken through NEEAPs. The main energy saving targets for the Member States are represented in the ESD. The ESD includes measures to improve energy services and energy efficiency
Energy Efficiency The EED makes it mandatory for MS to establish a long-term strategy for

32
Germany
In Germany a well-established instrument portfolio for construction of new buildings and
refurbishment of existing buildings exists. The main policy instruments are:
The energy efficiency requirements defined in the building code;
Low-interest loans and a repayment bonus for energy efficient refurbishment and new
buildings depending on the energy standard achieved;
Investment grants (existing buildings) and use obligation (new buildings) for the
implementation of RES-H; and
A variety of instruments for information and motivation as well as supply side measures.
The building codes have been adjusted (with progressive norms) five times over the past 35
years and energy demand reduction for space heating and domestic hot water has reduced from
300 to almost 65 kWh /m2 (Schimschar et al., 2011). The most recent update was in October 2009,
when the new German building code (energy saving ordinance – EnEV 2009) became effective.
To comply with the requirements of the European Commission, all newly constructed buildings
must have a nearly zero-energy performance by 2021. Interim targets are:
Reduction in the heat requirement of the building stock by 20% by 2020
Directive (EED, 2012/27/EU)
mobilizing investment in the renovation of the national stock of residential and commercial buildings, both public and private. The member states establish energy efficiency obligation schemes for energy suppliers of grid operators (commonly known as White Certificate Schemes) or alternative measures with equivalent effect aiming at providing efficiency measures that achieve energy savings of 1.5% per year in average.
Eco design Directive (2005/32/EC) and its recast (2009/125/EC)
This directive sets minimum efficiency standards for energy related technologies and materials used in the building sector (e.g. boilers, hot water generators, pumps, and ventilation)
Energy Labeling Directive (1992/75/EWG) and its recast (2010/30/EU)
The directive requires MS to establish labeling schemes for energy related technologies and materials. It includes many technologies used in the building sector.
Outreach
The European Commission has set up an online information portal, BUILD UP, to support EU member states in implementing the directive. Building sector professionals are the primary target audience for this portal.

33
Reduction in the primary energy requirement by 80% by 2050,
Aim to achieve an almost climate-neutral building stock by 2050
Table 3 presents overview of German legislation addressing the building sector.
Table 3: Overview of German legislation addressing the building sector (
German legislation Brief
Energy Saving Ordinance (EnEV)
EnEV set minimum requirements for the energy-related quality of the building shell and the system technology for both new and renovations of existing residential and non-residential buildings. These requirements are updated to enhance their stringency.
Renewable Energies Heating Act
The Act mandates use of renewable energy sources to provide heating and cooling in both residential and non-residential buildings, whether new or existing. The government supports the act through capital grants for smaller systems and low interest loans or redemption grants for larger systems
Act on the Promotionof Renewable Thermal Energy (EEWärmeG)
EEWärmeG imposes the use of renewable energies, including solar heating systems and heat pumps, in the construction of new buildings (so-called obligation to use)
PassReg Project The Passive House Regions with Renewable Regions (PassReg) project aims to promote implementation of NZEBs across 11 EU countries. An informational brochure that summarizes examples of NZEBs, approaches for municipalities toimplement NZEBs through Passiv Haus Standard program.
United Kingdom
The UK government has committed itself to a challenging CO2 emissions reduction target
for 2050. The UK’s target for all new homes to meet the Zero Carbon Standard from 2016 comes
in advance of the EPBD target for all new buildings in the EU to be ‘Nearly Zero-Energy
Buildings’ from 2020 (Zero Carbon Hub , 2014).
The country employs prescriptive energy efficiency requirements for buildings since 1976.
In 2005, following the implementation of the 2002 EPBD, the first performance-based code was
introduced. The 2010 code and related national policies have been further strengthened to reflect
the provisions of the EPBD recast. In 2007 the national government’s policy for all new homes to
be zero carbon standards from 2016 was implemented primarily through the progressive
tightening of Building Regulations. Phased introduction of zero carbon standards has already

34
begun (England); standards based on cost-effectiveness, currently cost benefit analysis and
standards are executed. Table 4 presents overview of UK legislation addressing the building
sector

35
Man
si Ja
in
Ta
ble
4: O
verv
iew
of U
K le
gisl
atio
n ad
dres
sing
the
build
ing
sect
or
UK
Leg
isla
tion
Brie
f
Zero
Car
bon
Buil
ding
s
Poli
cy
The
UK
is c
omm
itted
to e
nsur
ing
that
new
hom
es a
re z
ero
carb
on fr
om 2
016.
Fro
m 2
016
for h
omes
and
201
9 fo
r non
-dom
estic
bu
ildin
gs, a
ll ne
w b
uild
ings
in E
ngla
nd w
ill b
e re
quir
ed to
be
built
to a
zer
o-ca
rbon
sta
ndar
d. T
he p
olic
y an
d st
anda
rd h
as
cont
inue
d to
und
ergo
revi
sion
s sin
ce 2
007
to p
rote
ct e
cono
mic
and
tech
nica
l via
bilit
y an
d en
sure
thes
e re
quir
emen
ts re
mai
n ac
hiev
able
. Bu
ildin
g re
gula
tions
Part
L
Part
L o
f the
Bui
ldin
g R
egul
atio
ns se
ts m
inim
um st
anda
rds
for e
nerg
y ef
ficie
ncy
in n
ew a
nd e
xist
ing
build
ings
(it a
pplie
s to
ne
w b
uild
ing
wor
k in
Eng
land
and
Wal
es; S
cotla
nd a
nd N
orth
ern
Irel
and
have
sep
arat
e re
gula
tions
). Th
e cu
rren
t reg
ulat
ions
ca
me
into
eff
ect i
n A
pril
2014
. C
ode
for S
usta
inab
le
Hom
es (2
007)
The
code
for s
usta
inab
le h
omes
is th
e na
tiona
l sta
ndar
d fo
r the
sus
tain
able
des
ign
and
cons
truc
tion
of n
ew h
omes
. It a
ims
to re
duce
ca
rbon
em
issi
ons
and
prom
ote
high
er st
anda
rds
of su
stai
nabl
e de
sign
abo
ve th
e cu
rren
t min
imum
sta
ndar
ds se
t out
by
the
build
ing
regu
latio
ns.
Zero
Car
bon
Hub
Z
ero
Car
bon
Hub
is a
gov
ernm
ent/i
ndus
try
part
ners
hip
body
whi
ch g
athe
rs e
vide
nce
and
reco
mm
ends
app
ropr
iate
re
quir
emen
ts fo
r on-
hom
e ca
rbon
redu
ctio
ns. B
ased
on
rece
ntly
sub
mitt
ed fi
ndin
gs o
f the
Hub
, on-
hom
e ca
rbon
redu
ctio
ns
betw
een
44%
and
60%
, dep
ende
nt o
n ho
use
type
are
cal
led
for,
com
pare
d to
200
6 Bu
ildin
g Re
gula
tions
. 2n
d N
atio
nal E
nerg
y
Effi
cien
cy A
ctio
n Pl
an
(NEE
AP)
The
UK
’s 2
nd E
nerg
y Ef
ficie
ncy
Act
ion
Plan
(NEE
AP)
bro
ught
toge
ther
in o
ne d
ocum
ent a
ll th
e th
en c
urre
nt a
nd p
lann
ed
polic
ies
and
mea
sure
s the
gov
ernm
ent a
nd th
e D
evol
ved
Adm
inis
trat
ions
hav
e in
pla
ce to
impr
ove
ener
gy e
ffic
ienc
y. T
his
upda
ted
the
prev
ious
EEA
P of
200
7 an
d fu
lfille
d th
e U
K’s
obl
igat
ion
unde
r the
Ene
rgy
End-
Use
Effi
cien
cy a
nd E
nerg
y Se
rvic
es
Dir
ectiv
e (E
SD) t
o re
port
on
prog
ress
tow
ards
an
over
all n
atio
nal i
ndic
ativ
e en
ergy
sav
ings
targ
et o
f 9%
by
2016
. It w
as
supe
rsed
ed b
y th
e 20
14 E
nerg
y Ef
ficie
ncy
Act
ion
Plan
und
er th
e EU
Ene
rgy
Effic
ienc
y D
irec
tive.
N
atio
nal R
enew
able
Ener
gy A
ctio
n Pl
an
(NR
EAP)
-201
0
In th
e N
REA
P, v
ario
us ta
rget
s w
ere
set f
or U
K to
be
achi
eved
by
2020
. The
se in
clud
e:
15%
sha
re o
f ene
rgy
gene
rate
d fr
om re
new
able
sour
ces
in g
ross
fina
l ene
rgy
cons
umpt
ion
12%
of h
eat c
onsu
mpt
ion
met
by
rene
wab
le so
urce
s;
31%
of e
lect
rici
ty d
eman
d m
et b
y el
ectr
icity
gen
erat
ed fr
om re
new
able
ene
rgy
sour
ces
10%
of
ener
gy d
eman
d m
et b
y re
new
able
ene
rgy
sour
ces
(Mea
sure
s : R
enew
able
s O
blig
atio
n (R
O);
Syst
em o
f fe
ed-in
tar
iffs;
Intr
oduc
tion
of R
enew
able
Hea
t Inc
entiv
e (R
HI)

36 Mansi Jain
USA –The state of California
California’s NZEB strategies are one of its “Big Bold Energy Efficiency Strategies” to
achieve long term energy efficiency through market transformation. The NZEB policy vision,
authored by California Public Utilities Commission (CPUC), the leading implementing body for
NZEB policies in the state, specifies ultra-high energy efficiency as vital in achieving net zero
energy goals. Clean energy production and demand response is also to be encouraged to realize
net zero energy buildings (USAID, 2017).
In 2007, the CPUC adopted the approach that all new residential buildings in California
will be Energy Zero by 2020, and all new commercial buildings will be energy zero by 2030 (2007
Integrated Energy Policy Report). This commitment has been reiterated by the California Long Term
Energy Efficiency Strategic Plan in 2008. The 2013 Integrated Energy Policy laid out the steps and
renewable options for achieving the NZEB goals.
Near (2009-2011), mid-term (2012-2015) and long term (2015-2020) milestones have been
framed for timely implementation of the NZEB policy goals and to map progress toward the
overarching objectives (USAID, 2017). California has developed separate milestones for
residential and commercial buildings. By 2020, all new residential construction in California is
set to become ‘net zero energy’. By 2030, all new commercial construction and 50% of existing
commercial buildings in the state will also be net zero energy. Distinct zero energy targets are set
for federal buildings. By 2015, 15% of existing federal buildings will conform to new energy
efficiency standards and 100% of all new federal buildings will be zero net energy by 2030.
California has adopted a combination of pull and push market transformation strategies for
NZEB goals:
To catalyse improvement in energy efficient building technologies and practices by defining
aggressive interim mandatory energy efficiency goals for buildings.
The “Path to Zero” campaign to create demand for high energy efficiency buildings by
marketing campaigns, financial incentives and information dissemination on zero energy
and low energy technologies and design practices.

37
Advancement in stringency of California energy codes (Title 24) - at each triennial update
cycle, “beyond code” voluntary requirements of the preceding version are adopted as the
mandatory requirement for the updated code.
Green building ordinances adopted by the largest cities of California for large commercial
buildings.
To encourage local leadership initiatives for information dissemination on NZEB practices.
Innovative financing programs have been set up, in part through private sector funding.
2.4 Existing challenges and barriers to NZEB market development in developed countries
To realize the potential benefits of NZEBs in India, it is necessary to first overcome existing
barriers such as technical barriers, economic barriers, lack of capacity, or lack of awareness in the
country. It is evident from efforts made in developed nations for NZEB that both market
conditions and right policy interventions are needed for successful integration of NZEBs. In
addition to those who have embarked on their own efforts to look at low energy buildings, there
are several other stakeholders that need to be encouraged to join the drive and initiate transition.
Based on findings of the ZEBRA2020 project in Europe and PassREg project in Europe and North
America, there are host of barriers and challenges which have been brought to light which
hamper or pre-empt the wide scale uptake of NZEB in these nations. The ZEBRA2020 and
PassREg projects have undertaken studies to identify major barriers for market development of
NZEBs:
2.4.1 ZEBRA2020 project:
ZEBRA2020 aims at creating an observatory for NZEBs based on market studies and various
data tools and thereby generate data and evidence for policy evaluation and optimization.
European legislation (EPBD) makes NZEBs a legally binding standard by 2020. Therefore, the
key objective of ZEBRA2020 is to monitor the market uptake of NZEBs across Europe and
provide data as well as recommendations on how to reach the NZEB standard. ZEBRA2020
covers seventeen European countries and about 89% of the European building stock and
population. Thus, it is actively contributing to meeting the ambitious target of 100% share of
NZEBs for new buildings from 2020 and a substantial increase of deep NZEB renovations

38
(ZEBRA2020, 2016). The project identified a set of barriers which were observed as common
among the participating European countries (ZEBRA2020, 2016):
A need for more knowledge on energy efficient projects as well as positive examples to feed
into decisions for energy efficiency projects;
Poor end user awareness on how they are using energy in residential buildings;
Policy, regulation and standards are not established and are still developing across several
countries;
A need to understand what low energy building means in legislation for the actual building
process;
Investment cost are perceived as too high;
There is a long payback period (of 15-20 years) and residents do not stay long enough in a
house to benefit from this payback period;
There are very little financial instruments available in the EU that are aimed directly and
exclusively at supporting NZEBs;
Lack of knowledge and interest of energy efficiency among residents and building owners,
often due to lack of awareness combined with challenges and architectural and cultural
values.
Existing building structure and technical systems limit the choice of technical solutions
possible for NZEB renovations.
Findings from the market study and policy evaluation study in ZEBRA2020 show that there
is still a long way to go in establishing official national NZEB level for buildings, although most
countries have recently revised existing rules, regulations and guidelines, and facilitated means
enabling highly energy conservative buildings in accordance with the EPBD. Determined
differences in the structure of national and regional management, attitudes and economic
structures are all factors found to have both negative and positive effects on the progress and
implementation of NZEBs in the different countries. The study suggests that many countries are
poorly prepared for implementing NZEBs by 2020 and that there is a need for increased
knowledge on new technology on all levels in the building industry along with economic
incentives, building of pilot examples to follow, and utilizing the advantages that NZEBs bring
(ZEBRA2020, 2016).

39
2.4.2 PassREg project
The PassREg project investigated front runner regions which have successfully
implemented Nearly Zero Energy concepts using Passive House supplied as much as possible by
renewable energies as the foundation. The lessons learned, and the solutions applied in these
regions serve as a basis for adaptation and implementation in other regions across Europe. The
project, co-funded by the EU within the framework of the IEE and with participating regions
from ten European countries thus supports the implementation of the EPBD, recast 2010 and
makes an important contribution to the achievement of the EU’s efficiency goals for 2020
(PassREg, 2015). The project identified and highlighted the important barriers for the uptake of
the NZEB concept in developed nations in EUROPE and North America (PassREg, 2015). Some
of these are listed below in Table 5.
Table 5: Identified barriers for uptake of the NZEB Concept in Europe and America (PassREg, 2015)
Regulation and political agenda Lack of political will, motivation for transition Lack of clear direction, vision, targets & insight in progress towards vision and target Lack of stakeholder consensus Lack of knowledge with policymakers and public servants
Business case and financing Risks and benefits accrue to different parties (split incentive) Improved energy performance and non-energy benefits not recognized in appraisal process Incremental cost due primarily to (in order of importance, most common ranking) Cost of energy/carbon too low
Capacity Lack of interest, motivation to embrace PH/NZEB by end users Unfamiliarity of suppliers with PH/NZEB Resistance of suppliers/builders to change the local building tradition Lack of awareness and familiarity for design professionals Difficulty in finding trained traders and subcontractors Design-build projects lack integration; integrated design still niche, not the norm
Knowledge Insufficient knowledge base Inaccessibility of knowledge base Lack of trained personnel
Applied products Lack of suitable variety and competitive market for high performance products (whether
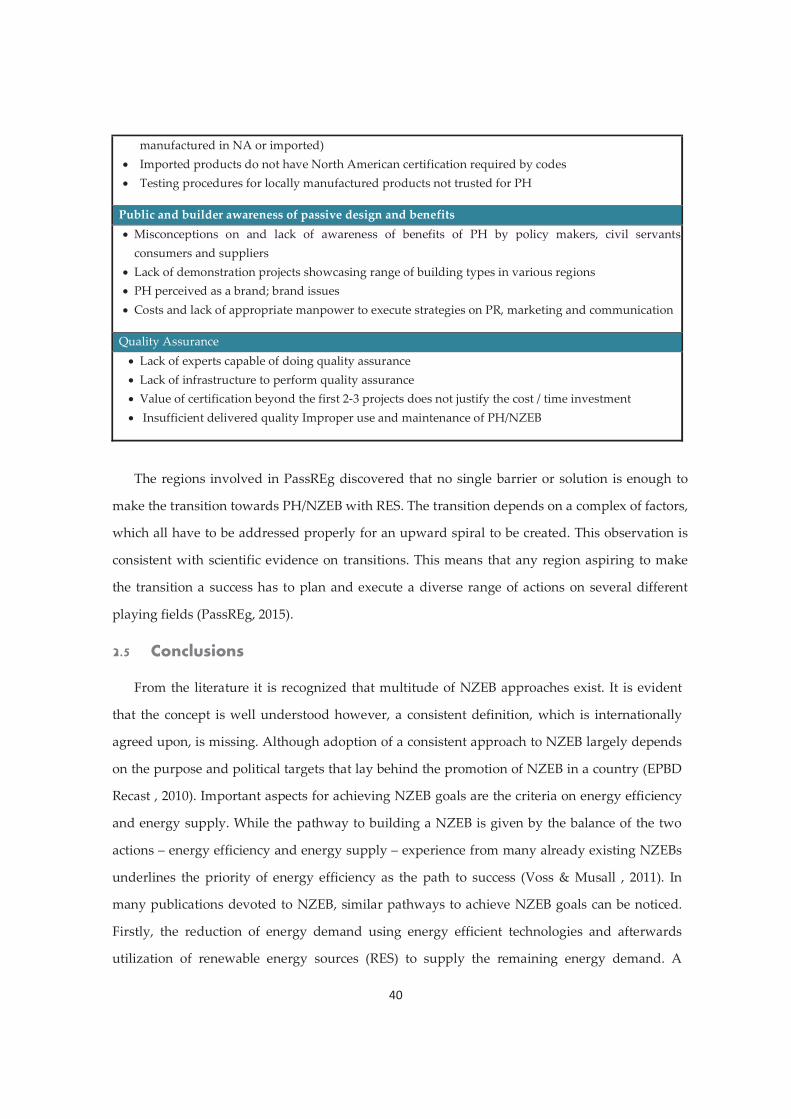
40
manufactured in NA or imported) Imported products do not have North American certification required by codes Testing procedures for locally manufactured products not trusted for PH
Public and builder awareness of passive design and benefits Misconceptions on and lack of awareness of benefits of PH by policy makers, civil servants,consumers and suppliers
Lack of demonstration projects showcasing range of building types in various regions PH perceived as a brand; brand issues Costs and lack of appropriate manpower to execute strategies on PR, marketing and communication
Quality Assurance Lack of experts capable of doing quality assurance Lack of infrastructure to perform quality assurance Value of certification beyond the first 2-3 projects does not justify the cost / time investment Insufficient delivered quality Improper use and maintenance of PH/NZEB
The regions involved in PassREg discovered that no single barrier or solution is enough to
make the transition towards PH/NZEB with RES. The transition depends on a complex of factors,
which all have to be addressed properly for an upward spiral to be created. This observation is
consistent with scientific evidence on transitions. This means that any region aspiring to make
the transition a success has to plan and execute a diverse range of actions on several different
playing fields (PassREg, 2015).
2.5 Conclusions
From the literature it is recognized that multitude of NZEB approaches exist. It is evident
that the concept is well understood however, a consistent definition, which is internationally
agreed upon, is missing. Although adoption of a consistent approach to NZEB largely depends
on the purpose and political targets that lay behind the promotion of NZEB in a country (EPBD
Recast , 2010). Important aspects for achieving NZEB goals are the criteria on energy efficiency
and energy supply. While the pathway to building a NZEB is given by the balance of the two
actions – energy efficiency and energy supply – experience from many already existing NZEBs
underlines the priority of energy efficiency as the path to success (Voss & Musall , 2011). In
many publications devoted to NZEB, similar pathways to achieve NZEB goals can be noticed.
Firstly, the reduction of energy demand using energy efficient technologies and afterwards
utilization of renewable energy sources (RES) to supply the remaining energy demand. A

41
minimum of energy efficiency requirements may be enforced in a NZEB definition. Finally, it is
argued that only a measured rating would enable the verification of claimed NZEBs, the
effectiveness and robustness of the design solutions, and finally the actual attainment of energy
policy goals (Sartori, et al., 2010). Therefore, a measurement and verification (M&V) process is
required and its completeness and complexity will be dependent on the options selected for the
definition of criteria.
As complexity surrounding the NZEB term has been addressed actively in the research
community, an increasing number of demonstration projects have also highlighted that NZEB
can be seen as a feasible endeavor with lessons learnt communicated to a wider set of
stakeholders. However, a paradigm shift is needed to mainstream NZEBs in the buildings sector,
which is sure to face abundant challenges. National and international policymakers who wish to
support the broad diffusion of net and near zero energy buildings will need to determine what
kind of regulatory framework is most appropriate, especially in a country like India. In the
meanwhile, market structures – both for public markets and in private-sector settings – are likely
to require significant adjustments for net zero energy buildings to achieve scaling. Energy
efficiency and renewable energy service providers may not be able to deliver the kind of
integrated (or bundled) efficiency and renewable energy needed to achieve NZEBs cost-
effectively. It will also be necessary to address uncertainties around performance measurement
and certification, lack of available financing instruments, insufficient information, missing
economic incentives, and a range of other issues of NZEBs are to move into the mainstream
building market.
In light of the existing barriers which inhibit potential energy savings from buildings, a single
instrument will be insufficient in bringing about the desired result in stimulating the NZEB
concept widely in Indian building sector. Therefore, it is challenging to have a ‘set’ or ‘mix’ of
instruments that cope with wide variety of barriers currently preventing NZEBs to flourish. In
fact, a bundle of instruments is required to properly address the most relevant barriers at the
same time, which would be necessary to intensify uptake of NZEB concept. In other words, a
target-specific policy package will be the most appropriate approach to address incremental
energy reductions from the building sector ( Laustsen, 2008). In addition, from policy approaches
adopted in developed countries across the world, a combination of policies (both RE and EE) is

42
proposed in various countries to exhibit techno-economically feasible NZEBs from their building
stocks (Bürger, 2013). Like for example, the EU’s Energy Efficiency Directive (EED) which since
2008 has required MS to describe co-ordinated packages of policies in their National Energy
Efficiency Action Plans (NEEAP). Similarly, market transformation of domestic appliances in
several developed countries has been achieved through a combination of minimum standards,
energy labels, incentives for the most efficient equipment, and an effective communication
campaign for end-users (Boza- Kiss, Moles, & Ürge-Vorsatz, 2013). It is fairer to state that certain
(NZEB) niche markets have been formed. However, this is still far away from achieving system-
wide market transformation.


45
3.1 Introduction
To analyze the socio-technical transformation of the building sector in India towards NZEBs,
various theoretical frameworks were explored. In this doctoral study theoretical body on
transitions and innovations, most particularly Strategic Niche Management (SNM) and
innovation theory of Sector Innovations Systems (SIS) are emphasized. To further
understanding to assess the developments and deepen our understanding of innovation and
diffusion of sustainable technologies in a given sector, an integrated approach is followed. In
addition to the SNM and SIS theories, theory on governance is also explored. In this
perspective, the Governance Assessment Tool (GAT) was identified as an important theoretical
framework to uncover restrictive and supportive conditions in a particular governance context
vis-à-vis sustainable innovation like NZEBs.
In doing so, this chapter focuses on introducing the main theoretical insights which provide
us with an analytical approach that can help answering sub-research question 1.1 What
integrated assessment framework suits best to assess NZEB niche development in India? The
integrated framework can be viewed as a theoretical concept bridging the literatures between
the academic sustainable transitions and governance traditions. This results as a starting point
for developing a research design for further empirical case studies addressing NZEB
innovations in the Indian building sector.
Following the presentation of the integrated assessment framework in this chapter, the latter
will be used in chapters 4-7 as the conceptual basis for reflective empirical analysis of separate
case studies. Hence, some of the theoretical concepts are repeated in those chapters.
3.1.1 Strategic niche management for NZEB’s: a theoretical approach
SNM can be defined as an analytical approach designed to facilitate introduction and
diffusion of radically new sustainable technologies through societal experiments (Caniëls &
Romijin, 2007). Established, commonly used technologies in society are mostly embedded into
socio- technological ‘regimes’9, and offer substantial barriers to the introduction and diffusion of
new sustainable technologies. Despite perceived high environmental and social benefits, these
9 The socio-technical regime from the ‘deep structure’ that accounts for the stability of an existing socio-technical system. It refers to the semi – coherent set of rules that orient and coordinate the activities of the social groups that reproduce the various elements of socio-technical systems (Kemp & Schot, Regime shifts to sustainablilty through processes of niche formation: the approach of strategic niche management, 1998).

46
technologies often fail to enter markets and do not become part of mainstream practices (i.e. a
‘regime’). Smith & Raven (2011) and Kemp et al. (1998) state that introduction of sustainable
technologies fails for various reasons including technology, government policies, regulatory
framework, demand and production, cultural and societal reasons, and infrastructure. The
concept of SNM was introduced by the end of 1990’s as a theoretical framework and a policy tool
to manage technological innovations and to facilitate introduction of sustainable technologies.
SNM promotes interactive learning processes by moving away from the traditional concept of
‘technology push’ and addresses lack of diffusion of sustainable technologies in society (Schot et
al, 1994; Kemp et al., 1998; Weber et al., 1999; Hoogma et al., 2002).
The focus on learning is an important aspect of SNM. Hoogma et al. (2002) claim that an
interactive learning process is instrumental for fostering long term institutional and societal
change. The concept highlights creating societal experiments for innovative stakeholders to
collaborate, exchange information, knowledge and experiences. SNM terminology defines these
experiments10 as, “unique socio-technical laboratories for learning about the problems,
shortcomings and barriers a new technology face” (Hoogma, 2000). Kemp & Schot (1998, p 64)
define SNM as, “the creation, development and controlled phase-out of protected spaces for the
development and use of promising technologies by means of experimentation, with the aim of
(1) learning about the desirability of the new technology and (2) enhancing the rate of application
of the new technology”.
Niche development and its protection from regime forces
The SNM concept advocates development of protected spaces called “niches” for certain
applications of the technology. This is done through the setting up of experimental settings
which provide a conducive environment for actors to learn about the design, user needs, cultural
and political acceptability and other aspects (Schot & Rip, 1997). A niche can be made up of one
or more ‘experiments’ with new technologies (Raven, 2005). The formation of a niche develops
an early foundation for diffusion and up scaling of innovations.
Academic literature and niche development mostly uses historical cases in Western European
countries for its empirical basis. Attention to developing countries seems to be less prominent. In 10 Weber et al. (1999) define an experimental project as the first step towards the development of a niche, and they see a niche as consisting of multiple more or less tightly coupled experimental local projects,

47
the case of NZEB integrated technology it can be stated that many Western countries have
demonstrated NZEBs and hence, fostering NZEB niche development, to exhibit integration of
energy efficiency and renewable energy technologies and reducing the energy demand of the
building stock. BRICS11 nations-, notably India, have joined the drive with NZEB demonstration
projects. In addition, these projects play a key role in highlighting the technical and economic
feasibility of the concept. However, NZEB niche development in India is in its formative stage,
and it can be stated that NZEBs have not yet developed into a (relatively) ‘mature’ niche. To
further stimulate innovation and diffusion of NZEBs, demonstration projects need to be
managed appropriately to support niche formation. The SNM framework can be used to analyze
these demonstration projects and understand the early adoption and diffusion of NZEB
technologies for wider societal acceptance.
For niches to survive, experiments are developed under special protected conditions to
support the gradual diffusion of a given new technology in real world conditions and become
economically and technologically competitive. A niche is thus able to exist because of some form
of “protection”– a set of conditions which provide a socio-technical “space” to test
“configurations that might work” (Hoogma et al., 2002; Kemp and Schot, 1998). The role of niches
is defined as, “a protective space for initiating path breaking innovations” (Smith & Raven, 2011).
In these spaces, various stakeholders can participate in the innovation process without being
subjected to immediate market pressure. Kemp & Schot (1998) define two forms of protection,
namely ‘technology’ and ‘market’ protection. Technology protection may include government
sponsorship, subsidies or tax exemptions, R&D commitment by firms, or a company’s decision
to accept higher costs or to fund a demonstration project (Hoogma, 2000; Kemp & Schot, 1998;
Weber et al., 1999). Alternatively, market protection comes from user preferences, where the
advantages of the technology outweigh the disadvantages only for specific users or in limited
locations (Kemp & Schot, 1998). Once the new technology is sufficiently established after its
initial phase of diffusion, and can survive on its own, the protection can be subsequently
removed (Lovell, 2007).
11 Brazil, Russia, India, China and South Africa - BRICS

48
The Niche formation process
Many SNM scholars explain the success or failure of a niche by analyzing interaction
between the three main niche processes, namely shaping of expectations, building social networks,
and the learning process.
a) Shaping of expectations: Promises and expectations of a new technology are important in a
niche development processes to attract attention; mainly to clarify what the benefits of the niche
will be (in our case the benefits of NZEB technology). Thus, interested actors - including firms,
users, policymakers, entrepreneurs and other relevant stakeholders - participate in niche
development processes based on hopeful expectations (Raven, 2005). These expectations are
important in the early development of a new technology to pave the way for social embedding
and for the wider learning process, particularly when its advantages are not clear. According to
Raven (2005) the process of shaping expectations is good when: a) an increasing number of
participants share the same expectations (expectations are converging into a shared vision); and
b) the expectations are increasingly based on tangible results from niche experiments.
b) Social network formation: Developing a niche may require new actors to get together and make
new social networks emerge and provide the necessary resources (like money, people, and
expertise). Mourik & Raven (2006) state that social networks are considered good when: a) the
network is broad (including firms, users, policy makers, scientists, and other relevant actors from
the science and technology domains, the policy domain, the social domain and including both
regime actors and regime outsiders); and b) when alignment within the network is facilitated
through regular interactions between the actors. Governments can play a leading role to create
such networks and articulate a vision of where a sector or society should be heading.
c) Learning Process: An interactive learning process is key to the SNM approach and is
considered important for successful innovation. According to Raven (2005),” Learning should
improve the alignment between the socio-technical configurations of an experiment”. A good
learning process is: a) broad – focusing not only on techno-economic optimization, but also on
alignment between the technical (e.g. technical design, infrastructure) and the social (e.g. user
preferences, regulation and cultural meaning) –; and b) reflexive – there is attention for
questioning underlying assumptions such as social values, and the willingness to change course

49
if the innovation does not turn out to match these assumptions. Hoogma (2002) identifies five
aspects that learning should be about: technical development and infrastructure; the user context
(i.e. user characteristics and consumer needs); societal and environmental impacts; industrial
development, and government policy and regulatory frameworks.
SNM and the role of government
SNM is predominantly a multi-actor approach, with the government’s role instrumental in
facilitating wider transitions. SNM is one of the theoretical frameworks proposed to illustrate
how governments can achieve significant, widespread technology change within well-
established socio-technical systems12 (Kemp and Schot, 1994; Schot and Hoogma, 1994; Kemp
and Schot, 1998; Rip and Kemp, 1998; Smith, 2006; Weber and Hoogma, 1998). To stimulate a
broader shift towards sustainable development an integral combination of technological
progress and system-wide social-institutional transformation is needed. Economic sectors are
said to become more sustainable with governments using the SNM model to catalyze
fundamental system wide change (Lovell, 2007). A socio-technical system is, however, slow to
change. This is often due to technological lock-in13 (Schot and Hoogma, 1994; Unruh, 2002) and
path dependency’ (Phillimore, 2001). However, governments can play a defining role to
transform the existing system by facilitating the process of niche formation and setting up a set
of successive experiments, or by implementing policy instruments that support niche
development, e.g. subsidy schemes, regulatory exemptions, or programs that include pilot
projects.
In multi-actor process other innovative stakeholders, including NGOs, citizens’ groups,
private companies, industrial organizations or independent individuals, and knowledge
institutions such as universities, are in the position to initiate and run niche projects. According
to Schot and Hoogma (1994) niches may fail even when governments take the full responsibility.
However, governments are still seen as the main actor involved in the management of niches
and can facilitate diffusion of innovations. This can be done by supporting up scaling of
successful experiments, through sponsorship or macro-policies (like changes in the regulatory
12Socio-technical systems consist of a cluster of elements, including technology, regulation, user practices and markets, cultural meaning, infrastructure, maintenance networks and supply networks (Malerba F. , Sectoral Systems of Innovation, 2004) 13 Technological Lock-in: where agents continue to employ an existing technology even though potentially more productive technologies can be found (Kemp & Schot, Regime shifts to sustainablilty through processes of niche formation: the approach of strategic niche management, 1998)
50
framework and the use of fiscal incentives). For demonstration projects to realize their full
potential, they should be linked to long term strategies for structural change involving policy
makers. After the initial stages of niche development, the SNM process usually expands to
include policies for diffusion, and for exploring structural change through system innovation
(Hoogma, 2000).
Theoretically speaking the mainstreaming NZEBs in the Indian building sector would
require a SNM approach. This would be required to analyze the past developments (of on-going
and completed NZEB demonstration projects) and evaluate the status of the NZEB niche in the
country. The SNM framework can be used by researchers as a research framework to address
the factors and conditions which determine whether the NZEBs niche will be a success or a
failure in the country. Although, in spite of many promising aspects of SNM, it has not yet
succeeded in linking theory with action and provides limited concrete ‘management principles’.
Theoretical concepts of SNM can be used to design an assessment tool for niche development
policies. SNM is so far been used as an ex-post analysis to inform policy makers about options
for future sustainability policies. Very few evidence, or cases have been documented with ex-
ante analysis (Hoogma et al, 2002; Kemp & Schot, 2008).
3.1.2 Sectoral innovation systems – an innovation perspective
Innovation is considered a key condition to foster structural change. Interactive and
learning processes among a wide variety of actors are necessary for innovation, thus making it
more of a collective process (Edquist, 2005). An innovation system can be seen in networks of
organizations, people and institutions within which the creation, diffusion and commercial
exploitation of new technologies and other types of knowledge takes place (Malerba F. , 2004).
The very concept of Sectoral Innovation Systems (SIS) has been developed to capture and
understand the relations between producers, users, institutions and governments (Lundvall,
1992; Edquist, 2005). It is argued that the rate and type of innovation greatly differ across
different sectors, which is mainly dependent on the characteristics of the economic sector to
which it belongs. Sectors differ along several dimensions related to technology, production,
innovation and demand. They also differ in the type and degree of change (Malerba F. , 2002).
A sector is defined as a set of activities which are unified by some related product groups
(e.g. buildings) for a given or emerging demand, which share some basic knowledge (Malerba F.

51
, 2005). A sectoral system of innovation (and production) is composed of a set of agents carrying
out market and non-market interactions for the creation, production and sale of sectoral products
(Malerba F. , 2004). Similarly, innovation in the building sector can be defined by interactions
between the main stakeholders involved in the process of design, construction, operation and
renovation of buildings. The SIS gives a specific meaning to the concept of the ‘structure’ of a
sector, which relates to the links and relationships among agents, knowledge, products and
technologies (Beerepoot, 2007). In the sectoral system of innovation, the term structure is also
referred to as ‘networks’ (Malerba F. , 2005). The SIS literature emphasizes on how the
characteristics of a sector determine the scope of innovation within that sector (Beerepoot &
Beerepoot, 2007). This innovation framework helps in understanding the agents and their
interactions, learning and innovation process specific to a particular economic sector (Beerepoot,
2007).
Building blocks of the sectoral innovation system framework
The SIS framework can be described as the collective emergent outcome of the co-
evolutionary interactions between the core building blocks of a sectoral innovation system
(Malerba, 2002, 2004, 2007). These core building blocks are composed of: knowledge and technology,
actor and networks, and institutions. In line with Malerba’s key concept, Geels (2004) adds that the
SIS approach needs more attention to the demand side. He mentions that most attention is mainly
directed towards the study of development of knowledge and suggests that it should also
address the diffusion and application of technology and its impact on society (Geels F. , 2004).
Faber and Hoppe (2013) elaborated the SIS framework and used it to assess sustainable energy
transitions in the Dutch construction sector. They define building blocks of the Dutch built
environment sector under four core dimensions: knowledge and technology, actors and networks,
institutions and market demand (as a fourth building block) (see figure 6).
a) Knowledge and technology: Any sector could be characterized by a specific knowledge base,
technologies and inputs. The main characteristics of the knowledge base are the nature of
knowledge (generic vs. specific, complex vs. simple, tacit vs. codified, independent vs. systemic)
and the means of knowledge dissemination ( Faber & Hoppe, 2012). Technologies are generally
developed in a specific socio-technical context made up of tacit and explicit knowledge, sunk
costs, learning conditions, complementarities and interdependencies (Dosi, 1982; Nelson and

52
Winter, 1982; Malerba and Orsenigo, 1997). Knowledge and technology places the issue of
sectoral boundaries at the center of analysis (Malerba F. , 2004).
b) Actors and networks: Interactive processes are of key importance to innovation. Therefore,
actors and networks are a major driving force towards sectoral change. Any sectoral system
analysis, therefore, involves an overview of the main agents in the sector, including their
interactions and formal as well as informal networks. Agents include individuals as well as
organisations, which interact through processes of communication, exchange, cooperation,
competition and command (Malerba F. , 2004). Agents are characterized by specific learning
processes, competencies, beliefs, goals, organizational structures and behaviors ( Faber & Hoppe,
2012). Faber and Hoppe (2013) differentiate agents as primary agents and secondary agents.
Primary agents are those (key) actors who perform core innovative activities, experiments and
capacity building. Secondary agents account for the supporting measures that, for example, have
to do with knowledge diffusion, provision of financial support, formulation and implementation
of regulations, and (legal) counselling. Connections such as relationships, collaborations,
resource exchange or social ties between the actors can be described as a network of formal and
informal relations and interactions ( Faber & Hoppe, 2012).
c) Institutions: Institutions include various formal and non-formal rules, such as values, routines,
common habits, established practices, laws and standards, which all shape cognitions and
actions of agents, as well as the interactions between agents (Malerba, 1999, 2004). Formal
regulations refer to ‘the formal rules of the game’, including rules, laws, monitoring and
sanctioning. Informal institutions describe the rules that provide legitimacy to individual
practices by reference to values, responsibilities, obligations, shared conceptions or common
beliefs (Scott, 1995). Faber & Hoppe (2013) suggest that informal institutional dimensions may be
influenced by shared visions and patterns of thinking. Shared visions can give rise to shaping of
expectations, which is considered a primary process of niche formation of a new technology
based on strategic niche management (Schot & Geels, 2008).
d) Market demand: Demand stems from private preferences of end consumers mostly revealed by
actual consumer choices. However, various scholars in evolutionary economic approaches claim

53
that the variety of preferences for both consumers and producers stems from asymmetry in
information or skills, constraints in opportunity, or heterogeneity of intrinsic motivations
(Malerba F. , 2005). A large diversity of preferences gives rise to market fragmentation and,
hence, increase the opportunity for radically new technologies to enter the niche market. Such
niches could be stabilised by the experimental users themselves or by governmental support to
allow environmental technologies to mature in protected niche markets, a notion that has been
recognised in the policy concept of strategic niche management (SNM) (Schot & Geels, 2008).
Many studies emphasize that government (or policy-making and implementation of
policies by public bodies) ought to play an important role in innovation systems and that
government regulation should provide an incentive for innovation. The most common reason
for government intervention is market failure in achieving socially desirable objectives
(Beerepoot & Beerepoot, 2007)
Figure 6: Dimensions of sectoral patterns of environmental innovations
Innovation and the role of governments
Many studies emphasize that government (or policy-making and implementation of
policies by public bodies) ought to play an important role in innovation systems and that
government regulation should provide an incentive for innovation. The most common reason

54
for government intervention is market failure in achieving socially desirable objectives
(Beerepoot & Beerepoot, 2007)
Governments can support and facilitate innovation in various ways. This can be done
through various support schemes (e.g. funding public research institutes, or R&D subsidies) or
government regulation (i.e. legal norms and standards). Traditional innovation policies have
been designed to provide public resources for R&D and increase the incentives for firms to
innovate, typical examples concern tax breaks for R&D, innovation subsidies and patents
(Edquist, 2005). However, in the modern context, government innovation policies also need to
deal with system imperfections (Smith, 2006) The SIS approach provides a good starting point
for understanding what stakeholders are involved and how effective public policies are, as
innovation policy should be sensitive to sectoral distinctions (Beerepoot & Beerepoot, 2007). It
can be considered a useful analytical concept to study scale adoption and diffusion of NZEBs, for
it requires innovation of new sustainable technologies. For this study (i.e. a focus on one
particular sector – building sector for NZEBs), the SIS is the most convenient framework for
analysis.
3.2 Integrated assessment framework for NZEB niche development
3.2.1 Comparing SNM and SIS
The theoretical frameworks of SNM and SIS share many commonalities. Although both
frameworks were largely developed independently, as SNM derives from transition theory (in
particular the Multi-Level Perspective (Geels F. , 2004) and SIS from the innovation systems
paradigm, both have roots in evolutionary economics. The two frameworks explain innovation
phenomena based on common conceptual grounds (Markard & Truffer, 2008). As observed in
the previous sections, it is evident that both frameworks highlight and focus on the importance
of actor networks for successful innovation and diffusion processes.
In the SNM framework, social network formation takes place where new networks emerge
during the early niche formation process, whereas in SIS, interaction of existing regime actors is
highlighted as the key determinant for long term transformation and successful innovations. In
addition, actor networks in both frameworks simultaneously influence the niche development
process and sector level innovations. New social networks from the SNM approach provide one
55
or more platforms for shared visions and the shaping of expectations of where innovations and
economic sectors are heading. Thus, the niche formation process provides insights for
prospective innovation dynamics both at the niche and the sector level. Shared visions and
expectations also influence informal institutions (in the SIS framework) at the sector level, such
as values, habits, routines, responsibilities, shared conceptions, and sometimes may also resist
niche formation processes. Similarly, the learning process of the SNM approach highlights the
aspects of technology development and user context, both complementing the two important
building blocks of the SIS framework, in particular knowledge, technology, and market demand.
In both SNM and SIS they relate to the concept of transformational change due to stimulating
improved co-evolutionary alignment between technical and social aspects.
Despite vivid clarity in commonalities there are subtle differences between the two
frameworks. Mild differences are found at the level of aggregation. In SNM, niches have a low
level of aggregation of actors largely due to the development of innovation networks and
attention towards single technology. Therefore, the efforts by actor networks at the niche level
are typically devoted to fostering niche development of one single innovation (a technology that
is said to have the potential to radically upset and replace an existing regime). In comparison, in
the SIS framework the level of aggregation can be mapped from medium to high due to many
actors from both the niche and regime being part of the innovation process. However, we
assume that there is much more interaction between niche- and regime actors in SIS than in the
case of SNM.
In addition, the SNM framework focuses on radical innovations whereas the SIS
framework does not specifically make any distinction between radical and incremental
innovations (Meleen & Farla, 2013). Considering the wider sectoral context, SIS studies tend to
stress on (socio-technical) regimes. Moreover, it is inclined towards incremental rather than to
radical innovations. In recent SIS frameworks, the role of end users and market demand
(creation of market demand for innovations) has received considerable attention, and therefore
has been included as a (one of the) building block(s) in the SIS framework ( Faber & Hoppe,
2012). However, in the SNM approach such attention is highlighted to a lower extent, and only
as part of the learning process, where user context and user preferences are briefly discussed.

56
However, special consideration toward the market demand aspect has not received enough
attention (Jain, Hoppe, & Bressers, 2014).
The SIS (or Technological Innovation System) and SNM frameworks represent different
perspectives on how processes of innovation and socio-technical transformations develop
(Markard & Truffer, 2008). Considering the commonalities and differences between the two
frameworks, there is a need to further understanding on how they can complement and
compensate each other’s limitations. For this reason, we have attempted to develop an integrated
framework to bridge the gap between the two frameworks in innovation and transition
literature. This integration will further support the development of an assessment framework for
assessing the status quo of a given (radical) niche development within a sectoral innovation
system (i.e. NZEBs in domestic construction sectors).
The integrated assessment framework might offer benefits which might reach beyond their
respective limitations. Thus, integration of the frameworks should provide us with a new
analytical approach to study niche development processes and further understanding in the
innovation and diffusion processes of technologies within economic sectors (hence, a sectoral
part of the regime level). In the integrated framework, we develop independent components
which help as building blocks to understand or assess sectoral niche development processes. The
building blocks are: shaping of expectations, actor networks, institutions, learning process and market
demand. They form the core building theoretical blocks to analyze the transformative processes of
economic sectors. Conceptually speaking, the framework addresses developments in both the
niche and sectoral regime level.
The five components are mutually exclusive, but there are evident relations between them.
When using the framework for assessing development and diffusion of sectoral innovations the
five components will independently be used for assessing innovations and the growth of a new
niche, but they are likely to show interdependencies; the one influencing the other (e.g. an actor
network shaping expectation concerning a potential innovation that has the potential to upset a
socio-technical regime). We envisage the use of the framework to assess empirical cases (in this
doctoral study this is the NZEBs in the Indian buildings sector). This allows for assessing a case
per theoretical component, but also helps to identify potential mutual dependencies between the
components. We expect that these components jointly influence the niche development, and

57
Actor network and interactions
Shaping of expectations
Institutions
Learning process
Market demand
Integrated framework Sectoral System Innovation
Framework (SSIf)
potentially upset and replace existing sectoral socio-technical regimes. The integrated framework
forms the basis of our research. This framework forms the basis for development of an Integrated
Sectoral System Innovation Assessment Framework (SSIAf). Figure 7 presents a graphical
overview of the Integrated Sectoral System Innovation Framework (SSIf). Table 6 presents an
overview of the key theoretical components of the assessment framework. For each component
(or cluster of components) the key conceptual items are presented.
Figure 7: The Integrated Sectoral System Innovation Framework (SSIf)
Table 6: Integrated assessment framework (Sectoral System Innovation Framework-SSIf)
Framework Description Shaping of expectations
a. Shared visions (converging into shared visions for niche development). b. Expectations held by regime actors (how do they see market
development?). c. Expectations based on tangible results from niche experiments.
Actor networks and interactions
a. Size of the sectoral actor network (including both primary agents and secondary agents, and both regime insiders and regime outsiders).
b. Formal and informal interactions. Institutions
a. Formal institutions (e.g., rules, laws, regulations, monitoring). b. Informal institutions (e.g., values, responsibilities, obligations ).
Learning process
a. Broad learning (e.g., technology and knowledge, techno-economic optimization, technical and social alignment, knowledge dissemination).
b. Reflexive, self-governance (with flexibility to change course). Market demand a. Requirements and preferences.
b. Heterogeneity. c. The role of niche markets. d. Market structure, size and segmentation.

58
3.2.2 A comprehensive policy oriented ‘failure’ framework for transformative change
In the previous section, we combined the strengths of the two independent frameworks of
SNM and SIS, into one integrated framework that forms the basis of a new assessment
framework of niche development in economic sectors. In addition, both concepts could also
serve as foundations for policies aiming to evoke radical transformative change. Weber &
Rohracher (2012) combined the insights from innovation system and transition theory to develop
a comprehensive ‘failure’ framework to legitimize innovation policies intervention for
transformative change without ‘unifying ‘these approaches. This extended framework of failures
allows for a policy–oriented integration of innovation systems with the complementary
transition theory concepts. The ‘failure’ framework supports the idea of market failures (Arrow,
1962) and system failures (Woolthuis, Lankhuizen, & Gilsing, 2005) which legitimize current
innovation polices, alongside addressing the lack of strategic and transformative operation of
these polices in terms of additional failures that innovation polices should also address (Weber &
Rohracher, 2012) .
We discuss system failures to understand innovation-oriented policies that aim to innovate
economic sectors. System failure can be categorized into four types of failures (Woolthuis,
Lankhuizen, & Gilsing, 2005):
Infrastructure failure, i.e. lack of existing physical and knowledge infrastructures needed to
enable innovation activities along with low return on investments for private investors.
Institutional failure, for which hard and soft failures are distinguished. The former refers to
formal institutional mechanisms that hinder innovation (e.g. regulations, standards,
legislation), whereas the latter relates to matters of political and socioeconomic cultures, social
norms and values.
Interaction or network failure, for which weak and strong failures are identified. Strong network
failure arises when interactions are too dense to allow for novel insights or inspirations to
emerge. Weak interaction failure exists when there is too limited exchange with third parties,
thus inhibiting interactive learning and ultimately innovation.
Capabilities failure, which refers to the absence of the necessary capabilities to adapt to new
and changing circumstances and (technological) opportunities. Capabilities failure also

59
captures the systemic problem of path-dependency of firms due to their inability to absorb
new knowledge.
From the perspective of transformative change, well established system failures arguments
are still valid to justify policy intervention, but they are too restrictive and leave out several
important instances of failure (Weber & Rohracher, 2012). Alongside system failures Weber &
Rohracher (2012) introduced four additional types of failures to broaden the analytical scope
and further the understanding of transitions. The following transformational failures attempt to
adopt the requirements for goal oriented transformative change.
Directionality failure highlights a lack of shared vision regarding the direction of
transformation process, inability of collective coordination of distributed agents involved in
shaping systemic change, insufficient regulation or standards to guide and consolidate the
direction of change, and a lack of targeted funding for research, development and
demonstration projects and infrastructures to establish corridors of acceptable development
paths.
Demand articulation failure concerns insufficient spaces for anticipating and learning about
user needs to enable the uptake of innovations by users, the absence of orienting and
stimulating signals from public demand, and a lack of demand-articulating competencies.
Policy coordination failure concerns a lack of multi-level policy coordination across different
systemic levels, a lack of horizontal coordination between research, technology and
innovation policies on the one hand and sectoral policies (e.g. transport, energy, and
agriculture) on the other, a lack of vertical coordination between ministries and
implementing agencies leads to a deviation between strategic intentions and operational
implementation of policies; no coherence between public policies and private sector
institutions, and no temporal coordination resulting in mismatches related to the timing of
interventions by different actors.
Reflexivity failure concerns insufficient ability of the system to monitor, anticipate and
involve actors in processes of self-governance, a lack of distributed reflexive arrangements
to connect different discursive spheres, to provide spaces for experimentation and learning,
and no adaptive policy portfolios to keep options open and deal with uncertainty.

60
The comprehensive ‘failure’ framework expresses the importance of innovation policies and
helps to extend the innovation system framework to make it more robust in changing policy
environments. The proposed framework also offers advantages to transition theory by
connecting them to prevailing models for legitimizing policy interventions. Governments play
an important role in the policy making and implementation process. Therefore, we consider
incorporation of conceptual notions from Weber and Rohracher ‘failure’ framework (2012) in
our integrated assessment framework as instrumental in understanding and assessing the role
of government and policy in niche development processes and sectoral innovation systems.
Weber & Rohracher (2012) claim that the framework needs to be tested in practice as a
support instrument for policy development and suggest consolidating the theoretical
underpinnings of the framework. Therefore, we assume that integration of transition theory and
innovation systems approach would be needed. To do this we attempt to consolidate the
‘failure’ framework of Weber & Rohracher (2012) in our integrated assessment framework (SSIf)
(see table 7). This will broaden the scope of this framework by not only preparing it to assess a
given niche’s status quo, but also making it useful to provide insights for policy strategies based
on Weber and Rohracher ‘failure ‘framework (which was also developed to assist policy
makers).
Table 7: Comparing the integrated sectoral system innovation assessment framework with Weber and Rohracher Failure Framework (2012)
Components Assessment criteria Failure framework Shaping of expectations
a. Niche actors sharing the same expectations (converging into shared visions).
b. Expectations of regime actors. c. Expectations are based on tangible results
from transition experiments.
Directionality failure
Actor networks and interactionsns
a. The network is broad (primary agents and secondary agents).
b. Formal and informal interactions.
Interaction or network failure
Institutions
a. Formal institutions (e.g., rules, laws, regulations, monitoring).
b. Informal institutions (e.g., values, responsibilities, obligations).
Institutional failure Policy coordination failure Infrastructure failure
Learning process
a. Broad learning (e.g., technology and knowledge, techno-economic optimization, technical and social alignment, knowledge dissemination).
Capabilities failure

61
b. Reflexive self-governance (flexibility to change course).
Reflexivity failure
Market demand a. Requirements and preferences. b. Heterogeneity. c. Role of niche markets. d. Market structure, size and segmentation.
Demand articulation failure
3.3 Governance
The concept of "governance" is widely used, both in practice and in policy science literature,
with a great variety of meanings (Rhodes, 1996; Bressers and Kuks, 2003, Pierre and Peters,
2000; Milward and Provan, 1999). Several authors have defined governance. The term generally
refers to the way in which collective impacts are produced in a social system. Stone (1989)
conceptualizes governance as, “creating the capacity to act” by bringing together the resources
required to accomplish the collective ends of society. In the early 1990s, the term ‘governance’
or ‘new governance ‘arrived as a conceptual alternative for traditional top-down modes for the
ways in which society was governed. Wamsley (1990) defines governance as the use of
authority in providing systemic steering and direction, and stands for ‘choosing, prioritizing,
directing and steering’. In addition, Rhodes (1997) refers governance to self-organizing, inter-
organizational networks’. Later Lynn et al. (1999) defined governance as “a regime of laws,
administrative rules, judicial rulings, and practices that constrain, prescribe and enable
governmental activity”.
Milward and Provan (1999) conceptualized ‘governance’ as creating the conditions for
ordered rules and collective action, often including agents in the private and non-profit sectors,
as well as within the public sector. In this perspective the essence of governance is its focus on
governing mechanism - grants, contracts, and agreements – that do not rest solely on the
authority and sanctions of governments. In combining insights from scholarly work on
governance (Bressers & Kuks, 2003) define governance in terms of the combination of the
relevant multiplicity of responsibilities and resources, instrumental strategies, goals, actor-
networks and scales. As a context, governance, to some degree, restricts and enables actions and
interactions in a certain part of society (Bressers, et al., 2013). For example, the organizational,
legal, financial and political aspects of a supportive context encourage the application of
technical solutions as well as collaborative management does.

62
3.3.1 Governance assessment tool
The GAT was developed as a descriptive model to assess the quality of governance in a
specific context. The basis for the tool was a collection of insights on governance as developed
by Bressers and Kuks (2003, 2004), and has a background in the Contextual Interaction Theory
(CIT) (Bressers & Kuks, 2004). CIT is an elaboration of more than 30 years’ scholarly work on
policy implementation theory and is designed to explain policy implementation processes and
outcomes and helps to understand the governance of a certain part of society (De Boer et al.,
2013). The GAT helps to assess and identify the strong and weak points in the governance
context when it comes to enabling and supporting collaborative and adaptive management in
practice. The tool predominantly draws attention to understanding of existing situations that
can obstruct policies and projects under complex and dynamic conditions (Boer & Bressers,
2011). Thus, it is of interest to us to incorporate the assessment tool into niche development
process to deepen our understanding of transitions and innovations of niche developments
while taking the complex governance context into account.
The dimensions of the Governance assessment tool
The GAT introduces five aspects of governance. It can be seen as a conceptual ‘check list’ to
describe all relevant aspects of the governance context. Table 8 provides an overview of the
governance dimensions that together describe a governance structure by developing further
elaborative questions. This context influences the motivations, cognitions and resources of the
stakeholders (as described in CIT) (Boer & Bressers, 2011). In GAT governance is no longer
considered an extension to public policies. Moreover, policies are no longer assumed to be
developed by one central actor only (nor are only one target group assumed). Interactions
between different actors and networks at multiple levels contribute to developing policies (Boer
& Bressers, 2011). However, actors have diverse perspectives, ambitions; strategies, instruments,
resources and responsibilities. Hence, the five developed dimensions of governance are useful
to assess the governance context regarding a particular aspect. Figure 8, presents the five
interrelated dimensions of governance that are central to GAT.

63
Figure 8: Five interrelated dimensions of governance (Bressers et al., 2013)
Table 8 : The five dimensions of governance (Bressers et al., 2013)
Levels and scales (not necessarily
administrative levels)
Governance assumes a general multi-level character of all
other dimensions.
Actors and networks Governance assumes the multi-actor character of the
relevant network(s).
Problem perspectives and goal ambitions Governance assumes the multi-faceted character of the
problems and ambitions.
Resources and organization (tasks and
responsibilities) of implementation
Governance assumes the complex multi-resource basis for
implementation.
Strategies and instruments Governance assumes the multi-instrumental character of the
strategies of the actors involved
The five dimensions provide a clear overview of the governance context (or contents of a
governance regime in a certain area with certain issues) (see table 8). To understand how a
governance context enables or restricts actions and interactions, the model was complemented
with four quality criteria: extent, coherence, flexibility and intensity (Boer & Bressers, 2011). The
governance dimensions and qualities together form the core of GAT. According the Bressers et
al. (2013) these qualities can be generally understood through posing of the following four
questions:
Extent: Are all relevant aspects for the sector or project that is focused on taken into account?

64
Coherence: Are the elements of the dimensions of governance reinforcing rather than
contradicting each other?
Flexibility: Are multiple roads to the goals, depending on opportunities and threats as they
arise, permitted and/or supported?
Intensity: How strongly do the elements of the governance context urge and support changes
in the status quo or in current developments?
Figure 9 : Example of visualization of governance context diagnosis in score card adapted from De
Boer et al, 2013
These dimensions and related questions can be used to follow up the first descriptive step
and enable a more in-depth picture of the governance setting. Figure 9, represents the ‘score
card’ that is used to asses existing governance settings where the arrows going up show that the
present situation is changing positively or will change in the foreseeable future; whereas the
arrows going down represent the present situation is changing negatively or will not improve
in the foreseeable future. The stable ‘=’ sign means that the status quo or business as usual
remains as it is, and no change is expected in the foreseeable future (Bressers et al., 2013).
The GAT and NZEB niche development
The GAT provides us with a vision towards current and possible future pathways for
governance context. This can be helpful to reflect upon, assess or evaluate (like any other policy)
the introduction and innovation diffusion of NZEBs in Indian building sector. Using GAT for an
assessment will provide insights to the current governance context of NZEB demonstration

65
projects and NZEB niche development in India at large. The assessment can highlight the
challenges in the governance regime which might obstruct or slow down the introduction and
diffusion of NZEB in a new niche, but may also help to identify potential drivers to spur NZEB
niche development as well as the innovations. In addition, the results can be used to make a
holistic ex-ante evaluation of how the governance context can influence collaborative
management of the NZEB niche development process.
Thus, it will be interesting to use GAT to understand and assess the governance context in
the building sector in India vis-a-vis NZEB niche development. It will also be of theoretical
interest to use the GAT in a way that allows for assessment of niche development of sustainable
innovations (like NZEBs). This is rather novel since the beginning of this doctoral thesis GAT
was not used thus far to assess developments and diffusion of sustainable innovations in the
built environment, nor in the topical field of energy. However, recently few publications have
emerged which use GAT in energy (Jain, Hoppe, & Bressers, 2017). The challenge to use GAT in
this way, however, urges us to rethink how to incorporate key theoretical notions of SNM and
SIS. In the next section we will further explore integration of GAT with these two frameworks.
Comparing the integrated assessment framework with GAT
The integrated SSIAf provides us with an analytical approach to assess niche developments
and further understanding of innovation and diffusion of sustainable technologies in a given
economic sector. Simultaneously, GAT helps us to advance understanding of the quality of
governance in a given context (e.g., governance of NZEB niche developments in the Indian
building sector, or governance of water systems in the Dutch Twente region), or identification
of barriers to implementation of a given policy. Combining insights from the two concepts
allows for broadening the scope and furthering the understanding of long term sustainable
transitions, sectoral innovations, implementation of transition–oriented policies, and assessment
of the role and state of ‘governance’ in niche development processes in sectoral systems.
In both the SSIAf and GAT assessment frameworks, actors and their networks are highlighted
as important drivers for innovations and for assessing the governance context in which
innovations evolve. Therefore, we believe that evaluating and assessing actors (and actor-
networks) interactions forms a critical part of integrated assessment framework. As social
interaction processes in multi-actor arenas are mostly driven by actors involved, these

66
interactions form a central stage in the theoretical basis that is key to the integrated assessment
framework. Thus, the interaction process is considered as an ultimate driver for niche
development, sustainability transitions and innovation. In this sense we believe actor-networks
be the key units of analysis in SSIAf, because they form the key social configuration in which
other important drivers for SSIAf occur, such as shaping of expectations, perceptions and goals,
informal and formal institutions, market demand and ultimately structural driver that influences
learning processes.
Although learning processes, as mentioned in SSIAf do not specifically reflect any direct
complementary to GAT, there might be reasons to think there is. Learning can be viewed as
resulting from actor interactions (e.g. sharing knowledge or experience, diffusion of beliefs,
facing problems and jointly solving them) and therefore can be seen as an implicit component of
GAT. It is also of key importance to understand that actor interactions will lead to wider social
learning as elaborated by Reed et al. (2006) stating that social learning can occur through actor
interactions, which may lead to changes at the individual level and may sometime go beyond
the individual level (Kruijf, Bressers, & Augustijn, 2014). Thus, social learning can be implied as
a process facilitated by creating interactive settings in which actors can share and reflect upon
different perspectives, experiences and types of knowledge (Schusler, Decker, & Pfeffer, 2003).
Moreover, from a policy–oriented perspective one learns that policy change often
results from policy–oriented learning (due to new cognitive and scientific insights, or external
macro events hat prompt policymakers to adapt policy strategies to new circumstances and
hence ‘force’ learning upon actors or learning from discursive conflicts that follow different
advocacy coalitions fighting each other in decision-making arenas (Sabatier, 1988). De Boer and
Bressers (2011) elaborate that as projects are extended over a considerable period this may
provide windows of opportunity for wider technical and social learning resulting from the
dynamics in the variation of specific actors (with specific actor characteristics), may cause
changes in the setting of the interactions. The confluence of the key building blocks of GAT
result in or can be seen as a process of interaction resulting in a learning process which can be
explored further as technical and knowledge development, infrastructure, techno-economic
optimization, technical and social alignment (user context), environmental impact and
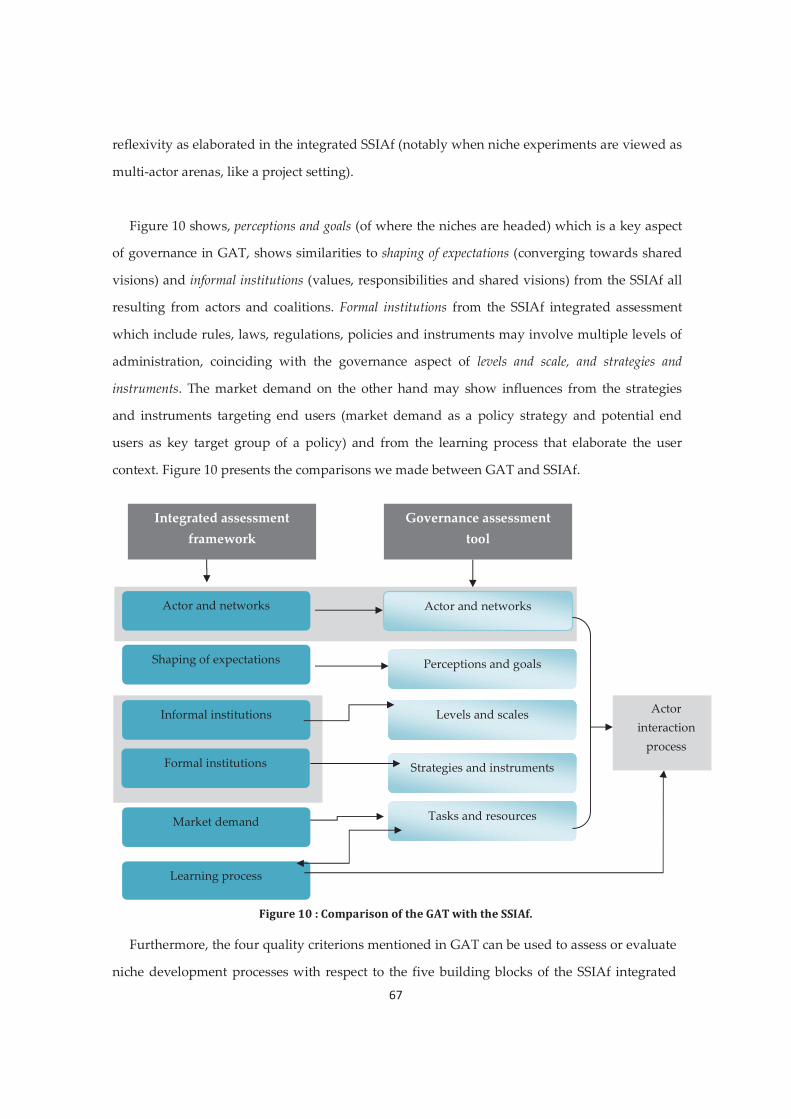
67
reflexivity as elaborated in the integrated SSIAf (notably when niche experiments are viewed as
multi-actor arenas, like a project setting).
Figure 10 shows, perceptions and goals (of where the niches are headed) which is a key aspect
of governance in GAT, shows similarities to shaping of expectations (converging towards shared
visions) and informal institutions (values, responsibilities and shared visions) from the SSIAf all
resulting from actors and coalitions. Formal institutions from the SSIAf integrated assessment
which include rules, laws, regulations, policies and instruments may involve multiple levels of
administration, coinciding with the governance aspect of levels and scale, and strategies and
instruments. The market demand on the other hand may show influences from the strategies
and instruments targeting end users (market demand as a policy strategy and potential end
users as key target group of a policy) and from the learning process that elaborate the user
context. Figure 10 presents the comparisons we made between GAT and SSIAf.
Figure 10 : Comparison of the GAT with the SSIAf.
Furthermore, the four quality criterions mentioned in GAT can be used to assess or evaluate
niche development processes with respect to the five building blocks of the SSIAf integrated
Tasks and resources
Actor and networks
Shaping of expectations
Informal institutions
Formal institutions
Learning process
Market demand
Actor and networks
Perceptions and goals
Levels and scales
Strategies and instruments
Actor interaction
process
Integrated assessment framework
Governance assessment tool

68
assessment framework. For example, actor interactions, expectations, market demand,
institutions and learning process can all be evaluated using the four quality criteria to
understand the overlap with the GAT framework. However, the validity can be further
elaborated based on the future empirical research.
3.4 Conclusions
In this chapter an integrated assessment framework was developed to assess niche
development in energy innovations, in particular NZEBs in the Indian building sector. In doing
so, we looked at two theoretical frameworks relevant to system innovations (SNM and SIS) and
identified complementary aspects in these frameworks for assessing the innovation and
diffusion of sustainable technologies. Next, we tried to develop an integrated assessment
framework by combining those two frameworks. We called this the “Sectoral System Integrated
Assessment Framework (SSIAf), which should be an analytical framework to assess niche
development in a given economic sector. Because of the importance of ‘governance’ in
sustainable system innovations, we addressed how governance was influential in to niche
development and the formation of sectoral innovation systems. This led us to compare this to
SSIAf. We judged that more attention to governance was needed and we looked at the GAT, to
look for possibilities for incorporation of governance aspects in SSIAf. The integrated
framework which resulted from this process will serve as a theoretical and analytical basis for
future empirical research, starting with assessment of NZEBs niche development in India.
In summary, this chapter contributes to both transition studies-related theory and
governance-related theory by developing an integrated assessment framework towards
innovation and diffusion of sustainable technologies combining insights from both of the
disciplinary fields.


71
4.1 Introduction
Both in construction and in operation, buildings consume vast amounts of energy. This
energy is mainly derived from fossil fuels (UNEP-SBCI, 2009). This poses a major challenge
since these conventional sources of energy are limited and cause serious environmental
damage including greenhouse gas (GHG) emissions. A transition towards low energy, low
carbon and energy efficient buildings has gained much attention in recent decades but has seen
mixed success (IEA, 2013). Many developed countries are currently preparing to transform
their building sector (both new and existing) by deploying more Net Zero Energy Buildings
(NZEBs)14 (EU-Commission, 2013). NZEBs are buildings that are self-sufficient in meeting their
energy needs, first by reducing energy demand and then by using on-site renewable energy
sources to meet the remaining needs (Hermelink et al., 2013). Torcellini et al. (2006) define
NZEB as “a residential or commercial building with greatly reduced energy needs through
efficiency gains such that the balance of energy needs can be supplied with renewable
technologies.”
The large-scale uptake of NZEBs is expected to enable many countries to reduce their
energy and carbon footprints and move towards using renewable sources of energy for their
building sector (Iqbal, 2004). To achieve this, policies and innovative approaches are being
developed and implemented (Jain, Hoppe, & Bressers, 2014). As such, governmental actors are
one of the main facilitators of the introduction and diffusion of new sustainable technologies. In
addition, actors from both the public and private sectors are expected to participate in creating
an enabling environment for this socio-technical transformation (Schot & Geels, 2008). The
large-scale adoption of NZEBs is not straightforward as building-sector stakeholders still view
it as a complex concept, to an extent because it can be described in a wide range of terms and
expressions without a standardized holistic approach. Its definition can vary depending on the
project goals, the intentions of the investor, concerns about climate change and energy costs
(Marszal & Heiselberg, 2009).
Many developed countries have demonstrated the NZEB concept as a practical option.
They are now in the process of expanding the niche towards wider adoption through societal
14 Net Zero Energy Buildings is also interchangeably termed as Near-Zero Energy Buildings. (Boermans et.al., 2011)[
72
acceptance (Voss & Musall , 2011). In doing so, governments have also set ambitious targets to
decarbonize their building sector (for example, the European Union (EU) Directive on Energy
Performance of Buildings (EPBD) specifies that, by the end of 2020, all new buildings should be
“Net Zero Energy Buildings” (EPBD Recast , 2010). However, ambitious targets and innovative
approaches are missing in most developing countries where sustainable transitions are still
needed (Lachman, 2013). A good example is India in which only a handful of NZEB
demonstration buildings have been constructed in recent years.
In India, the building sector is growing rapidly, with an estimate that 70% of the 2030
building stock had yet to be constructed (NRDC & ASCI, 2012). In terms of energy
consumption, this poses a large challenge as buildings are responsible for nearly 33% of India’s
total energy consumption, which is mostly derived from fossil fuels (NRDC & ASCI, 2012). A
growing population, stable economic growth and rapid urbanization further increase the
challenge of meeting the growing energy demand (Ofori, 2002). From this perspective,
buildings which meet their energy demand through self-generation can become a favourable
solution to deal with the energy challenges (demand–supply shortage, energy security, fossil
fuel dependence) facing the country, especially in growing urban settings. To achieve this, a
major systemic transformation will be required to fundamentally change the way in which
buildings are designed, constructed, operated and refurbished throughout their life. This will
be a formidable task since, despite efforts towards sustainable building solutions; the
mainstreaming of energy efficiency in the building sector in India still encounters substantial
economic, technical and implementation challenges (WEC, 2013). In recent years, a few NZEB
demonstration projects have gained attention, showing early signs of the formation of a new
niche. These NZEBs will require radical transformations or structural change on the societal
scale once they are able to demonstrate the benefits. Such socio-technical transitions imply
changes in structure, user practice, regulations, networks, infrastructure, culture and new
technologies (Loorbach & Rotmans, 2005).
Theoretical frameworks such as Strategic Niche Management (SNM: Kemp et al., 1998;
Hoogma, 2002; Raven, 2005; Schot & Geels, 2008) and Sectoral Innovation Systems (SIS:
Malerba, 2004; Geels, 2004; Faber & Hoppe, 2013) provide insight into fostering technological
and social change to initiate sustainable innovations at the niche and sector levels respectively.

73
SNM is an analytical framework designed to facilitate and study the introduction and diffusion
of new sustainable technologies through societal experiments (Schot & Geels, 2008). It is also
argued that, to understand innovation activities at the niche level, it is also important to
understand sector-level innovations through a lens that highlights sectoral innovation systems
(Weber & Hoogma, 1998). The latter is a more holistic approach than focusing on a single
technological niche and provides a more comprehensive understanding of learning and
innovation processes that are specific to a given industrial sector. In this paper, a new heuristic
tool is proposed that combines insights from the conceptual SNM framework and SIS
framework: The Sectoral Systems Innovation Assessment framework (SSIAf) and can be used to
analyse the innovation system surrounding a given technological niche in a given economic
sector (the conceptual details are addressed in Section 2).
The aim of this paper is to assess the status of NZEB niche innovation in India. The main
research question is: “What does the SSIA framework tell about NZEB niche formation in India?” The
question will be answered by assessing NZEB demonstration projects in India. In this, SSIAf is
used as the primary theoretical framework to assess the niche formation process at the sectoral
level.
The paper is structured as follows. Section 4.2- 4.4 presents the theoretical underpinnings of
SSIAf with origins in SNM and SIS. Next, Section 4.5 addresses the research design and
methodology adopted in this study. Section 4.6 presents the results which then, in Section 4.7,
are discussed and positioned in on-going academic debates. Finally, the main conclusions are
presented in Section 4.8.
4.2 Background to the sectoral system innovation assessment framework
This article uses an assessment framework (SSIAf) that draws on insights from two distinct
theoretical frameworks (and the research traditions they stem from): (i) Strategic Niche
Management (SNM) and (ii) Sectoral Innovation Systems (SIS). Before presenting the SSIAf, the
main conceptual notions of SNM and SIS will be presented, as well as their shortcomings and
previous conceptual endeavours to combine insights from the two frameworks. Finally, based
on these insights the SSIAf will be presented as an integrated framework that allows for
analysing niche formation in a particular given economic sector.

74
4.2.1 Strategic niche management
The concept of SNM was introduced by the late 1990s as a theoretical framework and a
policy tool to manage technological innovations and to facilitate the market introduction of
sustainable technologies (Schot & Geels, 2008). The theoretical background of SNM draws on
insights from constructivist science and technology studies (such as the Constructive
Technology Assessment; CTA) and evolutionary economics as developed by Nelson and
Winter (1982) and Dosi (1982). SNM refers to the process of deliberately managing niche
formation processes through real-life experiments. In a society, established, commonly used
technologies are generally embedded in societal structures that provide substantial barriers to
the introduction and diffusion of new sustainable technologies. The introduction of sustainable
technologies often fails for reasons linked to technology, government policy and regulatory
frameworks, demand and production, culture and society, and infrastructure (Kemp & Schot,
1998).
SNM advocates for radical innovation through socio-technical experiments in which
various stakeholders successfully collaborate and exchange information, knowledge and
experience (Caniëls & Romijn, 2008). This involves several actors within the dominant sectoral
regime making it a multi-actor approach. It sees governments (as one of the participating actors
or stakeholders) as instrumental in facilitating wider transitions (Schot et al., 1999; Rip & Kemp,
1998; Weber et al., 1993). This can be achieved by setting up a set of successive experiments or
by policy instruments (proposed by governments) that support niche development (e.g.,
subsidy schemes, regulatory exemptions, or pilot projects). SNM scholars explain the success or
failure of a niche by analysing the interactions between the three main niche processes: (i)
shaping of expectations, (ii) building social networks and, (iii) learning processes (Mourik & Raven,
2006; Caniëls & Romijn, 2008; Schot & Geels, 2008).
However, some scholars have critisized SNM claiming that it is difficult to assess whether
SNM actually works (e.g., (Lachman, 2013)). SNM conveys the idea that a transition can be
accomplished through the execution of appropriate management such that transitioning is
largely viewed as a managerial task. This view does not align with the concept of a complex
society, one that cannot be managed like a business firm (Shove & Walker, 2007). Criticisms of
related theory (in particular the Multi Level Perspective; MLP) also applies to SNM because

75
SNM builds on these theories (Lachman, 2013). These approaches are considered to be heavily
“flavoured” by the context in which they were conceived, and therefore as potentially less
suitable for other contexts. This is a limitation in that most MLP and SNM related studies were
conducted in developed countries, and only a few in developing countries. For this reason, calls
have been made for more research on approaches to transitions in non-OECD and developing
countries who are arguably “more in need of sustainable transitions” (Avelino & Rotmans,
2011).
When building on early transition-based policy concepts, such as SNM, there is a need to
improve the understanding of the politics and policies of sustainable transitions. On the
conceptual level, issues of power and politics were initially somewhat neglected (Meadowcroft,
2009; Shove &Walker, 2007) but have garnered more attention in recent years (e.g. Avelino &
Rotmans, 2011; Grin et al., 2010). In a similar vein, agency and power through the strategic
interplay of different types of actors, including demand-side actors, civil society and grassroots
movements, were considered as under-researched (Markard et al., 2012; Shove & Walker, 2007;
Seyfang & Hexaltine, 2012; Seyfang & Smith, 2007). In particular, the MLP has long been
criticized for underplaying the role of agency in transition studies (Smith , Stirling , &
Berkhout, 2005).
4.2.2 Sectoral innovation systems
An innovation system is a network of organizations, people and institutions within
which the creation, diffusion and commercial exploitation of new technologies takes place
(Malerba F. , 2004). The Innovation Systems literature, and in particular the Sectoral Innovation
Systems (SIS) literature, emphasizes how the characteristics of an economic sector determine
the scope of innovation within it (Beerepoot & Beerepoot, 2007). Within SIS, the core building
blocks are: knowledge and technology, actor and networks and institutions (Malerba, 2002, 2004,
2007). Faber and Hoppe (2013) elaborated on the SIS framework and used it to assess
sustainable energy transitions in the Dutch construction sector. In their view, SIS contain
building blocks in four core dimensions: (i) knowledge and technology, (ii) actors and networks, (iii)
institutions and (iv) market demand creation (adding the last one to Malerba’s initial set of
building blocks).

76
Although the Innovation System (IS) literature offers many benefits, it also suffers from
various limitations. The focus is somewhat on the functioning of systems and element
weaknesses rather than system change itself. Moreover, there is little attention given to reasons
behind these weaknesses. The IS approaches tend to over-emphasize large actors such as
industry, institutes and firms. There is a bias towards producers and suppliers and a tendency
to neglect smaller actors such as citizen-led grassroots movements (Shove & Walker, 2007).
Moreover, the IS approach neglects the demand side of markets. According to Geels (2004),
most attention in IS studies are directed towards the study of the development of knowledge
and that there is a need to also emphasizing the diffusion and application of technology and its
impact on society.
Typically, IS approaches measure and assess innovation system performance at the level of
the system and sub-systems. An indicator commonly used to measure the overall performance
of a system is the diffusion of the innovation under study (Bergek & Jacobsson, 2003; Bergek et
al., 2015). However, innovation diffusion was also used implicitly as the main indicator of
system performance (with less attention paid to other theoretically relevant indicators). One of
the key areas identified for further refinement and alignment in IS approaches is performance
assessment (e.g., defining indicators for different types of systems and different IS sub-
functions (Markard & Truffer, 2008). To an extent for this reason, the IS approach/perspective
has been critisized for being “inwardly oriented” by not paying sufficient attention to the
system’s environment (Markard & Truffer, 2008).
4.3 Integration of concepts from the SNM and IS traditions in the literature
Several attempts have been made to integrate insights from the Innovation System and
Transition theoretical frameworks, notably frameworks that have been established by Markard
and Truffer (2008), Meelen and Farla (2013), and Weber and Rohracher (2012). We will address
them shortly.
Markard and Truffer (2008) reviewed both theoretical concepts and explored commonalities
and differences. They acknowledged that Techonological Innovation Systems (TIS) and MLP
are closely related concepts in studying far-reaching technological changes. Based on the results
of this comparison Markard and Truffer developed a combined approach. It provides certain

77
benefits: (i) it more explicitly considers innovation processes at the micro-level of organizations;
(ii) it takes into account mutual interdependencies between actors and institutions; (iii) it
provides consistent performance comparisons; and (iv) it facilitates systematic identification
and assessment of the broad range of TIS factors that influence innovation processes. The
authors went on to present a path towards a framework that combines the strengths of the two
approaches to allow a better understanding of radical innovation processes and socio-technical
transformations. Ideas were formulated to embed technological innovation systems that can contain one
or more niches.
Meelen and Farla (2013) made a plea to combine the TIS framework with MLP to better
capture the relationship between technology evolution and sectoral change. They combine
insights from the two theoretical frameworks to develop an integrated framework that can be
used to analyse sustainable innovation policy. In the framework, the multilevel view from the
Transition Management (TM) / SNM approach has been integrated with the functions approach
of the (T)IS literature. This integrated policy framework shows that specific policy goals and
measures can be found at specific points in an intervention related to the interfaces between
landscape, regime, IS and niches. The integrated framework suggests that the stimulation of (T)
IS only makes sense when this is closely aligned with landscape and regime developments
(Meelen & Farla, 2013).
Another attempt at a conceptual integration between the IS and SNM/MLP traditions is
the “sustainable transitions failures framework” by Weber and Rohracher (2012). Insights from
transition studies (MLP/SNM) are used in a policy framework that is based on the IS approach
and the notion of ‘failures’ (factors that prevent sustainable innovations). This framework
draws on a combination of market failures, structural system failures and transformational
system failures (Weber & Rohracher, 2012). The focus of related research is often unsustainable
value change, and sustainability issues such as climate change. Empirical research has shown
that the framework is useful, but that it is difficult to address the comprehensive set of failures,
and that many are intertwined. In addition, although designed as a ‘policy framework’, the
failures framework neglects valuable conceptual insights that are available from the policy
studies discipline (Hoppe, et al., 2016).

78
Although the afore mentioned merger frameworks as presented by Markard and
Truffer (2008), Weber and Rohracher (2012), and Meelen and Farla (2013) offer clear benefits
over solely using SNM/MLP or (T) IS theoretical approaches their benefits should also be
viewed from perspectives of those who will be using it for research. For instance, the failures
framework (Weber & Rohracher, 2012) problematizes a large set of barriers that prevent
sustainable transitions from happening, which can serve as barriers to which policy makers can
design interventions to overcome them. However, we consider this framework to be very
comprehensive, time consuming to apply in empirical research, and pre-emphasizes barriers
instead of having a more integrated view that also address (enabling conditions to) niche
formation, which includes strategies and interventions to overcome the observed barriers.
In a similar vein, the framework by Meelen and Farla (2013) addresses issues that are of
special interest to policy makers and does not go much beyond this scope. For these reasons we
feel it is necessary to develop a theoretical framework that involves and integrates key insights
from SNM and SIS, but copes with the problematic issues of the afore mentioned merger
frameworks; i.e., by not only focusing on barriers and problems, by going beyond having a
myopic (prescriptive) policy-oriented vision, and by avoiding to construct a framework that is
too complex and comprehensive to apply to case study research of (sustainable, sectoral) niche
formation.
In sum, we feel that a theoretical framework should be developed that is able to: (i) analyze
the status quo of a given sectoral niche formation and (ii) analyze the historical development of
this given sectoral niche formation process. Moreover, the framework should acknowledge
most of the benefits offered by the integrative framework by Markard and Truffer (2008),
including systematic identification and assessment of the broad range of (T) IS factors that
influence innovation processes. The proposed SSIA framework presented in the following sub-
section is designed to empirically assess sectoral niche formation. It should allow for a better
understanding of niche innovation process within a given sectoral domain.
4.4. Integrated assessment framework to analyse sectoral niche formation
In assessing the status of NZEB niche innovation, SNM and SIS, despite their stated
limitations, both provide insights into the innovation process for the diffusion of sustainable
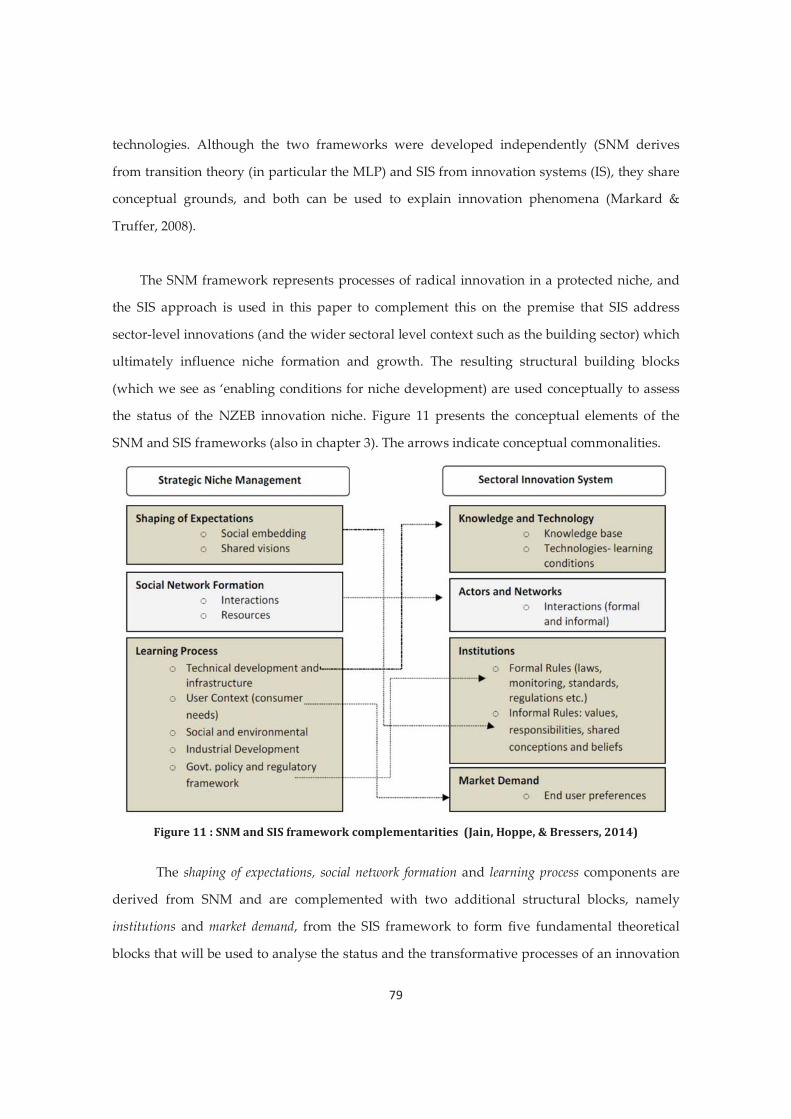
79
technologies. Although the two frameworks were developed independently (SNM derives
from transition theory (in particular the MLP) and SIS from innovation systems (IS), they share
conceptual grounds, and both can be used to explain innovation phenomena (Markard &
Truffer, 2008).
The SNM framework represents processes of radical innovation in a protected niche, and
the SIS approach is used in this paper to complement this on the premise that SIS address
sector-level innovations (and the wider sectoral level context such as the building sector) which
ultimately influence niche formation and growth. The resulting structural building blocks
(which we see as ‘enabling conditions for niche development) are used conceptually to assess
the status of the NZEB innovation niche. Figure 11 presents the conceptual elements of the
SNM and SIS frameworks (also in chapter 3). The arrows indicate conceptual commonalities.
Figure 11 : SNM and SIS framework complementarities (Jain, Hoppe, & Bressers, 2014)
The shaping of expectations, social network formation and learning process components are
derived from SNM and are complemented with two additional structural blocks, namely
institutions and market demand, from the SIS framework to form five fundamental theoretical
blocks that will be used to analyse the status and the transformative processes of an innovation

80
niche. The five building blocks jointly influence the sectoral niche formation process and the
innovations that result from the formation of a new radical niche within a sector (see Figure 12).
Figure 12 : Conditions enabling sectoral niche formation
4.4.1 Shaping of expectations
The promises and expectations of a new technology are considered important in niche
development processes to attract attention; mainly to clarify what the benefits of the niche will
be (in our case the benefits of NZEBs). Interested actors and stakeholders such as business
firms, end-users, policymakers and entrepreneurs participate in niche development processes
based on their expectations (Raven, 2005). According to Raven (2005), the process of shaping
expectations is considered as good when (i) an increasing number of participants share the
same expectations (converging towards a shared vision), and (ii) the expectations are
increasingly based on tangible results from transitional experiments. Thus, positive
expectations about a niche technology can support the concept to grow in scale, and attract
more participants and resources, by translating the niche idea (in our case NZEBs) into the
mainstream setting (Schot & Geels, 2008).
4.4.2 Actor network formation
Developing a niche may require new actors to get together and new social networks to
emerge that provide and exchange the necessary resources (e.g. money, people and expertise).
Mourik and Raven (2006) argue that social networks are favourable for a niche development
when: (i) the network is broad (including firms, users, policymakers, scientists and other
Shaping of expectations
Actor network formation
Learning process
Institutional alignment
Market demand creation
Sectoral niche formation

81
relevant actors from the science and technology domains, the policy domain, the social domain
and including both regime actors and regime outsiders), and (ii) when alignment within the
network is facilitated through regular interactions between the actors. Interactive processes are
seen as key to innovation and a major driving force for sectoral change (Hofman, 2002;
Malerba, 2007; Caniëls and Romijn, 2008).
4.4.3 Learning process
A learning process is considered likely to spur innovations if there is a broad focus
which not only addresses techno-economic optimization but also the alignment between the
technical (e.g. technical design, infrastructure) and social (e.g. user preferences, regulation
and cultural meaning) aspects. Hoogma (2002) identifies five aspects that are considered
important in learning about innovation/niche development: (i) technical development and
infrastructure, (ii) user context (i.e. user characteristics and consumer needs), (iii) societal
and environmental impacts, (iv) industrial development and (v) government policy and
regulations. Finally, a protected niche space may enable innovators to benefit from new
learning opportunities.
4.4.4 Institutional alignment
The concept of institutions includes various formal and non-formal rules, such as values,
routines, common habits, established practices, laws and standards, which all shape the
cognitions and actions of agents, as well as the interactions between agents (Malerba F. , 2004).
Formal institutions refer to ‘the formal rules of the game’, including rules, laws, monitoring and
sanctioning, and government policies. Informal institutions describe the rules that provide
legitimacy to individual practices by referring to values, responsibilities, obligations, shared
conceptions or common beliefs (Scott, 1995). Existing sector-level institutions may facilitate or
obstruct the growth and innovation of a niche. As such, this component taken from the SIS
framework will provide insight into the institutional frameworks that support or resist the
niche formation process and innovation.
4.4.5 Market demand creation
Market demand stems from the preferences of end consumers as largely revealed in
actual consumer choices (Geels F. , 2004). However, Malerba (2007) argues that, in evolutionary
economic approaches, the range of preferences of both consumers and producers stems from

82
asymmetry in information or skills, constraints on opportunity, or heterogeneity in intrinsic
motivations. A large diversity in preferences gives rise to market fragmentation and, hence, to
increased opportunities for radically new technologies to enter a niche market. The role of
demand is important in understanding technological change and innovation in a given sector
(Witt, 2011). Table 9 presents an overview of the key theoretical components of the assessment
framework.
Table 9: Assessment criteria for sectoral niche formation
Shaping of expectations
An increasing number of participants share the same expectations (converging to a shared vision).
Expectations are based on tangible results from transitional experiments.
Actor network formation
Size of the sectoral actor-networks (including both primary agents and secondary agents15, and both regime insiders and regime outsiders).
Extent of formal and informal interactions.
Learning process
Broad learning (on technology and knowledge, techno-economic optimization, technical and social alignment).
Reflexive learning, self-governance, flexibility to change course. First- and second-order learning.
Institutional alignment
Formal institutions (rules, laws, regulations, monitoring). Informal institutions (values, responsibilities, obligations).
Market demand creation
Requirements and preferences. Heterogeneity. Role of niche markets. Market structure, size and segmentation.
4.5 Research design and methodology
The research design concerns an embedded case study approach. For the empirical study,
all the existing NZEB pilot projects in India were shortlisted. At the time of data collection, nine
NZEB pilots could be identified as potential cases, of which seven16 were used for primary data
collection as our case study (see Table 10 and Figure 13). Three of these projects were
15 Primary and Secondary agents: The primary agents in a sectoral innovation system are the key players that perform core innovative activities, experiments and capacity building. In the housing sector, the primary agents are the firms that design, develop and build, the suppliers, the installers, the main users including households and social corporations of all sizes, and the local authorities. Secondary agents contribute to supporting measures in knowledge diffusion, financial support, regulations and counselling. In the housing sector, this includes national government, banks, supportive information and extension agencies, research institutions, consultancies, architects and intermediaries ( Faber & Hoppe, 2012). 16 Seven projects were selected on the basis of availability of primary data collection (interview participation). Nevertheless, all the nine projects were reviewed using available secondary data.

83
completed NZEB projects (in the performance-monitoring phase) and four of those projects
were either in the early design phase or in the construction phase. These projects can be
considered front-runner and innovator projects in terms of using the NZEB concept, and thus
can be considered as representative of projects contributing to the formation of a new niche.
Table 10: Overview of analysed NZEB projects
Project Name Type Stage Interviews / other sources
Ownership
Project 1: Indra Paryavaran Bhawan, New Delhi
Location: New Delhi, India Project area: 9565 m2 Built-up area: 32,000 m2 Certification: LEED Platinum, GRIHA 5-star Climate type: Composite EPI17: 43.75 kWh/m2/yr
Completed 3 Secondary research (articles, websites, publications)
Public sector
Project 2: Eco commercial Building: Bayer Material Sciences
Location: Greater Noida, India Built-up area: 891 m2 Certification: LEED Platinum Climate type: Composite EPI: 71.56 kWh/m2/yr.
Completed 1 Secondary research (articles, websites, publications)
Private sector
Project 3: A Living Laboratory (CEPT University)
Location: Ahmadabad, Gujarat, India Built-up Area: 498 m2 Certification: LEED Platinum, GRIHA18 5- star Climate type: Hot and dry EPI: 58 kWh/m2/yr.
Completed 1 Autonomous University (CARBSE supported by public sector)
Project 4: Nalanda University Campus
Location: Rajgir, Bihar, India Project area: 446 acres Certification: Adopted GRIHA rating
Conceptual Planning
2 Participation in project meetings
Central University (public support and international funding)
Project 5: Head Office Building, Uttar Haryana Bijli Vitran Nigam Limited (UHBVN)
Location: Panchkula, Haryana Project area: 8000 m2
Built up area: 20,145 m2 Certification: none Climate type: Composite EPI: 32 kWh/m2/yr
Tendering stage
1 Participation in project meetings
Public sector
17 EPI: Energy Performance Index 3GRIHA – Green Rating for Integrated Habitat Assessment

84
Project 6: Indian Institute of Technology (IIT)
Location: Jodhpur, India Project Area: 850 acres Status: Master Planning Climate type: Hot and dry
Master Planning
2 University (Public funding)
Project 7: Centre for Energy and Environment, MNIT
Location: Jaipur, India
Conceptual Stage
1 University (Public funding)
Figure 13 : Locations of NZEB demonstration projects.
Primary data were collected by conducting eighteen “in-depth” interviews,
participation in meetings, and field trips to the selected project sites (by the main researcher,
the first author of this paper), and a review of secondary data. The interviewees included
building owners, architects, energy consultants, government officials, policymakers; building
services designers (mechanical, electrical and plumbing (MEP), technology manufacturers and
building occupiers. The interviews were divided into two sets: eleven participants who were
directly involved with one or more of the above listed NZEB demonstration projects; and the
remaining seven participants who had relevant knowledge about the sector and the concept of
NZEB but no direct association with the NZEB pilots. This latter group was selected to provide
a sector-level perspective on the formation of the new NZEB niche and so give insights into
sectoral level innovations.

85
Semi-structured questionnaires were prepared for the in-depth interviews (see Annex
A). The questions were largely based on the five components of the SSIAf to assess NZEB niche
formation. All the interviews were conducted face-to-face, recorded and transcribed into text
files, which were used for analysis in the Atlas.ti qualitative analysis software program. This
program supports data (in this case interview transcripts) analysis by assisting researchers in
locating, coding and annotating findings in text files, in weighting and evaluating their
importance, and in visualizing the complex relationships (Muhr & Friese, 2004). The data were
coded using a coding scheme that consisted of codes resembling the theoretical concepts of the
SSIAf. This enabled a systematic assessment of the NZEB projects, and at a higher level of
abstraction the NZEB niche formation process.
Each component of the SSIAf was a basis for developing codes for the transcribed
documents. The five components became the main coding clusters in the Atlas. ti program and
a set of sub-codes was further developed and matched with their occurrences. The sub-codes
and their occurrences were then used to weight and evaluate their importance as part of
assessing the status of NZEB development in India, and hence supported the data analysis.
4.6 Results
The results of the study are presented and analysed for each component of the SSIAf (see
section 4.2). Each section elaborates on the sectoral perspective of NZEB niche innovation and
its impact on the niche innovation process (assuming the conceptual building blocks are ‘partial
enabling conditions’ for niche innovation processes). Before the results are presented, an
overview of the building sector in India along with its energy consumption pattern is presented
in sub-section 4.1. An integrated overview of the main results of the empirical study is
presented in section 4.3.
4.6.1 Market description of the Indian building sector
The Indian building sector consists predominately of a residential sector and a
commercial sector. Between 700 and 900 million m2 of commercial and residential space is
projected to be built each year until 2030 (Sankhe, et al., 2010). Figure 4 presents expected
trends for the building sector in India (differentiated by type of building). In all sectors, the

86
number of buildings is expected to increase rapidly although most growth is expected in terms
of residential buildings followed by the commercial sector. Given the significant increase in
estimated demand for buildings (see figure 14), it is imperative that the building sector to
manage its projected growth in a feasible and sustainable manner. This high growth will lead to
a significant increase in the energy demand of the building sector and hence energy efficiency
in this sector is a prime concern for energy planners including relevant governmental agencies.
The growth of India’s urban areas, both existing and projected, needs to be supported by clean
energy solutions to manage the dramatic impact of energy consumption on urban cities (Rawal
et.al., 2014).
The key stakeholders of the Indian building industry that have a significant role in
promoting its energy efficiency in India include national government ministries, federal
institutions, state government ministries, building sector associations, private sector
construction organizations and service providers (architects, developers etc.), financial
institutions, research and academia, manufacturers and, building material suppliers. National
ministries19 are considered as dominant stakeholders as they are responsible for formulating
policies and supporting and monitoring programmes related to the building sector in India.
Additionally, several bilateral/multilateral aid agencies (USAID, DFID, SDC, UNDP etc.) also
play an instrumental role towards an energy efficiency transition in the building sector through
their programmes that include pilot demonstration projects.
19 MOP- Ministry of Power, MNRE – Ministry of New and Renewable Energy, MOUD- Ministry of Urban Development

87
22%
8%45%
2%18%
5%Domestic
Commercial
Industrial
Traction
Agriculture
Misc
Figure 14: Estimated demand for real estate space for various sectors (2005-2030), Source: (Rawal et.al., 2014)
Buildings consume large amounts of energy throughout their lifecycle through design,
construction, operation, maintenance and retrofitting. Energy consumption is predominantly in
the form of electricity used to provide a variety of services such as thermal comfort (space
heating and cooling), lighting, water heating and various appliances (Jain, Hoppe, & Bressers,
2014). In India, building energy use has increased from 14% of total primary energy use in the
1970s to nearly 30% in 2004–2005, with a near-consistent 8% rise in annual energy demand in
residential and commercial sectors (Rawal et al., 2012; NRDC & ASCI, 2012). Figure 15 indicates
electricity consumption in India in the various sectors, and Figure 16 presents a more detailed
breakdown for residential and commercial buildings.
Figure 15 : Electricity Consumption in India (2012-13), Source: Central Electricity Authority, 2014

88
Figure 16: Electricity consumption pattern in residential (left) and commercial (right) buildings
(Source: BEE, 2014)
4.6.2 Shaping of expectations
NZEB pilot projects were able to shape positive expectations of new sustainable
technologies among the actors involved. Most of the studied NZEB pilots resulted from
highly motivated project owners (mostly public-sector clients) who were aware of the long-
term socioeconomic benefits of NZEBs (mostly from international NZEB demonstration
projects). This client motivation garnered further interest among the project design and
construction teams, creating a common project goal with a high visibility (drawing wider
societal attention). To this extent, the innovation in the design and construction of these
NZEB projects did garner wider attention. Expectations were also raised by four of these
NZEB pilots being educational buildings or large-scale university campuses (projects 3, 4, 6
& 7 in Table 10), thereby attracting attention from academia and the research community.
This is considered positive as it strengthens the expectations attached to this new niche. The
projects received support from the government in the form of subsidies, additional budgets
for public sector pilots, and through collaboration in bilateral NZEB programmes (USAID
PACE D –TA20 program).
However, on the sectoral level, actors were somewhat sceptical about the new NZEB
concept and doubted the technical and economic benefits, which to some extent slowed the
innovation process. This was mostly due to the lack of quantified benefits and outcomes, a
consequence of most projects still being in the development stage. Developing robust and
specific expectations and articulating a sound vision, of NZEBs may take more time, with the
possibility of changing expectations in the future. The lack of solid data on the performance
20 USAID PACE D –TA : USAID Partnership to Accelerate Clean Energy –Technical Assistance
Air Condition
ing 7%
Fans 34%
Evaporative cooler
4%
Refrigeration 13%
Lighting 28%
TV4%
Others 10%
Lighting 25%
Internal laods15%
HVAC 55%
others5%

89
of these buildings and the economic implications acts as a brake on the expansion of an
innovation niche. A vision or concrete goals for the uptake of NZEBs in the building sector is
needed, but is presently missing, and this is largely a task for the government. Additional
successful pilots are considered essential to attract interest from the building sector for
innovation.
4.6.3 Actor network formation
There was a high level of interaction between team members in each of the analysed
NZEB project’s boundaries. All the completed NZEB projects adopted an integrated design
approach21 that brought all the project stakeholders into the discussion from the conceptual
design stage22, thereby showing a considerable level of interaction and building of new
networks between the project team members. This was despite most of the public-sector
projects using a hierarchical system, with formal interaction and decision-making processes,
which to some extent probably hampered the innovation process and discouraged informal
network formation.
The project team configurations were diverse and appropriate for demonstration
projects. Additional experts became involved as they were needed to achieve pre-set NZEB
goals. Active participation and high levels of satisfaction were observed among those team
members having sufficient knowledge and expertise about the NZEB concept (including
passive design architects and LEED23 consultants taking a leading role in the project, HVAC24
experts). However, additional effort was needed to keep other stakeholders abreast of events
and motivated.
The collective participation of the various actors within a niche is theorized to lead to
an increased level of innovation, to knowledge creation, and to a reduction in complexity,
risks and uncertainty (Mourik & Raven, 2006). However, this was not observed within the
21 The conventional definition of integrated design is that project team members from all disciplines work together early and often throughout the project design process. Integrated design is an holistic method of design (and especially applied to buildings) that emphasizes management empathy to promote innovation and enhance energy performance of buildings through design. 22 One interviewee mentioned being part of weekly design review meetings that were held over nine months and chaired by the additional director general of Central Public Works Department (CPWD). Similarly, on another NZEB pilot project, a similar approach was adopted with three in-person design workshops followed by nearly twenty virtual meetings with the entire project team during the design phase. 23 Leadership in Energy and Environment Design (USGBC) 24 HVAC – Heating Ventilation and Air-Conditioning

90
NZEB projects studied. In particular, there appeared to be a lack of interaction and an
absence of social network formation between completed and on-going NZEB projects. Apart
from a few formal interactions through conferences, each project developed in isolation from
the other NZEBs in the country. As a consequence, there is a lack of coordination and
alignment between on-going NZEB projects on the aggregated niche level. In the longer run,
the failure to verify existing NZEB buildings will lead to ambiguity.
On the sectoral level, building sector stakeholders were apprehensive of the new NZEB
concept. Many factors contributed to this situation including the NZEB actors operating in
isolation. A consequence of this was that established building sector stakeholders were not
being reached to form part of a new social network. Various other factors appeared to be
considerable challenges: the high capital costs of NZEBs, a lack of verified and monitored data
in the public domain, a general lack of awareness, a lack of credible information about NZEBs,
and a general resistance to change. All of these contributed to increasing the gap between the
niche insiders and niche outsiders, effectively blocking social network formation.
4.6.4 Learning process
None of the NZEB demonstration projects (either completed or in the
design/construction phases) showed a high level of learning, hampering further innovation.
Learning was seen to be situational and fragmented, often focused on first-order learning such
that lessons were not transferred to other NZEB demonstrations projects. As such, the transfer
of direct learning experiences did not take place. Technical solutions and knowledge about
NZEBs were available but more aspects needed to be explored, especially concerning
situational NZEB site definitions and aspects of buildings from a life-cycle perspective.
Key decision-making was in the hands of a small number of expert team members
(energy consultants and project clients) who did not share critical information about project
failures. In fact, the projects that were investigated tended to shy away from sharing
performance information from the occupied NZEBs. In general, learning is expected to take
place through interactions between project team members (within an individual project) and
also between demonstration projects. The latter is viewed as important because it is assumed to
enhance network formation and make the setting of expectations more robust. We would argue

91
that this is highly needed for the successful up scaling of NZEB innovation projects, but
currently lacking in the present scenario. The role of educational institutions (as pilots) is seen
as important since buildings with an educational function can stimulate holistic learning about
the NZEB concepts and address both occupants’ needs and experiences and the benefits of
NZEBs for society at large.
On the sectoral level, the innovation process is slowed by the failure to learn from NZEB
demonstration projects. It was also difficult to understand the technical explanations of the
NZEB concept, and the learning process needs to focus on disseminating knowledge in a
simpler way that matches the relevant stakeholders in the building construction value chain
thus increase second-order learning.
4.6.5 Institutional alignment (formal and informal)
Currently, building sector institutions do not seem to be well aligned with NZEBs. To
some extent, there is a separation between energy efficiency and renewable energy (since each
aspect is looked after by different central government institutions). One of the main
instruments – the ECBC) – is a voluntary code that indicates a minimum energy performance
standard for commercial buildings. Future code implementation and compliance will lead to a
promising shift towards the adoption of energy efficient buildings, which will support
innovation. Similarly, from the renewable energy perspective, there have been some policies –
such as the solar roof-top policy, feed-in tariff mechanisms and net metering – that can be
considered supportive in achieving NZEB goals. All the investigated NZEB demonstration
projects received government subsidies to integrate renewable energy technology in the
buildings. In most cases, this was perceived as very positive, but a sign that it is still a
‘technology niche’.
Informal institutions such as values, common practices, responsibilities and obligations also
play an important role in niche innovation. An inherent shared practice observed in the studied
projects was that NZEB actors refrained from sharing project failures. Moreover, radical
innovators seemed obliged to highlight the successes of the demonstration projects in which
they are involved. Since most of the NZEB demonstrations projects involved public sector
buildings, they are typically scrutinized because they use special budgets available for such

92
demonstration projects. Consequently, actors tend to refrain from sharing information on
project failures25. This shared reticence limits innovation in subsequent demonstrations.
Further, government communication protocols and hierarchical systems put additional
pressure on the project teams and client representatives to report project successes (to senior
officials).
On the sectoral level, institutional fragmentation was observed, and this slowed the
innovation process, limited the learning process and hampered network formation. Several
national and state public authorities appeared only to be involved with their own separate
activities. Developing an integrated well-aligned comprehensive institutional framework was
of critical importance by most of the actors that were interviewed.
4.6.6 Market demand creation
There appears to be a low level of demand for energy innovations in the building sector,
particularly for NZEBs. The fact that there were only a handful demonstration projects in India
indicates that NZEBs are in an early stage of niche formation (or rather in an R&D stage) and
more of a ‘technology niche’. The replication of such projects is expected to take considerable
time in terms of experimentation and testing (following the verification of existing NZEBs).
Here, government initiatives (standards and policies) for creating a market demand are
considered important. Since existing energy standards do not incentivize people to explore
energy innovations, they tend to stick with conventional business-as-usual construction
practices. This ‘locks out’ the potential adoption of innovative sustainable technologies in the
building sector.
The involvement of end-users, and their preferences, can play an important role in the
innovation process (Malerba F. , 2004). This can lead to co-development of new technologies by
experimentation and gearing a technology to a specific demand ( Faber & Hoppe, 2012).
However, in the demonstration projects analysed, user involvement was restricted and limited.
Hence, the users’ preferences (as building occupiers) and their sensitization towards the use of
NZEBs were badly missed. When it came to NZEBs, it was observed that the housing sector’s
participation in energy innovations was negligible with house owners lacking sufficient
25 Gap in the designed and actual energy performance in the building (failing to achieve net zero status in a year)

93
motivation (due to financial implications and the lack of understanding of tangible benefits).
Moreover, project developers tend to shy away from innovations due to perceptions of ‘spilt
incentives’26. It seems that construction companies and other actors in the building industry in
India are not prepared to produce energy efficiency buildings in large numbers.
Perceived upfront costs, a lack of knowledge on the techno-economic feasibility, a lack
of awareness of the possibilities, a limited workforce in the industry with the skills to deliver
NZEBs and the limited technical know-how were the main barriers that were consistently
highlighted during the case study analysis which also resulted in limited demand for NZEBs.
For societal transformation and innovation to occur, private sector participation will be
necessary on a large scale. However, due to lack of feasible business models and access to
finance, clients and project owners were disinclined to accept the NZEB concept and adopt
innovation. However, a parallel uptake of solar energy technologies was seen to be a result of
subsidies and incentives from the government. Similar support from the government through
policies and programmes (including financing an increased number of NZEB demonstration
projects) is crucial by actors in the building sector.
4.7 Overview of the main results
In Table 11 an overview is presented of the main results using the SSIAF concepts.
Table 11: Overview of the main results of the empirical analysis
Assessment criteria for the NZEB innovation niche (SSIAf components)
observations results (regarding NZEB niche formation)
Shaping of expectations a. Increasing number of
participants sharing the same expectations (converging into a shared vision.
b. Expectations are increasingly based on tangible results from transition experiments.
NZEB project actors have positive expectations of the sustainable technologies demonstrated.
Expectations are not based on tangible results, hence neither robust nor specific. Possible to alter existing expectations in future.
Actors outside the NZEB projects do not have positive expectations from NZEBs (due to lack of tangible results), slowing the innovation process.
Niche development is in a pre-development stage
Positive expectations are shared only by NZEB project actors and not by mainstream building actors.
Expectations are still not specific or based on tangible results (they are general and do not give guidance for setting goals).
Expectations are not converging to a shared
26 In general, it is the end-user who, in the long run, gains most of the benefits of energy-efficient buildings.
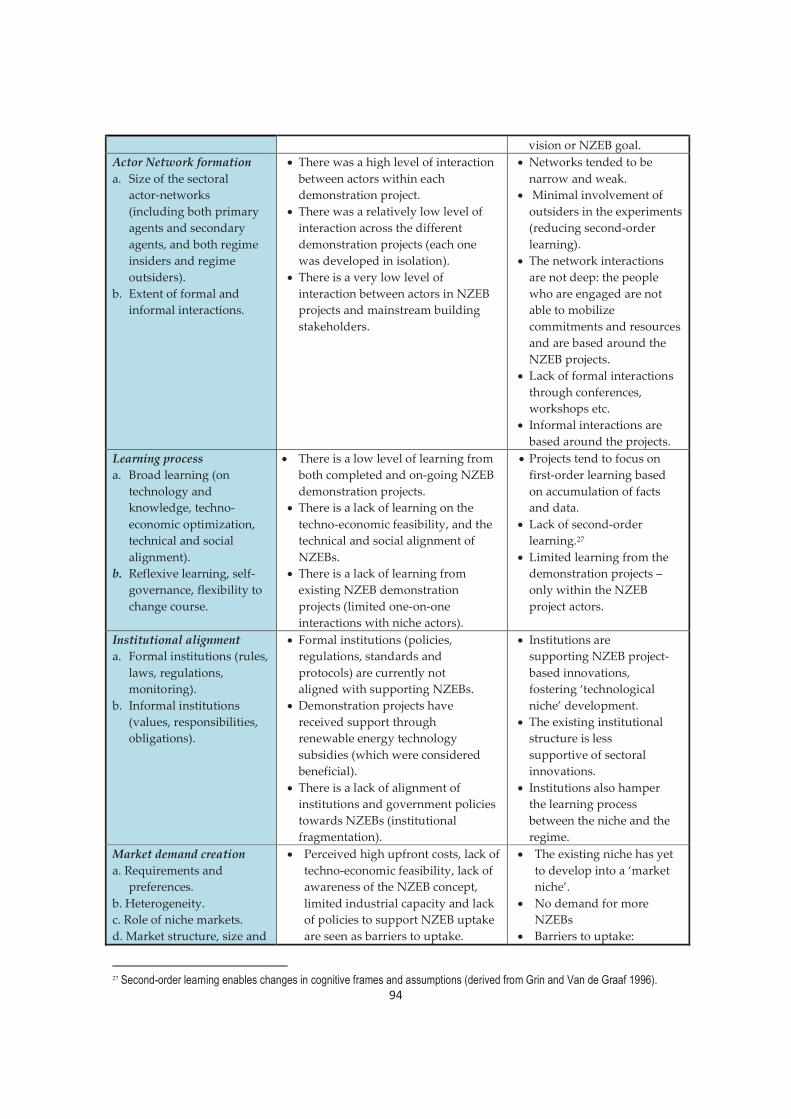
94
vision or NZEB goal. Actor Network formation a. Size of the sectoral
actor-networks (including both primary agents and secondary agents, and both regime insiders and regime outsiders).
b. Extent of formal and informal interactions.
There was a high level of interaction between actors within each demonstration project.
There was a relatively low level of interaction across the different demonstration projects (each one was developed in isolation).
There is a very low level of interaction between actors in NZEB projects and mainstream building stakeholders.
Networks tended to be narrow and weak.
Minimal involvement of outsiders in the experiments (reducing second-order learning).
The network interactions are not deep: the people who are engaged are not able to mobilize commitments and resources and are based around the NZEB projects.
Lack of formal interactions through conferences, workshops etc.
Informal interactions are based around the projects.
Learning process a. Broad learning (on
technology and knowledge, techno-economic optimization, technical and social alignment).
b. Reflexive learning, self-governance, flexibility to change course.
There is a low level of learning from both completed and on-going NZEB demonstration projects.
There is a lack of learning on the techno-economic feasibility, and the technical and social alignment of NZEBs.
There is a lack of learning from existing NZEB demonstration projects (limited one-on-one interactions with niche actors).
Projects tend to focus on first-order learning based on accumulation of facts and data.
Lack of second-order learning.27
Limited learning from the demonstration projects – only within the NZEB project actors.
Institutional alignment a. Formal institutions (rules,
laws, regulations, monitoring).
b. Informal institutions (values, responsibilities, obligations).
Formal institutions (policies, regulations, standards and protocols) are currently not aligned with supporting NZEBs.
Demonstration projects have received support through renewable energy technology subsidies (which were considered beneficial).
There is a lack of alignment of institutions and government policies towards NZEBs (institutional fragmentation).
Institutions are supporting NZEB project-based innovations, fostering ‘technological niche’ development.
The existing institutional structure is less supportive of sectoral innovations.
Institutions also hamper the learning process between the niche and the regime.
Market demand creation a. Requirements and
preferences. b. Heterogeneity. c. Role of niche markets. d. Market structure, size and
Perceived high upfront costs, lack of techno-economic feasibility, lack of awareness of the NZEB concept, limited industrial capacity and lack of policies to support NZEB uptake are seen as barriers to uptake.
The existing niche has yet to develop into a ‘market niche’.
No demand for more NZEBs
Barriers to uptake:
27 Second-order learning enables changes in cognitive frames and assumptions (derived from Grin and Van de Graaf 1996).

95
segmentation.
Government policy instruments have potential to create market demand and initiate innovations.
More demonstration projects are needed to create sufficient evidence-based knowledge about NZEBs (as a reliable and affordable building concept).
More private sector participation is required to spur the uptake.
Lack of feasible business models to attract private sector players.
Perceived high capital cost.
Lack of technical knowhow in the industry and lack of capacity.
lack of government support
lack of knowledge and awareness of NZEBs.
4.8 Discussion
The results reveal that, so far, the NZEB concept has not developed into a successful
innovation niche. This is to a large extent due to the limited development of some of the SIS
building blocks (institutions and market demand), reflecting relatively poor conditions for
NZEB technology to mature. There are several reasons for this. Many NZEB demonstration
projects were organized in an overly self-contained way–and this hampers the niche innovation
process. Each of the five SSIAf components were independently evaluated and assessed,
highlighting the limited success of the pilots in inducing further sustainable development of the
niche. Only a small number of actors (and mainly NZEB project actors) seem to have positive
and optimistic expectations of NZEBs. The expectations for the niche were not yet robust as
there was a lack of tangible results. The new social network tended to be narrow with
interactions taking place only within the demonstration projects and only during the project
timelines. Both formal and informal social interactions were also limited. The lack of a cohesive
actor-network may be a sign that that the niche is growing only slowly.
Our results support the views of those transition scholars who see social network
formation as a crucial condition for the growth of a niche (e.g. Schot & Geels, 2008; Caniels &
Romijn, 2008). Authors have stressed that sub-optimal involvement of mainstream actors (i.e.
the building sector) in the niche formation process and insufficient internal niche interactions
may eventually result in the complete failure of the niche (Schot & Geels, 2008). In the cases
studied, actor networks were rather narrow and excluded sector outsiders (such as non-
governmental organizations, policymakers, research institutions and financial institutions)
which led to some scepticism over the realized projects, and a lack of second-order learning,
that restricted sectoral innovations. Similar shortcomings were observed by Malerba (2004) and

96
by Faber and Hoppe (2013) who found that actor-networks were a key driver of sectoral change
and defining a new sectoral structure (which is required to spur sectoral innovation).
Another recurring finding is that the nature of social networks determines the depth and
breadth of learning processes. The NZEB projects tended to focus on first-order learning only
(based on ‘hard facts’ and data), and this impeded potential niche expansion. The institutional
settings apart from government subsidies did not provide incentives for innovation: the formal
rules were not yet aligned with NZEB innovations although they were to an extent for energy
efficiency in buildings. Similarly, several barriers were observed resulting in a lack of demand
for NZEBs on the building-sector level, indicating that niche formation had yet to result in
sectoral change.
We consider applying SSIAf useful in assessing the status of NZEB niche innovation in
the building sector in India. The integration of the SNM and SIS frameworks showed that they
were complementary, and this contributed well to answering the main research question. The
use of SSIAf enabled us to systematically assess the niche development process and probably
better than either of the two frameworks separately. For example, while the SNM focuses on its
primary components of shaping of expectations, the actor network formation and the learning process
to understand the niche formation process, it alone fails to gain from insights as to which
institutional alignment (formal and informal) and creation of market demand components can
contribute to the niche innovation process.
The institutional alignment component was seen to have a positive influence on the
learning process and on social network formations. Formal institutional support (subsidies,
incentives) motivated early adopters to go for NZEBs in the first place, which led to additional
learning for the actors involved. Institutional support in terms of policies and strategies was, to
an extent, conducive to raising expectations and legitimizing government support for new
sustainable technologies. Using the SNM framework alone would have overlooked
opportunities that the integrated framework highlighted. Similarly, existing barriers to large-
scale adoption were highlighted by including market demand component in the SSIAf. This
component was taken from the SIS framework and is relevant since it supports speculative
growth of the niche. However, using the SIS framework alone would have excluded an

97
assessment of the learning process in our niche projects, despite learning potentially creating
disturbances in an existing stable regime which can lead to sector-level innovations. As such,
the SSIAf has merits when it comes to assessing a niche innovation at the sectoral level and
hence builds upon the strengths of the two earlier frameworks.
The empirical study showed that the SSIAf components showed many mutual
interdependencies. For example, the shaping of expectations and goals was to an extent
dependent on other components such as the learning process (in resetting visions), and
institutions influenced one another. Similarly, the strength of the actor network had a strong
influence on the other four components. Also, it was seen that the five components are valued
differently in all the potential development phases of an innovation niche, as such creation of
market demand was low and close to negligible owing to the early phase of niche formation,
however technological learning and actor formation are deemed of high value to ensure the
strong formation of a new niche as also supported by various transition scholars (e.g. Hofman,
2002; Schot & Geels, 2008; Caniels & Romijn, 2008).
Most of the interviewees deemed broadening of the actor network as necessary and
believed that government interventions were necessary to foster this, a view recognized by
other scholars (e.g. (Caniëls & Romijn, 2008)). Informal institutions show significant
interdependencies in terms of shared visions and patterns of thinking ( Faber & Hoppe, 2012).
Integrated concepts could also serve as foundations for policies aiming to promote radical
transformative change.
Other frameworks, such as the MLP, also provide insights into technological transitions
and regime shifts on both the niche and the regime levels, and also address changes at the
landscape level. However, since the main aim of this paper has been to assess the NZEB
innovation niche, the MLP is less appropriate as it does not provide an insight into sector-level
innovation. This aspect is well covered by SIS (and incorporated in the SSIAf), which focuses on
how the characteristics of a sector may determine the scope of innovation within that sector. It
is possible that using the MLP alongside the SIS framework could bring further insights.
However, given that the MLP focuses on regime shift from a technological and social
perspective, and the SIS framework emphasizes a sector’s capacity for innovation and through
98
this regime shift, we would argue that these conceptual differences justify the integration of the
SIS and SNM frameworks as against using MLP.
Although SSIAf has many benefits – i.e. offering a broad conceptual understanding of
sectoral niche formation, allowing for the identification and assessment of conditions that
enable or disable sectoral niche formation, is arguably easier to use than more comprehensive
frameworks (i.e. the failures framework, Weber and Rohracher, 2012), by presenting a systemic
status quo which is attractive to policy makers and strategists to address when generating ideas
for policy making, and by offering a way to analyse structural proximity of actors (e.g., niche
and regime actors) – following the lessons from our case study analysis, there is also room for
criticism and suggestions for improvement.
First, SSIAf analysis was found to be rather static. The framework analyses sectoral niche
formation as a ‘snapshot’ in time and does not really allow for analysing niche development as
a set of sequential historical events. Second, the framework assumes a form of developed niche
formation, whereas the NZEB case study showed that niche development was basically in a
state of ‘pre-development’; i.e. the local projects were hardly coordinated from a niche platform
at an aggregated level, which heavily impeded cross-project coordination and learning. Third,
the focus on the economic sector and the status quo rather led to neglecting the multi-level
character of the niche formation process (concepts and processes that are appreciated by the
frameworks of Markard and Truffer, 2008 Weber and Rohracher, 2012, and Meelen and Farla,
2013). This limitation could possibly be resolved by adopting notions from these frameworks.
To some extent, the SSIAf also gives insufficient attention to the environment and the context of
sectoral innovation systems and niches (geographical conditions). Here, one could adopt some
of the problem-oriented concepts from the sustainable transition failures framework (Weber &
Rohracher, 2012). Other potential avenues for conceptual enhancement would be to explore
analytical frameworks that give sufficient room for policy and politics (See for an overview:
Hoppe et al., 2016 b) and pay attention to the contextual setting (e.g., Bressers et al., 2002).
Fourth, like the failures’ framework in data collection the use of SSIAf leads to collecting a
comprehensive set of data, which is rather time consuming for the researcher. Fifth, it remains
unclear why the five theoretical components of SSIAf do not have different weightings when

99
analysing niche formation; i.e. in early niche development market demand creation probably
deserves a lower weighing than learning about technological performance and side effects of a
given technology.
Perhaps, further conceptual development of the framework should assign different
weightings to the theoretical components depending on the stage that niche formation is in;
e.g., differentiating between pre-development stage, early development stage, late
development stage and ‘breakthrough’ stage. Sixth, the framework assumes focusing on a
single niche, whereas focusing on a given economic sector should allow for a more holistic
view, and therefore the identification of multiple niches within an economic sector.
We also want to address a methodological limitation that should be kept in mind when
reflecting on the results of this study. It entails the fact that the selected cases were in India,
against the background of a developing country. This arguably contributed to focusing on a
sectoral niche that was still in its pre-development stage. In future research we suggest SSIAf to
also be used in empirical research comprising case studies of niches that are more developed,
i.e. in further stages of niche formation (e.g., early niche formation, late niche formation).
Analysing and comparing cases in different development stages would allow researchers to
learn more about mechanisms that influence sectoral niche formation. This would probably
entail to (also) select cases of sectoral niche formation in developed countries. Moreover, an
attempt could be made to re-design SSIAf to make it more useful to dynamic forms of research,
and not just to assess a status quo as a ‘snapshot in time’.
Finally, the case study revealed the importance of donor aid to niche formation in India.
One could wonder what the absence of this condition would mean. Moreover, it gives thought
to how bottom-up development of local experimental projects and in the end niche (pre-)
development is dependent on such a condition. In this sense, theoretically it makes sense to
discuss whether donor aid can be labelled either as a ‘landscape event’ - because the condition
is of great importance to niche formation and cannot be labelled a regime characteristic as it
transcends the sectoral level; i.e. it is an international intervention or event – or rather as an
instrument at the micro level; (niche) to foster niche formation.
100
4.9 Conclusions
This paper started by introducing the NZEB concept and how a transition towards
large-scale uptake of this concept could enable countries such as India to deal with future
energy challenges, and particularly those in the building sector. This would require structural
changes encouraging innovation in the existing building sector regime. The paper attempts to
assess the current status of the NZEB innovation niche by posing and then answering its main
research question: “What does the SSIA framework tell about NZEB niche formation in India?” The
paper explores transition and innovation theories (SNM and SIS) and develops an integrated
framework, the SSIAf, to assess the current status of NZEB development in India. This has five
theoretical building blocks: shaping of expectations, social network formation, learning process,
institutional alignment and creation of market demand.
The results show that the NZEB innovation niche has yet to develop into a mature niche
and is growing only slowly. This is evident from the marginal expectations that building sector
stakeholders have regarding NZEBs. This is largely due to the lack of tangible results, despite
the project actors being positive towards NZEBs regardless of their isolated character. New
social networks were only strong within individual NZEB projects and there had been a failure
to create a cohesive network with other NZEBs and with actors outside the NZEB projects.
Consequently, the spurring of the innovations through network activities was limited. There
was also a lack of interactions between the niche and the wider regime, and the NZEB niche
therefore lacked the nurturing required to facilitate stabilization and growth towards maturity.
The strength of the SSIAf was that it provided an in-depth analysis of each of the independent
components of the framework. Several interdependencies were observed among the
components and we were able to elaborate on the dynamic nature of the niche that is currently
growing at a slow pace.
Based on the identified shortcomings of the SNM/MLP and IS approaches, we presented
the SSIAf and positioned it among other integrative frameworks (TIS–MLP and SNM–TIS). The
distinction is that the SSIAf is demarcated by a given industrial sector (in our case, the building
sector). Having sectoral boundaries, it is more limited than the more comprehensive integrative
framework suggested by Markard and Truffer (2008). As such, the SSIAf is more strongly

101
oriented towards actors and agency, paying greater attention to strategic actor interactions.
Another component that differs from Markard and Truffer’s suggested framework is the
SSIAf’s institutional component, which gives more attention to market, and societal rules and
sectoral policies. The distinction with the approaches of Weber and Rohracher (2012) and
Meelen and Farla (2013) is that the SSIAf does not have a strong policy orientation. In its
current form, the SSIAf is basically a heuristic tool – as other IS approaches – to assess a given
innovation system and niche market formation (such as here, NZEBs) on its inherent capability
and capacity to spur and successfully diffuse the given innovation and generate a wider market
uptake.

102


105
5.1 Introduction
As global warming and fossil fuel depletion highlight the need to save energy, demand
for energy in buildings is bound to increase (IEA, 2013). Green buildings with the highest level
of energy efficiency are now being projected as net zero energy buildings (NZEB) with the use
of renewable energy technology for energy production. This has recently gained a lot of
attention by research communities, early adopters of construction innovations, policy makers
as well as green building rating systems (such as LEED28), setting ambitious targets to
transform the building sector by adopting low, near or net zero energy building concepts. This
can be achieved by adopting passive building design strategies, the use of energy efficient
technologies, and integration with renewable energy systems to fulfill the remaining energy
demand through self-generation (Marszal & Heiselberg, 2009; Voss & Musall,2011; J.Salom
et.al, 2011). Such buildings offer a promising solution to deal with future energy challenges
with limited environmental impact. However, currently there are only a handful of projects
proving that it is a feasible concept (Gilijamse, W., 1995).
In India, however, energy efficient buildings and green buildings have seen an
increased uptake in recent years, where the country secured the third position in the 2016 US
Green Building Council (USGBC) annual rankings of top 10 countries for LEED. India has 15.90
million gross square meters (GSM) of LEED-certified space and an additional 89.28 million
cumulative GSM of LEED-certified and registered space (Analytics, 2016). India is also among
the top 10 countries outside the United States making progress in sustainable building design,
construction and operations. In the recently published ‘Smart Market’ report it is stated that by
2018, the green building industry in India is expected to increase by 20 per cent, driven largely
by environmental regulations and demand for healthier neighborhoods (Analytics, 2016).
Despite this, green building uptake also meets with several challenges such as lack of public
awareness, lack of public incentives, higher perceived upfront investment, and lack of market
demand (Analytics, 2016).
28 Leadership in Energy and Environment Design (LEED) -certified buildings save energy and water, helping residents and businesses make savings. Such spaces reduce carbon emissions and create a healthier environment for residents, workers and the larger community.

106
Although India’s green building sector has gained momentum, numerically it can be
considered rather small when compared to the number of buildings which are to be
constructed in the country till 2030. When looking at the estimated 2030 building volume, 70%
is still to be constructed (Kedia, et al., 2015). In this view scaling up NZEBs among the new to
be constructed volume of buildings can be viewed as a potential “game changer” by curbing
GHG emissions and drastically reducing energy demand of the building sector in India.
Currently, in India the building sector is responsible for nearly 33% of the total energy
consumption (NRDC & ASCI, 2012). In this perspective, large scale development of NZEBs has
the potential to deal with future energy challenges and ensure energy security for the country,
which is especially urgent in urban settings (Iqbal, 2004). However, this requires structural
changes and innovations in policy, regulations, user practices, market incentives, awareness as
well as new technology to overcome the existing barriers for green markets (Boermans et.al.,
2011). At the moment the market for NZEBs in India is at a nascent stage of niche formation,
with only a handful of NZEB demonstration projects running. Results from previous research
revealed that the NZEB niche is immature and growing only slowly (Jain, Hoppe, & Bressers,
2016). Currently, there is no single nationally accepted definition of NZEB in India as the
concept is still in its infancy. However, frontrunners define it as, “highly energy efficient
building with extremely low energy demand, which is met by renewable energy sources”. Such
buildings produce as much energy as they consume (annually) (Jain, Hoppe, & Bressers, 2016).
Governance arrangements play an important role in stimulating innovation and supporting
diffusion and adoption of new sustainable technologies (in our case NZEB technology), for
example by introducing innovation policies and a conducive framework for implementation of
such policies (Edquist, 2005). This also applies to innovation systems, for instance incentives,
networks, structure, and culture that have to do with the introduction and innovation diffusion
of NZEBs in the building sector in India (Beerepoot & Beerepoot, 2007). In this perspective, this
paper aims to analyze the state of governance in a selected region in India, in this case New
Delhi, to assess how supportive or obstructive the governance context is vis-à-vis niche
formation of NZEBs. The main research question is: What is the state of governance in New
Delhi regarding NZEB niche formation?

107
This paper is structured as follows. In section 5.2, the theoretical frameworks of the
Governance Assessment Tool (GAT) and Strategic Niche Management (SNM) are presented. In
section 5.3, the research design and methodology are presented. In Section 5.4, the results of the
case study analysis are presented. In Section 5.5, the results of the analysis are discussed. And
finally, in section 5.6, the conclusions are presented.
5.2 Theoretical framework
This section presents the two theoretical frameworks which will be of interest to understand
the niche formation process of NZEBs from a governance perspective. Section 5.2.1 elaborates
on governance and its influence on facilitating and stimulating innovation in a particular
context. This leads to introducing the GAT and its conceptual background in the Contextual
Interaction Theory (CIT). It provides a vision towards current and possible future pathways for
the governance context regarding niche formation and diffusion-adoption of NZEBs. Secondly,
SNM is briefly presented in Section 5.2.2. It explains the niche formation and diffusion of novel
sustainable technologies through the formation of protected niches, and gradual breakdown of
regime barriers. SNM and GAT will be compared to advance the understanding and the
analytical approach of governance processes that have to do with niche development and
deepen understanding of governance of innovations in a given economic sector. Theoretically,
the focus of this paper is to analyze sectoral energy transition and niche formation of
sustainable energy innovations from a governance and policy perspective. In this sense, it
contributes to a growing body of literature in this domain (Hoppe, Coenen, & Van den Berg,
2016).
5.2.1 Governance assessment tool
The GAT was developed as an evaluative framework to assess the quality of governance
in a specific context, specifically to evaluate a implementation setting (vis-à-vis certain issues,
policy instruments or projects) in terms of supportive or restrictive for such implementation.
The conceptual basis of the tool consists of a collection of insights on governance and has a
background in the CIT (Bressers J. , 2009). The CIT is a third-generation implementation theory
where implementation is not seen as a top-down process, but as multi-actor interaction process
influenced by the actors who are involved. According to the CIT, there are three core
characteristics per actor: motivation, cognition and resources. The “motivations, that may spur

108
the actors into action, their cognitions, information held to be true, and their resources,
providing them with capacity to act individually and power in relation to other actors”
(Bressers et. al. 2016) (p.45).
The governance model in the CIT consists of questions that attempt to determine: Where?
Who? What? How and with What? (Casiano, 2017). These questions respond to characteristics
that feature modern governance systems (Casiano, 2017). They are multi-level, multi-actor,
multi-faceted, multi-instrumental and multi-source-based (Kuks, 2004).
The governance concept as used by the GAT has its roots in public policy, public
administration and governance literature, and can be viewed as an attempt to organize the
multiplicity of aspects mentioned in those literatures into a concise fashion (Bressers & Kuks,
2004). Governance refers to, “all processes of governing, whether undertaken by a government,
market or network, whether over a family, tribe, formal or informal organization, or territory,
and whether through laws, norms, power or language. Governance differs from government in
that it focuses less on the state and its institutions, and more on social practice and activities”
(Bevir, 2012) (p.1). Therefore, governance is “beyond merely government” and a context for
decision-making and implementation; and it can be both supportive and restrictive for those
processes. The governance context here, assumes the existence of a multiplicity of actors, levels,
goals, instruments and different means that can be applied (Dinica & Bressers, 2003). As a
context, governance, to some degree, restricts and to some degree enables actions and
interactions in a certain part of society (Bressers & Kuks, 2004). The GAT helps to assess and
identify the strong and weak points in the governance context (in our case this would be to
support NZEB niche development). The tool predominantly draws attention to understanding
of existing situations that can obstruct policies and projects under complex and dynamic
conditions (Bressers & De Boer , 2011).
The dimensions of the GAT
The GAT framework introduces five dimensions that provide a clear overview of the
governance context (or contents of a governance regime in a certain area with certain issues).
Below are the dimensions of the governance context that are central to the GAT:
Levels (not necessarily administrative levels): governance assumes the general multilevel
character of policy implementation.
109
Actors and their networks: governance assumes the multi-actor character of policy
implementation.
Perception of the problem and objectives (not just the objectives): governance assumes the
multifaceted character of the problems and objectives of policy implementation.
Strategies and instruments: governance assumes the multi-instrumental character of policy
strategies for policy implementation.
Resources and organization of implementation: governance assumes the complex multi resource
bases for implementation of policy (Bressers & Kuks, 2003).
There are four quality criteria in order to assess the aptness of the governance regime
(Bressers et.al., 2016). These four quality criteria include: extent, coherence, flexibility and intensity
(Bressers & De Boer , 2011). The five governance dimensions and four qualities together form
the core of the GAT. The quality criteria assess to what extent the governance context is
supportive or restrictive for the policy process.
By analyzing the five dimensions of governance according to the four qualities of the
governance regime, one can attain a very pragmatic understanding of how different elements
of governance interact and hence influence an implementation setting, in our case adoption of
NZEBs. Extent is a quality of a governance regime that refers to how completely it considers
the various elements that have an impact on the process at stake (in this case NZEB niche
formation). The coherence of that same regime relates to how the various elements of the
regime strengthen each other (rather than weakening each other). Given that the actors are
different and important in different settings within a governance context; effective
implementation will also be influenced by the flexibility available. In a flexible governance
regime, actors have formal and informal liberties and stimuli to act towards the
implementation actions that assist in achieving goals. Finally, intensity is extent “to which the
regime elements urge changes in the status quo or in current developments” (Bressers & De
Boer , 2011). These dimensions can be used to follow up the first descriptive step and enable a
more in-depth picture of the governance setting regarding a given issue (see Table 12).

110
Man
si Ja
in
Tabl
e 12
: Mat
rix
of th
e Go
vern
ance
Ass
essm
ent T
ool (
adap
ted
from
: Bre
sser
s et
.al.,
201
6; G
ana
& H
oppe
,201
7)
Dim
ensi
ons
Exte
nt
Coh
eren
ce
Flex
ibil
ity
Inte
nsity
Leve
ls a
nd
scal
es
How
man
y le
vels
are
in
volv
ed a
nd d
ealin
g w
ith
an is
sue?
A
re th
ere
any
impo
rtan
t ga
ps?
or m
issi
ng le
vels
?
Do
thes
e le
vels
wor
k to
geth
er a
nd d
o th
ey tr
ust e
ach
othe
r bet
wee
n le
vels
? To
wha
t deg
ree
is th
e m
utua
l de
pend
ence
am
ong
leve
ls
reco
gniz
ed?
Is it
pos
sibl
e to
mov
e up
and
do
wn
leve
ls (u
p sc
alin
g an
d do
wn
scal
ing)
giv
en th
e is
sue
at st
ake?
Is th
ere
a st
rong
impa
ct
from
a c
erta
in le
vel t
owar
ds
beha
vior
al c
hang
e or
m
anag
emen
t ref
orm
?
Act
ors
and
netw
orks
A
re a
ll re
leva
nt
stak
ehol
ders
In
volv
ed?
Who
is
excl
uded
?
Wha
t is
the
stre
ngth
of i
nter
actio
ns
betw
een
stak
ehol
ders
? In
wha
t way
s ar
e th
ese
inte
ract
ions
inst
itutio
naliz
ed
in jo
int s
truc
ture
s? W
hat i
s the
hi
stor
y of
wor
king
toge
ther
? Is
ther
e a
trad
ition
of c
oope
ratio
n?
Is it
pos
sibl
e th
at n
ew a
ctor
s ar
e in
clud
ed o
r eve
n th
at th
e le
ad
shift
s fr
om o
ne a
ctor
to a
noth
er
whe
n th
ere
are
prag
mat
ic
reas
ons
for t
his?
Do
the
acto
rs
shar
e in
‘soc
ial c
apita
l’,
allo
win
g th
em to
sup
port
eac
h ot
her’
s ta
sks?
Is th
ere
a st
rong
pre
ssur
e fr
om a
n ac
tor o
r act
or
coal
ition
tow
ards
be
havi
oral
cha
nge
or
Man
agem
ent r
efor
m?
Prob
lem
pe
rspe
ctiv
es
and
goal
am
bitio
ns
To w
hat e
xten
t are
the
vari
ous
prob
lem
per
spec
tives
take
n ca
re o
f?
To w
hat e
xten
t do
the
vari
ous
goal
s su
ppor
t eac
h ot
her o
r are
they
in
com
petit
ion
or c
onfli
ct?
Are
the
re o
ppor
tuni
ties
to r
e-as
sess
goa
ls?
How
diff
eren
t are
the
goal
, am
bitio
ns fr
om th
e st
atus
qu
o or
bus
ines
s as
usu
al?
Stra
tegi
es a
nd
inst
rum
ents
W
hat t
ypes
of i
nstr
umen
ts
are
incl
uded
in th
e po
licy
stra
tegy
?
To w
hat e
xten
t is
the
ince
ntiv
e sy
stem
ba
sed
on s
yner
gy?
Are
trad
e-of
fs in
co
st b
enef
its a
nd d
istr
ibut
iona
l eff
ects
co
nsid
ered
? A
re th
ere
any
over
-laps
or
con
flict
s of
ince
ntiv
es c
reat
ed b
y th
e in
clud
ed p
olic
y in
stru
men
ts?
Are
ther
e op
port
uniti
es to
co
mbi
ne o
r mak
e us
e of
di
ffer
ent t
ypes
of i
nstr
umen
ts?
Is th
ere
a ch
oice
?
Wha
t is
the
impl
ied
beha
vior
al d
evia
tion
from
cu
rren
t pra
ctic
e an
d ho
w
stro
ngly
do
the
inst
rum
ents
re
quir
e an
d en
forc
e th
is?
Resp
onsi
bilit
ies
and
reso
urce
s A
re re
spon
sibi
litie
s cl
earl
y as
sign
ed a
nd su
ffic
ient
ly
faci
litat
ed w
ith re
sour
ces?
To w
hat e
xten
t do
the
assi
gned
re
spon
sibi
litie
s cre
ate
com
pete
nce
stru
ggle
s or
coo
pera
tion
with
in o
r ac
ross
inst
itutio
ns?
Are
they
co
nsid
ered
legi
timat
e by
the
mai
n st
akeh
olde
rs?
To w
hat e
xten
t is
it po
ssib
le to
po
ol th
e as
sign
ed
resp
onsi
bilit
ies
and
reso
urce
s if
acco
unta
bilit
y an
d tr
ansp
aren
cy a
re n
ot
com
prom
ised
?
Are
the
amou
nt o
f allo
cate
d re
sour
ces
suff
icie
nt to
im
plem
ent t
he m
easu
res
need
ed fo
r the
inte
nded
ch
ange
?

111 Mansi Jain
5.2.2 Strategic niche management
SNM (Schot & Geels, 2008; Caniëls & Romijn ,2008 ; Geels & Kemp, 2005 ; Rip & Kemp,
1998; Hoogma et.al. 2002; Raveb,2005 ) provides insight into fostering technological and social
change and at the same time initiates sustainable innovations at the niche level. SNM is an
analytical framework designed to facilitate and study the introduction and diffusion of new
sustainable technologies through societal experiments that contribute to forming a niche (Schot
& Geels, 2008).
SNM advocates argue that successful radical innovations derive from socio-technical
experiments in which various stakeholders collaborate, exchange information, knowledge and
experiences. Therefore, SNM involves participation of several actors making it a multi-actor
approach (Caniëls & Romijn, 2008). It states that governments (as participating actors) can be
instrumental in facilitating wider transitions. It also illustrates how widespread technology
change within well-established socio-technical systems can be achieved (Schot et. al., 1999; Rip
& Kemp, 1998; Weber et.al., 1999). This can be done by facilitating the process of niche
formation and setting up a set of successive experiments, often supported by policy
instruments (government induced) that supports niche development processes (e.g. by subsidy
schemes, regulatory exemptions, or programs that include pilot projects). Many SNM scholars
explain the success or failure of niches by analyzing the interaction between the three main
factors influencing niche processes, i.e. shaping of expectations, building of social networks, and
learning processes (Mourik & Raven, 2006; Caniëls & Romijn , 2008 ; Schot & Geels,2008). SNM
not only focuses on niche formation by organising experiments, but also by targeting the
gradual breakdown of regime structures and barriers that block niche development (Geels &
Kemp , 2006).
The Governance assessment tool and NZEB niche development
This paper uses the GAT as the main analytical framework. Using the GAT provides insights
on the current governance context of NZEB demonstration projects and NZEB niche
development in regions that are studied. The assessment can highlight the challenges in the
governance regime which might obstruct or slow down the large-scale implementation and
adoption of NZEBs but may also help to identify potential drivers and strengths. In addition,
the results can be used to make a holistic ex- ante evaluation of how the governance context can

112
influence collaborative management of the NZEB niche development process in a particular
region. It will also be of theoretical interest to use GAT in a way that allows for assessing niche
development of a given sustainable innovation. This is rather novel since GAT has not been
used for this purpose previously (and certainly not in transition studies research) to assess the
development and diffusion of sustainable innovations in the built environment, nor in the
energy domain.
Conceptually, the GAT and SNM reflect commonalities and can be used collectively to
broaden the scope and understanding of long term transitions, sectoral innovations, policy
implementation and the state of governance in niche development processes. In both the
assessment frameworks, actors and their networks are highlighted as an important determinant
for innovations and for assessing the governance context. Therefore, it should be right to
assume that evaluating actors and their interactions (at niche level as well as at sectoral level)
could play a key role in understanding innovation and diffusion of sustainable technologies,
and the state of governance in a holistic way. Similarly, problem perceptions and goals (of where
the governance is headed) which is a key aspect of governance in the GAT, shows similarities
to shaping of expectations (converging towards shared visions and goals). Although
responsibilities and resources (from the GAT) and learning process (from the SNM) do not
specifically reflect any conceptual commonalities, they may be interdependent on each other
(e.g. efficient use of resources (human and capital resource) can directly affect the learning
process and vice-versa) Moreover, in facilitating learning processes sequential experimentation
is required. This requires the mobilization of resources by actors who desire further
experimentation, fostering learning processes, and inherently niche formation itself.
The GAT complements the elements of SNM and hence gives us the opportunity to assess
complementarities of the governance setting through a “SNM lens”. SNM on the other hand
supports and complements GAT by understanding which policy and market barriers prevent
innovation, which are largely termed as regime barriers. Moreover, it adds the niche-regime-
landscape dimension to the (already multi-dimensionally) governance assessment framework.
Therefore, this paper will first use GAT to assess case study data, and then subsequently assess
conceptual complementarities and differences when reflecting on the case study data from a
SNM perspective.

113
5.3 Research design and methodology
A case study design was used to analyze the governance of NZEB niche formation in
New Delhi. The latter, the capital of India, was selected as a single case study to illustrate how
the GAT can be applied to NZEB niche formation, and address how it compares and
contributes to more traditional SNM analysis.
5.3.1 Case selection
Next to be an illustrative case, New Delhi is also important, because of its extremely high
number of inhabitants and the degree of urbanization (which also includes a vast building
sector) (see figure 17). In this situation, New Delhi should also reflect a high level of
institutional and governance complexities, next to exhibiting developments in the green
building sector or energy efficiency in buildings compared to the other parts of the country.
Therefore, within the Indian realm, the New Delhi case would be the best case selected to study
NZEB niche formation from a governance perspective. The highly-urbanized character of the
region exerts a tremendous pressure on public delivery of services including housing,
construction of new buildings, energy demand, and poses a great challenge for the city
administration.
Figure 17 : Masterplan of New Delhi, 2021 (DDA, 2015)

114
5.3.2 The building sector in New Delhi
New Delhi comprises of a total geographical area of 14,300 hectares (DDA, 2017). According
to the Masterplan 2021, land use distribution in the capital area is nearly 45-55% under
residential buildings, commercial space comprising of 3-4 %, 4-5 % for industrial, 15-20% of
green space, 8-10% of public and semi-public facilities and circulation comprise of 10-12%.
Thus, nearly 60-70% of land use comprises of buildings (DDA, 2017).
Buildings consume huge amounts of energy in lighting, cooling and ventilation (Jain,
Hoppe, & Bressers, 2014). New Delhi has the highest per capita power consumption among the
States and Union Territories of India, with a consumption of 1,265 KWh per capita per annum
as compared to the national average of 606 KWh (Kedia, et al., 2015). The power demand in
New Delhi is vastly growing, at a rate of 5-6% yearly (IEA, 2013), and the number of electricity
consumers in the region has grown by 90.47% during the last ten years, with the highest
growth in residential and commercial buildings (Kedia, et al., 2015).
As far as growth of energy efficient or green buildings is concerned, a vast uptake was
observed for green certified buildings either under LEED29, IGBC30 or GRIHA31 (which are
three independent green building rating systems used in India). In New Delhi, LEED certified
buildings encompass 3.2 million sqft of built up space (GBIG, 2017), LEED India (IGBC)
comprises of 8.3 million sqft space (GBIG, 2017) and GRIHA certified building comprise of
612,487 sqm of built up area (Vij et.al., 2016).
The demand of energy conscious buildings has gained momentum mostly in the
commercial building sector ( Laustsen, 2008). Several green certified buildings have also seen
the uptake of renewable energy integration (NHB & KFW, 2014). In GRIHA certified buildings,
there is a mandatory criterion to offset 2.5% of annual energy load of the building by RE
integration for daytime operated buildings, 0.5% by RE for 24x7 operated buildings and no
29 Leadership in Energy and Environmental Design (LEED) is a rating system devised by the United States Green Building Council (USGBC) to evaluate the environmental performance of a building and encourage market transformation towards sustainable design.
30 The Indian Green Building Council (IGBC), part of the Confederation of Indian Industry (CII) was formed in the year 2001. The vision of the council is, "To enable a sustainable built environment for all and facilitate India to be one of the global leaders in the sustainable built environment by 2025".
31GRIHA is a rating tool that helps people assesses the performance of their building against certain nationally acceptable benchmarks. It evaluates the environmental performance of a building holistically over its entire life cycle, thereby providing a definitive standard for what constitutes a ‘green building’.
115
requirement for residential buildings (Vij et.al., 2016). Additional points are given in the criteria
if the client exceeds the mandatory requirement. Therefore, these buildings can arguably be
viewed as low energy or near zero energy buildings. However, as far as NZEBs are concerned,
there is only one office building by the Ministry of Environment, Forest and Climate Change
(MOEFCC), Indira Paryavaran Bhawan which claims to be India’s first NZEB office building,
which is also a GRIHA and LEED certified building (Vij et.al., 2016). In addition to RE
integration criteria, GRIHA gives incentives to developers for GRIHA certification in new
construction in New Delhi with 5% extra floor area ratio (FAR)32 in buildings (Vij et.al., 2016).
This is seen a highly supportive.
Given these characteristics we view New Delhi as the region in India in which development
and widespread uptake of NZEBs would be most urgent. For this reason, we consider it the
most appropriate case in India (although it is somewhat of an extreme case) to assess its
governance setting vis-à-vis NZEB niche development.
5.3.3 Data collection
Data collection involved both primary and secondary data sources. First, a stakeholder
analysis was conducted to identify important and relevant stakeholders who are part of the
governance setting, and directly or indirectly affect the NZEB niche development process in the
building sector. This also included actors who have a significant role in promoting green
building, energy efficiency and near- or net zero energy buildings. This involved experts from
national ministerial authorities, state and city authorities (municipal bodies, development
authorities), building sector associations, financial institutions, building owners, construction
developers, utility providers, architects, sustainability consultants, research and academia,
manufacturers, and technology suppliers. These identified stakeholders were then shortlisted
according to their direct engagement in actual green building projects, sustainable building
projects, or NZEB projects in New Delhi. For all the identified stakeholders, an attempt was
made to contact at least two to three actors from each stakeholder category (e.g., architects,
academics, or developers). Contacts were made via e-mails, which were followed by phone
calls. In some cases, potential interviewees needed approval from their respective
organizations. This especially applied to government agencies and international aid agencies 32 Floor area ratio (FAR) is the ratio of a building's total floor area (zoning floor area) to the size of the piece of land upon which it is built.

116
(such as USAID PACE D-TA, EEREMC). The main researcher (first author)33 also used existing
her professional network of expertise to get access to some of the selected organizations. After
contact was made, each of the contacted experts was briefed about the research project, its aims
and objectives. As a result, fourteen in-depth interviews with the stakeholders who agreed to
participate were conducted between September, 2015 and July, 2016.
A semi-structured questionnaire was prepared for the interviews, based on the GAT
dimensions (see Appendix ii). The questions were largely based on the five dimensions of the
GAT framework along with the four complemented quality criterions as described in section
5.2. In addition, key aspects of SNM were included. All the interviews were conducted face to
face, recorded and transcribed into text files (interview transcripts), which were then used for
analysis using the qualitative analysis software of ATLAS.ti. This software program assists
qualitative researchers to locate, code, and annotate findings in text files, to weigh and evaluate
their importance, and to visualize the complex relations, supporting data analysis (i.e. the
interview transcripts) (Muhr & Friese, 2004).
In addition to collecting data via face-to-face interviews, the main researcher (first author of
this paper) participated in important project-based meetings which included accelerating NZEB
awareness and knowledge in the building industry. Finally, secondary sources of data were
gathered and analyzed (e.g., published reports, newspaper articles, and project briefs).
5.3.4 Data analysis
Data were treated using a coding scheme, consisting of codes resembling the five
dimensions and the quality criteria of the GAT. This allowed for a systematic analysis. Each
dimension of the GAT framework that is the five components formed the basis for developing
codes in the transcribed documents against the four quality criteria’s. A set of sub codes was
further developed along with their occurrences. These were then used to weigh and evaluate
their importance to assess the context with respect to the governance dimensions, and hence
supported analysis of the data. The coding clusters supported in conducting an unbiased
assessment of the data available from the interviews.
33 The researcher ( the first author) was part of the USAID PACE-D TA program which included NZEB promotion and awareness as one of the work packages. The website can be accessed at http://www.nzeb.in/ .
117
Furthermore, to avoid personal bias the interview transcripts and results of the analysis had
to be approved by experts, having participated in the interviews. This happened – amongst
others - during an expert meeting. In addition to this, the main researcher (first author) did not
conduct the analysis alone, but also received feedback from the other researchers (supervisors)
on the preliminary results of the analysis. Finally, personal bias was avoided by selecting
interviewees via systematic sampling of the stakeholders by conducting a thorough stakeholder
analysis before contacting the actors for interview participation. Hence, selection of
interviewees was not restricted to ‘snowballing’ within author’s expert network only.
Interviews and meetings with the representatives of all relevant stakeholders provided a
clear picture of the governance context by allowing its assessment along the four governance
criteria of extent, coherence, flexibility and intensity. The essence of those criteria will be repeated
each time before describing the observations done in the selected region.
5.4 Results
5.4.1 Governance assessment of the New Delhi case study
Extent: Are all relevant elements taken into account?
Levels and scales: All government levels ranging from national, state to local level relevant to
NZEB niche formation were found to be present, however no specific NZEB goals formulated
by those governments were observed. There were separate goals from related energy efficiency
and renewable energy policies. These related policies encompassed different levels of
government; i.e. from national government to state level and to urban local bodies (for
implementation).
At national level, the Bureau of Energy Efficiency (BEE)34 facilitates and coordinates
energy efficiency initiatives as per the Energy Conservation Act (EC Act, 2001). Second, the
Ministry of New and Renewable Energy (MNRE) develops and facilitates large scale adoption of
renewable energy technologies through integration in buildings by design and implementation
of instruments. And thirdly, building bye-laws are governed by the Ministry of Urban
Development (MoUD). Thus, at the federal level there are three separate governmental bodies
that deal with different aspects for potential NZEB adoption or for green buildings.
34 The statutory body under the Ministry of Power; Government of India (GoI)

118
The regional or state level is the most prominent government agencies as far as
implementation is concerned. They play an enforcing role to facilitate, and implement the
policies. They exercise the power to amend policies to suit the regional and local climatic
conditions and may, by rather legal and policy stipulations made by them, specify and notify the
use of energy in the buildings. The Energy Efficiency and Renewable Energy Management
Centre (EERMC), works as a State Designated Agency (SDA) to coordinate, regulate and enforce
of the Energy Conservation Act of the region. It has also been designated as State Nodal Agency
(SNA) for implementation of programs by the MNRE. The EERMC is responsible for promotion
of renewable energy, energy efficiency and energy conservation in the New Delhi35. For these
reasons context (extent) is considered as supportive due to completeness of the levels required
for NZEB adoption.
Actors and networks: All relevant actors needed for NZEBs niche formation were present in the
building sector in the region. However, only a handful of them were found to be actually
involved and appeared to be sufficiently motivated towards the concept of NZEB, largely
because NZEB is a relatively new expression for highly energy efficient green building with only
very few running demonstration projects. Nevertheless, actors were found to be sufficiently
involved with ongoing green buildings in the region. The actors that are motivated mostly
concern energy efficiency experts, passive design architects, motivated clients (mostly public
sector), technology manufacturers and suppliers (energy efficiency and on-site RE generation
technology providers, advanced metering and building control technology providers). More
relevant stakeholders – in particular government actors (in particular the EERMC) - “need to be
actively involved to support the uptake and develop a mature NZEB niche, along with creating
awareness,” as stated by an architect during an interview.
There is sufficient potential to include architects, educational institutions, the research
community, contractors, builders and developers, the industry association, and green building
councils to make them aware about the NZEB concept.
In sum, all the actors that are necessary for decision making are basically present, but since
the concept of NZEB is so new and under-researched in the Indian context many potential
35 http://delhi.gov.in/wps/wcm/connect/doit_eerem/EEREM/Home/ last accessed on August ,2016

119
relevant actors are poorly motivated, and hardly involved. The present extent of actors is
therefore considered ‘neutral’ but shows signs of progress.
Problem perceptions and goals: Actors have various perceptions, which were highlighted
during the interviews. They include: poor and inadequate energy infrastructure along with
inadequacy to deal with rising energy demand in buildings. It was also highlighted by 8 out of
14 interviewees that having only a few NZEB pilot demonstration projects is considered
insufficient to raise the expectations (as they exhibit the potential, but do not drive the market).
Economic benefits also need to be re-assessed as NZEBs are perceived as costly due to the use of
expensive technologies (both related to energy efficiency and renewable energy). Interviewees
also highlighted that green buildings still face resistance from mainstream developers and
builders as they are largely concerned about increase in construction cost without resulting in
higher selling price. Hence, developers and builders disregard anything that brings increased
upfront costs. They are however, incentivized by giving extra FAR to GRIHA rated buildings in
New Delhi. However, interviewees stated that developers are hardly attracted to this incentive
in the region with very few applications for extra FAR.
In addition, various definitions describe NZEBs, and this varies across different contextual
settings. In a dense urban setting like in New Delhi, interviewees argue that the NZEB needs to
be re-assessed as per local and regional limitations and needs. For example, due to high urban
density, on-site NZEBs may not be a feasible option in the case of high rise buildings or
potential of wind energy may be very limited. Nevertheless, various problem perspectives were
found to be taken into consideration by different actors who were interviewed, which can
therefore be supportive in considering multiple aspects (e.g. technical, policy, economic
aspects). However, the absence of goals for NZEB appears to restrict the adoption by many
actors. Hence, when assessing the extent of problem definitions and goals it appears as to be
rather neutral.
Strategies and instruments: Increased energy efficiency was seen as a high priority in the 12th
five-year plan36 with various non-price incentives to promote energy efficiency. Several of these
36 12th Five year plan - Since 1947, the Indian economy has been premised on the concept of planning. This has been carried through the Five-Year Plans, developed, executed, and monitored by the Policy Commission (NITI Aayog after 2014). With the

120
are included in the National Mission on Enhanced Energy Efficiency (NMEEE)37. Energy
efficiency in buildings is one of the important five approaches adopted with a national Energy
Conservation Building Code (ECBC)38. This is considered as highly supportive. Continued
attention is also paid to renewable energy resources in the 12th five-year plan, with national
solar mission program initiated by the Government as one of the eight programs under the
National Action plan on Climate Change (NAPCC). The document emphasizes development of
grid connected solar applications by offering feed-in-tariffs, net metering policy and other
supportive policy instruments. The mission has set a target of 1,000 MW by 2017 reaching 1
million households in the country (GoI, 2011).
An addendum to the National Building Code (NBC)39 2005 was finalized in 2016, including
a chapter on sustainable building design, namely, ‘Approach to Sustainability’, so that
sustainable construction practices are to be adopted in all future building constructions.
Previously, the government has shown interest towards developing a long-term roadmap for
NZEBs through bilateral project agreements with the United States. The Energy Conservation
and Commercialization (ECO) was implemented in three phases in which the NZEB concept
was introduced in ECO III40 phase (2006-12), and later again in the USAID PACE D TA Program
phase (2012-17), focusing on the extension of ECBC (near zero energy goals), and introducing
the NZEB knowledge dissemination portal41. These efforts were largely initiated by these
agreements through international partnerships.
Prime Minister as the ex-officio Chairman, the commission has a nominated Deputy Chairman, who holds the rank of a Cabinet Minister. The Twelfth Plan is currently underway. 37 which was launched in 2008 as one of the eight missions in the National Action Plan for Climate Change 38 ECBC sets minimum energy standards for commercial buildings having a connected load of 100kW or contract demand of 120 KVA and above. While the Central Government has powers under the EC Act 2001, the state governments have the flexibility to modify the code to suit local or regional needs and notify them. Presently, the code is in voluntary phase of implementation. About 22 states are at various stages of mandating ECBC. (https://beeindia.gov.in/content/ecbc). 39 The National Building Code of India (NBC), a comprehensive building Code, is a national instrument providing guidelines for regulating the building construction activities across the country. It serves as a Model Code for adoption by all agencies involved in building construction works be they Public Works Departments, other government construction departments, local bodies or private construction agencies. The Code mainly contains administrative regulations, development control rules and general building requirements; fire safety requirements; stipulations regarding materials, structural design and construction (including safety); and building and plumbing services. the revised Code has been brought out in 2016 as National Building Code of India 2016 reflecting the state-of-the-art and contemporary applicable international practices also including approach to sustainability in tandem with sustainable development goals.
40 The ECO III project worked towards identification and development of a collaboration framework between the US DOE National Research Laboratories, U.S. academic institutes and research centres, and the CEPT University in India (PACE-R). 41 A NZEB online knowledge dissemination portal has been launched by the Government under the USAID PACE D TA program.

121
Responsibilities and resources: There is disparity and inconsistency between the large range of
responsibilities which have been assigned to multiple actors especially between the national,
state and local level. And a large majority of interviewees consider it as imperative to
demarcate a careful division of responsibilities between the state level government bodies,
regional planning authorities and urban local bodies (ULB’s). Moreover, there is the often-
limited level of financial and knowledge resources, and for some of the stakeholders they are
even decreasing. This also holds governmental parties that must cope with the limited level of
resource input when formulating innovative and cohesive policies. For this reason, the building
sector energy efficiency programs are often implemented through cooperation with
international aid programs (e.g., the ECBC implementation with UNDP, EE high rise
residential building guidelines with the Swiss Development Cooperation etc.).
In sum, the presence of various programs and instruments toward EE and RE for buildings
are seen as highly supportive and reflect a high degree of extent in terms of separate
instruments and can potentially in the future be combined into one holistic, integrated NZEB
policy (as supported by 9 out of 14 interviewees). In sum, the extent of responsibilities and
resources can therefore be viewed as rather limited.
Coherence: are the elements reinforcing rather than contradicting each other?
Levels and scales: At the national level, the three national level agencies of BEE, MNRE and
MoUD work within their respective jurisdictions and authorities. Their interactions are limited,
which restricts the opportunity to work together in an integrated manner. They appear to be
isolated. This leads to institutional fragmentation and in turn to confusion at lower levels of
government when the policies have to be implemented (and are depending on the compliance
by municipalities, often using their own bylaws). They have separate goals and missions, and
inter-ministerial coordination is absent. In addition, there is a lack of unified policy and national
programs for NZEBs. This makes the context appear to be restrictive.
At the state level the institutional framework allows to work together for the
implementation of EE and RE policies (with same SDA and SNA). This can be considered as
positive and in support of NZEBs in future adoption. Currently, the SDA’s do not collaborate at
the local level with ULB’s to initiate enforcement of the policies for energy efficiency and

122
renewable energy in buildings. In doing so, they follow the top-down hierarchical institutional
framework. In sum, coherence regarding levels and scales is considered as neutral.
Actors and networks: The strength of interaction between the existing actors was found to be
fragile and is only possible through a formal platform, for example in the form of a conference
or a workshop. In the past this has been possible through bilateral project agreements. These
programs brought all the important stakeholders from the building industry and technology
providers from India and the U.S. (and other Western countries such as the United Kingdom.
and Switzerland) together. This helped to raise awareness and initiate discourse about the new
and relatively unknown concept of NZEBs in the Indian building scenario by engaging in a
series of workshops and exchange programs.
Similarly, awareness raising initiatives have been launched by the bilateral programs in the
past to activate and engage relevant building industry actors to increase actor interactions and
operationalise an industry alliance. However, the interviewees also revealed that the relatively
active NZEB actors fail to interact or develop synergies with each other, and only end up
interacting in formal arenas. They appear to be engaged in direct components of the on-going
bilateral programs (e.g. in alliance formation, and demonstration projects of their own). As a
result, they compete with each other for projects42. This relates to limitation in innovating on
common interest between configurations of different NZEB pilot projects.
The active stakeholders can be viewed as a relatively closed group. They operate in silos. As
a result, there is a large gap in knowledge exchange between certain important stakeholders
needed for innovation. Most of the stakeholders also refrain from sharing project data and
exhibit a lack of trust towards others. Therefore, the coherence regarding actors and networks
can be considered as poor.
Problem perceptions and goals: NZEB niche formation and its related problem perspectives
are so far not reflected in the national government’s policy goals. Currently, there is no shared
goal nor a single goal nor target for NZEBs in India (both at the national and the state level).
Various goals have been formulated by the government on EE and RE in separate visions and 42 Actors are competing as they are part of the same industry and compete for projects.

123
programs. For example, the state government has announced an ambitious solar PV installation
target for the year 2020 with a total installed capacity of 20,000 MW. A mandatory
implementation of ECBC in the 12th five-year plan is expected to enable a greater shift in the
building sector paradigm which sets minimum standards for energy performance in buildings.
In addition, the government has set targets for reducing GHG emissions through the NAPCC
which includes a mission for sustainable habitats. This encourages implementation of energy
efficiency in buildings. In fact, the goals are there but to some extent they are enforced by
different ministries and do not converge together as they are conceptualised in isolation. As a
result, these goals conflict with each other and add to fragmentation and complexity. Hence
coherence on problem perceptions and goals can be considered as limited.
Strategies and instruments: The related strategies and instruments that appear to support
innovations in NZEBs are disconnected from each other both in both the policy making and
implementation levels. They either focus on the energy efficiency or renewable energy
component of a NZEB, but hardly on both. Moreover, they (policies like ECBC codes or net
metering) are often considered as restricting due to their isolated character, and often exhibiting
a lack of coordination. On the other hand, they are neither really working against each other.
Each of these instruments needs to become strong at the ground level for implementation for a
comprehensive NZEB policy, with strengthening of local administrative bodies or
municipalities. One of the interviewees highlighted the increased emphasis on RE components
while neglecting the energy efficiency aspect of building design and construction, thus
sometimes downsizing energy efficiency policy implementation also. This may potentially
impede future niche development for NZEBs. For these reasons coherence in terms of
instruments and strategies can be considered as poor.
Responsibilities and resources: No clear responsibility for NZEB niche formation was
identified among stakeholders. This leads to institutions working in isolation from each other,
and follows top-down hierarchical structures, which show a lack of transparency in terms of
responsibilities and role division regarding NZEBs. Most of the interviewees mentioned that
these actors are given multiple responsibilities. Some of them are even overlapping between
each other, which in turn leads to duplicity of efforts, which happens almost at all levels of
implementation. This also creates competence struggles and thereby avoidance of cooperation.
124
A low degree of coherence is observed since these actors do not reinforce each other nor create
synergies for effective implementation.
The existing responsibilities of the SDA’s are not well supported by appropriate resources
as they lack a substantially skilled labor force to understand and support NZEB adoption. Their
resources are derived from sources that often have different goals. Since most of the actors have
insufficient personnel and technological knowledge, they focus more on fulfilling their
individual tasks than on recognizing and responding to the each other’s needs. In sum,
coherence regarding responsibilities and resources can therefore be considered limited since
several actors are involved with different aspects of NZEB niche development.
Flexibility: are multiple roads to the goals permitted and supported?
Levels and scales: The institutional framework imposes decision making in governmental
organizations in a top-down hierarchical manner as well. This also holds for responsibilities.
Hence, these levels work within their own jurisdiction boundaries, and are restricted in this
way. For instance, buildings with pre-set NZEB goals will also need additional approval at
different stages of the project cycle. Hence many organizations are involved at various levels.
However, ULB’s, SDA’s, and energy grid operators refrain from showing flexibility or
convergence to other organizations. A fair degree of adaptiveness is only seen at the state level
where states have the power and flexibility to modify the national government policies and
programs to suit the local and regional needs and address them. However, the other
stakeholders involved in local implementation actions are stringent and do not encourage any
change from their business as usual, in terms of practices and procedures. For NZEB niche
development this situation is viewed as restrictive with little opportunity for up scaling and
downscaling policies between different government levels.
Actors and networks: Since the actor network is limited and hardly active, it is relatively easy
for newcomers to enter networks. This also applies to entrance to readily established ‘issue
networks’, can therefore be considered as ‘flexible’. However, actors with fair knowledge about
NZEBs (the actors who have directly worked on NZEB pilots) may get a better say and authority
in the project implementation. The flexibility regarding actors and networks is assessed as rather
good.

125
Problems perceptions and goals: Since NZEBs are not yet part of (official) government policy,
reassessment of goals is possible. Technical and economic aspects can be explored, as the NZEB
concept is still in its infancy. Therefore, case specific modifications are still possible, similar to
those adopted in the Indira Paryavaran Bhawan project (a NZEB pilot project) in New Delhi,
with a relaxation in a permissible built area and extension of roof projections to accommodate
solar PV installations.
Few interviewees stated that NZEB definitions need reassessment specific to local context,
which can be explored by front runners and public-sector pilot projects. The re-alignment of
goals is potentially possible. This is considered as supportive for large scale NZEB
implementation in the future. An optimized packaging of separate policies can be beneficial in
the long run for the NZEB niche development and uptake thereafter. Hence, goals are
supportive for re-alignment. The flexibility of perspectives and goal ambitions context is
considered as relatively good. It should be considered that this degree of flexibility is partly a
positive side effect of weak and fragmented government policies. Improvement on that side
might endanger the observed flexibility, however.
Strategies and instruments: Existing instruments look flexible enough to be integrated with
other existing policies and clusters. However, independent policies themselves are complex and
have long process applications for implementation. For example, the net metering policy
application process is extremely lengthy and is not considered user friendly. Even the process of
approval takes a lot of time. Similarly, all the NZEB stakeholders considered ECBC to be
complex and difficult to understand (in particular by contractors and project developers).
Despite that, existing instruments can be applied in combination with each other. For example,
ECBC compliant buildings can easily take incentives from MNRE for solar integration and for
net metering application. In sum, the flexibility of strategies and instruments can be viewed as
supportive to NZEB niche formation.
Responsibilities and resources: Since most of the NZEB concept is introduced to the Indian
building sector by international bilateral programs, along with BEE, the responsibilities are not
flexible and follow a bureaucratic approach of command and control. Moreover, there are only
few opportunities to use resources for joint purposes. In addition, there is competition for the

126
scarce resources available due to dependency on external resources. Hence, flexibility regarding
responsibilities and resources can be considered as limited.
Intensity: how strongly do the elements urge changes in the status quo or in current developments?
Levels and scales: Most of the stakeholders consider central level regulatory measures the
strongest driving force for large scale implementation as well as innovation in the building
sector. They view that the central government ministries should take an active role in
developing a comprehensive set of unified NZEB policies and regulations. Currently, NZEBs are
not present in the national government agenda’s nor missions, but only in a piecemeal fashion,
and used by various authorities. Hence, there is neither an integrated approach, nor a program
from national government to support the uptake of NZEBs. In sum, the present intensity of
levels and scales is considered neutral. However, according to our interviewees this may
improve in the future.
Actors and networks: The existing actor network exerts only marginal pressure on any change
from business as usual practices. A lack of support policies does not incentivize people to adopt
NZEBs, but rather slightly incentivizes them towards taking an interest into energy efficient
buildings (ECBC is a voluntary code) in New Delhi. This also applies to the GRIHA43 rating tool,
which is basically targeted to all new public-sector buildings. Moreover, most non-governmental
stakeholders are looking for government initiatives to guide the actor network in the desired
direction. However, currently this condition is absent. This limits the overall flexibility of actors
and networks
Problems perception and goals: Stakeholders observe that only few NZEB pilots show that the
concept is feasible and RE integration is possible in buildings. Moreover, they do not show large
scale societal and economic benefits. More so, performance of existing NZEB pilots is not shared
within the public. This does not cause any shift in the existing building sector’s regime. An
awareness and interest among the industry is seen about energy efficiency buildings (through
other market based green certifications, such as LEED and GRIHA certifications), but not
particularly for large scale adoption of NZEBs. However, present goals in the 12th five-year plan
43 GRIHA is an acronym for Green Rating for Integrated Habitat Assessment. GRIHA attempts to minimize a building’s resource consumption, waste generation, and overall ecological impact to within certain nationally acceptable limits / benchmarks.

127
and at the state level to implement ECBC code are considered to be in line with the market
transition for energy efficient buildings. This is considered as rather positive. They can work
towards a roadmap for large-scale NZEB uptake with large scale solar PV installation targets
which have been recently initiated as the Delhi Solar policy, considered as positive. The goals
that are accepted for the future at the state level are considered pretty ambitious but will be
confronted with a still existing strong emphasis on low initial cost building. The intensity for
problem perceptions and goals can therefore be considered as neutral, as many economic goals
are much stronger and without ample evidence that NZEB can be profitable this will exert
“neutral” overall influence.
Strategies and instruments: Due to ambitious national level targets on RE installation, the state
SDA is implementing many solar specific instruments which are mostly subsidies and other
incentive-based instruments. This, to some extent, increased the marketing value of the RE
integration by raising more awareness and knowledge about solar integration in buildings and
with reduced costs. Hence, these instruments have been rather successful in changing the
expectations and move towards more technology interventions in buildings. A neutral degree of
intensity is observed regarding strategies and instruments. Regulatory measures and incentives
with lucrative financial implications are also viewed as an important impetus to manage the
actor network.
Responsibility and resources: Implementation is expected to occur according to the goals
determined by higher levels of government yet there is insufficient effort bestowed to ensure
that the goals are met, and at minimal support for doing so. The existing intensity is weak as
there is lack of financial resources, knowledge and skills for adoption and uptake of the NZEB
niche in the Delhi region with only one NZEB pilot project. It is only through the public sector
NZEB pilot demonstrations that the government agrees for additional budgets for the high cost
of NZEBs. There is a perceived need to decrease the knowledge gap among the various actors in
the building industry. In spite of the existing knowledge high upfront costs of these projects
sometimes slows down the niche development process from private sector stakeholders.
According to the interviewees, the state implementation agencies should get involved in
increasing the stability of funding resources, recognizing and supporting innovative locally

128
tuned implementation process through flexible and supportive instruments and communication.
The context on responsibility and resources is observed to be of restrictive nature.
5.4.2 Overview
A visual presentation of the governance of NZEB niche development in the New Delhi
region is presented by means in Figure 18 (in the form of a ‘GAT scorecard’). The green cells
represent the results of the analyzed issues according to the issue matrix of the GAT in Table 12
that are satisfactory (positive); red cells, on the contrary, present results that are worrying
(negative); and orange cells presents results that are rather unsatisfactory or uncertain (neutral).
The (+) indicates that the present situation is changing in a positive direction or will change
positively in the foreseeable future, whereas the (-) indicates that the situation is deteriorating
and is not likely to improve in the foreseeable future.
The governance context is highly incoherent, with fair degrees of flexibility, intensity, and
extent (see also Figure 18). From the extent perspective, New Delhi can be seen to be able to
adopt NZEBs, with a supportive context for actors and networks, problem perspectives and
strategies and instruments. In this context, actors neither have incentives, nor are motivated by
policies, because they are not in line with the goals. The local level actors have the authority,
flexibility and support to address their own issues (within a given project boundary). Hence the
incoherent but flexible and moderately intense context of the selected region shows that the
governance context is in a position that allows actors to actively collaborate and manage NZEB
niche formation, provided that the supportive qualities are enhanced through collaborative
management and uptake of more NZEBs.
In the case study it was seen that Government initiatives are largely taken through various
strategies and instruments which partly support NZEB demonstration project implementation.
In this region, existing NZEB pilots are supported by the government by showcasing public
buildings as NZEBs, with increased budgets.
What is initially interesting is the wide variety of configurations that have been observed.
Given the interpretative nature of the GAT, the factors leading to these differences brought into
the picture, though a further examination of the cases could provide additional insights about
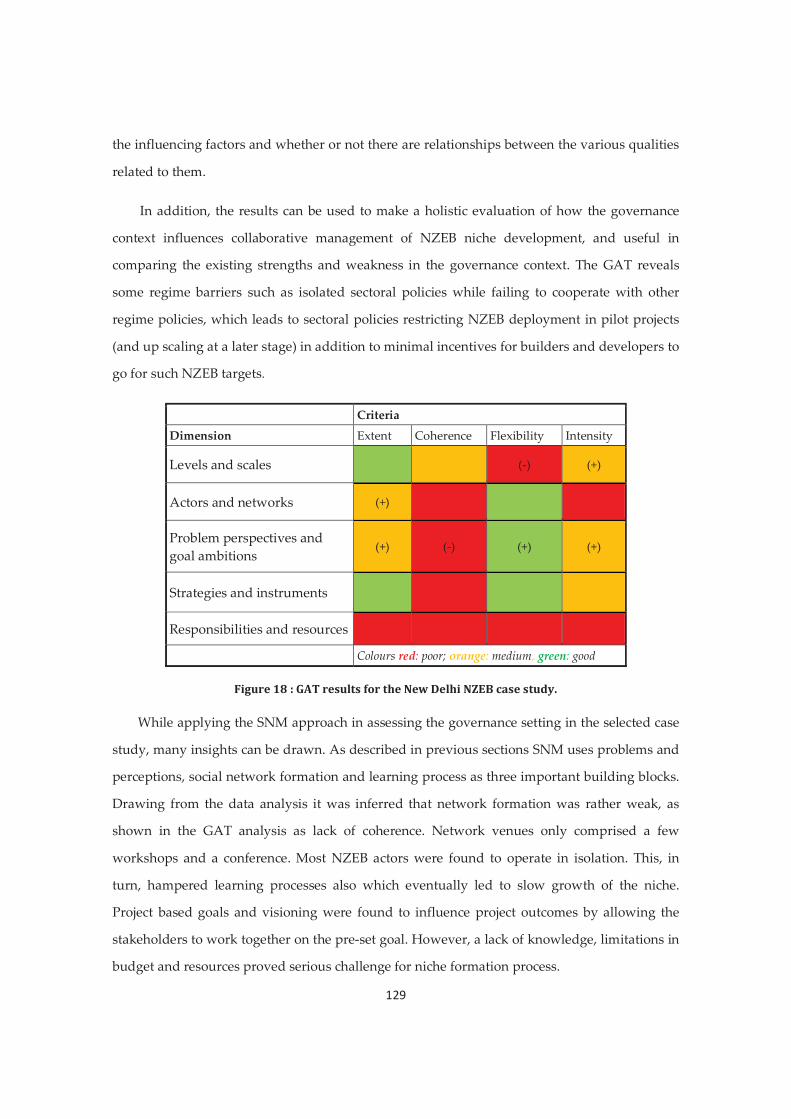
129
the influencing factors and whether or not there are relationships between the various qualities
related to them.
In addition, the results can be used to make a holistic evaluation of how the governance
context influences collaborative management of NZEB niche development, and useful in
comparing the existing strengths and weakness in the governance context. The GAT reveals
some regime barriers such as isolated sectoral policies while failing to cooperate with other
regime policies, which leads to sectoral policies restricting NZEB deployment in pilot projects
(and up scaling at a later stage) in addition to minimal incentives for builders and developers to
go for such NZEB targets.
Criteria
Dimension Extent Coherence Flexibility Intensity
Levels and scales (-) (+)
Actors and networks (+)
Problem perspectives and goal ambitions
(+) (-) (+) (+)
Strategies and instruments
Responsibilities and resources
Colours red: poor; orange: medium, green: good
Figure 18 : GAT results for the New Delhi NZEB case study.
While applying the SNM approach in assessing the governance setting in the selected case
study, many insights can be drawn. As described in previous sections SNM uses problems and
perceptions, social network formation and learning process as three important building blocks.
Drawing from the data analysis it was inferred that network formation was rather weak, as
shown in the GAT analysis as lack of coherence. Network venues only comprised a few
workshops and a conference. Most NZEB actors were found to operate in isolation. This, in
turn, hampered learning processes also which eventually led to slow growth of the niche.
Project based goals and visioning were found to influence project outcomes by allowing the
stakeholders to work together on the pre-set goal. However, a lack of knowledge, limitations in
budget and resources proved serious challenge for niche formation process.

130
SNM also advocates protection of the niche. It was observed in the case study that the only
NZEB demonstration project in the region was also protected by the government through
increased budget allocated for the public-sector building. In addition to this, the roof-top solar
panels were granted roof extension beyond permissible by-laws making it as a special case for
NZEB demonstration. Thus, the pilot demonstration was highly protected by the government
initiatives to showcase NZEB features. Hence, SNM highlights the protected space under which
niches can grow. This however was not observed in any other public building in the region.
Some of the regime barriers also led to the slow growth of the niche such as sectoral policies,
while failing to cooperate with other policies restricts the niche development process.
5.5 Discussion
From an SNM perspective, using the GAT to analyze the governance system for niche
formation was useful in assessing the state of governance for fostering such innovations. SNM
uses the three theoretical building blocks of problem perceptions and visioning, social network
formation and learning process as primary niche formation processes with the important issue
of creating ‘protection’ from the market to hold niche experiments (Kemp & Schot, 1998). This
shows similarities to some of the GAT components, namely: actor and networks, perhaps
somewhat to (adjusting) ‘problems and goals’, and (getting access to) resources (to afford new
sets of experiments).
Moreover, applying the GAT as an analytical tool was useful to understand and assess the
governance context in the building sector in the selected case study vis-à-vis NZEB niche
development. The study is of theoretical interest as GAT allows for assessing the governance
component of niche development and sustainable innovations (like NZEBs). This is rather
novel since the GAT has not been used thus far to assess developments and diffusion of
sustainable innovations in the built environment, nor in the topical field of energy. The
challenge to use GAT in this way, however, urges one to rethink how to incorporate key
theoretical notions of SNM with GAT.
In both the SNM and GAT assessment frameworks, actors and their networks are highlighted
as overlapping drivers for innovations and for assessing the governance context in which
innovations evolve. Therefore, evaluating and assessing actor (and actor-network) interactions
forms a critical part of the GAT assessment framework. As social interaction processes in multi-

131
actor arenas are mostly driven by actors involved, these interactions form a central stage in the
theoretical basis that is key to both GAT and SNM. Hence, interaction processes are considered
as an ultimate driver for niche formation, sustainability transitions and innovation. In this
sense, actor-networks can be seen as the key units of analysis in both the GAT and SNM
frameworks, in particular because they form the key social configuration in which other
important drivers for supportive governance context occur, such as problem perceptions and
goals, levels and scales, strategies and instruments, and resources and responsibilities.
The theoretical components of SNM can be viewed as similar to some key elements of the
GAT. Combining insights from the two concepts may allow for broadening the scope and
furthering understanding of long term sustainable transitions, sectoral innovations,
implementation of transition–oriented policies, and assessment of the role and state of
‘governance’ in niche development processes in sectoral systems. Furthermore, the four quality
criteria mentioned in the GAT framework can be used to evaluate the niche development
process with respect to the three building blocks of the SNM. For example, actor interactions,
expectations, learning process can all be evaluated as per the four quality criteria’s (extent,
coherence, flexibility and intensity) to understand the overlaps with the GAT framework.
However, the validity can be further elaborated based on the future empirical research. It will
be interesting to augment understanding of the governance context of niche development and
sustainable innovations (like NZEBs) through more empirical cases along with the GAT.
The findings also reveal the importance of international aid instruments to initiate
sustainable innovation in the building sector for NZEBs, also influencing the governance
context. For example, actor network formation was initiated largely by networking platforms
under aid programs (e.g., via NZEB conferences and workshops), which in turn also influence
policy instruments such as developing the ECBC code for buildings with component of super
ECBC buildings ready for RE integration (Jain, Hoppe, & Bressers, 2016). Hence, in developing
countries, such as India, a large extent of building innovations is advocated and developed
under those programs, thereby exerting a change of governance regime. The instruments used
under those programs are important drivers to bring about transition in sustainable
technologies by kick starting the niche formation process (Jain, et al., 2016; Mdivani & Hoppe,
2016).
132
5.6 Conclusions
In this paper the state of governance towards NZEB niche development was analyzed in the
selected city, New Delhi. We adopted a case study research design to assess the governance
context against the four qualities used in the “Governance Assessment Tool” of extent,
coherence, flexibility and intensity of the five structural components of the GAT. The five
components are levels and scales, actors and networks, strategies and instruments, problem
perspectives and goals, and responsibilities and resources. Our approach using the GAT was to
contribute to more conventional transition theory, in particular Strategic Niche Management.
Analyzing the elements presented, the qualities observed in the selected case study
revealed many interesting results. The governance context was found to be moderate in extent,
incoherent, moderately flexible and intense. This shows that the governance context in the
selected region is to some extent supportive towards NZEB niche development on the one
hand, but restrictive to NZEB niche development on the other hand. The main results of the
governance analysis are presented below:
The study revealed that all of the levels relevant for NZEB adoption were present.
However, they are currently isolated in relation to NZEB niche formation, however in the
future having presence of all the institutional levels is considered positive for large scale
adoption as stated by few of the interviewees.
Similarly, most of the relevant actors needed for NZEB niche development are present, but
were found to be less motivated towards building up the alliance network and initiate
knowledge building and learning especially for NZEB, which is also seen as important
element in SNM.
An increasing number of critical aspects for NZEB adoption are taken into account by the
existing NZEB stakeholders in the region which provide a good test bed for creating visions
and goals for future uptake of the concept.
Most of the instruments and strategies are also present both related to energy efficiency and
renewable energy integration in buildings, but they are not holistic as one NZEB policy or a
code for implementation at this stage.

133
The responsibilities and resources are seen as a weaker component of the governance
context for NZEBs, as the resources are limited both in terms of capital investment and
knowledge capacity.
Using the GAT in our opinion was useful and brought many aspects to light regarding the
quality of the governance of NZEB niche development. The assessment highlighted the
challenges in the regime which are obstructing or slowing down the introduction and diffusion
of NZEB innovations, and at the same time identifying potential drivers to spur NZEB niche
developments. In addition, the results can be used to make a holistic ex-ante evaluation of how
the governance context can influence collaborative management of the NZEB niche
development process.
SNM is an analytical approach typically used to assess niche developments with primary
evaluation based on: a) visioning and goal setting, b) social network formation, and c) learning
processes. By using the GAT complementary to SNM, further understanding of the quality of
governance in a given context was gained with additional insight into existing institutional
levels, strategies and instruments, and the resources and responsibilities available. Having had
a good experience in analyzing NZEB niche development while using both approaches, we
suggest that the use of both can be recommended in future niche development studies,
particularly those focusing on the governance of niche development. Therefore, the GAT as a
qualitative assessment framework towards the state of governance which can be complemented
with the mainstream SNM approach can potentially be used for informed decision making by
the government and policy makers towards introduction and diffusion of new sustainable
technologies in a developing country. Before doing so, we do, however, suggest researchers to
pay attention to the presence of a few pre-existing conditions. These conditions concern:
there needs to be some innovation in at least a certain (developed) phase of niche formation;
there needs to be at least some form of ‘governance’ (hence, not only market actor
involvement, and coordination via the price mechanism, but also public and civic
involvement, and at least some form of government intervention to support niche
formation);
134
the siting of the case study needs to be in a developing country (i.e. not in a Western
country).
Finally, we want to address limitations that should be kept in mind when reflecting on the
results of this study. It mostly entails the fact that the selected case study is in India, against the
background of a developing country. This arguably contributed to focusing on a sectoral niche
that was still immature or under-developed. In future research we suggest GAT to also be used
in empirical research comprising case studies of niches that are more developed, i.e. in further
stages of niche formation (e.g., early niche formation, late niche formation). Analyzing and
comparing cases in different development stages would allow researchers to learn more about
mechanisms that influence sectoral niche formation in a specific region with a dynamic
governance process. This would probably entail to (also) select cases of sectoral niche formation
in developed countries. Moreover, an attempt could be made to compare governance of two
regions within the country with separate state jurisdictions; this should be explored in future
research.


137
6.1 Introduction
This chapter aims to analyze the state of governance in the city of Ajmer in the state of
Rajasthan, to assess how supportive or obstructive the governance context is vis-à-vis niche
formation of NZEBs. The main research question is: What is the state of governance in Ajmer
regarding NZEB niche development?
This chapter is structured as follows: Section 6.2 briefly describes the theoretical
frameworks which are explained in detail in chapter 3 and chapter 5, to make this chapter
separately readable followed by the research design and methodology in section 6.3. In Section
6.4, the results of the case study analysis are presented. And finally, in Section 6.5, the
conclusions are presented.
6.2 Theoretical framework
The two theoretical frameworks that will be applied to understand the niche formation
process of NZEBs from a governance perspective in the city of Ajmer are (GAT) and to some
extent notions of SNM. Chapter 5, section 5.1 elaborates on governance and its influence on
facilitating and stimulating innovation in a particular context. This leads to introducing the
GAT as a tool considered useful to analyse governance aspects of niche formation processes.
Secondly, notions and applicability of SNM will assess (as presented in Chapter 5, section 5.2).
It explains niche formation and diffusion of novel sustainable technologies through the
formation of protected niches, and gradual breakdown of regime barriers. SNM and GAT were
previously compared conceptually in this thesis (see chapter 5 and Chapter 3) to advance the
understanding and the analytical approach of governance processes that are relevant to niche
formation and deepen understanding of governance of innovations in a given economic sector.
Empirically, the paper uses GAT as the main theoretical framework to assess the state of
governance in Ajmer City.
6.3 Research design and methodology
To assess the governance for NZEB niche development, the study uses the analytical
framework of GAT which is complemented by four evaluative qualities. For the empirical
study, the City of Ajmer is assessed on the strengths and weaknesses of the governance context

138
towards niche formation of NZEBs and addresses how it compares and contributes to more
traditional niche formation analysis using SNM.
6.3.1 Case selection – Ajmer city
The Ajmer region is one of the fast-growing cities in the state of Rajasthan with a total
population of 551,360 (as per 2011 census) and is the fifth largest city in the state in terms of
population growth, which is 11.93% over the last decade (ADA, 2016).
Ajmer comprises a total geographical area of 8575.29 hectares. According to the master
plan of 2033, land use distribution in the city is nearly 69% under residential use, 3.29% for
commercial buildings use, 12.76% for industrial use, 12.52% of public and semi-public facilities
and 12% of green space and forest area use. Nearly, 70-75% of land use in Ajmer comprises of
buildings (ADA, 2016), refer figure 19.
Buildings consume vast amounts of resources, mostly during construction and operation.
Energy consumption in buildings is attributed to lighting, heating and cooling facilities. With
growing income and urbanization in the city, demand as well as affordability for energy has
increased tremendously. Currently, 99.6% of the city’s population is connected by electricity
grids and 5% of the total power supply in the city comes from renewable sources (AVVNL,
2015). Due to increasing demand for energy in buildings, the city experiences several scheduled
and unscheduled power outages (AVVNL, 2015).
The city lags in innovation and transformation of the building sector regarding energy
conservation measures and various other sustainable initiatives (AMC, 2015). Currently there
are no LEED44 or GRIHA certified buildings (AMC, 2015). In 2015, the city Mayor proposed to
run its railway station on solar energy. Moreover, on many public-sector buildings, roof top
solar PV for energy generation has been installed following the use of net metering policy
(AMC, 2015). The population is growing rapidly and so is the demand for more housing. This,
in turn, will increase the demand for energy in the city. Low or zero energy buildings can bring
innovation in the city’s building sector.
Apart from this, Ajmer was selected for several national urban development schemes in
2014. The most prominent one concerned the flagship Smart Cities Mission under the Ministry
44 Leadership in Energy and Environment Design –United States Green Building Council

139
of Urban Development (of the national government). Under the mission, a proposal was made
to increase the adequate supply of electricity using smart metering, harnessing renewable
energy by installing rooftop solar panels at all the public buildings and in open spaces,
converting all the street lights into energy efficient lighting using solar energy, and constructing
public buildings as green buildings, while meeting standards to attain green building
certification (such as LEED or GRIHA). Implementation of these (proposed) initiatives is
expected to encourage innovation in the Ajmer building sector and thereby paves the way of
energy transition in the city.
Apart from the Smart City Mission, there are more schemes in the city which are being
implemented: i.e. the Atal Mission for Rejuvenation and Urban Transformation (AMRUT); the
Heritage City Development and Augmentation Yojana (HRIDAY) under the Ministry of
Housing and Urban Affairs; Housing for All; the Swach Bharat Mission; and the National
Urban Livelihood Mission. They focus on improving the city’s existing infrastructure.
Figure 19 : Ajmer master plan 2033 (source: ADA, 2015)
Given these characteristics we view Ajmer as a city in India which is subjected to the
implementation of several urban development and infrastructure schemes. The population is

140
growing rapidly and so is the demand for more housing. This, in turn, will increase the
demand for energy in the city. Assessment of the energy transition in the building sector is of
interest under the backdrop of growing population, increase in energy demand by buildings, as
well as growing energy consumption patterns. For this reason, we consider Ajmer City an
appropriate case to assess its governance setting vis-à-vis NZEB niche development. Thus,
comparing the governance assessment of Ajmer city with New Delhi will be of great interest as
New Delhi is overly urbanized and has the potential to lead the way for transitions in other
cities or regions. In contrast Ajmer is relatively a smaller and growing city where concepts of
energy efficiency in buildings are very new as well as of NZEB concept. Hence the two
contrasting regions would provide a more pragmatic understanding of NZEB niche formation
and the state of governance for future uptake in these regions. The comparative analysis will be
conducted in concluding chapter.
6.3.2 Data collection
To assess the governance system, selected key stakeholders were identified for data
collection which entailed a set of interviews in the Ajmer region followed by collection of
secondary data sources (i.e., published reports, newspaper articles etc.), participation in
meetings, and field trips to selected building sites. The interviews involved experts from
ministerial authorities, state government officials, officials and civil servants from the city
authorities (from the municipality and the development authority), building sector
associations, financial institutions, private sector buildings owners, project developers, service
providers, architects, consultants, (academic) researchers, manufacturers, and technology
suppliers.
For all the identified stakeholders, an attempt was made to contact at least two to three
actors from each stakeholder category (e.g., architects, academics, or developers). Contacts
were made via e-mail, which were followed by phone calls. In some cases, potential
interviewees needed approval from their respective organizations. This especially applied to
government agencies and international aid agencies. The first author (who participated in the
USAID PACE-D TA Program which included NZEB promotion and awareness raising
activities in one of the work packages) also used her professional network of expertise to get
access to some of the selected organizations. After contact was made, each of the contacted

141
experts was briefed about the research project, its aims and objectives. As a result, eight in-
depth interviews were conducted between September 2015 and February 2016 with the
stakeholders who agreed to participate.
In addition to collecting data via face-to-face interviews, the researcher participated in
important project-based meetings which included accelerating NZEB awareness and
knowledge in the building industry. Finally, secondary sources of data were gathered and
analyzed (e.g., published reports, newspaper articles, project briefs, etc.).
A semi-structured questionnaire was prepared for the interviews (see Appendix A). The
questions were largely based on the five dimensions of the GAT framework along with the four
complemented quality criterions (as described in Chapter 5, section 5.2). In addition, questions
containing key concepts from SNM were included. All the interviews were conducted face-to-
face, recorded and transcribed into text files (interview transcripts), which were then used for
analysis using the qualitative analysis software of ATLAS ti. This software program assists
qualitative researchers to locate, code, and annotate findings in text files, to weigh and evaluate
their importance, and to visualize the complex relations, supporting data analysis (i.e., the
interview transcripts) (Muhr & Friese, 2004). The section below presents the results of the
analysis using the GAT dimensions.
6.4 Results
6.4.1 Extent: Are all relevant elements taken into account?
Levels and scales: All governance levels ranging from the local level to the national level are
relevant and present, but with some restrictions. No specific NZEB goals formulated by those
governments were observed. The context is positive in terms of the large extent of the levels
involved from national, state to local level implementation. Examples concern the presence of
the Ajmer Municipal Corporation (AMC) and the Ajmer Development Authority (ADA), which
work under independent jurisdictions and govern different regions within the city in terms of
civic amenities, infrastructure, planning and enforcement of regulations. Similarly, for building
approval, authorities such as AMC and ADA are important. However, for a building to get
approval to become a NZEB or very low energy building it also needs (additional) approval
from other authorities, such as the electricity department - Ajmer Vidyut Vitran Nigam limited

142
(AVVNL), and from renewable energy department. Therefore, several separate approvals and
various stages of building construction in projects are required. This makes it a tedious and a
complex process. In sum, it can be reasoned that the levels and scales dimension have a
restrictive context.
Actors and networks: At the time of data collection there was no active NZEB stakeholder
network in the Ajmer city. Absence of NZEBs or any green buildings in the region was the
primary cause. It seems that existing mainstream building sector stakeholders lack technical
capacity to design NZEBs due to a lack of awareness, knowledge and expertise. These actors
viewed this as the responsibility of local bodies and the development authority’s (AMC and
ADA) to enforce, raise awareness and build capacity for green buildings. So far, the traditional
building sector actors include architects, project developers, contractors, material suppliers,
public sector, municipalities, development authorities and energy distribution operators. In
addition, energy efficiency and renewable energy technology manufactures, and suppliers have
not been able to establish a niche market in the Ajmer city nor have they been involved in any
network that advocates the uptake of NZEBs. And neither educational institutions, the
research community nor NGO’s become motivated to participate. Due to absence of some of
the key actors, the extent of the actor and networks context is considered as rather restrictive. In
addition, multiple stakeholders involved in local level implementation create restrictions and
make the context more complex.
Problem perceptions and goals: The Rajasthan state government has notified ECBC (Energy
code for buildings) implementation which might bring several transformations in the
commercial buildings sector pertaining to the use of energy efficiency design and
technologies for the construction of new commercial buildings. Most actors see NZEB pilots
from the public sector as crucial to raise knowledge and awareness. Many mainstream actors
believe that NZEBs would be costly due to the use of new sustainable technologies. Hence, a
lack of knowledge and expertise among existing architects was also brought to light. This
could be a major challenge in the region as architects usually play a lead role in the design
and supervision of building design and construction. Hence, demonstration projects may help
in changing these expectations which will encourage learning and awareness about the
concept and therefore support in goal setting at regional level. Recently, the AMC has

143
installed roof top solar PV systems to generate electricity and meet the buildings energy
demand with self-generated power production. The extent of problem perceptions and goals
can be considered as neutral.
Strategies and instruments: Several instruments are part of the policy strategy, but they do not
particularly address the concept of NZEB, which makes it difficult for interested actors to
understand the application of these instruments for construction of a holistic NZEB concept.
There are regulatory based, and subsidy-based instruments which provide an impetus for
investment to a certain extent. Examples are net- metering and a solar roof top policy.
Awareness raising, and capacity building are important instruments to nurture a new niche for
future large-scale implementation. However, sadly they are still missing. Therefore, the extent
is considered as restrictive.
Responsibilities and resources: There is a lack of understanding on the level of responsibility
with local government, energy distribution authorities, and with the development authority.
The key officials from the local government are not aware nor are they updated about national
and state level initiatives for EE and RE implementation or for NZEBs. There is also a lack of
sufficient resources to raise the capacity of city officials who are active in NZEB or energy
efficiency building implementation. The authorities (AMC and ADA) propose architects and
project developers to take the initiative. However, private sector actors expect government
authorities to be the key promoter and initiator of NZEBs and energy efficient buildings. This
leads to a deadlock situation, in which no one wants to take any responsibility. For these
reasons the governance context on responsibilities and resources can be judged as rather
neutral.
6.4.2 Coherence: are the elements reinforcing rather than contradicting each other?
Levels and scales: At the ‘levels and scales’ dimension a rigid hierarchical approach is
followed, making each level an isolated one, which in turn makes the implementation of the
NZEB concept very difficult, particularly because there is little inter agency-cooperation. The
various levels, the state and regional level governments follow a command and control
(authoritative) approach. At the local level, various separate stakeholders deal with different
aspects of NZEBs (e.g. getting building permits with ADA and AMC; getting approval for
energy, net metering with AVVNL; a lack of implementation plan and communication for the

144
ECBC code implementation by the municipality). Due to a lack of coherence between the
different government levels NZEB stimulation is likely to suffer in future. The coherence aspect
of the levels and scales dimension is therefore viewed as restrictive and highly complex.
Actors and networks: Interaction between various mainstream actors seems absent. The actor
network for NZEBs is negligible, especially with actors who are involved with issues regarding
energy efficiency and renewable energy in buildings. Another observation was a lack of
knowledge and expertise; current building sector stakeholders fail to collaborate or interact, and
do not develop networks. Mainstream market actors have expectations that others take the
responsibility and initiate network activities. For example, public agencies, such as the ADA
and the AMC expect architects to take the lead in initiating; and vice versa architects expect the
ADA and AMC to develop and expand the network formation spurring innovative concepts
like NZEBs. Perhaps it is fair to state that there is a status of deadlock since there is nobody
who initiates action, and the actors are only waiting at each other and nothing happens. Not
surprisingly, thus far no awareness raising, or capacity building initiatives have been organized
to garner interest from the important stakeholders in the building sector in the region. For these
reasons the actors and networks context can be viewed as rather poor.
Problem perceptions and goals: The various perspectives on NZEBs held by actors do not look
in conflict with each other as the problems highlighted mostly concern a lack of knowledge,
expertise on NZEBs, and expectations among stakeholders that NZEBs are costly. In general,
the stakeholders agreed on this, and see this is a rather easy way to neglect green buildings and
NZEBs and expect nothing to happen afterwards. Thus, this coherence is in fact negative and
the context is restrictive.
Strategies and instruments: Various isolated strategies were found present. They are directed
from the state level on solar policy, and energy efficiency but not approached in a holistic
manner for NZEB. The integration of energy efficiency and renewable energy in building
design and construction is not dealt with in a combined fashion. Instruments such as subsidies
for solar installations are present but with little awareness. In addition, there is complete lack of
awareness raising initiatives by the local government. Hence, the context on coherence of
strategies and instruments is rather seen as restrictive.

145
.
Responsibilities and resources: Responsibilities and resources are disjointed in a very complex
way with no clear boundaries mentioned at each local level. This encourages several authorities
towards corruption and non-compliance of the responsibilities and under-utilization of
resources making the context on coherence of responsibilities and resources rather restrictive.
6.4.3 Flexibility: are multiple roads to the goals permitted and supported?
Levels and scales: There is lack of flexibility between levels, in relation to both vertical and
horizontal scales. The existing implementation framework leads to following a multi-level,
hierarchical, system with little room for flexibility, making it difficult to move up and down a
level when it is concerned with NZEB approvals with various organizations such as ADA, AMC
or AVVNL. Therefore, this context can be viewed as rigid and restrictive for NZEB innovations
to emerge.
Actors and networks: Since the actor network is not active, it is relatively easy for interested
building sector stakeholders to conceptualise and initiate the network once the benefits of
NZEBs or highly energy efficient buildings are known to them. Hence the context is supportive
for new actors to join existing networks and projects. Any active and interested actor with
knowledge about NZEBs can steer the network formation. These opportunities for dynamic
development of the networks are making the flexibility of the context highly supportive.
Problem perceptions and goals: Since there are no concrete goals by the ADA and AMC for the
building sector towards efficient use of energy, it is still possible to re-assess, ‘re-invent’ or ‘re-
formulate’ any new goals or introduce them. Energy efficiency design, technology and
renewable energy goals for the building sector can be jointly packaged under one holistic NZEB
policy or building code. For these reasons the context can be seen as supportive for flexibility
regarding goal setting and problem perspectives.
Strategies and instruments: Since the NZEB concept is still in a nascent stage with no pilots
yet, it may be possible to combine and make use of different instruments. In 2017, the revised
ECBC code was issued at the national level, setting a minimum energy performance standard

146
for commercial buildings which introduces super ECBC buildings with renewable energy
integration, hence it allows for future updating to include NZEB goals within the ECBC code.
In addition, the Rajasthan state solar policy will act as a supportive instrument to make NZEB
goals more robust. These instruments are adjustable as per the local needs and climatic
conditions and hence provide room for more innovation for NZEBs in future. The context is
supportive.
Responsibilities and resources: The line between the practical responsibilities of the
development authorities and municipality is mostly as sharp as it is on paper, which means it is
stringent as mentioned and prescribed with less flexibility. Pooling of resources is also difficult
between the authorities, even to an extent that officials work in silos devoid of any interaction
between authorities such as no interaction between ADA and municipality. This situation was
also observed between various departments within the same authority. This often obstructs the
implementation of policies like ECBC, lack of information dissemination from one authority
etc. Sometimes even discouraging pilot projects from becoming successful, discouraging
flexibility. Finally, the flexibility of responsibilities and resources is also assessed as restrictive.
6.4.4 Intensity: how strongly do the elements urge changes in the status quo or in current developments?
Levels and scales: There seems to be no strong political nor national government support for
forceful measures, but several national programs and schemes on city brands like ’Solar city’, or
‘Smart city’ can help to make the integrated NZEB concept more acceptable among building
sector stakeholders. However, most regulatory measures are only voluntary ones with a
preventative nature. Intensity of levels and scales looks like a neutral governance context, for
NZEB implementation.
Actors and networks: Since many stakeholders are not aware of the NZEB concept, and neither
do potential end users (due to perceived high capital costs), there is an absence of (any) NZEB
demonstration projects. Apparently, there is no pressure from an actor or coalition in support
of behavioural change or management reform in relation to NZEB. This is likely related to a
lack of awareness, or a lack of technical knowhow. The context does not motivate private sector

147
actors towards any strong changes from the business as usual scenario. Hence, the context is
considered as restrictive.
Problems perceptions and goals: The goal of mandatory ECBC implementation with separate
RE goals is ambitious as compared to the existing BAU scenario. This is particularly due to lack
of compliance and implementation checks by public authorities who have no measurement and
verification protocol at hand. The lack of awareness and capacity among the existing building
sector actors may lead to the existing scenario to change much slower than might have been
expected. The governance context is seen as restrictive.
Strategies and instruments: The existing instruments do not exert any transformation at large.
Amending existing policies and bye-laws will take several years. Moreover, there is a lack of
compliance to existing policies, there are violations of bye-laws, and there is a problem with
corruption and public authorities, causing a restrictive context.
Responsibilities and resources: An increasing level of effort is made towards the adoption of
solar roof top policy by installation of solar technology for self-generation in public buildings.
The resources are being used with partial government subsidies. This creates interest from the
building sector toward replication of the effort. However, it is difficult to say whether funds are
sufficient for NZEB niche development. However, the authorities currently lack the capacity to
facilitate the uptake of NZEBs. Hence, the governance context on intensity in responsibilities
and resources can be considered as poor. The intensity of responsibilities and resources is also
assessed as restrictive.
6.5 Overview
This section provides an overview of the overall governance context in Ajmer regarding the
niche formation of NZEBs.

148
Figure 20 : GAT results - Ajmer region
In the Ajmer city case study (figure 20), the governance context is considered as highly
incoherent, with weak extent, moderate flexibility and weak intensity towards NZEB niche
development. This poor governance condition makes the context less supportive towards
NZEB adoptions as primary elements that are badly required for implementation are missing.
Due to the deficiency in extent, relevant issues and problems, actors and policies are ignored.
The incoherent, relatively flexible and weak intensity dimensions reflect limited governance
capacity to initiate any innovation and transition of building sector towards more energy
efficient buildings. Flexibility in terms of actor network formation, problem perceptions and
policy instruments are given to lower level actors to enable them to overcome issues associated
with incoherence existing in the five dimensions of governance. However, in this weak
governance context, opportunities exist where the incoherence can lead to undesired (and
unnoticed) defections from the intended goals. This condition can therefore be a small window
of opportunity for NZEB niche to conceptualize in the city through on-set of few NZEB
demonstration projects.
6.6 Conclusion
In this chapter, the state of governance towards NZEB niche development was analyzed in
Ajmer city. The study adopted a case study research design to assess the governance against
Criteria
Dimension
Extent Coherence Flexibility Intensity
Levels and scales (-)
Actors and networks (-) (+) (-)
Problem perspectives and goal ambitions
Strategies and instruments
(+) (-)
Responsibilities and resources
(+)
Colours: red: restrictive; orange: neutral, green: supportive

149
the four qualities used in the “GAT” of extent, coherence, flexibility and intensity of the five
structural components of the concept of “governance” as developed in the GAT. In the Ajmer
region, the governance context was assessed as rather restrictive for NZEB niche development.
The study shows a lack of extent, creating restrictive capacity of the governance to act towards
development of a new NZEB niche. In addition, the region was incoherent, moderately flexible
along with weak intensity. Therefore, NZEB niche innovation and adoption can be viewed as
difficult for wider future uptake. The levels and scale are not in line for NZEB niche formation
at city level. The actors are not aware and do not have enough knowledge about NZEBs,
therefore the network for NZEBs is also presently missing. Due to lack of knowledge and
awareness the visioning and goal setting is currently not present. Various instruments which
can support NZEB adoption are only present on paper with very little adoption. Like the New
Delhi region (chapter 5), the Ajmer region lacks resources in terms of both capital and skills-
based capacity to design, construct, adopt and implement large scale NZEBs.

150


153
7.1 Introduction
India’s energy transition towards more energy efficient buildings like NZEBs shows slow
growth as the niche status of NZEB is still rather immature (as resulted from the analyses in the
previous case studies conducted in India in Chapter 4-6). To further our understanding of
transitions and governance, I seek to learn from transitions in the building sector in other
countries in South-East Asia. Considering the growth of the green building sector in countries
such as Singapore, this should be seen as an extension to the study we conducted in India to
capture the growth trajectory and lessons learned by comparing the two independent cases.
Therefore, we feel it is necessary to study the current support system for green buildings and
other low energy buildings (such as NZEBs) and assess whether the ‘innovation system’ have
favourable conditions to spur large scale adoption of green buildings and bring transformative
change.
In this chapter45, we attempt to use the theoretical frameworks that were also used when
analysing case studies in India (see previous chapters) - that is Sectoral System Innovation
Assessment Framework (SSIAf) and Governance Assessment Tool (GAT) - to assess the quality
of governance and the quality of sectoral innovation system. First, SSIAf will be used as the
primary framework to draw comparisons between India and Singapore building sector for
innovations in energy efficiency in building sector. The key components are shaping of
expectations, the actor network, institutions, learning process, and stimulating market demand. As
stated in chapter 3, the SSIAf framework is an integrated assessment framework adopted from
SNM and SIS giving a more holistic approach to a niche innovations and transitions of new
sustainable technologies. In addition, the study will further the analysis by drawing insights
using the GAT framework to assess the quality of governance for transitions in both the
countries. SSIAf components will be assessed against the four quality criterions of the GAT
framework, i.e. extent, coherence, flexibility, and intensity.
45 This chapter is partly adapted from a study by Vidu Siva et al. (2017)’. The thesis title “Assessing the potential for an energy transition in the building sector in Singapore” attempts to study the supportive conditions in the Singapore building sector for a large-scale uptake of green buildings in Singapore. The study used theoretical framework of Sectoral Innovations Systems (SIS) analyzing the key components of Technology, Actor Network, Institutions and Market Demand.”

154
This chapter aims to provide greater understanding of transitions and quality of
governance in spurring the transitions toward green energy efficient buildings in Singapore,
when compared to India. Both countries have diverse building sectors, scales, climatic
conditions, and existing socio-political and economic scenarios. For this reason, the focus of the
analysis in this chapter is on Singapore, a country that quite successfully addressed innovations
of “green buildings” principles and succeeded to some extent in “greening” its’ built
environment (Siva, Hoppe, & Jain, 2017). In this study, the conditions are explored that spurred
and hampered innovation, and governance of “green buildings”, and towards niche formation
and innovation-diffusion of NZEBs, seeking to learn from the approach taken in Singapore and
thereby drawing comparisons with the complex building sector in India.
The chapter is structured as follows: Section 7.2 presents the key characteristics of the green
building niche and its policy support framework in Singapore. Section 7.3 elaborates on the
conceptual and analytical approach that will be used to compare the two cases. Section 7.4
elaborates on the method used in this study. In section 7.5 the results of the analysis are
presented. In section 7.6 the conclusions are presented and discussed.
7.2 Green building sector in Singapore
As one of the few countries in the world with a 100% urban population (World Bank,
2013), Singapore’s building sector consumes up to half of the nation’s total energy consumption
(Serene Peh et. al., 2014). In 2005, the Building Construction Authority (BCA) of Singapore
launched the “Green Mark” scheme to impel the construction industry towards a more
sustainable built environment. According to the BCA, the Inter-Ministerial Committee on
Sustainable Development (IMCSD) has set a target of “at least 80% of the buildings in
Singapore achieving the BCA Green Mark Certified rating by 2030” (BCA, 2013). This will
require a major transformation to change the way buildings in Singapore are designed,
constructed, and operated. At present, more than ten years after the introduction of the
certification scheme, it is estimated that green buildings in Singapore represent about 27% of
the nation’s total gross floor area (Sang & Chong, 2015). If this type of growth persists, it is
uncertain whether Singapore will be able to meet the IMCSD target. Such targets also motivate
the green building industry to expand further and beyond mere green buildings, and
experiment with NZEBs.

155
In Singapore, the building sector is governed by the BCA. The BCA is an agency under the
Ministry of National Development, “championing the development of an excellent built
environment for Singapore” (Sang & Chong, 2015). According to Ho (2012), by 2020, 29% of
Singapore’s carbon emission is related to energy use in residential and commercial buildings.
For this reason, it is important for the BCA to keenly address energy efficiency issues within
this sector.
In 2010, the first Zero Energy Building (ZEB) in South-East Asia was established. In fact, it
concerned a retrofitted existing building. This effort was an exemplary effort by the
government of Singapore through BCA, NUS and MOE. The lessons learned, and the
experience gained in the construction and operation of NZEB was considered very useful and
valuable for the entire sector and green building niche as the building industry strives to
achieve the set targets. The technologies in NZEB that are currently assessed in test beds can
potentially be applied to many of the existing buildings, of which the owners strive to obtain a
Green Mark Certification soon (BCA, 2010).
7.1.1 Green building rating tools in Singapore
In Singapore, the BCA adopted the so-called “Green Mark” scheme in January 2005. It
has been described as the LEED scheme in the US for countries in the tropical regions. The
Green Mark scheme places greater emphasis on energy efficiency; it has been tailored for a
tropical climate with the cooling of inner spaces using air-conditioning; and it has higher
standards of measurement and verification, using more precise instruments to monitor
equipment performance (Sang & Chong, 2015). According to the BCA, “It provides a
comprehensive framework for assessing the overall environmental performance of new and
existing buildings to promote sustainable design, construction and operations practices in
buildings. It is intended to promote sustainability in the built environment and raise
environmental awareness among developers, designers and builders when they start project
conceptualization and design, as well as during construction” (BCA, 2015; p45). The “Green
Mark” scheme has been endorsed and supported by several ministerial bodies in Singapore,
such as the National Environment Agency (Sang & Chong, 2015).

156
The assessment system of the “Green Mark” scheme awards points for specific energy
efficient and pro-environmental features and practices that can be integrated into building
projects and designs. These features must be more sustainable than the normal practice
observed in conventional buildings. The total score provides an indication of the environmental
friendliness of the building design and operation. Depending on the overall assessment and
score, the building will be certified as having met the BCA “Green Mark Platinum” standard,
the “Gold Plus” Standard, the “Gold” standard, or the “Certified” rating, with “Platinum”
being the highest level of certification (Sang & Chong, 2015).
In line with the “Green Mark” scheme, since 2005 three strategic “Master plans” were
issued and published by the BCA. In 2012, the Building Control Act was updated to include
legislation on the certification of buildings. It stated that newly constructed buildings must at
least achieve a certain minimum certification qualification. In 2013, it became mandatory to
building owners to submit energy consumption data to the BCA. Since 2014, building owners
are obliged to conduct periodic energy audits, and to at least achieve the minimum “Green
Mark” certification level when updating or retrofitting their cooling system (Serene Peh et. al.,
2014).
There is a requirement that certified “Green Mark” buildings must be re-assessed every
three years to maintain their “Green Mark” status. Newly constructed and certified buildings
will subsequently be re-assessed under the existing building criteria. The initial certification for
new buildings will be awarded based on their design. However, after one year, assessment will
be based on the building’s actual performance (Sang & Chong, 2015)
7.2 SSIAf framework
The SIS and SNM frameworks represent different perspectives on how processes of
innovation and socio-technical transformations develop (Markard & Truffer, 2008).
Considering the commonalities and differences between the two frameworks, a further
understanding was developed to complement the two frameworks and overcome each other’s
limitations if any. For this reason, an integrated framework was conceived (e.g., see chapter 3)
to bridge the gap between the two frameworks in innovation and transition literature. This
integration supported the development of an assessment framework for assessing the status
157
quo of a given (radical) niche development within a sectoral innovation system (i.e. innovation
in the building sector towards low energy buildings).
In the case study analysis of NZEB niche innovations in India, the integrated framework
provided us with new analytical insights to study niche development processes and further
understanding in the innovation and diffusion processes of sustainable technologies within
economic sectors (hence, a sectoral part of the regime level). In the integrated framework, we
developed independent components which help as conceptual building blocks to understand
sectoral niche development processes and innovations. These building blocks are: shaping of
expectations, actor networks, institutions, learning process and market demand creation (figure 12,
Chapter 4).
We envisage the use of this framework in our study to assess two embedded empirical
cases (in this chapter a comparison between building sectors in India and Singapore). This
allows for assessing and reflecting the cases using the SSIAf concepts. We expect that these
components jointly influence the development of innovations and related niche formation. The
integrated framework (SSIAf) forms the conceptual basis of our research. Table 1 presents an
overview of its key conceptual components. For each component (or cluster of components) the
key conceptual items are presented.
In addition to using the SSIAf, the GAT (Chapter 3, section 3.3) also helps us to advance
understanding of the quality of governance in a given context (e.g., governance of NZEB niche
developments in the Indian building sector, or governance of sustainable energy technologies
that are relevant to the sustainable transition of the building sector in Singapore), or
identification of barriers to the implementation of a given policy. Combining insights from the
two theoretical frameworks allows for broadening the scope and furthering the understanding of
long term sustainable transitions, sectoral innovations, implementation of transition–oriented
policies, and assessment of the role and state of governance’ in innovation processes of economic
systems. The key qualities criteria of the GAT will be assessed per SSIAf component. The four
quality criteria of GAT are: extent, coherence, flexibility, and intensity. See Chapter 3 for a more
detailed description of the two frameworks.

158
7.3 Methods
The research design of the study presented in this chapter involves an in-depth case
study of the Singaporean building sector. It will be compared against the innovation system
and niche formation in India’s building sector (the latter as presented in Chapter 4). A case
study research design was chosen to investigate the phenomenon in detail in its existing
context in Singapore (cf. using a rich set of qualitative data). Singapore was chosen as the case
study for a variety of reasons; one being that Singapore is viewed as a frontrunner in the green
building movement in the tropics and subtropics. Across Asia, Australia, and Africa, a total of
71 cities have adopted the “Green Mark” certification scheme. In line with this, and with the
IMCSD’s goal of having 80% of green buildings “Green Mark” certified by 2020, it is therefore
valuable and interesting to explore the uptake of green buildings, and its contribution to the
energy transition and innovations in the Singapore building sector towards NZEB niche
formation. Singapore possibly serves as a good practice, from which valuable lessons can be
drawn as compared to the building sector in India. Therefore, it is useful to explore the reasons
(and conditions) that account for successful green building innovation in this country and
thereby drawing comparative lessons with India.
Considering the advances in green building sector in Singapore, the case study can soundly
be compared to innovation in the Indian building sector to provide us with a broader
understanding of transitions and polices that spur sustainable transformations of economic
sectors.
Data collection in Singapore involved a set of eleven in-depth interviews, secondary data,
participation in two conferences, and a green building tour. The interviews46 were divided into
two sets: namely ‘primary actors’ and ’secondary actors’ following the classification given in
SIS theory. The first set of interviews involved six ‘primary actors’ who were directly involved
in one or more green building projects. This group of interviewees consisted of building
developers, architects, technology providers, and building occupants. These interviews
provided primary knowledge regarding green building development in Singapore as these
actors have been directly involved in green building demonstration projects (Siva, Hoppe, &
Jain, 2017).
46 Vidushini Shiva collected the data in Singapore under the supervision of Dr. Thomas Hoppe and Mansi Jain between May-September 2015

159
The interviewees represent almost all the relevant actors in the complex value chain of the
building construction sector. Additional information was gathered using secondary data and
information from the other interviewees addressing them (Siva, Hoppe, & Jain, 2017). The
second set of interviews was conducted with five ’secondary actors’. This interviewee group
consisted of government officials, representatives from consultancy groups and non-profit
organizations, and academic researchers. This was done to further understand the dynamics
between primary and secondary agents, and the role of the support system in facilitating the
energy transition towards green buildings in Singapore (Siva, Hoppe, & Jain, 2017). The data
collected for Singapore was first analysed separately following the SIS Framework and later
with SSIAf framework.
The results are then compared with SSIAf results corresponding to the study of NZEBs
niche innovations in India (Chapter 4). This comparison will largely focus on the SSIAf
component that supports the uptake of low energy buildings in the two given regions and the
quality of governance for innovation and transitions in that region. Quality of governance
assessed against the SSIAf components that support such transitions is also explored in both
cases and identified in the following sections. In the case of India, the interviews were
conducted during field visits to India from September 2014-July 2016. It should be noted that
actor interviews in the Singapore case study were shortlisted based on their presence as
primary and secondary stakeholders from building sector and involved directly or indirectly
with green buildings. In the case of India, the selected set of stakeholders included a set of
niche actors (quite like ‘primary actors’) who were found to be directly engaged in NZEBs
(which are also certified as ‘green buildings’), and demonstration projects that were highlighted
as innovation projects. In addition to niche actors, niche outsiders or ‘secondary actors’ were
also included during the data collection process to understand sectoral actors’ perception
towards innovation niches such as NZEB niche in India. In total, 18 interviewees participated
in the interviews focusing on SSIAf components, and 11 actors in interviews focussing on
governance (GAT) (in total 29 interviews in India case study).
7.4 Results
The results of the analysis are presented as per conceptual component of the SSIf
framework. The results are first drawn for the Singapore case, and are followed by results for

160
the Indian case. Each section, then, further elaborates on the quality of governance conditions
which can spur these transitions in both the regional cases.
7.4.1 Actor networks and interactions
A wide range of actors were found to be involved in the building construction sector for
green buildings and low energy buildings both in India and Singapore. Primary actors include
architects, engineers, consultants, suppliers, technology providers, building owners, building
developers, and tenants. Secondary actors include the BCA in Singapore and the Bureau for
Energy Efficiency (BEE) in India and other government agencies, green consultants, investors,
non-profit organizations and councils, and research institutes (often academic). However, in
Singapore it was found that BCA occupied the most influential position and many interviewees
agreed that they were heavily dependent on the BCA. Unlike in India where no single actor
(especially government agencies) was found to strongly influence innovations in the building
sector.
In Singapore, the national government was very active in trying to forge interaction among
the various stakeholders. Eight out of eleven stakeholders acknowledged that the government
has done a good job in providing platforms for interaction through consultation sessions. This
resulted in the industry responding according to the agenda’s set by the government making
the discourse unidirectional and one-sided. This was perceived in one aspect as supportive
towards transition and innovation initiatives taken by government; while on the other hand it
was also found to limit the effectiveness of actor interactions for novel innovations to emerge.
In the case of Singapore, concerns and ideas were not voiced in a multi-participant decision-
making process, limiting the innovation process as unidirectional, and making it more
incremental (unlike radical change, which is a condition that is required for upsetting the
existing regime).
In the case of India, the national government (BEE) was not seen by most interviewees as
the most influential actor in initiating the direction for green buildings or NZEBs innovations,
with no formal platforms for interactions apart from some conferences under bilateral projects.
Six out of seven interviewees (secondary actors) agreed that green building rating tools were
mostly industry initiatives (adhering to organisations in the networks surrounding the LEED,
IGBC and GRIHA rating tools) with less impetus provided by the government. This led actor

161
networks to emerge without any concrete direction and in multi-faceted discourse. However,
for low energy buildings and NZEBs, actors were found to be apprehensive and reluctant to
start a new social network on their own. Most often they only operated within (single) project
networks. This situation led to a ‘lock in’ between government and the industry, each hoping
that the other takes the first step towards such innovation initiatives.
Motivated private sector actors were found to operate in isolation waiting for the
government to respond, adopting industry-led green building rating tools. Thus, no formal
network emerged either via government initiative or via industry actors. This led innovation
processes to be slow, and only located within localized demonstration projects as remote
projects in the industry. However, this isolation led to an increased level of interaction
amongst the project actors within each innovation project’s boundary. Each of the studied
innovation projects in India followed an integrated design approach which brought all the
project stakeholders into the discussion from the conceptual design stage, thereby showing a
considerable level of interaction and building of new networks between the project team
members. Therefore, it can be observed that actor interactions were active with small niche
projects failing to scale-up in the industry.
This situation was not found in the Singapore case, where collaboration between
stakeholders was regarded by interviewees as ‘poor’. This was related to the absence of an
approach using an integrative design. Different stakeholders typically come in at different
stages of building projects, which often leads to a lack of coherence and sub-optimal design.
This means that project goals could become diluted due to the temporal involvement of
stakeholders (Siva, Hoppe, & Jain, 2017). In Table 13, the actor-network situation in both
countries is depicted as per the four quality criteria from GAT, to analyse the current
governance conditions for establishing more robust actor networks. Each assessment is
represented by a color code of green, orange, and red. Where green is signifying a positive
condition for implementation, orange signifying the situation is neutral and not moving in any
direction, and red signifying a negative governance condition.

162
Table 13: Assessment of actor networks and interactions
Extent Coherence Flexibility Intensity
Are all relevant stakeholders Involved? Who is excluded?
What is the strength of interactions between stakeholders? In what ways are these interactions institutionalized in joint structures? What is the history of working together? Is there a tradition of cooperation?
Is it possible that new actors are included or even that the lead shifts from one actor to another when there are pragmatic reasons for this? Do the actors share in ‘social capital’, allowing them to support each other’s tasks?
Is there a strong pressure from an actor or actor coalition towards behavioral change or Management reform?
Singapore All relevant actors for innovations in green buildings were found to be present.
Interaction between stakeholders is poor. They are institutionalized through initiatives and formal platforms provided by BCA.
The interaction between stakeholders proceeded mostly in only one direction to approach the BCA. This showed less flexibity limiting the effectiveness of such interactions, when concerns and ideas were not voiced in a multi-participant decision-making process.
BCA exerts strong pressure on behavioral change through its several policies and standards.
India All relevant actors for innovations were found to be present.
Interactions were strong within innovation project boundaries but weak between various projects. Interactions were not institutionalized and hence showed limited cooperation between projects. No effort was made by the government.
Since innovation in the niche is fragmented and not institutionalized, it is easy for new actors to be included giving room for flexibility.
No additional pressure is exerted by any actor especially by the government to exert behavioral changes or management reforms as regulations and new policies are not mandatory

163
While looking from the governance perspective, both in Singapore and India, completeness
of extent of the actors available to initiate innovation processes in the building sector, was
found to be present. It revealed a moderate level of coherence as far as the interaction between
these actors to spur innovations is concerned. In Singapore, as the BCA occupied a central
position in creating platforms for interactions and deployed a top-down approach, the context
was found to be less flexible and only one-directional. On the contrary, due to absence of any
central leader in initiating actor interactions, the context in India was more flexible to include
and engage more interested actors and drive the discourse as multi–directional for innovations.
The BCA exerts a strong influence on actors towards behavioural change in Singapore making
the context very intense, unlike the case of India where it was open-ended with no external
pressure on actors.
7.4.2 Institutions
Formal institutions
Formal institutions can include rules, regulations, policies, initiatives, and monitoring from
the government (Jain, Hoppe, & Bressers, 2016). In Singapore, nine out of eleven stakeholders
recognized that the government has done a lot in promoting the development of green
buildings. There are several different initiatives by the BCA in place. Formal institutions such
as regulations, laws and enforcements were found to be conducive for innovation in the
building sector in Singapore. The BCA which is considered as an apex institute for regulations
and enforcement in the building sector uses a set of several policy instruments and innovative
approaches, such as grants as financial incentives. A mandate was issued in 2015 for
organizations to reveal their energy performance data so that BCA could be enabled to do more
effective benchmarking (Siva, Hoppe & Jain, 2017). In Table 14 the set of initiatives taken by
BCA to move industry toward energy transitions in the building sector, is presented.
Table 14 : Policy instruments and actions adopted by the BCA in Singapore
S. no BCA policy instruments and actions.
1 Govt. supports risk-taking technology through grant schemes like the Green Building Innovation Cluster (GBIC)
2 Govt. has made it mandatory for any building that undergoes any sort of change or retrofitting to meet the minimum level of the “Green Mark” standard.

164
3 Phase out of inefficient technologies from the market (such as air-cooled chillers).
4 The Housing and Development Board called for a large solar-leasing tender in 2014, under which solar panels will be installed on the roof of 500 residential buildings (Siau, 2014). This could promote the use of solar panels and cause it to become the dominant method of generating electricity in Singapore.
5 A new scheme by the BCA to encourage the certification of rental spaces, which would help to bring about increased engagement and education of end-users. High performance buildings (typically “Green Mark Platinum” certified) are given public recognition by the BCA. These buildings are usually open to the public for guided educational tours.
6 The Green School Roadmap scheme was also recently launched to facilitate the greening of school spaces and helps build a culture of sustainability amongst children and juveniles.
7 The BCA also has a pilot scheme called ‘BREEF’ (Building Retrofit Energy Efficiency Financing) which helps to counter the high upfront costs of investing in new technology by underwriting some of the risks when a company wishes to take a loan to pay for the technology. These have been effective in reducing risk aversion for building owners, investors or project developers.
8 BCA released its 3rd Master Plan for green buildings which has a greater emphasis on reaching out to building owners and tenants. There are several schemes in place, like the “Green Mark Portfolio Programme”, which seeks to certify tenant spaces (as opposed to the entire building itself), and the “Green Lease Toolkit”, which serves as a handbook for owners and tenants on good practices and sustainability targets.
9 BCA rolled out a scheme called the “Green Mark Gross Floor Area” (GM GFA) incentive scheme, wherein buildings can be afforded increased GFA if they are able to undergo substantial energy efficiency enhancements.
Through these schemes, industry has responded and taken various measures. It was
also revealed by most interviewees that most people view BCA guidelines and regulations as
their reference point and simply follow what is needed to achieve a “Green Mark” standard or
meet with requirements of any scheme. With this initiative BCA was considered to influence
consumer preferences and make sustainability become a higher ranked priority amongst
building owners and users. On the one hand such initiatives can be seen as an impetus by the
government towards energy transitions for adoption of green buildings, however in terms of
effectiveness, six out of eleven interviewees conceded that the efforts from the government
have only been moderately effective, and that goal attainment was mostly related to the
implementation and enforcement of strict laws and regulations. This was also believed to
hamper innovation as people (owners, tenants, and investors) tend to follow the guidebooks
that are prescribed by BCA without innovating beyond the required standards. In this sense,
Singapore tends to follow a top-down approach, which does create the minimum conditions for

165
innovation required to foster change in the building sector, but only under set guidelines and
regulations, and when sufficient enforcement capacity is available.
On the contrary, the situation in India was found to be rather different as building sector
institutions do not seem to be well aligned with NZEBs or green buildings. To some extent,
there is a separation between energy efficiency and renewable energy (since each aspect is
looked after by different central government institutions). One of the main instruments − the
ECBC − is a voluntary code that indicates a minimum energy performance standard for
commercial buildings. Future code implementation and compliance are expected to lead to a
promising shift towards the adoption of energy efficient buildings, which will support
innovation. Similarly, from the renewable energy perspective, there have been some policies −
such as the solar roof-top policy, a feed-in tariff mechanisms and net metering − that can be
considered supportive in achieving NZEB goals. All the investigated NZEB demonstration
projects received government subsidies to integrate renewable energy technology in the
buildings. In most cases, this was perceived as very positive, but also as a sign that it is still
predominantly a ‘technology niche’ (Jain, Hoppe, & Bressers, 2016).
Informal institutions
Informal institutions refer to non-state actors like NGO or community projects, but also to
the common habits, beliefs, standards, established practices of society in general. In Singapore,
very little support seems to come from NGOs and there is a sparse presence of community
initiatives vis-à-vis green buildings. Most of the initiatives stem from the government, and not
from the grassroots level. All the interviewees agreed that from a cultural perspective,
Singaporeans tend to be opposed to change. There is a generalized mindset on budgeting to
only start fixing things once they are broken. This means that there is no initiative to optimize a
system if its basic functionalities are perceived to be in good condition. In turn, people are
typically risk-averse, and behave cautiously when deciding to adopt new technology. Despite
this, BCA has made several efforts to introduce and force behavioral changes in people towards
green buildings and low energy buildings however the effect is only moderate (Siva, Hoppe &
Jain, 2017).
In the case of India, a few demonstration projects were initiated toward NZEB, and several
LEED and IGBC certified building have emerged in the green building landscape in India.

166
Local community level initiatives are also considered very few as compared to the vastness of
the building sector in the country. Interviewees mentioned that more government efforts are
needed to bring about community level change in end users and consumers. From the ongoing
innovation projects in India, a culture of non-sharing of ideas was observed as people were
found to refrain from sharing the failure factors of (failed) experimental projects.
Moreover, radical innovators seemed obliged to highlight the successes of the
demonstration projects in which they were involved. Since most of the NZEB demonstration
projects involved public sector buildings, they are typically scrutinized because they use special
earmarked budgets, which lead participating actors to refrain from sharing information on
project failures. This shared reticence limits innovation learning between subsequent
demonstration projects. Furthermore, government communication protocols and hierarchical
systems put additional pressure on the project teams and client representatives to report project
successes (to senior officials). On the sectoral level, institutional fragmentation was observed,
and this also slowed the innovation process, limited the learning process and hampering
network formation. Several national and state (public) authorities appeared only to be involved
in their own separate activities. Developing an integrated well-aligned comprehensive
institutional framework was considered by interview participants to be of critical importance
by most of the actors that were interviewed.
From cultural perspectives, as was the case in Singapore, people are less flexible or not
open to change as far as standard building construction practices are concerned. More so,
acceptance of a new technology often depends on cost, hence people are found to be risk averse
and reluctant to accept new technologies without knowing the results, or the profitability. In
Table 15, the results of the assessment of governance conditions are presented for formal and
informal institutions.

167
Table 15 : Assessing formal and informal institutions
Extent Coherence Flexibility Intensity
What types of instruments are included in the policy
Strategy?
To what extent is the incentive system based on synergy? Are trade-offs in cost benefits and distributional effects considered? Are there any overlaps or conflicts of incentives created by the Included policy instruments?
Are there opportunities to combine or make use of different types of instruments? Is there a choice?
What is the implied behavioral deviation from current practice and how strongly do the instruments require and enforce this?
Singapore All types of instruments are introduced by govt. It includes standards, regulations, financial incentives, awareness and knowledge dissemination etc. Most of these initiatives are mandatory for implementation.
The BCA initiatives are considered as well thought and synergized. Such as good incentives are provided to parties adopting and exceeding the required standards. Awareness and knowledge dissemination is provided to actors which are unable to reach desired energy performance.
Yes, it is possible to combine the various instruments in place by the government.
Instruments strongly encourage stakeholders to exert behavioral change. E.g. by mandating the sharing of energy performance data of organizations, certification of tenant spaces, mandating green mark minimum certification for any renovation project.
India Several instruments are included in the policy strategy. Building codes, certifications, awareness tools, guidebooks etc.
These initiatives by the government are not well synergies and are fragmented between energy efficiency and renewable energy enforced by different ministries.
Yes, instruments are flexible and can be combined, however may find difficulty during implementation due to different enforcing authorities.
Since most of the instruments are only at voluntary stage, they exert only marginal pressure toward behavioral change and only from aware and motivated stakeholders.
Table 15 revealed positive governance conditions for existing institutions in Singapore, making
the situation favourable for adoption of green buildings or low energy buildings. In the case of

168
India, the situation was only positive for the most of instruments available, while medium to
negative conditions were found on flexibility, coherence and intensity.
7.4.3 Learning process
In the case of Singapore, both primary and secondary agents made substantial efforts to
ensure coordinated knowledge exchange between projects, stakeholders and the public. The
stakeholders exhibited good level of openness in sharing knowledge and learning’s. This was
usually seen facilitated by the government through organizing conferences, workshops, and
seminars. In terms of increasing their knowledge base, project developers in Singapore were
keen to educate tenants and end-users. They provided guidebooks in collaboration with the
BCA, called the “Green Lease Toolkit on sustainability practices”. In 2015, a scheme was
launched by BCA to encourage the certification of rental spaces, which would help to increase
engagement and education of end-users. Moreover, buildings with high green building
performance (typically “Green Mark Platinum” certified or NZEBs) are given public
recognition by the BCA. These buildings were usually open to the public for guided
educational tours.
As far as the academic knowledge was concerned, interviewees opined that a change or
re-orientation of academic work was deemed necessary to pay more attention to green
buildings. A need to increase research and publications on this subject was highly needed in
addition to having actual test beds and demonstration projects. This would highlight the
performance of specific technologies, and opportunities to save energy in real-life practice.
In the case of India, learning processes were seen as situational and fragmented, as
learning only happened among niche actors, who were directly involved in innovation projects.
Only seldom lessons were disseminated to a larger audience. As a consequence, only first order
learning took place. Unlike in Singapore, no dedicated effort was seen by the government in
spreading lessons from those projects, through media or publication. Only efforts were seen by
the frontrunners to publish their work in building magazines or through social media. Critical
information and experimental failures were, however, not easily shared, where stakeholders
were only inclined to showcase project success, without paying attention to learning that comes
from failures also. This was largely seen in demonstration projects which were funded by
government or public-sector buildings.

169
On the academic front, interviewees supported that a huge change is needed in the way
universities and architecture colleges include green building and NZEB concepts in academic
curricula and programs and pay more attention to research and publications alike. In Table 16
the results of the assessment of the learning process is presented against the four quality criteria
of governance.
Table 16 : Assessing learning process
Extent Coherence Flexibility Intensity
Are all forms of learning on relevant innovations achieved and disseminated?
To what extent is the learning process synergized?
Are there opportunities to recombine or make use of different types of lessons or knowledge ? Is there a choice how to disseminate?
What is the implied behavioral deviation from current practice about which the learning takes place and how strongly is this supported?
Singapore
In Singapore, stakeholders were found to be keen on sharing their learning experience with other actors. Also, government took good initiatives for awareness and knowledge dissemination programs
The learning process was found to be well synergized with a host of conferences, workshops, seminars and government initiatives to spread lessons and good practices through different initiatives
Yes, it is possible to recombine and make use of new knowledge. There are several opportunities to disseminate knowledge through seminars, workshops and conference and manuals largely facilitated by government.
The means of knowledge dissemination are mostly strong through strict codes and laws causing behavioural change among occupiers of dwellings.
India The learning process was limited to project actors and was not disseminated well.
The learning process was very fragmented and situational. No efforts made by government to synchronize learning.
The initiatives by the government were voluntary and were not enforced strictly. Hence, the learning processes were flexible, but just because of weakness (see intensity).
Government efforts were less intense to disseminate knowledge cause learning and thereby lead to behaviour change
The governance conditions for learning are rather positive in the Singapore case, with all
aspects of learning covered by stakeholders providing a good coherence from government led

170
initiatives. Several schemes showed flexible ways of learning, and strict enforcement of these
schemes made the condition intense. Whereas in India, the learning conditions were viewed by
the interviewees as open ended and flexible; however, not all aspects of learning were
explored, showing less coordinated efforts and less intensity due to poor enforcement by the
government.
7.4.4 Market demand
As far as the demand for sustainable technologies and innovations therein is concerned
in Singapore, cost effectiveness of these technologies was given high priority. Interviewees
stressed low cost and high benefits to accept and readily adopt these technologies, with low
payback periods. Some of the government institutes pushed technologies such as water-cooled
chillers plants (which came with payback period of five to seven years) making them rather
economically undesirable for consumers. The most easily adopted technology was energy
efficient lighting systems, which led to high market sales, due to cost effectiveness and less
operations and maintenance
Moreover, consumers were found to prefer well established technologies rather than
ones that are still in the experimental stage. This was largely because consumers were reluctant
to learn new knowledge about operating new unknown technologies and hence avoid adopting
them. Most interviewees agreed on the risk-averse nature of the Singaporean market, in which
consumers were conservative in their choices and prefer not to be the first to try out
experimental, unproven technology. However, some front runners have emerged, and they
largely comprise of educational institutions which are implementing new technologies as test
beds. Apart from this, the BCA also issued a pilot scheme called “BREEF”, which helped to
counter high upfront costs of investing in new technology by underwriting some of the risks
when a company wishes to take out a loan to pay for the technology. These measures were
considered effective in reducing risk aversion among investors and project developers drive the
demand to some extent.
A growing trend for green buildings was seen as a brand marketing and corporate social
responsibility among corporate companies’ offices with higher investment capital. This resulted
in better knowledge of building occupants for green buildings and how to operate them.

171
Despite all these efforts, green buildings remained under-valued in the building market and
were not sold or rented at premium, even if they were “Green Mark” certified. This would
result in a lack of demand from investors. To address these and other issues, the BCA
introduced a new scheme, called the “Green Mark Gross Floor Area” incentive scheme (GM
GFA), in which buildings can afford increased ‘GFA’ on the condition that substantial energy
efficiency enhancements are made. Furthermore, policy makers were in the process of
integrating energy efficiency in the assessment and appreciation of buildings in the scheme, so
that energy efficient buildings can attain a higher market value than conventional ones.
As far as demand for sustainable technologies in India is concerned, the situation for
expensive and new green building technology was similar as was seen in Singapore.
Consumers were found to be reluctant to adopt expensive technologies, despite the known
benefits. From the interviewees, it was perceived that technical knowhow and operational
knowledge for new technologies were less known which also resulted in low demand for such
technologies. Consumers were also risk-averse and preferred technologies with low payback
periods such as energy efficient lighting systems. The BEE has taken several initiatives to affect
the adoption of new technologies by introducing standards and labelling programs both for
technologies as well as buildings. This saw an incremental phasing out of some inefficient
technologies from the market and the acceptance of new efficient technologies such as
LEDS/CFLs over incandescent lamps, appliances, such as Star labelled air-conditioners.
Consumer participation and sensitization towards using new technologies were greatly
missed which made end users even more reluctant to adopt and accept new technologies. Few
private sector offices/ MNCs/ Hotels/shopping malls as well as construction developers were
observed to adopt green building rating certifications (such as LEED/GRIHA and CSR
initiatives on sustainability as brand marketing). In some states, an extra 5% Floor Area Ratio
(FAR) was granted to buildings having “GRIHA” certification. These initiatives were viewed
as positive for technology innovations and were found to increase market demand (but mainly
by project developers).
The housing sector’s participation in energy innovations was negligible, with home
owners lacking sufficient motivation (due to financial implications and the lack of
understanding of tangible benefits). Moreover, project developers tended to shy away from

172
innovations due to perceptions of ‘spilt incentives’. It seems that construction companies and
other actors in the building industry in India were not prepared to produce energy efficiency
buildings in large numbers (Jain, Hoppe, & Bressers, 2017).
Table 17 : Assessment of market demand
Extent Coherence Flexibility Intensity Are all aspects taken into consideration to derive market demand for new technologies?
Are all the efforts for increasing demand well synergized or coordinated?
Are there opportunities to combine or make use of different type of instruments to increase market uptake? Is there a Choice?
What is the implied behavioral deviation from current practice and how strongly does the market require and enforce this?
Singapore
Several initiatives are taken into consideration by the government to drive the market for sustainable technologies; however, more can be done.
Government has taken several initiatives which are well coordinated to address risk, cost, awareness, knowledge dissemination to increase the uptake of sustainable technologies.
There is flexibility for consumers to combine or choose different instruments and strategies which promote the uptake of new technologies.
Some mandatory instruments, such as sharing of energy performance of buildings, makes home owners adopt new sustainable technologies, and thereby enforce increasing market demand.
India
Initiatives for increase of market demand are limited. More can be done.
Government instruments are fragmented and enforced by separate agencies; hence, they are not well coordinated. Risks, costs, learning, awareness and knowledge all are dealt with separately.
There is some extent of flexibility to choose between instruments to increase the adoption of new sustainable technologies. However, they are only voluntary instruments.
The instruments are not exerting enough pressure to bring behavioural change as they are mostly in voluntary stage.
For market demand, in table 17 supportive qualities of coherence and flexibility were
observed in the Singapore case regarding the uptake in the industry. In the case of India, the
creation of market demand was viewed as ‘neutral’ for initiatives taken to increase the demand

173
and pressure exerted to behavioural change. The context was incoherent as far as
implementation of various instruments was observed. They seem to restrict rather than to
support, as enforced by different ministerial authorities, unlike Singapore where BCA clearly
takes the lead in such processes.
7.4.5 Shaping of expectations , problem perceptions and goal setting
In Singapore, only few green technologies were found to be popular amongst the green
building industry. They include energy efficient lighting (systems) and chillers plant system
(the latter due to its high energy usage). In addition, a recent uptake of solar PV panels was
seen in past 2-3 years. Knowledge, awareness and popularity of these technologies show that
consumers have positive expectations as far as some energy innovations are concerned in green
buildings in Singapore. Despite their popularity, consumers find chillers plants and solar
technologies expensive, as they exercise long payback periods. Hence, potential consumes are
reluctant to adopt these technologies despite their high promises and expectations. However,
these costs have reduced and have become more feasible compared to a few years ago.
Additional impetus by the state government through incentives and financial instruments help
in keeping up with increase in adoption of these technologies.
When looking at solar panels only, they become more feasible in Singapore when taking
into account government subsidies to encourage the use of renewable energy sources. With
high cost of unsubsidized electricity, more people are looking to alternative methods of energy
generation. The government has subsidies for the use of solar cells and they are also looking
into feed-in tariffs. Some energy companies also have enough capital to invest in the testing of
solar technology. State government ongoing initiatives were seen as backbone for maintaining
the expectations as promising, like e.g. Singapore government supports risk-taking technology
through grant schemes like the Green Building Innovation Cluster (GBIC). The scheme
provides funding for the experimentation, exhibition, and exchange of promising new energy
efficiency solutions amongst industry stakeholders. This has been pushing people to try and
embrace new technology. Hence, in Singapore various problem perceptions are taken into
account largely by the government and hence goal setting is also defined by the government.
According to the BCA, the IMCSD has set a target of “at least 80% of the buildings in Singapore

174
achieving the BCA “Green Mark Certified” rating by 2030” (Sang & Chong, 2015). This
situation makes the shaping of expectations and goal setting as a progressive scenario.
Similarly, in India momentum for green buildings and pilot projects for NZEBs have
shaped positive expectations about sustainable technologies for the building stakeholders. The
adopters of green buildings and low energy buildings were found to be among highly
motivated clients who were aware of the socio-economic benefits of energy innovations and
new technologies in buildings. The client motivation garnered further interest among the
project design and construction teams, creating a common project goal with a high visibility
(drawing wider societal attention). Educational institutions were among the front runners in
adopting the low energy building designs and was considered as positive. So were initiatives
taken by the public sector with buildings to showcase as NZEB pilot demonstration projects for
instance. This builds a strong and positive expectation from among the private sector regarding
the role of government and educational institutes in initiating innovations. In this regard
government initiatives through various instruments such as subsidies, incentives, feed-in-
tariffs, net metering and extra FAR were seen in a positive light. However, these initiatives
have not seen implementation on a large scale.
Few interviewees showed apprehension regarding the social and economic benefits of
adopting green or low energy buildings (NZEBs) as energy performance of existing
experiments was not widely shared, this to some extent lowered the expectations and increases
scepticism as to whether buildings are performing as designed. Government supported targets
were found present, but mostly for renewable energy technologies which leaves adoption of
energy efficient technologies behind. Implementation and enforcement of ECBC in commercial
buildings would, however, be viewed in a positive light, once it becomes a mandatory
instrument.
Table 18 : Assessment for shaping expectations and goal setting
Extent Coherence Flexibility Intensity
To what extent are the various problem Perspectives taken care of? What expectations does the industry hold?
To what extent do the various goals support each other or are they in competition or conflict?
Are there opportunities to reassess goals?
How different are the goal ambitions from the status quo or business as usual?

175
Singapore
Various problem perspectives are considered while setting a level of expectation from sustainable technologies.
Various goals set by the state government support each other as they are designed and implemented by BCA alone.
As BCA follows a top down approach for design and implementation of the goals, it looks difficult for the industry to re-assess and change them. Even if government monitors the programs, involvement and input of the industry stakeholders in not included
BCA has set a highly ambitious goal for green buildings in Singapore; however, the industry is slow to respond.
India Various problem perspectives are considered while setting a level of expectation from sustainable technologies.
Goals seem to contradict or appear to be in competition with each other especially separate RE and EE goals.
There are opportunities to reassess the goals as the two separate ministries can combine their respective goals as one holistic NZEB policy (although initiatives were started by the BEE).
Goals are ambitious as compared to the business as usual scenario. Green buildings only represent less than 5% of the total building stock in India.
In table 18, the governance situation in Singapore was moderate for shaping
expectations and goal setting, where completeness of extent and coherence showed positive
signs. However, there was less flexibity to change. In India, the situation as seen as flexible to
change and reassess goals and complete set of problems were assessed before setting
expectations from any new technology. However, the goals seem to be in competition with
each other, and there is a low level of intensity to exert any pressure for further innovations.

176
7.5 Discussion and conclusions
Singapore
From a governance perspective (figure 21) the overall quality of governance in
Singapore on the SSIAf’s quality criteria of extent, coherence, flexibility and intensity, was
found to be rather positive. The situation was observed as improving vis-a-vis innovation and
(large-scale) adoption of green buildings in the Singaporean building sector. By large, the
formal institutions and the learning process played a crucial role in making this condition a
supportive one as seen in table below with all green codes for both the components. The
existing institutions (mainly BCA) and their well-defined roles and responsibilities, with sound
support of financial resources from the government (through financial incentives, and
subsidies) created a conducive environment that enabled actor network formation, shaping of
expectations, and market demand creation to respond in a more supportive manner. It was,
however, observed from the case study that actors and interactions were somewhat hampered
due to lack of integrated design approach during building design and construction process.
This led to fleeting interactions, a lack of coherence, difficult collaboration patterns, (making
collaboration ties even less flexible), and in the end to sub-optimal design of green buildings.
The push from the government in initiating interactions (through workshops and conferences)
did exert some pressure on actors to interact and share project lessons. Similarly, as far as
demand in the market for new sustainable technologies was concerned, a unidirectional push
from the government did result in creating this demand as seen in the figure below.
Figure 21: Singapore – quality of governance in SSIAf components
Extent Coherence Flexibity Intensity
Actor networks
Institutions
Learning Process
Market Demand
Shaping expectations
177
The innovation system in Singapore was found to be supportive towards fostering green
buildings niche formation and for low energy buildings. The study shed light on the central
role of the national government (via the BCA) in Singapore’s green building innovation system.
Most of the industry firms and stakeholders were largely following BCA, which took a
prominent role in guiding innovations in the green building sector. Governments taking a
central role is considered as favourable by many transition scholars as they claim that
governments can play a defining role to transform existing systems by facilitating the process
of niche formation and setting up a set of successive experiments, or by implementing
particular policy instruments that support niche development, like subsidy schemes, regulatory
exemptions, or programs that include pilot projects (Kemp, 1994; Schot, Hoogma et al, 1994;
Kemp, Schot et al, 1998; Rip and Kemp, 1998; Smith, 2003; Weber, 2003). In line with this view
some of the innovation scholars also argue that government ought to play an important role in
innovation systems, and that government regulation should provide an incentive for
innovation (Beerepoot & Beerepoot, 2007).
In the Singapore case study, it was observed that government, via the BCA, implemented
several schemes and polices, making it the main actor which took full responsibility, with the
industry and the private sector following its lead. The government was also found to govern
the stakeholder network interactions (via innovation networks and innovation platforms) and
setting the conditions under which green building projects could successfully operate.
These conditions also facilitated learning processes wherein both the government and the
private sector were open to sharing lessons (success and failures) from their innovation
projects, and disseminate information through the public domain, publishing guidebooks,
conferences, and organizing workshops. Policy instruments proposed by the BCA to balance
the risk of expensive new technologies, phasing out of inefficient technology, and introducing
the green mark standard for rental spaces were few other initiatives. A few efforts paved the
way for increased adoption rates, as well as increasing domestic market demand for sustainable
technologies.
Cost effectiveness of technologies was considered important by end-users for adoption.
Herein, the government took initiatives such as introducing a risk balancing instrument to

178
cause an increase of market demand. However, once such initiatives that are supportive in
lowering risks are rolled back, there is a big risk that technology ‘lock in’ manifests and will
slow down the market uptake, as the study revealed that Singaporean consumers were found
to be rather reluctant adopting new non-tested high cost technologies. Hence, this condition
could only be favourable if the government continues to provide grants and financial
incentives. This reflects a system that is top down governed, in which market demand for new
technologies is dependent on the government. This differs from the ideal typical phenomenon
of market demand stemming from the private sector’s initiatives. This situation also led to
incremental innovation and hardly supports a radical innovation or creativity from the private
sector companies. The same situation was also observed concerning the hopeful expectations
that end-consumers have of new sustainable technologies on the pretext of the government’s
strict enforcement of several strategies and instruments that give end-users confidence. This is
important given the risk adverse nature many of them have. However, this condition, again,
depends much on government initiatives. In summary, for these reasons it can be argued that
there is too much dependence of the innovation system on the government as the central actor.
Regarding this situation in Singapore, there are some contrasting viewpoints from both
transition and innovation scholars. They consider this situation not solely supportive as
government has to deal with system imperfections (Smith, 2006). Schot et al. (1994) argue that if
only governments take the full responsibility niches may even fail. This view is also supported
by many innovation scholars (Bartholomew, 1997) who claim that commercial firms and
research institutions should typically take the lead, with the government playing only a
supportive role, instead of a central one. Innovation was taking place as directed by the BCA in
a more prescriptive manner with unidirectional approach, making the system favourable for
incremental innovations rather than radical ones. Radical innovations, arguably, stem from a
multi-directional discourse (as innovation can largely be a multi-actor process). Therefore, the
sectoral system in Singapore looks rather favourable to incremental innovations. However, this
condition will likely only prevail until the government decides to withdraw or terminate its
polices and change some of its strategies. This will likely cause the innovation process to
change, in a negative way.
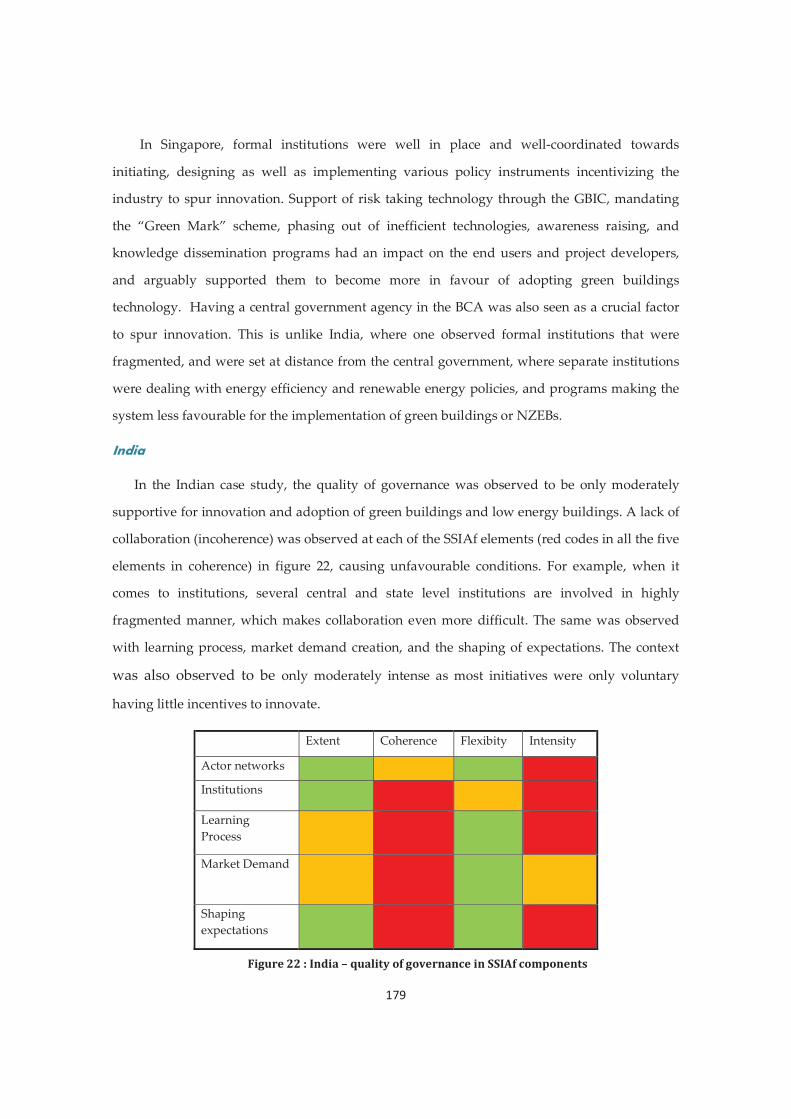
179
In Singapore, formal institutions were well in place and well-coordinated towards
initiating, designing as well as implementing various policy instruments incentivizing the
industry to spur innovation. Support of risk taking technology through the GBIC, mandating
the “Green Mark” scheme, phasing out of inefficient technologies, awareness raising, and
knowledge dissemination programs had an impact on the end users and project developers,
and arguably supported them to become more in favour of adopting green buildings
technology. Having a central government agency in the BCA was also seen as a crucial factor
to spur innovation. This is unlike India, where one observed formal institutions that were
fragmented, and were set at distance from the central government, where separate institutions
were dealing with energy efficiency and renewable energy policies, and programs making the
system less favourable for the implementation of green buildings or NZEBs.
India
In the Indian case study, the quality of governance was observed to be only moderately
supportive for innovation and adoption of green buildings and low energy buildings. A lack of
collaboration (incoherence) was observed at each of the SSIAf elements (red codes in all the five
elements in coherence) in figure 22, causing unfavourable conditions. For example, when it
comes to institutions, several central and state level institutions are involved in highly
fragmented manner, which makes collaboration even more difficult. The same was observed
with learning process, market demand creation, and the shaping of expectations. The context
was also observed to be only moderately intense as most initiatives were only voluntary
having little incentives to innovate.
Figure 22 : India – quality of governance in SSIAf components
Extent Coherence Flexibity Intensity
Actor networks
Institutions
Learning Process
Market Demand
Shaping expectations

180
In the Indian case study, it was observed that the sectoral innovation system was only
moderately supportive towards innovation and adoption of green buildings and NZEBs.
Unlike Singapore, the central government was not seen as an instrumental actor in governing
transition and innovation processes. It was largely the efforts made by private sector that
spurred innovation, by the Confederation of Indian Industries (CII), which introduced the first
Indian Green Building rating tool as India’s adoption of LEED under LEED-IGBC in 2001.
Hence, the private sector took the initiative towards green buildings innovation in India which
according to some transition scholars may be considered as favourable (Schot & Hoogma et al.,
1994). Later in 2007 the government (through MNRE) created an indigenous rating tool –
GRIHA - in the country in 2007-08, launched the ECBC code for commercial buildings in 2007
and implemented some additional actions to foster its use. However, most of the efforts were
only voluntary. Once more there was no single actor found to take the lead and govern the
green building movement in India. The rating tools implemented enacted a rise in the Indian
green buildings movement, without much government support. This, nonetheless, led to a slow
uptake process. More so, niche development of NZEBs can be arguably can be considered to be
rather immature (Jain, Hoppe, & Bressers, 2016).
The SSIAf analysis of the Indian case study revealed that although all important actors
were present for the green buildings innovation, the level of innovation was low due to lack of
single actor initiative in the process. Consequently, policy instruments, programs, actions and
efforts made by the government can only be judged as moderately effective ‘vis-a-vis’
innovation diffusion of new sustainable technologies in green buildings and NZEBs. The study
also revealed that the learning process was hampered as actors were only poorly motivated to
share lessons on their projects (even more so in public sector building). This resulted in lack of
expectations, low knowledge levels and little experience from the end users, and market
demand creation was also a very slow process.
We consider the use of SSIAf useful in assessing the status of niche innovation of green
buildings and low energy buildings in Singapore and India. The use of SSIAf enabled us to
systematically analyse and assess the innovation and niche development status in both
countries. In addition to using SSIAf, the study also attempted to integrate and use the GAT’s
four quality criteria to assess the status of governance in a particular contextual setting. We also

181
deemed this to be useful, as it was able to deal with limitations of SSIAf. Using GAT assessment
provides us with quality of governance in terms of how supportive or obstructive the
conditions are/or going to be in near future for implementation of green buildings or low
energy buildings. The GAT quality assessment allowed us to give sufficient attention to the
environment and the context of sectoral innovation systems and niches (geographical
conditions) making it a more pragmatic tool in addition to using SSIAf.

182


185
8.1 Introduction
This final chapter of this thesis is divided into three main subsections. The first part focuses
on answering the main research question. To do so the five sub-research questions will be
answered first. The second part reflects on the development and use of the theoretical
frameworks in this doctoral study. This section will reflect on the usability of the integrated
framework, its limitations, application challenges, and lessons learnt. Thirdly, the final section
elaborates on the contribution of this doctoral study to society, and to policy makers who are
working on sustainable transitions in building sectors within developing countries.
8.2 Results
8.2.1 Answering the sub-research question
In the previous seven chapters, this thesis has focused on delivering one final objective:
to answer the main research question, which was,
What are the supportive and restrictive conditions for Net Zero Energy Buildings (NZEBs) niche
development in the building sector in India?
To answer this question, this article-based thesis was structured as follows: The first chapter
presented the general background of the thesis stating the problem and briefly introducing the
theoretical frameworks which were to be used to answer the research question. This chapter
also introduced the main research question, five sub-research questions, and the research
approach. The second chapter entailed a literature review on the building sector in India,
buildings and use of energy, green buildings in India, conceptualization of NZEBs, NZEB
uptake in developed regions, and some of the barriers that prevent the wider uptake of NZEBs.
Following these introductory chapters, the thesis was divided into five research stages. The
first stage concerned a conceptual challenge, which synthesized the theoretical frameworks of
Strategic Niche Management (SNM), Sectoral Innovation System (SIS) and Governance
Assessment Tool (GAT) into an integrated assessment framework (Sectoral System Innovation
Assessment Framework –SSIAf) which could be used in empirical case study research. Chapter
three helped to answer the first sub-research question, which was the first stage of this research.
The second stage was presented in chapter four, in which the integrated assessment framework
was empirically applied and used in a case study where NZEB demonstration projects were

186
evaluated and assessed to understand niche formation and the innovation process of NZEBs in
India. The third and fourth research stages entailed the assessment of the governance context
for NZEB niche formation in two independent regions in India, namely New Delhi and Ajmer
(see chapters five and six, respectively). Two independent assessments were conducted to
evaluate, map and explore governance quality, which either obstruct or support the
introduction of NZEBs in the respective regions. The two regions were also compared on
governance qualities. In the fifth and the final stage of this research, sectoral innovations and
niche developments for green buildings and low energy buildings in India were compared to
those of Singapore. The study in this chapter is an attempt to expand my study beyond the
scope of a single country, in another Asian region, to develop further understanding on the
applicability of the theoretical frameworks in countries with differing contextual backgrounds.
So far in previous research stage two, I integrate the two innovation approaches, but leave
the GAT mostly as a complimentary approach. But in chapter 7, a step further was taken by
applying the four GAT criteria to the SSIAf dimensions. The threefold integrated framework
that I create that way does not replace the original GAT for other purposes, but it does add an
interesting option for this kind of research.
The next section will briefly present the results of each chapter.
The first stage of this doctoral study was developed under an integrated framework entitled
‘SSIAf’, answering the first sub-research question in Chapter three.
1. What analytical assessment framework suits best to assess NZEB niche development in
India?
As commented upon in the introduction chapter, the purpose of this research stage was to
explore and describe how well notions of innovations, niche development and governance
could be synthesized in an integrated fashion. In doing so, I considered two theoretical
frameworks relevant to system innovations and transitions (SIS and SNM) and identified
complementary aspects in the two frameworks for assessing niche formation of sustainable
technologies. Next, I developed an integrated assessment framework by combining those two
frameworks. I called this the “Sectoral System Innovation Assessment Framework” (SSIAf). The
study also addressed how governance was influential in niche developments and sectoral

187
innovation. This led me to compare this to SSIAf. I judged that more attention to governance
was needed. Then, I looked at the GAT, to identify possibilities for the incorporation of
governance aspects into SSIAf. The integrated framework which resulted from this process
served as a theoretical and analytical basis for empirical research (presented in Chapter 3),
starting with the assessment of NZEB niche development in India (presented in Chapter 4). In
summary, this chapter contributed to both transition studies-related theory and governance-
related theory by developing an integrated assessment framework that could be used to
analyze innovation and diffusion of sustainable technologies, while combining insights from
both disciplinary fields. For these reasons I argue that SSIAf is well equipped to assess NZEB
niche development in India, to address both sectoral innovations and governance aspects.
In stage two of this doctoral research, a case study was conducted to assess the niche formation
of NZEB in India using the integrated assessment framework to answer sub-research question 2
(as presented in Chapter 4).
2. What does the SSIA framework inform us about NZEB niche formation in India?
In this chapter, which was also published as an article in an academic journal (Jain et. al,
2016), the SSIAf was used to understand niche formation by analysing the conceptualization,
emergence and growth of the NZEB demonstration projects in India. In the case study seven
early NZEB demonstration projects were evaluated and analysed using a qualitative research
approach by conducting eighteen in-depth interviews with primary and secondary actors
between September 2014 to June 2015. The interview questions were based on the five
components of the SSIAf.
The result showed that the NZEB innovation niche was yet to develop into a mature niche
and is growing only slowly. This could be assessed from the results of the shaping of expectations
component of the SSIAf which revealed that there were only marginal expectations of the
building sector stakeholders regarding NZEB niche. The social network formation component
revealed that new social networks were only strong within individual NZEB projects and there
had been a failure to create a cohesive network with other NZEBs and with actors outside the
NZEB projects resulting in a limited level of innovations.

188
The strength of the SSIAf was that it provided an in-depth analysis of each of the
independent components of the framework despite of showing inter-dependencies between
each of its components. The study also revealed that the nature of social networks determines
the depth and breadth of learning processes. However, the NZEB projects tended to focus on
first-order learning only (based on ‘hard facts’ and data, and this impeded potential niche
expansion making the learning process only situational). The institutional settings and policy
instruments part from government subsidies did not provide any incentives for innovation.
The formal rules and regulations were not yet aligned with NZEB innovations although they
were to some extent aligned well to support energy efficiency in buildings. Similarly, several
barriers were observed resulting in a lack of demand for NZEBs at the building-sector level,
indicating that niche formation had yet to result in sectoral change.
Stages three and four of this doctoral research assessed two independent case studies
designed to evaluate the strengths and weaknesses of the governance context. This was done
by using the GAT analytical framework to assess the implementation of NZEBs focusing on
two regions in India, New Delhi and Ajmer. The selection of the two mentioned regions for the
case study analysis was largely derived from the difference in size of the two regions, growth in
demand for energy and the market for energy efficiency in buildings. The New Delhi region is
a big metropolitan area in India and would serve as an interesting case to highlight certain
governance aspects of the uptake of the NZEB niche and has the potential to lead and pave the
way for other regions. In contrast, the Ajmer region is smaller, where concepts of energy
efficiency in buildings have not yet been established with any green certified building. Hence
the two contrasting regions would provide a more pragmatic understanding of NZEB niche
formation in general, and more specifically the state of governance for future uptake in these
regions. The two studies answer the following two research questions, and have been
addressed in chapters five and six, respectively.
3. What is the state of governance in New Delhi regarding NZEB niche formation?
4. What is the state of governance in Ajmer regarding NZEB niche formation?
In the case study of New Delhi, which is a published as an article (Jain, Hoppe & Bressers,
2017), a stakeholder analysis was conducted to identify relevant stakeholders who are part of

189
the governance setting, and directly or indirectly affect the NZEB niche development process in
the building sector. Data were collected among fourteen stakeholders’ representatives who
were interviewed between September 2015 and July 2016.
The results of the study reveal that the governance context was found to be complete in
terms of extent, but rather incoherent, only moderately flexible, while intense in other areas.
Hence from the ‘extent’ perspective the New Delhi region can be seen to be able to adopt
NZEBs with a supportive context for actors and networks, problem perspectives, strategies and
instruments. The aspects of incoherency are minimized in their impact on actors involved
through the other qualities. In this context, actors are not incentivized to comply with policies
or instruments that are not in line with the goals of an integrated NZEB adoption in a
governance context. Furthermore, local level actors have high degrees of authority, flexibility
to address their issues themselves (inside a given jurisdictional boundary). Hence the
incoherent but flexible and intense context of the New Delhi region shows that the governance
context is in a position to actively spur and manage NZEB niche development provided that
supportive qualities of innovation systems are enhanced through collaborative management.
In the Ajmer case study, the governance context was highly incoherent, with a weak
extent, moderate level of flexibility and weak intensity towards NZEB niche development. This
situation resulted in poor governance conditions making the context less supportive towards
NZEB adoption as primary elements that are badly required for implementation were missing.
The existing governance qualities reflected limited governance capacity to initiate any
innovation and transition of the building sector towards the uptake of more energy efficient
buildings. Flexibility in terms of actor network formation, problem perceptions and policy
instruments were given to lower level actors to enable them to overcome issues associated with
incoherence existing in the five dimensions of governance. However, in this weak governance
context, opportunities exist where the incoherence can lead to undesired (and unnoticed)
defections from the intended goals. This condition can therefore be a small window of
opportunity for the NZEB niche. Like for example, an incoherent actor context gives room for
new actors to emerge, experiment and innovate without many restrictions, this in turn can
provide opportunities for new transition insights to emerge.

190
In both the cases, government initiatives were largely taken through various strategies
and instruments which partly supported NZEB demonstration project implementation. In the
New Delhi case, existing NZEB pilots were seen to be supported by the government by
showcasing public buildings as NZEBs, with increased budgets for construction. This initiative
was however, not seen in the Ajmer case. In addition, the results can be used to make a holistic
evaluation of how the governance context is influencing collaborative management of NZEB
niche development in Ajmer and is useful when comparing the existing strengths and
weaknesses of the governance context. The GAT analysis revealed a few regime barriers such
as isolated sectoral policies, lack of awareness by policy actors, lack of knowledge and expertise
of the NZEB concept, lack of network formation, and inadequacy in taking responsibilities
among government actors. These aspects were observed in the Ajmer case study, which made
the context restrictive.
The case study also revealed that network formation was completely absent to the extent
that various stakeholders were only operating in isolation, as was shown in the GAT analysis
by the lack of coherence, extent and intensity. However, improved levels of flexibility were
positive to start the formation of an innovation network. There was a lack of knowledge, there
were budget limitations, and there was a lack of resources, which proved to be serious
challenges to the niche development process.
In the fifth and the final research stage, the research horizon was expanded beyond India
in an attempt to apply the analytical frameworks to the Singapore building sector case, while
comparing the status of sustainable innovations and governance conditions between both
countries (i.e., India and Singapore). Singapore was selected based on its deviation from India
in terms of its building sector characteristics, climatic conditions, and existing socio-political
scenarios. Siva et al. (2017) found that Singapore has quite successfully addressed innovations
of “green buildings” principles and succeeded in greening its built environment. This case
study explores the conditions that either spur or hamper innovation, transitions and
governance of “green or low energy buildings” in Singapore and thereby draws comparisons
with the complex building sector in India. The comparative study was conducted to answer the
following sub-research question (which was also presented in Chapter 7 of this thesis).
191
5. What does SSIAf tell about green buildings innovation in Singapore when compared to the
building sector in India?
The results reveal that the sectoral innovation system in Singapore was generally
supportive towards green building uptake with supportive governance qualities. The active
role of national government – in particular by the BCA - is instrumental towards innovation
and transition process for green buildings in Singapore, which is unlike the case in India. In
Singapore most of the industry firms and stakeholders were largely following the BCA’s green
building policies and strategies. BCA also facilitated stakeholder network interactions (via
innovation networks and innovation platforms). These conditions facilitated learning processes
wherein both the government and the private sector were open to sharing lessons (on success
and failures of green building projects) and disseminate important information. Other factors
which were observed to be supportive for sectoral innovations, concerned policy instruments
proposed by the BCA which paved the way for increased market demand for sustainable
technologies in the Singaporean building sector.
From a governance perspective the overall quality of governance in Singapore on the
SSIAf’s quality criteria of extent, coherence, flexibility and intensity, were found to be rather
positive, and to improving even further. By large, the formal institutions and the learning
process played a crucial role in making this condition a supportive one. The existing
institutions (mainly BCA) and their well-defined roles and responsibilities, with sound support
of financial resources from the government (through financial incentives, and subsidies)
created a conducive environment that enabled actor network formation, the shaping of
expectations, and market demand creation to respond in a generally supportive manner.
In contrast, in the Indian case study, the quality of governance was observed to be only
moderately supportive towards innovation and adoption of green buildings and low energy
buildings. A lack of (incoherent) collaboration was observed at each of the SSIAf conceptual
elements, causing unfavourable conditions in the sectoral innovation system. For example,
regarding institutions, several central and state level institutions were found to be involved,
and only in a highly-fragmented manner, which made collaboration even more difficult. The
same was observed with the learning process, market demand creation, and the shaping of
expectations. The context was also observed to be only moderately intense as most initiatives

192
were only voluntary and having little incentives to innovate. The same was observed for the
sectoral innovation system as it was only moderately supportive toward innovation and
adoption of green and low energy buildings. Moreover, unlike Singapore, the central
government was not seen as an instrumental actor in governing the innovation processes.
The five research stages presented in this doctoral thesis allowed for further reflection,
standardization and refinement of the assessment framework vis-a-vis different contextual
settings; and thus, permitted a larger scope of analysis (niche demonstration projects,
governance assessment of two regions and comparatives assessment between two countries). In
general terms, the results showed that on a scale from restrictive to supportive, the qualities of
extent, coherence, flexibility and intensity, in India, were mostly moderate to restrictive, with
some exceptions pertaining to its local or regional specification. The SSIAf also assessed the
conditions for innovations of NZEB niche formation. They were largely found to be less mature
to enable a large-scale implementation or uptake of this concept. Hence, the SSIAf components
revealed that the NZEB niche in India was immature and was also found to be growing only
very slowly. In this context, when compared to Singapore, it was revealed that strengthening
the role of the national government and improvements in institutional alignments can be
instrumental in increasing the supportiveness of the existing governance, innovation as well as
the conditions for sustainable transitions for NZEBs in India. However, a careful approach
needs to be taken as too much of government intervention may also sometime pose risk to
radical innovation as was observed in the case of Singapore.
8.3 Theoretical frameworks: lessons and limitations
This doctoral study developed a new analytical approach to transitions, innovations and
governance phenomena. The study empirically applied the theoretical frameworks of SNM, SIS
and GAT. All three frameworks were developed separately and have great significance in their
own respective literatures on transitions, innovation and governance. Each of these frameworks
has also documented their respective shortcomings which have been discussed in Chapter 3, 4
& 5. To answer the main research question of this thesis, I went beyond these frameworks and
synthesized their strengths, while identifying common conceptual boundaries. I found that
both SIS and SNM explain innovations phenomena under common conceptual grounds, which
led to conceptualization and development of SSIAf presented in Chapter 3 of this thesis. SSIAf

193
was largely an integrated framework from SNM and SIS which was also compared with
building blocks of the GAT. For the ease of usability of this new framework, the applicability
was kept flexible which allowed the GAT to be seen as a rather independent framework. This
attempt was first made when SSIAf was applied in the first case study of this thesis as
presented in Chapter 4. The GAT framework was then applied in two subsequent case studies
in Chapter 5 and Chapter 6, followed by an integrated SSIAf with GAT in Chapter 7 where the
India and Singaporean building sectors were compared against the four quality criteria of GAT
alongside using SSIAf.
Having used the SSIAf in multiple case studies, the framework is judged to be useful in
assessing the status of NZEB niche innovation in the building sector in India. The integration of
the SNM and SIS frameworks showed that they were complementary, and this contributed well
to answering the main research question. The use of SSIAf enabled me to systematically assess
the niche development process in India and probably better than doing this be using either one
of the two frameworks separately. For example, while the SNM focuses on its primary
components (i.e., shaping of expectations, the actor network formation and the learning
process) to understand the niche formation process, it alone fails to gain insights as to which
institutional alignment (formal and informal) and creation of market demand components can
contribute to the niche innovation process (this component derives from the SIS framework).
Using the SNM framework alone would have overlooked opportunities that the integrated
framework highlighted. Similarly, existing barriers to large-scale adoption were highlighted by
including the market demand creation component in the SSIAf, which was adopted from the
SIS framework, and was found to be relevant as it supports the growth of the niche. In addition
to this, using the SIS framework alone would have excluded the possibility to assess the
learning process of the niche projects analysed in this doctoral study, even though learning
would potentially cause disturbances in existing stable regimes, which can lead to sector-level
innovations. As such, the SSIAf has merits when it comes to assessing a niche innovation at the
sectoral level and hence builds upon the strengths of the two frameworks mentioned
previously.
Using the GAT to assess governance systems for niche development was useful in
assessing the state of governance for fostering innovations in the two selected regions in India
194
(see Chapters 5 and 6). The SSIAf components showed similarities to some of the GAT
components, namely: actor and networks, perhaps somewhat to (adjusting) ‘problems and
goals’, and (getting access to) resources (to afford new sets of experiments) (Jain, Hoppe &
Bressers, 2017). Moreover, applying the GAT as an analytical tool was useful to understand and
assess the governance context in the building sector in the selected case study vis-à-vis NZEB
niche development. The study was of theoretical interest as GAT allowed for assessing the
governance component of niche development and sustainable innovations (i.e., NZEBs). This is
rather novel since the GAT has not been used thus far to assess developments and diffusion of
sustainable innovations in the built environment, and only much recently in few energy
domain research projects (Siva, Hoppe & Jain, 2017). Using the GAT was useful and brought
many aspects to light regarding the quality of the governance of NZEB niche development in
India and Green buildings in Singapore (Chapter 7). The assessment highlighted regime
challenges which were obstructing and slowing down the introduction and diffusion of NZEB
innovations. At the same time the GAT helped to identify potential drivers to spur NZEB niche
development. In addition, the results can be used to make a holistic ex-ante evaluation of how
the governance context can influence collaborative management of the NZEB niche
development process.
By using the GAT complementary to SSIAf (as presented in Chapter 7), further
understanding in the quality of governance in a given context was gained with additional
insight into existing institutional levels, strategies and instruments, and the resources and
responsibilities available. Having had a good experience in analysing NZEB niche development
and green building innovations in two distinct countries while using both approaches, I
suggest that the use of both can be recommended in future niche innovation development
studies, particularly those focusing on the governance and innovations of niche development.
Therefore, the GAT as a qualitative assessment framework for the governance context - which
can be complemented with the SSIAf approach - can potentially also be used for informed
decision making by policy makers who seek to introduce sustainable innovations in both
developed and developing countries.
Combining insights from the two concepts allowed for broadening the scope and
furthering understanding on long term sustainable transitions, innovations in sectoral systems,

195
implementation of transition-oriented policies, and assessment of the role and state of
‘governance’ in niche development processes in sectoral systems. Furthermore, the four quality
criteria mentioned in the GAT framework can be used to evaluate the niche development
process with respect to the five components of SSIAf. For example, actor interactions,
expectations, and learning processes can all be evaluated as per the four quality criteria (extent,
coherence, flexibility and intensity) to understand overlap with the GAT framework (as was
presented in Chapter 7). It will be interesting to augment understanding of the governance
context of niche development and sustainable innovations (like NZEBs) through conducting
more empirical cases that are also analyzed using the GAT. It is important to emphasize that
the GAT has an institutional perspective, as it includes contextual considerations and it is an
integral but not necessarily an interdisciplinary approach. The GAT has been created by social
scientists and environmental policy scholars with inputs from practitioners and various
stakeholders. It is still under development and requires refinement (Casiano, 2017). My
doctoral study makes some important revelations. It shows the GAT’s value to assess
developing country cases and to further develop operationalization of the GAT variables.
8.3.1 Limitations and recommendations for future research
In addition to the above-mentioned strengths of the new frameworks, some limitations must be
addressed which were noticed while conducting the four case studies.
First, the SSIAf analysis was found to have a rather low dynamic nature and to be a
rather static framework. It provided room for analysis as a ‘snapshot’ in time rather
than a set of sequential historical or ongoing events. Therefore, I recommend further
research that can focus on making this framework more dynamic and assessing the
notions of ongoing events in a given economic sector.
Second, the SSIAf assumes a form of developed niche formation, whereas the NZEB
case study of India showed that niche development was basically in a state of ‘pre-
development’ (Raven, Strategic Niche Management for Biomass: Phd Thesis, 2005) or
rather a premature niche. Further research needs to be conducted to be able to identify
and discern various niche development processes with set criteria that apply to certain
stages of niche development, ranging from early to mature niches.

196
Third, the focus on the economic sector and the status quo rather led to neglecting the
multi-level character of the niche formation process (concepts and processes that are
appreciated by the frameworks of Markard and Truffer, 2008; Weber and Rohracher,
2012; and Meelen and Farla, 2013). This limitation could possibly be resolved by
adopting notions from these frameworks. Indeed, this doctoral study only focused on
niches and regimes, and their inter-dynamics, while neglecting landscape level events.
Fourth, to some extent the SSIAf gives insufficient attention to the environment and the
context of sectoral innovation systems and niches (geographical conditions) like giving
attention to contextual setting (e.g., Bressers et al.,2002), which to a good extent was
overcome by synthesizing it with the GAT (see Chapter 7). Further empirical research is
needed to study and overcome the limitations of contextual settings.
Fifth, the SSIAf does not have a strong policy orientation and gives less attention to
politics (in line with Hoppe et al., 2016). In its current form, the SSIAf is basically a
heuristic tool − as other IS approaches − to assess a given innovation system and niche
market formation (such as here, NZEBs) on its inherent capability and capacity to spur
and successfully diffuse the given innovation and generate a wider market uptake.
However, a further conceptual enhancement can be explored in future research.
Sixth, the five theoretical components of SSIAf do not have different weightings when
analysing niche formation; i.e. in early niche development, market demand creation
probably deserves a lower weighing than learning about technological performance and
side effects of a given technology. Thus, further conceptual development of the
framework should assign different weightings to the theoretical components depending
on the stage that niche formation is in; e.g., differentiating between pre-development
stage, early development stage, late development stage and ‘breakthrough’ stage.
Seventh, the SSIAf framework assumes focusing on a single niche, whereas focusing on
a given economic sector should allow for a more holistic view specially to analyse
sustainable innovations in/of given economic sector, and therefore the identification of
multiple niches within an economic sector can be explored in future research.
8.4 Societal Relevance
This doctoral study can greatly contribute to the society by providing a sound platform for
policy making bodies (such as governments) in suggesting an analytical framework that can be

197
used to facilitate and guide sustainable innovation process in desired directions. The results of
this study reveal the usability of the framework proposed in this thesis, with its existing
limitations as well as its flexible character. The flexibility in using this framework for NZEB
niche development highlights some important aspects.
The society (to a large extent building end users) can get a pragmatic understanding of
transitions in progress and sustainable innovation processes. This gives an important impetus
to stakeholders such as NGOs, academic institutions as well as community groups to enhance
and further sustainable innovation agendas. The results of this doctoral study can be used as a
foundation to further explore the impact of the niche development process and innovations
using the newly developed frameworks. First, making (policy) suggestions to policy makers in
India to foster NZEB niche development, and second, addressing the issue of sustainable
transitions (and niche development of sustainable energy innovations) in developing countries.
The frameworks can be well applied to assess the niche formation and innovation process
of new sustainable technologies or concepts such as NZEBs in society as well as for policy
making. It is worthwhile to note that governments, policy makers, as well as NGOs can find
this research useful in assessing the stage of niche development and thereby proposing and
developing strategies. Like GAT identifies weak spots in the governance context that could
guide where to aim additional policies at, and to ‘repair’ those weak spots. When doing so, the
results of this study can be used as benchmarks for the niche in development stages and can
provide insights for future action by transforming it into a policy making tool (with set
standard criteria for assessment of any given situation in transition). To do so, participation of
government in initiating sustainable transitions and innovations and policy makers can be
instrumental in making the framework more robust and applicable.
Stakeholder participation is currently the most discussed topic in transition, innovation as
well as governance literature (Bergek et.al. 2015; Casiano, 2017; Siva et.al. 2017). Engagement of
a larger group of stakeholders (i.e. completeness in extent of actors in GAT) will enhance the
implementation process or will lead to furthering the complexities that come with diverse and
complex building sectors such as in case of India. This research contributes to this debate and it
also brings unanswered questions. The topic still requires further exploration; in this sense this

198
study should only be seen as a first step of a long research journey and also in developing
societal relevance and policy implications.
This doctoral study can also provide additional insights to sustainable innovations in other
developing countries where the assessment framework can provide understanding of gaps in
the transition process and in the state of governance. These empirically tested frameworks can
be applied or further developed as per local context to frame and design strategies and polices
for a desired sustainable innovation process in building sector. This also leaves room for further
exploration of the framework in sectors other than buildings and how would they respond to
for e.g. transition, innovation and governance for zero emissions transport sector for instance.


201
1. ADA. (2016). Master Development Plan - Ajmer region (draft) 2013-2033. Department of Town
Planning. Ajmer: Ajmer Development Authority. Retrieved July 2017
2. Akhaury, V. (2016). Challenging environment: How green buildings in India will enhance your
quality of life. http://www.firstpost.com/business/challenging-environment-how-green-
buildings-in-india-will-enhance-your-quality-of-life-2739872.html
3. AMC. (2015). Buidling energy conservation. (M. Jain, Interviewer) Ajmer.
4. Analytics, G. D. (2016). World Green Building Trends 2016 Smart Market Report. Dodge Data
and Analytics;.
5. Arrow, K. (1962). Economic Welfare and the allocation of resources for innovation. In N. R.,
The rate and Direction of Inventive Activity (pp. 609-625). Princeton: Princeten University
Press.
6. Avelino, F., & Rotmans, J. (2011). A dynamic conceptualization of power for sustainability
research. Journal of Cleaner Production, 19(8). 796- 804
doi:https://doi.org/10.1016/j.jclepro.2010.11.012
7. AVVNL. (2015). Energy situation in Ajmer. (M. Jain, Interviewer) Ajmer.
8. Bank, T. W. (2014). World Development Indicators. International Bank for Reconstruction and
Development. Washington D.C.: The World Bank Group. doi:10.1596/978-1-4648-0163-1
9. Bartholomew, S. (1997). National systems of biotechnology innovation: Complex
interdependence in the global system. International Journal of Business Studies, 28(2), 241-266.
10. BCA. (2010). https://www.bca.gov.sg/zeb/whatiszeb.html. Retrieved October 23, 2017, from
www.bca.goc.sg: https://www.bca.gov.sg/zeb/whatiszeb.html
11. BCA. (2013). Annual Report 2012: Redefining the Built Environment and Industry. Building and
Construction Authority. Singapore: Building and Construction Authority.
12. BEE. (2015). New-construction. Retrieved August 16, 2017, from www.beeindia.gov.in:
https://beeindia.gov.in/
13. BEEP. (2015). Beep-commercial buildings. Retrieved August 16, 2017, from
www.beepindia.org.
202
14. Beerepoot, M. (2007). Energy Policy Instruments and Technical Change in the built
environment.PhD Thesis. Delft, Netherlands: TU Delft.
15. Beerepoot, M., & Beerepoot, N. (2007). Government regulation as an impetus for
innovation : Evidence from energy perfromance regulation in the Dutch residential
builidng sector. Energy Policy, 35(10), 4812-4825.
doi:https://doi.org/10.1016/j.enpol.2007.04.015
16. Bergek, A., & Jacobsson, S. (2003). The emergence of a growth industry: a comparative
analysis of the German, Dutch and Swedish wind turbine industries. In S. Metcalfe, U.
Cantner (Eds.), Change, Transformation and Development (pp. 197-227). Springer, Heidelberg.
doi:10.1007 / 978-3-7908-2720-0
17. Bergek, A., Hekkert , M., Jacobsson, S., Markard, J., Sanden , B., & Truffer, B. (2015).
Technological Innovation systems in contexts : Conceptualizing contextual structures and
interaction dynamics. Environmental Innovation and Societal Transitions, 16, 51-64.
18. Bevir, M. (2012). Governance: A Very Short Introduction. Oxford: Oxford University Press.
19. Boer, C. de., & Bressers, H. (2011). Complex and Dynamic Implementation Processes-Analyzing
the Renaturalization of the Dutch Regge River. Enschede, Netherlands: University of Twente ,
Dutch Water Governance Centre.
20. Boer, C. de, Bressers, H., Ozerol, G., & Kruijf, V. d. (2016). Collaborative water resources
management: What makes up a supportive governance context? Environmental policy and
governance, 26(4), 229-241. doi:10.1002/eet.1714
21. Boermans et.al. (2011). Principles for Nearly Zero Energy Buildings-Paving the way for effective
implementation of policy requirements. Ecofys Germany GmbH ,Danish Building Research
Institute (SBi). Buildings Performance Institute Europe (BPIE).
22. Boza- Kiss, B., Moles, S., & Ürge-Vorsatz, D. (2013). Evaluating policy instruments to foster
energy efficiency for the sustainable transformation of buildings. Current Opinion in
Environmental Sustainability , 5(2), 163 – 176. doi:10.1016/j.cosust.2013.04.002
23. Bressers, H., & De Boer , C. (2011). Complex and Dynamic Implementation Processes:the
renaturalization of the Dutch Regge Rive. Enschede: University of Twente.

203
24. Bressers, H., & Kuks, S. (2003). What does Governance Mean ? From conception to
Elaboration. In H. Bressers, & W. Resenbaum (Eds.), Achieving Sustainable Development: The
Challenge of governance across social scales (pp. 65-88). London: Westpoint.
25. Bressers, H., & Kuks, S. (2004). Integrated governance and water basin management :
conditions for regime change towards sustainbaility. In H. Bressers, & S. Kuks (Eds.),
Integrated Governance and Water Basin Management (Vol. 41, pp. 1-265). Dordrecht-Boston-
London: Springer, Dordrecht. doi:https://doi.org/10.1007/978-1-4020-2482-5_9
26. Bressers, H., Boer , C. de., Lordkipanidze, M., Özerol , G., Kruijf , J. V.-D., Furusho, C., . . .
Browne, A. (2013). DROP- Water Governance Assessment Tool. Netherlands: DROP
PROJECT.
27. Bressers, H., Bressers, N., Kuks, S., & Larrue, C. (2016). The Governance Assessment Tool
and its use, in Governance for Drought Resilience. In H. Bressers, N. Bressers , & C. Larrue,
Governance for Drought Resilience: Land and Water Drought Management in Europe (pp. 45-65).
Springer International Publishing.Dordrecht. doi:10.1007/978-3-319-29671-5_3
28. Bressers, J. (2009). From public adminsitration to policy networks:Contextual Interaction
analysis,in Rediscovering public law and public adminsitration in comparative policy
analysis: a tribute to Peter Knoepfel,S.Narath and F.Varone. In S. Narath, & F. Varone
(Eds.), Rediscovering public law and public administration in comparative policy analysis: a tribute
to Peter Knoepfel (pp. 123-142). Lausanne: Presses polytechniques et universitaires
romandes.
29. Bürger, V. (2013). Overview and assessment of new and innovative integrated policy sets that aim
at the nZEB standard. Öko-Institut. Entranze Project - Intelligent Energy Europe.
30. Caniëels, M. C., & Romijin, H. A. (2007). Actor Networks in Strategic Niche Management :
Insights from Social Network Theory. Futures, 40(7), 613-629.
doi:10.1016/j.futures.2007.12.005
31. Casiano, C. F. (2017). Context Matters: Water governance assessment of the wastewater treatment
plant policy in central Mexico.PhD Thesis. Enschede: University of Twente.
32. CEA. (2014-15). Annual Report. Ministry of Power, Central Electricity Authority. New
Delhi: Ministry of Power.
204
33. DDA. (2017). Masterplan for Delhi, 2021. Delhi Development Authority. Delhi: DDA.
Retrieved from https://dda.org.in/tendernotices_docs/may1/MPD-
2021_31.03.2017260417.pdf
34. Dinica , V., & Bressers, H. (2003). Rio 3 World Climate Energy Event. in the
Implementation of Renewable Energy Policies: Theoritical Consideration and Experiences
from Spain, the Netherlands and The United Kingdom. 2003. Rio3 World Climate and Energy
event. Rio de Janario: Imprinta Express Brazil.
35. Dosi, G. (1982). Technological paradigms and technological trajectories:A suggested
interpretation of the determinants and directions of technical change. Research Policy, 11(3),
147-162. Retrieved from https://doi.org/10.1016/0048-7333(82)90016-6
36. Edquist, C. (2005). Systems of innovation, perspectives and challenges. In: Fagerberg,. In J.
Fagerberg, D. Mowery, & R. Nelson (Eds.), Oxford Handbook of Innovation (pp. 181-208).
Oxford, UK: Oxford University Press.
37. EPBD Recast . (2010). Directive 2010/31/EU of the European Parliament and of the Council
of 19 May 2010. Official Journal of the European Union.
38. Esbensen,, T., & Korsgaard, , V. (1977). Dimensioning of the solar heating system in the
zero energy house in Denmark. Solar Energy, 19(2), 195-199.
doi:https://doi.org/10.1016/0038-092X(77)90058-5
39. ET Bureau. (2017). India’s energy consumption to grow faster than major economies. New
Delhi: Economic Times. Retrieved December 2017
40. EU Commission. (2016). The Road from Paris: assessing the implications of the Paris Agreement
and accompanying the proposal for a Council decision on the signing, on behalf of the European
Union, of the Paris agreement adopted under the UNFCC. Brussels: European Commission.
41. EU-Commission. (2013). Progress by Member States towards Nearly Zero-Energy Buildings.
Brussels: European Commission.
42. Faber, A., & Hoppe, T. (2012). Co-constructing a sustainable built environment in the
Netherlands—Dynamics and opportunities in an environmental sectoral innovation
system. Energy Policy, 52, 628-638. doi:10.1016/j.enpol.2012.10.022

205
43. Gana, J. A., & Hoppe, T. (2017). Assessment of the Governance System Regarding
Adoption of Energy Efficient Appliances by Households in Nigeria. Energies, 10(1), 132.
doi:doi:10.3390/en10010132
44. GBIG. (2017, May 10). www.gbig.org. Retrieved June 10, 2017, from www.gbig.org:
http://www.gbig.org/places/25731
45. Geels , F., & Kemp , R. (2006). Transitions, Transformations and Reproduction.Dynamics in
Socio-technical Systems. . In M. McKelvey, & M. Holmén (Eds.), Flexibility and stability in
the innovating economy (pp. 227-256). Oxford: Oxford University Press.
46. Geels, F. (2004). From sectoral systems of innovation to socio-technical systems,insights
about dynamics and change from sociology and institutional theory. Research Policy, 33(6-
7), 897-920. doi:http://dx.doi.org/10.1016/j.respol.2004.01.015
47. Geels, F. (2011). The multi-level perspective on sustainability transitions: Responses to
seven criticisms. Environmental Innovation and Societal Transitions, 1, 24-40.
doi:10.1016/j.eist.2011.02.002
48. Geels, F. W. (2002). Understanding the Dynamics of Technological Transitions: A Coevolutionary
and socio-technical analysis. PhD Thesis. Enschede, Universiteit Twente: Twente University
Press (TUP).
49. Gilijamse, W. (1995). Zero-energy houses in the Netherlands. Proceedings of Building
Simulation (pp. 276–283). Amsterdam: University of Amsterdam. Retrieved from
http://www.ibpsa.org/%5Cproceedings%5CBS1995%5CBS95_276_283.pdf
50. GoI. (2011). Fatser, Sustainable and more Inclusive Growth- Approach to the Twelfth Five Year
Plan. New Delhi: Planning Commission .
51. GoI. (2011). Population Census of India. Office of the Registrar General & Census
Commissioner, India (ORGI). New Delhi: GoI.
52. GoI. (2017). Net Zero Energy Buildings. Retrieved August 2017, from Press Information
Bureau: http://pib.nic.in/newsite/PrintRelease.aspx?relid=145736
53. Grin, J., Rotmans, J., & Schot, J. (2010). Transitions to sustainable development : new directionsin
the study of long term transformative change. New York/London: Routledge.
https://www.sustainabilitytransitions.com/files/Review%20Boek%201%20Kuhlmann(1).pdf

206
54. Hermelink et al. (2013). Towards nearly zero-energy buildings : Definition of common principles
under the EPBD. Ecofys.
55. Hermelink, A., Schimschar, S., Boermans, T., Pagliano, L., Zangheri, P., Armani, R., . . .
Musall, E. (2013). Towards nearly zero-energy buildings : Definition of common principles under
the EPBD. Ecofys , Politecnico di Milano, University of Wuppertal. Köln: Ecofys. Retrieved
July 2014, from
https://ec.europa.eu/energy/sites/ener/files/documents/nzeb_full_report.pdf
56. Hofman, P., 2002. Becoming a first mover in green electricity supply: Corporate change
driven by liberalisation and climate change. Greener Manag. Int. 39, 99–108, GSE Research,
11.
57. Hoogma, R. (2000). Exploiting Technological Niches:Strategies for Experimental Introduction of
Electric Vehicles. Enscehde, PhD Thesis: Universiteit Twente.
58. Hoogma, R., Kemp, R., Schot, T., & Truffer, B. (2002). Experimenting for Sustainable
Transport. The Approach of Strategic Niche Management. London, New York: Spon Press.
59. Hoppe, T., Coenen, F., & Van den Berg, M. (2016). Illustrating the use of concepts from the
discipline of policy studies in energy research: An explorative literature review. Energy
Research & Social Science, 21, 12-32. doi:https://doi.org/10.1016/j.erss.2016.06.006
60. Hoppe, T., Kuokkanen, A., Mikkila, M., Kahiluoto, H., Kuisma, M., Arentsen, M., &
Linnanen, L. (2016). System merits or failures? Policies for transition to sustainable P and N
systems in the Netherlands and Finland. Sustainability, 8(5), 463. doi:10.3390/su8050463
61. IEA, I. E. (2013). World Energy Outlook 2013- Executive Summary. Retrieved from
www.worldenergyoutlook.org:
http://www.iea.org/publications/freepublications/publication/WEO2013_Executive_Summ
ary_English.pdf
62. IMF. (2016). World Economic Outlook. Washington: Internamtional Monetary Fund.
63. Iqbal, M. (2004). Feasibility study of a zero energy home in Newfoundland. Renewable
Energy , 29(2), 277-289.

207
64. Jain, M., Hoppe, T., & Bressers, H. (2014). Introducing the Sectoral System Innovation
framework (SSIf) for assessment of niche development on Net Zero Energy Buildings in
India. Netherlands Institute of Governments. Delft.
65. Jain, M., Hoppe, T., & Bressers, H. (2016). Analyzing sectoral niche formation: The case of
net-zeroenergy buildings in India. Environmental Innovations Societal Transitions, 25, 47-63.
doi:10.1016/j.eist.2016.11.004
66. Jain, M., Hoppe, T., & Bressers, H. (2017). A Governance Perspective on Net Zero Energy
Buildings Niche Development in India: The case of New Delhi. Energies, 10, 1144.
doi:10.3390/en10081144
67. Jana, A., & Malladi, T. (2015). Urban India 2015: Evidence (2 ed.). (A. Revi, Ed.) Bengaluru:
IIHS.
68. Kedia, S., Goswami, A., Jain , R., Agarwal, P., Balasubramania, S., & Radhakrishnan, A.
(2015). Green Growth and Sustainable Development in India:Towards the 2030 Development
Agenda. TERI & GGGI. New Delhi: The Energy and Resources Institute. Retrieved from
http://www.teriin.org/projects/green/pdf/National_SPM.pdf
69. Kemp, R., & Schot, J. (1998). Regime shifts to sustainablilty through processes of niche
formation: the approach of strategic niche management. Technology analysis and strategic
management, 10(2), 175-198. doi:https://doi.org/10.1080/09537329808524310
70. Kemp, R., Loorbach, D., & Rotmans , J. (2007). “Transition management as a model for
managing processes of co-evolution towards sustainable development.”. The International
Journal of Sustainable Development and World Ecology, 14(1), 78-91.
doi:10.1080/13504500709469709
71. Kilkis , S. (2007). A new metric for net- zero carbon buildings. ASME 2007 Energy
Sustainability Conference, (pp. 219-224.). California. doi:10.1115/ES2007-36263
72. Kruijf, J. V.-d., Bressers, H., & Augustijn, D. C. (2014). How social learning influences
further collaboration: experiences from an international collaborative water project. Ecology
and Society, 19(2), 1-10. doi:10.5751/ES-06540-190261

208
73. Kuks, S. (2004). Water governance and institutional changes:PhD Thesis. University of Twente,
CSTM. Enschede: University of Twente. Retrieved from
http://doc.utwente.nl/50293/1/thesis_Kuks.pdf
74. Lachman, D. (2013). A Survey and review of approaches to study transitions. Energy Policy,
58, 269-276.
75. Laustsen, J. (2008). Energy Efficiency Requirements in Building Codes, Energy Efficiency policies
for new buildings. INTERNATIONAL ENERGY AGENCY. IEA. Retrieved from
International Energy Agency: http://www.iea.org/g8/2008/Building_Codes.pdf
76. Loorbach, D. A. (2007). Transition Management - New mode of governance for sustainable
development. Rotterdam. Retrieved from http://hdl.handle.net/1765/10200
77. Loorbach, D., & Rotmans, J. (2005). Managing Transitions for Sustainable Development. In
X. Olsthoorn, A. Wieczorek (Eds.), Understanding Industrial Transformation. Environment &
Policy, (Vol. 44, pp. 1-19). Springer, Dordrecht. doi:https://doi.org/10.1007/1-4020-4418-6_10
78. Lovell, H. (2007). The governance of innovation in socio-technical system : the difficulties
of strategic niche managent in practice. Science and Public policy, 34 (1), 35-44.
doi:10.3152/030234207X190540
79. Lundvall, B. (1993). National systems of innovation. Towards a theory of innovation and
interactive learning. Prometheus: Critical Studies in Innovation , 11(2).
doi:https://doi.org/10.1080/08109029308629360
80. Lynn, L., Heinrich, C., & Hill, C. (1999). The emprirical study of governance:
Theories,models, methods'. Workshop on Models and Methods for the Empirical Study of
Governance, University of Arizona.
81. Malerba, F. (2002). Sectoral Systems of Innovation and Production. Research Policy, 31(2),
247-264. doi:0.1016/S0048-7333(01)00139-1
82. Malerba, F. (2004). Sectoral Systems of Innovation: Concepts, issues and analysis of six major
sectors in Europe. Cambridge: Cambridge University Press.
83. Malerba, F. (2005). Sectoral systems of innovation: a framework for linking innovation to
knowledge base,structure and dynamics of sectors. Economics of Innovation and New
Technology, 14(1-2), 63-82. doi:10.1080/1043859042000228688

209
84. Malerba, F., & Orsenigo, L. (1997). Technological regimes and sectoral patterns of
innovative studies. Industrial and Corporate Change, 6(1), 83-117.
85. Mamta. (2015). Green Building : A New Wave In India. International Journal of scientific
research and management, 3(12), 3781-3790. doi:10.18535/ijsrm/v3i12.02
86. Manisha, J., Gaba, V., & Srivastava, L. (2007). Managing Power Demand - A case study of the
residential sector in Delhi. The Energy and Resource Institute. New Delhi: TERI Press.
Retrieved from
https://pdfs.semanticscholar.org/8390/a331c7a522f003daa83021d821bed6861b5b.pdf
87. Markard , J., Raven , R., & Truffer , B. (2012). Sustainability Transitions: An emerging field
of research and its prospects. Research Policy 41 (6), 955-967.
88. Markard, J., & Truffer, B. (2008). Technological innovation systems and the multi-level
perspective:Towards and integrated frameowrk. Research Policy, 37(4), 596-615.
89. Marszal, A., & Heiselberg, P. (2009). A Literature Review of Zero Energy Buildings (ZEB)
Definitions. Denmark: Department of Civil Engineering, Aalborg University.
90. Mdivani, K., & Hoppe, T. (2016). Experience with LEDS and NAMA Low Carbon
Strategies: The Case of Georgia. Sustainability, 8(6), 535. doi:doi:10.3390/su8060535
91. Meadowcroft, J. (2009). What about the polictics ? Sustainable Development, transition
management, and long term energy transitions. Policy Sciences, 42(4), 323-340.
doi:10.1007/s11077-009-9097-z
92. Meelen, T., & Farla, J. (2013). Towards an integrated framework for analysing sustainable
innovation policy. Technology Analysis & Strategic Management , 25(8), 957-970.
doi:https://doi.org/10.1080/09537325.2013.823146
93. Mertz, , G., Raffio, , G., & Kissock, , K. (2007). Cost optimization of net-zero energy house.
Proceedings of ES2007. Energy Sustainability 2007 (pp. 477-488). Long Beach, California:
University of Dayton . Retrieved from
https://www.udayton.edu/engineering/centers/building_energy/resources/pdf/ES2007-
36077_CostOptNetZeroHouse.pdf

210
94. Milward, H., & Provan, K. (1999). How Networks are governed. In C. J. Heinrich, & L. E.
Lynn Jr. (Eds.), Governance and Performance: New Perspectives (pp. 238-267). Georgetown
University Press.
95. Mourik, R., & Raven, R. (2006). A practioner’s view on Strategic Niche Management. Energy
Innovations and Transitions department (Policy Studies Unit), Eindhoven University of
Technology. Eindhoven : ECN.
96. Muhr, T., & Friese, S. (2004). User's Manual for ATLAS.ti 5.0. www.atlasti.com/manual.html.
97. Nelson, R., & Winter, S. (1982). An Evolutionary Theory of Economic Change. London: Belknap
Press of Harvard University Press.
98. NHB, & KFW. (2014). WP IV: General residential buildings sector update with focus on EE /
green buildings. New Delhi: NHB.
99. NRDC, & ASCI. (2012). Constructing Change:Accelerating Energy Efficiency in India's
Construction Market. New Delhi: NRDC Council.
100. Ofori, G. (2002). Challenges of Construction Industries in Developing Countries: Lessons
from various countries. 2nd International Conference of the CIB Task Group, (pp. 1-11).
Gabarone, Botswana.
101. Olivier, J. G., Janssens, M. G., & Jeroen, P. (2012). Trends in Global CO2 Emissions. PBL
Netherlands Environmental Assessment Agency & Europran Commission. the Hague: doi:
10.2788/33777
102. PassREg. (2015). Advisory Report:on barriers and solutions in European regions introducing
Passive House technology with renewable energy supply. DNA in de bouw. doi:
http://www.passreg.eu/download.php?cms=1&file=D4_6_PassREg_Advisory_report.pdf
103. Phillimore, J. (2001). Schumpeter, Schumacher and the Greening of Technology. Technology
Analysis and Startegic Management, 13(1), 23-37.
doi:https://doi.org/10.1080/09537320120040428
104. Pierre, J., & Peters, B. (2000). Governance, Politics and the State. New York: Palgrave.

211
105. Planning Commission. (2017). Sector-wise contribution of GDP of India. Government of India,
Ministry of Statistics and Programme Implementation. New Delhi:
doi:http://statisticstimes.com/economy/sectorwise-gdp-contribution-of-india.php
106. Ramesh, S. P., & Khan, E. M. (2013, Feb). Energy Efficiency in Green Buildings - Indian
Concept. International Journal of Emerging Technology and Advanced Engineering, 3(Special
Issue 3), 329-336.
107. Ramji, A., Pujari, R., Dey, S., Gaba, V., Nafde, A., & Anand, V. (2016). Energy Policy
Roadmap for the Indian Railways:Energy Efficiency and Renewable Energy Interventions. Centre
for Energy, Environemnt and Water (CEEW). New Delhi: CEEW. Retrieved December 2016
108. Raven, R. (2005). Strategic niche management for biomass : a comparative study on the
experimental introduction of bioenergy technologies in the Netherlands and Denmark. Eindhoven:
Technische Universiteit Eindhoven.
109. Raven, R. (2005). Strategic Niche Management for Biomass: Phd Thesis. Eindhoven:
Technische Universiteit Eindhoven.
110. Rawal et.al. (2014). Residential Buidlings in India: Energy Use, Projections and Saving Potentials.
GBPN & CEPT, Centre for Advanced Research in Building Science & Energy (CARBSE) .
New Delhi: Global Buildings Performance Network (GBPN). Retrieved from
http://www.gbpn.org/sites/default/files/08.%20INDIA%20Baseline_TR_low.pdf
111. Rawal, Vaidya, Ghatti, & Ward. (2012). Energy Code Enforcement for Begineers: A tiered
Approach to Energy Code in India. ACEEE . New Delhi: Bureau of Energy Efficiency, Govt. of
India. Retrieved from https://aceee.org/files/proceedings/2012/data/papers/0193-000113.pdf
112. Reed, M. S., Fraser, E. D., & Dougill, A. J. (2006). An adaptive learning process for
developing and applying sustainability indicators with local communities. Ecological
Economics, 406-418. doi:10.1016/j.ecolecon.2005.11.008
113. ReportBuyer. (2016). India Green Building Market Opportunity Outlook 2020. England:
Reportbuyer.
114. Rhodes, R. (1996). The new Governance : Governing without Government. Political Studies,
44(4), 652-667. doi:https://doi.org/10.1111/j.1467-9248.1996.tb01747.x

212
115. Rhodes, R. (1997). Understanding Governance : Policy Networks, Governance, Reflexivity and
Accountability. Buckingham: Open University Press.
116. Rip, A., & Kemp, R. (1998). Technological Change. Human Choice and Climate Change.
Vol 2. In S. Rayner, & E. L. Malone (Eds.), Human choice and climate change. (Vol. 2, pp. 327-
399). Ohio: Battelle Press.
117. Rotmas J, & Avelino F. (2011). Adynamic conceptualization of power for sustainability
research. Journal of Cleaner Production 19(8), 796-804.
118. Sabatier, P. (1988). An advocacy coalition framerwork of policy change and the role of
policy -oriented learning therein. Policy Science, 21(2-3), 129-168.
119. Salom, J., Widén, J., Candanedo, J., & Marszal, A. (2011). Understanding Net Zero Energy
Buildings: evaluation of load matching and grid interaction indicators. 12th Conference of
International Building Performance Simulation Association. Sydney, AU: Proceedings of
Building Simulation.
120. Sang, A. K., & Chong, T. T. (2015). Build Green - Issue 8. Building and Construction
Authority. Singapore: BCA. Retrieved May 19, 2017, from
https://www.bca.gov.sg/Publications/BuildGreen/others/BGreen_8_2015.pdf
121. Sankhe, S., Vittal , I., Dobbs, R., Mohan, A., Gulati, A., Ablett, J., . . . Sethy, G. (2010). India's
urban awakening : building inclusive cities, sustainable economic growth. McKinsey Global
Institute. New Delhi: McKinsey & Company.
122. Sartori, I., Napolitano, A., Marszal, A., Pless, S., Torcellini, P., & Voss, K. (2010). Criteria for
Definition of Net Zero Energy Buildings. Proceedings of EuroSun 2010 : International
Conference on Solar Heating, Cooling and Buildings. Graz: Aalborg University.
123. Schimschar, S., Blok, K., Boermans, T., & Hermelink, A. (2011). Germany’s path towards
nearly zero-energy buildings - Enabling the greenhouse gas mitigation potential in the
building stock. Energy Policy, 39(6), 3346-3360. doi:10.1016/j.enpol.2011.03.029
124. Schot, J., & Geels, F. W. (2008). Strategic niche management and sustainable innovation
journeys: theory, findings,research agenda, and policy. Technology Analysis & Strategic
Management, 20(5), 537-554. doi:10.1080/09537320802292651

213
125. Schot, J., & Rip, A. (1997). The Past and Future of Constructive Technology Assessment.
Technological Forecasting and Social Change, 54, 251-268.
126. Schot, J., Hoogma, R., & Elzen, B. (1994). Strategies for Shifting Technological Systems: the
case of the automobile system. Futures, 26(10), 1060-76.
127. Schot, J., Kemp, R., Truffer, B., Maruo, K., Prätorius, G., Potter, S., & Sørup, P. (1999).
ENV4-CT96-0275- Strategic Niche Management as a tool for Trsnition to a sustainable transport
system (SNMT). University of Twente, Centre for Studies of Science Technology and
Society, Netherlands. Retrieved from
https://pdfs.semanticscholar.org/ad90/cd0ad643ea66986e83f7d023f859399502e6.pdf
128. Schusler, T. M., Decker, D. J., & Pfeffer, M. J. (2003). Social learning for collaborative
natural resource management. Society and Natural Resources, 15, 309-326.
doi:10.1080/08941920390178874
129. Scott, W. (1995). Institutions and Organizations:Ideas, Interests and Identities. Sage,
Thousand Oaks, 17, 136-140. doi:10.3917/mana.172.0136
130. Serene Peh et. al. (2014). BCA Building Energy Benchmarking Report 2014. Green Building
Policy Department , Green Mark Department ,Corporate Communication Department.
Singapore: Building and Construction Agency (BCA). Retrieved November 12, 2017, from
https://www.bca.gov.sg/GreenMark/others/BCA_BEBR_Abridged_FA.pdf
131. Seyfang, G., & Hexaltine, A. (2012). Growing grassroots innovations: exploring the role of
community-based incentives in governing sustainable energy transitions. Environment and
Planning C: Polictis and Space, 30(3), 381-400. doi:https://doi.org/10.1068/c10222
132. Seyfang, G., & Smith , A. (2007). Grassroots innovations for sustainable
development:Towards a new research and policy agenda. Enviromental Politics , 16(4), 584-
603. doi:https://doi.org/10.1080/09644010701419121
133. Shnapp, S., & Laustsen, J. (2013). Mitigation Potential from India's Buildings. Global Buildings
Performance Network (GBPN). Retrieved from
http://www.gbpn.org/sites/default/files/08.India_TechnicalReport_0.pdf.

214
134. Shove, E., & Walker, G. (2007). CAUTION! Trasitions ahead: politics, practice, and
sustainable transition management. Environment and Planning A :Economy and Space, 39(4),
763-770. doi:10.1068/a39310
135. Siva, V., Hoppe, T., & Jain, M. (2017). Green Buildings in Singapore; Analyzing a
Frontrunner’s Sectoral Innovation System. Sustainability, 6(6), 919. doi:10.3390/su9060919
136. Smith , A., Stirling , A., & Berkhout, F. (2005). The governance of sustainable socio-
technical transitions. Research Policy , 34(10), 1491-1510.
137. Smith. (2006). Alternative technology niches and sustainable development.
Innovation:Organisation and Management, 6(2), 220-235.
doi:https://doi.org/10.5172/impp.2004.6.2.220
138. Smith, A., & Raven, R. (2011). What is Protective Space? Reconsidering niches in transitions to
sustainability ((ECIS working paper series; Vol. 201105). . Technische Universiteit Eindhoven.
Eindhoven: Eindhoven Centre for Innovation Studies (ECIS),.
139. Smith, R. M. (2015, March). “Green” building in India: a comparative and spatial analysis
of the LEED-India and GRIHA rating systems. Asian Geographer, 32(2), 73-84. Retrieved
from https://doi.org/10.1080/10225706.2015.1020065
140. Stone, C. (1989). Regime Politics: Governing Atlanta, 1946-1988. Scandinavian Political
Studies, 14.
141. TERI, B., & Bank, Y. (2014). Green Real Estate Sector. New Delhi: Yes Bank & Teri.
142. Torcellini, P., Pless, S., Deru, M., & Crawley , D. (2006). Zero Energy Buildings: A Critical
Look at the Definition. National Renewable Energy Laboratory - ACEEE Summer Study.
California: National Renewable Energy Laboratory and Department of Energy, (US).
143. UNEP-SBCI. (2009). Buildings and Climate Change - Summary for decision makers. Paris,
France: UNEP.
144. Unruh, G. (2002). Escaping Carbon Lock-in. Energy Policy , 30(4), 317-325.
145. Urge-Vorsatz, D., Petrichenko, K., Antal, M., Staniec, M., Labelle, M., Ozden, E., & Labzina,
E. (2012). “Best Practice Policies for Low Energy and Carbon Buildings. A Scenario Analysis”.
Central European University Press.

215
146. US DOE . (2008, July). Building Technologies Program, Planned Program Activities for 2008-
2012, . Retrieved from http://www1.eere.energy.gov/buildings/mypp.html
147. USAID. (2016, May 30). Energy Conservation Building Code – 2016 National Expert
Consultation Workshop. New Delhi: USAID PACE D.
148. USAID. (2016). https://www.pace-d.com/building-energy-efficiency-3/. Retrieved August 16,
2017, from https://www.pace-d.com.
149. USAID. (2017). Retrieved August 16, 2017, from www.nzeb.in:
http://www.nzeb.in/definitions-policies/case studies/
150. USAID. (2017). Retrieved August 2017, from www.nzeb.in.
151. Vasudevan, R., Cherail, K., Bhatia, R., & Jayaram, N. (2011). Energy Efficiency in India-
History and Overview. Alliance for an Energy Efficient Economy. New Delhi: Retrieved
November 12, 2017
152. Vedala, S., Bilolikar, R. V., Parnandi, P. K., Khosla, R., Jaiswal, A., Goldstein, D., & Deol, B.
(2012). Constructing Change :Accelerating Energy Efficiency in India's buiding market. NRDC;
ASCI. New Delhi: NRDC Publications. Retrieved September 23, 2014
153. Vij et.al. (2016). GRIHA New Construction Manual. TERI, GRIHA. New Delhi: TERI Press.
Retrieved October 2017, from http://www.grihaindia.org/files/Manual_VolI.pdf
154. Voss, K., & Musall , E. (2011). Net Zero Energy Buildings – International Projects on Carbon
Neutrality in Buildings. Munich : Institut fur internationale Architektur-Dokumentation.
155. Wamsley, G. (1990). The Agency Perspective: Public administrators as agential leaders. In
G. L. Wamsley (Eds.), Refounding public administration. Newbury Park, Calif: Sage
Publications. Retrieved from http://www.loc.gov/catdir/enhancements/fy0658/89024241-
t.html
156. Weber, K. M., & Rohracher, H. (2012). Legitimizing research, technology and innovation
policies for transformative chance : combining insights from innovation systems and multi-
perspective in a comprehensive 'failures' framework. Research Policy, 41(6), 1037-47.
doi:https://doi.org/10.1016/j.respol.2011.10.015

216
157. Weber, M., & Hoogma, R. (1998). Beyond national and technological styles of innovation
diffusion: A dynamic perspective on cases from the energy and transport sectors.
Technology analysis and Strategic Management, 10(4), 545-566.
doi:https://doi.org/10.1080/09537329808524333
158. Weber, M., Hoogma, R., Lane, B., & Schot, J. (1999). Experimenting with Sustinable Transport
innovations - A workbook on Stategic Niche Management. Universiteit Twente, Enschede.
159. WEC. (2013). World Energy Perspectives : Energy Efficiency policies : what works and what does
not. Lodnon: World Energy Council. Retrieved from
https://www.worldenergy.org/wpcontent/uploads/2013/09/World_Energy_Perspective_En
ergy-Efficiency-Policies-2013_Full_Report.pdf
160. Witt, U. (2011). The dynamics of consumer behaviour and the transition to sustainable
consumption patterns. Environmental Innovation and Societal Transitions, 1(1), 109-114.
doi:https://doi.org/10.1016/j.eist.2011.03.001
161. Woolthuis, R. K., Lankhuizen, M., & Gilsing, V. (2005). A system failure framework for
innovation policy design. technovation, 25, 609-619.
162. World Bank. (2013). Urban Population (% of total);. Washington DC , USA: World Bank.
163. ZEBRA2020. (2016). Deliverable D5.2:Market actors NZEB uptake-Drivers and Barriers in
European countries. Austria: ZEBRA.
164. Zero Carbon Hub . (2014). Zero Carbon Homes and Nearly Zero Energy Buildings. London:
Zero Carbon Hub.


219
Table 19 : Integrated Assessment Framework (Sectoral System Innovation Framework-SSIAf)
Shaping of Expectation – (Shared visions, expectations based on tangible results)
Q1. Which factors led to the development of NZEB pilot and demonstration projects?
(Motivations, expectations, govt. support etc.)
Q2. What were your expectations from the NZEB project? Are these expectations shared
among the group of niche actors?
Q3. Are niche actors satisfied with the results of the NZEB demonstration projects; do they
think NZEB expectations are realistic, or should they be modified?
Q4. What is the role of government in articulating a vision for NZEBs? (e.g. NZEB -2030,
support for NZEB pilot project protection)
Actor networks and interactions – (broad social network, formal and informal interactions)
Q 5. Is a wide range of relevant actors involved in the pilot demonstration project,
and is the group diverse? How does this actor-network appear? (members, size of
network). Who is the key actor (in influencing decision-making)?
Q6. How often do niche network interactions/meetings take place? How is the niche
network managed and by whom?
Q7. Is there a network platform on NZEB niche development? (e.g. an NZEB alliance or
consortium)
Q8. How are NZEB niche actor interactions facilitated by the government?
Institutions (formal: rules, laws, regulations, sectoral polices, monitoring and sanctioning etc.; informal: common habits, routines, established practices, laws and standards, responsibilities, obligations, beliefs etc.) Q9. To what extent are rules, regulations, policies and monitoring aligned with NZEB niche
development?
Q 10. What is the role of national and regional governments in providing protection to the
NZEB demonstration projects? (subsidies, tax rebates, financial incentives, co-financing etc.)
Q11. How do informal institutions (such as common habits, beliefs, standards, established
practices) support the NZEB niche development process?
Learning Process (Technical and knowledge, Techno-economic optimization, Technical/social alignment (user preferences, regulations, cultural meaning), Environmental impact, Reflexive self-governance (i.e. the flexibility to change course)
Q 12. Have NZEB pilot demonstrations been successful in making the technical, economic and
environmental feasibility of NZEBs explicit? (clear definition, standards, cost benefits, sound
outcome indicators etc.)

220
Q13. How has the newly acquired knowledge on NZEB been disseminated among the various
stakeholders including end-users (e.g. NZEB web portal, magazine articles, open days,
newspapers, public media) and how is knowledge exchange managed in the niche actor
network?
Q14. Have user preferences or user involvement been given importance in the project’s
progress? Are end-users aware of specific aspects of occupying NZEBs that directly influence
their comfort? (Metering, smart metering, mechanisms for energy saving, expertise on
automated systems, guidance, manuals, user-behaviour etc.)
Q 15. Did niche actors illustrate explicit reflexive learning in experimenting with pilot projects
(e.g. monitoring the niche development)? Did it proceed according to the plan, and if not, was
the experimentation strategy revised? Did they critically reflect on their role and the way they
do things in designing and constructing NZEB demonstration projects?
Market Demand - (requirements and preferences, market structure, size and segmentation)
Q16. To what extent were end-users (and NZEB clients) satisfied with the results of NZEB pilot
projects?
Q 17. What are the main barriers to developing a market demand for NZEBs? How is the creation
of a market demand expressed in NZEB demonstration projects? In what ways is the creation
of a market demand reflected? (e.g., awareness-raising campaigns, advertisements, marketing
strategies, field trips for potential users to demonstration project sites).

221
Table 20 : Case study questionnaire for sector-level actors outside the NZEB niche
Shaping of Expectations - (shared visions, expectations based on tangible results)
Q1. What are the expectations of the regime actors regarding NZEB niche development? (positive
or negative + argumentation)
Q2. Have these expectations changed after NZEB pilot demonstration projects have been
successful? (positive or negative and why)
Q3. Has government support (funding, incentives etc.) to NZEB demonstration projects influenced
the expectations of the regime actors?
Actor networks and interactions – (broad social network, formal and informal interactions)
Q4. What is the level of formal and informal interactions between niche and regime actors over
NZEBs? (High or low – through conferences, workshops etc.)
Q5. Which barriers do regime networks impose on NZEB niche development?
Institutions (formal: rules, laws, regulations, sectoral polices, monitoring and sanctioning etc.; informal: common habits, routines, established practice, laws and standards, responsibilities, obligations, beliefs etc.) Q6. What key sectoral policies and regulations target NZEBs? (e.g. ECBC code development, energy
efficiency finance, building regulations)
Q7. How stringent or flexible are the formal institutions towards NZEB niche development?
Learning Process (Technical and knowledge, Techno-economic optimization, Technical/social alignment (user preferences, regulations, cultural meaning), Environmental impact, Reflexive self-governance (i.e. the flexibility to change course) Q8. Are regime actors learning from demonstration projects about major regime barriers preventing
niche development? (sectoral policies, regulations, user preferences, cultural values, infrastructure,
etc.)
Q9. What is the role of educational institutions in building technical and knowledge development
regarding NZEBs?
Market Demand - (Requirements and preferences, market structure, size and segmentation)
Q10. What reasons can be identified for the low current market demand for NZEBs?
Q 11. What characteristics of the building market go against increasing the market demand for NZEBs?

222


225
Table 21 : GAT Questionnaire - Case study 2 ,3
Governance
Dimension
Quality of the governance regime
Levels and scales Extent: How many administrative levels are involved and dealing with
NZEBs? Are there any important gaps or missing levels?
Coherence: Do these govt. bodies work together and do they trust each?
To what degree is the mutual dependence among levels recognised?
Flexibility: Is it possible to move up and down levels (up scaling and
downscaling) given the issue at stake?
Intensity: Is there a strong impact from a certain government level on
NZEB niche development (e.g. on learning, networking, more pilot
projects, scaling up of NZEB best practices.
Actors and
Networks
Extent: Are all relevant stakeholders involved? Are there any
stakeholders not involved or even excluded?
Coherence: What is the strength of interactions between stakeholders? In
what ways are these interactions institutionalised in stable structures?
Do the stakeholders have experience in working together? Do they trust
and respect each other?
Flexibility: Is it possible that new actors are included or even that the
lead shifts from one actor to another when there are pragmatic reasons
for this? Do the actors share in ‘social capital’ allowing them to support
each other’s tasks?
Intensity: Is there a strong pressure from an actor or actor coalition
towards stimulation of NZEB niche development
Problem
perspectives and
goal ambitions
Extent: To what extent are various problem perspectives taken into
account?
Coherence: To what extent do the various perspectives and goals support
each other, or are they in competition or conflict?
Flexibility: Are there opportunities to re-assess goals? Can multiple goals
be optimized in package deals?
Intensity: How different are the goal ambitions from the status quo or

226
business as usual?
Strategies and
instruments
Extent: What types of instruments are included in the policy strategy?
Are there any excluded types? Are monitoring and enforcement
instruments included?
Coherence: To what extent is the incentive system based on synergy? Are
trade-offs in cost benefits and distributional effects considered? Are there
any overlaps or conflicts of incentives created by the included policy
instruments?
Flexibility: Are there opportunities to combine or make use of different
types of instruments? Is there a choice?
Intensity: What is the implied behavioural deviation from current
practice and how strongly do the instruments require and enforce this?
Responsibility-ties
and resources
(implementation)
Extent: Are all responsibilities clearly assigned and facilitated with
resources?
Coherence: To what extent do the assigned responsibilities create
competence struggles or cooperation within or across institutions? Are
they considered legitimate by the main stakeholders?
Flexibility: To what extent is it possible to pool the assigned
responsibilities and resources if accountability and transparency are not
compromised?
Intensity: Is the amount of allocated resources sufficient to implement
the measures needed for the intended change?

227
SUMMARY Among the developing nations, India’s economic growth is accelerating at fast pace, causing
the demand for energy to increase manifolds. Economic growth also leads to an increased
demand for buildings in cities which accounts up to 40% of the total energy consumption in the
country. The current energy infrastructure is poor and incapable of coping with this
exponential increase in demand for buildings and energy requirements. For these reasons, it is
imperative for the Indian building sector that projected energy growth is managed in a feasible
and a more sustainable manner. To cope with this, there seems to be an urgent need to design
and implement policy instruments, and governance mechanisms that influence key systemic
conditions to overcome barriers that are essential in the transition of the building sector
towards low energy or low carbon energy systems, and towards near zero energy goals.
Currently, green buildings account for less than 5% of the current building stock in the country.
Green buildings with the highest energy efficiency level are now being projected as ‘near’ or
‘net zero energy buildings’ (NZEB) in the western world. They use renewable energy for energy
production. NZEBs are buildings with an extremely low energy demand, and in which the
remaining energy demand is met by on site renewable energy.
This doctoral study starts from exploring key theoretical frameworks which deem suitable to
assess sustainability transitions, sustainable innovations and governance conditions needed for
radical transformations and structural change towards large uptake of NZEBs in India’s
building sector. These theoretical frameworks include Strategic niche management, Sectoral
innovation systems and Governance assessment tool. The doctoral study answers the main
research question “What are the supportive and restrictive conditions for Net Zero Energy
Buildings (NZEBs) niche development in the building sector in India? Consequently, this
article-based research starts with analyses of the integration of these theoretical frameworks and
develops a new integrated assessment framework called as “Sectoral System Innovation
Assessment framework” (SSIAf). Three empirical case studies were selected to explore the
applicability of the integrated framework to assess the niche development of NZEBs in India
from innovation, transitions and governance perspective. Data collection involved 40 semi-
structured in-depth interviews with key stakeholders in India and also collection of written
documents, site visits, and participation in workshops and meetings. The main conclusions

228
were that the NZEB innovation niche was yet to develop into a mature niche and is growing
only slowly. This could be assessed from the results of the shaping of expectations component of
the SSIAf framework which revealed that there were only marginal expectations of the building
sector stakeholders regarding NZEB niche. The social network formation component revealed that
new social networks were only strong within individual NZEB projects and there had been a
failure to create a cohesive network with other NZEBs and with actors outside the NZEB
projects resulting in a limited level of innovations. From governance perspective, the study
revealed that the governance context in New Delhi region was found to be complete in terms of
extent, but rather incoherent, only moderately flexible, while fairly intense in other areas. Hence
from the ‘extent’ perspective the New Delhi region can be seen to be in a position to adopt
NZEBs with a supportive context for actors and networks, problem perspectives, strategies and
instruments. On the contrary, in the Ajmer case study, the governance context was considered
to be highly incoherent, with a weak extent, moderate level of flexibility and weak intensity
towards NZEB niche development. This situation resulted in poor governance conditions
making the context less supportive towards NZEB adoption as primary elements that are badly
required for implementation were missing. The existing governance qualities reflected limited
governance capacity to initiate any innovation and transition of the building sector towards the
uptake of more energy efficient buildings in the selected case.
In addition to the case studies conducted in India, innovations of green buildings in
Singapore were analysed and compared to the situation in India. The case study integrated
SSIAf and GAT to analyse and draw comparisons to the cases in India. The results reveal that
the sectoral innovation system in Singapore was generally supportive towards green building
uptake with supportive governance qualities. The active role of national government – in
particular by the BCA – could be seen as instrumental towards innovation and transition
process for green buildings in Singapore, which is unlike the case in India. From a governance
perspective the overall quality of governance in Singapore on the SSIAf’s quality criteria of
extent, coherence, flexibility and intensity, were found to be rather positive, and to improving
even further. In contrast, in the Indian case study, the quality of governance was observed to be
only moderately supportive towards innovation and adoption of green buildings and low
energy buildings. The five research stages presented in this doctoral thesis allowed for further
reflection, standardization and refinement of the assessment framework vis-a-vis different

229
contextual settings; and thus, permitted a larger scope of analysis (niche demonstration
projects, governance assessment of two regions and comparatives assessment between two
countries).

230

231
SAMENVATTING
Te midden van de andere ontwikkelingslanden versnelt de economische groei van India
zich voortdurend en veroorzaakt daarmee een verveelvoudiging van de vraag naar energie. De
economische groei leidt ook tot meer vraag naar gebouwen in de steden, die al zo’n 40% van
het totale energieverbruik van het land veroorzaken. De huidige energie-infrastructuur is zwak
en niet in staat om te voldoen aan de exponentieel groeiende vraag naar gebouwen en hun
energiebehoeften. Om deze redenen is het nodig dat de Indiase bouwsector op een haalbare en
meer duurzame manier met de voorziene energiebehoefte omgaat. Om dit te bereiken, is er een
urgente behoefte aan het ontwerpen en implementeren van beleidsinstrumenten en
sturingsmechanismen die de wezenlijke systeemvoorwaarden beïnvloeden om zo de barrières
te slechten die de transitie van de bouwsector in de richting van laag energetische en
koolstofarme systemen en uiteindelijk nagenoeg nul energievraag in de weg zitten. Op dit
moment zijn groene gebouwen nog slechts 5% van de bestaande bouw in het land. De groene
gebouwen met het hoogste energie efficiëntie niveau worden nu in de westerse wereld “net” of
“near zero energy buildings” (afgekort tot NZEB’s; ‘nulenergiegebouwen’ in het Nederlands)
genoemd. Dit zijn gebouwen met een extreem laag energieverbruik waar in de resterende
vraag met hernieuwbare energie wordt voorzien.
Dit promotieonderzoek startte met het verkennen van theoretische raamwerken die geschikt
lijken voor onderzoek naar transities naar duurzaamheid, duurzame innovaties en de
benodigde sturingscondities die nodig zijn voor radicale transformaties en structurele
veranderingen in de richting van een brede marktopname van NZEB’s in de bouwsector van
India. Deze theoretische raamwerken omvatten Strategisch Niche Management (SNM),
Sectorale Innovatie Systemen (SIS) en de Governance Assessment Tool (GAT). In lijn hiermee
startte dit op artikelen gebaseerde onderzoek met het analyseren van de mogelijkheden tot
integratie van deze theoretische raamwerken en het ontwikkelen van een nieuw geïntegreerd
beoordelingskader, “Sectoral System Innovation Assessment framework” (SSIAf) genaamd.
Drie empirische cases werden geselecteerd om de toepasbaarheid van het geïntegreerde
raamwerk te onderzoeken bij het beoordelen van de niche-ontwikkeling van NZEB’s vanuit een
innovatie-, transitie- en governance-perspectief. In India omvatte de gegevensverzameling
onder meer 40 semigestructureerde diepte-interviews met sleutelfiguren. De belangrijkste

232
conclusies waren dat de NZEB-innovatieniche zich nog verder moest ontwikkelen tot een
volwaardige niche, en maar langzaam groeit. Dit kon worden afgeleid uit de component van
het scheppen van verwachtingen uit het SSIA-raamwerk, die liet zien dat er slechts marginale
verwachtingen onder de sleutelfiguren in de bouwsector bestaan wat betreft de ontwikkeling
van de NZEB-niche. De component sociale netwerkvorming liet zien dat de sociale netwerken
alleen sterk waren binnen individuele NZEB-projecten en dat het mislukt was om een
samenhangend netwerk te scheppen met andere NZEB-projecten en met actoren buiten de
NZEB-projecten, hetgeen resulteerde in een beperkt innovatieniveau. Vanuit een governance-
perspectief liet de studie zien dat de governance-context in New Dehli weliswaar compleet was
in termen van omvattendheid, maar nogal onsamenhangend, slechts gematigd flexibel, maar
tamelijk intensief in andere opzichten. Vanuit het perspectief van omvattendheid kan de New
Delhi-regio worden gezien als in een positie om NZEB’s te ontwikkelen, met een
ondersteunende context voor actoren en netwerken, probleempercepties, strategieën en
instrumenten. In de Ajmer-casestudie werd daarentegen de governance-context beoordeeld als
zeer onsamenhangend, met een zwakke mate van omvattendheid, een gematigd niveau van
flexibiliteit en een zwakke intensiteit in de richting van de ontwikkeling van de NZEB-niche.
Deze situatie resulteerde in zwakke governance-condities die de context minder ondersteunend
maken voor de ontwikkeling van NZEB’s, omdat wezenlijke elementen die hard nodig zijn
voor implementatie worden gemist. De bestaande governance-kwaliteiten geven een beeld van
een beperkte governance-capaciteit om wat voor innovatie dan ook op te starten. Dit geldt in
het bijzonder voor de transitie van de bouwsector in de richting van meer energie-efficiënte
gebouwen in de Ajmer-regio.
Naast de casestudies in India, is ook een vergelijking gemaakt met de energietransitie en
innovaties van groene gebouwen in Singapore. Deze casestudie gebruikte een geïntegreerde
versie van SSIAf en de GAT om deze te analyseren en te vergelijken met de cases uit India. De
resultaten laten zien dat het sectorale innovatiesysteem in Singapore in het algemeen
ondersteunend was voor de nicheontwikkeling en marktopname van groene gebouwen, met
ondersteunende governance-kwaliteiten. De actieve rol van de nationale regering – in het
bijzonder de Building Construction Authority (BCA) – wordt als instrumenteel gezien voor de
innovatie en het transitieproces naar groene gebouwen in Singapore, wat verschilt van de
situatie in India. Vanuit een governance-perspectief werd de algemene kwaliteit van de

233
governance in Singapore voor wat betreft de op de SSIAf-componenten toegepaste
kwaliteitscriteria van omvattendheid, samenhang, flexibiliteit en intensiteit, als tamelijk positief
gezien. Bovendien bleken zij zich nog verder te verbeteren. In India, daarentegen, werd de
governance-kwaliteit slechts als matig ondersteunend voor innovatie en de verspreiding van
groene en laag-energetische gebouwen gezien.
De vijf stappen van het onderzoek dat in dit proefschrift is gepresenteerd, vormen een basis
voor verdere reflectie, standaardisatie en verfijning van het beoordelingskader voor
verscheidene contextuele situaties. Daarmee maken ze een bredere reikwijdte van analyse
mogelijk die ook nichedemonstatieprojecten, de governance-beoordeling van twee regio’s en
een vergelijkende beoordeling van twee landen omvat.

234
