book of abstracts - iwa-ywp.pliwa-ywp.pl/wp-content/uploads/2018/02/bookofabstracts.pdf ·...
TRANSCRIPT

1st
IWA Polish
Young Water Professionals
Conference
Book of Abstracts Book of Abstracts
Water, Wastewater and Energy
in Smart Cities
12 - 13 September 2017 Cracow, Poland
Silesian University of Technology
Lublin University of Technology
Warsaw University of Technology
Poznan University of Technology
Wrocław University
of Technology
Gdańsk University of Technology
Co-organised by:
Organised by:
CRACOW UNIVERSITY
OF TECHNOLOGY
Bialystok University
of Technology
Czestochowa University of Technology
Honory Patronage by:
Rector of the Cracow
University of Technology
Water, Wastewater and Energy
in Smart Cities
12-13 September 2017, Cracow, Poland
BOOK OF ABSTRACTS

SPONSORS:
PLATINUM
GOLD
STANDARD
BRONZE

A tourist visiting Cracow for the first time is
faced with a vast choice of picturesque sights
and places of interest, full of history and le-
gends; some of them deserve a particular atten-
tion. Those places are the pillars of Cracow’s
image as an attention-stealing city with a
unique history and culture.
This book presents the Abstracts from the first Conference of Intenatio-
nal Water Association IWA for young scientists which was held on 12-
13 September 2017 in Cracow, Poland. The National IWA Young Wa-
ter Professionals (YWP) Conference was the first great event of the
Cracow University of Technology and International Water Association
Poland. The Conference‘s location is not a coincidence, Cracow is the
most beautiful town in Poland and a place with great history.
Founded probably at the beginning of the 10th Century, Cra-
cow is one of the oldest cities not only in Poland, but also in
Europe. Located at the Vistula River and being an essential rest
stop on the key trade routes, Cracow has grown over the centu-
ries to become a true metropolis. A rapid economic growth
followed by extensive investment projects, has also stimulated
the city’s impressive cultural development, earning Cracow a
place among the global urban jewels. For many centuries, Cra-
cow was the capital of Poland. The city is virtually swarming
with historic monuments of culture and architecture, museums
and memorials.
The highest level of technical education is ensured by the
Cracow University of Technology, ranked among the most
prestigious technical universities in Europe. Through high
level of its courses, based on many years of experience and
tradition, the Cracow University of Technology educates the
future intellectual elite of Europe. The students have the
opportunity to follow their scientific ambitions not only by
attending the courses, but also by participating in scientific
and economic activities of the University institutions, such as
the Centre for Advanced Technology. The Cracow Universi-
ty of Technology successfully combines Polish tradition and
history with progress and innovations.

5
Contents
Use of EPANET solver to manage water distribution in Smart City ................................................... 9
Sensitivity analysis of water consumption in office buildings .......................................................... 11
Innovative solutions in monitoring systems in flood protection ........................................................ 13
Application of Information Technology Solutions for Early Warning Systems at Water Utilities ... 15
Effect of Drought Crisis on Salinity Level of Bangkok Water Supply ............................................. 17
The influence of the synthetic hyetograph parameters on the simulation results of runoff from the
urban catchment ................................................................................................................................. 18
Evaluation of potential secondary water pollution in public fountains in the aspect of development
of Legionella species .......................................................................................................................... 20
Maximum precipitation in a year with a defined duration and likelihood of exceedance in the world
............................................................................................................................................................ 22
A comparative analysis of selected wastewater pretreatment processes in food industry ................. 24
On-site pilot-scale experiments for upgrading pharmaceutical wastewater treatment in combined AS
– biofilm systems ............................................................................................................................... 26
Experimental study of the anaerobic ammonium oxidation process and the effect of operational
parameters on system performance .................................................................................................... 28
Analysis of Oxygen Conditions Ensuring High Efficiency of COD and Nitrogen Removal in SBR,
IFAS-MBSBBR, MBSBBR Systems ................................................................................................ 30
The rate of denitrification with using hydrodynamically disintegrated excess sludge as organic
carbon source ..................................................................................................................................... 32
Inhibition effect of free ammonia on deammonification process under different intermittent aeration
strategies in sequencing batch reactor ................................................................................................ 34
Photo-oxidation of selected PAHs with calcium peroxide as a source of the hydroxyl radicals ....... 36
Anticancer drugs in the aquatic environment – possibilities of their elimination ............................. 38
Modeling Aeration Control Strategies for Low Energy Process Control in WWTP ......................... 40
Possibilities of heat energy recovery from graywater installation ..................................................... 42
Automatization of sedimentation test ................................................................................................ 44
Model-Based Evaluation of Different Strategies for Improving Energy Balance of Wastewater
Treatment Plants ................................................................................................................................ 46
Municipal Waste Management Plant as Energy Prosumer ................................................................ 48
Water and sewage sludge digestion: characteristic of the process and its possible applications ....... 50
Analysis and comparison of methods for the preparation of domestic hot water from district heating

6
system, selected renewable and non-renewable sources in low-energy buildings ............................ 52
Comparison of designed and real electric energy consumption by SBR reactors in a small municipal
WWTP ............................................................................................................................................... 54
Drinking of tap water is smart, but how do it better?- A tap water quality research ......................... 56
Evaluation of the possibility of using the water of the Bystrzyca Nadwórniańska River in
Czerniejów (Ukraine) to supply the population with drinking water ................................................ 58
Use of absorbance UV to interpret transformations of organic compounds during filtration by
biologically active carbon filters - experiments of pilot scale technological investigations ............. 60
Natural Organic Matter in water, its significance and ways of removal – a review .......................... 62
Composting sewage sludge with solid fraction of digested pulp from agricultural biogas plant ...... 64
Influence of hydrodynamic disintegration on solubilization and bioavailability of sludge particulate
material............................................................................................................................................... 66
The rate of generation of hydrogen sulphide in sewage systems ....................................................... 68
Influence of the Wastewater Treatment Process on the Content of Fulvic Acids ............................. 70
Analysis and modelling of Fixed-bed column operation for urea removal from human urine by
adsorption onto coal fly ash ............................................................................................................... 72
The influence of type of sampling container on the arsenic concentration variability in the
geothermal water of the Bańska PGP-1 well ..................................................................................... 73
Fate of heavy metals in streams and retention tanks in the agglomeration of Gdańsk ...................... 75
Sorption of Ni(II) on surface of bed's grains used in iron and manganese removing filters ............. 77
Preliminary assessment of the dependence the type of reverse osmosis membrane used in
desalination process on the quality of obtained concentrate .............................................................. 79
Estimation of pollutants leaching from cement coating to water after pipe renovation based on
laboratory experiments ....................................................................................................................... 81
The Impact of the Way in Which the Inflow Is Connected With the Retention Reservoir on
Required Volume ............................................................................................................................... 83
Municipal landfill as a source of humic substances polluting water ................................................. 85
Impact of land use on heavy metal contamination in the Dobczyce Reservoir area (south Poland) . 86
Smart use of water in smart cities - possibilities or limitations? ...................................................... 88
Drinking water supply without use of disinfecant ............................................................................. 89
Changes of physicochemical and microbiological parameters of infiltration water at Debina intake
in Poznan. Unique conditions - flood................................................................................................. 91
Issues of the presence of parasitic protozoa in surface waters ........................................................... 93
Impact of catchment area activities on water quality in small retention reservoirs ........................... 95

7
Monitoring of heavy metals in selected Water Supply Systems in Poland, in relation to current
regulations .......................................................................................................................................... 97
Influence of the length of the study period on the dimensioning of the usable capacity of main water
tanks ................................................................................................................................................... 99
The effects of the purification of the backwash water waste stream in the light of the phytotoxicity
assessment of the coagulation products ........................................................................................... 101
The use of activated alumina and magnetic field for the removal heavy metals from water .......... 103
Contamination content introduced with rain water to the rivers after they have been cleaned in
separators of petroleum compounds ................................................................................................ 105
Assessment the impact of sampler changes on the sampling uncertainty associated with thermal
waters ............................................................................................................................................... 107
Application of GPR Method for Detection of Loose Zones in Flood Levee ................................. 109
Stability evaluation of modernized bank protections in a culvert construction ............................... 111
The impact of the shape of deep bore well screen openings on the filtration process in full saturation
conditions ......................................................................................................................................... 113
Degradation Pathways of Pentachlorophenol and Benzo(a)pyrene During Heterogeneous
Photocatalysis................................................................................................................................... 115
The occurrence of antibiotic resistance genes in tap water – a review ............................................ 117
Evaluation of selected sewage sludge gasification technological parameters ................................. 119
Sewage sludge conditioning with the application of ash from biomass-fired power plant ............. 121
Possibilities of using biomass of microalga in methane fermentation ............................................. 123
Utilization of zeolites for reduction of ammonia in the digesters .................................................... 125
Possibility of using modified natural zeolite in the process of biogas desulfurization .................... 127
Numerical analysis of a heat exchanger with differentiated temperatures surface at varying distances
from the wall .................................................................................................................................... 129
Sewage Management Changes in the North-eastern Poland After Accession to the European Union
.......................................................................................................................................................... 131
Model Studies on the Effectiveness of MBSBR Reactors for the Restoration of Small Water
Reservoirs......................................................................................................................................... 133
Characteristics of Bionor-type SBR waste water treatment plant .................................................... 135
Long-term operation of IFAS-MBBR wastewater treatment plant – the activity of activated sludge
and biofilm ....................................................................................................................................... 137
Define of internal recirculation coefficient for biological wastewater treatment in anoxic and
aerobic bioreactors ........................................................................................................................... 139

8
The efficiency of nutrients removal from household wastewater in nonwovens bioreactors .......... 141
Measurement of hydrogen sulphide concentration in selected places of Sewage Treatment Plant
Cracow Płaszów II ........................................................................................................................... 143
Possibilities of using water treatment sludge in sewage sludge dewatering .................................... 145
The influence of the energy input on the particle size of disintegrated excess sludge in the ultrasonic
disintegration process ....................................................................................................................... 147
Statistical evaluation of the reduced graphene oxide influence on the anammox biomass ............. 149
Uncertainty of forecast and control of activated sludge sedimentation capacity: data mining
approach ........................................................................................................................................... 151
The effective concentration of chromium (III) in the wastewater by nanofiltration process assisted
diafiltration mode ............................................................................................................................. 153
Oily wastewater treatment using a zirconia ceramic membrane ...................................................... 155
Adsorptive Removal of Active Pharmaceutical Residues from Source Separated Human Urine ... 157
Effect of organic nitrogen concentration on the efficiency of trickling filters ................................ 159
Model-based evaluation of two conceptual mechanisms for N2O production in the anammox-
enriched granular sludge .................................................................................................................. 161
Ciliated protozoa in the impact zone of the Uzhgorod treatment plant ........................................... 163

9
Use of EPANET solver to manage water distribution in Smart City
A. Antonowicz*, R. Brodziak**, J. Bylka**, J. Mazurkiewicz***, S. Wojtecki*, P. Zakrzewski* * Wydział Informatyki, Politechnika Poznańska, ul. Piotrowo 3, 60-965 Poznań, Polska (E-mail: [email protected], [email protected], [email protected]) ** Wydział Budownictwa i Inżynierii Środowiska, Politechnika Poznańska, ul. Piotrowo 3a, 60-965 Poznań, Polska (E-mail: [email protected], [email protected]) *** Wydział Rolnictwa i Bioinżynierii, Uniwersytet Przyrodniczy w Poznaniu, ul. Wojska Polskiego 28, 60-637 Poznań, Polska (E-mail: [email protected])
INTRODUCTION According to the „Smart City” concept, by the inteligent water supply system, we see control and management of measurement and control devices through the use of ICT infrastructure elements – Master Control, monitoring and visualization systems, intelligent decision support systems, programmable controllers, industrial networks, etc. One of the main problems related to the implementation of smart water networks is the integration of different systems in order to enable a decision on the selection of an appropriate action scenario. However, due to the large number of dynamically changing information about the proces, making a choice for the expert (Operator / technologist) can be difficult or even impossible. Therefore, more and more often, it requires the implementation of intelligent decision support systems using computer simulations, inference with elements of Artificial Intelligence (genetic algorithms, fuzzy logic, artificial neural networks, etc.) and also various types of data analysis. In order to make full use of these systems, it is necessary to integrate them, for example through an appropriate web application, which allows access to a variety of data and tools (computational engines), often originally written in different, incompatible programming languages, and with various security features. RESEARCH OBJECTIVES The aim of the paper/work is to develop a method of using EPANET solver to perform simulations allowing to choice the best scenario operation of the water supply network according to a specified criterion. The main task is to develop the application that allows remote access to the simulation model of the water distribution network developed in the EPANET environment. The application should be able to perform both single and cyclic simulations with the specified step of changing the values of the selected process variables (pump performance, valve opening rate, etc.). It is advisable to appliaction meets requirements concerning generally accepted safety rules by using identification, authorization and authentication mechanisms. Moreover, to ensure access control to different types of information should implement multi-level permissions structure. The structure of the developed application is presented in Fig. 1. The proposed modular approach allows the implementation of the system in various variants - local (all modules located on the computer or mobile device), local-remote (web browser and selected modules placed on the computer or mobile device and other modules on the server) and remote (web browser placed on a computer or mobile device, and other modules on the server).

10
Figure 1. Modular approach of the implemented program. METHODOLOGY The work identifies and describes IT tools for: solving hydraulic models of water supply networks (Epanet shared libraries), database applications (PostgreSQL database), middleware software used to configure the data flow (Epanet-Python toolkit), Internet platforms for the construction and maintenance of programs (e.g. Pyramid) software to model various unit processes used in intelligent water supply management systems. The paper will also describe the concept of secure data exchange by individual application users. RESULTS The result of the work is a solution that allows access (in various modes) to the services, tools and data that are part of the intelligent management of the water network. Data exchange between: application, model and EPANET solver has been described. The flexible structure of the resulting application allows it to be used for various systems stored on various IT platforms. The application enables both single and cyclic simulation with a given step of changing the values of selected process variables (pump performance, valve opening rate, etc.) and uses spatial telemetry data (eg GIS data). In order to ensure adequate control of access to various types of information, a multi-level authorization structure has been implemented. REFERENCES EPANETTOOLS 0.9.2 : Python Package Index, www: Document:
https://pypi.python.org/pypi/EPANETTOOLS (accessed 3.11.17). Rossman, L., 2000. Epanet 2 user manual. National Risk Management Research Laboratory,
Cincinnati. WIDEST Water Innovation through Dissemination Exploitation of Smart Technologies D2.3: Smart
Water Grid topical roadmap. dostęponline: http://www.widest.eu/downloads/downloads-roadmaps (dostęp 3.11.17).
Python + libraries
Water supply
system model
file.inp
Solver
EPANET.DLL
Data base
POSTGIS
Web browser
APPLICATION
Python Script

11
Sensitivity analysis of water consumption in office buildings T. Suchacek*, L. Tuhovcak* and J. Rucka* * Institute of municipal water management, Faculty of civil engineering, Brno University of Technology, Zizkova 17, Brno 602 00, Czech republic (E-mail: [email protected])
ABSTRACT In the Czech Republic there is currently no legislative regulation defining in a mandatory manner a detailed procedure of calculating water demand related to a public main supplying water to a service area of a town or village type. Traditionally, a combination of empiric experience and partial legislative regulations is employed to determine the volume of water needed for the specific types of buildings or drinking water consumers in units of volume of water per calendar year. Nevertheless, when designing a water supply network it is necessary to meet the legislative requirements which, in fact, define the hydraulic parameters of the water network. Given the defined design flow-rate it is necessary to ensure the required range of operating pressures in those parts of the water network where consumers are connected. If the water supply is also used for fire-fighting purposes, the required pressure and flow-rate must be ensured for fire water supply. For comprehensive water supply systems, the design or redesign is often based on mathematical modelling and simulation methods [6] where the hydraulic calculations use as inputs also the daily and hourly variation coefficients (demand coefficients). In the Czech Republic, for example, the value of these coefficients is not defined by law, which causes problems in assessing the hydraulic capacity of the networks when designing new networks. Nevertheless, even in the better case when the demand coefficients are defined, it is often ignored that these coefficients differ at various operating pressures and are considered as being constant for any pressure conditions although it has been proved that pressure influences water demand. For example, according to [3], water demand is divided for the purposes of simulating water demands changes in relation to pressure changes into “inside the house” and “outside the house”. Both these parts of demand have a different coefficient expressing the dependency on pressure while the “outside the house” demand is much more influencable by pressure. Subsequently, the average coefficient is calculated expressing the dependency of water demand on pressure for the entire building. This coefficient is then implemented in the FAVAD equation [4]. The coefficient value for the “inside the house” demand was set for example in [1] for the student campus in Johannesburg at 0.2. According to [5], the dependency of demand on pressure was also proved for pressure toiler flushers in Great Britain and the coefficient value was set at 0.07 and 0.025. However, pressure also influences water demand variations during the day. The paper present the results of a real detailed study focused on simulating changes in water demand with changing pressure, changes in water demand variation with respect to pressure changes. Paper presents results of the conducted sensitivity analysis analysing the demand coefficient values at various time step durations. For the study was selected an office building for the detailed water demand analysis. In the Czech Republic this is a relatively typical kind of office building with three floors with approximately the same number of people working on each floor. After a detailed survey of the selected building it was confirmed that all water consumption in the building was the "inside the house" consumption. The measuring campaign in the selected building took place over one calendar year just like the monitoring of the number of people in the building. During the campaign, was metered pressure downstream the control valve fitted on the water service pipe and flow rate, i.e. volume of water

12
flowing through the water meter with a pulse generator, with the pulse value of 1 litre. The pressure and water meter index were recorded in 15s intervals. During the campaign there were cycles in which a constant value was set on the pressure control valve. At the end of the cycle the valve was always readjusted to a randomly generated value. The cycle duration was approx. 2 weeks. As the campaign lasted 1 year, it was necessary to take into account or exclude long-term impacts and trends in water consumption. In the Czech Republic, there has been a downward trend in water consumption since 1989 but in the last 3 years consumption can be considered more or less stable [2]. The effect of long-term trends could thus be excluded. The measured and acquired data was evaluated in two ways. Water consumption was normalised given the number of people in the building. The evaluation of water consumption and determination on the demand coefficient was made on the basis of measured quantities only during working hours in the building, which are the same for all employees and the number of people in the building thus does not change during the day. The demand coefficient determination was made using the consumption defined in litres per person and unit of time. First, the dependency of the demand coefficient on the pressure in the network was defined irrespective of the work day in the week (3 various working hour durations). Account was taken of all data for all days only during the working hours on the specific days. The second way was to make the evaluation separately for the work days with the same working hours duration. Thus, three different independent data sets were evaluated. The sensitivity analysis took place as the last step of the detailed analysis, i.e. the dependency of demand on pressure in the network. Hourly coefficients are used in a prevailing majority of cases to determine the demand coefficient, however, in this sensitivity analysis this time interval lasts from 10 minutes to 1.5 hours. After this analysis, the coefficient values for all the specific time steps were compared. The detailed analysis of water consumption and its subsequent prediction is a topical issue. The dependence of the demand coefficient on the pressure in the network can be used, for example, for the reconstruction of water supply networks related to pressure condition optimising. It is possible to predict the consequences of active pressure management optimise for example, the filling of water reservoir or pumping station pumping. The determined dependencies of water consumption and its variation over time may be used to predict uneven water demand given the change in pressure conditions in buildings of a similar character. REFERENCES Bartlett, L., (2004) B.Eng Final Year Project Report. Pressure dependent demands in Student Town
Phase 3, Dept of Civil and Urban Engineering, Rand Afrikaans University (now University of Johannesburg), South Africa, Johannesburg
Duda, J., Lípa, O., Petr, T. and Skácel, V., (2016) VODOVODY KANALIZACE ČR 2015, Department of Agriculture (in Czech).
Kovář, J., Ručka, J. and Andrš, O., (2014) Simulation Modelling of Water-supply Network as Mechatronic System. Proceedings of the 16th International Conference on Mechatronics – Mechatronika 2014, pp. 697-700, Brno, Czech republic.
Lambert, A. and Fantozzi, M., (2010) Recent developments in pressure management, Water Loss 2010. Sao Paolo, Brazil.
May, J. (1994) Pressure dependent leakage. World Water Environmental Engineering. Thorton, J. and Lambert, A., (2005) Progress in practicatel prediction of pressure:leakage,
pressure:burst frequency and pressure:consumption relationships, Leakage 2005. Halifax, Canada.

13
Innovative solutions in monitoring systems in flood protection K. Sekuła*, M. Połeć* and A. Borecka* * AGH University of Science and Technology, Department of Hydrogeology and Engineering Geology, Krakow, Poland (E-mail: [email protected]; [email protected]; [email protected] )
ISMOP PROJECT AS AN EXAMPLE OF COMPLEX MONITORING S YSTEM Currently, with the cooperation of AGH University of Science and Technology in Kraków and the following companies: SWECO Hydroprojekt Kraków sp. z o.o., Neosentio and ZPPUH Budokop Sp. z o.o, a project titled, IT System of Levee Monitoring (ISMOP), is being conducted (Stanisz et al., 2014, 2015; Borecka at al., 2016; Korzec et al., 2017). The article presents the system for monitoring the changes that occur within the experimental core of the earthen levee on the basis of reference and experimental control and measurement network. The research is carried out on an experimental levee built in a 1:1 scale (width x length x height: 58 x 208 x 4.5 m) located in the village of Czernichow, approximately 30 km west of Cracow. It consists of two parallel levee segments in the shape of an ellipse constructed of soils characterised by variable filter coefficients in the range from 10-5 m/s to 10-8 m/s with a built-in control and measurement network. The aim of the project The main idea of the project is to develop a comprehensive system to support the activities of state authorities and local governments for flood protection of the population by providing real-time information on the dynamics and intensity of processes occuring in earthen levees. The innovation is the utilization of a series of sensors monitoring the changes in the body of levee. It can be done by comparing the results of numerical simulations with results from installed two groups of sensors: reference sensors for spot measurement of pore pressure, temperature sensors, ground pressure sensors, a fiber optic sensor cable for the linear measuring of the temperature, inbuilt on two levels of the vent side and experimental sensors measuring the temperature and pore pressure, taking into account minimizing the costs of construction and installation, the energy consumption of the measurement and data transmission, assuming the optimal metering density (Korzec i in., 2017). The ultimate goals of the experiments is to create simply and relatively inexpensive system for local governments including developing the method of presenting the results of the analysis and its distribution to authorized bodies responsible for flood protection, thus supporting the decision-making process. Based on the analysis of the group of measured parameters, an alarm signal will be activated, indicating an emergency or a crisis. Preliminary results of the experiments The paper will present the preliminary results of measurement experiment carried out on experimental levee. The conclusions of the experiment made it possible to verify the proper operation of the automated system pump control, defining the factors that could interfere with the experimental measurement, development of procedures related to the control of the carried experiments, and developing instructions for further simulation of flood wave.

14
Acknowledgments. The project is financed under grant No. PBS1/ B9/18/2013 awarded by the National Centre for Research and Development within the framework of the Applied Research Programme REFERENCES Borecka, A., Stanisz, J., Korzec, K. and Leśniak, A. (2016) Smart levee in Poland. 3rd European
Conference on Flood risk management, 18-20 October 2016 (pp. 258), Lyon, France. Korzec, K., Borecka, A., Kessler, D. and Majerski, P. (2017) SMART LEVEE in Poland. Full-scale
monitoring experimental study of leveed by different methods. Computer Science – in review. Stanisz, J., Borecka, A., Leśniak, A. and Zieliński, K., (2014) Selected levee monitoring systems.
Przegląd Geologiczny, 62, 699–703. Stanisz, J., Korzec, K. and Borecka, A. (2015) ISMOP Project (IT System of Levee Monitoring as
an example of integrated monitoring of levee. Geology, Geophysics and Environmental Protection. 41(1), 137-139.

15
Application of Information Technology Solutions for Early Warning Systems at Water Utilities
A. Balut*
* Institute of Environmental Engineering, Poznan University of Technology, Berdychowo 5, 60-965 Poznan, PL (E-mail: [email protected]/ [email protected])
INTRODUCTION Deployment of IT solutions in water utilities in Poland concerns nowadays lots beyond GIS implementation projects. The scope of modern IT platforms is truly advanced software for complete management of water treatment processes and involved objects, including ranges of various types of equipment. There are multiple factors that disrupt required volume of supplied water. These are normally classified as natural, accidental and intentional. This paper addresses potential arising from application of already deployed and these now being developed IT solutions in water utilities in Poland. Primarily – from the perspective of intentional, terrorist threats. This document depicts operating procedures that are called in case of contamination in water supply (damage of key elements of the network infrastructure) or introduction of toxic contamination factors. This paper also discusses relevant IT tools to which network operators or water plant owners have access that are extremely useful in accurate pinpointing the threat and in following relevant operating procedures and related actions. Early warning systems (EWS) in water utilities EWS is built of [WMO’13]:
• warning system against threats and incidents, • issue identification in an up-to-date database, • water network hydraulic model as the core tool supporting decision-making processes, • local water quality monitoring.
Planning and modelling of threat scenarios GIS-related modelling of water distribution systems addresses the following key questions:
• supply of water from its sources (wells, tanks) to city zones, • origin of water in analysed nodes (percentage by sources), graphical displays, • water age analysis.
Emergency procedures in case of threats Genuine water quality modelling enables effective decision making ie. isolation of contaminated areas, cut-off of contaminated sources, support to affected society, analysis of similar sources through lab probing of water samples. Use of modelling software in early warning systems in water utilities Hydraulic models are nowadays the best available solution – both for scenarios forecasting as well in real-case events.

16
Graph.1. Screenshot from Info Works Plus, contaminated areas have been marked[1]. CONCLUSIONS Based on briefly presented capabilities of selected IT tools it can be stated that their usability in the management of water distribution systems is sound, especially in case of events. Due to modern and integrated GIS, SCADA and online modelling technologies real-life and up-to-date data can be analysed. Thanks to these IT tools appropriate decision making can be done fast and relevant authorities/units might receive accurate data and instructions, based on pre-approved Standard Operation Procedures (SOPs). ‘Time matters’ – right data should be provided in right time to right addresses. REFERENCES
Bałut A., Urbaniak A. (2013) Model sieci jako narzędzie ochrony systemu zaopatrzenia w wodę, Gaz, woda i technika sanitarna, 9/2013, 359-363.
Clark R.M., Hakim S., Ostfeld A. (2011) Handbook of Water and Wastewater Systems Protection Springer, USA, 324-331.
EPA 817-R-07-001, Water Critical Infrastructure and Key Resources Sector-Specific Plan as Input to the National Infrastructure Protection Plan, USA, 2007, 113.
Hosner, M. (2002) Use of a Model to Help Secure a Water System, DHI North America Conference, Orlando, June 2002.
Kuliczkowski A., Lichosik D. (2015) Zagrożenia terrorystyczne związane z systemami zaopatrzenia w wodę, Instal, 2015, no. 7–8, 77–81.
World Metrological Organization (2013) No. 1113, Planning of water quality monitoring systems, Technical Report Series, Switzerland, 2013.

17
Effect of Drought Crisis on Salinity Level of Bangkok
Water Supply A. Kordach* , A. Bunya** , C. Khanboon**, S. Charoenchai** , S. Sangphitak** , and N. Wongpat*** * Water Supply Section Water, Surveillance Division, Water Quality Department, Metropolitan Waterworks Authority, Bangkok, Thailand (E-mail: [email protected]) ** East Bank Water Resources Section, Surveillance Division, Water Quality Department, Metropolitan Waterworks Authority, Bangkok, Thailand *** Water Quality Department, Metropolitan Waterworks Authority, Bangkok, Thailand
ABSTRACT Drought crisis have well-documented effects on every organism in the world. In 2013-2016, Thailand has also been catastrophic affected. Dam water levels in Chao Phraya basin are minimum in around 50 years. The consequences on raw water resources are studied. Metropolitan Waterworks Authority (MWA), Thailand is responsible for providing and producing water supply on Bangkok, Nonthaburi, and Samutprakan provinces. The impacts on water quality and water production are considered. Especially, rise of salinity in tap water from sea level intrusion in the most past 100 years is investigated. However, conventional water treatment process of MWA water supply does not eliminate salt from production system. The forecasted impacts on tap water quality and quantity of supplied water are discussed. To solve this problem, MWA has developed countermeasures such as the improvement of monitoring and predicting the salinity situations in order to prevent problems immediately. Moreover MWA coordinated with Department of Irrigation to increase the drainage of salt water, to manage raw water pumping system in order to reduce salinity of raw water before it enters into canal water, and to reduce capacity of water supply production of facilities that are affected by salt water while increasing that of the ones with no effects from salt water. Additionally, MWA notified people and major users of water in advance in case that water supply has higher level of salinity than monitoring standard via Line application and MWA’s Website. These measures are able to reduce effects from the highest sea level in 2016. As of 27 May 2016, the salinity level of raw water at raw water pumping station has been reduced from 0.87 gram/litres to 0.49 gram/litres accounting for 43 percent reduction. This result reduces concerns and increases confidence of users toward quality of water supply even in crisis situations. Keywords: salinity, drought crisis, tap water, water supply

18
The influence of the synthetic hyetograph parameters on the simulation results of runoff from the urban catchment
K. Mazurkiewicz*, M. Skotnicki* * Institute of Environmental Engineering, Poznan University of Technology, Pl.M.Sklodowskiej-Curie 5, Poznan, Pl (E-mail: [email protected]; [email protected])
THE INTRODUCTION Parameters of the design storm should describe the real properties of local rainfalls and generate maximum runoff from the catchment. One of the most widely used synthetic hyetograph is Euler hyetograph (ATV–DVWK–A 118, 1999), for which intensity peak occurs in 30% of the storm duration TD. According to the information available in the literature the location of the maximum intensity is not constant and may vary from 20% to 50% of the time storm duration. Based on the rainfall data analysis made for Poznań, it was found that the peak intensity of the rainfall occurs between 35% and 45% of the time TD, depending on the storm duration (Mazurkiewicz, 2016). The variability of the rainfall peak location in real rains may raise doubts about the use of the synthetic hyetograph with constant peak location. The principles for the selection of the rainfall duration are not clearly defined.
The purpose of this research is the assessment of the impact of the synthetic hyetograph parameters (storm duration and the peak location) on the maximum outflow. These results are part of a broader research which leads to unify hyetograph parameters according to the EN-752 regulations. THE SCOPE OF THE ANALYSIS A synthetic hyetographs for durations TD from 15 minutes to 3 hours with the use of Chicago method were developed (Keifer and Chu, 1957). The ratio r (defined as time-to-peak rainfall intensity TP to the storm duration TD ) varied from 0.2 to 0.5. The rainfall intensity were calculated with the use of Bogdanowicz-Stachy Formula for 50% probability of occurrence.
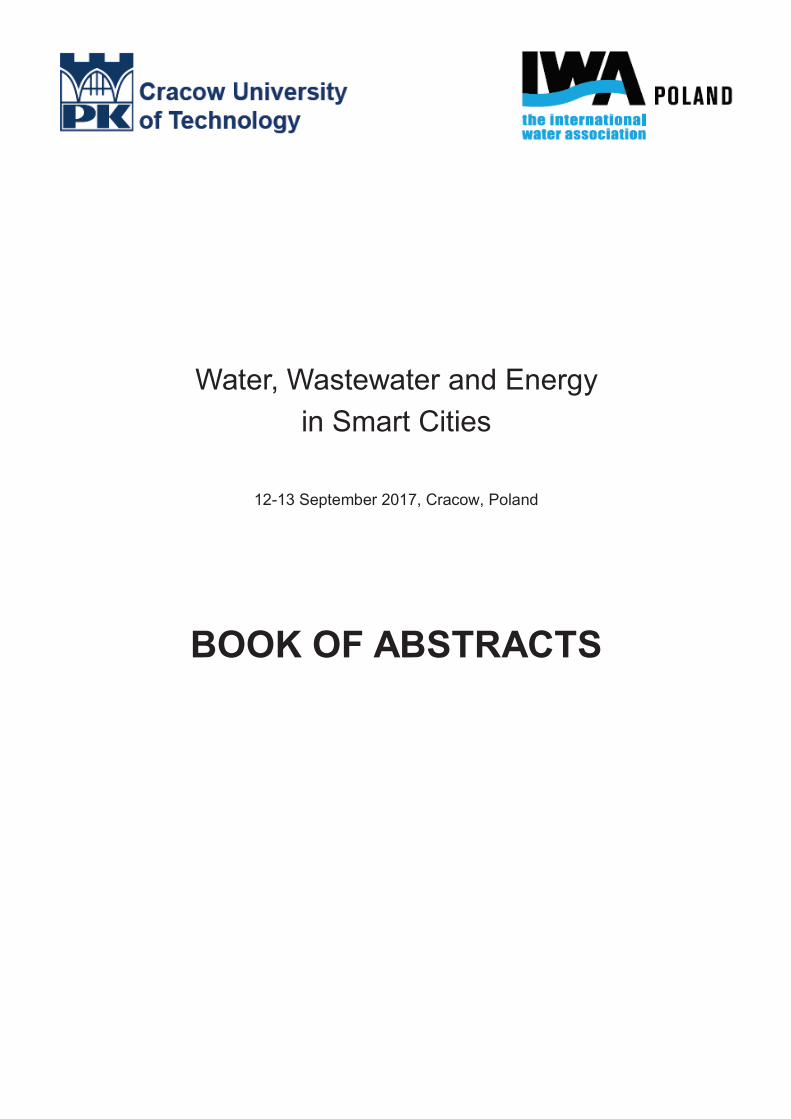
The runoff simulations were made for three real urban catchments. The catchments A and B are located in Bydgoszcz, their total area are respectively 89 ha and 172 ha, average percent of impervious area are equal to 26 % in both cases. Catchment C with an area of 670 ha and average percent of impervious area of 29% is located in Poznań. The catchment models were built in SWMM5. DISCUSSION OF THE RESULTS On the basis of performed simulations, it was found that for the specified storm duration, the increase of ratio r causes increase the outflow peak QP (Fig.1a). The Graphs were made for dimensionless flow values QP/QB (where QB is the value of the basic outflow peak calculated for storm with the longest analyzed duration TD = 180 min and r= 0.3- according to the Euler hyetograph for which changes in ratio r are not taken into account).
Depending on the storm duration, the increase of the outflow peak as a result of increasing ratio r (from r=0.2 to 0.5) is around 10%. This value is comparable for all the catchments. The dimensionless outflow peak values for r = 0.3 for the longest storm duration are smaller than calculated for greater ratio r. What is important, for r >0.3 outflow QB is achieved for storms of shorter duration (Fig.1b) than in case of storms with r=0.3. For constant value of ratio r the peak outflow QP increases with increase of storm duration TD (Fig.1b). When a certain value of storm
19
duration (called threshold time od storm duration TDT) is reached, the outflow peak practically does not change. The value of storm threshold time decreases with an increase of ratio r (Tab.1). a) catchment A b) catchment C
0.85
0.90
0.95
1.00
1.05
0.2 0.3 0.4 0.5
r [-]
QP/Q
B [
-]
15 min 30 min 60 min
90 min 120 min 180 min
QB = QP(r = 0,3; TD = 180 min)
0.80
0.85
0.90
0.95
1.00
1.05
15 30 45 60 75 90 105 120 135 150 165 180
TD [min]
QP/Q
B [
-]
r = 0.2
r = 0.3
r = 0.4
r = 0.5
QB = QP(r = 0,3; TD = 180 min)
Figure 1. The outflow peak as the function of ratio r (a) and storm duration TD (b) Table 1. Threshold times TDT of rainfalls for analyzed catchments
Ratio r (-)
Catchment A (TTR =21 min)
Catchment B (TTR = min)
Catchment C (TTR =50 min)
TDT
(min) TP
(min) TDT
(min) TP
(min) TDT
(min) TP
(min) 0.2 120 24.0 125 25.0 175 35.0
0.3 100 30.0 110 33.0 165 49.5
0.4 70 28.0 95 38.0 135 54.0
0.5 55 27.5 70 35.0 90 45.0
Average 27.4 Average 32.8 Average 45.9
Determined threshold time corresponds with the longest travel time through the channels TTR for given catchment estimated on the basis of the Chezy equation (with Manning coefficient) . CONCLUSIONS AND SUMMARY It has been shown that the outflow peak is not dependent only on the total storm duration, but also on the rainfall peak location. For the examined catchment areas and hyetographs parameters, the greatest peak were obtained for storm which peak is located in the middle of the duration (symmetric hyetograph). Presented results indicate relevance of taking into account changes in rainfall peak location in synthetic hyetographs while determining the runoff form urban catchment. REFERENCES ATV–DVWK–A 118 (1999) Hydraulische Bemessung und Nachweis von Entwässerungssystemen,
Hennef Keifer C.J., Chu H.H. (1957) Synthetic rainfall pattern for drainage design, ASCE Journal of the
Hydraulics Division, 83 (HY4), 1–25 Mazurkiewicz K. (2016) Wyznaczenie charakterystyki opadu obliczeniowego dla potrzeb
modelowania odpływu ze zlewni miejskiej- rozprawa doktorska, Instytut Inżynierii Środowiska, Politechnika Poznańska

20
Evaluation of potential secondary water pollution in public fountains in the aspect of development of Legionella species
J. Bąk* * Institute of Water Supply and Environmental Protection, Cracow University of Technology, 24 Warszawska Street, Cracow PL (E-mail: [email protected])
INTRODUCTION Not only the excessive quantity or the water deficit are dangerous. The presence in water of certain elements and compounds and selected microorganisms can also have a negative impact on the health and life of humans. Contaminated water is also harmful to the environment and living organisms. Public fountains can be potential sources of Legionella bacteria. At high air temperatures persisting for a long time, water temperature in the fountains may also increase significantly. This can cause a sudden and significant increase in Legionella bacteria, which results in secondary water contamination. This phenomenon with water – air aerosol generated by fountains can be very dangerous for people. RESEARCH TESTS During the test, water temperature measurements in fountains in Poland were made. The research was conducted in order to determine whether there is a possibility of growth of Legionella bacteria. One of the aims of the study was to determine how the temperature changes in the basin of the fountain and when the highest temperature occurs. The temperature distribution was measured during daylight hours. These research tests was conducted in the spring. Similar studies were conducted during the summer in Hungary (Bąk J., 2016), but only single temperature measurements were made (without distribution during the day). The water temperature in most cases was greater than 200C, but in no case exceed 250C, which indicated the need for further research. SUMMATION AND CONCLUSIONS The paper presents the characteristics of bacteria of the family Legionellaceae with particular emphasis on the effect of water temperature on the presence and bacterial growth. The research tests of water temperature distribution in the fountains in one big city in Poland were presented. The results were discussed and proposed conclusions. The study confirmed the existence of the risk of increasing the number of bacteria of the genus Legionella in the water in the fountains. As a consequence, secondary water pollution may even lead to outbreaks of legionellosis in the spring and summer. Therefore, the quality of water surrounding us in urban space is also very important. REFERENCES Bartram J., Chartier Y., Lee J.V., Pond K., Surman – Lee S. (edition) (2007) Legionella and the
prevention of legionellosis, WHO. Bąk J. (2016) Evaluation of the possibility of danger of Legionella bacteria due to the temperature

21
of the water in the fountains selected in Hungary, Water supply and water quality, red. Zbysław Dymaczewski, Joanna Jeż-Walkowiak, Andrzej Urbaniak. – Poznań.
Botzenhart K. and others (2002) Legionella in Guidelines for drinking – water quality. Second edition. Addendum. Microbiological agents in drinking water” WHO Geneva, s. 40 – 69.
Goldberg D.J., Wrench J.G., Collier P.W., Emslie J.A., Fallon R.J., Forbes G.I., McKay T.M., Macpherson A.C., Markwick T.A., Reid D. (1989) Lochgoilhead fever: outbreak of non-pneumonic legionellosis due to Legionella micdadei Lancet Feb;1(8633):316-8.
Grabińska - Łoniewska A., Siński E. (2010) Mikroorganizmy chorobotwórcze i potencjalnie chorobotwórcze w ekosystemach wodnych i sieciach wodociągowych, Wydawnictwo Seidel – Przywecki, Warszawa.
Hsu S.C., Martin R., Wentworth B.B. (1984) Isolation of Legionella Species form drinking water”, Applied and Environmental Microbiology, vo.48, no. 4, October, s.830 – 832.
Ohno A., Kato N., Yamada K., Yamaguchi K. (2003) Factors influencing survival of Legionella pneumophila Serotype 1 in hot spring water and tap water Applied and Environmental Microbiology, vol.69, No. 5, May, s. 2540 – 2547.
Rozporządzenie Ministra Zdrowia z dnia 13 listopada 2015 roku w sprawie jakości wody przeznaczonej do spożycia przez ludzi, Dz.U. 2015 poz. 1989.
Rozporządzenie Ministra Zdrowia z dnia 9 listopada 2015 roku w sprawie wymagań, jakim powinna odpowiadać woda na pływalniach, Dz.U. 2015 poz. 2016.
Sakamoto R., Ohno A., Nakahara T. and others (2009) Legionella pneumophila in rainwater on roads Emerging Infectious Diseases, vol. 15, No. 8, August, s. 1295 – 1297, www.cdc.gov/eid.
Sodeberg M., Rossier O., Cianciotto N. (2004) The type II protein secretion system of Legionella pneumophila promotes growth at low temperatures”, Journal of Bacteriology, 186, s. 3712 – 3720.
Stypułkowska – Misiurewicz H., Krogulska B., Pancer K., Matuszewska R. (2001)Legionella sp. – laboratoryjne rozpoznawanie zakażeń u ludzi w środowisku wodnym” Rocznik PZH, 52, nr 1, s. 1 – 18.
Szewczyk E. (redakcja) (2013) Diagnostyka bakteriologiczna, Wydawnictwo Naukowe PWN, Warszawa. Toczyłowska B., Kozłowski B. (2012) Temperatura jako czynnik ryzyka skażenia wody
wodociągowej bakteriami Legionella – doświadczenia z praktyki”, Instal nr 4, s. 18 – 24. Yee R., Wadowsky R. (1982) Multiplication of Legionella pneumophila in unsterilized tap water,
Applied and Environmental Microbiology, 43, s. 1330 – 1334.

22
Maximum precipitation in a year with a defined duration and likelihood of exceedance in the world
M. Całek* * Faculty of Environmental Engineering, Cracow University of Technology, 24 Warszawska Street, 31-155 Krakow, Poland (E-mail: [email protected])
INTRODUCTION Along with urbanization and the formation of so-called Smart Cities increasingly pay attention about understanding, management and planning the urban environment. One of the elements on which pay particular attention is stormwater management. Management takes into account a quantitative and qualitative criteria. In the context of climate change and which carry as a consequence of more frequent than before the appearance of short duration but high intensity rain quantitative criteria is particularly important. When sewer capacity is insufficient, high intensity of rainfall in flat and urbanized areas may cause the local flooding. Proper design of stormwater drainage facilities is one of the challenges of engineers of the 21st century. One of the elements necessary for the design of the above mentioned facilities is the intensity of the precipitation with a defined duration and the probability of exceedance. An overview of the methodology for determining maximum precipitation in selected countries in the world is the content of this article. ESTIMATION METHODS OF MAXIMUM PRECIPITATION Direct methods Direct methods involve the calculation of the maximum rainfall based on registered rainfall using statistical distributions. Due to the characteristics of the precipitation, variable depending on the location, does not exist one universal distribution that allows to calculate correctly maximum precipitation for any place on Earth. For example, in Japan and in India the most widely used distribution is the Gumbel distribution, in Poland satisfactory results are obtained with the lognormal distribution. Although direct methods allows to receive the most accurate results, they are not common use by engineers in the practice. This is due to the burdensome of these methods and very often with the lack of appropriately long rainfall data series. The importance of the direct methods is that they are the basis for the development of empirical formulas, which due to its affordability are used by engineers in practice (Całek, 2015; IHP Regional Steering Committee for South East Asia and the Pacific, 2008; Zope et al., 2016). Indirect methods Indirect methods may be local or nationwide. They allow for calculation of precipitation with a duration from 5 minutes to more than 24 hours. For example, in Malaysia has been developed a rainfall Intensity-Duration-Frequency (IDF) curves for 35 cities. The IDF curves has been saved as polynomial equations and for each of the cities has been developed correction factors depending on the period of the repeatability of rain (Government of Malaysia, 2009). Calculation of maximum precipitation depending on the geographical region takes place inter alia in India. The formula Kothyari and Grade has been developed on the basis of the rainfall data originating from 78 gauging stations in different regions of India. The intensity of precipitation shall be calculated on the basis of 2-year return period and 24 hours duration rainfall. The equation is adjusted depending on the region (Zope et al., 2016).

23
A slightly different approach to calculate the maximum rainfall has been implemented in the United Kingdom. Developed a comprehensive method contains the algorithm for rain intensity calculations takes into account local characteristics of precipitation height. For this purpose has been developed maps with rainfall depths of 5-year return period and 60 minutes duration and ratio of 60 minutes to 2 day rainfalls of 5-year return period (Butler, Davies, 2004). In the United States of America for each of the States IDF curves has been developed using the recorded precipitation of varying duration. Curves has been created by using statistical distributions, whereby achieved an projection accuracy at 90%. On the basis of the created models developed Precipitation-Frequency Atlases for the duration of the rain D<1 hour, 1<D<24 hours and D>24 hours. In addition, provides interactive maps that allow the calculation of the maximum precipitation with a defined duration and likelihood of exceedance anywhere in the country (http://hdsc.nws.noaa.gov/...). The most commonly used model by Polish engineers in practice is a Błaszczyk formula published in 1954 - a nationwide formula. Unfortunately, the model underestimates the average results by approximately 40% (Kotowski et al., 2010). The method in which the formula has been estimated undermines the credibility of the obtained results (Węglarczyk, 2013). CONCLUSION Existing models are determined using statistical methods based on long strings of rainfall data. Particularly noticeable is the trend to create local models that allow to take account of local conditions. It should be noted that design engineer has an access to the tools that support the design process of drainage systems and calculations of maximum precipitation with a defined duration and likelihood of exceedance. REFERENCES Butler D., Davies J. W. (2004) Urban Drainage, 2nd Edition Całek M. (2015) Opady maksymalne o czasie trwania i prawdopodobieństwie przewyższenia p% w
przyjętych regionach geograficznych Polski – Metody bezpośrednie i pośrednie ich wyznaczania Government of Malaysia, Department of Irrigation and Drainage (2009) DID MANUAL Volume 4 –
Hydrology and Water Resources http://hdsc.nws.noaa.gov/hdsc/pfds/pfds_map_cont.html?bkmrk=nc IHP Regional Steering Committee for South East Asia and the Pacific (2008) Asian Pacific
FRIEND Rainfall Intensity Duration Frequency (IDF) Analysis for the Asia Pacific Region Kotowski A., Kaźmierczak B., Dancewicz A. (2010) Modelowanie opadów do wymiarowania
kanalizacji Węglarczyk S. (2013) O poprawności wzorów Błaszczyka na obliczanie opadów miarodajnych,
Infrastruktura i Ekologia Terenów Wiejskich, 3/IV, 63-76 Zope P. E., Eldho T. I., Jothiprakash V. (2016) Development of Rainfall Intensity Duration
Frequency Curves for Mumbai City, India, Journal of Water Resource and Protection, 2016, 8, 756-765

24
A comparative analysis of selected wastewater pretreatment processes in food industry
K. Jaszczyszyn*, W. Góra*, Z. Dymaczewski*, R. Borowiak *Faculty of Civil and Environmental Engineering, Poznan University of Technology, 5 Piotrowo, 60-965 Poznan, Poland (E-mail: [email protected])
ABSTRACT The article presents a comparative analysis of the classical coagulation with iron sulphate and adsorption on bentonite for the pretreatment of wastewater in the food industry. As a result of the studies, COD reduction and total nitrogen were found to be comparable in both technologies, and a 29% higher total phosphorus removal efficiency by the coagulation. After the coagulation and adsorption processes, a significant difference between mineral and organic fraction in the sludge was found (49% and 51% for bentonite and 28% and 72% for iron sulphate, respectively). INTRODUCTION Classical pretreatment methods for industrial wastewater which based on mechanical and physico-chemical processes, are often insufficiently effective, and also waste streams are difficult to manage. According to that, new and highly effective pretreatment methods that will take into account the residual pollutions as well as an impact of applied processes on the sludge management, are being developed (Ministry of the Environment, 2004; Vanerkar, 2013). An example method that meets the current criteria is an adsorption with mineral sorbents application combined with flocculation (Worch, 2012). MATERIAL AND METHODS Averaged wastewater samples from three food processing plants: slaughter and meat processing (IP1 and IP2) and bakery industry (IP3) were analyzed. Pretreatment processes with iron sulphate and bentonite, as mineral sorbent (BET surface area 58,511 m2/g) were carried out. Batch experiments was conducted in laboratory conditions in 1dm3 reactors. The reagent dosages were determined based on the turbidity criterion. All chemical analyzes of wastewater and sludge were conducted in accordance with the applicable standards and standard methods. EXPERIMENTAL RESULTS On the basis of the preliminary research, according to the treated wastewater turbidity, iron sulphate and bentonite were selected for further analysis. Reagent doses: iron sulphate IP1 – 0,6g/l, IP2 – 0,9g/l, IP3 – 0,45g/l and for bentonite IP1 – 1,8g/l, IP2 – 0,9g/l, IP3 – 0,9 g/l.

25
Figure 1. Influence of doses of iron (III) sulphate and bentonite on wastewater turbidity. Table 1. Effectiveness of the reduction of selected pollutants [%] Bentonite Fe2(SO4)3
IP1 IP2 IP3 IP1 IP2 IP3 COD 84,4 84,7 71,0 93,4 85,3 79,4 Nitrogen 83,1 77,4 82,7 90,0 72,1 88,0 Phosphorus 53,9 69,4 82,8 98,4 98,6 96,9 Table 2. Percent of dry matter content in the sediment sludge (FS – fixed solids = mineral matter fraction, VS – volatile solids = organic fraction). Bentonite Fe2(SO4)3
IP1 IP2 IP3 IP1 IP2 IP3 FS % 63 39,6 43,9 23,9 35,3 24,8 VS % 36,8 60,4 55,3 76,2 64,1 75,2 SUMMARY For both methods - iron sulphate coagulation as well as adsorption with bentonite, comparable COD and total nitrogen removal efficiencies were obtained. In the coagulation, the efficiency of phosphorus removal was 29% higher than in the adsorption. Other hand, in the adsorption process, about a 20% higher of the mineral matter content in the sludge was achieved, while 11-times lower iron concentration. Application of bentonites for the pretreatment of food processing industry, may be an alternative method to the classical coagulation process. Analyzing the directions of sludge management, depending on the applied pretreatment technology, significant differences in sediment composition should be taken into account. REFERENCES Ministry of the Environment (Ministerstwo Środowiska) (2004). Najlepsze dostępne techniki (BAT)
– wytyczne dla branży spożywczej: owocowo-warzywnej (soki i nektary, przetwory, mrożonki), ENVIRON Poland Sp. z o.o., Warszawa. (in Polish)
Worch, E. (2012). Adsorption technology in water treatment: fundamentals, processes, and modeling. Walter de Gruyter.
Vanerkar, A.P., Satyanaryan, S., Satyanaryan, S. (2013). Treatment of Food Processing Industry Wastewater by a Coagulation/Flocculation Process. International Journal of Chemical and Physical Sciences IJCPS Vol. 2, Special Issue - March 2013

26
On-site pilot-scale experiments for upgrading pharmaceutical wastewater treatment in combined AS – biofilm systems
V. Bakos1*, J. Simon1 and A. Jobbágy1
1Budapest University of Technology and Economics, Department of Applied Biotechnology and Food Science, H-1111 Budapest, Szent Gellért tér 4., +36 1 463 1243 (*Email: [email protected], Date of birth: 08/12/1982, platform presentation)
INTRODUCTION, AIMS AND SCOPE Industrial discharge receiving wastewater treatment plants (WWTPs) may face treatment difficulties due to poorly biodegradable substrates as well as drastic inhibition effects on nitrification (Tomlinson et al., 1966), thus remarkably higher sludge age is to be maintained in order to meet effluent nitrogen criteria. Nitrogen removal of low-SRT (Sludge Retention Time) activated sludge (AS) systems can highly be enhanced by applying a downstream biofilm process (Jobbágy et al. 2008, Bakos et al., 2013). Pilot-scale on-site experiments were carried out at a full-scale pharmaceutical AS WWTP (hydraulic capacity: 6000 m3 d-1) aiming both enhancing biological nitrogen removal and ensuring stable good sludge separability. METHODOLOGY Two continuous-flow combined AS-biofilm pilot-scale systems (see Fig.1) were operated on the site. The full-scale AS plant consisted of 3 biological treatment trains. At the start of the experiment System 1 was operated at higher inlet flow rate (2.2 l h-1) corresponded to 2-train operation, while System 2 worked at remarkably higher SRT (inlet flow rate: 1.2 l h-1) corresponded to 4-train operation. Continuous-flow experimental systems were permanently operated for 162 days with careful analytical follow-up.
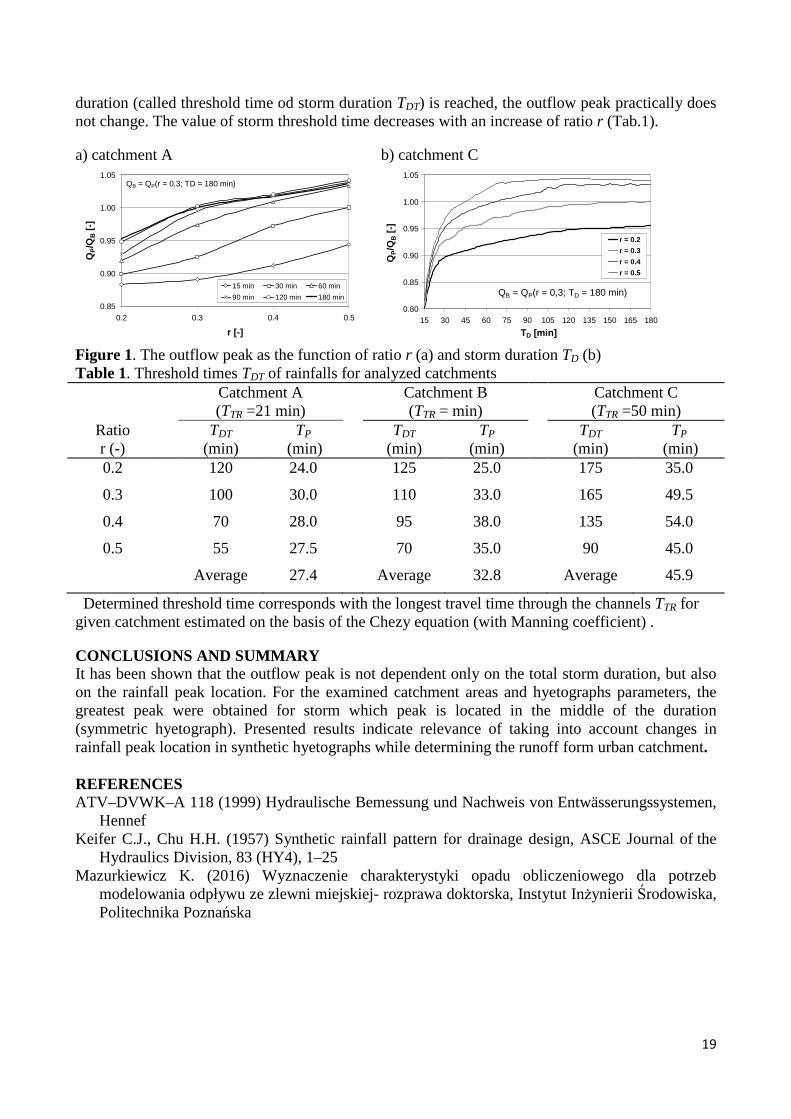
Figure 1. Technological layout of pilot-scale systems RESULTS AND MAJOR FINDINGS During the start-up phase, in System 1 no nitrate was redirected to the head of the AS stage, thus non-aerated AS reactors were spontaneously converted into low DO (dissolved oxygen) basins which led to remarkable increase of DSVI (see Fig.2a). Filaments could quickly and drastically be suppressed by switching the non-aerated low DO basins into anoxic conditions by starting nitrate recirculation from the efficiently nitrifying bio-filters. Stable full nitrification during AS stage was only achievable in case of 4-train operation (see Fig.2b). However, at lower AS SRT biofilm reactors could smoothly and efficiently take over ammonium oxidation. In the final period of the experiment back-seeding
27
of nitrifiers previously back-washed from bio-filters proved to be efficient for enhancing AS nitrification.
Figure 2. a) AS settleability and b) concentration of nitrogen forms (Inlet TN and effluent NH4N) in differently operated pilot-scale systems.
ACKNOWLEDGEMENTS The research project was financed by Novartis Pharma AG. Authors express their special thanks to the operation staff of the investigated wastewater treatment plant for technical support. REFERENCES (The full reference list will be given in the conference paper) Bakos, V., Tardy, G., Palkó, Gy., Jobbágy, A. (2013) Pilot-scale verification of efficient nitrifier
backseeding in a combined activated sludge – biofilm system, Per. Pol. Chem. Eng., 57(1-2), 93-99.
Jobbágy, A., Tardy, G.M., Palkó, Gy., Benáková, A., Krhutková, O., Wanner, J. (2008) Savings with upgraded performance through improved activated sludge denitrification in the combined activated sludge-biofilter system of the Southpest Wastewater Treatment Plant, Wat. Sci. Tech., 57(8), 1287-1293.
Tomlinson, T.G., Boon, A.G., Trotman, C.N.A. (1966) Inhibition of nitrification in the activated sludge process of sewage disposal, J. Applied Microbiology, 29(2), 266-291.

28
Experimental study of the anaerobic ammonium oxidation process and the effect of operational parameters on system performance
D. Sobotka* * Gdansk University of Technology, Faculty of Civil and Environmental Engineering, Gdansk, POLAND (tel. +48 58 347-19-54, fax +48 58 347-23-03, e-mail: [email protected])
INTRODUCTION The anaerobic ammonium oxidation (anammox) process has been widely recognized as the efficient nitrogen removal process for high strength ammonia wastewater streams treatment. The principal advantages of the anammox process over conventional nitrification-denitrification are substantially lower oxygen consumption and sludge production as well as no need for external carbon sources. However, anammox bacteria grow very slowly and they are vulnerable to several specific inhibitors, including dissolved oxygen (DO), pH, organic compounds, temperature, nitrite and free ammonia (FA). Knowledge of these adverse effects of compounds present in anammox reactors can be important not only for feasibility studies and reactor design guidelines, but also for development of the process start-up strategy. The aim of this study was twofold. First, the anammox-enriched granular sludge was formed during the long-term biogranulation experiment. Next, the influence of factors, such as DO, temperature, pH, FA concentration on the anammox process rate was studied. MATERIALS AND METHODS The anammox experimental study was conducted in a laboratory scale plexiglass SBR with a working volume of 10 L, equipped with a control system for DO and pH. Temperature was controlled by a jacketed thermostatic reactor tank. The SBR was inoculated with anaerobic sludge originated from a full-scale side stream treatment system in Switzerland. The reactor was fed with synthetic medium adapted from Dapena-Mora et al. (2004). The most important components, i.e. nitrite and ammonium, were supplied in the form of NH4Cl and NaNO2, respectively. During the course of the study, the following experiments were carried out: 1° The biogranulation experiment was conducted in a laboratory scale plexiglass SBR. The reactor was inoculated with anaerobic sludge originated from a full-scale side stream treatment system. The concentration of volatile suspended solids (VSS) in the inoculum sludge was 0.51 g L−1. The properties of the developed granules were investigated in terms of the biomass activity (including growth rate of the anammox bacteria), size distribution of the granules as well as nitrogen removal pathways and system performance. 2° DO experiments - The purpose of the research was to determine the influence of the aeration method (continuous and intermittent) and dissolved oxygen concentration on the anammox process rate. During the study period two SBR was operated. SBR1 with intermittent aeration, and DO concentration at the level 1 and 0.8 mg O2 L-1. SBR2 with continuous aeration and DO approximately 0.4 mg O2 L
-1. 3° The long- and short-term temperature experiments - the long-term effects of temperature were determined in the SBR, during the reactor operation at the decreasing temperatures: 30 °C, 20 °C, 15 °C, 14 °C, 13 °C, 12 °C and 11 °C. In order to determine the short-term effects of temperature on the activity of anammox granular biomass, batch tests were carried out in two parallel batch reactors with the maximum working volume of 4 L each. The reactors were equipped with electrodes for on-line measurement of pH and temperature. The tests were carried out at ten different temperatures: including 10, 15, 20, 25, 30, 35, 40, 45, 50 and 55 °C under non-aerated conditions.

29
The effect of temperature on the maximum specific growth rate constant of anammox-enriched granular biomass at the actual process temperature was calculated using the Arrhenius equation. In order to take into account the inhibiting effect of high temperatures (above 40 °C) on the anammox process, the modified Ratkowsky equation was used. 4° FA experiments - the impact of high concentrations of FA on inhibition of the anammox process was determine. During the study period, the total nitrogen load (TNL) supplied to the reactor was increased from 0.23 to 2.42 kgN·m-3·d-3. During all experiments, additional microbiological analyses of anammox granular sludge were carried out in order to investigate changes in the microbial community composition during cultivation of the anammox enriched granules. RESULTS During the long-term operation of the laboratory scale SBR, the operational conditions were applied to favor the formation of anammox-enriched granules. The maximum observed specific anammox activity (SAA) reached 1.6 kg Nm−3d−1, but in the second half of the experiment (days 180–330), the rates stabilized at approximately 0.8 (±0.18) kg N kg VSS−1d−1. This value is similar to the reported literature data on biogranulation experiments. The use of different aeration methods revealed that both types of aeration approaches (intermittent vs. continuous), together with different DO concentrations, have a significant impact on the observed nitritation-anammox rates. Higher process rates and more stable operation were obtained in the SBR with intermittent aeration. The maximum activity of non-acclimated anammox enriched granular biomass was observed at 40°C, while the process temperature of 55°C resulted in an irreversible decrease of the anammox activity due to biomass lysis. The granular biomass acclimation to low temperatures allowed for the successful (efficient) operation of the SBR at 15°C. Anammox process could be successfully operated at FA concentration below 4 mgN·L-1. Higher concentrations of FA result in the decrease of anammox activity. The process was almost completely inhibited when FA concentration was 10.6 mgN·L-1.
b)
Figure 1. a) Effluent concentrations of nitrogen compounds (ammonia and nitrite) and SAA during the SBR operation. b) View of the mature granular sludge developed after biogranulation experiment. REFERENCES Dapena-Mora A., Arrojo B., Campos J.L., Mosquera-Corral A., M´endez R., 2004, Improvement of
the settling properties of Anammox sludge in an SBR, J. Chem. Technol. Biotechnol., 79 (12), 1412–1420.
Sobotka D., Tuszyńska A., Kowal P., Czerwionka K., Makinia J., Long-term performance and microbial characteristics of the anammox-enriched granular sludge cultivated in a bench-scale sequencing batch reactor. Biochemical Engineering Journal 120, 125-135.

30
Analysis of Oxygen Conditions Ensuring High Efficiency of COD and Nitrogen Removal in SBR, IFAS-MBSBBR, MBSBBR Systems
K. Sytek-Szmeichel* and J. Podedworna* * Faculty of Building Services, Hydro and Environmental Engineering, Warsaw University of Technology, Nowowiejska 20, 00-653 Warsaw, Poland (E-mail: [email protected]; [email protected])
INTRODUCTION Sequencing batch reactors offer the possibility to remove nitrogen, phosphorus and organic carbon in one tank, without the necessity of sludge and wastewater recirculation. In biological wastewater treatment microorganisms in a form of suspended (activated sludge method) or attached (biofilm immobilized on a carrier) biomass are used. Immobilization of biomass on moving carriers (moving bed reactors) makes the biofilm method to activated sludge method alike. Moreover using moving bed method results in numerous technological benefits such as the process stability, the increase of simultaneous nitrification-denitrification efficiency, independence of the microorganisms’ age of the wastewater hydraulic retention time and the possibility to remove nutrients synergistically (Yang et al. 2010). However due to oxygen diffusion limitation into inner layers of biofilm, obtaining high activity of nitrifiers in this biomass requires higher levels of dissolved oxygen concentration in wastewater (5–6 mg O2/L) when compared to conventional activated sludge reactors (2–3 mg O2/L) (Ning et al., 2014). The aim of this work is to compare the oxygen conditions ensuring high efficiency of COD and N removal in three type of reactor: SBR with activated sludge (series I), IFAS-MBSBBR in which biomass developed as activated sludge and biofilm formed on the surface of moving carriers (series II) and MBSBBR with biomass in form of biofilm (series III). Data presented in this paper was part of three long-term research projects (each concerning another method) and was chosen on the assumption of high and comparable efficiency of wastewater treatment in all systems. In consequence three conducted series differed in dissolved oxygen concentration in aerobic phases. METHODS The experiment was divided into three series and took place on laboratory-scale models of SBR with active volume of 28 L each. In series II (IFAS-MBSBBR) and III (MBSBBR) 25% of the reactor’s active volume comprised of the EvU-Perl carrier with the specific surface area 600 m2/L. The experiments were conducted with the use of synthetic wastewater, whose composition remained the same throughout the whole testing period (COD: 665 ± 32.3 mg O2/L; TN: 67.6 ± 3.77 mg N/L; N-NH4: 39.7 ± 2.47 mg N-NH4/L; pH:7.5 -7.9). The reactors were operated at three 8-hour cycles per day. Each cycle consisted of the following consecutive phases: I unaerated (90 min.), I aerated (160 min.), II unaerated (40 min.), II aerated (120 min.), sedimentation (60 min.), and decant (10 min). In every cycle, 10 L wastewater was fed to the reactors, 2/3 of the volume in I unaerated phase, and 1/3 in II unaerated phase. In series I, II and III DO was kept at concentration 1.5 mg O2/L, 3.0 mg O2/L and 6.0 mg O2/L, respectively. The scope of the study included: analysis of the influent and effluent to/from the reactor (COD, TKN, N-NH4
+, N-NO2-,
N-NO3-, pH, alkalinity), monitoring tests of wastewater treatment process (range as in the
characteristics of the influent and effluent).
31
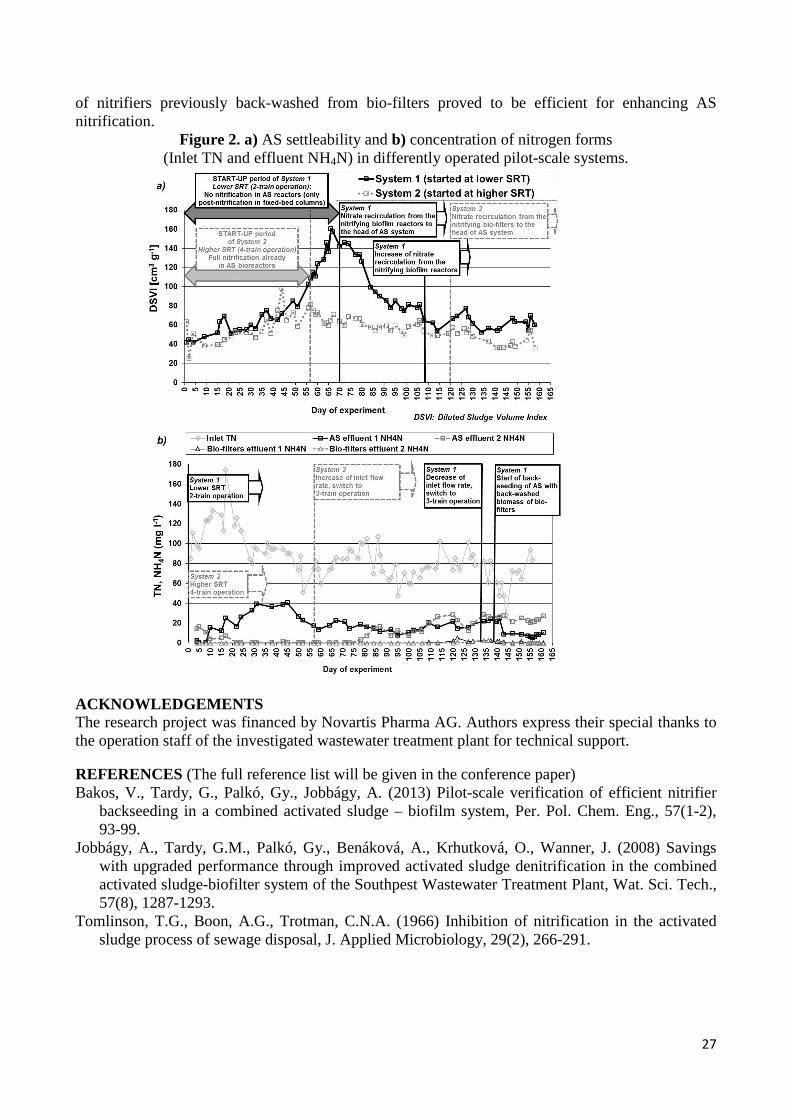
RESULTS The data summarized in Table demonstrate that in all series a high effectiveness of organic contaminants removal was achieved (ca. 95%), with an average value of COD in effluent equal to 33.5 mg/L (for all series). Regardless of the method, highly effective process of ammonia nitrogen oxidation was also observed. The value of N-NH4 in the final effluent did not exceed 1.0 mg N-NH4/L. In all series the effectiveness of removing TN was comparable (ca. 90%), which allowed for obtaining TN concentrations in the effluent of approximately 6.50 mg TN/L. On the basis of monitoring tests it was revealed that the ratio of simultaneous denitrification to the total efficiency of denitrification in the cycle was: 54% in SBR, 78% in IFAS-MBSBBR and 64% MBSBBR system. Table 1. Effluent characteristics and treatment effectiveness (η) in each series of the experiment.
Series I Series II Series III
COD (mgO2/L) 34.0 ± 8.88 32.4 ± 9.71 34.1 ± 9.14 η (%) 94.9 ± 1.24 95.1 ± 1.36 94.9 ± 1.18
TN (mg N/L) 6.80 ± 1.82 5.68 ± 1.33 6.91 ± 1.50 η (%) 90.1 ± 2.72 91.6 ± 2.07 89.5 ± 2.25
TKN (mg N/L) 2.22 ± 1.28 1.68 ± 0.81 2.59 ± 1.22 η (%) 96.8 ± 1.79 97.5 ± 1.23 96.0 ± 1.88
N-NH4+
(mg N-NH4+/L) 0.16 ± 0.10 0.19 ± 0.10 0.22 ± 0.21
η (%) 99.6 ± 0.23 99.5 ± 0.24 99.5 ± 0.57 N-NOx (mg N-NOx /L) 4.58 ± 1.07 4.01 ± 0.96 4.32 ± 0.76
*) average ± standard deviation
Figure 1. Dissolved oxygen concentration profile in a single treatment cycle. Figure presents the difference in dissolved oxygen concentration profile in each series of the experiment. Moreover, it was calculated that the air blowers operating time (necessary to maintain the proper DO concentration) was 38.1%, 34.9% and 64.4% of total aeration time for series I, II and III, respectively. REFERENCES Ning, Y.F., Chen, Y.P., Shen, Y., Zeng, N., Liu, S.Y., Guo, J.S. and Fang, F. (2014) A new
approach for estimating aerobic–anaerobic biofilm structure in wastewater treatment via dissolved oxygen microdistribution. Chemical Engineering Journal, 255, 171-177.
Yang, S.; Yang, F.; Fu, Z.; Wang, T.; Lei, R. (2010), Simultaneous nitrogen and phosphorus removal by a novel sequencing batch moving bed membrane bioreactor for wastewater treatment. Journal of Hazardous Materials, 175 (1-3), 551-557.

32
The rate of denitrification with using hydrodynamically disintegrated excess sludge as organic carbon source J. Walczak * and M. Zubrowska-Sudol * * Department of Water Supply and Wastewater Treatment, Faculty of Building Services, Hydro and Environmental Engineering, Warsaw University of Technology, ul. Nowowiejska 20, 00-653 Warsaw, PL (E-mail: [email protected], [email protected])
INTRODUCTION In biological removal of nitrogen from wastewater the process of dissimilating nitrate reduction (denitrification) is used. This process is carried by heterotrophic organisms, hence one of the factors influencing their effectiveness is amount of easy-digestible organic carbon entering the bioreactor with wastewater. In case of deficit of organic compounds, which is a common problem in wastewater treatment plants, a decline in effectiveness of nitrogen removal occurs. To meet the requirements for final wastewater effluent quality, additional source of organic carbon has to be introduced to the bioreactor. There could be compounds like methanol, ethanol, acetic acid and glucose, called conventional sources of organic carbon (Mokhayeri, 2009). The other solution is using waste products from food industry (Świnarski, 2009) or rich in glycerine by-products of biodiesel called alternative sources of organic carbon. In the last few years several studies were conducted which tested the application of disintegrated waste activated (excess) sludge (WAS) to enhance nitrogen removal from wastewater (Yan, 2013). The results of these studies show that organic compounds obtained in the disintegration process are the proper substrate for denitrifying bacteria. In this study there were two purposes asked i) analyzing the rate of denitrification with using excess sludge, which was subjected to the hydrodynamic disintegration (HD) performed at different energy densities, as organic carbon source, ii) analyzing the impact of the psychrophilic hydrolysis of disintegrated sludge on the denitrification rate. METHODOLOGY The rate of denitrification The NUR test was performed in a beaker with a working volume of 1 L. Gaseous nitrogen was applied over the surface of the liquid for the duration time of the test, thus the possibility of atmospheric oxygen diffusion was eliminated. Before starting the test, KNO3 solution and examined sources of organic carbon were added to the batch reactor. The samples were collected every 30min from the continuously stirred reactor and immediately filtered with 0.45µm syringe filters, then the nitrites and nitrates were measured. Denitrification rate (vden) was calculated by the decreasing slope of the NOx-N concentration with time and divided by g VSS. The effect of psychrophilic hydrolysis of disintegrated sludge on the rate of denitrification Samples of disintegrated sludge at the tested levels of energy density were subjected to anaerobic hydrolysis at 20°C for 24h. After that time NUR tests were repeated according to the method described previously except that the test reactor was fed with the same volume of the examined carbon source, which in tests performed before hydrolysis. Further tests were labelled as D-70kJ/L+H, D-140kJ/L+H, D-210kJ/L+H.

33
RESULTS The rate of denitrification (vden) determined for samples from disintegrated sludge was dependent on the energy density at which the HD process was carried out. In each series the maximum value of this parameter occurred for D-210kJ/L (taking into consideration only the tests carried out for the disintegrated sludge). It was 1.4±0,2 times higher than those obtained for municipal wastewater after mechanical treatment, which was a substrate the biomass was adapted to. However vden determined for D-210kJ/L was 1.8±0,2 times lower than those obtained for acetic acid. It should also be noted that the denitrification rates for D-70kJ/L and D-140kJ/L were comparable to vden for wastewater.
Figure 1. Denitrification rates (vden) determined for different types of organic substrates (average±stdev). When performing NUR tests with the same volume of disintegrated sludge which in tests made before hydrolysis, it was observed that hydrolysis of sludge previously subjected to the HD with increasing energy density, contribute to gradually smaller growth rate of denitrification. This means that the sludge subjected to disintegration at increasing energy density characterized by reduced susceptibility to psychrophilic hydrolysis. CONCLUSIONS Maximum vden were observed for sludge subjected to the process of disintegration at 210 kJ/L (taking into consideration only the disintegrated sludge). Susceptibility of disintegrated sludge to psychrophilic anaerobic hydrolysis decreased with increasing energy density, and thus obtained organic carbon contributed to smaller increase in denitrification rate in relation to use of disintegrated sludge which was not subjected to the process of hydrolysis. REFERENCES Makhayeri, Y., Riffat, R., Takacs, I., Dold, P., Bott, C., Hinojosa, J., Bailey, W., Murthy, S. (2008)
Characterizing denitrification kinetics at cold temperature using various carbon sources in lab-scale sequencing batch reactors. Water Science Technology, 58(1), 233-238.
Świnarski, M., Mąkinia, J., Czerwionka, K., Chrzanowska, M. (2009) Industrial wastewater as an external carbon source for optimization of nitrogen removal at the “Wschod” WWTP in Gdansk (Poland). Water Science Technology, 59(1), 57-64.
Yan, P., Ji, F., Wang, J., Fan, J., Guan, W., Chen, Q. (2013) Evaluation of sludge reduction and carbon source recovery from excess sludge by the advanced Sludge reduction, Inorganic solids separation, Phosphorus recovery, and Enhanced nutrient Removal (SIPER) wastewater treatment process. Bioresource Technology, 150, 344-351.

34
Inhibition effect of free ammonia on deammonification process under different intermittent aeration strategies in sequencing batch reactor
H. Al-Hazmi *, X. Lu*, J. Majtacz *, P. Kowal*, J. Mąkinia*. * Gdansk University of Technology, Faculty of Civil and Environmental Engineering, ul. G. Narutowicza 11/12, 80-233 Gdansk, POLAND, (E-mail: [email protected])
INTRODUCTION The nitrogen removal from the wastewater in case of the most world’s Wastewater Treatment Plants (WWPs) is conducted in the conventional activated sludge (AS) systems via nitrification and denitrification processes. Such systems usually ensure high efficiency of nutrients removal, however they reflect high energy consumption and operational costs. Recently, the deammonification process has received a special attention as a promising energy-efficient technology for nitrogen removal. The deammonification process involves two steps. The first step is the partial nitrification of ammonia (NH4-N) by ammonia oxidizing bacteria (AOB) to produce nitrite (NO2-N) and the second step is the anammox process to “anaerobically” oxidize ammonia to nitrogen gas with nitrite as an electron acceptor. Free ammonia (FA) plays a significant role in the stable, long-term deammonification system operation. FA can inhibit the activities of nitrifying bacteria, at particular nitrite oxidizing bacteria (NOB). The inhibition impact of FA on AOB is observed within 10–150 mg FA•dm-1 while on NOB is 0.1–1.0 mg FA•dm-1. Therefore, the control of FA concentration may be effective strategy to enrich AOB population in the AS with simultaneous washout of the NOB from the system. The aim of this study was to examine the impact of high NH4-N concentration and selected intermittent aeration strategy to enhance the deamonification process rate. A special attention has been paid to test and to compare the process performance at the different concentration of FA. MATERIAL AND METHODS The deammonification process was examined in a bench-scale sequencing batch reactor (SBR) with a working volume of 10 dm3 for 2 days. The system was equipped with a thermostatic jacket to maintain a constant temperature at 30±1oC. Aeration was controlled with the continuous measurement of DO concentration. Two modes of the intermittent aeration modes were tested: variant 1.aeration 5 min + mixing 10 min. and variant 2.aeration 5 min + mixing 15min. For both variants the DO set points was controlled at 0.4 (± 0.1) g O2/m
3. The pH was also continuously measured and controlled in the range of 7.0-7.9 by 1.00 M NaOH addition. In order to eliminate errors due to variability of the sludge digester liquors composition, the reactor was fed with the synthetic reject water supplemented with medium as suggested by Dapena-Mora et al. (2004). The process rate measurements were carried out during 48 h lasting test by NH4-N, NO2-N and NO3-N concentrations control. Results and significance of the findings Results of the experiments are shown in Figure 1.
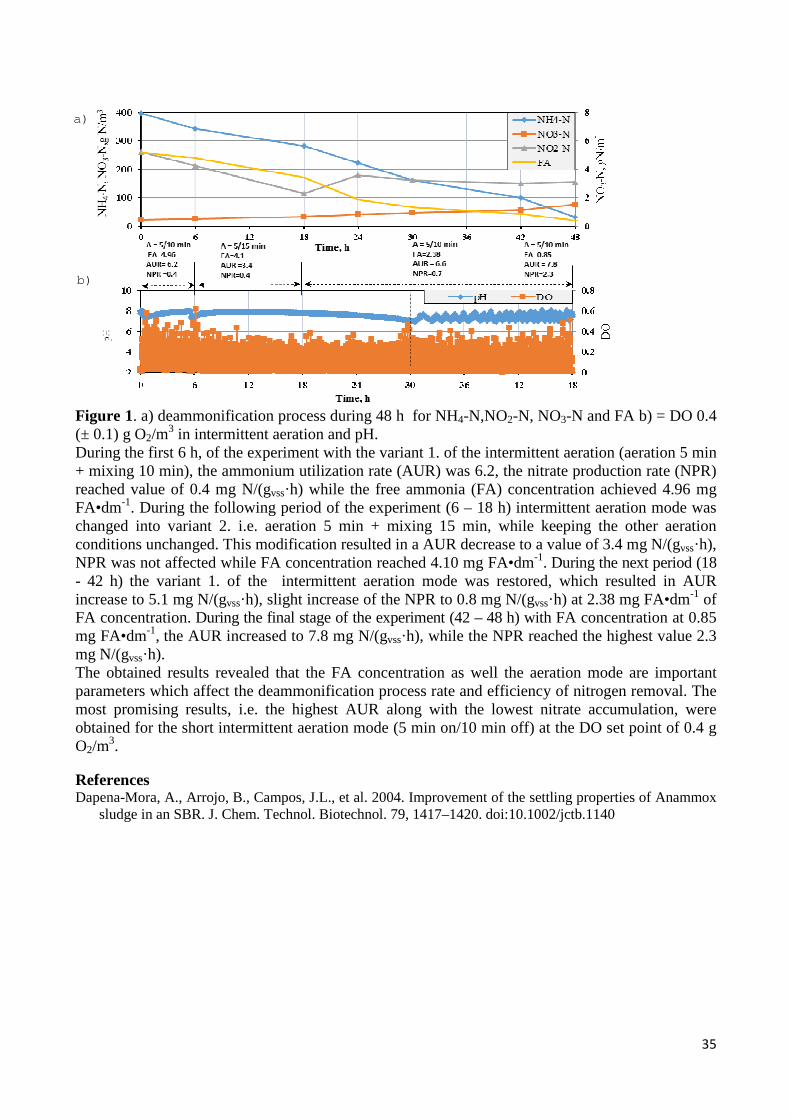
35
Figure 1. a) deammonification process during 48 h for NH4-N,NO2-N, NO3-N and FA b) = DO 0.4 (± 0.1) g O2/m
3 in intermittent aeration and pH. During the first 6 h, of the experiment with the variant 1. of the intermittent aeration (aeration 5 min + mixing 10 min), the ammonium utilization rate (AUR) was 6.2, the nitrate production rate (NPR) reached value of 0.4 mg N/(gvss·h) while the free ammonia (FA) concentration achieved 4.96 mg FA•dm-1. During the following period of the experiment (6 – 18 h) intermittent aeration mode was changed into variant 2. i.e. aeration 5 min + mixing 15 min, while keeping the other aeration conditions unchanged. This modification resulted in a AUR decrease to a value of 3.4 mg N/(gvss·h), NPR was not affected while FA concentration reached 4.10 mg FA•dm-1. During the next period (18 - 42 h) the variant 1. of the intermittent aeration mode was restored, which resulted in AUR increase to 5.1 mg N/(gvss·h), slight increase of the NPR to 0.8 mg N/(gvss·h) at 2.38 mg FA•dm-1 of FA concentration. During the final stage of the experiment (42 – 48 h) with FA concentration at 0.85 mg FA•dm-1, the AUR increased to 7.8 mg N/(gvss·h), while the NPR reached the highest value 2.3 mg N/(gvss·h). The obtained results revealed that the FA concentration as well the aeration mode are important parameters which affect the deammonification process rate and efficiency of nitrogen removal. The most promising results, i.e. the highest AUR along with the lowest nitrate accumulation, were obtained for the short intermittent aeration mode (5 min on/10 min off) at the DO set point of 0.4 g O2/m
3. References Dapena-Mora, A., Arrojo, B., Campos, J.L., et al. 2004. Improvement of the settling properties of Anammox
sludge in an SBR. J. Chem. Technol. Biotechnol. 79, 1417–1420. doi:10.1002/jctb.1140
a)
a)
b)
36
Photo-oxidation of selected PAHs with calcium peroxide as a source of the hydroxyl radicals Jolanta Kozak*, Maria Włodarczyk-Makuła** Department of Chemistry, Water and Wastewater Technology, Faculty of Infrastructure and Environment, Czestochowa University of Technology, 42-200 Czestochowa, 69 Dabrowskiego Str., PL (*E-mail:[email protected])** (E-mail: [email protected])
ABSTRACT With the growth of industry and the increase density of population , the amount of organic micro-pollutants in the environment is increasing. The main sources of PAHs in the environment are crude oil, petroleum products and coal, incomplete combustion of coal, fossil fuels and biomass, etc.( Smol 2015). The current regulation of the Ministry of the Environment from 2014, does not defines acceptable concentrations for PAHs for wastewater discharged to receivers. Although there are no legal acts defines acceptable levels of PAH in effluents discharged to receivers, monitoring for surface water should be carried out. More than that, as the research shows, wastewater discharged into the receivers is a source of surface water pollution Photodegradation may be more effective alternative to conventional methods. It follows the equations (1-4) (Małachowska-Jutsz 2014, Rubio-Clemente 2014).
CaO2 + 2 H20 → Ca(OH)2 + H2O2 (1)
H2O2 + hγ→ 2OH· (2)
3O3 + H2O2 + hγ →4O2 +2OH· (3)
Fe2+ + H2O2 → Fe3+ + OH- + OH· (4) Literary reports show that using several reagents at the same time gives better results in pollution degradation.. In advanced oxidation methods, different oxidation systems are used, eg O3 / UV, O3 / H2O2, H2O2 / UV and O3/ H2O2 /UV, H2O2 / Fe2+/UV. The most widely used and widely tested reagents are Fenton Fe2+ H2O2 , H2O2 reagent, permanganate, and especially ozone and their mixtures (http://chem.arch.ug.edu.pl/zis/c_9.pdf ). The use of CaO2 as an alternative source of hydroxyl radicals allows for lower process costs and safer storage than H2O2. Furthermore, the release of H2O2 from CaO2 occurs gradually and only in acidic aquatic environment.(Skoczko, 2013). Therefore, it seems important to conduct research with the mentioned reagent. The aim of the investigation was to evaluate the effectiveness of selected PAHs degradation during photo-oxidation process. EXPERIMENTAL PROCEDURE Materials Coke plant wastewater in the study was used. Wastewater from industrial wastewater treatment plant was taken. Wastewater is biologically treated with an activated sludge methods. Coke plant wastewater for organic compounds (COD) and PAHs content was analyzed. Methods Coke plant wastewater samples were mixed with calcium peroxide CaO2. Next the value of pH was corrected and then Fenton reagent were added to the samples. The samples were exposed to UV-C rays for 4,6 or 8 minutes. The depth of wastewater was equal to 0.25 mm. Changes in the PAHs
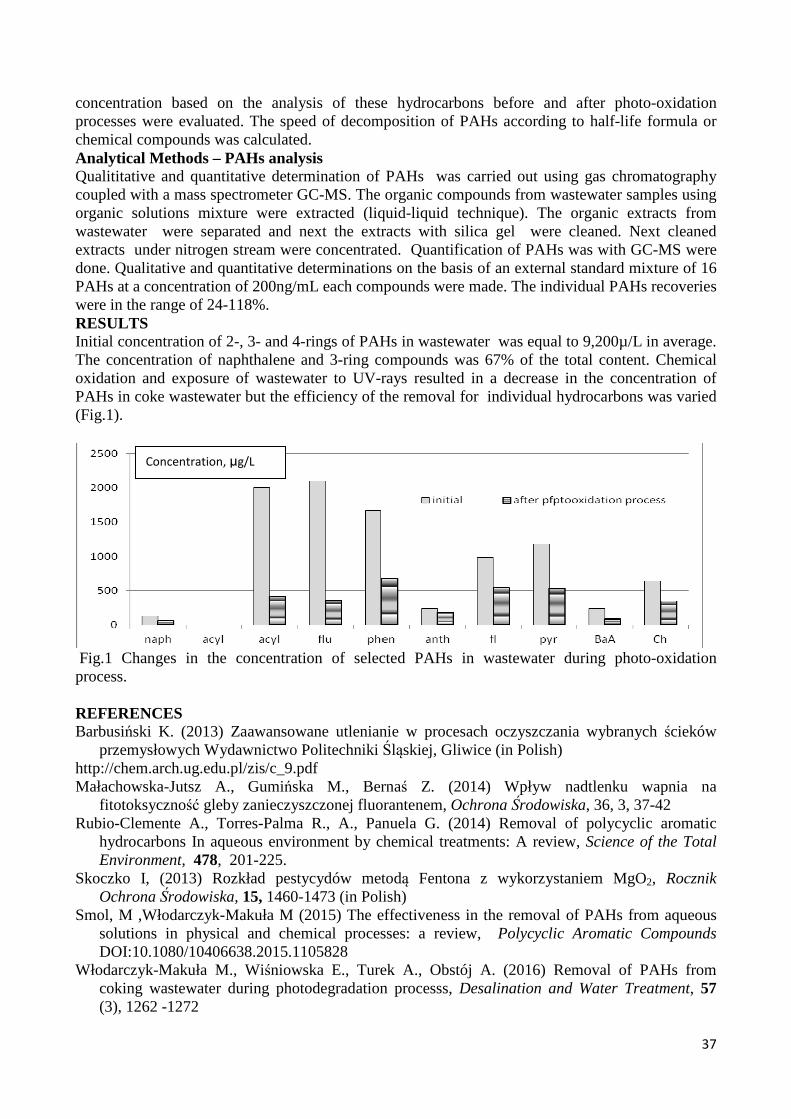
37
concentration based on the analysis of these hydrocarbons before and after photo-oxidation processes were evaluated. The speed of decomposition of PAHs according to half-life formula or chemical compounds was calculated. Analytical Methods – PAHs analysis Qualititative and quantitative determination of PAHs was carried out using gas chromatography coupled with a mass spectrometer GC-MS. The organic compounds from wastewater samples using organic solutions mixture were extracted (liquid-liquid technique). The organic extracts from wastewater were separated and next the extracts with silica gel were cleaned. Next cleaned extracts under nitrogen stream were concentrated. Quantification of PAHs was with GC-MS were done. Qualitative and quantitative determinations on the basis of an external standard mixture of 16 PAHs at a concentration of 200ng/mL each compounds were made. The individual PAHs recoveries were in the range of 24-118%. RESULTS Initial concentration of 2-, 3- and 4-rings of PAHs in wastewater was equal to 9,200µ/L in average. The concentration of naphthalene and 3-ring compounds was 67% of the total content. Chemical oxidation and exposure of wastewater to UV-rays resulted in a decrease in the concentration of PAHs in coke wastewater but the efficiency of the removal for individual hydrocarbons was varied (Fig.1).
Fig.1 Changes in the concentration of selected PAHs in wastewater during photo-oxidation process. REFERENCES Barbusiński K. (2013) Zaawansowane utlenianie w procesach oczyszczania wybranych ścieków
przemysłowych Wydawnictwo Politechniki Śląskiej, Gliwice (in Polish) http://chem.arch.ug.edu.pl/zis/c_9.pdf Małachowska-Jutsz A., Gumińska M., Bernaś Z. (2014) Wpływ nadtlenku wapnia na
fitotoksyczność gleby zanieczyszczonej fluorantenem, Ochrona Środowiska, 36, 3, 37-42 Rubio-Clemente A., Torres-Palma R., A., Panuela G. (2014) Removal of polycyclic aromatic
hydrocarbons In aqueous environment by chemical treatments: A review, Science of the Total Environment, 478, 201-225.
Skoczko I, (2013) Rozkład pestycydów metodą Fentona z wykorzystaniem MgO2, Rocznik Ochrona Środowiska, 15, 1460-1473 (in Polish)
Smol, M ,Włodarczyk-Makuła M (2015) The effectiveness in the removal of PAHs from aqueous solutions in physical and chemical processes: a review, Polycyclic Aromatic Compounds DOI:10.1080/10406638.2015.1105828
Włodarczyk-Makuła M., Wiśniowska E., Turek A., Obstój A. (2016) Removal of PAHs from coking wastewater during photodegradation processs, Desalination and Water Treatment, 57 (3), 1262 -1272
Concentration, µg/L

38
Anticancer drugs in the aquatic environment – possibilities of their elimination
P. Rezka*, E. Laskowska**, J. Płonka**, M. Kryłów* and W. Balcerzak * Institute of Water Supply and Environmental Protection, Faculty of Environmental Engineering, Cracow University of Technology (E-mail: [email protected]) ** Department of Inorganic Chemistry, Analytical Chemistry and Electrochemistry, Faculty of Chemistry, Silesian University of Technology
INTRODUCTION Pharmaceuticals and their derivatives are regarded as one of the most serious problems that will be faced in near future, especially in developing countries. The development of medicine and the prolonged life of society are promoting factors of the increased production and consumption of pharmaceuticals over the world. Considering other sources of environmental pollution such as cosmetic products and plastics, it may be surprising that in the available literature it is in vain to seek research articles on the presence of, for example, anticancer drugs in Poland. Although the dominating ecological theme in Poland is the issue of air quality, every citizen of a city or village would like to see rivers, lakes, floodplains and even the Baltic Sea not being contaminated with highly harmful pharmaceuticals, such as cytostatic drugs. Cytostatic drugs are a group of natural and synthetic compounds used widely in cancer treatment (chemotherapy) and are toxic to rapidly dividing tumor cells. Since they may also be harmful for other rapidly dividing cells (such as bone marrow, hair and mucous membranes), the drugs are highly dangerous with many undesirable side effects, such as anemia, nausea and vomiting. Cytostatic drugs act differently, depending on the type of drug; but their main role is to inhibit or completely block the replication of DNA in the tumor cell. The above-mentioned cytostatics (cyclophosphamide, ifosfamide, and 5-fluorouracil) are not only used in chemotherapy of different types of cancers, such as cancer of breasts, bronchial, testes, ovaries (CP, IF) and cancer of the digestive system (5-FU) but also in the treatment of leukemia, lymphoma and autoimmune diseases. They are also used for immunosuppression after organ transplantation (Kidd, 2007). The subject matter is, however, relatively well described in the literature around the world. Some studies have shown that cytostatic drugs can be present in wastewater effluents (Buerge, 2006), surface waters (Lin, 2014; Moldovan 2006; Valcarcel, 2011). At present it is known that the currently used wastewater treatment processes do not eliminate the most commonly used cytostatic drugs such as 5-fluorouracil, cyclophosphamide, ifosfamide, methotrexate and doxorubicin. In Poland, the dominant cytostatic drug is 5-fluorouracil, whose adverse effects more or less severely affect many organ systems of the human body. The second most significant is the highly toxic cyclophosphamide, a drug that is carcinogenic, mutagenic and teratogenic (Kummerer, 2001; 2010). MAIN OBJECTIVE This work will focus on three most popular cytostatics in Poland and will be an attempt to determine the possibilities of their removal from water matrices. The concentration levels of cytostatics in aquatic environment depends on number of factors such as the annual consumption of the aforementioned pharmaceuticals in medical facilities, drug absorption by the human body, time profile of the excretion of the drug from the human body and removal efficiency during wastewater treatment.

39
REFERENCES Buerge, I.J., Buser, H.R., Poiger, T., Muller, M.D. (2006) Occurrence and fate of the cytostatic
drugs cyclophosphamide and ifosfamide in wastewater and surface waters. Environmental Science & Technology, Vol. 40, 7242-7250.
Kidd, K.A., Blanchfield, P.J., Mills, K.H., Palace, V.P., Evans, R.E., Lazorchak, J.M., Flick, R.W. (2007) Collapse of a fish population after exposure to a synthetix estrogen. Proceedings of the National Academy of Sciences of the U.S.A., Vol. 104, 8997-8901
Kummerer, K. (2001) Drugs in the environment: emission of drugs, diagnostic aids and disinfectants into wastewater by hospitals in relation to other sources – a review. Chemosphere, Vol. 45, 957-969
Kummerer, K. (2010) Pharmaceuticals in the environment. Annual Review of Environment and Resources, Vol. 35, 57-75
Lin, A.Y.-C, Lin, Y.-C., Lee, W.-N. (2014) Prevalence and sunlight photolysis of controlled and chemotherapeutic drugs in aqueous environments. Environmental Pollution, Vol. 187, 170-181
Moldovan, Z., (2006) Occurrences of pharmaceutical and personal care products as micropollutants in rivers from Romania. Chemosphere, Vol. 64, 1808-1817
Valcarcel, Y., Gonzalez, A., Rodriguez-Gil, J.L., Gil, A., Catala, M. (2011) Detection of pharmaceutically active compounds in the rivers and tap water of the Madrid Region (Spain) and potential ecotoxicological risk. Chemosphere, Vol. 84, 1336-1348
40
Modeling Aeration Control Strategies for Low Energy Process Control in WWTP
J. Drewnowski*, E. Zaborowska*, S. Pérez Figueroa**, A. Robles** and A. Seco**
* Gdansk University of Technology, Faculty of Civil and Environmental Engineering, Narutowicza 11/12, 80-233 Gdansk, POLAND (E-mail: [email protected], [email protected]) ** Polytechnic University of Valencia, School of Civil Engineering, Dept. of Hydraulic Engineering and Environment, Camino de Vera, s/n 46-022 Valencia, SPAIN (E-mail: [email protected])
INTRODUCTION Nowadays, the use of mathematical models, computer simulations and computational hardware control allow the analysis of many different technological solutions in a short time and with low investigation budget, besides carrying out various scenarios and control strategies in reality. Modelling becomes an integral part of the design and operation of wastewater treatment systems in gaining more knowledge of the mechanisms and operational strategies playing an important role in this process (Gujer, 2006). The paper presents the example of modeling aeration control strategies for low energy process control based on real data under different operation condition from WWTP in northern Poland. The aim of this study was to evaluate different concepts of the modeling aeration control strategies for cost effective nitrogen removal using activated sludge models (ASM), as well as more comprehensive models Mantis2.
MATERIAL AND METHODS Extracting experimental data. The experimental part was carried out in order to present the process of model calibration and validation. Laboratory batch experiments with the process biomass and settled wastewater were carried out in a specially designed and constructed experimental set-up consisting of two parallel batch reactors (max. volume of 4.0 dm3), control system and computer. Batch test results obtained at a large (100,000 PE) BNR WWTP in Slupsk (Poland) provided the experimental database for comparison of the model predictions and additional 96-hour measurement campaign under summer/winter conditions in the full-scale modified Bardenpho bioreactor at this plant presented earlier by Zaborowska et al. (2016) was integrated to calibration/validation process. Organization of the modeling study procedure. The computer simulations were carried out with the GPS-X simulation platform (Hydromantis, Canada) and compared to DESASS software (CALAGUA, Spain). Furthermore, the effect of side-streams on nutrient removal efficiency could be estimated because the performance of the whole plant model simulated by GPS-X (such as Mantis2) or DESSAS platform.
RESULTS AND DISCUSSION Energy consumption is crucial in determining WWTP operating costs. The Figure 1a shows estimated power usage in a sample WWTP. The aeration could consume almost 50% of total energy at WWTPs. The objective of the study was to model different aeration strategies for improve biochemical processes and energy balance using newly developed controllers in GPS-x ver. 6.5.1. Control processes of variable variants for aeration zone was tested under the operational parameters for Bardenpho system at the studied WWTP. Computer simulations enabled to estimate ON/OFF controller for dissolved oxygen variable, ON/OFF controller for the ammonium variable, PID controller for the dissolved oxygen variable and ON/OFF for the variable ammonium as well as more complex systems e.g. ammonia-based aeration control (ABAC). In this study, modeling aeration control strategies for low energy process control in WWTP is based on compilation of
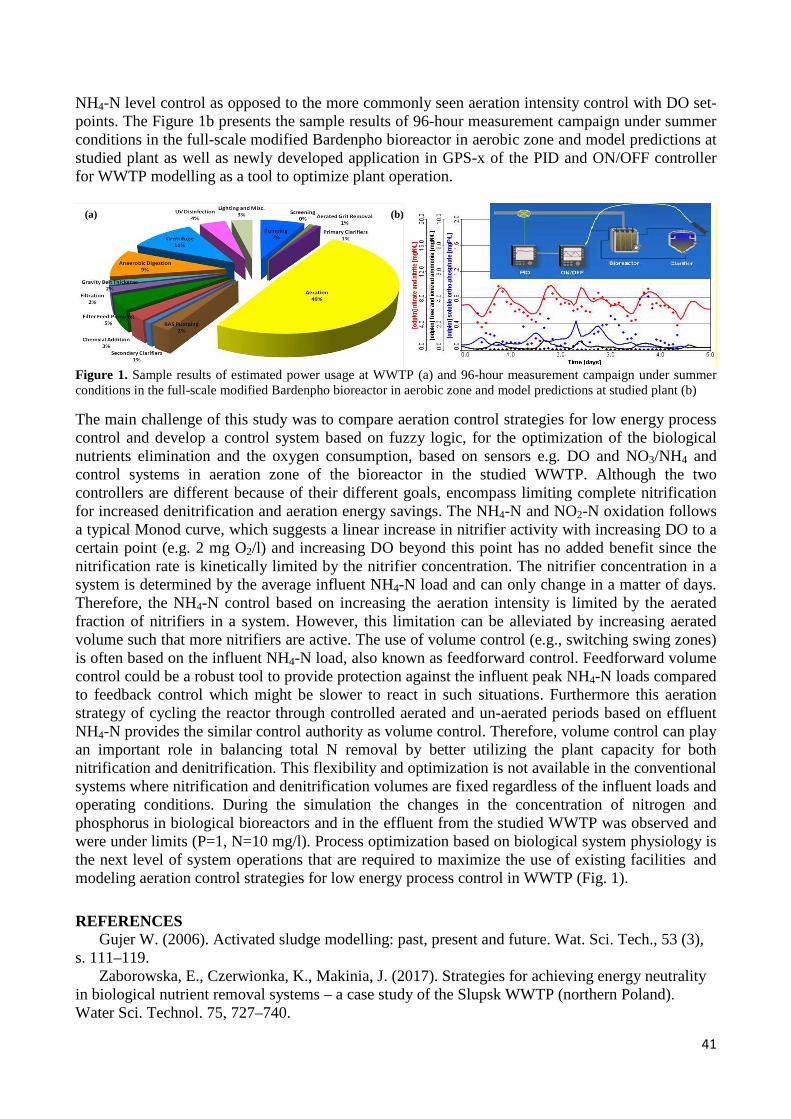
41
NH4-N level control as opposed to the more commonly seen aeration intensity control with DO set-points. The Figure 1b presents the sample results of 96-hour measurement campaign under summer conditions in the full-scale modified Bardenpho bioreactor in aerobic zone and model predictions at studied plant as well as newly developed application in GPS-x of the PID and ON/OFF controller for WWTP modelling as a tool to optimize plant operation.
Figure 1. Sample results of estimated power usage at WWTP (a) and 96-hour measurement campaign under summer conditions in the full-scale modified Bardenpho bioreactor in aerobic zone and model predictions at studied plant (b)
The main challenge of this study was to compare aeration control strategies for low energy process control and develop a control system based on fuzzy logic, for the optimization of the biological nutrients elimination and the oxygen consumption, based on sensors e.g. DO and NO3/NH4 and control systems in aeration zone of the bioreactor in the studied WWTP. Although the two controllers are different because of their different goals, encompass limiting complete nitrification for increased denitrification and aeration energy savings. The NH4-N and NO2-N oxidation follows a typical Monod curve, which suggests a linear increase in nitrifier activity with increasing DO to a certain point (e.g. 2 mg O2/l) and increasing DO beyond this point has no added benefit since the nitrification rate is kinetically limited by the nitrifier concentration. The nitrifier concentration in a system is determined by the average influent NH4-N load and can only change in a matter of days. Therefore, the NH4-N control based on increasing the aeration intensity is limited by the aerated fraction of nitrifiers in a system. However, this limitation can be alleviated by increasing aerated volume such that more nitrifiers are active. The use of volume control (e.g., switching swing zones) is often based on the influent NH4-N load, also known as feedforward control. Feedforward volume control could be a robust tool to provide protection against the influent peak NH4-N loads compared to feedback control which might be slower to react in such situations. Furthermore this aeration strategy of cycling the reactor through controlled aerated and un-aerated periods based on effluent NH4-N provides the similar control authority as volume control. Therefore, volume control can play an important role in balancing total N removal by better utilizing the plant capacity for both nitrification and denitrification. This flexibility and optimization is not available in the conventional systems where nitrification and denitrification volumes are fixed regardless of the influent loads and operating conditions. During the simulation the changes in the concentration of nitrogen and phosphorus in biological bioreactors and in the effluent from the studied WWTP was observed and were under limits (P=1, N=10 mg/l). Process optimization based on biological system physiology is the next level of system operations that are required to maximize the use of existing facilities and modeling aeration control strategies for low energy process control in WWTP (Fig. 1).
REFERENCES Gujer W. (2006). Activated sludge modelling: past, present and future. Wat. Sci. Tech., 53 (3),
s. 111–119. Zaborowska, E., Czerwionka, K., Makinia, J. (2017). Strategies for achieving energy neutrality
in biological nutrient removal systems – a case study of the Slupsk WWTP (northern Poland). Water Sci. Technol. 75, 727–740.
(a) (b)

42
Possibilities of heat energy recovery from graywater installation K. M. Niewitecka* * Department of Water Supply and Wastewater Management, Warsaw University of Technology, Faculty of Building Services, Hydro and Environmental Engineering, 20 Nowowiejska Street, 00-653 Warsaw, Poland (E-mail: [email protected])
INTRODUCTION The energy contained in the graywater can be recycled and reused by using the latest technology. Particularly noteworthy is the possibility to reduce charges related to the preparation of DHW (domestic hot water). POSSIBILITIES OF HEAT RECOVERY Heat recovery from internal installations Heat recovery from the inner installations may be realized by using DWHR exchangers. Vertical exchangers are the most effective and most commonly used nowadays. They work as a counter-current heat exchangers. Among them there are spiral heat exchangers and a “pipe in pipe” exchangers.
Figure 1. Different configurations of the DWHR and DHW heater installation (Joniec, 2007). Exchangers are installed on the waste stacks in a building. The spiral exchanger consists of a waste stack and the copper spiral pipe wrapped around it, filled with the cold water passing upwardly. “Pipe in pipe” solution is two tubes - the inner of the smaller diameter (graywater pipe) and the outer one, which makes a cover (filled with the cold water). Both exchangers work analogously. (Kimmels, 2011).
Heat recovery from sewage systems The heat from drain water can be received also at the stage of transport - in the sewage collector. Using special heat exchangers and also in cooperation with the heat pump, a large amount of heat energy can be recovered. In relation to the other, low-temperature heat sources used as an heat energy source for heat pumps, waste water is characterized by a relatively high temperature within a year. (Table 1.) Waste water transfers the heat to the medium (as glycol, saline or water), which is then transported by the pipeline to the heat pump evaporator.

43
Table 1. Temperatures of lower heat sources.
Lower heat source Temperature (°C)
Soil 7-13
Soil water 7-12
Drain water 15-20
Heat exchangers are available as built into the structure of sewage pipe, used in the case of new constructed collectors, as well as ones for the use on the existing collectors, at the stage of the renovation, mounted by using a trenchless technology (Kuliczkowski, 2009). ECONOMIC ANALYSIS In the single-family residential building DWHR exchanger was installed. An economic analysis was performed for three variations, depending on the method of the system installation as well as of localizing cold and preheated water (Table 2). Data used for the calculations: cold water temp. 10°C; DHW temp. 60°C; mixed water temp. 40°C; drain water temp. 38°C; heater efficiency η=0,95; DWHR efficiency ε=0,50. Table 2. Savings in DHW preparation.
Variation Energy savings (kWh) Money savings (PLN)
3 users 5 users 3 users 5 users
W1 660,1
1100,2
+349,9
+583,1
W2 397,5
662,4
+210,7
+351,1
W3 364,8
608,0
+193,3
+322,3
SUMMARY Graywater heat recovery systems allows for significant savings in terms of preheating domestic hot water. The rate of costs recovery depends on the activity of a building and the type of installations. The design solutions of the heat exchangers, as well as the internal installations, must be always adjusted to the quality of the media as graywater. REFERENCES Cooperman A., Dieckmann J., Brodrick J. (2011) Drain Water Heat Recovery, ASHRAE Journal,
11, 58-62. Kimmels A. (2011) Shower heat Recovery: Overview of Commercially Available DWHR Systems,
Meander Heat Recovery Joniec W. (2007) Odzysk ciepła z kanalizacji, Rynek Instalacyjny, 5, 72-75. Kuliczkowski P. (2009) Rodzaje wymienników ciepła stosowanych w kolektorach kanalizacyjnych
umożliwiających odzysk ciepła ze ścieków, Instal, 12, 46-49.

44
Automatization of sedimentation test T. Turlej* * Department of Power Systems and Environmental Protection Facilities, University of Science and Technology Cracow, Mickiewicza 30 av, Cracow, Poland (E-mail: [email protected])
INTRODUCTION Sedimentation processes are processes commonly used in various fields of industries. Sedimentation is widely used in wastewater treatment processes chemical and food industry or in mineral processing industries [Kowalski, 2001]. Sedimentation is a very beneficial process for energy reasons, there is very low demand for energy supplied to the sedimentation itself (energy must be supplied to accompanying processes, eg pumping of generated sediment). The course and speed of the sedimentation process depend on many factors, such as the type of suspension, particle size distribution, suspension concentration, chemical composition, particle and fluid density difference, fluid viscosity, etc (Kowalski, 2004). The velocity of the sedimentation process is relatively low, for this reason it is necessary to use a wide range of process intensification techniques, including coagulation, flocculation, multiflux fillings, even autocoagulation (Banaś, 2004). In the design of sedimentation equipment (settlers), it is necessary to define several process parameters: surface loading or particle size of the suspension, which is subjected to the sedimentation process. Grain size distribution can be determined by different methods, e.g. diffractometry (laser diffractometer), sedimentation weight, or by advanced electron microscopy methods (Różycki, 2016). The sedimentation process is different in case of free sedimentation than hindered sedimentation, when the fractional content of solid is at least 1% of volume (Orzechowski, 1990). Due to the complexity of the process of falling grains in the suspension of relatively high concentration, it is necessary to experimentally determine the parameters of the sedimentation process. For this purpose the static sedimentation test of the suspension is performed, a test which is obtained by plotting the sedimentation curve of suspension (Kynch, 1952). In the constrained sedimentation there is the occurrence of zone sedimentation, resulting in zones of different concentrations: the zone of purified liquid and the zone of concentrated sediment. The position of the boundary phase separation allows us to determine the size of the designed settler, the maximum attainable degree of compression (Bandrowski, 2001). The problem associated with performing a sedimentation test is, for example, the duration of such a test. Static studies of slow-sedimenting suspensions can last for several dozen hours. Furthermore, this test depends (to a large extent) on the subjective, arbitrary assessment of the position of the phase separation boundary, which is determined by the investigator. Methods In order to eliminate this type of errors and to optimize work time for sedimentation tests, several methods have been proposed to facilitate sedimentation testing. Most often used for this purpose is video recording, followed by a posteriori analysis of recorded film, carried out by a technician. However, these methods are also subject to errors: human factors (subjective assessment) and parallax effect. In order to exclude such errors, the concept of a stand for automatic sedimentation testing was proposed. This stand is equipped with a digital camera located on a trolley that moves along a guide parallel to the test cylinder.. The camera image is continuously processed through the image

45
analysis module. The output of this module is the height of the phase separation point on the recorded frame. The use of mathematical calculations (the difference between the position of the boundary and the center of the image transferred from the camera) allows the signal to be sent to the camera position control module. The signal received enables the camera to be positioned in such a way that the center of the recorded image is exactly at the level of the phase separation boundary. Using the position of the camera at a given time, plot of sedimentation curve is obtained. Materials A coal suspension was used to verify the correctness of the proposed position. The suspension for the research came from the process of coal enrichment from one of the processing plant.. The sample was taken from the treatment system of the duct leading the suspension to the settlers, just before the flocculants dosing point. The concentration of the sampled suspension was in range of 45±2 kg/m3. RESULTS As a result of the studies, the sedimentation curves for the coal suspensions were obtained. The curves were plotted using three methods: a classical sedimentation test conducted by a technician, using video analysis and using an automated sedimentation test proposed by the author of the article. CONCLUSIONS The verification of the correctness of the construction and the effectiveness of the algorithms used in this device was carried out using several suspensions. Examples of sedimentation tests carried out using this stand are provided in the article. An analysis of the difficulties encountered during the design and operation of the device was carried out and an assessment of the possibility of using the automatic sedimentation tester in a wide spectrum of suspensions was assessed. The measurements verified positively the suitability of the proposed laboratory stand. The use of automatic sedimentation test has eliminated errors in the subjective assessment of phase separation (classical sedimentation test) and parallax effect (image processing). REFERENCES Banaś M. (2004) The dependence of sedimentation efficiency on suspension concentration,
Inżynieria chemiczna i procesowa, vol. 25, issue 3, 659-664. Bandrowski J, Merta J., Zioło J. (2001) Sedymentacja zawiesin. Zasady i projektowanie. Wyd.
Politechniki Sląskiej. Gliwice 2001, ISBN 83-7335-000-4. Kowalski, W. P., Kołodziejczyk, K., Zacharz, T. (2001) The investigations of a lamella concurrent
sedimentation process, Inżynieria Chemiczna i Procesowa, vol. 22, 777-782. Kowalski, W. P. (2004) Investigation of fine grains distribution using the sedimentation analysis,
Journal of materials processing technology, vol. 157, 561-565. Kynch G. J. (1952) A theory of sedimentation. Trans. Faraday Soc. 48, 166. Orzechowski Z. (1990) Przepływy dwufazowe adiabatyczne ustalone. PWN. Różycki S., Banaś M., Wisła-Walsh E., Turlej T., Wnęk P. (2016) Physico-chemical properties of
suspended solids from coal processing plant, SGEM2016: 16th International Multidisciplinary Scientific GeoConference, vol. 2, Bulgaria, 2016, 611-618.
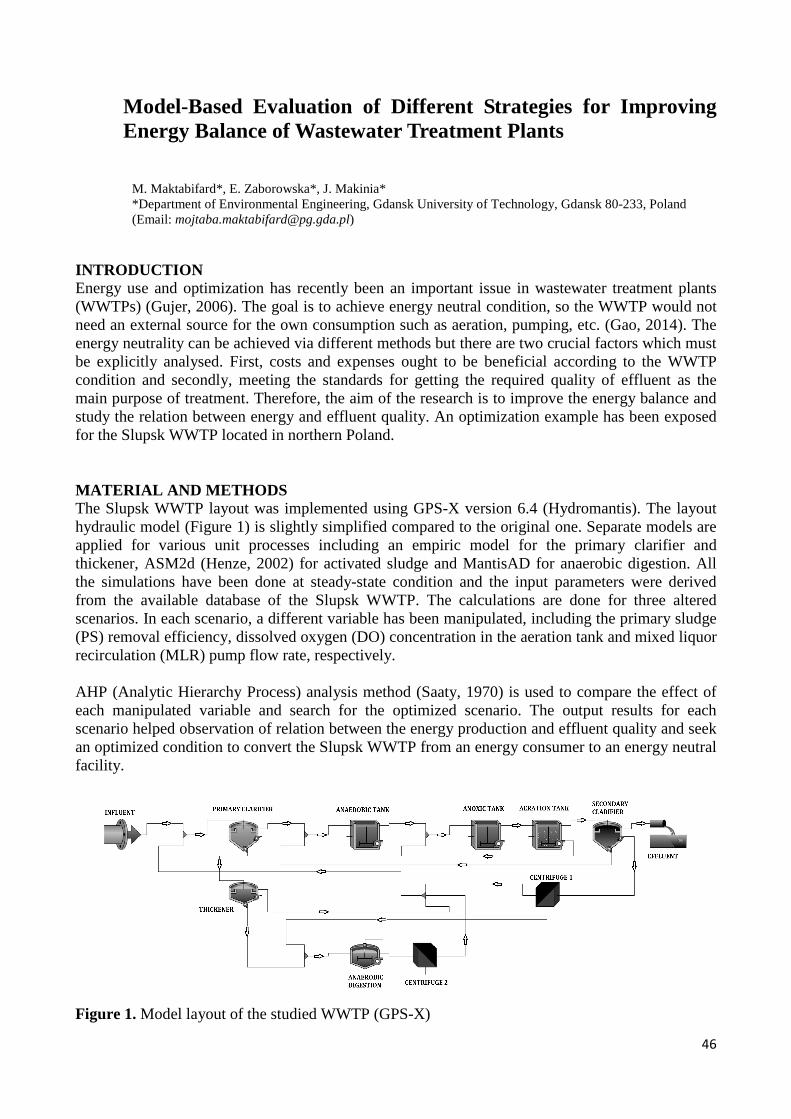
46
Model-Based Evaluation of Different Strategies for Improving Energy Balance of Wastewater Treatment Plants
M. Maktabifard*, E. Zaborowska*, J. Makinia* *Department of Environmental Engineering, Gdansk University of Technology, Gdansk 80-233, Poland (Email: [email protected])
INTRODUCTION Energy use and optimization has recently been an important issue in wastewater treatment plants (WWTPs) (Gujer, 2006). The goal is to achieve energy neutral condition, so the WWTP would not need an external source for the own consumption such as aeration, pumping, etc. (Gao, 2014). The energy neutrality can be achieved via different methods but there are two crucial factors which must be explicitly analysed. First, costs and expenses ought to be beneficial according to the WWTP condition and secondly, meeting the standards for getting the required quality of effluent as the main purpose of treatment. Therefore, the aim of the research is to improve the energy balance and study the relation between energy and effluent quality. An optimization example has been exposed for the Slupsk WWTP located in northern Poland. MATERIAL AND METHODS The Slupsk WWTP layout was implemented using GPS-X version 6.4 (Hydromantis). The layout hydraulic model (Figure 1) is slightly simplified compared to the original one. Separate models are applied for various unit processes including an empiric model for the primary clarifier and thickener, ASM2d (Henze, 2002) for activated sludge and MantisAD for anaerobic digestion. All the simulations have been done at steady-state condition and the input parameters were derived from the available database of the Slupsk WWTP. The calculations are done for three altered scenarios. In each scenario, a different variable has been manipulated, including the primary sludge (PS) removal efficiency, dissolved oxygen (DO) concentration in the aeration tank and mixed liquor recirculation (MLR) pump flow rate, respectively. AHP (Analytic Hierarchy Process) analysis method (Saaty, 1970) is used to compare the effect of each manipulated variable and search for the optimized scenario. The output results for each scenario helped observation of relation between the energy production and effluent quality and seek an optimized condition to convert the Slupsk WWTP from an energy consumer to an energy neutral facility.
Figure 1. Model layout of the studied WWTP (GPS-X)

47
RESULTS AND DISCUSSION The total energy consumption and biogas production are exposed according to removal efficiency of the clarifier in Figure 2. The total energy consumption is the aeration energy plus the pumping power consumed for the MLR. The reference point refers to the simulation result at steady-state condition (the actual average) and the valid intervals marked in the graphs are the results where the effluent quality meets the Polish standards. (TP<1 and TN<10 mg/L)
Figure 2. (a) Energy consumption and biogas production (kW) with various removal efficiencies, (b) Energy (%) vs. primary clarifier removal efficiency. Figure 2 demonstrates that by raising the efficiency of primary clarifier, the total energy consumption decreases and biogas production increases simultaneously. Therefore, the percentage of the energy balance increases substantially (by more than 100%) compared to the reference point. Similar comparison has taken place for other manipulated variables. The final results derived by applying AHP method is shown in Table 1. Different scenarios have been compared according to the criteria. Simulation results helped us to score each parameter and seek for the best scenario. Table 1. AHP methodology results for three scenarios.
Effluent Quality Energy Balance
Total
N Removal
P Removal
Energy
Consumption Biogas
Production
PS efficiency 0.142 0.6 0.139 0.777 0.353 DO concentration 0.428 0.2 0.573 0.111 0.350
MLR rate 0.428 0.2 0.286 0.111 0.296 CONCLUSIONS The energy balance is improved by increasing the removal efficiency of the primary clarifier due to more biogas production, but on the other hand, the effluent quality is the main purpose of wastewater treatment. After applying AHP methodology for the defined scenarios, the result showed similar significance for the DO concentration and primary sludge removal efficiency, while MLR has smaller effect on achieving the energy neutral point. REFERENCES Gao, H. (2014). Towards energy nuetral wastewater treatment, methodology and state of art. Royal
society of chemistry. Gujer, W. (2006). Activated sludge modelling: past, present, future. Water Science Technology. Henze, M. (2002). Activated sludge models on Mathematical Modelling for Design and Operation
of Biological Wastewater Treatment. Environmental Science: Processes & Impacts. Hydromantis. (2015). GPS-X 6.4. Hamilton, Ontario, Canada. Saaty. (1970) Analytic Hierarchy Process.

48
Municipal Waste Management Plant as Energy Prosumer
J. Ciuła*, K. Gąska** A. Generowicz*** and G. Hajduga***
* Nowy Sącz Water Networks Company,22 Wincentego Pola Street, 33-300 Nowy Sącz, Poland (E-mail: [email protected]) ** Chair of Technologies and Installations for Waste Management, Silesian University of Technology, 18 Konarskiego Street, 44-100 Gliwice, Poland (E-mail: [email protected]) *** Institute of Water Supply and Environmental Protection, Cracow University of Technology, 24 Warszawska Street, 31-155 Cracow, Poland (E-mail: [email protected]; [email protected])
INTRODUCTION Landfills still are the leading method of solid waste disposal in Poland. According to the Central Statistical Office (GUS), there have been 394 municipal landfills in operation at the end og 2014. Rising operation cost of this objects (energy or heat), are forcing policymaker to search for new energy sources. Landfill biogas can be considered as such energy source.
WASTE DISPOSAL INSTALLATION – WASTE TO ENERGY UNITS Every landfill which collects biodegradable fraction, becomes a “bioreactor” where organic matter is transformed into landfill biogas, which can be neutralized and used for recovery of thermal energy. Because, every landfill is different terms of a chemical composition of biogas, therefore degassing installation should be treated individually. Currently, cogeneration (CHP) i.e. landfill operation with energy recovery is becoming more popular in Poland. This process can be defined as a thermodynamic process in which chemical energy from landfill biogas is converted into useful energy forms such as electricity and heat (for plant's technological needs). The main advantage of cogeneration is overall conversion efficiency achieved in the cogeneration process, which is higher than when electricity and heat are produced in a separate way. The overall process efficiency exceeds 85% (Ciuła, 2009).
LANDFILL AS A SOURCE OF RENEWABLE ENERGY In Poland a significant increase in the amount of energy coming from renewable sources was observed in the last 10 years. According to the GUS (Berent-Kowalska, 2013), the amount of electricity produced from renewable sources in 2014 biogas comprises 3,66%. The data include landfill biogas, biogas from wastewater treatment plants and remaining biogas. Electricity and heat production from biogas can be divided to landfill biogas (225 GWh; 69 TJ), biogas from wastewater treatment plants (253 GWh; 86 TJ) and remaining biogas (338 GWh; 144 TJ) (Rey, Font, 2013). The lowest heat production attributed to landfill biogas results from a low heat demand at a landfill, compared to other producers (Nixon, Dey, Ghosh, Davies 2013).
WASTE DISPOSAL PLANT (ZZO) – ENERGY PROSUMER Electricity and heat produced from landfill biogas can be primarily spent to satisfy facility's own needs while the surplus can be transferred (sold) to a power grid as "green energy". This is the new role of the facility as an energy prosumer. While looking into the way electricity is managed in prosumer systems, three types of installations can be distinguished: directly connected to the
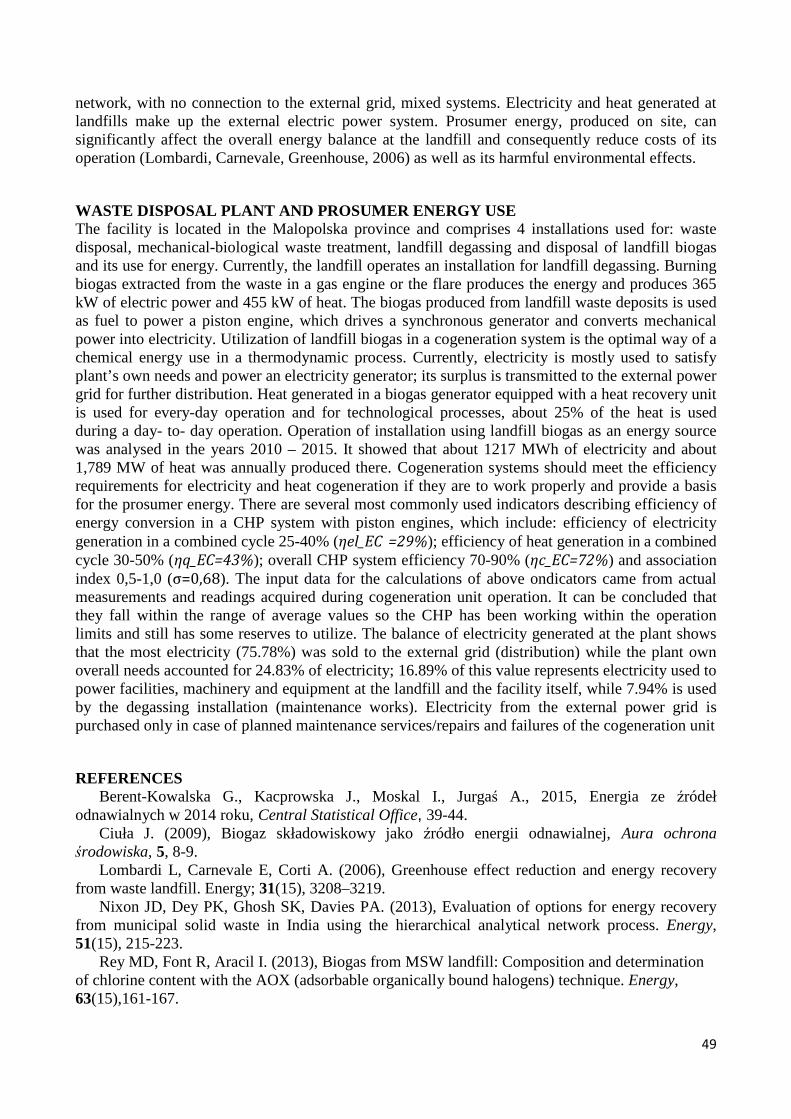
49
network, with no connection to the external grid, mixed systems. Electricity and heat generated at landfills make up the external electric power system. Prosumer energy, produced on site, can significantly affect the overall energy balance at the landfill and consequently reduce costs of its operation (Lombardi, Carnevale, Greenhouse, 2006) as well as its harmful environmental effects.
WASTE DISPOSAL PLANT AND PROSUMER ENERGY USE The facility is located in the Malopolska province and comprises 4 installations used for: waste disposal, mechanical-biological waste treatment, landfill degassing and disposal of landfill biogas and its use for energy. Currently, the landfill operates an installation for landfill degassing. Burning biogas extracted from the waste in a gas engine or the flare produces the energy and produces 365 kW of electric power and 455 kW of heat. The biogas produced from landfill waste deposits is used as fuel to power a piston engine, which drives a synchronous generator and converts mechanical power into electricity. Utilization of landfill biogas in a cogeneration system is the optimal way of a chemical energy use in a thermodynamic process. Currently, electricity is mostly used to satisfy plant’s own needs and power an electricity generator; its surplus is transmitted to the external power grid for further distribution. Heat generated in a biogas generator equipped with a heat recovery unit is used for every-day operation and for technological processes, about 25% of the heat is used during a day- to- day operation. Operation of installation using landfill biogas as an energy source was analysed in the years 2010 – 2015. It showed that about 1217 MWh of electricity and about 1,789 MW of heat was annually produced there. Cogeneration systems should meet the efficiency requirements for electricity and heat cogeneration if they are to work properly and provide a basis for the prosumer energy. There are several most commonly used indicators describing efficiency of energy conversion in a CHP system with piston engines, which include: efficiency of electricity generation in a combined cycle 25-40% (ηel_EC =29%); efficiency of heat generation in a combined cycle 30-50% (ηq_EC=43%); overall CHP system efficiency 70-90% (ηc_EC=72%) and association index 0,5-1,0 (σ=0,68). The input data for the calculations of above ondicators came from actual measurements and readings acquired during cogeneration unit operation. It can be concluded that they fall within the range of average values so the CHP has been working within the operation limits and still has some reserves to utilize. The balance of electricity generated at the plant shows that the most electricity (75.78%) was sold to the external grid (distribution) while the plant own overall needs accounted for 24.83% of electricity; 16.89% of this value represents electricity used to power facilities, machinery and equipment at the landfill and the facility itself, while 7.94% is used by the degassing installation (maintenance works). Electricity from the external power grid is purchased only in case of planned maintenance services/repairs and failures of the cogeneration unit
REFERENCES Berent-Kowalska G., Kacprowska J., Moskal I., Jurgaś A., 2015, Energia ze źródeł
odnawialnych w 2014 roku, Central Statistical Office, 39-44. Ciuła J. (2009), Biogaz składowiskowy jako źródło energii odnawialnej, Aura ochrona
środowiska, 5, 8-9. Lombardi L, Carnevale E, Corti A. (2006), Greenhouse effect reduction and energy recovery
from waste landfill. Energy; 31(15), 3208–3219. Nixon JD, Dey PK, Ghosh SK, Davies PA. (2013), Evaluation of options for energy recovery
from municipal solid waste in India using the hierarchical analytical network process. Energy, 51(15), 215-223.
Rey MD, Font R, Aracil I. (2013), Biogas from MSW landfill: Composition and determination of chlorine content with the AOX (adsorbable organically bound halogens) technique. Energy, 63(15),161-167.

50
Water and sewage sludge digestion: characteristic of the process and its possible applications
J. Górka*, M. Cimochowicz-Rybicka* * Department of Environmental Engineering, University of Technology, 24 Warszawska, Cracow 31-155, Poland (E-mail: [email protected]; [email protected])
INTRODUCTION The necessity of waste disposal is caused by the need to save resources, reduce the needed space for their disposal, processing and storage (Poskrobko, 2007). There is also a requirement that environmental damage should not be involved in this process (Biegańska & Ciuła, 2011). The handling and disposal of voluminous sludge produced from water treatment plant poses difficulty to environmental scientists and engineers. The water treatment sludge is difficult to dispose because their composition and properties depend on the quality of raw water, the used treatment methods and type of reagents and their doses. These type of waste are characterized by large quantitative and qualitative differences (Verrelli et al., 2009). There are many ways of water treatment sludge disposal (Ahmad et al., 2016):
• in recovery and reuse of coagulants from water treatment sludge, • as coagulant in wastewater treatment plants, • in removal of contaminants and heavy metal from wastewater, • as a substrate in constructed wetlands, • in sewage sludge dewatering, • in cement production, • in brick and ceramic production, • in manufacturing lightweight aggregates, • as raw material for concrete and mortar, • in agricultural practice and other land bases uses.
However, all these mentioned methods are very expensive and require complicated technologies. USING WATER TREATMENT SLUDGE DURING ANAEROBIC DIGES TION OF SEWAGE SLUDGE The aim of the researches was to determine the possibilities of using water treatment sludge from water treatment plant during anaerobic digestion of sewage sludge. The anaerobic digestion of sewage sludge is established method of sewage sludge processing for medium and large wastewater treatment plants. The basis for energy researches have been a respirometric tests, which allow an analysis of the quantity and quality of fermentation gas (Cimochowicz-Rybicka, 2013). The results showed that digestion of sewage sludge and water treatment sludge increased a biogas production. Consequently, the use water treatment sludge during anaerobic digestion of sewage sludge is part of the principle of ‘integrated economy’ consisting of the implementation of a municipal waste management system where in the different disposal technologies work side by side and complementing each other. (Żygadło, 2001).
REFERENCES Ahmad T., Ahmad K., Alam M. (2016). Sustainable management of water treatment sludge through

51
3R concept. Journal of Cleaner Production, 124, 1-13. Biegańska J., Ciuła J. (2011). Zintegrowana gospodarka odpadami komunalnymi w Polsce jako
element zrównoważonego rozwoju. Archives of Waste Management and Environmental Protection, 13(1), 51-60.
Cimochowicz-Rybicka M. (2013) Aktywność metanogenna osadów ściekowych poddanych beztlenowej stabilizacji z zastosowaniem dezintegracji ultradźwiękowej. Cracow University of Technology 2013.
Poskrobko B. (2007) Zarządzanie środowiskiem, Polish Economic Publishing Warsaw 2007. Verrelli D., Dixon D., Scales P. (2009). Effect of coagulation conditions on the dewatering
properties of sludges produced in drinking water sludge. Colloids and Surfaces A: Physicochemical and Engineering Aspects, 348, 14-23.
Żygadło, M. (2001) Zintegrowany system gospodarki odpadami. PZITS Poznań 2001.

52
Analysis and comparison of methods for the preparation of domestic hot water from district heating system, selected renewable and non-renewable sources in low-energy buildings
M.Knapik*,
* Institute of Thermal Engineering and Air Protection, Faculty of Environmental Engineering, Cracow University of Technology (E-mail: [email protected])
INTRODUCTION Low-energy and passive constructions are a result of the introduction of new ideas in building design process. Their main objective is to achieve a significant reduction in demand for non renewable primary energy, necessary to cover the needs of these buildings, mostly related to their heating, ventilation and domestic hot water. (Feist, 2009) Achieving the expected quality of energy performance for low energy buildings does not require to introduce expensive technological solutions. Achieving appropiate energy quality is based largely on improving the thermal insulation properties of the most important elements of construction. This allows to reduce seasonal heating demand. In buildings of this type increased demand of energy for domestic hot water preparation in relation to the total energy demand can be observed. Experimental results show that in the low energy buildings about 20% of heat energy is used for heating domestic hot water. Domestic hot water from district heating system One of the alternatives of supplying buildings with heat is district heating system (Szczechowiak E, 1994) . In this case, heat is generated outside of the heated building and it supplied to the building via high-parameter pipe network, and then by a heat exchanger directed to the specific receivers. Particular advantage of district heating is the lack of a heat source at the customer, therefore, are not emitted to the environment any contaminants associated with combustion of non-renewable sources. Domestic hot water from renewable sources – wind turbines and photovoltaic cells Research shows that (Knapik, 2016), to achieve the low demand for non renewable primary energy it is also necessary to use renewable energy sources, especially such as solar and wind power. Combining in one building, installations using these two types of renewable energy sources will provide benefits of mutual complementarity, when the energy generation in one of these installations will disappear or will be significantly reduced. In the autumn and winter period, when the possibilities of solar energy are significantly reduced wind turbines due to usually occurring in this time windy weather will produce much more energy than photovoltaic cells. This situation is changing in the summer months, when the photovoltaic cells produce more energy, due to the longer day and a much greater intensity of solar radiation. In the summer months, while the air masses are not moving too quickly, in result, it is observed lower wind speeds and therefore wind turbines produce limited amounts of power. Electricity from renewable sources can be used to heat the hot water in the tank through the warmer. Domestic hot water from renewable sources – heat pump powered by wind turbines and photovoltaic cells
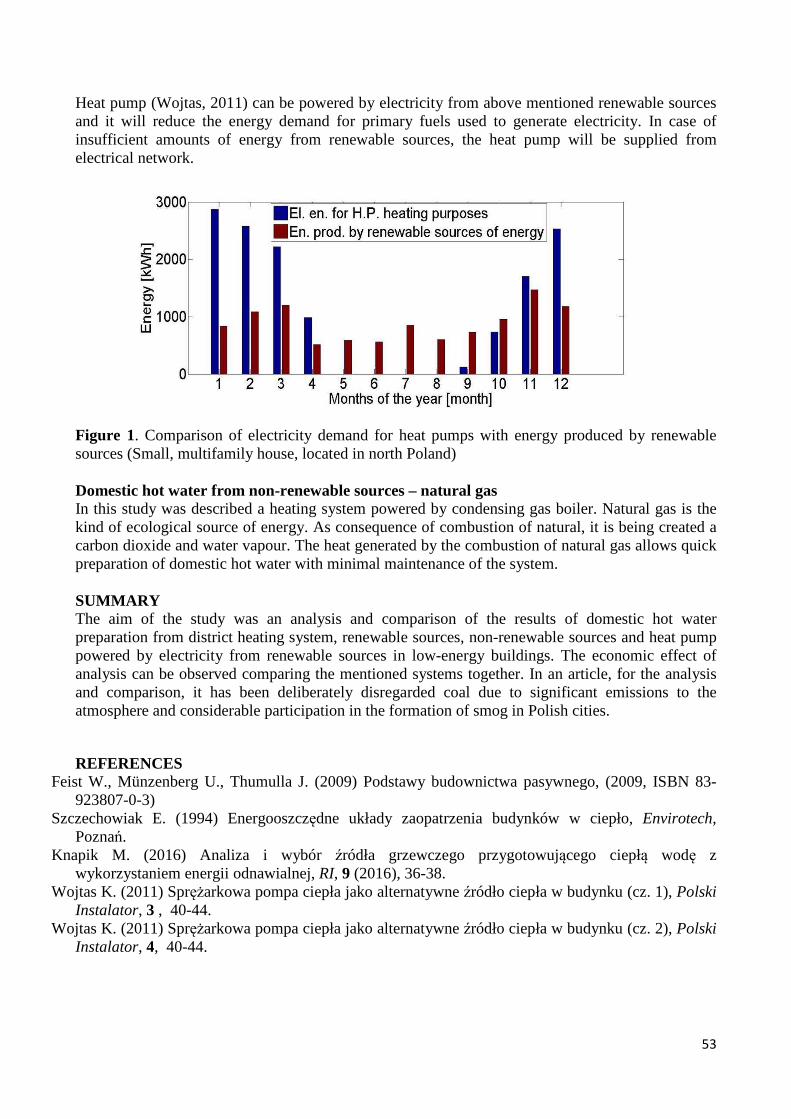
53
Heat pump (Wojtas, 2011) can be powered by electricity from above mentioned renewable sources and it will reduce the energy demand for primary fuels used to generate electricity. In case of insufficient amounts of energy from renewable sources, the heat pump will be supplied from electrical network.
Figure 1. Comparison of electricity demand for heat pumps with energy produced by renewable sources (Small, multifamily house, located in north Poland) Domestic hot water from non-renewable sources – natural gas In this study was described a heating system powered by condensing gas boiler. Natural gas is the kind of ecological source of energy. As consequence of combustion of natural, it is being created a carbon dioxide and water vapour. The heat generated by the combustion of natural gas allows quick preparation of domestic hot water with minimal maintenance of the system. SUMMARY The aim of the study was an analysis and comparison of the results of domestic hot water preparation from district heating system, renewable sources, non-renewable sources and heat pump powered by electricity from renewable sources in low-energy buildings. The economic effect of analysis can be observed comparing the mentioned systems together. In an article, for the analysis and comparison, it has been deliberately disregarded coal due to significant emissions to the atmosphere and considerable participation in the formation of smog in Polish cities.
REFERENCES Feist W., Münzenberg U., Thumulla J. (2009) Podstawy budownictwa pasywnego, (2009, ISBN 83-
923807-0-3) Szczechowiak E. (1994) Energooszczędne układy zaopatrzenia budynków w ciepło, Envirotech,
Poznań. Knapik M. (2016) Analiza i wybór źródła grzewczego przygotowującego ciepłą wodę z
wykorzystaniem energii odnawialnej, RI, 9 (2016), 36-38. Wojtas K. (2011) Sprężarkowa pompa ciepła jako alternatywne źródło ciepła w budynku (cz. 1), Polski
Instalator, 3 , 40-44. Wojtas K. (2011) Sprężarkowa pompa ciepła jako alternatywne źródło ciepła w budynku (cz. 2), Polski
Instalator, 4, 40-44.

54
Comparison of designed and real electric energy consumption by SBR reactors in a small municipal WWTP
J. Ciepliński*, S.M. Rybicki* * Instytut Zaopatrzenia w Wodę i Ochrony Środowiska, Wydział Inżynierii Środowiska, Politechnika Krakowska, ul. Warszawska 24, 31-155, Kraków, Poland (E-mail: [email protected]; [email protected])
INTRODUCTION The paper describes part of the experiment designed to determine distribution of electrical energy consumption by a medium-size municipal wastewater treatment plant. The experiment is addressed towards minimization of electrical energy consumption and thus reduction of an ecological ‘footprint’ of contemporary wastewater treatment plant. The main subject is to check whether minimization of this consumption can be achieved by re-arrangement of energy supply subsystem. The plant was designed at the capacity of 1250 m3/d (p.e. equals to 14950). Real operating conditions are in fact lower as follows flow is approx. 500 m3/d with approx. 4000 p.e.. The research has focused mainly on energy consumption by the biological treatment stage (SBRs) and sludge stabilization. During the first stage of measuring grid`s construction following devices were covered: SBRs no3 and 4 blowers: D4, D5, D6, SBR no4 internal turbine: Tr4 and SBR no4 sludge pump: P11. During the second stage the grid was enhanced by another 5 devices. This allowed monitoring of the most important devices of the bio-treatment stage of the WWTP’s main technological line. Paper will be focused on comparison of theoretical and real energy consumption of blowers equipped with Variable-frequency drives (VFDs) and other vital devices powered directly (without VFD). MEASURMENTS AND CALCULATIONS Each energy consuming treatment unit/equipment has been equipped with a measuring device, which measures and stores data concerning device’s total energy consumption with fixed time intervals. Based on that energy usage data during given time period was gathered (column “M” in table 1 and 2). All blowers’ motors nominal power is 30 kW, pump motor is 5.5 kW. Table 1.Measured and estimated energy consumption by the SBR no4 in January 2016.
Date Time P11 5,5 [kW] D5 30 [kW] TR4 11/7.5 [kW]
E1 [kWh] M [kWh] E1 [kWh] E2 [kWh] M [kWh] E1 [kWh] M [kWh] 29-12 14:00 - - - - - -
4-01 14:00 2,38 1,80 1343,50 497,10 444,66 1139,74 614,15 5-01 14:10 1,28 1,02 288,00 106,56 97,95 192,73 105,76 8-01 13:55 2,20 0,81 818,00 302,66 129,25 552,56 93,56
11-01 13:55 1,65 1,20 894,00 330,78 293,89 583,55 299,59 12-01 13:55 1,10 0,79 419,00 155,03 146,25 191,76 104,70 13-01 14:15 1,10 0,83 322,00 119,14 111,92 177,69 84,15 14-01 13:55 2,29 1,68 258,50 95,65 95,52 145,78 70,16 15-01 13:55 1,19 1,19 252,00 93,24 94,35 168,40 83,48 18-01 14:05 1,74 0,98 845,00 312,65 276,36 591,96 283,83 19-01 13:30 1,28 0,95 286,50 106,01 99,95 163,43 75,65 21-01 13:55 1,93 1,42 411,50 152,26 148,73 342,13 168,32 22-01 13:55 1,19 0,88 173,50 64,20 65,17 175,12 96,57 25-01 13:55 1,93 1,38 504,00 186,48 165,81 521,55 269,50 26-01 13:40 1,47 1,03 227,50 84,18 76,98 156,29 79,97
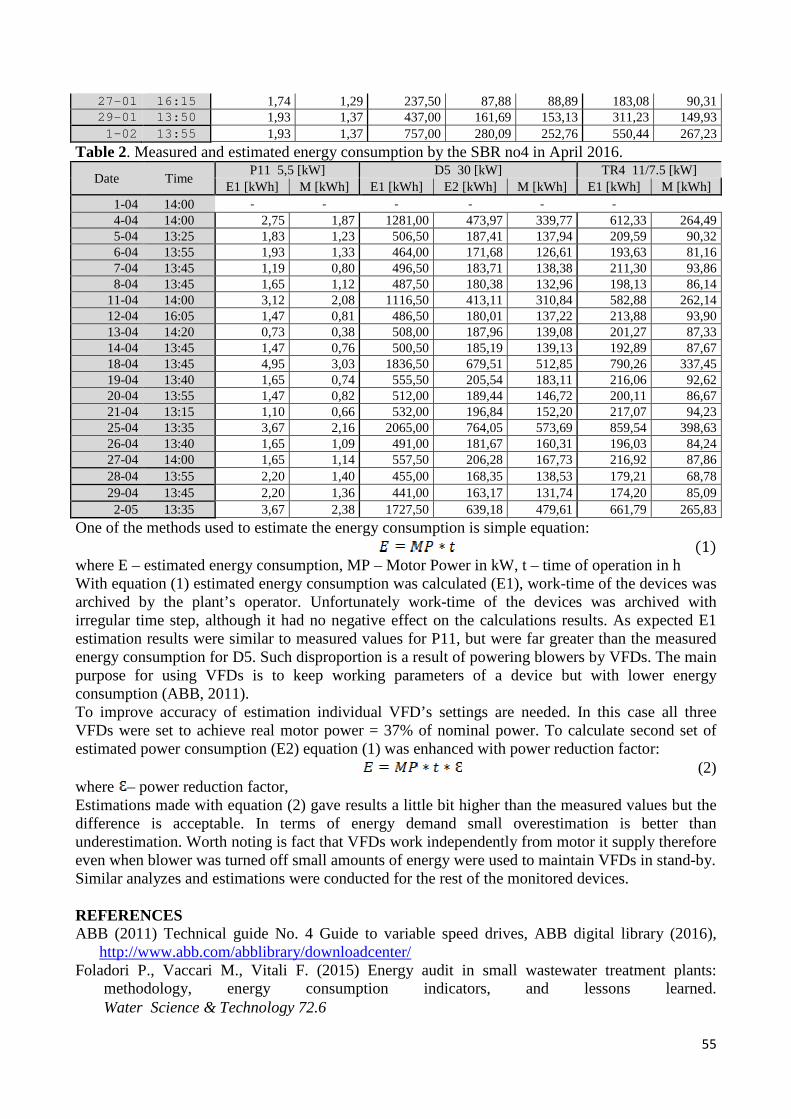
55
27-01 16:15 1,74 1,29 237,50 87,88 88,89 183,08 90,31 29-01 13:50 1,93 1,37 437,00 161,69 153,13 311,23 149,93
1-02 13:55 1,93 1,37 757,00 280,09 252,76 550,44 267,23
Table 2. Measured and estimated energy consumption by the SBR no4 in April 2016.
Date Time P11 5,5 [kW] D5 30 [kW] TR4 11/7.5 [kW]
E1 [kWh] M [kWh] E1 [kWh] E2 [kWh] M [kWh] E1 [kWh] M [kWh] 1-04 14:00 - - - - - -
4-04 14:00 2,75 1,87 1281,00 473,97 339,77 612,33 264,49 5-04 13:25 1,83 1,23 506,50 187,41 137,94 209,59 90,32 6-04 13:55 1,93 1,33 464,00 171,68 126,61 193,63 81,16 7-04 13:45 1,19 0,80 496,50 183,71 138,38 211,30 93,86 8-04 13:45 1,65 1,12 487,50 180,38 132,96 198,13 86,14
11-04 14:00 3,12 2,08 1116,50 413,11 310,84 582,88 262,14 12-04 16:05 1,47 0,81 486,50 180,01 137,22 213,88 93,90 13-04 14:20 0,73 0,38 508,00 187,96 139,08 201,27 87,33 14-04 13:45 1,47 0,76 500,50 185,19 139,13 192,89 87,67 18-04 13:45 4,95 3,03 1836,50 679,51 512,85 790,26 337,45 19-04 13:40 1,65 0,74 555,50 205,54 183,11 216,06 92,62 20-04 13:55 1,47 0,82 512,00 189,44 146,72 200,11 86,67 21-04 13:15 1,10 0,66 532,00 196,84 152,20 217,07 94,23 25-04 13:35 3,67 2,16 2065,00 764,05 573,69 859,54 398,63 26-04 13:40 1,65 1,09 491,00 181,67 160,31 196,03 84,24 27-04 14:00 1,65 1,14 557,50 206,28 167,73 216,92 87,86 28-04 13:55 2,20 1,40 455,00 168,35 138,53 179,21 68,78 29-04 13:45 2,20 1,36 441,00 163,17 131,74 174,20 85,09 2-05 13:35 3,67 2,38 1727,50 639,18 479,61 661,79 265,83
One of the methods used to estimate the energy consumption is simple equation: (1)
where E – estimated energy consumption, MP – Motor Power in kW, t – time of operation in h With equation (1) estimated energy consumption was calculated (E1), work-time of the devices was archived by the plant’s operator. Unfortunately work-time of the devices was archived with irregular time step, although it had no negative effect on the calculations results. As expected E1 estimation results were similar to measured values for P11, but were far greater than the measured energy consumption for D5. Such disproportion is a result of powering blowers by VFDs. The main purpose for using VFDs is to keep working parameters of a device but with lower energy consumption (ABB, 2011). To improve accuracy of estimation individual VFD’s settings are needed. In this case all three VFDs were set to achieve real motor power = 37% of nominal power. To calculate second set of estimated power consumption (E2) equation (1) was enhanced with power reduction factor:
(2) where – power reduction factor, Estimations made with equation (2) gave results a little bit higher than the measured values but the difference is acceptable. In terms of energy demand small overestimation is better than underestimation. Worth noting is fact that VFDs work independently from motor it supply therefore even when blower was turned off small amounts of energy were used to maintain VFDs in stand-by. Similar analyzes and estimations were conducted for the rest of the monitored devices. REFERENCES ABB (2011) Technical guide No. 4 Guide to variable speed drives, ABB digital library (2016),
http://www.abb.com/abblibrary/downloadcenter/ Foladori P., Vaccari M., Vitali F. (2015) Energy audit in small wastewater treatment plants:
methodology, energy consumption indicators, and lessons learned. Water Science & Technology 72.6

56
Drinking of tap water is smart, but how do it better? – A tap water quality research
A. Mika*, K. Sekuła*, M. Dendys*, W. Ptaszek* *Department of Hydrogeology and Geology Engineering, AGH University of Science and Technology, A. Mickiewicza 30, 30-059 Cracow (E-mail: [email protected])
QUALITY OF DRINKING WATER IN POLAND Drinking tap water has recently become popular. It is a way to fight with the tons of garbage (disposable, plastic bottles). However, many people are afraid of water quality. Drinking water in Poland must fulfill the requirements of Drinking Water Directive from 3 November 1998 (and Commission Directive (EU) 2015/1787 of 6 October 2015 amending Annexes II and III to Council Directive 98/83/EC) and also Regulation of Minister of Health of 13 November 2015 on the scope on the quality of water intended for human consumption. The specified threshold values for selected components should not be exceeded both at the initial point of water distribution as well as in the end-user. Many factors related to the water supply network and inner installation in the building influence on the concentration of chemical elements in water (Postawa et al, 2011) The research The research was performed in December 2015, during one week. 56 samples were collected. The samples were taken in different parts of the day and in the two types of building (old and new one). Samples were taken by two qualified operators. The first sample was collected at the morning at 6 a.m., before anyone uses the tap. The second one after the tap was rinsed and then the third one after 30 minutes stagnation. At the evening was taken one sample (after using the tap all day). The samples were described in table 1. Table 1. Description of samples Sample Where was collected? Description of sample
1 S and N (old and new building) Sample was taken at 6 a.m., without passing the stagnant water
2 S and N (old and new building) Sample was taken after the tap was rinsed (3 minutes)
3 S and N (old and new building) Sample was taken after 30 minutes stagnation
4 S and N (old and new building) Sample was taken after normal using the tap all day (6 p.m.)
Samples were transported at the day of sampling to the certified Hydrogeochemical Laboratory of Hydrogeology and Geology Engineering Department, AGH (certificate of accreditation No. AB 1050) and analyzed using ICP-OES and ICP-MS methods (according to PN-EN ISO 11885:2009 and PN-EN ISO 17294-2:2006). The physical components (pH, conductivity) were measured. The concentrations of hydrogen carbonate and chlorides were determined titrimetrically. The correctness of chemical composition analysis were verified by calculate analytical error based on the ion balance. According to Polish technical standard PN-89/C-04638/02, analytical error for this water should not exceed 5%. Average error of the analyzes do not exceed this value. Researches prove that the quality of water in Cracow is good, but concentrations of chemical components are different at the initial point of water distribution and by the consumers. The results

57
show also, that concentration of metals and related substances are mostly higher in the samples taken without passing the stagnant water in the water system. For example at figure 1 were presented differences between Cu concentration in old (S) and new (N) buildings, in morning samples, without passing the stagnant water in the water system (1) and after the tap was rinsed (2). The threshold value of Cu concentration is 2 mg/L (RMH, 2015).
Figure 1. Concentration of Cu in different samples. REFERENCES Commission Directive (EU) 2015/1787 of 6 October 2015 amending Annexes II and III to Council
Directive 98/83/EC on the quality of water intended for human consumption DWD, 1998, Drinking Water Directive – Council Directive 98/83/EC on the quality of water
intended for human consumption Postawa A., Witczak S., Kmiecik E., Wątor K. - Metals and related substances in drinking water in
Poland, AGH, Cracow 2011 PN–89/C–04638/02 Water and waste water – Ions balance of water – Methods of calculation (in
Polish) PN-EN ISO 17294-2:2006 Water quality — Determination of selected elements by inductively
coupled plasma mass spectrometry (ICP-MS) PN-EN ISO 11885:2009 Water quality — Determination of selected elements by inductively
coupled plasma optical emission spectrometry (ICP-OES) RMH Regulation of Minister of Health of 13 November 2015 on the scope on quality of water
intended for human consumption (Journals of Laws [Dz.U.] No.1989 – RMH 2015 c

58
Evaluation of the possibility of using the water of the Bystrzyca Nadwórniańska River in Czerniejów (Ukraine) to supply the population with drinking water
D. Pietrzak*, O. Mandryk**, K. Wątor*, E. Kmiecik* and A. Zelmanowych** * Faculty of Geology, Geophysics and Environmental Protection, Department of Hydrogeology and Engineering Geology, AGH University of Science and Technology, Adama Mickiewicza 30 Av., 30-059 Cracow (E-mail: [email protected]; [email protected]; [email protected]) ** Ivano-Frankivsk National Technical University of Oil and Gas, ul. Karpacka 15, 76019 Iwano-Frankiwsk, Ukraine (E-mail: [email protected])
INTRODUCTION The article presents the results of the research carried out in order to assess the possibility of using surface water of the Bystrzyca Nadwórniańska River in Czerniejów (western Ukraine), for the public supply of water intended for human consumption. Methods In this study an existing database that contains the results of analyzes of surface water samples collected in 1999 – 2014 was used. Each year, from 8 to 13 samples were collected from the Bystrzyca Nadwórniańska River in Czerniejów, in accordance with the procedure described in the international standard (ISO 5667-3, 5667-6, 5667-14). In the analyzes the results for samples collected in the years 1999, 2002, 2005, 2008, 2011 and 2014 were selected. The pH value and temperature were measured in the field. The analysis in the laboratory included determination of alkalinity, hardness, dissolved oxygen, BOD5, COD, suspended solids, odor and ions: Ca, Mg, Na, K, Fe, NO2, NO3, Cl, SO4, Cu , PO4, HCO3. These chemical analyzes were verified by calculation of errors based on the ionic balance. The results of the analyzes were referred to the polish applicable requirements for surface water used for public supply of water intended for human consumption, specified in Regulation of the Minister of Environment of 27 November 2002 (RME 2002). In addition, results were compared with the limit values for the classification of physico-chemical elements specified in the Regulation of the Minister of Environment of 21 July 2016 regarding the classification of the surface water status and environmental quality standards for priority substances (RME 2016). Results The results indicate that water of the Bystrzyca Nadwórniańska River in the area of Czerniejów was out of the class due to exceeding the limit values for class A3 for Cu. The high Cu concentration are observed in the years 1999 and 2002. In next years, the copper concentration was not measured, although they should be further controlled. Other indicators are in the range of limit values for the class A1, hence these waters could be used for human consumption. On the basis of incomplete assessment of the status of the Bystrzyca Nadwórniańska River water (due to the tests limitation to the physical and chemical components) determined that the water has a bad state because it exceeded the limits for class II for Cl, SO4 and COD. In the samples collected in 1999 and 2002 is also observed exceeding the maximum limit concentrations for Cu.

59
REFERENCES PN-EN ISO 5667-3:2013-05 Water quality -- Sampling -- Part 3: Preservation and handling of
water samples, Polski Komitet Normalizacyjny, Warszawa. PN-EN ISO 5667-6:2016-12 Water quality -- Sampling -- Part 6: Guidance on sampling of rivers
and streams, Polski Komitet Normalizacyjny, Warszawa. PN-EN ISO 5667-14:2016-11 Water quality -- Sampling -- Part 14: Guidance on quality assurance
and quality control of environmental water sampling and handling, Polski Komitet Normalizacyjny, Warszawa.
Regulation of the Minister of the Environment on the requirements to be met by surface waters used to supply the population with drinking water. Dz.U. 2002.204.1728.
Regulation of the Minister of the Environment on the classification of surface water bodies status and environmental quality standards for priority substances. Dz.U. 2016.1187.

60
Use of absorbance UV to interpret transformations of organic compounds during filtration by biologically active carbon filters - experiments of pilot scale technological investigations D. Holc*, A. Lewicka*, A. Pruss**, M. Komorowska –Kaufman** * Doctoral studies „Construction and the environment” Poznan University of Technology, Faculty of Civil and Environmental Engineering Institute of Environmental Engineering, ul. Berdychowo 4, 60-965 Poznań (E-mail: [email protected]) ** Poznan University of Technology, Faculty of Civil and Environmental Engineering, Institute of Environmental Engineering, ul. Berdychowo 4, 60-965 Poznań
SUMMARY Organic compounds commonly found in the waters, they can react with other pollutants and contribute to the formation of by-products of oxidation. In order to obtain the required quality of water intended for human consumption and the introduction to the water mains biologically stable water, it is necessary to efficiently remove these substances from the water. In addition to traditional methods for removing organic compounds from water, such as: coagulation, adsorption, chemical oxidation, more often at water treatment plants used filtration through a biologically active carbon filter. The advantage of filtration through of biologically active filter over other methods is the ability to convert the biodegradable fraction of organic compounds to form a readily assimilable by microorganisms (Świderska-Bróż, Wolska, 2011; Gibert et al., 2015; Holc et al., 2016; Seredyńska-Sobecka et al., 2006; Zhu et al., 2010). Materials and methods Technological research in order to eliminate organic compounds from water, were conducted in pilot-scale the system consisting of two filtration column with a height of 300 cm and an internal diameter of 100 mm. To maintain a constant temperature over the entire height of the filter bed, the column was placed in a water jacket, to prevent the growth of algae, hidden behind a black geotextile. Filtration bed with a height of 210 cm, was the activated carbon WG-12. Filtered dechlorinated Poznan tap water. The system was launched in April 2015 and is still operated. The columns filters, which were conducted studies differed among themselves how to activate the filter bed (a. Holc et al., 2016) and identified microorganisms colonizing it (b. Holc et al., 2016). Water samples for analysis were taken flow and return of the filter columns and vertical section. The efficiency of the elimination of organic compounds from the water was evaluated by the following parameters: COD (KMnO4), the concentration of dissolved oxygen, total organic carbon (TOC), pH, alkalinity and the UV absorbance at different wavelengths: 204 nm, 254 nm, 356 nm and 436 nm. Results UV absorbance allows the determination of organic compounds indirectly, which have a high content of aromatic rings. They are considered to be precursors of disinfection by-products or oxidation. Its value is often interpreted as an indicator of activated aromatic rings, which allows the prediction of the reactivity of the aromatic components in the chlorination (Mołczan et al., 2006). The variable UV254 absorbance in water, in the present study period for both study filtration columns, confirmed the high efficiency of removal of organic contaminants. In this study also observed, in the interdependence relationship of the absorbance measured at different wavelengths.

61
Correlation occurs allows for indirect information about the organic substances contained in the tested water and the changes which they are subject to. Ratios UV254 / UV204 and UV254 / UV436 in both filters, had a very low value, which demonstrates high efficiency of removal of aromatic organic compounds by biodegradable. The ratio UV254 / UV356 allows you to track changes in the particle size of dissolved organic matter. Throughout analyzed period study above ratio was maintained at a constant low level, such a relationship is often observed in the presence of aromatic functional groups (Yan et al., 2012). In this article, the authors present the results of the research, with particular emphasis on the use of absorbance measurements at different wavelengths, since the launch of the model BAF in 2015 until now. Analysis of these results is a supplement to the information published in 2016 (b. Holc et al., 2016), and submit unpublished further research.
Keywords biologically active filter (BAF), organic compounds, biofiltration, UV absorbance, pilot scale technological investigation
REFERENCES Gibert O., Lefevre B., Teuler A., Bernat X., Tobella J. (2015) Distribution of dissolved organic
matter fraction along several stages of a drinking water treatment plant, Water Process Engineering, nr 6, 64-71.
Holc D., Pruss A., Michałkiewicz M., Cybulski Z. (2016) Effectiveness of organic compounds removing during water treat-ment by filtration through a biologically active carbon filter with the identification of microorganisms.. Rocznik Ochrona Środowiska, Vol. 18, 235-246 (article in polish).
Holc D., Pruss A., Michałkiewicz M., Cybulski Z. (2016) Acceleration of carbon filters activation - experiments of pilot scale technological investigations. Water supply and water quality. 683-703 (article in polish).
Mołczan M., Szlachta M., Karpińska A., Biłyk A. (2006) Water quality assessment in terms of specific UV absorbance. Ochrona Środowiska, Vol. 28, Nr 4, 11-16 (article in polish).
Seredyńska-Sobecka B., Tomaszewska M., Janus M., Morawski A. W. (2006). Biological activation of carbon filters. Water Research, Nr 40, 355-363.
Simpson D. R. (2008). Biofilm processes in biologically active carbon water purification, Water Research, Nr 42, 2839-2848.
Świderska-Bróż M., Wolska M. (2011) Efficiency of surface water treatment processes at removing biodegradable organic substances, Ochrona Środowiska, Vol. 33, nr 4, 77-80 (article in polish).
Yan M., Korshin G., Wangc D., Cai Z. (2012) Characterization of dissolved organic matter Rusing high-performance liquid chromatography (HPLC)-size exclusion chromatography (SEC) with a multiple wavelength absorbance detector, Chemosphere, Vol. 87, 879-885.
Yan M., Dryer D., Korshin G. (2016) Spectroscopic characterization of changes of DOM deprotonatione-protonation properties in water treatment processes. Chemosphere, Vol. 148, 426-435.
Zhu I. X., Getting T, Bruce D. (2010) Review of biologically active filters in drinking water applications, AWWA 2010, 102:12, 67-77.

62
Natural Organic Matter in water, its significance and ways of removal – a review
P. Miller* *Politechnika Krakowska im. Tadeusza Kościuszki, Wydział Inżynierii Środowiska, ul. Warszawska 24, Kraków 31-155, Poland, (E -mail: [email protected]))
INTRODUCTION Natural Organic Matter (NOM) is, by definition, a complex matrix of carbon-based compounds, that is present in all natural waters, especially the surface ones (Bekbolet et al. 2005). Most of those compounds are the results of biodegradation processes (and processes related with biodegradation) of living organisms and their waste products. In general, their presence in natural waters is a result of the interactions between the hydrologic cycle and the biosphere and geosphere (Bhatnagar et al. 2016). The amount, composition, as well as characteristics of NOM compounds vary a lot in waters of different origin; this differentiation comes from geological, chemical, biological, climatic and other type processes in the environment surrounding water source (Matilainen et al. 2010). Moreover, also topographic and seasonal conditions, as well as various weather phenomena (e.g. heavy rains) may have an impact on NOM. The presence of NOM compounds causes several sanitary problems, which have to be dealt with in order to make the water suitable for domestic use. In other words: NOM compounds significantly deteriorate the sanitary quality of water, through for example: causing taste, odor and color or increasing chemical demand for coagulation, oxidation and disinfection (Bhatnagar et al. 2016). Sanitary problem, that has to be considered the greatest one among all the problems generated by NOM presence, is: generation of the so-called “disinfection by-products” (DBPs). Many NOM compounds, through reaction with oxidizing substances used as disinfectants in water treatment facilities, create various toxic compounds, such as: trihalomethanes (THMs) or haloacetic acids (HAAs). These compounds pose a great threat to human health – research has proven many of them to be mutagenic and/or carcinogenic, and so their presence in tap water is unacceptable (Bekbolet et al. 2005). From that fact arises the necessity of removing NOM compounds from treated water before it reaches consumers. This article is a review of the subject, including the division of NOM compounds through different criteria, the effects of their presence in water from sanitary point of view and ways of removing them from the water used in modern water treatment. KEYWORDS Natural organic matter; tap water; sanitary problems; disinfection by-products; trihalomethanes; haloacetic acids; water treatment Effects of NOM presence The presence of NOM compounds in water intended to domestic use (tap water) may lead to the occurrence of many serious sanitary problems, such as:
1) color, odor and taste of the water,

63
2) higher corrosivity, 3) greater concentration of microorganisms, 4) greater concentration of other organic contaminants, as well as heavy metals (through
adsorption on NOM particles), 5) enhanced fouling (if membrane filtration technology is used for water treatment), 6) increased chemical demand for coagulation and disinfection (sometimes also oxidation), 7) creation of the so-called “disinfection by-products” (DBPs), e.g. trihalomethanes (THMs).
From sanitary point of view, the most important problem is the last one – creation of DBPs. Currently, more than 600 toxic DBPs have been identified (Matilainen et al. 2011), most of them are carcinogenic and/or mutagenic.
Figure 1. Hypothetical molecular structure of a humic acid. REFERENCES Bekbolet M., Uyguner C. S., Selcuk H., Rizzo L., Nikolaou A. D., Meriç S., Belgiorno V.,
Application of oxidative removal of NOM to drinking water and formation of disinfection by-products, Desalination, vol. 176, 2005, 155–166.
Bhatnagar A., Sillanpää M., Removal of natural organic matter (NOM) and its constituents from water by adsorption – A review, Chemosphere, vol. 166, 2017, 497–510.
Matilainen A., Gjessing E. T., Lahtinen T., Hed L., Bhatnagar A., Sillanpää M., An overview of the methods used in the characterisation of natural organic matter (NOM) in relation to drinking water treatment, Chemosphere, vol. 83, 2011, 1431–1442.
Matilainen A., Vepsäläinen M., Sillanpää M., Natural organic matter removal by coagulation during drinking water treatment: A review, Advances in Colloid and Interface Science, vol. 159, 2010, 189–197.

64
Composting sewage sludge with solid fraction of digested pulp from agricultural biogas plant
W. Czekała, J. Dach, J. Mazurkiewicz, J. Przybył, A. Lewicki, A. Smurzyńska and K. Kozłowski
Institute of Biosystems Engineering, Poznan University of Life Sciences, ul. Wojska Polskiego 28, 60-637 Poznan, POLAND (E-mail: [email protected])
INTRODUCTION One of the most important environmental issues is the management of waste, including disruptive by-products of wastewater treatment processes such as sewage sludge. Management of waste can take place using technologies compatible with sustainable development. Composting and biogas production can be mentioned as part of the biological conversion process. Composting is a controlled process of aerobic decomposition of organic matter with micro-organisms, carried out in pile or reactors. Among the advantages of this method are the significant reduction in the weight and volume of composted mixtures and the final product, compost, which is an organic fertilizer. Considering the high volume of nitrogen in sewage sludge in on the one hand, and the solid fraction of digested pulp in carbon on the other, it is possible to use them in the composting process. is As a result of oxygen decomposition processes compost hygienisation occurs. This is an important aspect of this process, since sludge is often a source of microbiological contaminants and helminths' eggs. PURPOSE OF RESEARCH The purpose of the study was to determine the possibility of composting sewage sludge in a mix with a solid fraction of digestate. METHODOLOGY Dehydrated municipal sewage sludge was composted with a solid fraction of the digested pulp from an agricultural biogas plant, located in Poland. Primarily corn silage, fruit pulp and distillery were used for the production of biogas in this installation. The compost mix consisted of 25 kilograms of sewage sludge and 20 kilograms of solid fraction of digestate in fresh mass. The dry weight of the sewage sludge was 14.56% and the solid fraction of digested pulp was 32.52%. The organic matter content in dry matter was 75.58% for sewage sludge and 92.94% for digested pulp, respectively. During composting the temperature changes, carbon dioxide emissions, dry matter and organic matter, pH, conductivity, and bulk density were monitored. The experiment included two Phases. Phase I took place in bioreactors and lasted until the cooling of the compost was complete. Phase II included compost maturation for a period of eight months. The experiment was carried out in laboratory conditions at the Ecotechnology Laboratory (Poznan University of Life Sciences). Bioreactors of 165 dm3 volume were used for the experiment equipped with equipment for monitoring the decomposition of organic materials in aerobic and anaerobic conditions.

65
Figure 1. Schematic diagram of the system for laboratory composting 1 – air supply pomp, 2 – flow meter and flow regulator, 3 – chamber of reactor, 4 – air cooler, 5 – cold water, 6,7 – condensate and leachate collectors. RESULTS The temperature of the composted mixture during the experiment ranged between 18 and 75.1ºC. Maximum values of carbon dioxide concentration of 11.7% were reported with the highest compost temperatures. During Phase I, a weight reduction of 45 kg to 31.4 kg was observed. Studies have shown that sludge with a solid fraction of digestate can be a suitable substrate for composting. This was proven among others by the reduction of organic matter from 93.45% at the beginning of the experiment to 78.32% after 69 days of the process. Knowing that sewage sludge is rich in nitrogen, it is important to keep in mind the appropriate proportions between components so as to avoid excessive ammonia emissions. INFORMATION ABOUT SOURCES OF FINANCING The work was created within the framework of the European Union project entitled: " Scholarship support for PH.D. students specializing in majors strategic for Wielkopolska’s development" Sub-measure 8.2.2 Human Capital Operational Programme, co-financed by European Union under the European Social Fund in 2012-2013 and 2013-2014 edition.

66
Influence of hydrodynamic disintegration on solubilization and bioavailability of sludge particulate material
A. Garlicka*, M. Zubrowska-Sudol*
* Department of Water Supply and Wastewater Treatment, Faculty of Building Services, Hydro and Environmental Engineering, Warsaw University of Technology, Nowowiejska 20, 00-653 Warsaw, PL (E-mail: [email protected]; msudol@ is.pw.edu.pl)
INTRODUCTION Nowadays, the development of technologies connected with the treatment of sewage sludge in wastewater treatment plants is an important research issue. More and more research papers deal with excess sludge disintegration in the context of increasing the anaerobic digestion process efficiency, obtaining better dehydrate effects of fermented sludge, reducing the amount of sewage sludge generated, intensifying biogenic compounds removal from wastewater, and obtaining the compounds of nitrogen and phosphorus (Huan et al., 2009, Wan et al., 2017). It is known that sewage sludge is characterized by a high content of organic compounds and biogenic compounds (nitrogen and phosphorus). If this sludge is subjected to a disintegration process, in the solid phase of the sludge dissolved organic compounds and dissolved nitrogen and phosphorus compounds are obtained (Żubrowska-Sudoł and Walczak 2015), which can be used for the above mentioned technological goals. In practice, the choice of a disintegration method is dictated, on the one hand, by the required disintegration efficiency and, on the other hand by the capital and operational costs of the system. It is proved that hydrodynamic sludge disintegration allows us to attained similar disintegration efficiencies to ultrasound methods at a much lower energy input (Biradar et al., 2010). However, very few reports have addressed this method of sludge disintegration. Hence, this paper presents a study with the goal of evaluating the impact of hydrodynamic disintegration on: i) matter solubilisation and bioavailability of sludge particulate material, ii) SCOD, VFA, STN and STP release and iii) determination of susceptibility of disintegrated sludge in hydrolysis and acidification processes. In the experiments we have conducted so far, the disintegration process has been conducted at energy density (ƐL) (represented in kJ per 1 litre of disintegrated sludge) of 70, 140, 210, 280 and 350 kJ/L. The purpose of these studies was to investigate the effects of disintegration at higher levels of ƐL. This parameter was varied in the range of 140 ÷ 700 kJ/L with increase of 140kJ/L at every stage. MATERIALS AND METHODS Thickened excess sludge (TS: 4.79÷5.44 %) disintegration was conducted in a lab device containing a multi-use rotor driven by a motor with a power of P = 2.2 kW, revolutions n = 2800/min (patent no.214335), installed in a 10 L tank as described in detail in (Żubrowska-Sudoł and Walczak 2014). The sludge was originated from a biological nutrient removal wastewater treatment plant (PE = 2 100 000). A 10 L sample of sludge was used for each disintegration and the process was conducted at a selected energy density. The experiment included the launch of 3 repetitions, each with a different batch of sewage sludge. Scope of the experiment included: temperature, SCOD, VFA, STN and STP. In addition, COD solubilisation and degree of disintegration (DD) were controlled. In order to determine the susceptibility of disintegrated sludge for hydrolysis and acidification processes, acidification batch tests were conducted. Tests were carried out in continuously stirred reactors of 1 litre volume for 48h at a constant temperature of 20°C. Every 24

67
hours followed changes of SCOD and VFA in filtrate (the filtrate was separated from the sludge by centrifuging and then filtrated with 0,45 µm filters). RESULTS It was observed that along with increasing energy density, at which the hydrodynamic disintegration process was conducted, the temperature of sludge increased significantly. It escalated from an average of 11 to 84 ° C, respectively for the raw sludge and the disintegrated at ƐL=700kJ/L. These results suggest that not only cavitation, but also temperature could be a factor causing destruction of activated sludge flocs.
During the pre-treatment, an increase in ƐL of hydrodynamic disintegration resulted in further solubilization of sludge particulate material. Therefore, significant increase of SCOD, VFA, STP, STN was observed. Accordingly the concentration of SCOD, VFA, STP, STN increased from 354mgO2/L, 31 mgCH3COOH/L, 108 mgP/L, 247 mgN/L for raw sludge to 17530 mgO2/L, 745 mgCH3COOH/L, 273 mgP/L, 3417 mgN/L for disintegrated sludge at ƐL=700kJ/L. Moreover, an increase of COD solubilisation was observed from 3 to 42% for the disintegrated sludge at ƐL=140 and 700kJ/L, with a marked slowdown in COD solubilisation growth for ƐL=560kJ/L. In addition, it was noted that the maximum increase in COD solubilisation occurred when DD was ranging from about 60 to 90%. Moreover, it was documented that anaerobic hydrolysis and acidification of the disintegrated sludge (for all tested ƐL), allowed for higher VFA concentrations against the value of this indicator at the start of the experiment (before hydrolysis). Similar observations were made for SCOD but only for sludge disintegrated at 140 and 280kJ/L. The submission of disintegrated sludge to hydrolysis and acidification processes at higher levels of energy density, did not contribute to the extra charge of SCOD. CONCLUSIONS 1. Hydrodynamic disintegration can be an effective method for increasing of solubilization and
bioavailability of sludge particulate material. 2. The degree of solubilization is highly depended on disintegration degree and the related energy
density at which the process of hydrodynamic disintegration was carried out. 3. Sludge disintegrated at various levels of energy density have different susceptibility to hydrolysis
and acidification process.
REFERENCES Biradar, P.M., Roy, S.B., D’Souza, S.F., Pandit, A.B. (2010) Excess cell mass as an internal carbon
source for biological denitrification. Bioresource Technology, 101, 1787-1791. Huan, L., Yiying, J., Mahar, R.B., Zhiyu, W., Yongfeng, N. (2009) Effects of ultrasonic
disintegration on sludge microbial activity and dewaterability. Journal of Hazardous Materials, 161, 1421-1426.
Wan, C., Ding, S., Zhang, C., Tan, X., Zou, W., Liu, X., & Yang, X. (2017) Simultaneous recovery of nitrogen and phosphorus from sludge fermentation liquid by zeolite adsorption: Mechanism and application. Separation and Purification Technology, 180, 1-12.
Zubrowska-Sudol, M., Walczak, J. (2014) Effects of mechanical disintegration of activated sludge on the activity of nitrifying and denitrifying bacteria and phosphorus accumulating organisms. Water Research, 61, 200-209.
Zubrowska-Sudol, M., Walczak, J. (2015) Enhancing combined biological nitrogen and phosphorus removal from wastewater by applying mechanically disintegrated excess sludge. Water research, 76, 10-18.
68
The rate of generation of hydrogen sulphide in sewage systems Z. Podraza*, B. Dąbrowska*, T. Żaba* * Institute of Water Supply and Environmental Protection, Cracow University of Technology, Warszawska street 24, 31-155 Cracow, Poland (E-mail: [email protected]; [email protected]; [email protected])
INTRODUCTION Hydrogen sulphide (H2S) is a flammable, explosive, malodorous and toxic gas which causes serious odour problems, corrosion of concrete, and a health risk to humans (Sharma et al., 2014; Sharma et al., 2013). Eliminating the damage caused by hydrogen sulphide emission is very expensive and costs a lot of money per year (Jiang et al., 2015). The rate of sulphate reduction depends on many factors such as: temperature, pH, presence of sulphates, quantity and quality of biodegradable organic matter, wastewater flow velocity or residence time in the sewage, type of sewer pipe, area-to-volume ratio of the sewer pipe, quality of wastewater, nature of biochemical processes in the bulk water, and biofilm or sediment on the inner wall of the sewer pipe (Hvitvet-Jacobsen et al., 2002; Jegatheesan et al., 2015; Park et al., 2014). The relationship between the most important parameters and sulphide accumulation is included in kinetic equations of sulphide formation (Huan et al., 2013). Empirical models There are a many of equations describing the kinetics of hydrogen sulphide generation inside sewage systems. The earlier models for estimation of hydrogen sulphide formation were empirical. (Nielsen et al., 1998)’ equations is one of empirical model and is given below:
,03.1)50( 20)-(T5.0
V
AtCODaS hs ⋅⋅−=∆
(1)
where: ∆S is formation of total sulphide (soluble and metal–associated) in pressure main [g S/m3], a, b are parameters characteristic for wastewater quality, COD is soluble Chemical Oxygen Demand, T is temperature [⁰C], th is anaerobic residence time of wastewater in the pressure main [hr], A is inside area of the wastewater pipe [m2], V is total volume of the wastewater pipe [m3]. There is still lack of one model which estimates the rate of hydrogen sulphide formation. The assessment of existing mathematical models is important to estimate generation of hydrogen sulphide in sewage systems. The aim of the research was the (Nielsen et al., 1998)’s empirical model applied to estimation of hydrogen sulphide generation rates from pressure pipework outlet at Złocień residential area. Material and methods The research work was conducted in Sewage Treatment Plant Cracow Płaszów II. The sewage samples were collected every two hours during twenty four hours period. Twelve samples were

69
collected and analysed. The values of Chemical Oxygen Demand (COD), Biochemical Oxygen Demand (BOD), temperature and the concentration of soluble sulphides in the wastewater in pressure pipework outlet from Złocień residential area in Cracow, at the Sewage Treatment Plant Cracow Płaszów II, were investigated. CONCLUSION The concentration of soluble sulphides in the wastewater was estimated by the (Nielsen et al., 1998)’s equation and compared with the experimental data. On the base of these calculations the value of parameter a in the (Nielsen et al., 1998)’s equation was calculated. The relative error of the values of the concentration of soluble sulphides in the wastewater in pressure pipework outlet from Złocień residential area in Kraków was below 20%. The research is the first step in determining the rate of formation of hydrogen sulphide from Złocień residential area in Sewage Treatment Plant Cracow Płaszów II. REFERENCES Dąbrowski W. (2004) Oddziaływanie sieci kanalizacyjnych na środowisko, Wydawnictwo PK,
Kraków, 2004, 56-57. Huan N. H., Hai N. X., Yem T., Tuan N. N. (2013) Factors effect to the sulphide generation rate in
the To Lich River, Vietnam, ARPN Journal of Engineering and Applied Sciences, 8(3), 190–199.
Nielsen P. H., Raunkjær K., Hvitved-Jacobsen T. (1998) Sulfide production and wastewater quality in pressure mains Water Science and Technology, 37(1), Great Britain, 1998, 97–104.
Hvitved-Jacobsen T., Vollertsen J., Yongsiri C., Nielsen A.H., Abdul_Talib S., Sewer microbial processes, emissions and impacts, 3rd International Conference on Sewer Processes and Networks, Paris, 2002, p.1–13.
Jegatheesan V., Abdikheibari S., Marleni N., Estimating hydrogen sulphide dissipation rate constant under the influence of different chemical dosing, International Biodeterioration and Biodegradation, 101 (2015), p.47–55.
Jiang G., Sun X., Keller J., Bond P.L., Identification of controlling factors for the initiation of corrosion of fresh concrete sewers, Water Research, 80 (2015), p. 30–40.
Park K., Lee H, Phelan S., Liyanaarachchi S., Marleni N., Navaratna D., Jegatheesan V., Shu L. (2014) Mitigation strategies of hydrogen suphide emission in sewer networks – A review. International Biodeterioration & Biodegradation, 95(2014), 251–261.
Sharma K., Derlon N., Hu S., Yuan Z. (2014) Modeling the pH effect on sulfidogenesis in anaerobic sewer biofilm. Water Research, 49, 175–185.
Sharma K., Ganigue R., Yuan Z.(2013) pH dynamics in sewers and its modelling. Water Research, 47, 6086–6096.
Vollertsen J., Nielsen A. H., Jensen H. S., Rudelle E. A., Hvitved–Jacobsen T. (2011) Modeling the corrosion of concrete sewers, 12th International Conference on Urban Drainage, Porto Alegre/Brazil.

70
Influence of the Wastewater Treatment Process on the Content of Fulvic Acids D. Łomińska*, A. M. Anielak* * Department of Environmental Engineering, Cracow University of Technology, 24 Warszawska, 31-155 Cracow, Poland (E-mail: [email protected] [email protected])
INTRODUCTION Following a rapid industrial growth, an increase of both wastewater volumes as well as their concentrations and types of pollutants have been observed. As a result of the wastewater treatment process, some pollutants are transformed into new substances, which may pass to the plant effluent. Humic substances (HS) that include soluble fulvic acids (FA) are commonly known as contaminants. The authors decided to analyze raw and treated sewage from a wastewater treatment plant (WWTP) for the content of FA. The study was conducted to assess the quantities of the substances discharged in relation to the input pollution load. FA in oxidation and disinfection process are precursors of chloroorganic compounds. The problem of discharge wastewater, which contains FA, is important, because of the amount and location of discharge treated sewage. METHODOLOGY OF RESEARCH The samples were collected directly from the primary and secondary effluent at the wastewater treatment plant. Sewage samples were taken from the treatment plant with technological sequences of biological treatment and sewage sludge treatment. FA were extracted from the collected material in a laboratory. FA were isolated from the collected samples in accordance with the procedure (Aiken et al. 1979, Anielak et al. 2016). The concentration of the FA solution was determined in a vacuum evaporator and was specified by the determination of dry residue. The analysis were performed in the certified laboratory EkotechLAB in Gdansk. RESULTS The wastewater sample had a volume of 50 L (primary effluent) and 339 L (secondary effluent). The acids isolated from the primary effluent had a concentration of FA equal 14.8 mg / L, while secondary effluent had a concentration of 5.2 mg/L; both samples had a dark brown colour. They were contaminated with inorganic substances (Cl, Si, Na, Ca, K, P, Mg, and Fe, Br). The ash content of the primary effluent was 11.55 %, and of the secondary effluent, it was 9.74 %, which indicated a large number of inorganic impurities, higher in the primary effluent. Table 1. Comparison of the properties of FA extracted from the primary and the secondary effluent from the WWTP.
Fulvic acids Ash Literature
Samples [mg/L] [%] [-] Primary effluent 14.8 11.55 (Łomińska, Anielak,
2017)
Secondary effluent 5.2 9.74 (Anielak, Kryłów, Łomińska, 2017)

71
Figure 1. Mass reduction in wastewater sample after primary and secondary treatment as a function of temperature [Author's work on the basis on (Łomińska, Anielak, 2017; Anielak, Kryłów, Łomińska, 2017)]. At an ash content of 11.55 % and 9.74 %, the weight of samples remained unchanged, despite the temperature rise up to 700 °C. The mass remained constant at a temperature of approx. 580 °C, which was slightly higher than the temperature specified in the applicable standards (550 °C). It can be shown that volatile substances are similar to primary and secondary effluents. The main aim of the study was to compare and assessment of the amount of substances discharged from the WWTP in comparison to the input pollution load. Studies have shown that effluent contain significant amounts of FA, which penetrated into the surface waters may be precursors of by-products of oxidation and disinfection used in stations treatment of surface water. REFERENCES Aiken, G. R.; Thurman, E. M.; Malcolm, R. L.; Walton, H. F. (1979) Comparison of XAD Macroporous Resins for the Concentration of Fulvic Acid from Aqueous Solution. Anal. Chim. Acta, 51, 1799-1803. Anielak A.M, Kryłów M., Łomińska D., (2017) Humic Acids Discharged from Municipal Sewage Treatment Plant - work submitted for publication. Anielak A., Polus M., Łomińska D., Żaba T. (2016) Biodegradacja kwasów fulwowych z wykorzystaniem osadu czynnego wzbogaconego archeanami. Przemysł Chemiczny, 95(1), 110- 113 Anielak A., Żaba T., Polus M., Beńko P., Bochnia T., Łuszczek B., (2016) Efektywność oczyszczania ścieków komunalnych w systemie SBR i Bardenpho. Przemysł Chemiczny, 95(2), 314-319 Łomińska D., Anielak A., (2016) Formation of humic substances - the case study of the ”Płaszów” WWTP at Kraków, The 8th Eastern European Young Water Professionals Conference, Leaving the Ivory Tower - Bridging the Gap between Academia, Industry, Services and Public Sector, 12- 14 May 2016- Gdańsk University of Technology – Poland Łomińska D., Anielak A., (2017) The Content of Fulvic Acids in The Primary Effluent at the Płaszów WWTP in Kraków, Eko-dok 2017, IX Konferencja Interdysyplinarne Zagadnienia w Inżynierii i Ochronie Środowiska, ES3 Web of Conferences 17, 00054

72
Analysis and modelling of Fixed-bed column operation for urea removal from human urine by adsorption onto coal fly ash M. Ganesapillaia*, Prithvi Simhab, Bonny Thawania, Chinmoy Deba a Mass Transfer Group, Chemical Engineering Department, VIT University, Vellore, Tamil Nadu, INDIA - 632014 b Swedish University of Agricultural Sciences, Department of Energy and Technology, Box – 7032, SE-75007 Uppsala, Sweden *Corresponding Author: Associate Professor, Department of Chemical Engineering, Chemical Engineering Department, VIT University, Vellore, Tamil Nadu, INDIA 632014. [email protected].
INTRODUCTION Wastewater management or the lack of it has a direct impact on urban development and food production (UN, 2017). Human urine accounts for 1% of the conventional wastewater volumetric flow but contributes approximately 80% of N and 50% of P (Lienart, 2007). These plant essential nutrients can be recovered from source separated human urine to aid the formation of a closed loop sanitation cycle (Ganesapillai et al., 2015). In a recent batch study (Simha et al., 2017) we demonstrated the potential of utilizing untreated coal fly ash in wastewater treatment by using adsorptive recovery of urea from synthetic urine solutions as the case study. RESULTS AND DISCUSSION The present study aims at the design of a continuous, large scale nutrient recovery unit for urine using a fixed-bed fly ash column. The following parameters were investigated (i) initial flow rate (2-6 L.h-1); (ii) bed height (20-80 cm); and (iii) initial concentration of adsorbate (20-100% v/v). In addition, the effluent N concentration was modelled via the column breakthrough using the Thomas, Adam-Bohart, Yoon-Nelson and Modified-dose response equations. Optimal column operation was attained at initial urea concentration of 80%, urine flow of 4 L.h−1 and fly ash bed depth of 40 cm which resulted in >80% urea recovery at equilibrium. Besides, column reusability was established by performing multiple cyclical adsorption–desorption runs over the exhausted ash. CONCLUSIONS The use of fly ash produced at thermal power plants as an adsorbent for nutrient recovery in wastewater treatment can potentially provide simultaneous utilization of two wastes – coal fly ash and wastewater. This study’s results provide significant insight into the development and engineering of post–source–separation treatment and recovery technologies for human urine. REFERENCES The United Nations World Water Development Authority Report (2017), Wastewater: The untapped resource. Simha, P., Ramanathan, A., Thawani, B., Jain, P., Hussain, S., & Ganesapillai, M. (2017). Coal fly ash for the recovery of nitrogenous compounds from wastewater: Parametric considerations and system design. Arabian Journal of Chemistry. Ganesapillai, M., Simha, P., & Zabaniotou, A. (2015). Closed-loop fertility cycle: Realizing sustainability in sanitation and agricultural production through the design and implementation of nutrient recovery systems for human urine. Sustainable Production and Consumption, 4, 36-46.

73
The influence of type of sampling container on the arsenic concentration variability in the geothermal water of the Bańska PGP-1 well E. Kmiecik*, P. Rusiniak*, K. Wątor* *AGH University of Science and Technology, Faculty of Geology, Geophysics and Environmental Protection, Department of Hydrogeology and Engineering Geology, Mickiewcza 30 Av., 30-059 Kraków, POLAND (E-mail: [email protected], [email protected], [email protected])
INTRODUCTION The main purpose of this paper is to present the influence of type of sampling container on a chemical composition variability of geothermal water. Existing research conducted on bottled waters showed that from the vessel walls to water stored in a bottle are transferred various pollutants, mainly the elements such as: As, Cr or Sb (Reimann et al., 2012; Carneado et al., 2015; Marcinkowska et al., 2017). The water with a natural high temperature can intensify this process. The object and the purpose of the experiment The experiment was conducted on the samples of geothermal water, collected from the Bańska PGP-1 well. It is located in the Bańska Niżna, Lesser Poland voivodeship (Kmiecik, Korzec; 2015; Mika, Korzec, 2015). The mineralization of investigated water is about 3 g/L, temperature on outflow is about 86°C, and the hydrogeochemical type is SO4-Cl-Na-Ca (Chowaniec, 2009). In accordance to a procedures established in PN-EN ISO 5667 norms series (e.g. PN-EN ISO 5667-11:2004; PN-EN ISO 5667-3:2013; PN-EN ISO 5667-6:2016-12; PN-EN ISO 5667-14:2016-11) and tips contained in the guidebook proposed by Witczak et al. (2013) and Zdechlik et al. (2013), the key element in research of chemical composition of groundwater is to fulfil the requirements ensuring representativeness of the collected samples. One of them is a selection of the appropriate sampling containers which should be characterized by chemical and biological neutrality relative to analysed indicators. In that experiment the samples of geothermal water were collected to glass and plastic containers in different colours. Parallel, the samples were collected to the standard PE containers adapted for the groundwater sampling. The analyses were conducted during 24 h and were repeated after the month of water storage in the selected for the experiment containers. Preliminary results of the experiment The analyses this kind set of samples allowed to evaluate the influence of material and colour of sampling container on the arsenic concentration variability in geothermal water samples. The results showed that there is a significant change in concentration of analysed component. After the month of water storage in chosen containers the concentration of arsenic increased few times depends on the kind of container which was used for sampling. REFERENCES Carneado S., Hernández-Nataren E., Sánchez-López J. F., Sahuquillo A., (2015), Migration of
antimony from polyethylene terephthalate used in mineral water bottles, Food Chemistry 166, p. 544-550.
Chowaniec J., (2009), Hydrogeology study of the western part of the Polish Carpathians, Biuletyn

74
Państwowego Instytutu Geologicznego 434: p. 1–98. Kmiecik E., Korzec K., (2015), Analysis of chemical composition stability of thermal water from
Bańska PGP-1 well, Podhale, Przegląd Geologiczny, vol. 63, no. 10/1, p. 830-833. Marcinkowska M., Lorenc W., Barałkiewicz D., (2017), Study of the impact of bottles material and
color on the presence of AsIII,AsV, SbIII, SbV and CrVI in matrix-rich mineral water — Multielemental speciation analysis by HPLC/ICP-DRC-MS, Michrochemical Journal 132, p. 1-7.
Mika A., Korzec K., (2015), Analysis of the concentration stability of metasilic acid in the thermal water from the Bańska PGP-1 well, Technika Poszukiwań Geologicznych, Geotermia, Zrównoważony Rozwój, no. 2 /2015, p. 89-96.
PN-EN ISO 5667-3:2013-05 Water quality -- Sampling -- Part 3: Preservation and handling of water samples, Polski Komitet Normalizacyjny, Warszawa.
PN-EN ISO 5667-6:2016-12 Water quality -- Sampling -- Part 6: Guidance on sampling of rivers and streams, Polski Komitet Normalizacyjny, Warszawa.
PN-EN ISO 5667-11:2004 Water quality -- Sampling -- Part 11: Guidance on sampling of groundwaters, Polski Komitet Normalizacyjny, Warszawa.
PN-EN ISO 5667-14:2016-11 Water quality -- Sampling -- Part 14: Guidance on quality assurance and quality control of environmental water sampling and handling, Polski Komitet Normalizacyjny, Warszawa.
Reimann C., Birke M., Filzmoser P., (2012), Temperature-dependent leaching of chemical elements from mineral water bottle materials, Applied Geochemistry 27, p. 1492-1498.
Witczak S., Kania J., Kmiecik E., (2013), Guidebook on selected physical and chemical indicators of groundwater contamination and methods of their determination, Biblioteka Monitoringu Środowiska, Warszawa.
Zdechlik R., Drzymała M., Wątor K., (2013), Practical aspects of water sampling in groundwater monitoring, Biuletyn Państwowego Instytutu Geologicznego 456: p. 659-664.

75
Fate of heavy metals in streams and retention tanks in the agglomeration of Gdańsk N. Nawrot (1990)*, K. Matej-Łukowicz (1990)* and E. Wojciechowska (1974)* * Department of Sanitary Engineering, Faculty of Civil and Environmental Engineering, Gdansk University of Technology, Narutowicza 11/12, 80-233 Gdańsk, Poland, (E-mail: [email protected])
ABSTRACT The inflow of pollutants from urbanized areas causes degradation of surface waters in the cities. The streams flowing through the cities receive surface runoff from surrounding areas and also act as receivers of the storm waters discharged from urban drainage systems. The major pollutant discharged with storm water runoff is suspended solids, however the runoff also contains heavy metals (zinc, lead, copper, cadmium, nickel), organics (BOD5, COD) and nutrients, pesticides etc, depending mainly on watershed characteristics [1]. According to the data published by the City of Gdańsk in 2009 [2] it was estimated that the load of pollutants discharged by the streams flowing through the city had the highest contribution in the total loads of pollutants (BOD5, total N and total P) discharged from the city area to the Gulf of Gdańsk (other contributors were municipal WWTP and industry). Increasing urbanization of the city contributes to the increase of surface runoff and loads of pollutants. Due to high eutrophication risk within the semi-closed Baltic Sea and, particularly, in the Gulf of Gdańsk, the water quality of the streams becomes an issue of special environmental concern. Part of pollutants carried by streams are deposited in the sediments accumulating in retention tanks. In Gdańsk, due to high difference of elevations inside the city area, reaching 150 m, retention tanks are built on the streams for flood protection purpose. There are altogether 49 retention tanks at the moment and new ones are planned. The assessment of the sediments quality is crucial for planning of their future disposal and at the same time brings the new insight on the distribution of pollutants in the urbanized watershed. In the article the preliminary results of analyses of the water samples (TSS, COD, , ammonia N, nitrates, total P, Zn, Pb, Cu and Cd concentrations) and sediments (N, P, Zn, Cu, Pb and Cd concentrations) carried out at two streams flowing through the area of Gdańsk will be presented. One of the streams is Oliwski Stream, flowing through the old Oliwa district and discharging to the Gulf of Gdańsk in Jelitkowo. Water samples will be collected from 5 sampling points located along the stream and sediments from 3 retention tanks will be analyzed. Another stream selected for analysis is Strzyża Stream flowing through Matemblewo and Wrzeszcz and discharging to the Dead Vistula river. The analyses will concentrate at the middle part of the stream, which is a densely urbanized area (5-6 water sampling points and 4-5 retention tanks). The results of analyses performed so far on Oliwski Stream are presented in Fig. 1 (water samples) and in Fig. 2 (sediment samples). The water quality of Oliwski Stream is good, though the concentrations of pollutants increase during rainfalls. The heavy metals content in the sediment tanks is at low to moderate level, comparing to geochemical criteria [3] or to German classification of sediments [4]. Among the analyzed heavy metals, the concentrations of Cu were on the highest level according to [3,4] and the highest concentrations were observed in the retention tank located in Stara Oliwa, were a number of copper roofs are present. The relationships of measured pollutants concentrations to the watershed characteristic will be analyzed.

76
Figure 1. Concentrations of NO3
-, NO2-, NH4, PO4
3- and Ptot in water collected from 5 points in Oliwski Stream
0
20
40
60
80
100
120
140
A B A B A B A B A B
Orłowska Chłopska Subisława Grunwaldzka Spacerowa
mg
/kg
s.m
.
Zn
Cu
Pb
Figure 2. Concentrations of Zn, Cu and Pb in sediment samples collected from retention tanks on Oliwski Stream. REFERENCES Bojakowska I., Sokołowska G., (1998) Geochemiczne klasy czystości osadów wodnych, Przegląd
Geologiczny, vol 46, nr 1. Grabarczyk K., Gwoździej-Mazur J. (2005). Analiza zanieczyszczeń ścieków opadowych ze zlewni
zurbanizowanych. Monografie Komitetu Inżynierii Środowiska PAN, 32/2005. LAWA-Arbeitskreis (1998) „Zielvorgaben” in Zusammenarbeit mit LAWA-Arbeitskreis
„Qualitative Hydrologie der Flieβgewässer”, Beurteilung der Wasserbeschaffenheit von Flieβgewässern in der Bundesrepublik Deutschland – Chemische Gewässergűteklassifikation, Berlin (1998)
Ładunek zanieczyszczeń odprowadzany do Morza Bałtyckiego (2011) Broszura informacyjna Urząd Miasta Gdańsk, niepublikowana.

77
Sorption of Ni(II) on surface of bed's grains used in iron and manganese removing filters
M. Tytkowska*, M.M. Michel*, L. Reczek* and T. Siwiec* (E-mail: [email protected]) * Faculty of Civil and Environmental Engineering, Warsaw University of Life Sciences – SGGW, Nowoursynowska 166, 02-787 Warszawa, Poland
INTRODUCTION In groundwater, heavy metals may exceed the standards for drinking water. It is possible to remove heavy metals on iron hydroxides and manganese oxides (Jeon et al. 2004; Han et al. 2006). Exceeding nickel is a problem for underground water treatment (Reczek et al. 2015). Hence the concept of nickel sorption in iron and manganese removing filters. CHARACTERISTICS OF RESEARCH MATERIAL Iron and manganese in coatings, presence of crystalline phases For determination of iron and manganese content and the type of crystalline phase was determined by XRD X-ray diffraction. In the coating covering bed from iron removing filter (FeRF) the crystalline phases were found: Fe(OH)3, Fe2O3, FeO(OH) hexagonal, MnO2 cubic. In the case of bed from manganese removing filter (MnRF) the following crystalline phases were found: Fe(OH)3 orthorombic, FeO(OH) orthorombic, Fe(OH)3, FeO hexagonal, MnO2 cubic, MnO2 hexagonal, MnO2 orthorombic. Both naturally formed coatings in groundwater treatment filters contain iron and manganese compounds and have a similar coating composition, which was related to the crystalline phases. The pyrolusite rock (G1 bed) was characterized by the manganese oxide crystalline phases: MnO2 tetragonal, MnO2 orthorombic, MnO2 hexagonal, MnO2, Mn2O3, Mn3O4 and the coating on the manganese dioxide modified quartz sand (MnQS) contained a small amount of crystalline phases: MnO2 hexagonal, MnO2 orthorombic. Determination of pHpzc pHpzc values were determined using the immersion method (Babić et al. 1999). The obtained results are shown in Fig. 1. On this basis, pHpzc values for materials were determined. The obtained results are for FeRF 7.54, and for MnRF 7.41, these are similar values. pHpzc for G1 material was 5.27, while for MnQS 5.44. These values are close to and lower than for naturally formed coatings, due to the presence of only manganese compounds, for which pHpzc is in the range of 1.5 - 5 (Murray, 1974). The pHpzc value depends on the type of oxides covering the bed. NICKEL SORPTION Method of sorption studies. Batch experiments were used for sorption tests, shaking under thermostatic conditions (283 K) for 24 hours. The initial concentration of the Ni(II) in solution was 5 mg L-1. The effectiveness of Ni(II) sorption on the tested materials was investigated as a function of the solution pH (4, 5, 6, 7, 8, 9). The pH was measured by potentiometric method before and after shaking the sample as well as the concentration of nickel by atomic absorption spectrometry (AAS). Effectiveness of nickel sorption

78
Results on nickel sorption are presented in Fig. 2. It has been found, that naturally formed coating in iron removing filters was characterized by the highest sorption efficiency (80-90%) in the wide pH range of solution. The sorption properties of bed naturally coated in manganese removing filter were weaker (35-45%). Lower Ni(II) removal efficiency was observed at pH close to the pHpzc values. The G-1 catalytic bed and MnQS, which contain only manganese oxides, was characterized by very low sorption efficiency, 0-7% and 5-10% respectively. The pH of the solution was not constant during the sorption experiment and tended to have a pH value at the zero charge point.
Figure 1. Determination of pHpzc of testing materials in KNO3 solutions (pHi - initial value; pHf - final value). Figure 2. The efficiency of Ni(II) sorption as a function of initial pHi in solutions. CONCLUSIONS Bed’s grains from iron and manganese removing filters have very similar properties: the iron and manganese content in coatings, crystalline phases and pHpzc values. The surface of catalytic bed G1 and the manganese dioxide coated quartz sand have similar properties: the presence only manganese oxides in crystalline phase and similar values of pHpzc, but lower than FeRF and MnRF. The highest sorption of Ni(II) on material from iron removing filter was occurred. Presumably, the iron presence in surface layer of grains has significantly increased the efficiency of Ni(II) sorption. The materials contains only manganese oxides were not effective for removing Ni(II) from water. REFERENCES Babić B., M., Milonjić S., K., Polovina M., J., Kaludierovic B., V. (1999) Point of zero charge and intrinsic equilibrium constans of activated carbon cloth, Carbon 37, 477-481. Han R., Zou W., Zhang Z., Shi J., Yang J., (2006) Removal of copper(II) and lead(II) from aqueous solution by manganese oxide coated sand I. Characterization and kinetic study, J. of Hazardous Materials, B 137, 384-395. Jeon B-H., Dempsey B. A., Burgos W. D., Royer R. A., Roden E. E. (2004) Modeling the sorption kinetics of divalent metal ions to hematite, Water Research, Nr 38, 2499-2504. Murray J. W. (1974) The surface chemistry of hydrous manganese dioxide, J. Colloid Interf. Sci. Nr 3, 357-371. Reczek L., Michel M., Siwiec T., Nowak P. (2015) Usuwanie manganu i niklu z wody ujmowanej w stacji wodociągowej w Seroczynie, Instal, Nr 1/2015, 42-44.

79
Preliminary assessment of the dependence the type of reverse osmosis membrane used in desalination process on the quality of obtained concentrate
B. Tomaszewska*, ** and M. Tyszer* * AGH - University of Science and Technology, Faculty of Geology, Geophysics and Environmental Protection, Mickiewicza 30 Av., 30-059 Kraków, Poland (E-mail: [email protected]; [email protected]) ** Mineral and Energy Economy Research Institute, Polish Academy of Sciences, Wybickiego 7, 31-261 Kraków, Poland (E-mail: [email protected])
INTRODUCTION Membrane processes, including reverse osmosis (RO) are commonly used as a preliminary water treatment to remove undesirable contents of geothermal waters, which often are highly mineralized, exhibit high carbonate hardness and elevated concentrations of silica, sulphates, strontium, barium and other macro and micronutrients. By means of reverse osmosis is possible to remove up to 99% or even more of dissolved ions, particles, colloids, organics, bacteria and pyrogens from the tested water (Tomaszewska, 2017). During the last years, membrane processes are considered as one of the most promising methods for desalination of geothermal water and to gain water which possible can be used for other purpose, for example for drinking purpose (Bonte, 2013; Gallup, 2007; Gude, 2016; Reddy, 2007; Tomaszewska, 2014). Observed in the world increase in the use of mineralized waters, increasingly strict laws and also economic and environmental aspects lead to seek new forms of efficient and sustainable management of wasted, mineralized waters, which potentially could be the source of many useful and valuable ingredients possible to future use, inter alia, for balneology purpose. Desalination market is powered by limited supply of water for drinking purpose and increasingly demand, in both intended for drinking, economic and balneological purposes (Bodzek, 2011). However, concentrate obtained from desalination of mineralized water using membrane processes, especially reverse osmosis, potentially could be uses as a source of products with balneological features (Tomaszewska & Szczepański, 2014). Undisputed advantage associated with the use of reverse osmosis process to concentrate mineralized water is to gain a good quality concentrate and also to obtain water with substantially reduced level of dissolved components possible for further use. The aim of this work is to examine the dependence the type of membrane used in reverse osmosis process on the quality of obtained concentrate. METHODS AND PROCESS TECHNOLOGY Geothermal water type The analyses were conducted on the example of mineralized water obtained from well oriented in the southern Poland. Water is characterized by increased mineralization and high value of conductivity (about 3.3 mS/cm), total hardness (about 655 mgCaCO3/L), elevated concentrations of sulphates (854 mg/L), calcium (194 mg/L), silica (61 mg/L) and magnesium (41 mg/L). The TDS of tested water was 2410 mg/L and concentration of metalistic acid was 79 mg/L.
80
Process technology The reverse osmosis processes were conducted using stirred cell device in the dead-end filtration system, at specific pressure (15 bar). The process consists in that all water is passed to membrane and contaminants are held in the membrane. The processes were carried out to obtain 50% recovery of feed water and the active area of the membrane was 35.25 cm2. For the tests were chosen two membranes: 30HR-440i membrane and BW30FR-400 membrane. RESULTS As a result of water concentrating in the reverse osmosis process with selected membranes, high quality of new product – concentrate has been obtained. For the first chosen membrane, the value of TDS of concentrated mineral water increased up to 3989.5 mg/L with 132.6 mg/L metalistic acid concentration. In the case of using second selected membrane TDS of concentrated mineral water increased up 4022.8 mg/L with 129.25 mg/L metalistic acid concentration. Also was observed significant increase of total hardness in concentrate: for the first membrane up to 1166.1 mg/L and for second up to 1111.5 mg/L. The use of different types of reverse osmosis membranes in conducted tests allow to obtain for both cases good quality concentrate with significantly increased value of TDS, mineralization and value of metalistc acid potentially possible for future use, but with visible differences in concentration of specific dissolved constituents. Acknowledgements The work presented was financed by the Polish National Centre for Research and Development, grant No 245079 (2014-2017). REFERENCES Bodzek M., Konieczny K. (2011) Usuwanie zanieczyszceń nieorganicznych ze środowiska
wodnego metodami membranowymi. Wyd. Seidel-Przywecki. Bonte M., van Breukelen B.M., Stuyfzand P.J. (2013) Temperature-induced impacts on
groundwater quality and arsenic mobility in anoxic aquifer sediments used for both drinking water and shallow geothermal energy production. Water Research, 47, 5088-5100.
Gallup, D. L. (2007) Treatment of geothermal waters for production of industrial, agricultural or drinking water. Geothermics 36, 473–483.
Gude V.G. (2016) Geothermal source potential for water desalination – Current status and future perspective. Renewable and Sustainable Energy Reviews 57, 1038-1065.
Reddy K.V., Ghaffour N. (2007) Overview of the cost of desalinated water and costing methodologies. Desalinaton, 205, 340-353.
Tomaszewska B., Pająk L., Bodzek M. (2014) Application of a hybrid UF-RO process to geothermal water desalination. Concentrate disposal and costs analysis. Archives of Environmental Protection 40 (3), 137-151.
Tomaszewska B., Rajca M., Kmiecik E., Bodzek M., Bujakowski W., Wątor K., Tyszer M. (2017) The influence of selected factors on the effectiveness of pre-treatment geothermal water during nanofiltration process. Desalination, 406, 74-82.
Tomaszewska B., Szczepański A. (2014) Possibilities for the efficient utilization of spent geothermal waters. Environmental Science and Pollution Research, 21:11409-11417.

81
Estimation of pollutants leaching from cement coating to water after pipe renovation based on laboratory experiments
A. Młyńska*, M. Zielina* * Cracow University of Technology, Faculty of Environmental Engineering, Institute of Water Supply and Environmental Protection, ul. Warszawska 24, 31-155 Cracow, Poland (E-mail: [email protected]; [email protected])
CEMENT MORTAR PIPE LINING One of the non-structural water pipe renovation method is cement mortar spraying (Rockaway, 2007). Although this technique has been known since nearly hundred years, still it is one of the most popular pipe renovation method in the world (Damodaran, 2005; Deb, 2002). Cement mortar coating has a numerous advantages, such as a relatively low cost of its performing (AWWA, 2011), providing active corrosion protection and self-healing ability of coating after cracks (Bonds, 2005). Disadvantages of cement mortar lining, among others, include the possibility of leaching aluminium and some heavy metals from the cement coating into the water and also potentially strong influence of cement on water pH (Deb, 2010). EXPERIMENTS The experiments under both static and dynamic conditions were carried out in a laboratory. The main purpose of the research was to elaborate the curves describing the dependence of leaching pollutants from the cement mortar coating on the diameter and the length of the freshly cemented water pipe. Elaborated leaching curves allow to determine an expected concentrations of aluminium at the end of the freshly cemented pipes. The experiments were performed simultaneously on the two separate test stands in a laboratory. The first of them, allowed for monitoring the leaching process of aluminium from the cement mortar lining into the water under static conditions. Whereas, the second test stand was operated under dynamic conditions. The experiments carried out under dynamic conditions enabled observing the leaching process of pollutants from the cement mortar lining to the flowing water, simulating more similar conditions to prevail after pipe renovation. Dynamic conditions during the experiments guaranteed the same pipe wall shear stress between the cement coating and the flowing water as in real conditions. RESULTS Results of the static experiments were verified based on the experiments carried out under dynamic conditions. Since dynamic experiments are much more laborious, such verification seemed to be meaningful. The similarity of both the results, based on static and dynamic experiments, would result in eliminating the necessity of performing tests under dynamic conditions, carrying out the experiments only under static conditions. Some differences between both results could be explained by the influence of shear stress between the flowing water and the cement layer. Based on the aluminium concentration tests in the water samples collected from the dynamic and static set-ups during the experiments, the cumulative leaching graphs were elaborated. From the
82
dynamic cumulative leaching graph, the growth in aluminum concentration at the end of the freshly cemented pipes with different lengths and diameters was counted. Finally, based on the elaborated dynamic leaching graph, the concentration of aluminium leached from the cement mortar lining expected at the end of the freshly cemented transit pipeline connecting the intake of drinking water from the Dobczyce reservoir to Cracow town after its possible renovation was counted. The calculations have shown that the risk of exceeding the limitation for aluminium concentration in water at the end of the renovated pipe is very small. REFERENCES American Water Works Association (AWWA). (2011) Internal corrosion control in water
distribution systems, Manual of water supply practices–M58, First Edition, AWWA, Denver 2011.
Bonds, R.W. (2005) Cement-mortar linings for ductile iron pipe, Ductile Iron Pipe Research Association, Alabama 2005.
Damodaran, N., Pratt, J., Cromwell, J., Lazo, J., David, E., Raucher, R., Herrick, Ch., Rambo, E., Deb, A., Snyder, J. (2005) Customer acceptance of water main structural reliability, AwwaRF, Denver 2005.
Deb, A., Hasit, Y.J., Schoser, H.M., Snyder, J.K., Loganathan, G.V., Khambhammettu, P. (2002) Decision support system for distribution system piping renewal, AwwaRF and AWWA, 2002.
Deb, A., McCammon, S.B., Snyder, J., Dietrich, A. (2010) Impacts of lining materials on water quality, Water Research Foundation, Denver 2010.
Rockaway, T.D., Ball, R.T. (2007) Guidelines to minimize downtime during pipe lining operations, AwwaRF, Denver 2007.
83
The Impact of the Way in Which the Inflow Is Connected With the Retention Reservoir on Required Volume
M. Nowak*, W. Dąbrowski*
* Institute of Water Supply and Environmental Protection, Faculty of Environmental Engineering, Cracow University of Technology,
SUMMARY The content is devoted to an analysis of a storm water reservoir operation. The reservoir is settled at the top of a sewer whose capacity is too low. Because of the construction of the reservoir, it is not necessary to enlarge the sewer cross section area. The way in which the sewer delivering storm water is connected with a storage tank is significant for predicting its required volume. The importance of this connection results from the fact that, in many cases of gravitational sewerage systems, the tank starts to accumulate storm water from the very beginning of a storm, while at the same time the sewer below the tank is not filled with storm water.
The first method of protecting the tank against this unwanted phenomena is the localization of the first storm water overflow at the beginning of the sewer whose capacity is too small. The discharge from this overflow is then directed to the storage tank. The second way of decreasing the storage tank volume is based on such constructions of a storage tank that result in a fast increase of the outflow rate. For all such constructions, the flow rate out of the storage tank rises quickly to the upper limit and then remains constant. The first innovation of such a tank construction patented in Poland is known under the name ‘Contract’. In recent years a whole range of retention tanks has been developed, including gravitational tanks of a rectangular form, sewers with expanded diameters serving as storage tanks, pumping-gravitational multi-chamber tanks and vacuum tanks. The differences in the construction details impacts both on the storage volume and the investment cost.
There are three approaches to dimensioning these kinds of storage tanks. The first, and more precise, is based on real-time modelling of rain precipitation, land runoff and the flows through the sewers. This method requires specific information about hundreds of storms, including precipitation intensity profiles, over time. Such detailed data, covering at least several years, are unknown in some countries, even for large towns, and in general are not available for small communities. Moreover, commercial and public domain software, such as Mike Storm Urban, SWMM and many others, have limited ability to model the construction of storage reservoirs. In the second approach, consultants use graphs for directly reading the volume of the storage tanks. Such graphs have been known for decades but they do not consider the constructional details of connecting sewers with tanks. The results of real-time sewerage modelling have proven that these graphs are inaccurate and even often misleading. In the third design approach, new subroutines are developed for source codes of existing real-time sewerage modelling software; such source codes are available for SWMM. These subroutines extend the ability of storage tanks modelling through the new opportunities that take into account the tank’s hydraulics structure and its cooperation with the sewerage systems. However, sewerage systems serving small communities are often not large enough to justify long and expensive rain

84
precipitation monitoring. Because of the lack of data referring to the history of rain precipitation, simple rational methods have been used for sewerage modelling, including design methods for small retention tanks dimensioning. The results of the calculations presented here refer to small communities in which these simple rational methods of modeling are applicable. An Excel application has been developed for analyzing the operation of the storage tanks construction impact on their cooperation with the sewerage systems. Storm period lengths applicable for designing water retention tanks are almost ever longer than the lengths of storms for which the upper sewers are calculated. This means that in rational design methods, the inflow in time into the tank can be modelled in the form of a trapeze. This form of inflow has been assumed for the results of the computations presented here. The required reservoir volume has been predicted for the outflow from the tank in the form of a circular sewer, located at different levels in comparison with the tank floor. The tank volume occupied by storm water has been predicted each time from a differential mass balance equation. Graphs presenting the changes in this volume over time are presented and the impact of the tank construction on the required volume is analyzed. REFERENCES Dąbrowski W. (2004) Oddziaływanie sieci kanalizacyjnych na środowisko, Politechnika
Krakowska, 2004. Dziopak J. (1992) Analiza teoretyczna i modelowanie wielokomorowych zbiorników
kanalizacyjnych. Monografia nr 125, Wydawnictwo Politechniki Krakowskiej, 1992. Dziopak J. (1984) Model matematyczny zbiornika retencyjnego kanalizacji deszczowej,
Politechnika Krakowska, 1984. Kaźmierczak B., Kotowski A., Dancewicz A. (2012) Weryfikacja metod wymiarowania kanalizacji
deszczowej za pomocą modelu hydrodynamicznego (SWMM) w warunkach wrocławskich. Ochrona Środowiska, 34(2) 2012.
Kotowski A. (2011) Podstawy bezpiecznego wymiarowania odwodnień terenów, Wydawnictwo Seidel-Przywecki, 2011.
Słyś D. (2008) Retencja i infiltracja wód deszczowych, Wydawnictwo Politechniki Rzeszowskiej, 2008.
Szeląg B., Mrowiec M. (2016) The methods of evaluating storage volume for single-chamber reservoir in urban catchment. Archives of Environmental Protection, 42(2), 20-25.

85
Municipal landfill as a source of humic substances polluting water
T. Orliński*, A. M. Anielak* * Department of Environmental Engineering, Institute of Water Supply and Environmental Protection, Cracow University of Technology, 24 Warszawska, 31-155 Cracow, Poland (E-mail: [email protected]) ** Department of Environmental Engineering, Institute of Water Supply and Environmental Protection, Cracow University of Technology, 24 Warszawska, 31-155 Cracow, Poland (E-mail: [email protected])
Keywords: humic substances, humic acids, fulvic acids, landfill, leachate
ABSTRACT The humic substances (HS) belong to natural organic contaminants that are commonly found in different environments. In the process of oxidation and disinfection HS are precursors of toxic substances, which cause a problem in many water treatment plants. In the sewage treatment plants, HS are not biodegradable and together with purified wastewater and are discharged into surface waters. One of important source of the formation of HS is the municipal landfill. In this thesis I test the amount of soluble HS i.e. humic and fulvic acids present in the leachate of Barycz landfill in Cracow. The extracted HS were subjected to a detailed analysis for the content of metals and IR spectrum analysis has also been done. The acids empirical indicators have also been determined in visible light, which are the quotients of absorption for specific wavelengths A4/A6 and A2/A3. Basing on elemental composition the C/O, C/H and C/N ratios have been determined. Based on the determined composition element ratios of C/O, C/H and C/N. The obtained data were compared with the characteristics specified in the literature proposed for the substance presents in surface waters.

86
Impact of land use on heavy metal contamination in the Dobczyce Reservoir area (south Poland) G. Zemełka*, M. Kryłów*, and E. Szalińska**
* Faculty of Environmental Engineering, Cracow University of Technology, Warszawska St. 24, 31-155 Cracow, Poland (E-mail: [email protected], [email protected]) ** Faculty of Geology, Geophysics and Environment Protection, Department of Environment Protection, AGH University of Science and Technology, Mickiewicza Av., 30, 30-059 Cracow, Poland (E-mail: [email protected])
INTRODUCTION Type of land use and its development are essential for the quantity and quality of material discharged from catchment to watercourse. Especially, in the areas where a surface run-off is a major concern during snow melt and rain periods due to the catchment slope. Since, suspended sediment load transported by a river or stream commonly represents a mixture of sediment derived from different locations and source types, a detailed assessment of contamination within the contributing catchment is required to assess its quality (Walling, 2005). The aim of this study was a preliminary assessment of heavy metal contamination in different types of the land use in the Dobczyce Reservoir area. This study constitutes a part of the major research project concerning fingerprinting method (Zemełka & Szalińska, 2016). STUDY AREA The investigations were performed in two locations of the Dobczyce Reservoir neighbourhood. The first one consisted of 4 sampling sites localized the Raba River outlet to the reservoir area, and in the second one sampling was performed in 4 sites of the Wolnica Stream catchment. Sampling locations were selected accordingly to the deployment of so-called “time integrated collectors” which are used in the fingerprinting project to collect suspended matter (Phillips et al., 2000). Furthermore, the location of the soil sampling sites responded to the different land use: forests, arable land, meadows and pastures, buildings (housing and industrial). In the Wolnica Stream catchment agriculture is the dominant activity. Arable land (42.6 %), meadows and pastures (42.1 %) cover most of the land, while forests only 9.4 %. Buildings (3.1 %) have the smallest contribution of land use structure. The Raba River is catchment with more diversified land use that dominates forests, which constitute 54.6 %. Arable land (18.4 %), meadows and pastures (1.9 %) and mixed crops (12.1 %) has a smaller share of the coverage area. Buildings cover 13 % of the total area (Corine Land Cover, 2017). METHODS The surface soil samples, from the depth 0-5 cm, were collected by hand from the selected sampling sites in March 2017. Laboratory work consisted of wet soil sieving, to isolate <63 µm size fraction and air drying. Samples (0.5 g) were mineralized in 10 ml of 65% HNO3 in close microwave system (Milestone Start D Microwave Digestion System) in 175°C for 10 min (EPA 3051 method). Metal measurements (Pb, Zn, Cd, Cu, Mn, Ni, Fe) were performed with the use of atomic absorption spectrophotometry.

87
RESULTS AND DISCUSSION Measured metal concentrations were compared with the guidelines values given by Ministry of the Environment Regulation from September 1, 2016 (Dz.U.2016.1395). Acceptable concentrations of heavy metals causing risk specifically relevant to the soil protection area based on land use for the respective types of land were not exceeded. Based on the collected samples it can be noticed that heavy metal concentrations vary between the land use in each catchment. In the Wolnica Stream forest sample concentrations of all investigated heavy metals were rather low, while the situation was slightly different in arable land 1 and 2 sample. However, the soil sample taken from the Raba River area buildings 1 and 2 (respectively industrial and housing) had very high concentration of almost all heavy metals, whilst the relatively low concentrations of almost all heavy metals were observed in meadows and pastures. Generally higher rates of contamination could be observed in catchment area with a more diverse land use structure, residential areas which depend strongly on human activity (especially municipal and industrial pollution). They may also be caused by other factors such as the presence of biological or geochemical barriers favoring the metals accumulation in the soil, the supply of groundwater rich in metals or natural weathering processes. As a consequence surface runoff leads to heavy metal suspended matter and sediment contamination. Thus, investigated heavy metals were also found in suspended matter and sediments in the Wolnica Stream and the Raba River, as well as in the Dobczyce Reservoir (Reczynski, 2010; Szarek-Gwiazda 2013; Zemełka, 2017). REFERENCES Corine Land Cover, http://land.copernicus.eu/pan-european/corine-land-cover/clc-2012, 3.03.2017
(in English). Phillips, J., Russell, M. and Walling D. (2000) Time-integrated sampling of fluvial suspended
sediment: a simple methodology for small catchments, Hydrological Processes, UK vol. 14, 2589-2602.
Reczynski, W., Jakubowska, M., Golas, J., Parker, A., Kubica, B. (2010) Chemistry of sediments from the Dobczyce Reservoir, Poland, and the environmental implications, International Journal of Sediment Research vol. 25, 28-38.
Rozporządzenie Ministra Środowiska z dnia 1 września 2016 r. w sprawie sposobu prowadzenia oceny zanieczyszczenia powierzchni ziemi, Dz.U.2016.1395, 1-84.
Szarek-Gwiazda E. (2013) Czynniki kształtujące stężenia metali ciężkich w rzece Rabie i niektórych karpackich zbiornikach zaporowych, Studia Naturae 60, Instytut Ochrony Przyrody PAN 2013.
Walling, D. (2005) Tracing suspended sediment sources in catchments and river systems, Science of the Total Environment, UK vol. 344, 159-184.
Zemełka, G. (2017) Contamination and environmental risk assessment of heavy metals in the sediments of the Dobczyce Reservoir and its tributaries, Geomatics and Environmental Engineering (in review).
Zemełka, G. and Szalińska, E. (2016) Suspended matter as water contaminant, 16th International Multidisciplinary Scientific Geoconference & Expo SGEM 2016, Conference Proceedings 30.06-6.07.2016, Albena, Bulgaria, Water Resources. Forest, Marine and Ocean Ecosystems, Hydrology & Water Resources vol. 1, 697-702.
88
Smart use of water in smart cities - possibilities or limitations? J. Bąk* * Institute of Water Supply and Environmental Protection, Cracow University of Technology, 24 Warszawska Street, Cracow PL (E-mail: [email protected])
INTRODUCTION Water is essential for human life and other living organisms. The need to save water is due, inter alia, to the paradigm of sustainable development. There are many ways to minimize the consumption of high quality water supplied by the water supply network. These include the simplest way, such as perlators and those complex, requiring additional installation, such as use of greywater and rainwater. Secondary water pollution Not only water deficit are dangerous. There is a possibility of secondary water pollution in the water supply network due to changes in network parameters (inter alia velocity). Changes in these parameters may occur due to reduced demand for water by residents and, as a result, reduced water flow - at the same pipe diameter. RESULTS The article includes a review with comparative analysis of various water supply classification systems for the tap fittings, such as the WELPS English program, the European WELL, or the Australian WELS standards. Several types of perlators and flow limiters were compared in the research section. This equipment was tested in the household. The possibilities of minimizing water consumption by using them was collated. In addition, the work also analyses the evolution of water consumption in Poland in recent years and their possible relationship with the threats quality of drinking water supplied to consumers. SUMMATION In implementing the directions for sustainable development and, in particular, sustainable consumption, it is extremely important to draw attention at the same time to the need to adapt existing infrastructure to the changing needs of society. REFERENCES http://www.bristan.com/wepls http://www.span.gov.my/index.php/en/contact-us/office-location-address http://www.well-online.eu/home/index.html?changelang=2 http://www.waterrating.gov.au/industry/regulations-standards

89
Drinking water supply without use of disinfecant
M. Rajnochova*, J. Rucka* and L. Tuhovcak*
* Brno University of Technology, Faculty of Civil Engineering, Institute of Municipal Water Management, Zizkova 17, Brno, Czech Republic (E-mail: [email protected])
ABSTRACT The proposed paper deals with the drinking water distribution systems which do not use chlorine-based disinfectants to secure the microbial safety of the delivered water. The first assessment of the water supply system (WSS) should be performed on the very beginning of the process in the moment when the operator starts thinking of the operation of the WSS without a chemical disinfection. Assessment of the water-supply system for the disinfection-less operation It needs to be assessed whether the WSS is suitable and safe for the above mentioned approach. This first assessment is based on the decision algorithm. In case of the positive result of the first assessment the gradual transition to drinking water distribution without a chemical disinfectant may be launched subsequently. It is a relatively long-time process which is based on several clearly defined procedures. The paper also presents the basic principles to perform the transition of the WSS to the disinfection-less operation. Implementation of the multi-barrier approach The article also describes the current knowledge and experiences of several WSS in the Czech Republic and abroad which are operated without the chemical disinfectants. In the countries, where the drinking water is distributed without any chemical disinfectant, the operators of the WSS rely on ensuring a sufficient number of barriers. These barriers oppose against ingress of pollution in the WSS. If the number of barriers is reliable enough then the drinking water can be distributed without any chemical disinfectant with the WSS. The concept of multiple barriers approach ensures safety of drinking water delivery in case of failure of one of these barriers. (Rosario-Ortiz, 2016) The WSS loses one of its security barriers in such a case when omitting the chemical disinfection and the associated loss of residual disinfectant in the network. Therefore, the reliability and functionality of the other barriers is essential. Overall risk – benefit assessment of the process Obviously not every WSS is suitable for ending the chemical disinfection and transition to operation without using a disinfectant. The decision can be made only on the basis of a detailed field survey of the various parts of WSS assessment and their technical condition. The source of water, water treatment (if included) and the distribution network objects need to be checked. A simulation of the selected indicators of the drinking water quality in the WSS is the inevitable part of the assessment (Korth, 2004; Kooij, 2014; Rajnochová, 2017; Kovář, 2014). In the paper the following topics will be presented:
• Advantages and disadvantages of drinking water distribution without a chemical disinfectant • Lessons learned from several WSS in the Czech Republic with this approach. • Decision algorithm of the first assessment for transition to supply of drinking water without
disinfectant. • Decision algorithm of transition to drinking water without disinfectant completed by
undesired events that may occur during this transition

90
REFERENCES Kooij, D. (2014) Microbial Growth on Drinking - Water Supplies, London: IWA Publishing, 2014. Korth A., Wrickle B. (2004) Entwicklung und Überprüfung einer Strategie zur Ablösung der
chemischen Desinfektion bei Sicherung mikrobiologisch stabiler Verhältnisse im Leitungsnetz. Abschlussbericht zum DVGW-Forschungsvorhaben W 18/00. (in German)
Kovář, J., Ručka, J., Andrš, O. (2014) Simulation Modelling of Water- supply Network as Mechatronic System. In Proceedings of the 16th International Conference on Mechatronics – Mechatronika 2014. 1. Brno: VUT v Brně, 2014. s. 697-700.
Rajnochová M. (2017) Zásobování pitnou vodou bez použití desinfekčního činidla. Diplomová práce. Vysoké učení technické v Brně, Fakulta stavební, Ústav vodního hospodářství obcí. Vedoucí práce Ing. Jan Ručka, Ph.D. (in Czech)
Rosario-Ortiz, F., Rose, J., Speight, V., Gunten, U. and Schnoor, J. (2016). How do you like your tap water?. Science, 351(6276), pp.912-914.
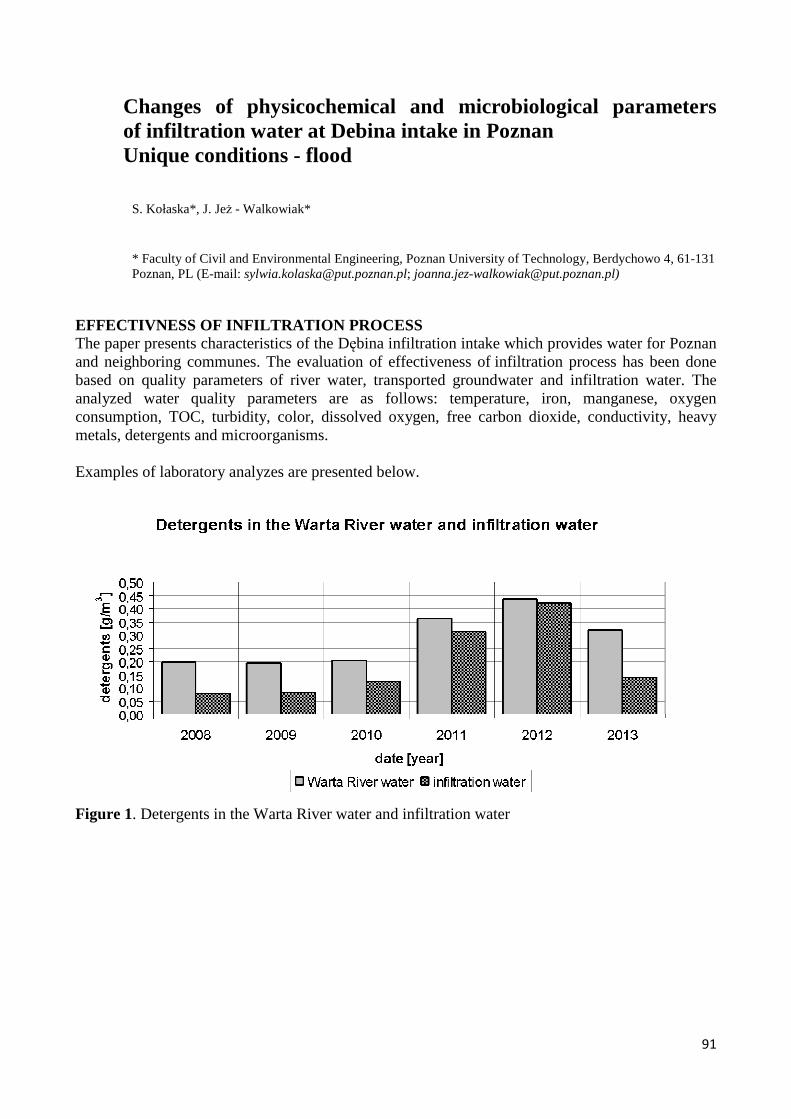
91
Changes of physicochemical and microbiological parameters of infiltration water at Debina intake in Poznan
Unique conditions - flood
S. Kołaska*, J. Jeż - Walkowiak*
* Faculty of Civil and Environmental Engineering, Poznan University of Technology, Berdychowo 4, 61-131 Poznan, PL (E-mail: [email protected]; [email protected])
EFFECTIVNESS OF INFILTRATION PROCESS The paper presents characteristics of the Dębina infiltration intake which provides water for Poznan and neighboring communes. The evaluation of effectiveness of infiltration process has been done based on quality parameters of river water, transported groundwater and infiltration water. The analyzed water quality parameters are as follows: temperature, iron, manganese, oxygen consumption, TOC, turbidity, color, dissolved oxygen, free carbon dioxide, conductivity, heavy metals, detergents and microorganisms. Examples of laboratory analyzes are presented below.
Figure 1. Detergents in the Warta River water and infiltration water

92
Figure 2. Lead in the Warta River water and infiltration water Unique conditions – flood The paper also includes an assessment of the impact of flood conditions on the quality of infiltration water and operation of infiltration intake. In this part of the paper the following parameters were taken into account: color, turbidity, TOC, nitrites, the total number of microorganisms in 36oC (mesophilic), the total number of microorganisms in 22oC (psychrophilic), coli bacteria, clostridia, Clostridium perfringens, enterococcus. Analyzing the effects of flood on infiltration process we came up with the following conclusions: the deterioration of infiltration water quality was due to the deterioration of river water quality, substantial shortening of groundwater passage and partial disappearance of the aeration zone. The observed deterioration of infiltration water quality did not affect the treated water quality, produced at water treatment plant.
93
Issues of the presence of parasitic protozoa in surface waters E. Hawrylik* * Division of Sanitary Biology and Biotechnology, Department of Civil and Environmental Engineering, Białystok University of Technology, Wiejska 45E, 15-351 Bialystok, Poland (E-mail: [email protected])
OCCURRENCE OF PARASITIC PROTOZOA IN SURFACE WATERS Parasitic protozoa are unicellular organisms in large numbers isolated from natural waters, soil, food and media fouled with excrement of animals and ill people. They are cosmopolitan, are found in all countries of world. They are playing a significant role in the proliferation of illnesses carried by water. Within these organisms, one of the most serious health risks for humans are intestinal protozoa of the genera Cryptosporidium and Giardia (Matuszewska, 2007; Bojar and Kłapeć, 2011). An increased prevalence of cryptosporidiosis and giardiasis they result from infecting people with parasitic protozoa and are taking place as a result of the direct or indirect contact through: − consumption of water contaminated with protozoa (drinking water, surface water, water in recreational pools, jacuzzi), − consumption the underdone contaminated food, − contact with objects, surfaces contaminated with excrement of people or animals infected with parasitic protozoa (WHO, 2011). Protozoa from the Cryptosporidium genera Protozoa from the Cryptosporidium genera are triggering in human and animal illness called cryptosporidiosis. They suffer from it mostly children and persons with the lowered body's resistance, where the disease can even lead to death. Cryptosporidium oocysts have a very high resistance to adverse external conditions. They are able to survive freezing in the temperature range from -15 to -20°C, whereas in the isotonic solution in temperature 4oC they are surviving even 18 months. In addition, the oocysts are particularly resistant to chlorine. Only during 4 hours at setting of 30 Cl2 mg/dm3 of water, was a decrease in the number of oocysts by 99% (Carey et al., 2004; WHO, 2011). Estimated data shows that from the sewage treatment plant serving about 50 thousand residents to the environment getting 65 million oocysts Cryptosporidium parvum per day, and in the liter of raw sewers it is possible to detect the minimum 14 000 oocysts (Butarewicz, 2013). According to WHO (2011) and Smith (1990) in cleaned sewers they were detecting Cryptosporidium in the range of 3.3 to 20 000 oocysts/dm3, in surface waters polluted with sewage from agricultural 0.006 – 2.5 oocysts/dm3, in recreational waters 0.66 - 500 oocysts/dm3, and in drinking water 0.006 - 4.8 oocysts/dm3. Protozoa from the Giardia genera Giardiasis like cryptosporidiosis occurs mainly in children and people with weakened immune systemic. Giardia infection is recognised too "illness of dirty hands". Some of the most common routes of transmission system must be: human - environment. Protozoa from the Giardia genera are located in the digestive tract of people and animals, and their vegetative forms (trophozoites) are found only in an body of the carrier. In disadvantageous conditions they are developing cysts which along with excrement are being expelled to the environment. They are resistant to environmental factors - in water at a temperature of 4 - 18oC can survive for three months, but only four days at 37°C (Niewiadomska, 2001).

94
SOURCES OF INFECTION OF WATER WITH PROTOZOA FROM TH E CRYPTOSPORIDIUM AND GIARDIA GENERA AND THEIR DETECTION Research on the occurrence of Cryptosporidium spp. and Giardia spp. in the environment are being led in Poland for over 30 years. These are not routine tests, and its range includes mainly the analysis of different types of water. The drinking water as the source of the transfer operation of pathogenic intestinal protozoa was examined by numerous authors. Frequent are also studies on the presence of parasitic protozoa in recreational waters - lakes or swimming pools. How they are giving Boyar and Kłapeć (2011) high contamination oocysts Cryptosporidium is stated in surface waters (83%), the lower percentage of positive attempts is stated in the water initially treated (13%) and waterworks (22%). With reference to protozoa from the Giardia genera polluting surface waters with cysts amounts to the 57%, however in case of initially treated and waterworks water is identical like in case of Cryptosporidium. The primary way to combat diseases caused by parasitic protozoa is the knowledge of their sources. Parasitic protozoa are getting to water as a result of pollutant which can come from council and agricultural sewage, natural fertilizers, as well as excrement of farmed animals and wild living (Polus and Kocwa-Haluch, 2009). Although the most serious source of contamination cysts and oocysts parasitic protozoa may be raw and cleaned sewage, unfortunately little research carried out in Poland involved in determining the size of Cryptosporidium spp. and Giardia spp. in the wastewater. Conducted processes of the sewage treatment aren't reducing the number, or the vitality of life stages dispersion protozoa (Polus and Kocwa-Halus, 2009). Therefore the detection, estimating the number and the species identification of parasitic protozoa in sewers is an important issue from a point of view of engineering and the environmental protection, as well as the health care. Not less an important aspect is a study effective methods of the decay of cysts and oocysts in cleaned sewers carried to waters of receivers.
REFERENCES Bojar H., Kłapeć T. (2011) Water as a potential source of human and animal infection with
protozoa of the genera Cryptosporidium and Giardia. Medycyna Ogólna i Nauki o Zdrowiu, 17(1), 045-051.
Butarewicz A. (2013) Organizmy patogenne w osadach ściekowych – ich wykrywanie i unieszkodliwianie. Oficyna Wydawnicza Politechniki Białostockiej, Białystok 2013.
Carey C. M., Lee H., Trevors J. T. (2004) Biology, persistence and detection of Cryptosporidium parvum and Cryptosporidium hominis oocyst. Water Research, 38, 818-862.
Matuszewska R. (2007) Protozoan pathogens of genus Cryptosporidium i Gardia. Part I. Occurrence in water environment and health risk. Roczniki Państwowego Zakładu Higieny, 58(3), 569-577.
Niewiadomska K., Pojmanska T., Machnicka B., Czubaj A. (2001) Zarys parazytologii ogólnej, Wydawnictwo PWN, Warszawa 2001.
Polus M., Kocwa-Haluch R. (2009) Detection of Cryptosporidium in wastewater by RFLP-PCR. Technical transactions Environmental Engineering, Issue 6, Year 108, 183-193.
Smith H.V. (1990) Environmental aspects of Cryptosporidium species: a review. Journal of the Royal Society of Medicine, 83(10), 629-631.
WHO (2011) Guidelines for Drinking - water Quality. 4th ed.

95
Impact of catchment area activities on water quality in small retention reservoirs
K. Oszczapińska*, I. Skoczko* and J. Szczykowska* * Department of Technology in Engineering and Environmental Protection, Bialystok University of Technology, Wiejska St. 45E, 15-351 Bialystok, Poland (E-mail: [email protected], [email protected], [email protected])
INTRODUCTION There is close relationship between surface water quality and its catchment area character. Chemical substances scouring, conditioned on the type of land use, geological substratum structure, kind of soil and climate conditions, has significant impact on chemical water components changes (Sidoruk and Skwierawski, 2006). Small water reservoir right functioning depends on water quality. Objects located in agricultural catchment are particularly exposed to fertilizers, pesticides and organic matter eluted from the soil. Small and medium reservoirs depth aids eutrophication. Often it comes to supply watercourse pollution (Górniak and Grabowska, 1998). The most common biogenes source in surface waters are, mentioned earlier, fertilizers used in agricultural catchments. Their influent on soils in catchment basin was tested by Czyżyk and Rajmund (2013), who after six-year studies proved that more nitrogen has permeated to the soil from mineral than natural fertilizers (Czyżyk and Rajmund, 2013). On the other hand, sylvan catchments exhibit smaller biogenic runoff thanks to forest cover absorption abilities (General Directorate of The State Forests, 2012). The aim of the study was to evaluate catchment area impact on small water reservoirs condition in Podlasie. RESEARCH METHODS Studies were conducted in two different catchment areas. Topiło reservoir, located in Podlasie area as a wooden logs store, but in 1975 tank was excluded from this type of use (Hajnówka Forest District unpublished data). Second reservoir, Dojlidy, is located also in Podlasie area, in the south-east of Białystok as a part of Dojlidy Ponds. In contrast to Topiło, Dojlidy has agricultural catchment. Water samples collected from five sites along each reservoir were analysed for the presence of total nitrogen and phosphorus, chlorophyll “a” , reaction, turbidity and conductivity. Researches took place in spring, summer and autumn 2013 (Topiło Lake) and 2014/2015 (Dojlidy). Moreover, due to recorded weather condition, correlation between analysed indicators and catchment basin was studied. RESULTS During the study period, the values of analysed indicators exhibited high variability and showed characteristic patterns of seasonal changes. To compare two examined reservoirs Carlson (1977) and Kratzer-Brezonik (1981) Trophic State Index was used. Because of low average deepness Secchi depth hasn’t been measured. TSI results are presented in Figure 1.

96
Figure 1. Trophic State Index in Topiło and Dojlidy reservoirs The lowest trophic state was observed in autumn and the highest in summer. Because of the high loads of phosphorus received by the reservoirs, this element did not limit primary production. TSI values calculated on the basis of total phosphorus were always markedly higher than calculated on chlorophyll-a and total nitrogen. Both reservoirs demonstrated TSI indexes specific to hypertrophic lakes due to large amount of total phosphorus. Despite agricultural activities in Dojlidy catchment basin, study analysis showed higher content of all examined water quality indicators in Topiło. This reservoir is burdened of organic matter from wooden legs stored in the past. About 40 years after the end of this type of use pollution is still at an elevated level. REFERENCES Carlson, R. E. (1977) A trophic state index for lakes. Limnology and Oceanography, 22, 2. 361-
369. Czyżyk, F. and Rajmund, A. (2013) Penetration of nitrogen into water as a result of fertilization of
light soil. Ecological Engineering, 33, 29-34. (In Polish) General Directorate of The State Forests. (2012) Principles of silviculture, State forests, Warsaw,
11-14. Górniak, A. and Grabowska, M. Primary production of phytoplankton in newly constructed lowland
reservoir in eastern Poland. International Rev. Hydrobiol., 83, 307-310. Hajnówka Forest District unpublished data. Kratzer, C. R. and Brezonic, P. L. (1981) A Carlson-type trophic state index for nitrogen in Florida
Lakes. Water Research Bull, vol. 17. Sidoruk, M. and Skwierawski, A. (2006) Effect of land use on the calcium, sodium, potassium and
magnesium contents in water flowing into the Bukwałd Lake. Ecol. Chem. Eng, 13, 337-343.
97
Monitoring of heavy metals in selected Water Supply Systems in Poland, in relation to current regulations
P. Zeuschner*, A. Szuster-Janiaczyk*, P. Noga, M. Skrzypczak, * Faculty of Civil and Environmental Engineering, Poznan University of Technology, 60-965 Poznań, ul. Piotrowo 3a (E-mail: [email protected])
INTRODUCTION Monitoring of heavy metals is an important part of water quality monitoring in Water Supply Systems because of health risk posed by these pollutants. To determine the actual concentration of heavy metals in drinking water, the quantity of water sampled and the frequency and location of the water samples shall be determined. The purpose of this paper is to present the monitoring of heavy metals in relation to current regulations, and world trends. Research objectives In the presented work, the way of a heavy metal monitoring analysis, was carried out for 3 Water Supply Systems (WSS-1,WSS-2,WSS-3). System WSS-3 is part of the larger water supply system, and two others are standalone systems. The characteristics of these systems are presented in Table1. Tabela 1. Characteristics of the examined Water Supply Systems WSS-1 WSS-2 WSS-3 The amount of water consumers
24. 150 30. 201 30. 493
Type of water intake 4 intakes-13 deep wells
4 intakes- 9 deep wells
2 intakes - groundwater and infiltration
Number of water treatment plants
3 SUW 3 SUW 1 SUW
Structure of the water supply network
Looped-branched Looped-branched Looped-branched
The length of the network
349,6 km 284,1 km 183,53 km
Network building materials
75,1% PVC; 17,95%PE;
6,85% cast iron , 0,15% ductile iron
72% PVC, 23% cast iron,
5% asbestos cement
-
Average daily water demand
3533 m3/d 3867 m3/d 4000 m3/d
Hydraulic conditions Velocity: 90% below 0.3 m / s
Velocity: 70% below 0,5m/s
-
Methodology This paper analyses the results of heavy metal monitoring from the following periods: for WSS-1 -1970÷2016; for WSS-2 - 2013÷2016; for WSS-3- 2012÷2014. The total number of analysed water samples is summarized in Table 2. The samples were taken in systems with high variability over

98
time. STATISTICA and Excel were used in the analysis of water quality test results. Table 2. The total number of analysed water samples (total / overview monitoring)
Number of samples WSS-1 WSS-2 WSS-3 Raw water (R) 17 66 551
Treated water (T) 33/2 212/32 1748/63 From network (N) 28/8 1298/32 389/0
Number of tested parameters 94 41 85 Number of heavy metals samples R / T / N * 3/15/8 0/0/0 504/63/0 *R/T/N- for raw water /for treated water / for water from network RESULTS The study analyses the conducted monitoring of heavy metals in relation to the applicable regulations. The analysis takes into account the number of samples, place and frequency of consumption and the value of the obtained parameters. According to Polish law, the required annual quantity of samples for all systems should be 16/2 (total/overview monitoring), but it was: 6/2,5 in WSS-1, 394/16 in WSS-2, and 896/21 in WSS-3. Table 3. The results of analyses the water from network
Unit
Average / min÷-max.
WSS-1 WSS-2 WSS-3 Copper [Cu mg/dm3] - - <0,0046/0,0013 ÷ <0,01 Lead [Pb µg/dm3] - - <1,66/<1 ÷ <4 Arsenic [As µg/dm3] - - <1 Chrome [Cr µg/dm3] - - <2,01/<1 ÷ <4 Mercury [Hg µg/dm3] - - <0,12/<0,1 ÷ <0,2 Cadmium [Cd µg/dm3] - - <0,13/<0,1 ÷ <0,3 Nickel [Ni µg/dm3] - - <2,62/<1 ÷ 7,7 DISCUSSION AND CONCLUSION Heavy metals are some of the parameters being in overview monitoring- performed less frequently. The largest group of samples and the largest number of heavy metal analyses were performed on treated water, which, due to the transition to the treatment process, does not reliably show metal concentrations in Water Supply System. For WSS-2, the average annual number of samples corresponds to the regulations, but monitoring heavy metals was not at all conducted. The average annual number of samples for WSS-1 did not meet the regulations. WSS-3 is part of a larger water supply system, what causes a large number of samples raw water and treated water, but negatively affects the number of samples collected from network – the heavy metal monitoring has been wholly shifted to a larger system. REFERENCES Regulation of Polish Minister of Health from 27.11.2015r. Quality of water intended for human
consumption (Dz. U. z 2015 r. poz. 139 i 1893). Postawa A., Witczak S., Metale i substancje towarzyszące w wodach przeznaczonych do spożycia
w Polsce (eng. Metals and related substances in waters intended for consumption in Poland), Akademia Górniczo-Hutnicza im. Stanisława Staszica w Krakowie, Kraków 2011.
Lead and Copper Rule Monitoring and Reporting Guidance for Public Water Systems, USEPA, 2010.
99
Influence of the length of the study period on the dimensioning of the usable capacity of main water tanks O. Woyciechowska*, T. Bergel * and B. Szeląg** * Department of Sanitary Engineering and Water Management, University of Agriculture in Kraków, al. Mickiewicza 24/28, 30-059 Kraków, Poland (E-mail:[email protected]; [email protected]) ** Faculty of Environmental, Geomatic and Energy Engineering, Kielce University of Technology, al. Tysiąclecia Państwa Polskiego 7, 25-314 Kielce, Poland (E-mail:[email protected])
ABSTRACT The philosophy of designing the usable capacity of network tanks dates back to the 1960s.
The methodology is based on knowledge of the volume of water supplied to the network and the character of its` consumption, taking into account all recipients. To determine the capacity, an analytical or descriptive method is used, where it is necessary to determine the daily maximum demand as well as the hourly distribution of water supply to the system. Values should be empirically defined, but if it is not possible, the textbooks refer to the 1966 Ordinance of the Minister of Agriculture containing water demand for individual purposes, coefficient of irregularity for daily water demand used for determining the maximum daily water demand, and demand types used for determine the percentage capacity of the tank.
The main problem highlighted by the designers is the lack of updating of the values given in the guidelines and the difficulty in obtaining the relevant operational data, which may have a negative impact on the determination of the tank capacity. The help does not come with the legal norm PN-EN 1508 of 2002 for systems and their components intended for water collection, which contains general statements without specific guidance.
The purpose of this article is to try to determine the minimum water consumption observation time, which allows for proper design of the usable capacity of the water tank.
The study was conducted in 2014-2015 in two water supply systems with the number of customers not exceeding 2500 people, located in the Cracow district. The registration of the water meter, installed on the drain line from the initial water tank, was full clock hours. Periods of varying length of observation were analyzed: from 1 month to 24 months.
For data analysis, cluster analysis and the k-median method, which are commonly used in many scientific fields, have been used, which is an innovative application for determining the mean hours of water demand distribution. The method allowed for separating two data groups, characterized by weekdays and holidays (Saturdays, Sundays, holidays).
The analysis showed that the difference in the percentage capacity, calculated for all periods, did not exceed 2.1% (object A) and 1.2% (object B). It was also noted that for each period of more than 6 months, for both objects, this difference was not more than 1%.

100
Figure 1. Changes in the percentage of tank capacity in objects A and B depending on the duration of the study
In order to determine a reliable period, the maximum daily demand in individual months was analyzed. The value of this demand, in excess of the average, occurred from VI - IX in object A and from V - IX in object B.
Thus, based on the analysis, it can be concluded that the optimum from the point of view of calculating the usable capacity of the water mains is the observation period of the water demand of at least six months. At the same time, the condition must be fulfilled that these months cover the period V - IX. Due to the fact that the research was a pilot study, it is recommended that they are continued in other water supply systems with different water abstraction characteristics.

101
The effects of the purification of the backwash water waste stream in the light of the phytotoxicity assessment of the coagulation products
E. Łaskawiec*, M. Dudziak* and J. Wyczarska-Kokot* * Institute of Water and Wastewater Engineering, Silesian University of Technology, St. Konarskiego 18, 44-100 Gliwice, POLAND (E-mail: [email protected]; [email protected]; [email protected])
THE OBJECTIVE OF THE RESEARCH The aim of the presented study was the analysis the effects of purification of coagulation process backwash water, extended by the assessment of the phytotoxicity of purified liquid samples and coagulation deposits formed in Phytotoxkit® phyto tests and the Lemna m. Growth Inhibition Test. The application of phytotoxicity assessment may constitute an important element when selecting a method for the management of swimming pool installation waste streams. The examined backwash water was made up by waste streams generated from the process of washing the pressure filters that constitute an integral element of the water treatment systems of the facility under investigation. THE STUDY AND THE METHOD Characteristics of the backwash water Backwash water from the circulations of various-purpose basins and varying values of physicochemical parameters was examined (Table 1). The coagulation process was conducted using a coagulant containing 8.2% of active aluminium Al3+ (PAX 16). A coagulant dose was selected experimentally in classic beaker tests comprising 1 minute's fast agitation process, 20 minutes' flocculation and 1 hour's sedimentation. Aluminium doses tested were: 7, 13 and 20 mgAl3+/L. Table 1. The selected physicochemical parameters of the washings
Physicochemical parameter
Unit The circuit swimming
pool The circuit of hot tub
Turbidity NTU 45.50 6.89
Absorbance UV254 m-1 12.30 13.40
Suspended solid mg/L 82.00 16.00
Total nitrogen mgTN/L 22.80 3.10
Total phosphorus mgTP/L 6.30 1.60
Phenol index mgC6H5OH/L 1.48 0.10
Chemical oxygen demand
mgCOD/L 69.00 25.00
Aluminium remained mgAl/L 0.32 0.88 Evaluation of phytotoxicity The phytotoxicity assessment of the coagulation process products was made in decanted liquids and filtrated coagulation deposits. The influence of liquid samples on the growth abilities of Lemna

102
minor was assessed based on either the inhibition of stimulation of the growth of fronds and morphological changes within them in 7-day tests. In turn, the phytotoxicity assessment of the deposits was made based on the Phytotoxkit® biotest, which used Lepidium sativum and Sinapis alba for the evaluation of the germination inhibition and root growth of plants in 72-hour tests. INVESTIGATION RESULTS Results obtained from the Phytotoxkit® phyto test indicate a high diversity in the sensitivity of plant organisms used to the components of coagulation sludge. Lepidium sativum was stimulated to germinate and grow by deposits present in raw backwash water, while the increment of the Sinapis alba root was strongly inhibited by these components. In turn, in samples with deposits from the coagulation of hot tub circulation backwash water, the Sinapis alba growth was intensively stimulated at low coagulant doses (Figure 1). In addition, the high stimulation of the growth of Lemna minor fronds was observed in raw backwash water samples, amounting to -99% for the swimming pool and -113% for the hot tub.
Figure 1. Phytotoxicity sludge after coagulation washings from: a) hot tube b) swimming pool CONCLUSIONS The coagulation processes carried out enabled a significant improvement in the values of the physicochemical parameters of backwash water, which has provided a basis for continuing research on the possibility of its reuse. However, the performed phytotoxicity assessment of the process products has documented the presence of toxic components in them, which may pose problems when selecting a management method, especially in the case of coagulation deposits.

103
The use of activated alumina and magnetic field for the removal heavy metals from water
I. Skoczko*, E. Szatyłowicz* * Department of Technology in Environmental Engineering and Protection, Bialystok University of Technology, 45A Wiejska St., 15-351 Białystok, POLAND (E-mail: [email protected]; [email protected])
AIM OF THE RESEARCH The presence of some heavy metals, such as copper, lead and cadmium, in water may represent a serious environmental problem. Increasing concentration of these metals in the water constitutes a severe health hazard due to their toxicity [Naiya et al. 2009; Kırbıyık et al. 2016]. The objective of this work was to verify the granular activated alumina (AA) sorption properties, during the process of removing copper, lead and cadmium from water, and to monitor the impact of magnetic field (MF) on the effectiveness of removing copper, lead and cadmium from water. Activated alumina adsorption is known to be an effective and inexpensive technology for the removal of selenium and arsenic from water, and was suggested by EPA as a BAT for point-of-use applications [Singh, Pant 2004; Dhanasekaran et al. 2016]. The removal of copper, lead and cadmium from water using AA and impact of magnetic field was less reported. MATERIAL AND METHODS The study consisted of determining the magnetic field effect on the efficiency of removal copper (Cu), lead (Pb) and cadmium (Cd) with a single component of the model solutions. The experiment was conducted at a laboratory scale using model solutions with concentration of component of 0.5 mg/dm3 in the process of dynamic adsorption. Laboratory tests was performed in a 1 dm3
volume of laboratory distributors filled with Al2O3. Dosage of sorbent was 450 g/dm3. In parallel, an untreated control samples, which was not exposed to magnetic field.
Figure 1. Scheme of equipment used in experiment was the same. Model solution was exposed in polyethylene bottle for 10 min to a weak static magnetic field (MF) generated from a stack of magnets (B = 118 mT). The bottle was surrounded by ferrite permanent magnets. Magnetic induction measured through the bottle wall reached 57 mT. The measurement of the magnetic induction was performed by an apparatus for induction HGS-10A. A control was also kept for 10 minutes in the same vessel without the MF only in order to eliminate the possible effect of adsorption of the tested component of the water on the walls of the vessel. Subsequently, both samples were filtered through a funnel filled with activated alumina. Figure 1 shows a schematic

104
experiment. Concentration of the test component of the model solution (concentration of Cu, Pb, Cd) prior to the adsorption process and after the process was determined by atomic absorption spectrometry apparatus Thermo Scientific iCE3300. The experiment was repeated 5 times. These samples were filtered through a column packed with AA. Then, water samples were measured for metals concentration by atomic absorption spectrometry, the electrolytic conductivity, redox potential and pH. In parallel it was examined a sample without the influence of the magnetic field. RESULTS AND CONCLUSIONS Table 1. The average values of the measured parameters of the samples.
Copper (Cu) Lead (Pb) Cadmium (Cd)
Parameter *1 *2 *3 *1 *2 *3 *1 *2 *3
Concentration of element
[µg/l]
534.9 ±15.7
45.6 ±6.4
35.4 ±5,2
530.3 ±14.1
68.2 ±8.5
24.6 ±2,6
651.4 ±18.8
179.1 ±8.3
145.4 ±6.1
Conductivity [µS/cm]
60.4 ±3.1
178.7 ±3.7
171.1 ±2.3
62.7 ±1.9
104.8 ±2.6
97.3 ±3.6
60.8 ±2.6
118.6 ±1.6
125.3 ±2.7
Redox potential [mV]
272 ±17
107 ±10
97 ±8
283 ±26
134 ±13
121 ±16
269 ±30
130 ±14
141 ±10
pH [-]
6.07 ±0.07
9.09 ±0.07
9.21 ±0.07
5.19 ±0.09
7.82 ±0.09
9.00 ±0.10
8,06 ±0.06
8.35 ±0,08
8,87 ±0,07
*1 – model sample before adsorption process, *2 – control sample, *3 – magnetized sample Pilot tests showed (table 1) that the use of AA sorption materials with MF impact could possibly decrease the copper, lead and cadmium content in the model water. The MF had also a positive effect on the efficiency of removal copper, lead and cadmium on AA. Increasing the efficiency of heavy metals removal in the samples had been exposed magnetic field varied from 1.9 % to 8.2 % compared to the control samples. Application of MF is efficient, energy-saving, chemical-free, and environmental friendly. As a result of collected information analysis, it was found that in the future, the influence of magnetic field on the physicochemical properties of water and properties of the sorption materials may be more frequently and widely used. In many cases, it restricts the use of chemicals and consumption of energy, which contributes to the protection of the natural environment in many aspects. It seems appropriate to investigate the mechanism of magnetic field effect on the process of adsorption on activated alumina. This sorbent has the ability to remove both metals, anions, and other specimens present in the water. Furthermore, removal of these components is carried out by adsorption or chemical precipitation of formed hydroxides or complexes. REFERENCES Dhanasekaran, P., Satya Sai, P. M., Anand Babu, C., Krishna Prabhu, R., Rajan, K. K. (2016)
Arsenic removal from groundwater by Anjili tree sawdust impregnated with ferric hydroxide and activated alumina. Water Science and Technology: Water Supply, 16(1), 115-127.
Naiya, T. K., Bhattacharya, A. K., Das, S. K. (2009). Adsorption of Cd(II) and Pb(II) from aqueous solutions on activated alumina. Journal of Colloid and Interface Science, 333(1), 14-26.
Kırbıyık, Ç., Pütün, A. E., Pütün, E. (2016). Comparative studies on adsorptive removal of heavy metal ions by bio sorbent, biochar and activated carbon obtained from low cost agro-residue. Water Science and Technology, 73(2), 423-436.
Singh, T. S., Pant, K. K. (2004). Equilibrium, kinetics and thermodynamic studies for adsorption of As(III) on activated alumina. Separation and Purification Technology, 36(2), 139-147.

105
Contamination content introduced with rain water to the rivers after they have been cleaned in separators of petroleum compounds Dawid Łapiński MSc, Eng *, Professor Józefa Wiater DSc, PhD, Eng **. * Department of technology in engineering and environmental protection, Faculty of Civil and Environmental Engineering, Bialystok University of Technology Wiejska 45A(E-mail: [email protected]) ** Department of technology in engineering and environmental protection, Faculty of Civil and Environmental Engineering, Bialystok University of Technology Wiejska 45A (E-mail: [email protected])
THE PROBLEM OF RAINWATER The article presents the results of rain water quality studies. The rain water flowing from the surface of urbanized areas of the city of Bialystok discharged into the river after they have been cleansed with separators witch stop petroleum compounds. It also discussed are issues related to with rain water and the problem to need develop them. Dynamic growth of civilisation and the expansion of urbanized areas have forced the need to develop rainwater. The priority is to collect them as quickly as possible from squares, streets, sidewalks and roofs, and next drain to the rain drain or land-water receiver. The main way of rain waters treatment, before they reach the water receiver, there are devices based on physical methods that mostly use sedimentation and filtration processes. The most important parameter to determine the negative impact of precipitation on the water receiver is the total suspension in which most pollutants accumulate. The content of pollutants, both organic and non-organic, in rainwater is very diverse and depends on many factors. The first of all the type of catchment management, the method of collection and discharge of precipitation water, the length of the intervals between precipitation and the duration of the precipitation itself. Pollutants brought with rain comes from two main sources. The first source is atmospheric pollution absorbed by rain from dust and gases and the second impurities flushed from the roofs, streets and sidewalks. Major pollution and descriptive parameters in rain water include:
• heavy metals (zinc, chromium, cadmium, lead, nickel, copper) • aromatic hydrocarbons (benzo [a] pyrene, pyrene, naphthalene) • total suspension, BOD, COD, nitrogen, phosphorus, anions, cations, conductivity, pH.
Material and methods
Test samples are leachate from petroleum separators located in the city of Bialystok and water taken from the river Biala. The selection of measurement and control points was based on the type of catchment from which the rainwater was collected, the traffic intensity of the adjacent streets, and the size and construction of the separator used. Selected 4 measurement and control points as shown in Figure 2.
Figure 1. Measurement and control point No.1, petroleum separator outlet.

106
The sampling has been set for March, April and May 2017, and is related to conducting self-study work under the titles "Possibility of purifying rainwater from traffic impurities after separators". It is a spring rainy season characterized by different types of intensity and duration of the rain. At this time was expected increasing the amount of pollutions accumulated in the suspension after the winter period associated with the de-icing proces. It is important to sampling in the first 20 minutes of precipitation because according to the literature occurs, the highest concentration of contaminants of impurities flushed from the surface. In samples will determinated: total suspension by weight method, BOD by respirometry using the OXITOP kit, COD with dichromate method using a spectrophotometer HACH LANGE DR/5000, anions and cations using an ion chromatograph Thermo Scientific ICS 5000+ , Heavy metals determined by the AAS method on an electrothermal atomic absorption spectrometer Thermo Scientific iCE3400 and pH and conductivity by potentiometric method.
Figure 2. Location of measurement and control points. REFERENCES Dąbkowski S.L., Górska K., Górski J., Szeląg B. (2010) Wstępne wyniki badań ścieków deszczowych w
jednym z kanałów w Kielcach. Gaz, Woda i Technika Sanitarna 2010, nr 6, 20–24. Eriksson E., Baun A., Mikkelsen P.S. and Ledin A.(2005) Selection of storm water priority pollutants, 10th
International Conference on Urban Drainage, Copenhagen/Denmark, 21-26 August 2005. Królikowska J. (2009) Podczyszczanie ścieków opadowych przy zastosowaniu hydroseparatora, Wodociągi i
Kanalizacja 2009, 42-43. Ociepa E. (2011) Ocena zanieczyszczenia ścieków deszczowych trafiających do systemów kanalizacyjnych,
Inżynieria i Ochrona Środowiska 2011, t. 14, nr. 4, 357-364. Rule K.L., Comber S.D.W., Ross D., Thornton A. ,Makropoulos C.K., Rautiu R., (2006) Diffuse sources of
heavy metals entering an urban wastewater catchment, Chemosphere, 63, 2006, 64–72. Sakson G., Zawilski M., Badowska E., Brzezińsk A.(2014) Zanieczyszczenie ścieków opadowych jako
podstawa wyboru sposobu ich zagospodarowania, Czasopismo Inżynierii Lądowej, Środowiska I Architektury, JCEEA, t. XXXI, z. 61 (3/I/14), lipiec-wrzesień 2014, 253-264.
3
2
4
1

107
Assessment the impact of sampler changes on the sampling uncertainty associated with thermal waters
A. Mika*, K. Sekuła*, E. Kmiecik*, K. Wątor* * AGH University of Science and Technology, Department of Hydrogeology and Engineering Geology, Krakow, Poland (E-mail: [email protected]; [email protected]; [email protected]; [email protected])
THE UNCERTAINTY IN EU LAW According to The European Union directives (WFD, 2000; GDD, 2006) the identification and determination of uncertainty is an important part of the overall groundwater monitoring effort
Moreover, COMMISSION DIRECTIVE 2009/90/EC indicates necessity of implementation the quality assurance/ quality control program (QA/QC) in water monitoring researches. This problem has been discussed among in papers Witczak et al. (2006), Kmiecik (2008, 2011), Kmiecik et al. (2008) or Kmiecik & Podgórni (2009). THE MAIN GOAL OF RESEARCH The aim of this study is to assess the impact of sampler changes on the uncertainty associated with the process of the geothermal waters sampling. The study was carried out on thermal water exploited by Bańska Niżna PGP-1 well in south part of Poland (Małopolska Province). To estimate the uncertainty associated with sampling used the results of determinations of silica (SiO2) in normal and duplicate samples collected in two series. First series included the collecting samples by two qualified samplers. In order to check the influence of sampler it was decied to carried out the second series included the collecting samples by eight unqualified samplers Chemical analysis were made using ICP-OES method (according to PN-EN ISO 11885: 2009) in certified Hydrogeochemical Laboratory of Hydrogeology and Engineering Geology Department at the AGH University of Science and Technology in Krakow (Certificate of Polish Centre for Accreditation No. AB 1050). To evaluate the overall uncertainty the empirical approach was implemented, based on double analysis of normal and duplicate samples taken from the same well in a series of testing. The analysis of the results was performed using ROBAN software based on technique of variance analysis using robust statistics (rANOVA). This paper presents how important thing is to define the uncertainty in the estimation of both the study of curative waters, but also in assessing the chemical composition of waters and taking into account the impact of systematic errors result from the change of sampler. ACKNOWLEDGEMENTS The study was partially supported by AGH-UST 11.11.140.797 and AGH 11.11.140.321. The authors thank PEC Geotermia Podhalańska SA for their support with research in Bańska Niżna. REFERENCES DT (2009) COMMISSION DIRECTIVE 2009/90/EC of 31 July 2009 laying down, pursuant to

108
Directive 2000/60/EC of the European Parliament and of the Council, technical specifications for chemical analysis and monitoring of water status.
GDD (2006) Directive 2006/118/EC of the European Parliament and of the Council of 12 December 2006 on the protection of groundwater against pollution and deterioration (Daughter to 2000/60/EC).
Kmiecik, E. And Podgórni, K., (2009) Estimation of sampler influence on uncertainty associated with sampling in groundwater monitoring. Geological Bulletin of the Polish Geological Institute, 436(9), 253-260.
Kmiecik, E., (2008) Assessing uncertainty associated with sampling of groundwater: Raba river basin monitoring network (South Poland) [In:] New developments in measurement uncertainty in chemical analysis. Symposium at BAM, Berlin.
Kmiecik, E., (2011) Methodological aspects of assessing the chemical status of groundwater. AGH, Kraków.
Kmiecik, E., Drzymała, M. And Podgórni, K., (2008) Uncertainty associated with groundwater sampling (Królewski spring, Kraków, Poland) [In:] Chemometrics in the science and practice, pp. 91-92.
WFD (2000) Directive 2000/60/EC of the European Parliament and of the Council of 23 October 2000 establishing a framework for Community action in the field of water policy.

109
Application of GPR Method for Detection of Loose Zones in Flood Levee
T. Gołębiowski* and T. Małysa**
* Cracow University of Technology, Faculty of Environmental Engineering, Institute of Geotechnics, Department of Geodesy, Geophysics and Engineering Geology; Warszawska st. 24, Cracow, Poland (E-mail: [email protected]) ** Firm: MET-GEO; ul. Styczniowa 37, 32-540 Trzebinia, Poland
(E-mail: [email protected]) INTRODUCTION Detection of inner damages in hydrotechnical constructions is very important matter because such damages (e.g. loose zones in flood levees or fractures in concrete dams etc.) may lead to leakage of those construction and in the extreme case (e.g. during the flood) to the destruction of levees and dams. If damages did not appear on the surface of hydrotechnical construction it’s impossible to know of its existence. Therefore it is very important to find the methods for examination of inner condition of hydrotechnical construction. Boreholes and sensors weaken the construction. They are invasive, expensive and delivers only punctual information. Solution of described problems might be the application of non-invasive geophysical methods which delivered continuous information between boreholes and sensors. INVESTIGATION SITE Terrain measurements were performed on the Vistula river flood levee in the village of Wawrzeńczyce near Cracow (Fig. 1). In the investigation site, during the flood in 2010, leakages of levee were observed, so detection of inner water filtration paths was an important matter taking into account the stability of the levee during the next flood.
Figure 1. GPR investigation site on the flood levee of the Vistula river in the village of Wawrzeńczyce near Cracow (base maps: www.google.pl/maps). GPR SURVEYS The aim of GPR surveys was detection of loose zones existed in the levee which were water filtration paths and during the next flood may threaten the stability of the levee. GPR surveys had reconnaissance character, so they were carried out with the use of short-offset reflection profiling (SORP) technique and radargrams were subjected to standard signal processing.
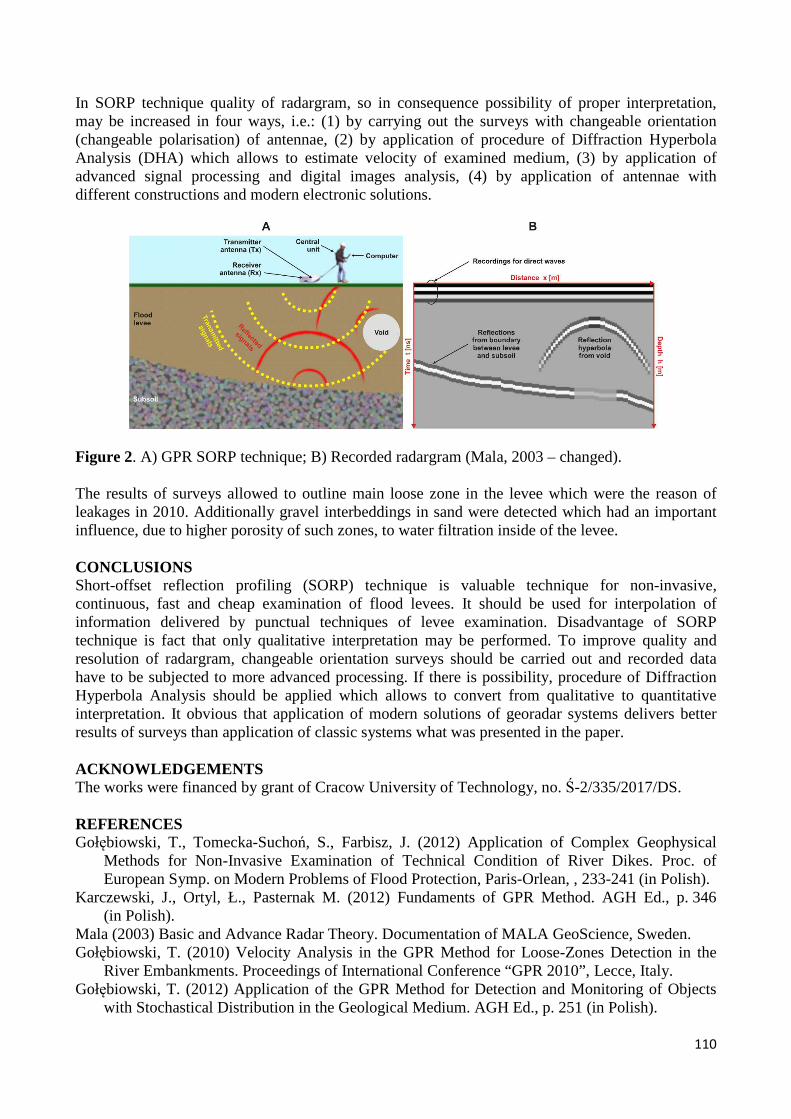
110
In SORP technique quality of radargram, so in consequence possibility of proper interpretation, may be increased in four ways, i.e.: (1) by carrying out the surveys with changeable orientation (changeable polarisation) of antennae, (2) by application of procedure of Diffraction Hyperbola Analysis (DHA) which allows to estimate velocity of examined medium, (3) by application of advanced signal processing and digital images analysis, (4) by application of antennae with different constructions and modern electronic solutions.
Figure 2. A) GPR SORP technique; B) Recorded radargram (Mala, 2003 – changed). The results of surveys allowed to outline main loose zone in the levee which were the reason of leakages in 2010. Additionally gravel interbeddings in sand were detected which had an important influence, due to higher porosity of such zones, to water filtration inside of the levee. CONCLUSIONS Short-offset reflection profiling (SORP) technique is valuable technique for non-invasive, continuous, fast and cheap examination of flood levees. It should be used for interpolation of information delivered by punctual techniques of levee examination. Disadvantage of SORP technique is fact that only qualitative interpretation may be performed. To improve quality and resolution of radargram, changeable orientation surveys should be carried out and recorded data have to be subjected to more advanced processing. If there is possibility, procedure of Diffraction Hyperbola Analysis should be applied which allows to convert from qualitative to quantitative interpretation. It obvious that application of modern solutions of georadar systems delivers better results of surveys than application of classic systems what was presented in the paper. ACKNOWLEDGEMENTS The works were financed by grant of Cracow University of Technology, no. Ś-2/335/2017/DS. REFERENCES Gołębiowski, T., Tomecka-Suchoń, S., Farbisz, J. (2012) Application of Complex Geophysical
Methods for Non-Invasive Examination of Technical Condition of River Dikes. Proc. of European Symp. on Modern Problems of Flood Protection, Paris-Orlean, , 233-241 (in Polish).
Karczewski, J., Ortyl, Ł., Pasternak M. (2012) Fundaments of GPR Method. AGH Ed., p. 346 (in Polish).
Mala (2003) Basic and Advance Radar Theory. Documentation of MALA GeoScience, Sweden. Gołębiowski, T. (2010) Velocity Analysis in the GPR Method for Loose-Zones Detection in the
River Embankments. Proceedings of International Conference “GPR 2010”, Lecce, Italy. Gołębiowski, T. (2012) Application of the GPR Method for Detection and Monitoring of Objects
with Stochastical Distribution in the Geological Medium. AGH Ed., p. 251 (in Polish).

111
Stability evaluation of modernized bank protections in a culvert construction
M. Cholewa *, K. Plesiński*, K. Kamińska*, P. Baran * * University of Agriculture in Krakow, Faculty of Environmental Engineering and Lands Surveying, Department of Hydraulic Engineering and Geotechnics, al. Mickiewicza 24/28, 30-059 Kraków, PL (E-mail: [email protected]; [email protected]; [email protected]; [email protected])
INTRODUCTION Road culverts built in the last century often did not have any design projects. Light-weight traffic was assumed depending on the local economic, ground and technical conditions. It mainly concerned district and local roads where traffic was low at that time. Over the years traffic density increased, often the type of the road also changed. Modernization and rebuilding of the road infrastructure were necessary. PURPOSE The paper presents stability evaluation of the banks of the Wilga River on a chosen stretch in Koźmice Wielkie, Małopolska Province. The examined stretch included the river bed upstream from the culvert on a district road. The culvert construction, built over four decades ago, was disassembled in 2014. The former construction, two pipes that were 1.4 m in diameter, was entirely removed. The investor decided to build a new construction in the form of insitu poured reinforced concrete with a 4 x 2 m cross section. Change of geometry and different location in relation to the river current caused increase in the flow velocity and, as a consequence, erosion of both protected and natural banks. Groundwater conditions were determined based on the geotechnical tests that were carried out on soil samples taken from the banks and the river bed. Stability calculations of natural slopes of the Wilga River and the ones protected with riprap indicate mistakes in the design project concerning construction of the river banks. The purpose of the study was to determine the stability of the Wilga River banks on a selected section adjacent to the rebuilt culvert. Change of geometry and different location in relation to the river current caused increase in the flow velocity which lead to erosion of the banks. Stability of a chosen cross section was analysed in the paper. Presented conclusions are based on the results of geotechnical tests and numerical calculations. CHARACTERIZATION OF THE WATERCOURSE The source of the Wilga River is located in Pawlikowice (Wielicki Foothills). The river starts at the altitude of 370 m above sea level and after about 21 km it flows into the Vistula River at the altitude of 200 m above sea level. The beginning of the river meanders through stone formations and after that it flows only through finegrained cohesive soils (Fig. 1a). The outlet stretch was regulated and embankments were built so the urban area is protected against the backwater from the Vistula River. The Wilga River has an irregular flow. During floods in July it rises, the flow velocity increases and the river intensely erodes its bed creating often vertical slops that are 3 m high (Fig. 1b). When the water levels are low they do not exceed a few centimetres.
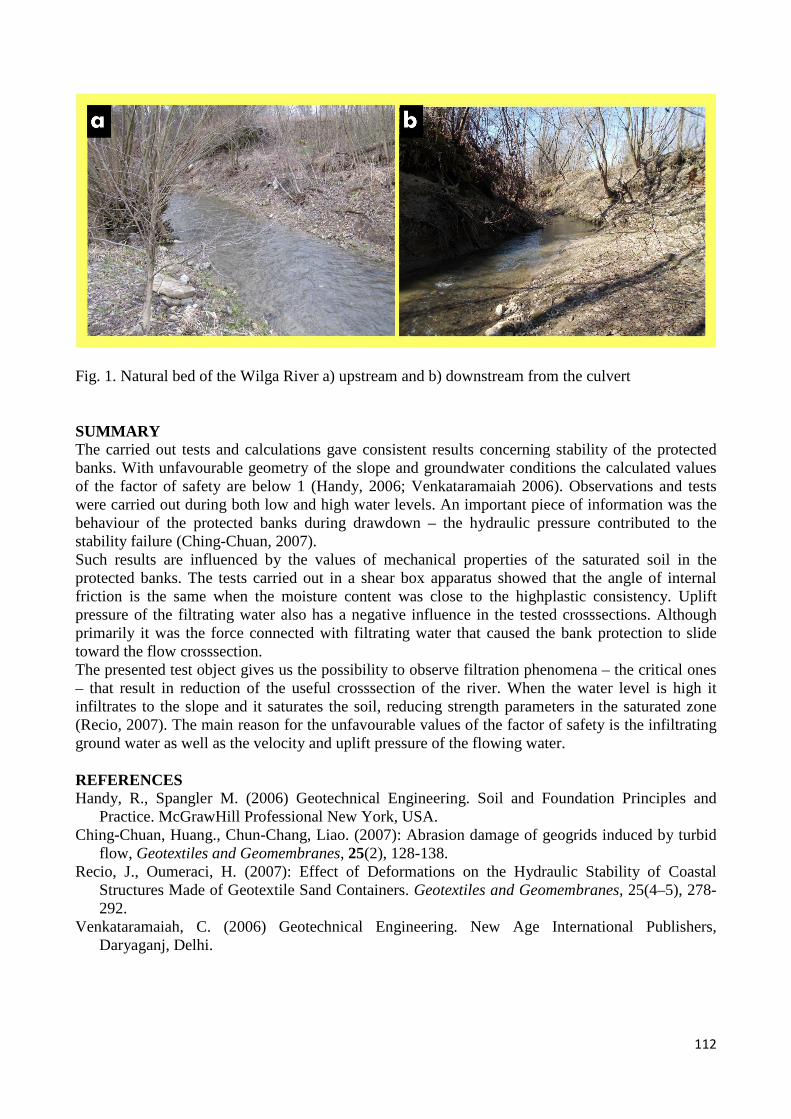
112
Fig. 1. Natural bed of the Wilga River a) upstream and b) downstream from the culvert SUMMARY The carried out tests and calculations gave consistent results concerning stability of the protected banks. With unfavourable geometry of the slope and groundwater conditions the calculated values of the factor of safety are below 1 (Handy, 2006; Venkataramaiah 2006). Observations and tests were carried out during both low and high water levels. An important piece of information was the behaviour of the protected banks during drawdown – the hydraulic pressure contributed to the stability failure (Ching-Chuan, 2007). Such results are influenced by the values of mechanical properties of the saturated soil in the protected banks. The tests carried out in a shear box apparatus showed that the angle of internal friction is the same when the moisture content was close to the highplastic consistency. Uplift pressure of the filtrating water also has a negative influence in the tested crosssections. Although primarily it was the force connected with filtrating water that caused the bank protection to slide toward the flow crosssection. The presented test object gives us the possibility to observe filtration phenomena – the critical ones – that result in reduction of the useful crosssection of the river. When the water level is high it infiltrates to the slope and it saturates the soil, reducing strength parameters in the saturated zone (Recio, 2007). The main reason for the unfavourable values of the factor of safety is the infiltrating ground water as well as the velocity and uplift pressure of the flowing water. REFERENCES Handy, R., Spangler M. (2006) Geotechnical Engineering. Soil and Foundation Principles and
Practice. McGrawHill Professional New York, USA. Ching-Chuan, Huang., Chun-Chang, Liao. (2007): Abrasion damage of geogrids induced by turbid
flow, Geotextiles and Geomembranes, 25(2), 128-138. Recio, J., Oumeraci, H. (2007): Effect of Deformations on the Hydraulic Stability of Coastal
Structures Made of Geotextile Sand Containers. Geotextiles and Geomembranes, 25(4–5), 278-292.
Venkataramaiah, C. (2006) Geotechnical Engineering. New Age International Publishers, Daryaganj, Delhi.
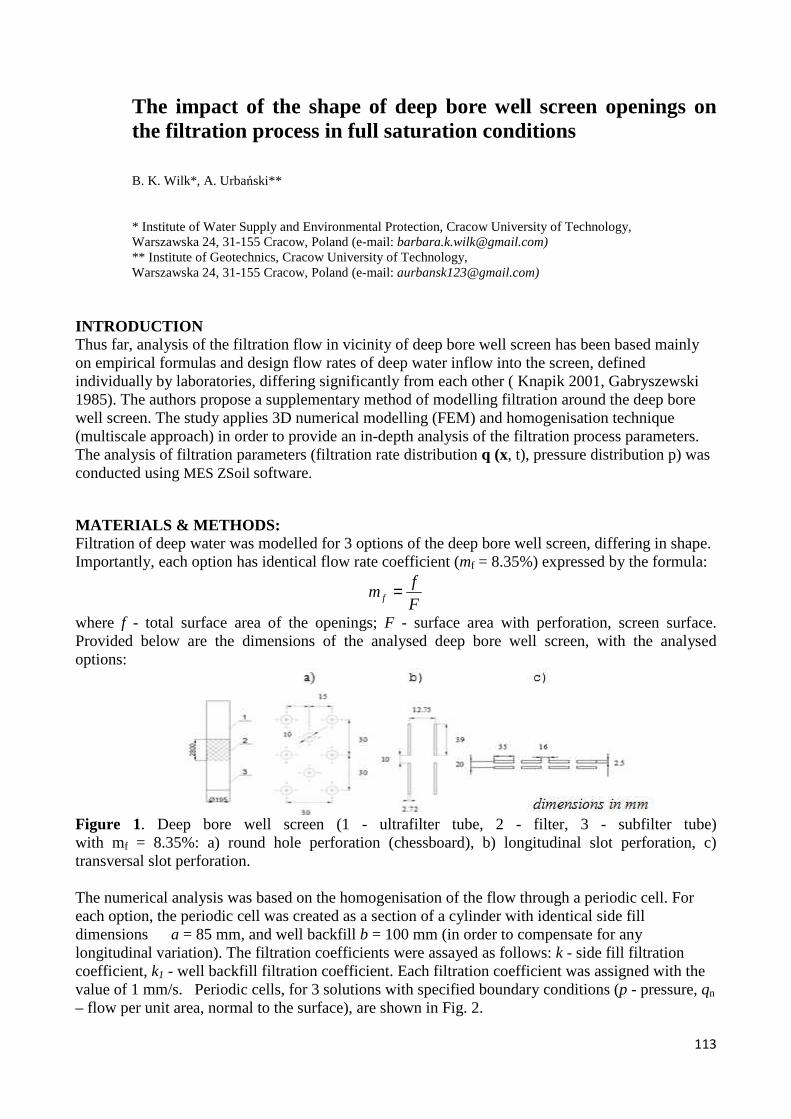
113
The impact of the shape of deep bore well screen openings on the filtration process in full saturation conditions B. K. Wilk*, A. Urbański** * Institute of Water Supply and Environmental Protection, Cracow University of Technology, Warszawska 24, 31-155 Cracow, Poland (e-mail: [email protected]) ** Institute of Geotechnics, Cracow University of Technology, Warszawska 24, 31-155 Cracow, Poland (e-mail: [email protected])
INTRODUCTION Thus far, analysis of the filtration flow in vicinity of deep bore well screen has been based mainly on empirical formulas and design flow rates of deep water inflow into the screen, defined individually by laboratories, differing significantly from each other ( Knapik 2001, Gabryszewski 1985). The authors propose a supplementary method of modelling filtration around the deep bore well screen. The study applies 3D numerical modelling (FEM) and homogenisation technique (multiscale approach) in order to provide an in-depth analysis of the filtration process parameters. The analysis of filtration parameters (filtration rate distribution q (x, t), pressure distribution p) was conducted using MES ZSoil software. MATERIALS & METHODS: Filtration of deep water was modelled for 3 options of the deep bore well screen, differing in shape. Importantly, each option has identical flow rate coefficient (mf = 8.35%) expressed by the formula:
F
fmf =
where f - total surface area of the openings; F - surface area with perforation, screen surface. Provided below are the dimensions of the analysed deep bore well screen, with the analysed options:
Figure 1. Deep bore well screen (1 - ultrafilter tube, 2 - filter, 3 - subfilter tube) with mf = 8.35%: a) round hole perforation (chessboard), b) longitudinal slot perforation, c) transversal slot perforation. The numerical analysis was based on the homogenisation of the flow through a periodic cell. For each option, the periodic cell was created as a section of a cylinder with identical side fill dimensions a = 85 mm, and well backfill b = 100 mm (in order to compensate for any longitudinal variation). The filtration coefficients were assayed as follows: k - side fill filtration coefficient, k1 - well backfill filtration coefficient. Each filtration coefficient was assigned with the value of 1 mm/s. Periodic cells, for 3 solutions with specified boundary conditions (p - pressure, qn – flow per unit area, normal to the surface), are shown in Fig. 2.

114
RESULTS
Figure 2. Periodic cell of deep bore well screen with perforation and well-screen adjacent zone:
a) round hole perforation, b) longitudinal slot perforation, c) transversal slot perforation After specifying the boundary conditions, the obtained results clearly indicated that the highest flow rate vector values were to be found at the well screen openings and in their immediate vicinity. Also, the values of flow per unit (qj), for each case are read in such a distance from the filter tube, which assure vanishing disturbances of this field.
Figure 3. Velocity field distribution for 3 options of the periodic cell: a) round hole perforation, b) longitudinal slot perforation, c) transversal slot perforation Next, the pressure distribution was determined. The highest pressure values were observed at the boundary of the perforated tube. Pressure dropped with the increasing distance from the deep bore well screen.
Figure 4. Pressure distribution for 3 options of the periodic cell: a) round hole perforation, b) longitudinal slot perforation, c) transversal slot perforation.
CONCLUSION Conducted analysis shows, for considered cases of filter openings setup, that the shape of the perforation has a secondary influence for the screen selection. The key criterion is the mf coefficient. REFERENCES Knapik K., Bajer J. (2011), Wodociągi, Politechnika Krakowska, Kraków T. Gabryszewski, A. Wieczysty (1985) , Ujęcia wód podziemnych , Arkady, Warszawa

115
Degradation Pathways of Pentachlorophenol and Benzo(a)pyrene During Heterogeneous Photocatalysis E. Kudlek*, M. Dudziak*, G. Kamińska* and J. Bohdziewicz* * Silesian University Technology, Institute of Water and Wastewater Engineering,mul. Konarskiego 18a, 44-100 Gliwice, Poland (E-mail: [email protected], [email protected], [email protected], [email protected])
INTRODUCTION Photochemical oxidation is one of the most effective methods of decomposition of a wide range of organic micropollutants (Wols, 2012). The oxidation of several compounds leads to the formation of biologically active by-products with a much higher toxicity than the parent compound (Kudlek, 2016). The occurrence of these compounds in the water environment has raised concern about their negative impact on the water biocenosis. The paper presents the determination of degradation pathways of pentachlorophenol and benzo(a)pirene during the process of heterogeneous photocatalysis carried out in the presence of TiO2 catalyst. EXPERIMENTAL Water solutions prepared on deionized water matrices with the addition of pentachlorophenol (PCP) and benzo(a)pyrene (BaP) standards from Sigma-Aldrich (Poznań, Poland) at a concentration of 0.5 mg/L were subjected to heterogeneous photocatalysis process. The pH of the solutions was adjusted to 7 using 0.1 mol/L HCl and 0.1 mol/L NaOH. The processes was carried out in a laboratory glass batch reactor equipped with a medium-pressure lamp of power 150 W placed in a cooling jacket. Titanium dioxide (TiO2) nanopowder was used as catalyst of the process. Samples for analysis were collected after 5, 10, 15 and 30 minutes of UV irradiation. The experiments for tested compounds ware carried out separately. The analytical procedure of investigated micropollutants was performed according to guidelines developed in preliminary studies (Bohdziewicz, 2016). Toxicological evaluation was carried out by the use of the Microtox® test by Modern Water (Warsaw, Poland). RESULTS AND DISCUSSION The effectiveness of compounds degradation during photocatalysis increased with the reaction time elongation (Fig. 1a). After 30 minutes of UV irradiation the concentration of both compounds decreased by more than 96%. The results presented in time "0 min" was obtained for the adsorption of micropollutants on the catalyst surface, that preceded the initializing of UV irradiation.
a)
0.0
0.1
0.2
0.3
0.4
0.5
0.6
0.7
0.8
0.9
1.0
0 5 10 15 20 25 30
C/C
0
Time of UV irradiation, min
PCP BaP
b)
0
10
20
30
40
50
60
70
80
90
100
0 5 10 15 20 25 30
Inhi
bitio
n of
bio
lum
ines
cenc
e,
%
Time of UV irradiation, min
PCP BaP
Figure 1. Change of a) compound concentration and b) water toxicity during photocatalysis.

116
The GC-MS analysis allowed for the estimation of possible photocatalytic degradation pathway of examined micropollutants, which were presented in Figure 2 and 3. Due to high reaction rates of the oxidation of pentachlorophenol and bezo(a)pyrene the determination of by-products was possible only in sample after 5 minutes of UV irradiation. The toxic nature of formed compounds was confirmed by the results obtained for the Microtox® test (Fig. 1b). For both tested micropollutants an increase in the toxicity was observed within the whole time of the process run.
Figure 2. Possible degradation pathway of pentachlorophenol.
Figure 3. Possible degradation pathway of benzo(a)pyrene. CONCLUSIONS Heterogeneous photocatalysis process carried out for 30 minutes allows to achieve removal degrees of tested micropollutants which exceeded 96%. The GC-MS analysis indicated the formation of degradation by-products, which negative impact on water organisms was confirmed by the performed toxicity test. The identification of photodegradation products of micropollutants and the determination of their toxic potential is necessary for a complete evaluation of the effectives of the applied water treatment method. Acknowledgment The paper has been prepared within the frame of the National Science Centre project based on decision no DEC-2013/11/B/ST8/04391. REFERENCES Bohdziewicz, J., Dudziak, M., Kamińska, G. and Kudlek, E. (2016) Chromatographic determination
and toxicological potential evaluation of selected micropollutants in aquatic environment - analytical problems. Desalination and Water Treatment, 57(3), 1361-1369.
Kudlek, E., Dudziak, M. and Bohdziewicz, J. (2016) Influence of inorganic ions and organic substances on the degradation of pharmaceutical compound in water matrix. Water, 8(11), 1-18.
Wols, B.A. and Hofman-Caris, C.H.M., (2012) Review of photochemical reaction constants of organic micropollutants required for UV advanced oxidation processes in water. Water Research, 46(9), 2815-2827.

117
The occurrence of antibiotic resistance genes in tap water – a review
A. Siedlecka* * Wrocław University of Science and Technology, Faculty of Environmental Engineering, Wyb. Wyspiańskiego 27, 50-370 Wrocław (E-mail: [email protected])
ABSTRACT The phenomenon of antibiotic resistance of bacteria is an emerging threat all over the world. Nowadays, when the availability of antibiotics agents is so wide, the overuse of drugs is the inevitable consequence both in developed and developing countries. The obvious result of this is the prevalence of antibiotic resistant bacteria. Due to the fact that prokaryotic genomes could be regarded as the molecules of high plasticity, their rapid adaptation to the new environmental conditions, i.e. presence of antibiotic agents, is expected. Nevertheless, as antibiotic resistance bacteria could cause incurable infections, the constant monitoring of their prevalence should be implemented in all the environmental components, including wastewaters, soil, air and waters. Resistant bacteria, if present in wastewaters, could reach the catchment of a drinking water treatment plant with purified, but poorly disinfected wastewaters, and then enter the water supply systems, in case of insufficient water treatment processes. Although the major part of bacteria, including resistant strains, is retained in water treatment plant, the antibiotic resistance genes are able to enter a water supply system, due to the fact, that the dimensions of genes (which are indeed small DNA fragments) allow them to omit most of the treatment processes, including membrane units. Moreover, disinfection processes could cause the lysis of bacterial cells in some circumstances, leading to the release of free DNA molecules, which could contain the antibiotic resistance genes. There are two major ways of spreading resistance among the bacteria: vertical gene transfer (in the process of proliferation) and horizontal gene transfer, i.e. conjugation, transformation and transduction. All of them contribute to the prevalence of the antibiotic resistance, but in case of the free antibiotic resistance genes, the transformation phenomenon is the most important, as in consequence, initially pathogenic, but susceptible (curable) strains may become pathogenic and resistant, after the contact with DNA fragments. From that point of view, these genes could be regarded as the new pollution and should be first of all monitored and second of all suppressed. In view of the fact that drinking water is one of the main source of potable water, its highest quality should be provided regardless of other factors. This mean that the occurrence of antibiotic resistance genes, as potential resistance factors, should be investigated in water supply systems, as the intake of potable water containing these genes could lead to the transfer of resistance to human pathogenic strains. Moreover, most of the bacteria dwelling in tap water could not be cultivated in laboratory conditions, remaining undetectable. That may lead to underestimation of the problem. Furthermore, the routinely applied method for detection of antibiotics resistant bacteria, i.e. Kirby-Bauer disc-diffusion method, is dedicated to human or animal pathogens, which present diverse optimum condition (temperature 35oC and rich nutrient medium like Mueller-hinton agar) than autochthonous tap water microorganism (which are psychrophilic and accustomed to poor in nutrients habitats). Therefore, the other way to investigate antibiotic resistance phenomenon is needed and the detection of antibiotic resistance genes seems to be an appropriate solution. In fact, molecular biology tools, including widely applied PCR technique with a lot of its variants

118
and modifications, as well as gel electrophoresis, including DGGE, are increasingly applied methods used in investigations of antibiotic resistance genes in tap water. Constantly improved databases containing information about antibiotic resistance genes allow to compare and share the discovered sequences of nucleotides, as well as starters and conditions of PCR. In view of the fact that free DNA molecules may be present at very low concentrations in tap water, the isolation of pure DNA material might be a challenge. The aim of this study is to compare the applied methods for antibiotic resistance genes (ARGs) investigations in tap water. As the concentration of ARGs in treated, drinking water is expected to be very low and even may cause the problems in standard isolation procedure, the special emphasis is placed on the applied procedures and their efficiency. The study presents the first attempts to obtain free DNA directly from tap water. The further efforts must be put in order to determinate the final amount of obtained DNA and the presence of chosen ARGs among the molecules. As mentioned above, the isolation of DNA from bacterial colonies obtained from tap water and cultivated in laboratory conditions, even if reach in antibiotic resistance genes, may lead to the neglecting of the majority of microorganisms dwelling in tap water pipelines, thereby the metagenomic approach is likely to be an alternative. REFERENCES Andersson, D.I., Hughes, D. (2012) Evolution of antibiotic resistance at non-lethal drug
concentrations. Drug Resistance Updates, 15, 162–172. Hwang, Ch., Ling, F., Andersen, G.L., LeChevallier, M.W., Liu, W.-T. (2012) Evaluation of
Methods for the Extraction of DNA from Drinking Water Distribution System Biofilms. Microbes Environ., 27(1), 9–18.
Kasprzykowska, U., Sobieszczańska, B.M. (2014) Plastyczność bakteryjnych genomów - międzykomórkowy transfer informacji genetycznej. Postępy mikrobiologii, 53(2), 165–171.
Lebleu, N., Roques, Ch., Aimar, P., Causserand, Ch. (2009) Role of the cell-wall structure in the retention of bacteria by microfiltration membranes. Journal of Membrane Science, 326, 178–185.
Schwalbe, R., Steele-Moore, L., Goodwin, A.C. (ed.) (2007) Antimicrobial Susceptibility Testing Protocols, CRC Press, Boca Raton.

119
Evaluation of selected sewage sludge gasification technological parameters G. Gałko*, D. Król** Faculty of Energy and Environmental Engineering, Silesian University of Technology, Konarskiego 18,Z 44-100 Gliwice, PL , (E-mail: [email protected])* (E-mail: [email protected])**
ABSTRACT: The results of selected technological parameters of computational analysis during sewage sludge air gasification were shown in this paper. Gas efficiency (rate of technological readiness), degree of carbon conversion and energy balance that takes into account the enthalpy of creation were calculated Introduction: One of sewage sludge thermal disposal possibility is air-gasification. Sanitary neutral ashes and combustible syngas are process products. Direction of use the calorific value of gas defines. Technological parameters like degree of combustible substance conversion, chemical efficiency and fuel properties of sewage sludge have influnence on calorific value. Process temperature primarily affect on technological parameters. Syngas technological readiness in the range 30-50% and 72% carbon conversion, is possible to achieve during sewage sludge gasification in temperaturę arround 700°C (Seong-W,2011).However, 47,5% proces efficiency is possible to recieve during counterflow sewage sludge gasification in the range of temperatures 600-900°C (Kyung Won L,2014) Experiment: In the temperature range 700-800°C sewage sludge air gasification process using 5 kW counterflow gas generator process the experiment was done. With the use of GAS3100 analyser, composition of syngas was measured. Measurment of temperature with nickel type K thermocouples linked with the control panel connected to the computer was taken. Results of the experiment were described and presented in (Król,2017) Technological Parameters: Sewage sludge gasification proces parameters was performer. Calorific value, energy balance and degree of fuel conversion was done. Process graphical interpretation was in the calculation methodology used.
Figure 1., Gasification process graphical intepretation
In accordance with graphical interpretation syngas flow using mass balance of substances supplied

120
to gasification chamber was calculated. Evaluation of selected parameters was done by calculation of them using formula. Gas efficiency:
The level of carbon conversion fuel:
Description: Stgazu – syngas flow (kmol/h), Stp-fuel flow (kmol/h), yCO,yCO2,yCH4,yH2-selected gases shares(-). Wd-Lower Heating Value(MJ/m3-syngas,MJ/kg – fuel), yC- sample mass shares of carbon (-). Caclulation methodology was done in accordance with (Wei-Hsin Ch., 2013). Results The average calorific value of generated syngas was 3,98 MJ/m3. Combustible gases concentration was in the ranges 14,28-17,58% CO, 4,01-5,22% H2 and 2,81-4,22% CH4. The oxygen concentration was in the range 2,98-3,93%. Results of technological parameteres evaluation was done in the function of O2 syngas concentration in molar fraction [-]).
Figure 2. Gas Efficiency (ηchem), Carbon conversion (Ccon)C = f(zO2). Conclusions: Gas efficiency was varied with changes of oxygen syngas concentration. The efficiency value was in the range 46 to 53% with oxygen molar fraction 0,034 and 0,035. With change of oxygen concentration in syngas , the degree of carbon conversion was diffrent. Range values was from 51,2 to 55,5%. REFERENCES Król, D., Gałko, G. (2017) Sewage sludge gasification research, Chemical Industry, 2, 341-342. Kyung-Won, Lee, Woo Chan Lee, Hyuk Jun Lee, Jong In Dong (2014) Gasification characteristics
of sewage sludge combined w.ith wood biomass. Journal of Material Cycles and Waste Management, 16, 642-649.
Wei-Hsin, Chen, Chih-Jung, Chen., Chen-I, Hung, Cheng-Hsin Shen, Heng-Wen Hsu. (2013) A comparision of gasification phenomena among raw biomass torrefied biomass and coal in an entrained- flow reactor, Applied Energy, 112, 421-430.
Seong-Wan, Kang, Jong-In, Dong, Jong-Min, Kim, Woo-Chan, Lee, Won-Gu, Hwang (2011) Gasification and its emission characteristics for dried sewage sludge utilizing a fluidized bed gasifier. Journal of Material Cycles and Waste Management, 13, 180-185.
Ca
rbon
con
vers
ion
(C
con
), %
Col
d ga
s e
ffici
ency
, %
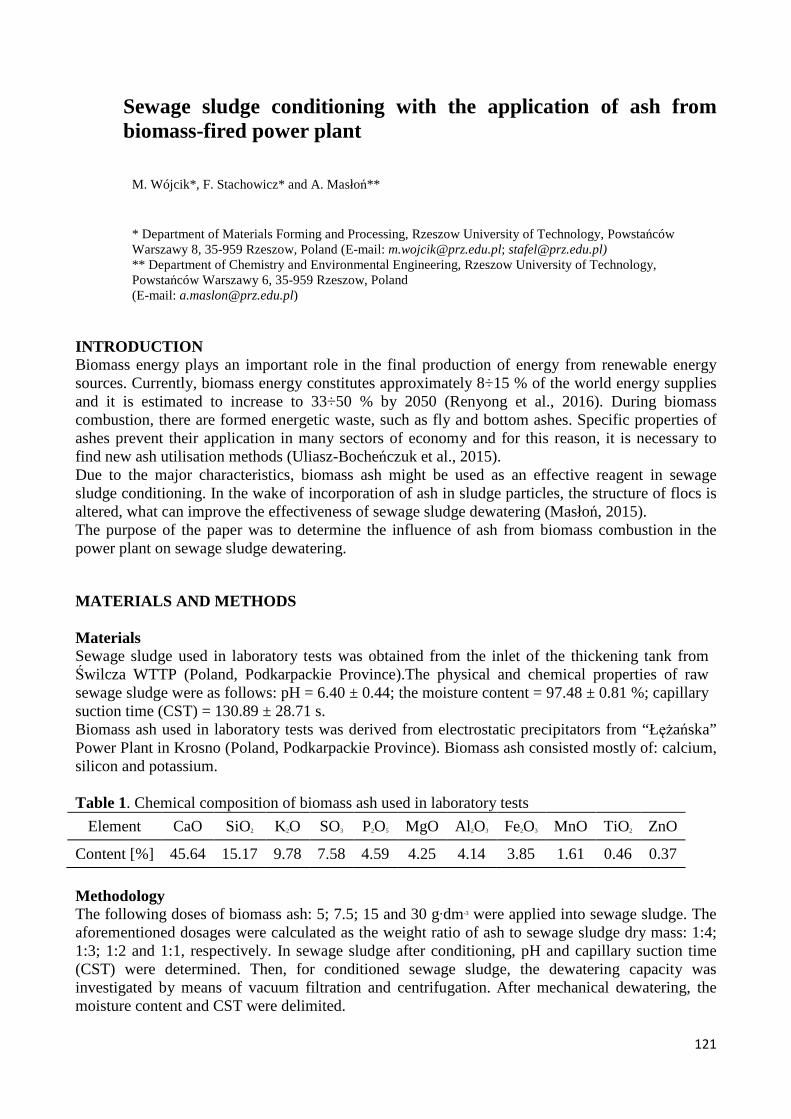
121
Sewage sludge conditioning with the application of ash from biomass-fired power plant
M. Wójcik*, F. Stachowicz* and A. Masłoń**
* Department of Materials Forming and Processing, Rzeszow University of Technology, Powstańców Warszawy 8, 35-959 Rzeszow, Poland (E-mail: [email protected]; [email protected]) ** Department of Chemistry and Environmental Engineering, Rzeszow University of Technology, Powstańców Warszawy 6, 35-959 Rzeszow, Poland (E-mail: [email protected])
INTRODUCTION Biomass energy plays an important role in the final production of energy from renewable energy sources. Currently, biomass energy constitutes approximately 8÷15 % of the world energy supplies and it is estimated to increase to 33÷50 % by 2050 (Renyong et al., 2016). During biomass combustion, there are formed energetic waste, such as fly and bottom ashes. Specific properties of ashes prevent their application in many sectors of economy and for this reason, it is necessary to find new ash utilisation methods (Uliasz-Bocheńczuk et al., 2015). Due to the major characteristics, biomass ash might be used as an effective reagent in sewage sludge conditioning. In the wake of incorporation of ash in sludge particles, the structure of flocs is altered, what can improve the effectiveness of sewage sludge dewatering (Masłoń, 2015). The purpose of the paper was to determine the influence of ash from biomass combustion in the power plant on sewage sludge dewatering.
MATERIALS AND METHODS Materials Sewage sludge used in laboratory tests was obtained from the inlet of the thickening tank from Świlcza WTTP (Poland, Podkarpackie Province).The physical and chemical properties of raw sewage sludge were as follows: pH = 6.40 ± 0.44; the moisture content = 97.48 ± 0.81 %; capillary suction time (CST) = 130.89 ± 28.71 s. Biomass ash used in laboratory tests was derived from electrostatic precipitators from “Łężańska” Power Plant in Krosno (Poland, Podkarpackie Province). Biomass ash consisted mostly of: calcium, silicon and potassium. Table 1. Chemical composition of biomass ash used in laboratory tests
Element CaO SiO2 K2O SO3 P2O5 MgO Al2O3 Fe2O3 MnO TiO2 ZnO
Content [%] 45.64 15.17 9.78 7.58 4.59 4.25 4.14 3.85 1.61 0.46 0.37
Methodology The following doses of biomass ash: 5; 7.5; 15 and 30 g·dm-3 were applied into sewage sludge. The aforementioned dosages were calculated as the weight ratio of ash to sewage sludge dry mass: 1:4; 1:3; 1:2 and 1:1, respectively. In sewage sludge after conditioning, pH and capillary suction time (CST) were determined. Then, for conditioned sewage sludge, the dewatering capacity was investigated by means of vacuum filtration and centrifugation. After mechanical dewatering, the moisture content and CST were delimited.

122
RESULTS According to the specific physical and chemical properties, ash from biomass-fired power plant can be used as an inexpensive sludge conditioner. The application of ash has resulted in the decline of CST with the increase of the dose of mentioned reagent. For 30 g·dm-3 dosage of ash, CST was of approximately 84.66 % lower than for non-conditioned sewage sludge (the decline from 130.89 s to 20.08 s). Sewage sludge after conditioning with biomass ash showed a much stronger dewatering capacity than raw sludge. Laboratory research indicated different efficiencies in the improvement of sewage sludge dewatering, depending on the amount of biomass ash. With the highest applied dosage of ash (30 g·dm-3), the moisture cake content decreased of approximately 10 ÷ 25 %, depending on the method of dewatering. The confirmation of the effectiveness of biomass ash in sewage sludge conditioning might reduce the consumption of chemical reagents in treatment plants and contribute to the reduction of their operating costs. Additionally, the mixture of sewage sludge and biomass ash may be successfully used in the cultivation of energy plants plantations.
Figure 1. The influence of biomass ash on sewage sludge dewatering
REFERENCES Renyong S., Jiuuu L., Jiang J., Mehmood K., Yuan L.,Renkou X., Quian W. (2016) Characteristics of
biomass ashes from different materials and their ameliorative effects on acid soil. Journal of Environmental Sciences (in press).
Uliasz-Bocheńczuk A., Pawluk A., Skierka J. (2015), Wymywalność zanieczyszczeń z popiołów lotnych ze spalania biomasy. Mineral Resources Management, 31, 145-156.
Masłoń A. (2015) Wpływ materiałów pylistych na poprawę właściwości sedymentacyjnych osadu czynnego. Instal, 4, 51-55.

123
Possibilities of using biomass of microalga in methane fermentation
P. Kondzior*
* Division of Sanitary Biology and Biotechnology, Faculty of Civil and Environmental Engineering, Białystok University of Technology, ul. Wiejska 45E, 15-351 Białystok, Poland (E-mail: [email protected])
INTRODUCTION Algae and cyanobacteria are among the microalgae. They mostly occur in surface waters. Microalgae are the first links of the trophic chain, and they are the main source of organic matter. Microalgae have many positive as well as negative attributes. Species that produce harmful toxins to humans and animals are posing a serious threat. In optimal conditions the growth of algae is proceeding exponentially, and the excessive the growth leads to so called algal blooms (or red tide), followed by the reduction of the population (Nicklin 2000). There are two main methods of breeding microalgae on an industrial scale: open ponds or closed systems (photobioreactors) that occur in many varieties – columnar, panel, tubular, etc. Microalgal biomass production requires water, light, carbon dioxide, mineral salts. Elements necessary to growth of algae and cyanobacteria are nitrogen, phosphorus and iron. Microalgae have a high photosynthetic efficiency, quickly increase their biomass, characterized by resistance to dirt and can adapt to changing environmental conditions. Thanks to these characteristics microalgae compete with typical energy crops (Koziel and Włodarczyk 2011, Dębowski et. al. 2015). APPLICATION OF MICROALGAE IN THE PROCESS OF METHANE FERMENTATION Researchers are looking for new and greater abilities of applying algae and blue-green algae. There are many research centers working on discovering way of using them in engineering and environmental protection. The important role of microalgae is seen in the field of renewable energy sources. Production of biogas from algae and cyanobacteria as a substrate or co-substrate in fermentation chamber is very important. The production of methane of the biomass of the water flora is closely dependent on species used to the fermentation of the algae or cyanosis. Using this process for getting the energy is economically justified. According to Nowicka et. al. (2015) biogas production as a result of the mesophilic methane fermentation from microalgae is for: Laminaria digitata about 500 dm3 CH4 / s.m kg., Macrocystis 390-410 dm3 CH4 / s.m kg., Chlorella vulgaris 240 dm3 CH4 / s.m kg. and cyanobacterium Spirulina platensis about 280 dm3 CH4 / s.m kg. The researchers reported that the methane content was between 62-67% of the total volume of biogas produced during the fermentation process. The methane content is an important parameter, because it is burnt fuel. In the biogas there are still among others. carbon dioxide, which is not energetic, but it is still possible to recycle it to microalgae breeding system. In order to compare the amount of biogas produced from the water flora with the land flora you must take into account the percentage of methane content (further given in round brackets). Biogas produced in the mesophilic methane fermentation of the individual raw materials is (according Nowicka et al. 2015): extrusions of potatoes 820 dm3 / kg s.m. (methane content 54%), lucerne 450-600 dm3 / kg s.m. (54-64%), corn 350-500 dm3 / kg s.m. (50%) straw 350-450 dm3 / kg s.m. (54-58%). Given data is showing that in some cases land plants are less predictable raw material. The amount of methane produced during the fermentation of corn commonly used having regard to the percentage is similar to the amount of the algae Chlorella vulgaris in the same fermentation process. According to the research Brennan and Owende (2010) high protein content in the algal biomass results in low ratio of C:N, which
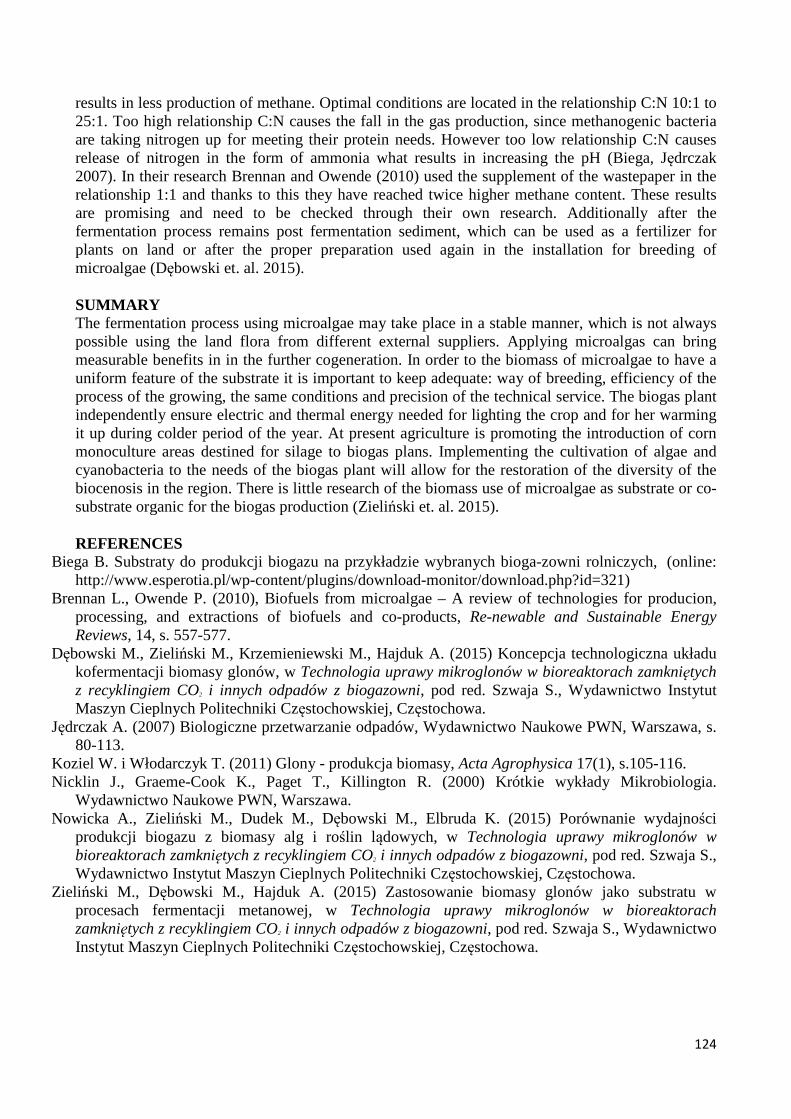
124
results in less production of methane. Optimal conditions are located in the relationship C:N 10:1 to 25:1. Too high relationship C:N causes the fall in the gas production, since methanogenic bacteria are taking nitrogen up for meeting their protein needs. However too low relationship C:N causes release of nitrogen in the form of ammonia what results in increasing the pH (Biega, Jędrczak 2007). In their research Brennan and Owende (2010) used the supplement of the wastepaper in the relationship 1:1 and thanks to this they have reached twice higher methane content. These results are promising and need to be checked through their own research. Additionally after the fermentation process remains post fermentation sediment, which can be used as a fertilizer for plants on land or after the proper preparation used again in the installation for breeding of microalgae (Dębowski et. al. 2015). SUMMARY The fermentation process using microalgae may take place in a stable manner, which is not always possible using the land flora from different external suppliers. Applying microalgas can bring measurable benefits in in the further cogeneration. In order to the biomass of microalgae to have a uniform feature of the substrate it is important to keep adequate: way of breeding, efficiency of the process of the growing, the same conditions and precision of the technical service. The biogas plant independently ensure electric and thermal energy needed for lighting the crop and for her warming it up during colder period of the year. At present agriculture is promoting the introduction of corn monoculture areas destined for silage to biogas plans. Implementing the cultivation of algae and cyanobacteria to the needs of the biogas plant will allow for the restoration of the diversity of the biocenosis in the region. There is little research of the biomass use of microalgae as substrate or co-substrate organic for the biogas production (Zieliński et. al. 2015). REFERENCES
Biega B. Substraty do produkcji biogazu na przykładzie wybranych bioga-zowni rolniczych, (online: http://www.esperotia.pl/wp-content/plugins/download-monitor/download.php?id=321)
Brennan L., Owende P. (2010), Biofuels from microalgae – A review of technologies for producion, processing, and extractions of biofuels and co-products, Re-newable and Sustainable Energy Reviews, 14, s. 557-577.
Dębowski M., Zieliński M., Krzemieniewski M., Hajduk A. (2015) Koncepcja technologiczna układu kofermentacji biomasy glonów, w Technologia uprawy mikroglonów w bioreaktorach zamkniętych z recyklingiem CO2 i innych odpadów z biogazowni, pod red. Szwaja S., Wydawnictwo Instytut Maszyn Cieplnych Politechniki Częstochowskiej, Częstochowa.
Jędrczak A. (2007) Biologiczne przetwarzanie odpadów, Wydawnictwo Naukowe PWN, Warszawa, s. 80-113.
Koziel W. i Włodarczyk T. (2011) Glony - produkcja biomasy, Acta Agrophysica 17(1), s.105-116. Nicklin J., Graeme-Cook K., Paget T., Killington R. (2000) Krótkie wykłady Mikrobiologia.
Wydawnictwo Naukowe PWN, Warszawa. Nowicka A., Zieliński M., Dudek M., Dębowski M., Elbruda K. (2015) Porównanie wydajności
produkcji biogazu z biomasy alg i roślin lądowych, w Technologia uprawy mikroglonów w bioreaktorach zamkniętych z recyklingiem CO2 i innych odpadów z biogazowni, pod red. Szwaja S., Wydawnictwo Instytut Maszyn Cieplnych Politechniki Częstochowskiej, Częstochowa.
Zieliński M., Dębowski M., Hajduk A. (2015) Zastosowanie biomasy glonów jako substratu w procesach fermentacji metanowej, w Technologia uprawy mikroglonów w bioreaktorach zamkniętych z recyklingiem CO2 i innych odpadów z biogazowni, pod red. Szwaja S., Wydawnictwo Instytut Maszyn Cieplnych Politechniki Częstochowskiej, Częstochowa.

125
Utilization of zeolites for reduction of ammonia in the digesters A. Hajduk*, M. Dębowski*, M. Zieliński* and P. Rusanowska* * University of Warmia and Mazury in Olsztyn, Faculty of Environmental Sciences, Department of Environment Engineering (E-mail: [email protected], [email protected], marcin.zieliń[email protected], [email protected])
INTRODUCTION Methane fermentation is a biochemical process, during which bacteria decompose organic matter and produce biogas. It is one of the most economical and environmentally friendly process for management of various types of organic waste, including sewage sludge, waste from agriculture and slaughter waste (Pilarska A. 2015). Efficient anaerobic decomposition of organic matter might be disturbed or even hampered by various factors. Identified inhibitors of methane fermentation process include: heavy metals, low pH, high organic loading (Pilarska A. 2015). A common factor limiting the efficiency of methane fermentation is a high concentration of ammonia in the digesters. So far, ammonia removal based on the physicochemical and biological processes that do not always give satisfactory results, so extensive studies on the use for this purpose natural zeolites mainly clinoptilolite were initiated. This zeolite has showed a higher selectivity for monovalent ions. Removal of ammonium with zeolite takes place by ion exchange or by adsorption in the pores of the aluminosilicate skeleton Baranska R.R., 1997; Gomonaj V.I. 1997).The high efficiency of the use of zeolites in wastewater treatment provide a opportunities to eliminate high concentrations of ammonia from the digesters. The aim of studies was to determine the impact of the utilization of zeolites in the removal of ammonia from the systems of biological transformation of organic substrates to biogas during methane fermentation. METHODOLOGY In the experiment, the plant biomass with addition of different doses of zeolite was fermented. The study was divided into three series, each with five variants with the following criteria: a series - type of plant biomass used, variant - dose of zeolite. The following species of plants biomass were used: Helianthus tuberosus (1 series), Helianthus annuus L. (2 series), Miscanthus giganteus (3 series). The biomass before fermentation was crushed to a fraction of 4 - 5 mm in a ball mill. The following doses of zeolite were used: 0g/dm3 (1 variant), 1g/dm3 (2 variant), 5g/L (3 variant), 7.5g/dm3(4 variant), 10gdm3 (5 variant). As a sorbent the 3-5mm zeolite fraction was used. The experiment was performed with the manometric OxiTop Control system. The manometric device consists of a glass bottle provided with a pressure transducer located in a measuring head. In each of the variant of the experiment, 0.1dm3 of anaerobic sludge, prepared lignocellulosic biomass and dose of zeolite was introduced to the glass bottles. In all variants, initial organic loading was established at the level of 5.0g/dm3. In order to ensure anaerobic conditions within glass bottles, nitrogen was purged to replace air present inside. A complete set of measurement was placed in a thermostatic cabinet with hysteresis that does not exceed ±0.5°C. Measurements were carried out at 36°C. Measurement time was 20 days, and the pressure in the glass bottle was recorded every 24 h. The analyses of the content of ammonia in the digestate and effluent from digester were conducted. The effluent from digester were obtained through centrifugation of digestate. The concentration of the ammonia was determined by direct distillation.
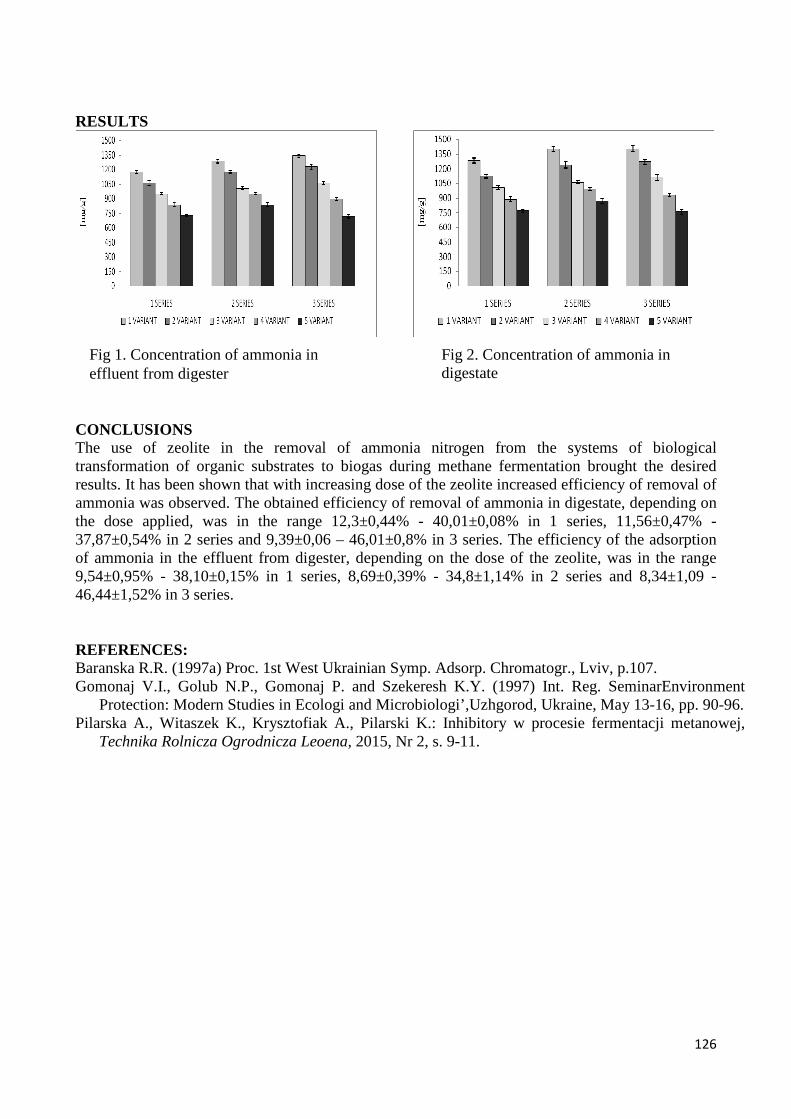
126
RESULTS
CONCLUSIONS The use of zeolite in the removal of ammonia nitrogen from the systems of biological transformation of organic substrates to biogas during methane fermentation brought the desired results. It has been shown that with increasing dose of the zeolite increased efficiency of removal of ammonia was observed. The obtained efficiency of removal of ammonia in digestate, depending on the dose applied, was in the range 12,3±0,44% - 40,01±0,08% in 1 series, 11,56±0,47% - 37,87±0,54% in 2 series and 9,39±0,06 – 46,01±0,8% in 3 series. The efficiency of the adsorption of ammonia in the effluent from digester, depending on the dose of the zeolite, was in the range 9,54±0,95% - 38,10±0,15% in 1 series, 8,69±0,39% - 34,8±1,14% in 2 series and 8,34±1,09 - 46,44±1,52% in 3 series. REFERENCES: Baranska R.R. (1997a) Proc. 1st West Ukrainian Symp. Adsorp. Chromatogr., Lviv, p.107. Gomonaj V.I., Golub N.P., Gomonaj P. and Szekeresh K.Y. (1997) Int. Reg. SeminarEnvironment
Protection: Modern Studies in Ecologi and Microbiologi’,Uzhgorod, Ukraine, May 13-16, pp. 90-96. Pilarska A., Witaszek K., Krysztofiak A., Pilarski K.: Inhibitory w procesie fermentacji metanowej,
Technika Rolnicza Ogrodnicza Leoena, 2015, Nr 2, s. 9-11.
Fig 1. Concentration of ammonia in effluent from digester
Fig 2. Concentration of ammonia in digestate
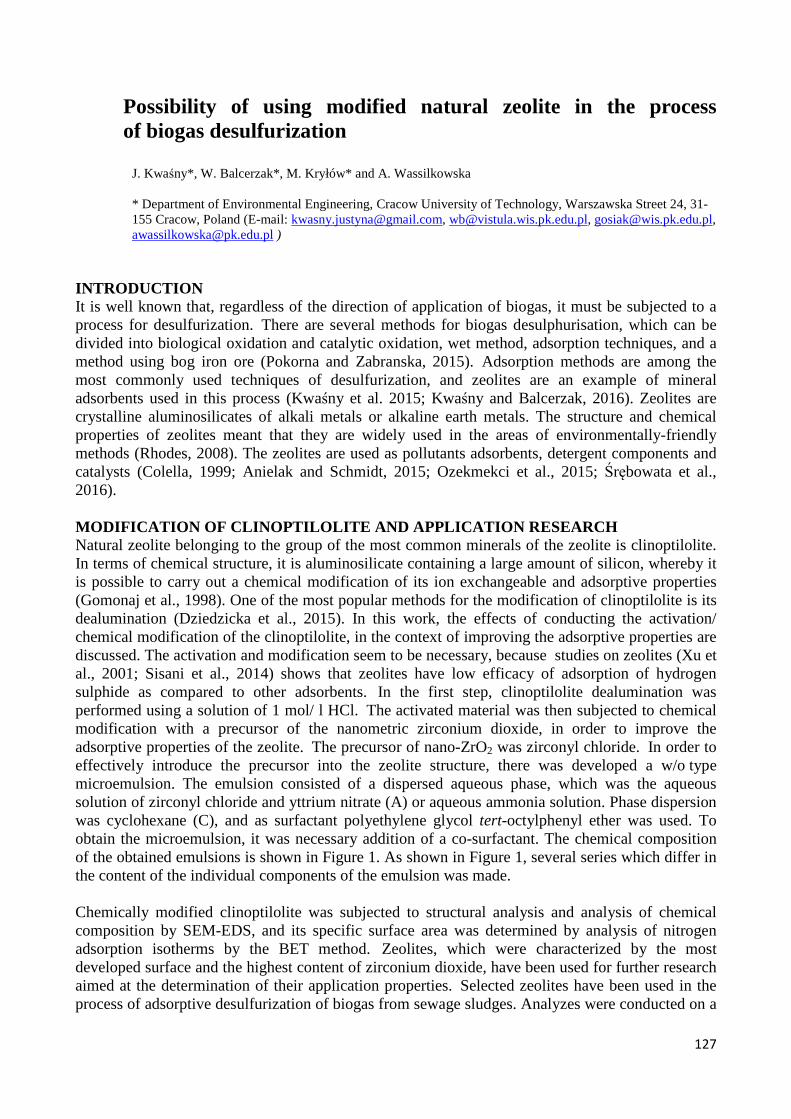
127
Possibility of using modified natural zeolite in the process of biogas desulfurization
J. Kwaśny*, W. Balcerzak*, M. Kryłów* and A. Wassilkowska * Department of Environmental Engineering, Cracow University of Technology, Warszawska Street 24, 31-155 Cracow, Poland (E-mail: [email protected], [email protected], [email protected], [email protected] )
INTRODUCTION It is well known that, regardless of the direction of application of biogas, it must be subjected to a process for desulfurization. There are several methods for biogas desulphurisation, which can be divided into biological oxidation and catalytic oxidation, wet method, adsorption techniques, and a method using bog iron ore (Pokorna and Zabranska, 2015). Adsorption methods are among the most commonly used techniques of desulfurization, and zeolites are an example of mineral adsorbents used in this process (Kwaśny et al. 2015; Kwaśny and Balcerzak, 2016). Zeolites are crystalline aluminosilicates of alkali metals or alkaline earth metals. The structure and chemical properties of zeolites meant that they are widely used in the areas of environmentally-friendly methods (Rhodes, 2008). The zeolites are used as pollutants adsorbents, detergent components and catalysts (Colella, 1999; Anielak and Schmidt, 2015; Ozekmekci et al., 2015; Śrębowata et al., 2016). MODIFICATION OF CLINOPTILOLITE AND APPLICATION RESE ARCH Natural zeolite belonging to the group of the most common minerals of the zeolite is clinoptilolite. In terms of chemical structure, it is aluminosilicate containing a large amount of silicon, whereby it is possible to carry out a chemical modification of its ion exchangeable and adsorptive properties (Gomonaj et al., 1998). One of the most popular methods for the modification of clinoptilolite is its dealumination (Dziedzicka et al., 2015). In this work, the effects of conducting the activation/ chemical modification of the clinoptilolite, in the context of improving the adsorptive properties are discussed. The activation and modification seem to be necessary, because studies on zeolites (Xu et al., 2001; Sisani et al., 2014) shows that zeolites have low efficacy of adsorption of hydrogen sulphide as compared to other adsorbents. In the first step, clinoptilolite dealumination was performed using a solution of 1 mol/ l HCl. The activated material was then subjected to chemical modification with a precursor of the nanometric zirconium dioxide, in order to improve the adsorptive properties of the zeolite. The precursor of nano-ZrO2 was zirconyl chloride. In order to effectively introduce the precursor into the zeolite structure, there was developed a w/o type microemulsion. The emulsion consisted of a dispersed aqueous phase, which was the aqueous solution of zirconyl chloride and yttrium nitrate (A) or aqueous ammonia solution. Phase dispersion was cyclohexane (C), and as surfactant polyethylene glycol tert-octylphenyl ether was used. To obtain the microemulsion, it was necessary addition of a co-surfactant. The chemical composition of the obtained emulsions is shown in Figure 1. As shown in Figure 1, several series which differ in the content of the individual components of the emulsion was made. Chemically modified clinoptilolite was subjected to structural analysis and analysis of chemical composition by SEM-EDS, and its specific surface area was determined by analysis of nitrogen adsorption isotherms by the BET method. Zeolites, which were characterized by the most developed surface and the highest content of zirconium dioxide, have been used for further research aimed at the determination of their application properties. Selected zeolites have been used in the process of adsorptive desulfurization of biogas from sewage sludges. Analyzes were conducted on a
128
laboratory scale.
Figure 1. The chemical composition of the microemulsion (VA/V- participation of the aqueous phase, VB/V- participation of the oil phase, VC/V- content of surfactant and co-surfactant). REFERENCES Anielak A. M., Schmidt R. (2015) Removal of As (III) and Cr (III) on modified clinoptilolite.
Polish Journal of Environmental Studies 24, 2, 477–482. Colella C. (1999) Natural zeolites in environmentally friendly processes and applications. Studies in
Surface Science and Catalysis, 125, 641–655. Dziedzicka A., Sulikowska B., Ruggiero-Mikołajczyk M. (2015) Catalytic and physicochemical
properties of modified natural clinoptylolite. Catalysis Today, 259, 50-58. Gomonaj V.I., Golub N.P., Szekeresh K.Y., Leboda R., Skubiszewska-Zięba J. (1998) On the utility
of transcarpathian clinoptylolite in the adsorption of Hg(II), Cr(III) and Ni(II) ions from aqueous solutions. Ochrona Środowiska, 4(71), 3-6.
Kwaśny J., Balcerzak W. (2016) Sorbents used for biogas desulfurization in the adsorption process. Polish Journal of Environmental Studies 25(1), 37-43, DOI: 10.15244/pjoes/60259
Kwaśny J., Balcerzak W., Rezka P. (2015) Application of zeolites for the adsorptive biogas desulfurization. Technical Transactions, Environmental Engineering, 3-Ś, 39-45
Ozekmekci M., Salkic G., Fellah M.F. (2015) Use of zeolites for the removal of H2S: A mini-review. Fuel Processing Technology, 139, 49-60.
Pokorna D., Zabranska J. (2015) Sulfur-oxidizing bacteria in environmental technology. Biotechnology Advances, 33, 6, 1246–1259
Rhodes C.J. (2008) Zeolite mediated reactions: Mechanistic aspects and environmental applications, Progress in Reaction Kinetics and Mechanism, 33,1, 1-79
Sisani E. et al. (2014) Adsorptive removal of H2S in biogas conditions for high temperature fuel cell systems, International Journal of Hydrogen Energy 39, 21753–21766
Śrębowata A., Tarach K., Girman V., Góra-Marek K. (2016) Catalytic removal of trichloroethylene from water over palladium loaded microporous and hierarchical zeolites, Applied Catalysis B: Environmental 181, 550–560.
Xu X., Yang W., Liu J., Lin L. (2001) Synthesis and perfection evaluation of NaA zeolite membrane. Separation and Purification Technology 25, 475–485.

129
Numerical analysis of a heat exchanger with differentiated temperatures surface at varying distances from the wall
M.Orłowska* * Technical University of Koszalin, Faculty of Civil Engineering, Environmental and Geodetic Sciences, al. Śniadeckich 2, 75-453 Koszalin, Poland (E-mail: [email protected])
INTRODUCTION When installing a radiator, we have to take many considerations into account, such as a wall with a window or interior, the distance from the floor and the sill or wall. It is also important to consider additional decorative covers. This article is a follow-up to the author's series on airflow for radiators operating under different boundary conditions The numerical analysis include in this issue refers to the proposed three heights of the location of the heater x at the wall (x1=1; x2=2; x3=2,5cm) Fig.1 with the differentiated temperatures surface set on the walls. Suggested distances let you determine which of the systems under test is the most efficient in terms of unit efficiency and thus the energy efficiency of the heat exchanger.
Figure 1. The scheme of testing stand
CONVECTION HEAT TRANSFER AND RADIATORS Convection occurs when we are dealing with the macroscopic movement of fluid particles (liquid or gas) in the direction of temperature drop. The movement of fluid molecules determines the heat flux and the temperature field. This term refers to the case of the energy flow between the moving fluid and the surface of the barrier at different baffle and plate temperatures. We divide it into natural and forced. With forced velocity fluids are much higher. The movement of heat during convection

130
coincides with conduction (Skoczylas, 1999). Currently, 90% of all radiators that are installed are plate radiators that are flat. They are characterized by low weight, low water content, nice appearance, large heat transfer surface, wide range of dimensions. The surfaces of the radiators can be smooth or wavy. There are solutions one and several rows. The front of these radiators gives off the heat by radiation and convection while the rear of the radiator mostlyby convection (Nantka, 2010). METHODOLOGY OF NUMERICAL RESEARCH All simulations were performed using the simulation code Ansys Mechanical APDL/CFD Flo Preferences for GUI Filtering Flotran CFD 2D Flotran 141 Library of Elements Types. The program is based on solving the balance equations of energy, momentum and mass used in CFD- Computational Fluid Dynamic model. The standard version of the simulation code allows you to conduct modeling based on traditional dependence phenomenological equations and additional closures, describing the previously mentioned turbulent momentum and energy streams. The test system was modeled in two-dimensional space. Program calculates after entering the boundary conditions: temperature of the walls of the heat exchanger, room air velocity. The article presents couple of selected systems with different geometry attempted to explain its effects on the intensity of heat exchange (heat transfer coefficient) (Ansys ver.12,1).
0,00E+00
1,00E+00
2,00E+00
3,00E+00
4,00E+00
5,00E+00
6,00E+00
7,00E+00
8,00E+00
9,00E+00
0 0,1 0,2 0,3 0,4 0,5 0,6
α [
W/m
2K
]
heigh of radiator [m]
α in height of radiator (side from canal)
2,5 cm
2 cm
1 cm
Figure 2. Heat transfer coefficient α in height of radiator function REFERENCES Ansys CFD, ver.12,1, Mechanical APDL Product Launcher, User Instruction. Nantka M.B. (2010) Ogrzewnictwo i ciepłownictwo, tom II, Wydawnictwo Politechniki Śląskiej,
27-28. Skoczylas A. (1999), Przenoszenie ciepła, Oficyna Wydawnicza Politechniki Wrocławskiej, 11.
131
Sewage Management Changes in the North-eastern Poland After Accession to the European Union
S. Skarżyński*, I. Bartkowska* * Department of Environmental Engineering Systems, Faculty of Civil and Environmental Engineering, Bialystok University of Technology, ul. Wiejska 45A, 15-351 Białystok , Poland (E-mail: [email protected]; [email protected])
INTRODUCTION Poland's accession to the European Union contributed to the infrastructure development of the whole country. One of the elements of the modernized infrastructure is the sewage network and facilities on this network, as well as facilities for waste water treatment and disposal of sludge. A wide stream of funds flowing to the country, and consequently also to the north-eastern Polish voivodeships, allowed modernization, organize, and sometimes the construction of waste water from this part of the country. CHARACTERISTICS OF NORTH-EASTERN POLAND VOIVODESHIP S The definition of north-eastern Poland defines three voivodships the Podlaskie Voivodeship (with the seat of the authorities in Bialystok), the Warmian-Masurian Voivodship (with the seat of the authorities in Olsztyn) and the Lublin Voivodship (with the seat of the authorities in Lublin). As of 31 December 2016, the voivodships covered by this area are inhabited by more than 4.76 million people on an area of nearly 70,000 km2, resulting in a population density of 68.5 persons/km2 (Central Statistical Office, 2017). Podlaskie The Podlaskie Voivodship is located in the north-eastern part of Poland, in the geographical center of Europe. The seat of the province authorities is Bialystok. The voivodship occupy the area of 20,187.02 km2 and is inhabited by 1,187,587 people, giving a population density of 58.8 persons/km2. The Podlaskie Voivodeship is divided into 14 counties (consisting of 118 communes) and 3 cities with county status. The largest cities are Bialystok (about 300 thousand inhabitants), Suwałki (about 70 thousand inhabitants) and Lomza (about 63 thousand inhabitants) (Central Statistical Office, 2017). Warmian-Masurian The Warmian-Masurian Voivodeship is located in the north-eastern part of Poland. The seat of the voivodship authorities is Olsztyn. The voivodeship occupy the area of 24,173.17 km2 and is inhabited by 1,437,812 people, giving a population density of 59.5 persons/km2. Warmian-Masurian Voivodship is divided into 19 counties (consisting of 116 communes) and 2 cities with county status. The largest cities are Olsztyn (about 173 thousand inhabitants), Elbląg (about 121 thousand inhabitants) and Elk (about 60 thousand inhabitants) (Central Statistical Office, 2017). Lublin Lubelskie Voivodeship is located in the northern part of Poland. The seat of the voivodship authorities is Lublin. The voivodeship occupy the area of 25,122.46 km2 and is inhabited by 2,133,340 people, giving a population density of 84.9 persons/km2. Lublin Voivodeship is divided into 20 counties (consisting of 213 communes) and 4 cities with county status. The largest cities are Lublin (about 340 thousand inhabitants), Zamość (about 65 thousand

132
inhabitants), Chełm (about 64 thousand inhabitants) and Biala Podlaska (about 57 thousand inhabitants) (Central Statistical Office, 2017). PARAMETERS OF WASTEWATER MANAGEMENT IN THE NORTH-EA STERN VOIVODSHPS OF POLAND The main factors and parameters that allow us to evaluate the development of the sewage management in north-eastern Poland are included: percentage of population using wastewater treatment plants, number of municipal sewage plants with the division of their type, number of industrial plants, number of no-flood tanks, amount of waste water purified in a year, amount of sludge produced in the year, pollution load in purification wastewater, design capacity of wastewater treatment plant, size of plant in population equivalent (PE), financial outlay for the construction and modernization of sewage networks and facilities. All data was obtained from the Local Data Bank provided by the Central Statistical Office. CHARACTERISTICS OF THE MOST IMPORTANT INVESTMENTS I N WASTE WATER MANAGEMENT From a number of investments in the field of waste water management carried out in the discussed area in the period after Poland's accession to the European Union, the most important were (www.mapadotacji.gov.pl, 2017):
• development and modernization of the water and sewage system in Bialystok and the commune of Wasilków (Podlaskie Voivodeship),
• improvement of water quality in Bialystok, sewage and sludge sector (Podlaskie Voivodship),
• modernization of sewage treatment plant and development of water and sewage infrastructure in Suwałki - stages I and II (Podlaskie Voivodeship),
• project "Water and sewage management in Olsztyn" (Warmian-Masurian voivodeship), • improving the water and sewage management of the agglomeration of Ełk (Warmian-
Masurian voivodeship); • construction of a factory wastewater treatment plant for Tymbark Sp. z o.o. Sp. k.
in Olsztyn (Warmian-Masurian Voivodship), • development and modernization of water supply and sewage disposal in Lublin (Lublin
Voivodeship), • Inter-communes water and sewage system project within the agglomeration of Puławy
(Lublin Voivodship), • modernization of the sewage treatment plant in Chelm, together with the development
of the water and sewage system (Lublin Voivodship). REFERENCES Central Statistical Office Department of Demography and Labor Market Research (2017)
Population and natural movement in 20016 in Poland, Warsaw. EU subsidy map (www.mapadotacji.gov.pl) [access 27.03.2017]. Operational Program Infrastructure and Environment (www.pois.gov.pl) [access 27.03.2017]. Ministry of Development of the Republic of Poland (www.mr.gov.pl) [access 27.03.2017]. Ministry of the Environment of the Republic of Poland (www.mos.gov.pl) [access 27.03.2017].

133
Model Studies on the Effectiveness of MBSBR Reactors for the Restoration of Small Water Reservoirs
K. Chmielowski*, A. Nowak**, R. Mazur**, E. Panek**, J., Chmist*** * Department of Sanitary Engineering and Water Management, University of Agriculture in Krakow, Mickiewicza Avenue 24-28, 30-059 Kraków, PL (E-mail: [email protected]) ** Department of Environmental Management and Protection, AGH University of Science and Technology, Poland, 30 Mickiewicza Avenue, 30-059 Krakow, PL (E-mail: [email protected], [email protected]) *** Department of Geoinformation, Photogrammetry and Remote Sensing of Environment, AGH University of Science and Technology, Poland, 30 Mickiewicza Avenue, 30-059 Krakow, PL (E-mail: [email protected]) **** Department of Ecology and Environmental Protection, Poznań University of Life Sciences, Piątkowska St. 94c, Poznan, 60-649, PL (E-mail: [email protected])
ABSTRACT The authors present the MBSBR model with a quasi-continuous flow for small water reservoir restoration, characterized by high concentrations of organic pollutants. To determine the efficiency of waste water treatment the laboratory analysis of physic-chemical parameters were conducted for the model on a semi-technical scale of 1: 3. Wastewater treatment process was carried out in 24 h for 1 m3 for raw sewage. The startup period was 2 weeks for all biofilters (biological beds). Approximately 50% reduction in COD and BOD5 was obtained on average for the studied bioreactors. Significant improvements were achieved in clarity of the treated wastewater, with the reduction of suspension by 60%. The oxygen profile has improved significantly in 7 to 9 hours of the process, and a diametric reduction in the oxidative reduction potential was recorded. A preliminary model of biological treatment effectiveness was determined based on the conducted studies. In final stages the operation mode was set in real conditions of polluted water reservoirs. Introduction and Methods The application of MBBR reactors in the wastewater treatment of various types of sewage (industrial and communal) is already conducted on global scale (Leiknes and Ødegaard, 2007; McQuarrie and Boltz, 2011). MBBR technology is particularly valuable for the environmental biotechnology purposes (Ødegaard et al., 2004; Hosseiny et al., 2002) because is characterized by: high efficiency of wastewater treatment; tolerance for changes in physicochemical parameters (temp., pH, redox, etc.) and high levels of organic loads. The authors have constructed a MBBR prototype for restoration of small water reservoirs highly contaminated by organic compounds. Hydraulic tests for the developed bioreactors were performed in an experimental water pool. Tested reactors were models in scale 1:1. The biotechnological studies such as efficiency of wastewater treatment were conducted in the reactor model in the scale 1:3. The process of wastewater treatment was carried out for municipal sewage under fixed conditions for a volume of V = 1m3. The startup period of biological bed took about 2 weeks. After that time a stable process of wastewater treatment was achieved. Three MBBR reactors (with aeration in fine bubble mode by disc diffusors) and one MBBR (with aeration in mode of air-lift reactor) were tested. The physicochemical parameters of the process (e.g. pH, red-ox, O2, etc.) were monitored during wastewater treatment. Laboratory analyses such as COD, BOD5 and s.m. have been carried out, as well as selected forms of nutrients were determined.

134
Results and Discussion The obtained results indicate a significant efficiency of the sewage treatment in the period of 24 h for tested installation on semi-technical scale. Similar results are also confirmed by many authors (Ødegaard et al., 2004, Ivanovic and Leiknes, 2008, Miksch and Sikora, 2010). COD reduction efficiency reached more than 50% for the MBBR reactors (52 - 82%) and BOD5 was in the range 65% - 89%. The results for air-lift reactor were significantly worse than those for the MBBR reactors. The COD reduction ranged from 36.6% to 62% and BOD5 – from 57% to 78%. Suspended matter reduction was on the level of 60-89% for MBBR and 37- 60% for air-lift reactor, what was reflected in the clarified final effluents. The results of the correlation analysis of the oxygen concentrations in the tested reactors showed better wastewater treatment efficiency for the MBBR reactors compared to the air-lift reactor. Laboratory analysis of selected nutrients also indicated a significant reduction in concentrations of ammonium and phosphate ions. The differences in nitrate and nitrite concentrations should be interpreted in relation to sampling mode and aerators’ operation. Although the sewage treatment process in model bioreactors was conducted in quasi-flow mode, nevertheless the obtained efficiencies allow us to conclude that the tested technologies are promising for the application in the reclamation of small water reservoirs. Hydraulic and biotechnological studies allowed better estimation of the number of reactors necessary in the restoration of polluted water reservoirs, with respect to its capacity. The proposed method of reclamation with MBBR reactors can be compared to the in-situ WTP (wastewater treatment plant) technology. The high stability of the wastewater treatment process makes these types of reactors particularly valuable in temperate climate zones (Rusten et al., 2006). REFERENCES Hosseiny, S. H., & Borghei, S. M. (2002). Modelling of organic removal in a moving bed biofilm
reactor (MBBR). Scientia Iranica, 9(1), 53-58. Ivanovic I. and Leiknes T. (2008). Impact of aeration rates on particle colloidal fraction in the
biofilm membrane bioreactor (BF-MBR). Desalination, 231(1), 182-190. Leiknes T. and Ødegaard H. (2007). The development of a biofilm membrane bioreactor.
Desalination, 202(1), 135-143. McQuarrie J. P. and Boltz J. P. (2011). Moving bed biofilm reactor technology: process
applications, design, and performance. Water Environment Research,83(6), 560-575. Miksch K., Sikora J. (2010). Biotechnologia ścieków” Wydawnictwo Naukowe PWN. Ødegaard, H., Rusten, B., & Wessman, F. (2004). State of the art in Europe of the moving bed
biofilm reactor (MBBR) process. In Proceedings of the 77th Annual Water Environment Federation Technical Exposition and Conference, New Orleans, Louisiana, Oct (pp. 2-6).
Rusten, B., Eikebrokk, B., Ulgenes, Y., & Lygren, E. (2006). Design and operations of the Kaldnes moving bed biofilm reactors. Aquacultural engineering, 34(3), 322-331.

135
Characteristics of Bionor-type SBR waste water treatment plant B. K. Wilk*, M. Cimochowicz - Rybicka* * Institute of Water Supply and Environmental Protection, Cracow University of Technology, Warszawska 24, 31-155 Cracow, Poland (e-mail: [email protected])
INTRODUCTION SBR (Sequencing Batch Reactor) combines the functions of activated sludge chamber and the secondary sedimentation basin within a single tank. Biological treatment with the use of aerobic and anaerobic processes, as well as separation of activated sludge from effluent all occur within a single tank. The changes in the composition of the waste water incoming to the treatment plant necessitate the changes of duration of specific stages of the treatment cycle (Anielak 2006). The SBR operation cycle, during which organic matter, as well as nitrogen and phosphorus compounds are removed from the waste water, includes the time necessary to fill the reactor, perform biological treatment of waste water, separate activated sludge from effluent, partial discharge of effluent from the treatment plant, removal of excess sludge, and also includes the downtime. The “Bionor” technology is based on an activated sludge system using sequential batch reactors. Presented below is the block diagram of the waste water treatment plant in question:
Figure 1. Block diagram of the Bionor 0203 MATERIALS & METHODS: The aim of the study was to determine the efficiency of operation of Bionor 0203 waste water treatment plants located on the premises of mountain National Parks: 1. Waste water treatment plant on West Spitsbergen (Sør-Spitsbergen National Park); 2. Waste water treatment plant in the PTTK (Polish Tourist and Sightseeing Society) Shelter Murowaniec (Tatra National Park); 3. Waste water treatment plant in the PTTK Shelter Five Ponds Valley (Tatra National Park); 4. Waste water treatment plant in the PTTK Shelter on Markowe Szczawiny (Babia Góra National Park). The waste water treated in the plants is domestic sewage; however, due to the water saving policy in the mountain shelters and the polar station, the waste water parameters are significantly higher than typical for this type of sewage. Two oxygen indicators were quantified: BOD5 and COD. A comparison was run of the values of the quantified indicators characterising the influent and effluent samples. Spitsbergen waste water treatment plant Influent samples were collected after the bag-type grating, whereas the effluent was sampled at the treatment plant outlet. The sewage was frozen in the polar station and then moved to a cold room on a ship where they were stored for seven days without light. The BOD5 was quantified in 2009, using the measurement range of 0-40 mg O2/dm3 for the effluent, and 0-400 mg O2/dm3 for the influent.
Leachate
Influent
Leachate pumping station
Sludge dryers
Effluent
Effluent pumping station
Sludge bags
Discharge
Excess sludge
Bag-type grating
Storage reservoi
r
Sequencing batch
reactors

136
The samples were incubated for five days and stirred at 20°C in a thermostatic cabinet. The COD was quantified using the measurement range of 100-1,500 mg/dm3 for both influent and effluent. Quantification was performed with the use of dichromate cell method. Waste water treatment plants in: PTTK Shelter Murowaniec, PTTK Shelter Five Ponds Valley, and PTTK Shelter on Markowe Szczawiny The analysis of influent and effluent was performed by an accredited laboratory on composite samples collected proportionally to the time. The analysis was performed in October 2016 (PTTK Shelter Murowaniec and PTTK Shelter on Markowe Szczawiny), and in November 2016 (PTTK Shelter Five Ponds Valley). The influent samples were collected from the influent sampling tanks, while effluent samples were collected from the effluent sampling tanks. The COD was quantified using a method compliant with the PN-ISO 6060:2006 standard, while BOD5 was quantified using a method compliant with the PN-EN 1899-:2002 and PN-EN ISO 5814:2013 - 04E standards. RESULTS As shown by the analytical studies, the average COD values of influent for the Markowe Szczawiny treatment plant reached 3,790 mg/dm3, for the Murowaniec treatment plant - 920 mg/dm3, for the Five Ponds Valley treatment plant - 1,298 mg/dm3, and for West Spitsbergen - 2,301 mg/dm3. The values of the quantified indicators were significantly higher than typical values for domestic sewage. The COD of the influent to the treatment plant was similar to that of industrial sewage. The following average COD values in the effluent were observed: Markowe Szczawiny - 106 mg/dm3; Murowaniec - 77 mg/dm3; Five Ponds Valley - 58 mg/dm3; West Spitsbergen - 1,288 mg/dm3. The average COD reduction efficiency was as follows: Markowe Szczawiny - 97%; Murowaniec - 92%; Five Ponds Valley - 95%; West Spitsbergen - 44%. The average BOD5 values in the influent were as follows: Markowe Szczawiny - 106 mg/dm3; Murowaniec - 310 mg/dm3; Five Ponds Valley - 370 mg/dm3; West Spitsbergen - the quantified BOD5
values (>480 mg/dm3) of the influent are inaccurate and fail to clearly specify the values of those parameters. The average BOD5 values for the effluent were as follows: Markowe Szczawiny - 22 mg/dm3; Murowaniec - 23 mg/dm3; Five Ponds Valley - 13 mg/dm3; Polish Polar Station on West Spitsbergen - 500 mg/dm3.The average BOD reduction efficiency was as follows: Markowe Szczawiny - 79%; Murowaniec - 92%; Five Ponds Valley - 96%. CONCLUSIONS On the basis of the analysis of the study outcomes, the following conclusions are made: - the average BOD5 reduction efficiency in waste water treatment plants in Polish national parks
was very high, falling within the range of 79 - 96%. - the average CODCr reduction efficiency in waste water treatment plants in Poland ranged from
92% to 97%. This confirms very high efficiency of the treatment plants in question. - Unfortunately, the absence of the precise value of the BOD5 of the effluent from the
Spitsbergen waste water treatment plant makes it impossible to accurately assess the effect of biological waste water treatment for that site. We may conclude that the effluent charge is over 15 times higher. The average COD reduction efficiency was low and reached only 44%. The reasons behind the unfavourable outcome of the analysis of the waste water treatment plant analysis undoubtedly included: the specific climate of West Spitsbergen, as well as incorrect sampling and storage of samples until analysis.
REFERENCES Anielak Anna M. (2006) Niekonwencjonalne metody usuwania substancji biogennych w
bioreaktorach sekwencyjnych (Unconventional methods of biogenic substance removal in sequencing batch reactors), Gaz, woda i technika sanitarna, 2, 23-27
“Bionor” informational materials, Kielce 2001 (http://www.bionor.pl).

137
Long-term operation of IFAS-MBBR wastewater treatment plant – the activity of activated sludge and biofilm
P. Piechna*, M. Żubrowska-Sudoł* and Ł. Przysiecka** * Department Water Supply and Wastewater Treatment, Faculty of Building Services, Hydro and Environmental Engineering, Warsaw University of Technology, Nowowiejska 20, 00-653 Warsaw (E-mail: [email protected]; [email protected]) ** NanoBioMedical Centre UAM, Umultowska 85, 61-614 Poznań (E-mail: [email protected])
INTRODUCTION Hybrid processes of wastewater treatment combine suspended (activated sludge) and attached (biofilm) growth, and were developed to enhance biological carbon, nitrogen and phosphorus removal. In IFAS-MBBR (Integrated Fixed-film Activated Sludge – Moving Bed Biofilm Reactor), the biomass is immobilized on freely moving carriers. Such solutions allow for reduction of required volume of the biological reactor due to higher biomass amount in the tank. Presence of attached biomass can provide longer solids retention time (SRT) thus enhancing nitrification and denitrification (Kim et al., 2011). Moreover, it was reported, that such systems are more stable, an improvement in robustness and resistance to varying loads were observed (Onnis-Hayden et al., 2011). Although IFAS technology is widely described in the literature, there is still a lack of long-term analysis of objects working in full-scale. In this study an analysis covering 14 years of full-scale IFAS-MBBR wastewater treatment plant was presented. Additionally, batch tests were conducted to compare the efficiencies of C and N removal by activated sludge and biofilm and real-time PCR analysis of samples of attached and suspended biomass was conducted. METHODS Wastewater treatment plant. The municipal wastewater treatment plant (WWTP) is located in Pajęczno, in southwestern Poland (51°8’55”S 18°58’25”E) and receives municipal wastewater from population equivalent around 11 – 12 thousand (depending on the season). Biological nutrient removal (BNR) at this WWTP is achieved in IFAS-MBBR, where as the biofilm carriers EvU-Pearl (active surface of 800 m2/m3; carrier filling ratio in aerobic reactor – 10%) were used. Over the years 2003 – 2016 given data was collected: flow rates and chemical analyses of raw and treated wastewater. Additionally, in years 2005 and 2016, total volatile solids of activated sludge and biofilm were assessed. Batch tests of C and N removal. The batch tests were conducted in 5 L test reactors, aerated throughout the experiment. The experiments were conducted for 3 different variants, in which, as the biomass: 1) activated sludge was used, 2) biofilm attached to moving carriers was used, 3) activated sludge and biofilm were used. The tests were conducted for 4 hours and every 30 min a sample was collected. Chemical analysis covered: COD, N-NH4
+, N-NO2-, N-NO3
-, TKN, pH, alkalinity. Based on obtained results, the efficiency of C and N removal were calculated. Real-time polymerase chain reaction (qPCR). The abundance of ammonia-oxidizing bacteria (AOB) and nitrite oxidizing bacteria (NOB) was investigated by using qPCR. The DNA was extracted from the samples by using XpeditionTM Soil/Fecal DNA MiniPrep (Zymo Research, USA). The qPCR reactions were performed according to methodology presented by Tsushima et al.
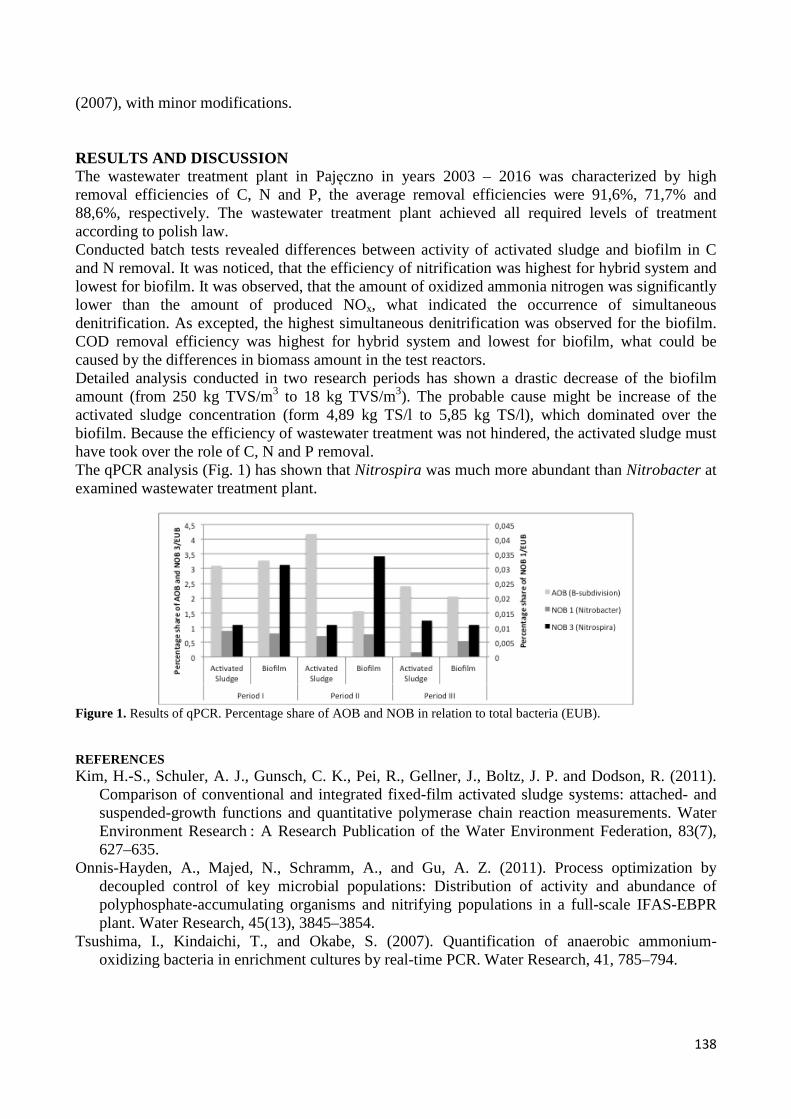
138
(2007), with minor modifications. RESULTS AND DISCUSSION The wastewater treatment plant in Pajęczno in years 2003 – 2016 was characterized by high removal efficiencies of C, N and P, the average removal efficiencies were 91,6%, 71,7% and 88,6%, respectively. The wastewater treatment plant achieved all required levels of treatment according to polish law. Conducted batch tests revealed differences between activity of activated sludge and biofilm in C and N removal. It was noticed, that the efficiency of nitrification was highest for hybrid system and lowest for biofilm. It was observed, that the amount of oxidized ammonia nitrogen was significantly lower than the amount of produced NOx, what indicated the occurrence of simultaneous denitrification. As excepted, the highest simultaneous denitrification was observed for the biofilm. COD removal efficiency was highest for hybrid system and lowest for biofilm, what could be caused by the differences in biomass amount in the test reactors. Detailed analysis conducted in two research periods has shown a drastic decrease of the biofilm amount (from 250 kg TVS/m3 to 18 kg TVS/m3). The probable cause might be increase of the activated sludge concentration (form 4,89 kg TS/l to 5,85 kg TS/l), which dominated over the biofilm. Because the efficiency of wastewater treatment was not hindered, the activated sludge must have took over the role of C, N and P removal. The qPCR analysis (Fig. 1) has shown that Nitrospira was much more abundant than Nitrobacter at examined wastewater treatment plant.
Figure 1. Results of qPCR. Percentage share of AOB and NOB in relation to total bacteria (EUB). REFERENCES Kim, H.-S., Schuler, A. J., Gunsch, C. K., Pei, R., Gellner, J., Boltz, J. P. and Dodson, R. (2011).
Comparison of conventional and integrated fixed-film activated sludge systems: attached- and suspended-growth functions and quantitative polymerase chain reaction measurements. Water Environment Research : A Research Publication of the Water Environment Federation, 83(7), 627–635.
Onnis-Hayden, A., Majed, N., Schramm, A., and Gu, A. Z. (2011). Process optimization by decoupled control of key microbial populations: Distribution of activity and abundance of polyphosphate-accumulating organisms and nitrifying populations in a full-scale IFAS-EBPR plant. Water Research, 45(13), 3845–3854.
Tsushima, I., Kindaichi, T., and Okabe, S. (2007). Quantification of anaerobic ammonium-oxidizing bacteria in enrichment cultures by real-time PCR. Water Research, 41, 785–794.
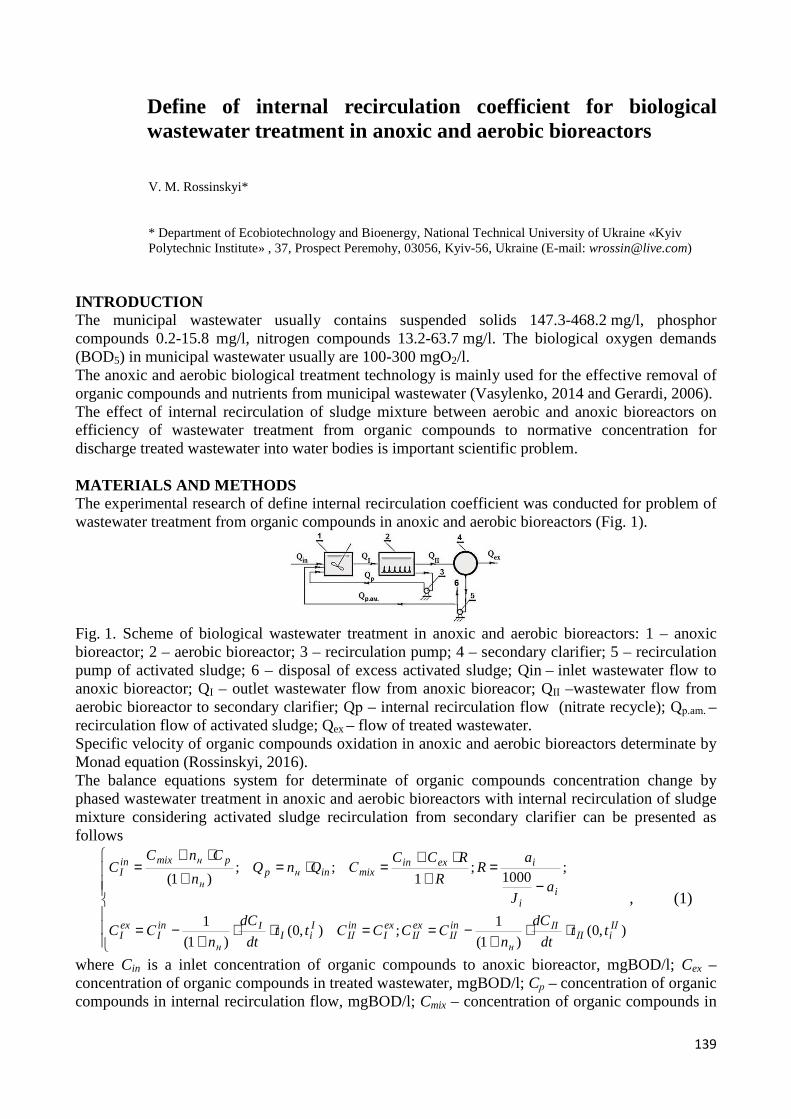
139
Define of internal recirculation coefficient for biological wastewater treatment in anoxic and aerobic bioreactors V. M. Rossinskyi* * Department of Ecobiotechnology and Bioenergy, National Technical University of Ukraine «Kyiv Polytechnic Institute» , 37, Prospect Peremohy, 03056, Kyiv-56, Ukraine (E-mail: [email protected])
INTRODUCTION The municipal wastewater usually contains suspended solids 147.3-468.2 mg/l, phosphor compounds 0.2-15.8 mg/l, nitrogen compounds 13.2-63.7 mg/l. The biological oxygen demands (BOD5) in municipal wastewater usually are 100-300 mgО2/l. The anoxic and aerobic biological treatment technology is mainly used for the effective removal of organic compounds and nutrients from municipal wastewater (Vasylenko, 2014 and Gerardi, 2006). The effect of internal recirculation of sludge mixture between aerobic and anoxic bioreactors on efficiency of wastewater treatment from organic compounds to normative concentration for discharge treated wastewater into water bodies is important scientific problem. MATERIALS AND METHODS The experimental research of define internal recirculation coefficient was conducted for problem of wastewater treatment from organic compounds in anoxic and aerobic bioreactors (Fig. 1).
Fig. 1. Scheme of biological wastewater treatment in anoxic and aerobic bioreactors: 1 – anoxic bioreactor; 2 – aerobic bioreactor; 3 – recirculation pump; 4 – secondary clarifier; 5 – recirculation pump of activated sludge; 6 – disposal of excess activated sludge; Qin – inlet wastewater flow to anoxic bioreactor; QI – outlet wastewater flow from anoxic bioreacor; QIІ –wastewater flow from aerobic bioreactor to secondary clarifier; Qр – internal recirculation flow (nitrate recycle); Qр.am. – recirculation flow of activated sludge; Qex – flow of treated wastewater. Specific velocity of organic compounds oxidation in anoxic and aerobic bioreactors determinate by Monad equation (Rossinskyi, 2016). The balance equations system for determinate of organic compounds concentration change by phased wastewater treatment in anoxic and aerobic bioreactors with internal recirculation of sludge mixture considering activated sludge recirculation from secondary clarifier can be presented as follows
⋅⋅+
−==⋅⋅+
−=
−=
+⋅+
=⋅=+
⋅+=
),0()1(
1;),0(
)1(
1
;1000
;1
;;)1(
IІiІI
ІI
н
inIІ
exIІ
exI
inIІ
IiI
I
н
inI
exI
ii
iexinmixinнp
н
pнmixinI
ttdt
dC
nСCCСtt
dt
dC
nСC
aJ
aR
R
RCCСQnQ
n
CnCC
, (1)
where Cin is a inlet concentration of organic compounds to anoxic bioreactor, mgBOD/l; Cex – concentration of organic compounds in treated wastewater, mgBOD/l; Cр – concentration of organic compounds in internal recirculation flow, mgBOD/l; Cmix – concentration of organic compounds in

140
mixture of activated sludge and wastewater, mgBOD/l; nн – internal recirculation coefficient, fraction of 1; CI – concentration of organic compounds in anoxic bioreactor, mgBOD/l; tІ – duration of wastewater treatment in anoxic bioreactor, hour; CIІ – concentration of organic compounds in sludge mixture in aerobic bioreactor, mgBOD/l; tІІ – duration of wastewater treatment in aerobic bioreactor, hour; Ji – index of activated sludge, cm3/g; R – coefficient of activated sludge recirculation, fraction of 1. The complex computational experiment for define of internal recirculation coefficient was conducted for wastewater containing biodegradable organic compounds with concentration Cin = 300 mgBOD/l by dose of activated sludge ia =2 g/l, dissolved oxygen concentration in anoxic bioreactor 0,1 mg/l, dissolved oxygen concentration in aerobic bioreactor 2 mg/l, index of activated sludge 80 cm3/g, concentration of nitrate 5 mgN-NO3
-1/l. RESULTS AND DISCUSSIONS By results of experiment was defined increasing duration of wastewater treatment in aerobic condition, for example twice, can effectively remove organic compounds from wastewater to normative concentration for discharge treated wastewater into water bodies (15 mgBOD/l) while reducing values of internal recirculation coefficient to 57% (Fig. 2).
Figure 2. Dependences of the concentration of biodegradable organic compounds (BOD) from coefficient of internal recirculation of sludge mixture and duration of wastewater treatment in anoxic (0.5 hour) and aerobic bioreactors (hour): 1 – 0,5; 2 – 1; 3 – 1,5; 4 – 2; 5 – 2,5; 6 – 3. CONCLUSION The internal recirculation coefficient for biological wastewater treatment in anoxic and aerobic bioreactors is important for choosing the exploitation technological parameters of bioreactors with recirculation of sludge. The internal recirculation coefficient influence the kinetic parameters wastewater treatment from organic compounds due to the redistribution of their concentration in anoxic and aerobic bioreactors. Define of internal recirculation coefficient can be determined by iterative computation by the balance equations system (1) for biological wastewater treatment in anoxic and aerobic bioreactors from organic compounds to normative concentration for discharge treated wastewater into water bodies. REFERENCES Michael, H. Gerardi (2006). Wastewater Bacteria. John Wiley & Sons Inc (Verlag). Rossinskyi, V. (2016) The rate of oxidation of organic compounds in the bioreactors on the extent
of biodegradation of synthetic detergent // Bulletin of National University of Water Management and Nature Resources Use. Vol. 3(75), 148–154. (in Ukrainian).
Vasylenko, O., Polishchuk, O., Vasylenko, L. (2014) The applying of the technology of biological wastewater treating from compounds of nitrogen and phosphorus in city treatment plants. Ecological safety and Environmental Sciences, No. 15, 90-101. (in Ukrainian).
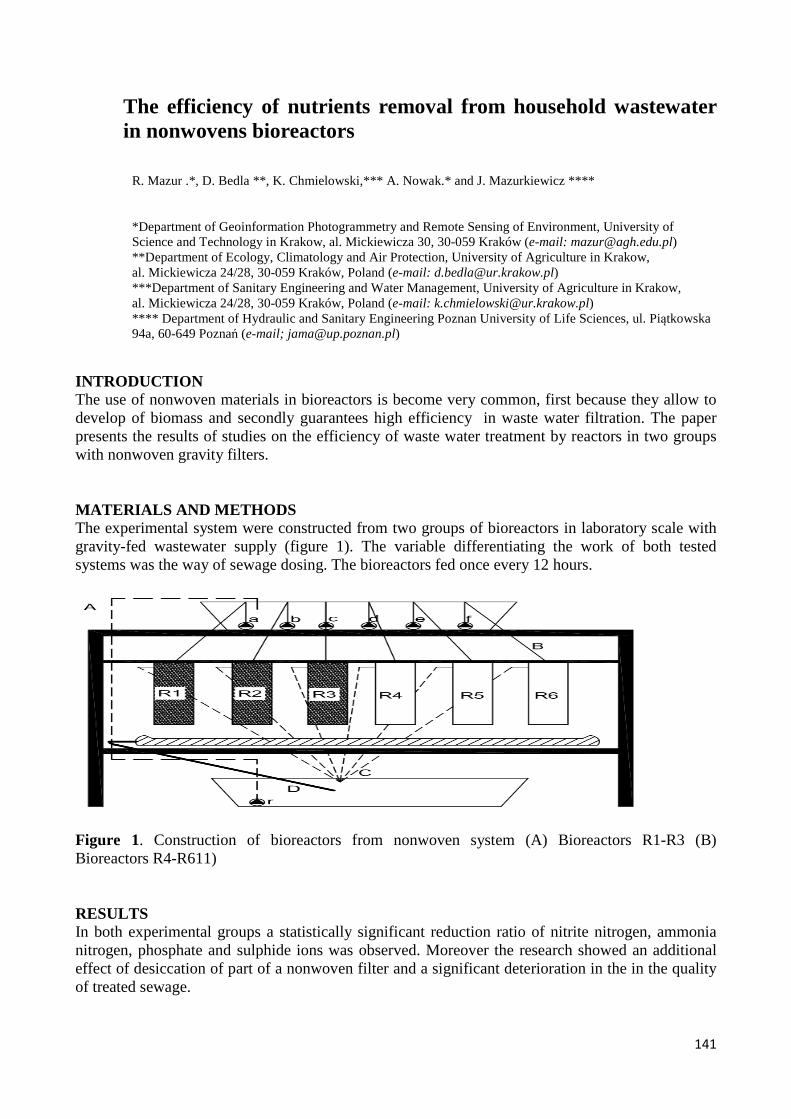
141
The efficiency of nutrients removal from household wastewater in nonwovens bioreactors
R. Mazur .*, D. Bedla **, K. Chmielowski,*** A. Nowak.* and J. Mazurkiewicz **** *Department of Geoinformation Photogrammetry and Remote Sensing of Environment, University of Science and Technology in Krakow, al. Mickiewicza 30, 30-059 Kraków (e-mail: [email protected]) **Department of Ecology, Climatology and Air Protection, University of Agriculture in Krakow, al. Mickiewicza 24/28, 30-059 Kraków, Poland (e-mail: [email protected]) ***Department of Sanitary Engineering and Water Management, University of Agriculture in Krakow, al. Mickiewicza 24/28, 30-059 Kraków, Poland (e-mail: [email protected]) **** Department of Hydraulic and Sanitary Engineering Poznan University of Life Sciences, ul. Piątkowska 94a, 60-649 Poznań (e-mail; [email protected])
INTRODUCTION The use of nonwoven materials in bioreactors is become very common, first because they allow to develop of biomass and secondly guarantees high efficiency in waste water filtration. The paper presents the results of studies on the efficiency of waste water treatment by reactors in two groups with nonwoven gravity filters. MATERIALS AND METHODS The experimental system were constructed from two groups of bioreactors in laboratory scale with gravity-fed wastewater supply (figure 1). The variable differentiating the work of both tested systems was the way of sewage dosing. The bioreactors fed once every 12 hours.
Figure 1. Construction of bioreactors from nonwoven system (A) Bioreactors R1-R3 (B) Bioreactors R4-R611) RESULTS In both experimental groups a statistically significant reduction ratio of nitrite nitrogen, ammonia nitrogen, phosphate and sulphide ions was observed. Moreover the research showed an additional effect of desiccation of part of a nonwoven filter and a significant deterioration in the in the quality of treated sewage.

142
CONCLUSIONS The tested systems of reactors provide the scientific promises for their use on an industrial scale as a system with partial treatment household sewage. The contents of nutrients in treated wastewater, however still exceeds the permissible level specified in the standard for treated sewage. In spite of marked difference between concentrations of investigated nutrient in treated wastewater between the experimental groups wasn’t possible to demonstrate in most cases the statistically significant differences. REFERENCES Abegglen, C., Ospelt, M., Siegrist, H. (2008) Biological nutrient removal in a small-scale MBR
treating household wastewater; Water Research, 42, 338-346. Bounds, T.R, Ball, H.L, Ball, E.S. (2003) Wastewater treatment system utilizing textile filter
media. United State Patent, Patent No. US 6540920 B2, Apr. 1, 2003. Chmielowski, K., Ślizowski, R. (2008) Defining the optimal range of a filter bed's d10 replacement
diameter in vertical flow sand filters. Environment Protection Engineering 3/2008, 35-42. Konieczny, K. (2015) Efektywność oczyszczania ścieków przy zastosowaniu reaktora
membranowego. Rocznik Ochrony Środowiska , 17, 1034-1052 (in Polish). Korkut, E. N, Martin, J.P, Yaman, C. (2006) Wastewater treatment with biomass attached to porous
geotextile baffles. J. Environ. Eng., 132, 2, 284–288. Loomis, G., Dow, D., Jobin J., Herron E., A. Gold, A., Stolt, M., Błażejewski, G. (2004) Long-
term treatment performance of innovative systems. Proc. of the X Nat. Symposium on Ind. And Small Com. Sewage Systems. ASAE. Sacramento 2004.
Ren, X., Shon, H.K., Jang, N., Lee Y., Lee J., Cho, K., Kim, I. (2010) Novel membrane bioreactor (MBR) coupled with a nonwoven fabric filter for household wastewater treatment. Water Research, 44, 3, 751-760.
Spychała, M., Łucyk, P. (2015) Effect of Thickness of Textile Filter on Organic Compounds and Nutrients Removal Efficiency at Changeable Wastewater Surface Level. Science, Nature, Technologies/Nauka, Przyroda, Technologie, 9, 3.
Szewczyk, K. (2007) Bioreaktory membranowe w ochronie środowiska. Wodociągi i Kanalizacja, 39(5), 61–63 (in Polish).
Turbak A.F, (1993) Nonwovens: Theory, Process, Performance, and Testing, Tappi Press, Atlanta, Georgia.

143
Measurement of hydrogen sulphide concentration in selected places of Sewage Treatment Plant Cracow Płaszów II
Z. Podraza*, B. Dąbrowska*, T. Żaba* * Institute of Water Supply and Environmental Protection, Cracow University of Technology, Warszawska street 24, 31-155 Cracow, Poland (E-mail: [email protected]; [email protected]; [email protected])
INTRODUCTION Hydrogen sulphide (H2S) is a strong toxic gas which has the characteristic smell of rotten eggs. H2S is responsible for toxic environment causes a wide range of health effect such as breathing difficulties, irritation of eyes and skin and even death. Hydrogen sulphide contributes toward the corrosion of sewer systems especially of concrete pipes or metallic parts of reinforcement. H2S is produced during decomposition of organic matter and it is emitted into the sewer atmosphere. In the next step hydrogen sulphide is absorbed by concrete surfaces exposed to the sewer atmosphere and subsequently oxidized to sulphuric acid (H2SO4). It is the beginning of corrosion of concrete. Sewage Treatment Plant Cracow Płaszów II has started activity in 1974. In the mid of 1976 it reached the projected capacity of 132 thousand m³/hour. Sewage Treatment Plant consist of biological and mechanical part. Maximum capacity of the Plant is 328,000 m3/day and their average flow of wastewater is 150,000 m3/day. After the purification process, sewage from Treatment are drained to the river Drwin, which is the tributary of the Vistula River. Material and methods The measurement of hydrogen sulphide concentration were conducted in selected places with a use of Draeger multigas meter. The concentrations of hydrogen sulphide were measured in the following locations: Sewage Collection Station, Initial Pumping Station (Coarse Grid), Fine Grid Filtration Building, Initial Sediment Pumping Station, Compaction and Sediment De-watering Station, pressure pipework outlet from Złocień residential area and Biogas De-sulphurisation Station. The measurements were carried out from November 2016 to April 2017. Results Results of the research were as follow: The Sewage Collection Station: 5–174 ppm, The Initial Sediment Pumping Station: 2–18 ppm, the pressure pipework outlet from example residential area: 1–11 ppm and The Biogas De-sulphurisation Station: 15,4–183 ppm. There was no detection of hydrogen sulphide in The Initial Pumping Station (Coarse Grid), in The Fine Grid Filtration Building and The Compaction and Sediment De-watering Station. CONCLUSION The research conducted in Sewage Treatment Plant Cracow Płaszów II indicates the presence of H2S in the area of Sewage Treatment Plant. The range of concentrations of H2S differed depending on the place and area. The highest concentration of hydrogen sulphide was observed in The Biogas De-sulphurisation Station (183 ppm) and in The Sewage Collection Station (174 ppm). It is important to determine the dependence of the concentration of hydrogen sulphide in relation to composition of the wastewater.

144
Table 1. The concentration of H2S in selected locations of Sewage Treatment Plant Cracow Płaszów II. Place
Concentration of hydrogen sulphide
min (ppm)
max (pmm)
average (ppm)
Sewage Collection Station 5 174 46,6
Initial Sediment Pumping Station 2 18 6,6
pressure pipework outlet from Złocień residential area Biogas De-sulphurisation Station
1
15,4
11
183
4,7
111,6
REFERENCES Hvitved-Jacobsen T., Vollertsen J., Nielsen A. H. (2013) Sewer Processes: Microbial and Chemical
Process Engineering of Sewer Networks, CRC Press, Boca Raton, 2013, 12-16, 81, 246. Jegatheesan V., Abdikheibari S., Marleni N. (2015) Estimating hydrogen sulphide dissipation rate
constant under the influence of different chemical dosing. International Biodeterioration and Biodegradation, 101(2015), 47–55.
Jiang G., Sun J., Sharma K. R., Yuan Z. (2015) Corrosion and odor management in sewer systems. Current Opinion in Biotechnology, 33(2015), 192–197.
Jiang G., Sun X., Keller J., Bond P.L. (2015) Identification of controlling factors for the initiation of corrosion of fresh concrete sewers, Water Research, 80 (2015), p. 30–40.
Nielsen A. H., Vollertsen J., Jensen H. S., Wium-Andersen T., Hvitved-Jacobsen T. (2008) Influence of pipe material and surfaces on sulfide related ador and corrosion in sewers. Water Research, 42(2008), 4206-4214.

145
Possibilities of using water treatment sludge in sewage sludge dewatering
J. Górka*, M. Cimochowicz-Rybicka*, M. Kryłów*
*Department of Environmental Engineering, University of Technology, 24 Warszawska, Cracow 31-155, Poland (E-mail: [email protected]; [email protected], [email protected])
INTRODUCTION Sewage sludge is the main wastewater treatment product. The most important in its processing and utilization have their volume and hydration (Wolski et al., 2011). These parameters affect on technological process and the costs of processing. The various conditioning processes are carried out to improve dewaterability of sewage sludge. Nevertheless, the selection of the optimum and the most effective ways of conditioning is still an open question (Dębowski et al., 2008). The supplement of commonly techniques of sewage sludge conditioning during its dewatering is possibility to use the water treatment sludge as a polymer which improves the dewaterability of sewage sludge. USING WATER TREATMENT SLUDGE IN SEWAGE SLUDGE DEWAT ERING Studies have shown that application of water treatment sludge in conditioning and dewatering process of sewage sludge improves the treatability of sewage sludge (Ahmad et al., 2016). Especially, alum sludge enhanced dewaterability of sewage sludge (Lai & Liu, 2004; Yang et al., 2007). On the other hand, there is not much research involved with the filtration properties of sewage sludge co-digested with water treatment sludge. Płonka and Barbusiński (2010) in their research used water treatment sludge during the co-digestion process of sewage sludge. They have shown that with increase of the water treatment sludge share in the sample mixture the dewaterability is increased. Samples of mixture characterized by lower capillary suction time and proper filtration resistance. The aim of the study is determine the dewaterability of sewage sludge mixed with water treatment sludge before and after fermentation process. The composition and properties of water treatment sludge depend mainly on the quality of treated water and the water treatment processes, including the type of coagulants used. Their utilization is an important economic and ecological problem because these waste are very difficult to dispose. The water treatment sludge contains organic matter, heavy metals and various types of sands and dusts. Its using during dewatering process solves this problem. REFERENCES Ahmad, T., Ahmad, K., Alam, M. (2016). Sustainable management of water treatment sludge
through 3R concept. Journal of Cleaner Production, p. 1-13. Dębowski, M., Zieliński, M., Krzemieniewski, M. (2008). Skuteczność kondycjonowania osadów
ściekowych metodą Fentona. Ochrona Środowiska, 30(2), p. 43-47. Lai, J., Liu, J. (2004). Co-conditioning and dewatering of alum sludge and waste activated sludge.
Water Science and Technology, 9, p. 41-48. Płonka, I., Barbusiński, K. (2010). Preliminary research into the digestion of post-coagulation
sludge. Environment Protection Engineering, 36(3), p. 59-67. Wolski, P., Wolny, L. (2011). Wpływ dezintegracji i fermentacji na podatność osadów ściekowych
na odwadnianie. Rocznik Ochrona Środowiska, 13, p. 1697-1706.

146
Yang, Y., Zhao, Y., Babatunde, A., Kearney, P. (2007). Co-conditioning of the anaerobic digested sludge of municipal wastewater treatment plant with alum sludge: benefit of phosphoous reduction in reject water. Water Environemental, 13, p. 2468-2476.

147
The influence of the energy input on the particle size of disintegrated excess sludge in the ultrasonic disintegration process
Ł. Skórkowski*, E. Zielewicz** * Institute of Water and Wastewater Engineering, Silesian University of Technology, Konarskiego18A, 44-100 Gliwice, Poland, (E-mail: [email protected]) (corresponding author) ** Institute of Water and Wastewater Engineering, Silesian University of Technology, Konarskiego18A, 44-100 Gliwice, Poland, (E-mail: [email protected])
INTRODUCTION Due to the large amounts of sludge generated in the process of wastewater treatment by activated sludge technology, implementation of techniques reducing the amount of excess sludge and its impact on environment is essential. Anaerobic digestion is the most widespread method of sewage sludge processing. In order to achieve the most favourable effects, the sludge preconditioning, called disintegration, is required. Main aims of the disintegration is the improved: biogas generation, destruction of solids and dewatering of the digested sludge. Disintegration of excess sludge covers a number of processes taking place in sewage sludge due to the introduction of various types of energy. Ultrasonic preconditioning is one of the most widespread mechanical disintegration methods (Zielewicz, 2016). The ultrasound cavitation is considered the primary mechanism causing changes in sonicated sludge (Zielewicz 2016, Cogate Kabadi, 2009) such as dispergation of flocks, microorganism cells’ disruption (cells’ sonolisys), sonochemical effects, rheological changes and many other. The description of the direct effects of disintegration is based on the changes in CST (Capilary Suction Time), CODs (Chemical Oxygen Demand of supernatant after filtration) as well as in the concentrations of organic matter dissolved in the supernatant denoted as SCOD (Chemical Oxygen Demand of supernatant after membrane filtration). The effects could be always monitored as change in particle size and particle distribution. The studies present the influence of ultrasonic energy on the disintegration effects described by the various indicators. MATERIALS AND METHODS Excess sludge for the research was procured from municipal sewage treatment plant located in the south of Poland. The excess sludge was collected after the mechanical thickening, the Chemical Oxygen Demand of sludge COD0 was 17120 mgO2/dm3, The effects of the sludge disintegration were evaluated based on the values of the indicators for dispersion in relation to changes of CODs and CST defined as (Zielewicz, 2016):
kdCODs = CODsUT/ CODsNT (1) kdCST =CSTUT/CSTNT (2)
and the cell lysis indicator and acidification indicator defined as: kdSCOD = SCODUT/ SCODNT (3) kd VFA = VFAs UT / VFAs NT (4)
NT – before disintegration, UT – after disintegration. The particle size analysis of the disintegrated sludge was performed utilizing laser diffraction method. Malvern Mastersizer 3000 laser diffraction particle size analyser was used.

148
Table 1. Characteristics of excess sludge disintegration descriptors.
EV(UT) Consumption of energy per unit
volume (Zielewicz, 2016)
Disintegration time
Sludge disintegration descriptors
Sludge dispersion indicator
Cell lysis indicator
Acidification indicator
(kW h m-3) (s) kdCOD kdCST kdSCOD kdVFA 10 63 3,23 22,98 4,22 1,78 20 126 4,13 24,49 4,62 1,75 50 315 8,24 34,12 9,67 3,01 100 630 18,46 74,67 12,09 12,61
Figure 1. Particle size distribution. CONCLUSIONS The results of the research proved that the effects of the ultrasonic disintegration, as far as disintegration descriptors and particle size distribution is concerned, are strongly influenced by the energy input. REFERENCES Zielewicz E., Effects of ultrasonic disintegration of excess sewage sludge. Applied Acoustics
2016;103:182-189, Zielewicz E., Effects of ultrasonic disintegration of excess sewage sludge, Top Curr Chem (Z)
(2016) 374:67, Gogate P.R., Kabadi A.M., A review of applications of cavitation in biochemical
engineering/biotechnology,. Biochemical Engineering Journal. 2009; 44: 60-72.
149
Statistical evaluation of the reduced graphene oxide influence on the anammox biomass
M. Tomaszewski*, G. Cema, P. Gutwiński, A. Ziembińska-Buczyńska
*Silesian University of Technology, Environmental Biotechnology Department, Akademicka 2, 44-100 Gliwice, Poland
INTRODUCTION The anammox (anaerobic ammonium oxidation) process is the most efficient process of nitrogen removal from high strength ammonia wastewater. Although there are some full scale applications of anammox-based technologies, but there are limited to nitrogen-rich wastewater with relatively high temperatures (30-40°C). An effective low-temperature anammox process seems to be one of the most challenging but profitable processes in wastewater treatment. Fast development of nanomaterials and nanotechnology is also reflected in the field of environmental sciences. The role of nanomaterials in water and wastewater treatment is mainly connected with their adsorption, photocatalysis and antimicrobial properties (Santhosh et al., 2016). Furthermore, same recent studies demonstrated that the graphene nanomaterials could enhance key anammox enzymes activity and anammox process efficiency. A breakthrough researches in this field indicated that appropriate amount of graphene oxide (GO) (Wang et al., 2013) and especially reduced graphene oxide (RGO) (Yin et al., 2015; 2016) enhance the activity of anammox bacteria at 35°C. Promoting mechanism is probably connected with high efficient electron transfer capacity of graphene materials, that increases the rate of the anammox enzymatic reactions. However, too high concentration of RGO may inhibit anammox activity, inducing an oxidative stress. Thus, the main objective of this study was to verify the possibility of supporting anammox process at low temperatures via appropriate RGO addition. Yin et al. (2015) reported that the optimal dose of RGO at 35˚C is 100 mg/l. On the other hand, the electron transfer ability of RGO, probably responsible for the stimulation, depends on temperature (Gómez-Navarro et al., 2007). In view of these facts, central composite design (CCD) was employed to study simultaneous effects of RGO dose and low temperatures on the specific anammox activity (SAA). MATERIALS AND METHODS The full CCD experimental set-up consisted of 12 experiments. Control experiments without RGO addition were also carried out for each test. Preliminary studies have shown inhibition of RGO at concentration of 100 mg/l at 30˚C and 20˚C. Therefore, the RGO dose range was set between 15 and 85 mg/l, and temperature range was set between 10 and 30˚C, all tests were triplicates. Tests were performed in batch reactors, with working volume of 100 ml, with initial substrate concentrations equal to 25 mg N-NH4/l and 30 mg N-NO2/l. Samples from the batch test reactor were periodically collected for the N-NH4 and N-NO2 concentrations measurement at period adapted to the temperature used in the experiment (0.75-2 h). SAA (g N/g VSS·d) was calculated based on the decrease of the nitrogen in the linear range of substrates removal and RGO influence was evaluated as a percentage of SAA in the relation to the control. Table 2 Central Composite Design experimental set-up (T - temperature, RGO - reduced graphene oxide, α ≈ 1.41)
Experiment number
1 2 3 4 5 6 7 8 9 10 11 12
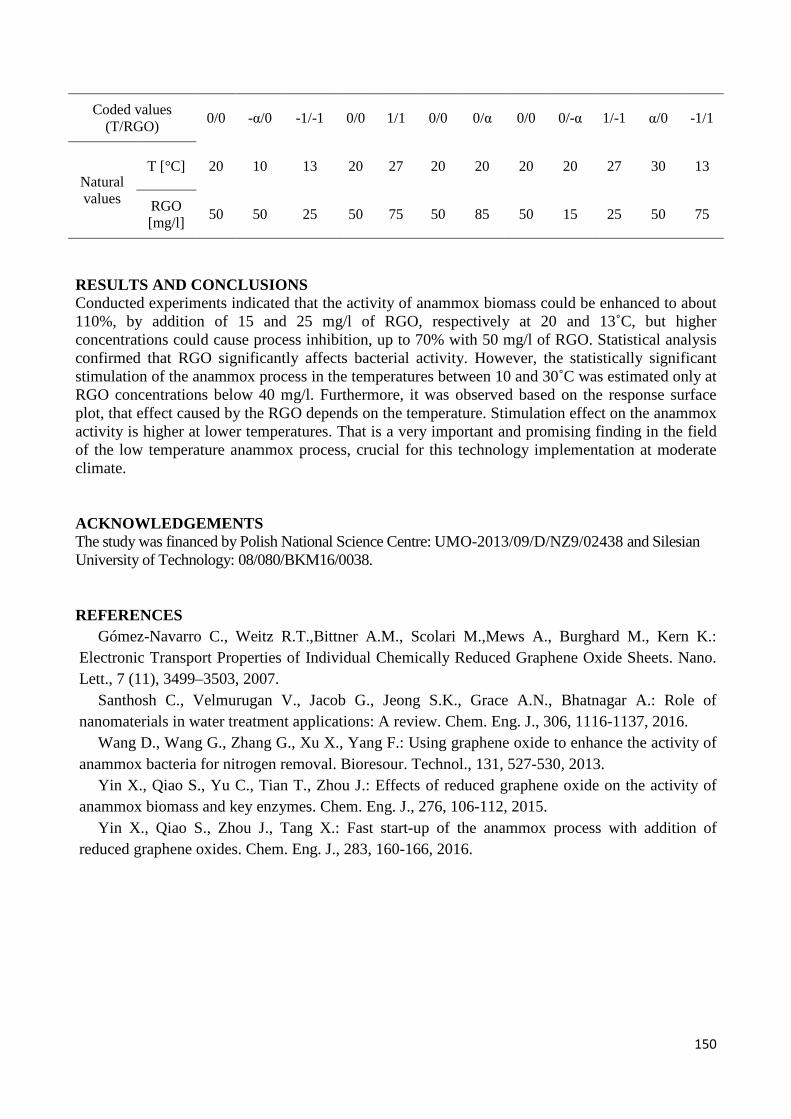
150
Coded values (T/RGO)
0/0 -α/0 -1/-1 0/0 1/1 0/0 0/α 0/0 0/-α 1/-1 α/0 -1/1
Natural values
T [°C] 20 10 13 20 27 20 20 20 20 27 30 13
RGO [mg/l]
50 50 25 50 75 50 85 50 15 25 50 75
RESULTS AND CONCLUSIONS Conducted experiments indicated that the activity of anammox biomass could be enhanced to about 110%, by addition of 15 and 25 mg/l of RGO, respectively at 20 and 13˚C, but higher concentrations could cause process inhibition, up to 70% with 50 mg/l of RGO. Statistical analysis confirmed that RGO significantly affects bacterial activity. However, the statistically significant stimulation of the anammox process in the temperatures between 10 and 30˚C was estimated only at RGO concentrations below 40 mg/l. Furthermore, it was observed based on the response surface plot, that effect caused by the RGO depends on the temperature. Stimulation effect on the anammox activity is higher at lower temperatures. That is a very important and promising finding in the field of the low temperature anammox process, crucial for this technology implementation at moderate climate. ACKNOWLEDGEMENTS The study was financed by Polish National Science Centre: UMO-2013/09/D/NZ9/02438 and Silesian University of Technology: 08/080/BKM16/0038. REFERENCES
Gómez-Navarro C., Weitz R.T.,Bittner A.M., Scolari M.,Mews A., Burghard M., Kern K.: Electronic Transport Properties of Individual Chemically Reduced Graphene Oxide Sheets. Nano. Lett., 7 (11), 3499–3503, 2007.
Santhosh C., Velmurugan V., Jacob G., Jeong S.K., Grace A.N., Bhatnagar A.: Role of nanomaterials in water treatment applications: A review. Chem. Eng. J., 306, 1116-1137, 2016.
Wang D., Wang G., Zhang G., Xu X., Yang F.: Using graphene oxide to enhance the activity of anammox bacteria for nitrogen removal. Bioresour. Technol., 131, 527-530, 2013.
Yin X., Qiao S., Yu C., Tian T., Zhou J.: Effects of reduced graphene oxide on the activity of anammox biomass and key enzymes. Chem. Eng. J., 276, 106-112, 2015.
Yin X., Qiao S., Zhou J., Tang X.: Fast start-up of the anammox process with addition of reduced graphene oxides. Chem. Eng. J., 283, 160-166, 2016.

151
Uncertainty of forecast and control of activated sludge sedimentation capacity: data mining approach
B. Szeląg*, K. Chmielowski** and E. Wąsik** * Faculty of Environmental Engineering, Geomatics and Power Engineering, Kielce University of Technology, Al. Tysiąclecia Państwa Polskiego 7, 25-314 Kielce, Poland (E-mail: [email protected]) ** Department of Sanitary Engineering and Water Management, University of Agriculture in Cracow, Mickiewicza Av. 24/28, 30-059 Cracow (E-mail: [email protected], [email protected])
INTRODUCTION Sludge volume index (SVI) and sedimentation (SE) are the basic indicators for estimating the sedimentation capacity of a treatment plant (Martins et al., 2004; Barbusiński and Miksch, 1997). Deterioration of these parameters causes problems during sewage clarification in the secondary settling tank and – as a consequence – leads not only to the increase in the concentration of suspended solids and carbon and phosphorus compounds in the effluent from the settling tank, but also negatively affects the sludge dehydration process (Chan et al., 1991). Obtaining the values of the sedimentation capacity assessment indices is therefore essential to maintain the required quality level of sewage flowing out of the treatment plant. In order to forecast the sedimentation capacity of the sludge, a number of mathematical models have been developed, using artificial intelligence methods, such as neural networks, support vectors, random forests, etc (Lou and Zhao, 2012; Han et al., 2016). However, due to the stochastic selection of data for learning and test sets, as well as due to estimation errors of parameters in the structure, the obtained results may be burdened with uncertainty. It is worth noting that this aspect has not been addressed in the models developed so far for forecasting of activated sludge sedimentation. However, studies on hydrology and power engineering confirm that it has a significant impact on the results of calculations. Having regard to the above, the paper presents the methodology for estimating the uncertainty of the activated sludge sedimentation forecast using the bootstrap method, which is commonly used in economics, finance, medicine, etc (Davison and Hinkley, 2009). AIM AND METHODOLOGY OF RESEARCH In order to forecast the SE values, the analyses were based on the results of quantitative and qualitative measurements of sewage (i.e. biochemical and chemical oxygen demand, total nitrogen, ammonium nitrogen, total phosphorus) and the operational parameters of the biological reactor (i.e. temperature, pH, oxygen concentration in the nitrification chamber, mixed liquor suspended solids) at the municipal sewage treatment plant Sitkówka – Nowiny, obtained within studies carried out in the period of 2012 – 2017. The forecast of activated sludge sedimentation was prepared using the method of multilayer perceptron type of artificial neural networks. At the same time, the sludge volume index was determined within the described studies, by using the biological reactor parameters and the calculated value of SE. Based on the conducted simulations, 90%, 95% and 99% confidence intervals were determined (mean relative and absolute error) for the values of the results’ fit to the activated sludge sedimentation simulation parameters. Statistical distributions of errors were identified using the Kołmogorov-Smirnov test to determine the confidence intervals. By using the developed mathematical models for uncertainty, the possibility of correcting the operational parameters of a biological reactor was considered in order to improve the sedimentation capacity of activated sludge.

152
RESULTS AND DISCUSSION The conducted analyses indicated that the mean values of relative and absolute error for the activated sludge sedimentation forecast in the obtained bootstrap samples are significantly variable. In the case of mathematical models with 10 and 20 neurons in the hidden layer it was found that in individual bootstrap samples the values of MAE and MAPE in the test set varied between 24.16-117.74 cm3/dm3 and 5.42-38.90%, and 23.60-85.21 cm3/dm3 and 4.73-30.68%, respectively (fig.1).
Figure 1. The effect of the number of neurons in the hidden layer on the variation in the mean absolute and relative error for the forecast of activated sludge sedimentation capacity in the bootstrap samples CONCLUSIONS The results of the above described analyses and the obtained forecasts of operating parameters of the reactor, based on the developed model for forecasting the activated sludge sedimentation, have shown that in practical considerations the uncertainty of the mathematical model is an important issue. This aspect plays a significant role in the decision-making by technologists, and gives the opportunity to improve the efficiency of the treatment plant operation, as well as reduces the occurrence of potential states of emergency. REFERENCES Barbusiński, K. and Miksch, K. (1997) Relationship between Organic Loading and some Properties
of Activated Sludge. Journal of Chemical Technology and Biotechnology. 69, 357–361. Chan, W.T. and Koe L.C. (1991) A knowledge-based framework for the diagnosis of sludge
bulking in the activated sludge process. Water Science and Technology, 23, 847–855. Davison, A.C. and Hinkley, D.V. (2009) Bootstrap methods and their application. New York, NY:
Cambridge University Press. Han, H., Li, Y., Guo, Y. and Qiao, J. (2016) A soft computing method to predict sludge volume
index based on a recurrent self - organizing neural network. Applied Soft Computing. 38, 477– 486.
Lou, I. and Zhao, Y. (2012) Sludge Bulking Prediction Using Principle Component Regression and Artificial Neural Network. Mathematical Problems in Engineering. 2012, 1–17.
Martins, A.M.P., Heijnen, J.J. and van Loosdrecht M.C.M. (2004) Bulking sludge in biological nutrient removal systems. Biotechnology and Bioengineering. 86(2), 125–135.

153
The effective concentration of chromium (III) in the wastewater by nanofiltration process assisted diafiltration mode P. Religa*,B. Kaźmierczak** *Department of Environmental Protection, Kazimierz Pulaski University of Technology and Humanities in
Radom, Chrobrego 27, Radom, Poland (email: [email protected]) ** Faculty of Building Services, Hydro and Environmental Engineering, Warsaw University of Technology,
Nowowiejska 20, 00-653 Warsaw, Poland (email: [email protected])
ABSTRACT Chromium wastewaters are the result of the textile, tannery, photographic and electroplating industries (Dönmez, 2005; Lefebvre, 2006; Wionczyk,2011). The precipitation method is a common method of disposing of chromium wastewater. In this method a sediment and supernatant liquid are formed. The chromium content of the supernatant hovers around 20-50 µg (Wang, 2016), which is still significantly above the permissible values for purified waters. Furthermore, a significant problem that inhibits further biological disposal are considerable amounts of salt present in the water over sediment (Sundarapandiyan, 2010). The use of conventional wastewater treatment systems does not have the beneficial effect in salt removal (Koçberber, 2007), so this problem is being solved by using pressure membrane processes, particularly the nanofiltration process (NF) (Religa, 2013, 2015, Dasgupta, 2015; Shahmansour, 2015; Galiana -Aleixandre, 2011; Yan, 2016). The effect of wastewaters separation are two streams: a permeate which is saline solution and a retentate solution – the chromium, in which remains still a large amount of salt (Cassano, 2001; Religa, 2016). In order to increase the degree of desalination of chromium wastewater, a connection of nanofiltration in diafiltration mode was proposed (Religa, 2016; Yan, 2016). The diafiltration is a filtration method by introducing the diluent into to the system in order to elute low molecular weight substances from it. The diafiltration process is often carried out as constant volume diafiltration CVD (Wang, 2008; Kovacs, 2009; Fikar, 2010). In this variant of the method the amount of solvent used to obtain the assumed salt wash-off is proportional to the volume of the "washed" solution. Therefore, the highest preconcentration of the effluent is used to optimize the spent diluent in the diafiltration step is beneficial. Unfortunately, due to the high degree of salinity chromium wastewaters the possibility of their concentration is strongly limited by the effect of the polarization of the membrane. The results of previous research of the use of the nanofiltration process with diafiltration mode CVD (Religa, 2016) indicate that this process gives the possibility of obtaining a highly concentrated and deprived of salt in chromium (III) solution (Religa, 2016). The disadvantage of the process is the large consumption of diluent. The solution of concentration problem of chromium (III) in a highly saline wastewater can be the change the way of carrying out diafiltration. The paper proposes a concentration of chromium (III) in the process of nanofiltration with diafiltration mode with a variable volume diafiltration VVD. This process relies in introduces into the wastewater, without pre-concentration of the diluent at a rate less than the permeate run-off.
This leads to the simultaneous desalination and chromium concentration. The proposed solution reduces the volume of added diluent relative to the CVD process and the higher degree of chromium concentration. In the paper the influence of rate of diluent added and the type of membrane on desalting effect of the model solutions of chromium wastewater in the process carried out by nanofiltration in diafiltration VVD.
154
REFERENCES Cassano, A., Molinari, R., Romano, M., Drioli, E. (2001) Treatment of aqueous effluents of the
leather industry by membrane processes a review. Journal of Membrane Science, 181, 111–126. Dasgupta, J., Mondal, D., Chakraborty, S., Sikder, J., Curcio S. and Arafat, H.A. (2015)
Nanofiltration based water reclamation from tannery effluent following coagulation pretreatment. Ecotoxicology and Environmental Safety, 121, 22–30.
Dönmez, G. and Koçberber, N. (2005) Isolation of hexavalent chromium resistant bacteria from industrial saline effluents and their ability of bioaccumulation. Enzyme and Microbial Technology, 36, 700–705.
Fikar, M., Kovacs, Z. and Czermak, P. (2010) Dynamic optimization of batch diafiltration processes.Journal of Membrane Science, 355, 168–174.
Galiana-Aleixandre, M.V., Mendoza-Roca, J.A. and Bes-Piá, A. (2011) Reducing sulfates concentration in the tannery effluent by applying pollution prevention techniques and nanofiltration. Journal of Cleaner Production, 19, 91–98.
Koçberber, N. and Dönmez, G. (2007) Chromium(VI) bioaccumulation capacities of adapted Miedcultures isolated from industrial saline wastewaters. Bioresource Technology, 98, 2178–2183.
Kovacs, Z., Fikar, M. and Czermak, P. (2009) Mathematical modeling of diafiltration. Hungarian Journal of Industrial Chemistry, 37 (2), 159–164.
Lefebvre, O. and Moletta, R. (2006) Treatment of organic pollution in industrial saline wastewater: A literature review. Water Research, 40, 3671–3682.
Religa, P., Kowalik-Klimczak, A. and Gierycz, P. (2013) Study on the behavior of nanofiltration membranes using for chromium(III) recovery from salt mixture solution. Desalination, 315, 115–123.
Religa, P. and Kowalik-Klimczak, A. (2015) Effect of interaction between anionic surfactants and poly(piperazine-amide) nanofiltration membranes used for chromium(III) recovery from saline solution. Water Science and Technology, 72 (10), 1803–1809.
Religa, P. and Kaźmierczak, B. (2016) Desalination of chromium tannery wastewater by nanofiltration with different diafiltration mode. Desalination and Water Treatment, 64, 409–413.
Religa, P., Kaźmierczak, B. and Gierycz, P. (2016) Systems for chromium recirculation in tanneries. Desalination and Water Treatment, 64, 414–418.
Shahmansour, A., Bellona, Ch. (2015) Nanofiltration technology in water treatment and reuse: applications and costs. Water Science and Technology, 71 (3), 309–319.
Sundarapandiyan, S., Chandrasekar, R., Ramanaiah, B., Krishnan, S. and Saravanan, P. (2010) Electrochemical oxidation and reuse of tannery saline wastewater”, Journal of Hazardous Materials, 180, 197–203.
Wang, D., He, S., Shan, Ch., Ye, Y., Ma, H., Zhang, X., Zhang, W. and Pan, B. (2016) Chromium speciation in tannery effluent after alkaline precipitation: Isolation and characterization. Journal of Hazardous Materials, 316, 169–177.
Wang, L., Yang, G., Xing, W. and Xu, N. (2008) Mathematic model of the yield for diafiltration processes.Separation and Purification Technology, 59, 206–213.
Wionczyk, B., Cierpiszewski, R., Mól, A. and Prochaska, K. (2011) Studies on the kinetics and equilibrium of the solvent extraction of chromium(III) from alkaline aqueous solutions of different composition in the system with Aliquat 336. Journal of Hazardous Materials, 198, 257–268.
Yan, Z.Q., Zeng, L.M., Li, Q., Liu, T.Y., Matsuyama, H. and Wang, X.L. (2016) Selective separation of chloride and sulfate by nanofiltration for high saline wastewater recycling. Separation and Purification Technology, 166, 135–141.

155
Oily wastewater treatment using a zirconia ceramic membrane J. Kwaśny*, M. Kryłów* and W. Balcerzak* * Department of Environmental Engineering, Cracow University of Technology, Warszawska Street 24, 31-155 Cracow, Poland (E-mail: [email protected], [email protected], [email protected])
INTRODUCTION Oils in wastewater can significantly impede its purification process. Oils are not easily biodegradable, they inhibit the self-cleaning of surface water, further impairing their organoleptic and physicochemical properties. Some mineral oil components have carcinogenic properties. Therefore, it is necessary to remove oil contaminants, to appropriate levels regulated by law. Fixed emission limits for vegetable oils and animal oils are 100-150 mg/L, while for synthetic and mineral oils, 10-15 mg/L. Solubility of oils in water is negligible and is several mg/dm3, therefore, these substances are present in water primarily as an oil-in-water emulsion (Coca et al., 2011). Oily wastewater is closely related to the metallurgical and petrochemical industries, but also to the production of cosmetics, food and leather processing (Coca et al., 2011). As a by-product of many industrial processes that contain various types of lubricants, oils and fats, they have been classified as hazardous waste that must be cleaned before discharge to the sewer. Different methods of oil wastewater treatment are used because they depend on the physical properties, concentration and size of oil droplets. Oil whose drops have a diameter of less than 20 mm is classified as emulsified oil. Among methods of oil wastewater treatment, gravity separation, centrifugation, chemical treatment, flotation, filtration, membrane processes and sorption techniques and mixed techniques are distinguished. Membrane techniques have found particular use in the treatment of oil effluents, because they result in high process efficiency and permeate purity, as well as low energy consumption and continuous separation. Among the disadvantages of membrane techniques are their high susceptibility to dirt and high maintenance costs. CERAMIC MEMBRANES AND THEIR PREPARATION In the filtration process is now widely used ceramic membranes. This is due to their properties, among which one can distinguish the mechanical strength, resistance to chemicals and high temperatures and ease of cleaning and microbiological strength assisted by the deposition of nanometric metal particles into the membrane, eg silver. In these respects, ceramic membranes outperform polymeric membranes which, in order to improve their properties, are modified by doping with nanometric, inorganic particles such as ZrO2, Al2O3, TiO2, and SiO2. Choosing the type of membrane depends on economic factors, including price, durability, vitality, cleaning and its frequency, and energy consumption. Zirconium compounds, as well as aluminum, tin and silica oxides are widely used as membranes. Ceramic membranes are usually obtained by sol-gel technique but also by isostatic compression, reverse phase technique or hydrothermal crystallization. In all the cited methods, the common stage, which is the calcination of the membrane, can be distinguished. It is also worth adding that the results obtained depend on the type of substrates used and on the synthesis method. Ceramic membranes are molded with zirconia, as this results in an increase in filtration efficiency by, for
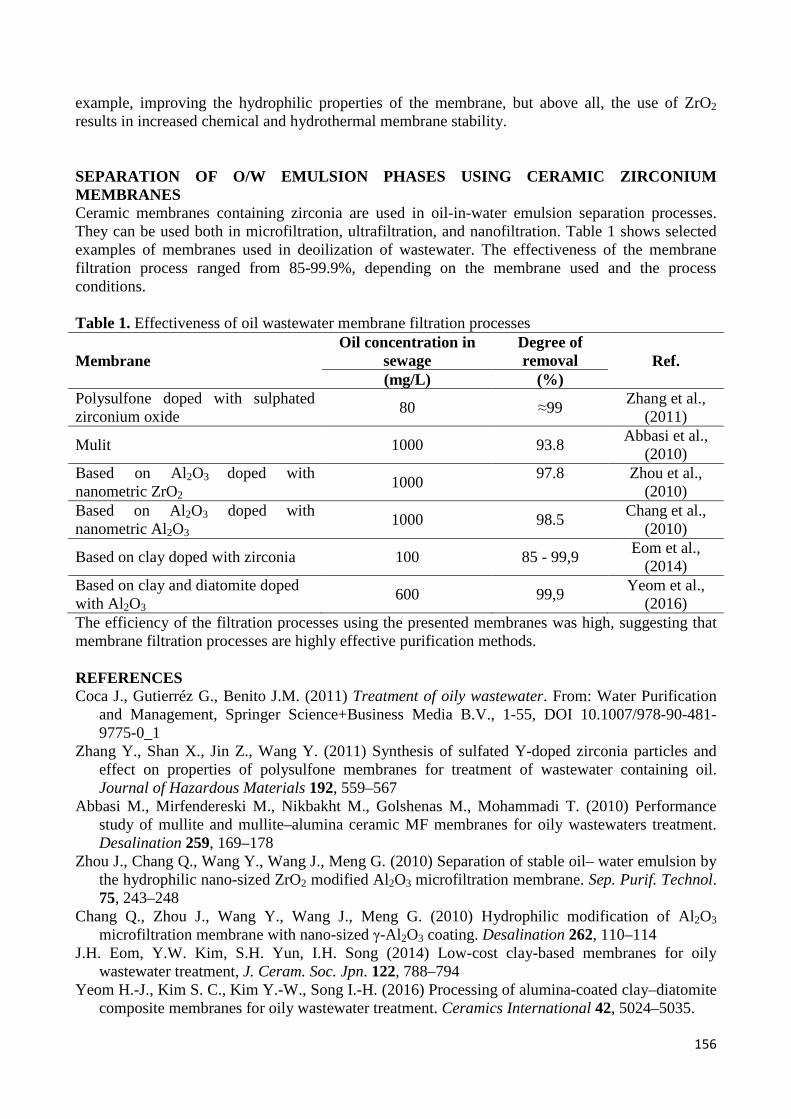
156
example, improving the hydrophilic properties of the membrane, but above all, the use of ZrO2 results in increased chemical and hydrothermal membrane stability. SEPARATION OF O/W EMULSION PHASES USING CERAMIC ZIR CONIUM MEMBRANES Ceramic membranes containing zirconia are used in oil-in-water emulsion separation processes.
They can be used both in microfiltration, ultrafiltration, and nanofiltration. Table 1 shows selected examples of membranes used in deoilization of wastewater. The effectiveness of the membrane filtration process ranged from 85-99.9%, depending on the membrane used and the process conditions. Table 1. Effectiveness of oil wastewater membrane filtration processes
Membrane Oil concentration in
sewage Degree of removal Ref.
(mg/L) (%) Polysulfone doped with sulphated zirconium oxide
80 ≈99 Zhang et al.,
(2011)
Mulit 1000 93.8 Abbasi et al.,
(2010) Based on Al2O3 doped with nanometric ZrO2
1000 97.8
Zhou et al.,
(2010) Based on Al2O3 doped with nanometric Al2O3
1000 98.5 Chang et al.,
(2010)
Based on clay doped with zirconia 100 85 - 99,9 Eom et al.,
(2014) Based on clay and diatomite doped with Al2O3
600 99,9 Yeom et al.,
(2016) The efficiency of the filtration processes using the presented membranes was high, suggesting that membrane filtration processes are highly effective purification methods. REFERENCES Coca J., Gutierréz G., Benito J.M. (2011) Treatment of oily wastewater. From: Water Purification
and Management, Springer Science+Business Media B.V., 1-55, DOI 10.1007/978-90-481-9775-0_1
Zhang Y., Shan X., Jin Z., Wang Y. (2011) Synthesis of sulfated Y-doped zirconia particles and effect on properties of polysulfone membranes for treatment of wastewater containing oil. Journal of Hazardous Materials 192, 559–567
Abbasi M., Mirfendereski M., Nikbakht M., Golshenas M., Mohammadi T. (2010) Performance study of mullite and mullite–alumina ceramic MF membranes for oily wastewaters treatment. Desalination 259, 169–178
Zhou J., Chang Q., Wang Y., Wang J., Meng G. (2010) Separation of stable oil– water emulsion by the hydrophilic nano-sized ZrO2 modified Al2O3 microfiltration membrane. Sep. Purif. Technol. 75, 243–248
Chang Q., Zhou J., Wang Y., Wang J., Meng G. (2010) Hydrophilic modification of Al2O3 microfiltration membrane with nano-sized γ-Al 2O3 coating. Desalination 262, 110–114
J.H. Eom, Y.W. Kim, S.H. Yun, I.H. Song (2014) Low-cost clay-based membranes for oily wastewater treatment, J. Ceram. Soc. Jpn. 122, 788–794
Yeom H.-J., Kim S. C., Kim Y.-W., Song I.-H. (2016) Processing of alumina-coated clay–diatomite composite membranes for oily wastewater treatment. Ceramics International 42, 5024–5035.
157
Adsorptive Removal of Active Pharmaceutical Residues from Source Separated Human Urine M. Ganesapillaia*, Prithvi Simhab, Bonny Thawania, Chinmoy Deba a Mass Transfer Group, Chemical Engineering Department, VIT University, Vellore, Tamil Nadu, INDIA - 632014 b Swedish University of Agricultural Sciences, Department of Energy and Technology, Box – 7032, SE-75007 Uppsala, Sweden * Corresponding Author: Associate Professor, Department of Chemical Engineering, Chemical Engineering Department, VIT University, Vellore, Tamil Nadu, INDIA - 632014. [email protected].
INTRODUCTION Over-the-counter drugs such as paracetamol, ibuprofen, cyplofloxacin, ranitidine, azithromycin, etc. have played an important role in the prevention and treatment of common diseases such as fever, pain and allergies. When administrated to humans, active pharmaceutical ingredients get adsorbed, metabolized and then excreted in urine and faeces. It is estimated that around 30-90% of a given pharmaceutical dose remains undegradable in the human body and are largely excreted as active compounds (Aksu and Tunç, 2005). Recently, Solanki and Boyer (2017) estimated that urine, although constituting less than 1% of the volumetric wastewater flow in the environment, contributes 64% of the pharmaceuticals on a mass basis. The presence of these compounds, now classified as emerging contaminants, constitutes significant risk to ecosystem health and sustainability. Methods and Materials In the present study, 24 h batch adsorption experiments were performed to investigate the removal of five over-the-counter drugs from fresh human urine, viz., paracetamol, ibuprofen, cyplofloxacin, ranitidine and azithromycin. Coal fly ash, activated charcoal, low-grade rock phosphate, bentonite and rice husk ash were chosen as the adsorbents. The following process parameters were examined: (i) adsorbent loading (1-3 g); (ii) initial adsorbate concentration (0.1, 0.2 mmol·L-1); (iii) agitation speed (140, 150, 160 rpm); and (iv) temperature (30-40°C). RESULTS AND DISCUSSIONS The adsorption was modelled by non–linear regression and comprehensive error analysis of nine isotherm models and three kinetic models. The pharmaceutical removal efficiency of the adsorbents varied as activated charcoal > fly ash > bentonite >rice husk ash > rock phosphate. At an adsorbent loading of 2 g, bentonite, fly ash and charcoal were able to strip more than 85% of all pharmaceuticals from urine. CONCLUSIONS Modelling results revealed that the sorption was best described by Redlich–Peterson equation and intra-particle diffusion model. Besides, a multi-staged adsorber was also designed to simulate the amount of different adsorbents required to treat different volumes of fresh urine so as to provide greater than 90% removal of the target pharmaceuticals.

158
REFERENCES Avni Solanki and Treavor H. Boyer (2017) Pharmaceutical Removal in Synthetic Human Urine Using Biochar. Water Research & Technology DOI: 10.1039/c6ew00224b (In Press). Zümriye Aksu and Özlem Tunç (2005). Application of biosorption for penicillin G removal: comparison with activated carbon. Process biochemistry 40(2): 831-847.

159
Effect of organic nitrogen concentration on the efficiency of trickling filters
Ł. Kopeć*, J. Drewnowski**, F. J. Fernandez-Morales***
* Ekofinn-Pol Ltd, ul. Leśna 12, 80-297 Banino, POLAND (E-mail: [email protected]) ** Gdansk University of Technology, Faculty of Civil and Environmental Engineering, Narutowicza 11/12, 80-233 Gdansk, POLAND (E-mail: [email protected]) *** Departamento de Ingeniería Química Instituto de Tecnologías Química y Medioambiental, Universidad de Castilla-La Mancha , Avda. Camilo José Cela s/n. 13004 Ciudad Real. (E-mail: [email protected])
INTRODUCTION In Poland, the trickling filter technologies are widely used for the treatment of domestic sewage in non-urbanized areas. The main advantages of these devices are the high resistance to biomass` wash-out and easy operation under variable wastewater flow-rates. In the trickling filters, the biomass forming the biofilm develops as a result of the scattering of wastewater over the surface of the filling and consists of different microbial species. The species distribution of the biofilm depends primarily on the influent wastewater characteristics. Especially, when the ratio of COD to BOD is greater than 2, undesirable microorganisms, such as filamentous bacteria, growth resulting in deterioration of the quality of the effluent wastewater. In operation of trickling filters, as well as in other facilities of this type, little attention is paid to nitrogen compounds, because it is not required in the ordinance on the conditions, when sewage is discharged into water or ground. Preliminary studies and observations indicate that the concentration of organic nitrogen, including urea (carbonic acid diamide), has a significant impact on the performance of the trickling filters. The occurrence of very high concentrations of organic nitrogen directly before the biological treatment is due to the continuous water-saving by the people using the sewage system (Gajewska et al. 2011). The aim of the study was to find the relationship between the concentration of organic nitrogen in wastewater after mechanical treatment and the purification efficiency. MATERIAL AND METHODS The study was conducted in Poland at six selected wastewater treatment plants (WWTP) based on the technology of the Bioclere® trickling filters. The research was conducted in the villages of Kwitajny, Protowo (Warmia and Mazury District), Pronie, Gisiel (Pomeranian District), Rządza and Gąsiorowo (Masovian District) for 6 months from November 2016 to April 2017. The sewage treatment facilities were characterized by similar capacities and were located in non-urbanized areas. Only wastewater from dwellings and households came to these WWTPs. Discharges of other sewage than household were excluded. BOD, COD, ammonia, organic nitrogen and pH (as a measure of urea concentration) were determined in raw wastewater. In order to calculate the effectiveness of the purification process for each WWTP, the effluent COD concentration was determined. 12 measurement series were carried out (two per month), and the average concentration values were used for further calculations. RESULTS AND DISCUSSION In all the tests performed, the COD to BOD relationship was close to 2 (Fig. 1a), which indicates that the wastewater fed to the trickling filters was hardly biodegradable (Dymaczewski 2011). Additional, it must be highlighted that the concentrations of organic nitrogen had a significant effect on the effluent COD concentration. WWTP presenting organic nitrogen concentrations above 20 mg/l at the beginning of the biological treatment were characterized by a nearly doubled COD

160
effluent concentration (Fig. 1b). This results indicated that the influent nitrogen concentration clearly influence the effluent quality. The combination of the low biodegradability and the high concentration of nitrogen compounds leads to changes in the appearance of the biofilm (Fig. 2a and 2b) and reduce the quality of the effluent obtained (Kopeć 2013). a) b)
Figure 1. COD to BOD relationship in the wastewaters studied a) Effluent COD dependency on the influent organic nitrogen (b) in investigated trickling filters.
a) b)
Figure 2. Shape of trickling filter filling with normal biofilm (a) and with filamentous bacteria (b), (Kopeć 2013) The large amounts of organic nitrogen may indicate that urea, sulfoamides, antibiotics, analgesics, and other amine-containing pharmaceuticals are present in wastewater. These compounds are hardly degradable and toxic to most bacteria and protozoa. According to the latest sources, these compounds are increasingly detectable in wastewater (Kraigher et al., 2008, Heberer, 2002) which would lead to lower qualities in the microbial population degrading these pollutants and therefore in the effluent quality. The results of the article confirm the possibility of large quantities of harmful substances for bacteria in sewage in non-urbanized areas. However, the impact of these compounds on the effectiveness of purification based only on organic nitrogen concentrations is insufficient. Further research should be extended by chemical analyzes of specific substances which are present in wastewater and slow down biochemical processes. REFERENCES
Dymaczewski Z. (2011). Poradnik eksploatatora oczyszczalni ścieków – praca zbiorowa. Polskie Zrzeszenie Inżynierów i Techników, Poznań, p 1152.
Gajewska M., Kopeć Ł., Obarska-Pempkowiak H., (2011). The operation of a small wastewater treatment facilities in a scattered settlement. Rocznik Ochrony Środowiska, t. 13, 207-225.
Heberer T. (2002) Occurrence, fate and removal of pharmaceutical residues in the aquatic environment: a review of recent research data. Toxicology Letters, 131.
Kopeć Ł. (2013). Mikroorganizmy błony biologicznej w złożach zraszanych. Gaz, Woda i Technika Sanitarna, 2, 53-58.
Kraigher B., Kosjek T., Heath E., Kompare B., Mandic-Mulec I. (2008): Influence of pharmaceutical residues on the structure of activated sludge bacterial communities in wastewater treatment bioreactors. Water Research 42.
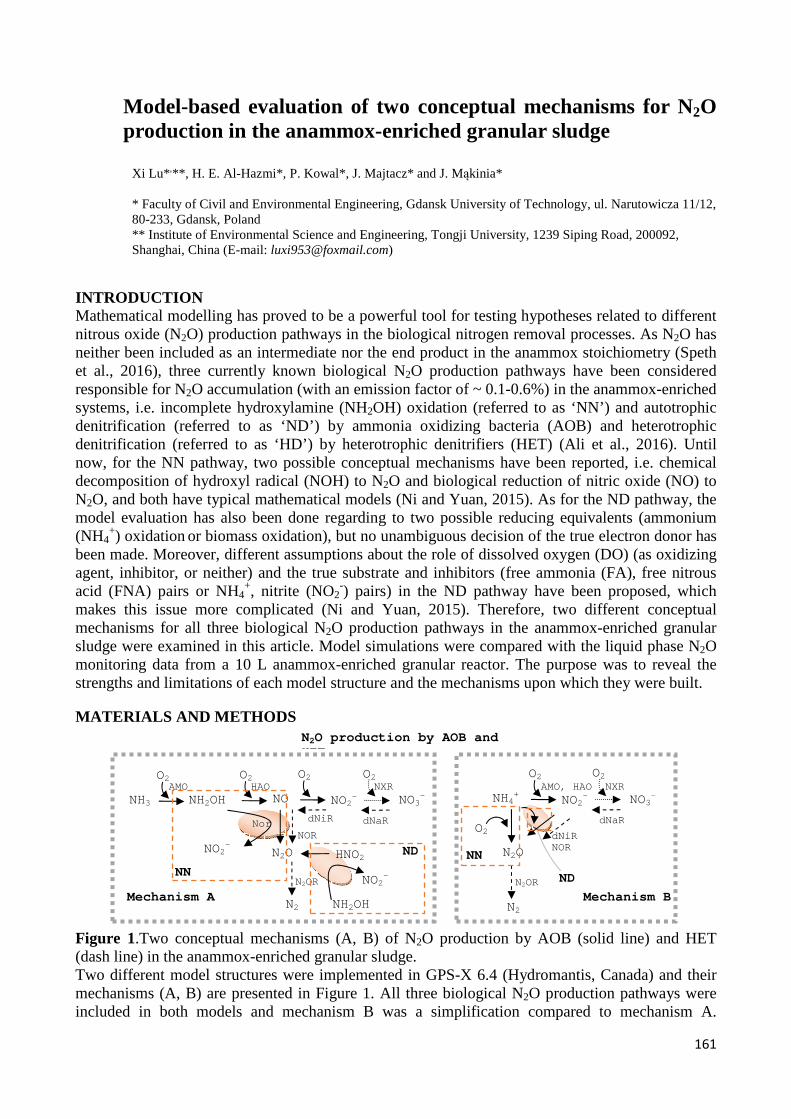
161
Model-based evaluation of two conceptual mechanisms for N2O production in the anammox-enriched granular sludge
Xi Lu* ,**, H. E. Al-Hazmi*, P. Kowal*, J. Majtacz* and J. Mąkinia*
* Faculty of Civil and Environmental Engineering, Gdansk University of Technology, ul. Narutowicza 11/12, 80-233, Gdansk, Poland ** Institute of Environmental Science and Engineering, Tongji University, 1239 Siping Road, 200092, Shanghai, China (E-mail: [email protected])
INTRODUCTION Mathematical modelling has proved to be a powerful tool for testing hypotheses related to different nitrous oxide (N2O) production pathways in the biological nitrogen removal processes. As N2O has neither been included as an intermediate nor the end product in the anammox stoichiometry (Speth et al., 2016), three currently known biological N2O production pathways have been considered responsible for N2O accumulation (with an emission factor of ~ 0.1-0.6%) in the anammox-enriched systems, i.e. incomplete hydroxylamine (NH2OH) oxidation (referred to as ‘NN’) and autotrophic denitrification (referred to as ‘ND’) by ammonia oxidizing bacteria (AOB) and heterotrophic denitrification (referred to as ‘HD’) by heterotrophic denitrifiers (HET) (Ali et al., 2016). Until now, for the NN pathway, two possible conceptual mechanisms have been reported, i.e. chemical decomposition of hydroxyl radical (NOH) to N2O and biological reduction of nitric oxide (NO) to N2O, and both have typical mathematical models (Ni and Yuan, 2015). As for the ND pathway, the model evaluation has also been done regarding to two possible reducing equivalents (ammonium (NH4
+) oxidation or biomass oxidation), but no unambiguous decision of the true electron donor has been made. Moreover, different assumptions about the role of dissolved oxygen (DO) (as oxidizing agent, inhibitor, or neither) and the true substrate and inhibitors (free ammonia (FA), free nitrous acid (FNA) pairs or NH4
+, nitrite (NO2-) pairs) in the ND pathway have been proposed, which
makes this issue more complicated (Ni and Yuan, 2015). Therefore, two different conceptual mechanisms for all three biological N2O production pathways in the anammox-enriched granular sludge were examined in this article. Model simulations were compared with the liquid phase N2O monitoring data from a 10 L anammox-enriched granular reactor. The purpose was to reveal the strengths and limitations of each model structure and the mechanisms upon which they were built. MATERIALS AND METHODS
Figure 1.Two conceptual mechanisms (A, B) of N2O production by AOB (solid line) and HET (dash line) in the anammox-enriched granular sludge. Two different model structures were implemented in GPS-X 6.4 (Hydromantis, Canada) and their mechanisms (A, B) are presented in Figure 1. All three biological N2O production pathways were included in both models and mechanism B was a simplification compared to mechanism A.
Nor
Mechanism A
NH3 NH2OH NO NO2
-
N2O HNO2
O2 O2
O2
NO2-
NO3-
O2
N2
NH4+
NO2-
N2O
O2
NO3-
O2
N2 Mechanism B
O2 dNaR
dNiR NOR
dNaR dNiR
NOR
N2OR N2OR
AMO HAO AMO, HAO NXR NXR
NH2OH
NO2-
N2O production by AOB and HET
NN NN
ND
ND

162
Differences were also among the true substrates (FA, FNA (A) vs. NH4+, NO2
- (B)) and DO inhibition terms (modified Haldane (A) vs. traditional (B)) for the ND pathway, as well as the NO inhibition terms (A) and NH4
+ saturation terms (B) on the HD pathway. Model simulations were compared with the liquid phase N2O monitoring data from a 10 L anammox-enriched granular reactor (Lu et al., in preparation). RESULTS AND SIGNIFICANCE OF NEW FINDINGS
0.00
0.06
0.12
0.18
0.24
0.30
0.36
0.42
0.48
0.54
0.60
0 15 30 45 60 75 90 105 120 135 150 165 1800
10
20
30
40
50
60
70
80
90
100
Liqu
id p
hase
N2O
(m
g N
/L)
N2O Simulation (A) R2=0.91
N2O Simulation (B) R2=0.94
Liquid phase N2O-N
(i) Nitrogen load:NH+
4=220 mg N/L NO-
2=286 mg N/L NO
2-N/NH
4-N=1.3
0.00
0.08
0.16
0.24
0.32
0.40
0.48
0.56
0.64
0.72
0.80
DO Simulation (A,B) DO
DO
(m
g O
2/L)
NH
+ 4, N
O- 2,
NO
- 3 (m
g N
/L)
t (min)
NH4-N Simulation (A) R2=0.99
NH4-N Simulation (B) R2=0.99
NH4-N
NO3-N Simulation (A) R2=0.87
NO3-N Simulation (B) R2=0.85
NO3-N
NO2-N Simulation (A) R2=1.00
NO2-N Simulation (B) R2=1.00
NO2-N
0.00
0.06
0.12
0.18
0.24
0.30
0.36
0.42
0.48
0.54
0.60
0 15 30 45 60 75 90 105 120 135 150 165 1800
10
20
30
40
50
60
70
80
90
100(ii) Nitrogen load:NH+
4=220 mg N/L NO-2=374 mg N/L NO2-N/NH4-N=1.7
Liqu
id p
hase
N2O
(m
g N
/L)
N2O Simulation (A) R2=0.56
N2O Simulation (B) R2=0.92
Liquid phase N2O-N
0.00
0.08
0.16
0.24
0.32
0.40
0.48
0.56
0.64
0.72
0.80
DO Simulation (A,B) DO
DO
(m
g O
2/L)
NH
+ 4, N
O- 2,
NO
- 3 (m
g N
/L)
t (min)
NH4-N Simulation (A) R2=0.99
NH4-N Simulation (B) R2=0.99
NH4-N
NO3-N Simulation (A) R2=0.81
NO3-N Simulation (B) R2=0.81
NO3-N
NO2-N Simulation (A) R2=0.99
NO2-N Simulation (B) R2=0.99
NO2-N
Figure 2. Simulation results of two model structures (A, B) in two typical scenarios (i, ii). Two typical scenarios of the simulation results are presented in Figure 2. Both models could describe the trends of NH4
+, NO3-, NO2
- (scenarios i,ii) and N2O (scenario i) concentrations in the anammox-enriched granular sludge with high accuracies (R2>0.81). However, model A failed (R2=0.56<0.81) in reproducing N2O accumulation at elevated NO2
- concentrations (scenario ii), and this failure could not be changed by adjusting the values of different NO inhibition coefficients for heterotrophic NO2
-, NO and N2O reduction processes. Model B successfully (R2=0.92>0.81) described the N2O trend (scenario ii). During this simulation, N2O reduction process by HET was found to have a lower affinity to NH4
+ than other (NO3- and NO2
-) reduction processes. The results further revealed that the overall N2O emission from the anammox-enriched granular sludge would be largely mitigated if there was NH4
+ remaining in the system. REFERENCES Ali, M., Rathnayake, R.M.L.D., Zhang, L., Ishii, S., Kindaichi, T., Satoh, H., Toyoda, S., Yoshida,
N. and Okabe, S. (2016) Source identification of nitrous oxide emission pathways from a single-stage nitritation-anammox granular reactor. Water Res. 102, 147–157.
Lu, X., Pereira, T.D.S., Al-Hazmi, H.E., Majtacz, J., Zhou, Q., Xie, L. and Makinia, J. (in preparation) Model-based evaluation of N2O production pathways in the anammox-enriched granular sludge.
Ni, B.-J. and Yuan, Z. (2015) Recent advances in mathematical modeling of nitrous oxides emissions from wastewater treatment processes. Water Res. 87, 336–346.
Speth, D.R., in ’t Zandt, M.H., Guerrero-Cruz, S., Dutilh, B.E. and Jetten, M.S.M. (2016) Genome-based microbial ecology of anammox granules in a full-scale wastewater treatment system. Nat. Commun. 7, 11172.
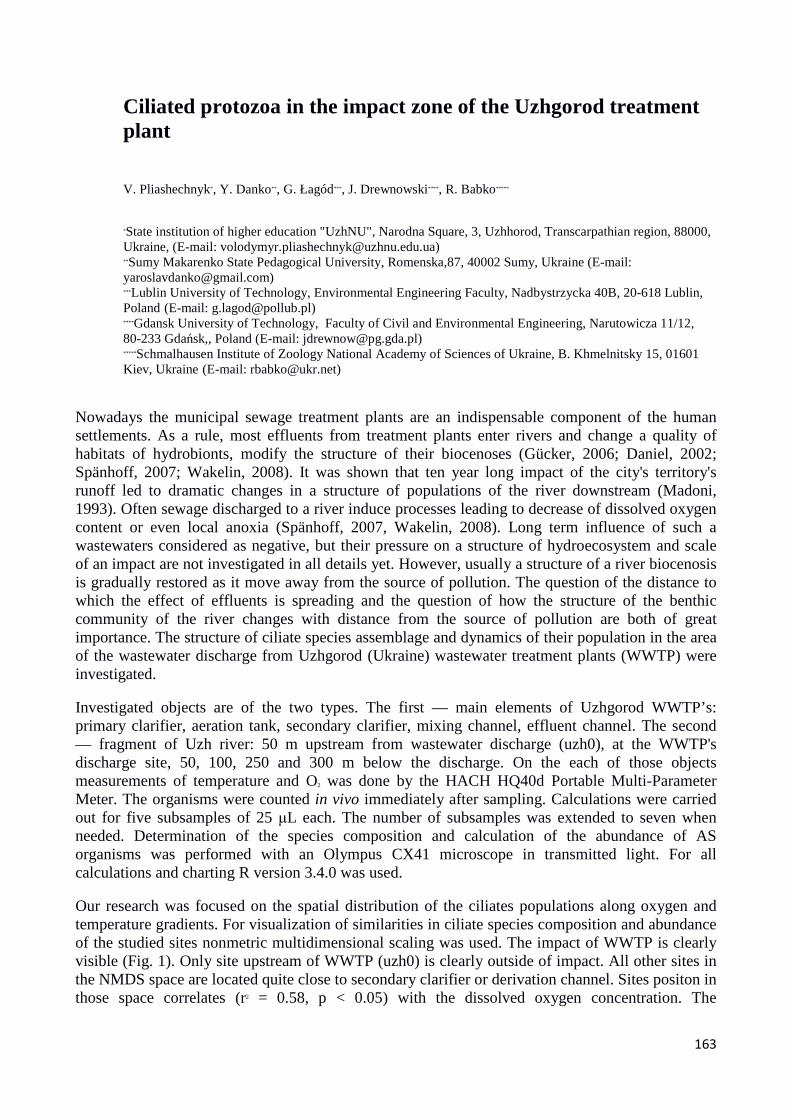
163
Ciliated protozoa in the impact zone of the Uzhgorod treatment plant
V. Pliashechnyk*, Y. Danko**, G. Łagód*** , J. Drewnowski**** , R. Babko*****
*State institution of higher education "UzhNU", Narodna Square, 3, Uzhhorod, Transcarpathian region, 88000, Ukraine, (E-mail: [email protected]) **Sumy Makarenko State Pedagogical University, Romenska,87, 40002 Sumy, Ukraine (E-mail: [email protected]) *** Lublin University of Technology, Environmental Engineering Faculty, Nadbystrzycka 40B, 20-618 Lublin, Poland (E-mail: [email protected]) **** Gdansk University of Technology, Faculty of Civil and Environmental Engineering, Narutowicza 11/12, 80-233 Gdańsk,, Poland (E-mail: [email protected]) ***** Schmalhausen Institute of Zoology National Academy of Sciences of Ukraine, B. Khmelnitsky 15, 01601 Kiev, Ukraine (E-mail: [email protected])
Nowadays the municipal sewage treatment plants are an indispensable component of the human settlements. As a rule, most effluents from treatment plants enter rivers and change a quality of habitats of hydrobionts, modify the structure of their biocenoses (Gücker, 2006; Daniel, 2002; Spänhoff, 2007; Wakelin, 2008). It was shown that ten year long impact of the city's territory's runoff led to dramatic changes in a structure of populations of the river downstream (Madoni, 1993). Often sewage discharged to a river induce processes leading to decrease of dissolved oxygen content or even local anoxia (Spänhoff, 2007, Wakelin, 2008). Long term influence of such a wastewaters considered as negative, but their pressure on a structure of hydroecosystem and scale of an impact are not investigated in all details yet. However, usually a structure of a river biocenosis is gradually restored as it move away from the source of pollution. The question of the distance to which the effect of effluents is spreading and the question of how the structure of the benthic community of the river changes with distance from the source of pollution are both of great importance. The structure of ciliate species assemblage and dynamics of their population in the area of the wastewater discharge from Uzhgorod (Ukraine) wastewater treatment plants (WWTP) were investigated.
Investigated objects are of the two types. The first — main elements of Uzhgorod WWTP’s: primary clarifier, aeration tank, secondary clarifier, mixing channel, effluent channel. The second — fragment of Uzh river: 50 m upstream from wastewater discharge (uzh0), at the WWTP's discharge site, 50, 100, 250 and 300 m below the discharge. On the each of those objects measurements of temperature and O2 was done by the HACH HQ40d Portable Multi-Parameter Meter. The organisms were counted in vivo immediately after sampling. Calculations were carried out for five subsamples of 25 µL each. The number of subsamples was extended to seven when needed. Determination of the species composition and calculation of the abundance of AS organisms was performed with an Olympus CX41 microscope in transmitted light. For all calculations and charting R version 3.4.0 was used.
Our research was focused on the spatial distribution of the ciliates populations along oxygen and temperature gradients. For visualization of similarities in ciliate species composition and abundance of the studied sites nonmetric multidimensional scaling was used. The impact of WWTP is clearly visible (Fig. 1). Only site upstream of WWTP (uzh0) is clearly outside of impact. All other sites in the NMDS space are located quite close to secondary clarifier or derivation channel. Sites positon in those space correlates (r2 = 0.58, p < 0.05) with the dissolved oxygen concentration. The
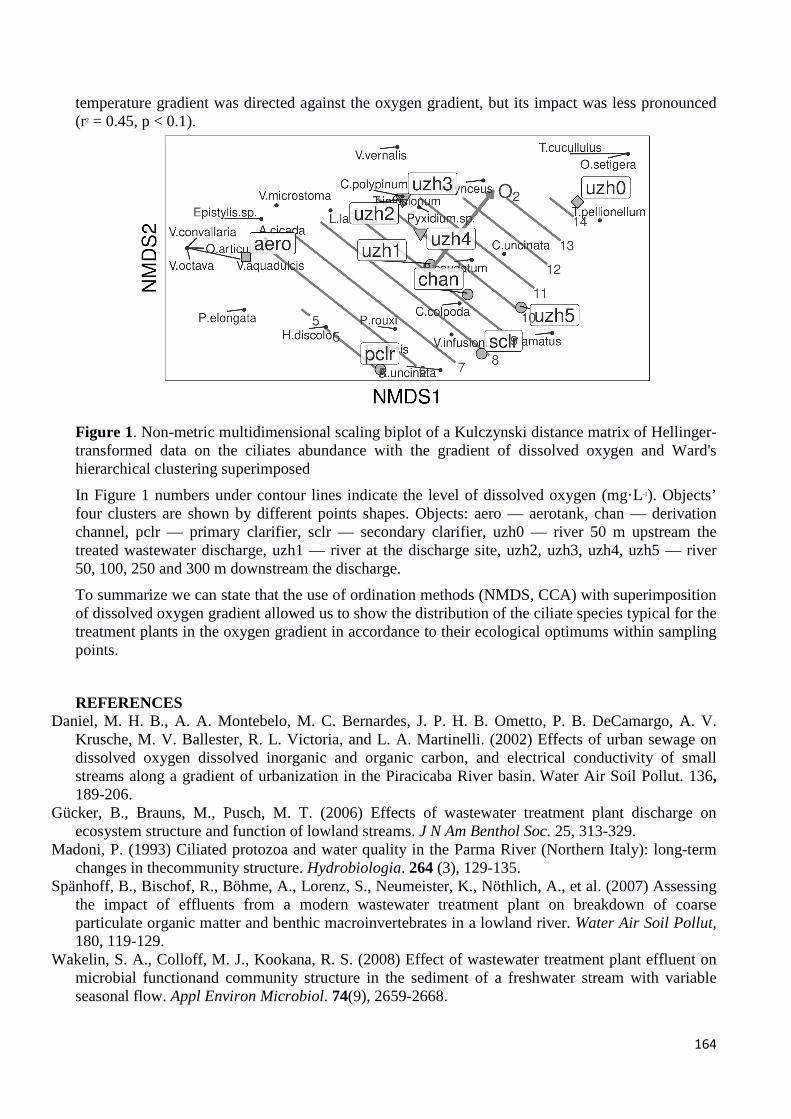
164
temperature gradient was directed against the oxygen gradient, but its impact was less pronounced (r2 = 0.45, p < 0.1).
Figure 1. Non-metric multidimensional scaling biplot of a Kulczynski distance matrix of Hellinger-transformed data on the ciliates abundance with the gradient of dissolved oxygen and Ward's hierarchical clustering superimposed
In Figure 1 numbers under contour lines indicate the level of dissolved oxygen (mg·L-1). Objects’ four clusters are shown by different points shapes. Objects: aero — aerotank, chan — derivation channel, pclr — primary clarifier, sclr — secondary clarifier, uzh0 — river 50 m upstream the treated wastewater discharge, uzh1 — river at the discharge site, uzh2, uzh3, uzh4, uzh5 — river 50, 100, 250 and 300 m downstream the discharge.
To summarize we can state that the use of ordination methods (NMDS, CCA) with superimposition of dissolved oxygen gradient allowed us to show the distribution of the ciliate species typical for the treatment plants in the oxygen gradient in accordance to their ecological optimums within sampling points.
REFERENCES Daniel, M. H. B., A. A. Montebelo, M. C. Bernardes, J. P. H. B. Ometto, P. B. DeCamargo, A. V.
Krusche, M. V. Ballester, R. L. Victoria, and L. A. Martinelli. (2002) Effects of urban sewage on dissolved oxygen dissolved inorganic and organic carbon, and electrical conductivity of small streams along a gradient of urbanization in the Piracicaba River basin. Water Air Soil Pollut. 136, 189-206.
Gücker, B., Brauns, M., Pusch, M. T. (2006) Effects of wastewater treatment plant discharge on ecosystem structure and function of lowland streams. J N Am Benthol Soc. 25, 313-329.
Madoni, P. (1993) Ciliated protozoa and water quality in the Parma River (Northern Italy): long-term changes in thecommunity structure. Hydrobiologia. 264 (3), 129-135.
Spänhoff, B., Bischof, R., Böhme, A., Lorenz, S., Neumeister, K., Nöthlich, A., et al. (2007) Assessing the impact of effluents from a modern wastewater treatment plant on breakdown of coarse particulate organic matter and benthic macroinvertebrates in a lowland river. Water Air Soil Pollut, 180, 119-129.
Wakelin, S. A., Colloff, M. J., Kookana, R. S. (2008) Effect of wastewater treatment plant effluent on microbial functionand community structure in the sediment of a freshwater stream with variable seasonal flow. Appl Environ Microbiol. 74(9), 2659-2668.