boonsupthip, heldman. 2007
TRANSCRIPT

E:FoodEngineering&PhysicalProperties
JFS E: Food Engineering and Physical Properties
Prediction of Frozen Food Properties duringFreezing Using Product CompositionW. BOONSUPTHIP AND D.R. HELDMAN
ABSTRACT: Frozen water fraction (FWF), as a function of temperature, is an important parameter for use in the de-sign of food freezing processes. An FWF-prediction model, based on concentrations and molecular weights of specificproduct components, has been developed. Published food composition data were used to determine the identity andcomposition of key components. The model proposed in this investigation had been verified using published exper-imental FWF data and initial freezing temperature data, and by comparison to outputs from previously publishedmodels. It was found that specific food components with significant influence on freezing temperature depressionof food products included low molecular weight water-soluble compounds with molality of 50 µmol per 100 g foodor higher. Based on an analysis of 200 high-moisture food products, nearly 45% of the experimental initial freezingtemperature data were within an absolute difference (AD) of ± 0.15 ◦C and standard error (SE) of ± 0.65 ◦C whencompared to values predicted by the proposed model. The predicted relationship between temperature and FWFfor all analyzed food products provided close agreements with experimental data (± 0.06 SE). The proposed modelprovided similar prediction capability for high- and intermediate-moisture food products. In addition, the pro-posed model provided statistically better prediction of initial freezing temperature and FWF than previous publishedmodels.
Keywords: composition, freezing temperature, frozen food, frozen water, prediction
Introduction
The frozen water fraction (FWF) is the mass of water that hasundergone phase change during the food freezing process. The
magnitude of the FWF increases exponentially as product temper-ature decreases. This parameter is important in the design of foodfreezing processes (Duckworth 1971; Heldman 1974; Boonsupthipand Heldman 2005). The FWF is a key component in the predictionof frozen food properties (Heldman 1982; Larkin and others 1984;Becker and Fricke 1999b), product freezing time (Hung and Thomp-son 1983; Cleland and Earle 1984; Mannapperuma and Singh 1988;Pham 1996; Salvadori and others 1997; Becker and Fricke 1999a),and the ice crystal size in frozen food (Donhowe and others 1991;Martino and others 1998; Woinet and others 1998a; Boonsupthipand Heldman 2005).
Models for FWF prediction have been derived from thermody-namic relationships between freezing temperature and the concen-tration and molecular weight of food components. In the publishedliterature, the relationship is referred to as the freezing temperaturedepression relationship (Bartlett 1944; Heldman 1974; Schwartzberg1976; Chen 1985b; Cleland and Valentas 1997). Refining the modelsto allow prediction of FWF and other freezing parameters based onproduct composition should create a very efficient approach. Due tothe complex nature of a food product, the prediction method mustbe developed very carefully. The key food components impacting thephase change of water must be identified and considered. Most pub-lished approaches are product specific, require experimental data,
MS20060598 Submitted 11/6/2006, Accepted 3/21/2007. Author Boonsupthipis with Dept. of Food Science and Technology, Food Engineering Major, Fac-ulty of Agro-Industry, Kasetsart Univ., 50 Paholyothin Rd., Jatujak, Bangkok10900, Thailand. Author Heldman is with Heldman Associates, 4581 WestonRd.; nr 351, Weston, FL 33331. Direct inquiries to author Heldman (E-mail:[email protected]).
and are not based on food composition (Miles 1974; Chen 1985b).The overall objective of this investigation was to focus on the keyfood components with significant impact on the magnitude of mo-lality of the water phase within the product, and on the depressionof freezing temperature of food. This approach has the potential forapplication to any type of food.
The specific objective of this investigation was to develop a modelfor frozen water fraction prediction, based on concentration andmolecular weight of the product components. The investigation in-cluded the identification of the key food solute weights, and the ver-ification that summation of the ratios of food solute mass to molec-ular weight can represent molality of the food, and can be used topredict depression of the freezing temperature of water in the foodproduct. The verification involved the applicability of the predictionmodel to typical food products, and prediction of the initial freezingtemperature, as well as the relationship between temperature andunfrozen water fraction.
Theoretical considerationsThe depression of the freezing temperature for an ideal solu-
tion can be described by a thermodynamic relationship (Noggle1989; Mortimer 1993). For a 2-phase system (unfrozen water withdissolved solutes and frozen water) at equilibrium at the freez-ing temperature, the chemical potential of the pure solid solvent(µs
1) is equal to the chemical potential of the liquid solvent in thesolution:
µ1 (solid) = µ1 (solution) (1)
µs1 = µo
1 + RTA ln a1 (2)
where µo1 is the chemical potential of the pure unfrozen water. The
ideal gas constant (R 1.978 kcal/kg-mol·K or 8.314 kJ/kg-mol·K) andabsolute temperature (TA) are part of the relationship, while a1 is
E254 JOURNAL OF FOOD SCIENCE—Vol. 72, Nr. 5, 2007 C© 2007 Institute of Food Technologistsdoi: 10.1111/j.1750-3841.2007.00364.xFurther reproduction without permission is prohibited

E:Fo
odEn
ginee
ring&
Phys
icalP
rope
rties
Composition-based ice fraction model . . .
activity of the pure unfrozen water. When Equation 2 is divided bytemperature and differentiated with respect to temperature, at aconstant pressure, the following relationship is obtained:
(∂ ln a1
∂TA
)P
= �H f usion
T 2A
(3)
where �H f usion is the molar enthalpy change of fusion of the puresolvent. When Equation 3 is multiplied by ∂TA and the expression isintegrated over the range from the melting point of the pure solventTAo (water = 273.15 K) to a lower temperature TA, the following isobtained:
ln a1 = lnP1
Po= ln aw = −L
R
(1
TA− 1
TAo
). (4)
For an ideal solution, a1 = P1/P◦ = aw. P1, P ◦, and aw were partialvapor pressure of water, vapor pressure of pure water, and wateractivity, respectively. The molar enthalpy change for fusion becomesthe latent heat of fusion for water (L [18515 J/mol]). Using Raoult’slaw, P1 = n1P◦, where n1 is molar fraction of water in the solution,Equation 4 can be expressed as:
ln n1 = −LR
(1
TA− 1
TAo
)(5)
For this investigation, n1 is defined as:
n1 = mU/MW
mU/MW + ∑i
(mi/Mi )(6)
where m and M are mass and molecular weight of food components.The subscripts U , W , and i are unfrozen water, water, and the keyfood component, respectively. Components i are the dry solid com-ponents with significant impact on the freezing temperature of thefood.
In many foods, a significant portion of the water does not freeze,even at very low temperatures. In order to account for unfreezablewater mass (mb), the amount must be incorporated into Equation 5through n1 in Equation 6:
n1 = (mU − mb)/MW
(mU − mb)/MW + ∑i
(mi/Mi )(7)
Unfreezable water is usually defined as the water that does not freezeat temperatures encountered during food freezing (Wolfe and others2002). In this investigation, unfreezable water is defined as water thatdoes not freeze at−40 ◦C (Heldman 1974). Several prediction modelsfor the quantity of unfreezable water in food have been proposed(Schwartzberg 1976; Chen 1985a). An empirical model proposedby Schwartzberg (1976) has been applied in this investigation. Themodel is a linear relationship between unfreezable water and totaldry solid (Xs) mass fraction:
XU,−40◦C = Xb = aXs (8)
where a is an experimental coefficient factor defined for spe-cific types of food products and Xs is the summation of dry solidmass fractions of proteins, carbohydrates, lipids, ashes, and fibers(Schwartzberg 1976; Chen 1985b; Pham 1987; Mannapperuma andSingh 1989). The values of a are 0.24 to 0.27 for meat and fish, 0.18to 0.25 for vegetable, 0.15 to 0.20 for glucose, 0.3 for sucrose, 0.11 foregg component, 0.13 for bread, and 0.40 for Tylose gel (Schwartzberg
1976; Chen 1985b; Pham 1987). Meats and seafoods have beenidentified to contain relatively large quantities of unfreezable wa-ter (Heldman 1974).
Frozen water mass (mI ) can be estimated by:
mI = mW − mb − mU (9)
where mW is initial water content of food. FWF is then expressed as:
FWF = mI /mT (10)
where mT is total mass of food. In addition, FWF is expressed as afunction of temperature (T) as:
FWF(T) = mI (T)/mT (11)
To obtain values of FWF, the molecular weights (Mi) of food keycomponents are required (Equation 5 and 7). In this investigation,actual molecular weights of key low molecular weight food soluteshave been identified. Food components with large molecule weights(for example, proteins, carbohydrates, and fiber) were assumed tohave a molecular weight of 50 kDa. Lipids were assumed to have nosignificant influence on freezing of food products.
All food properties, including FWF, were assumed to dependon composition, and with no significant dependence on structure(Heldman and Taylor 1997; Fikiin 1998; Hartel 2001). This investiga-tion was concerned only with the structures that are nonporous.
Materials and Methods
Experimental data managementFood composition. In this investigation, the compositions of
foods have been acquired from Food Composition and NutritionTables (Souci and others 1994). The key component of food com-position was the water fraction of the food product to be evaluated.Product compositions from the Food Composition and Nutrition Ta-bles had been selected with water contents as close as possible tothe products investigated in the published literature on food freez-ing. The water content difference between these 2 sources of datawas strictly less than ±1%. Water is the major component that un-dergoes phase transition and the properties of water and ice have asignificant influence on properties of the frozen food. Similarity ofthe amount of water content in a same type of food products shouldlead to similarity of properties of the products.
Food properties. Unfrozen water fraction data for meat,seafood, fruit, and vegetable presented in Mollier diagrams (Riedel1951; Riedel 1956; Riedel 1957) were used in this investigation. Thedata were converted from the enthalpy of the foods measured by anadiabatic calorimetric method. Unfrozen water fraction is directlyproportional to ice fraction (Equation 9). These 2 parameters wereused interchangeably in this study.
Experimental initial freezing temperature data were obtainedfrom a variety of literature sources (Dickerson, Jr. 1981; Heldmanand Singh 1981; Weast and Astle 1982; Chen and Nagy 1987; Lindsayand Lovatt 1994; Woinet and others 1998). Rahman (1994; 1995a;1995b) assembled these experimental data.
Identification of key food componentsKey food components were selected according to influence on
depression of the freezing temperature. The assumptions included:
Vol. 72, Nr. 5, 2007—JOURNAL OF FOOD SCIENCE E255

E:FoodEngineering&PhysicalProperties
Composition-based ice fraction model . . .
(1) only low molecular weight water-soluble food components havesignificant influence on initial freezing temperature of water and(2) only food components reported in the food compositions litera-ture exist in foods in significant quantities. A minimum molality wasdefined as the molality change magnitude needed to cause signif-icant change in the food property magnitudes. Food componentswith molality higher than the minimum were identified as the keycomponents.
The predetermined key food components were examined in thepredictions of the food properties of actual food products. Then,deviation of the molality by the minimum value was reevaluated toconfirm its insignificant influences on the predicted values of actualfood product properties.
Prediction of food properties basedon food composition
Food properties. Unfrozen water mass as a function of temper-ature (mU [T ]) can be estimated using Equation 5 and 7. To obtainthe initial freezing temperature, Equation 5 was substituted withEquation 7 and rearranged to:
1TA
= 1TAo
− RMW
λln
(mU − mb)/MW
(mU − mb)/MW + ∑i
(mi/Mi )
(12)
where mU is substituted with the initial water content (mW ) and λ
is the mass enthalpy change for fusion or the latent heat of fusionfor water (333.64 kJ/kg).
Statistical analysisComparisons of predicted and published experimental values
were statistically analyzed in terms of standard errors or root meansquare errors (RMS) (Mickley and others 1957; Chen 1985a):
Standard Error =
√√√√√n∑1
(Experimental − Predicted
)2
n(13)
where n is the number of data. In some cases, the results were ex-pressed in terms of absolute difference (AD) or percent absolutedifference (%AD) (Rahman 1994):
AD = ∣∣Experimental − Predicted∣∣ (14)
%AD =∣∣Experimental − Predicted
∣∣Experimental
× 100 (15)
Results and Discussion
Influence of key food componentson frozen food properties
The strategy of this work is to use a lowest total solute molalityfood (most diluted system) as a reference food to help identify min-imum solute molality as the basic criterion of key food componentselection. A lowest total solute molality food is defined as the foodwhose total solute molality is lowest in comparison to that of allfood products. If this most diluted food system is added with a cer-tain amount of water-soluble solute, its freezing properties will bechanged as explained by the freezing temperature depression con-cept. The higher the solute molality added, the higher the freezing
properties affected. The point to identify is the minimum molal-ity point (minimum solute molality) where the freezing propertiesbegin to significantly change. A use of lowest total solute molalityreference food to help identify this point is beneficial because thesystem is most sensitive to a change in a small amount of water-soluble solute. These findings would lead to a conclusion that anyfood solute that contributes molality equal or higher than the min-imum molality level would be considered a key food component.This is due to its significant impact on the predicted freezing prop-erties. On the other hand, any food solute present in food in smallermolality is ignorable.
In order to create a most diluted reference food, a survey ofproduct compositions was conducted. Based on an analysis of358 food products, the total solute molality of squash with 94.2%moisture content was found to be the most diluted system with0.0014 mol/100 g food (Souci and others 1994). As a result, the totalsolute molality of 0.001 mol/100 g food (a little lower than that ofsquash) is preestablished as an appropriate reference of most di-luted solute molality of any food products.
The degrees of variation of the freezing property values,which are considered significant, must be established. The pub-lished literature for initial freezing temperature and frozen wa-ter fraction of several high moisture food products (Riedel1956; Heldman 1974, 1982, 1992; Schwartzberg 1976; Riedel1977; ASHRAE 1981; Larkin and others 1984; Chen 1985b;Rahman and Driscoll 1994; Rahman 1995b; Hsu and Heldman 2004)was analyzed. It was found that typical results include initial freezingtemperatures in a range from 0 to −3 ◦C, and frozen water fractionsfrom 0.0 to 1.0. Based on this information, an acceptable predictionvariation for prediction of initial freezing temperature was proposedto be ±5% (AD). This magnitude of variation was based on the sensi-tivity of a good temperature sensor (±0.1 ◦C). An acceptable standarderror (SE) for the frozen water fraction prediction was establishedas 0.005, a magnitude observed in the experimental data for frozenwater fraction.
The influence of solute molality added to the reference food(0.001 mol/100 g food) from 0 to 10000 µmol/100 g of food on foodfreezing properties has been analyzed. The initial freezing temper-ature (TA) was calculated using Equation 12. It was assumed thatmU and mb were equal to 95.5% and 1.0%. The total solute molality(∑
[mi/Mi]) was varied. For example, the initial freezing tempera-ture of the reference food was calculated as −0.0196930 ◦C usingthe total solute molality of 0.001 mol/100 g food. Once the refer-ence food was added to 50 µmol/100 g food, the predicted initialfreezing temperature of the reference food decreased to −0.0206775◦C (by substituting the total solute molality with 0.001050 mol/100g food). The unfrozen water fractions as a function of temperaturewere calculated using Equation 5 and 7. For example, the unfrozenwater fraction of the reference food at −10 ◦C was 58.09%. Whenthe reference was added to 50 µmol/100 g food, the unfrozen waterfraction increased to 61.00%. The differences of the predicted initialfreezing temperatures and unfrozen water fractions as a functionof temperature between the reference food and the reference foodwith additional solute molality in various levels were evaluated. Aportion of the results is presented in Figure 1. The results confirmedthat the initial freezing temperature and unfrozen water fractionwere dependent on solute molality. As the additional solute molal-ity increased, the values of these parameters became more highlydifferent from those of the reference food. It was evident that an in-crease in solute molality of 50 µmol/100 g food caused a 5% decreasein the initial freezing temperature. The same change in molalitycaused a variation of ±4.02 × 10⁻⁴ (SE) in prediction of the frozenwater fraction, much less than the acceptable limit of 0.005. This
E256 JOURNAL OF FOOD SCIENCE—Vol. 72, Nr. 5, 2007

E:Fo
odEn
ginee
ring&
Phys
icalP
rope
rties
Composition-based ice fraction model . . .
suggested that the initial freezing temperature is more subjected tomolality change than the unfrozen water fraction.
The evaluation of the effect of solute molality change was alsoconducted for other reference foods with higher solute molality than0.001 mol/100 g food. It was noticed that when the reference molal-ity was increased, the variation of the freezing properties from thoseof the corresponding reference foods decreased. For example, whenthe reference molality was increased to 0.15 mol/100 g food (highestvalue found for high-moisture food products was 0.12 mol/100 gfood of 89.4% moisture pineapples [Souci and others 1994]), an in-crease in molality of 50 µmol/100 g food resulted in an insignificantvariation in the initial freezing temperature (±0.03% AD). The varia-tion in unfrozen water fraction was only ±0.38 × 10⁻⁴ (SE) (Figure 1).This observation confirms that the low reference molality (0.001mol/100 g food) is the most sensitive indicator when evaluating theinfluence of molality change on initial freezing temperature andunfrozen water fraction. A small addition of molality to this systemwould more highly alter the freezing properties than to the systemwith higher molality.
The preceding analysis indicates that food solutes with molalitiesof 50 µmol/100 g food or higher must be considered as significant.Based on published food compositions, sodium (MW = 22.99) is thelowest molecular weight component in any food (Table 1). Giventhe molecular weight of sodium, the maximum mass fractions withsignificant influence on initial freezing temperature or unfrozen wa-ter fraction would be 0.0000115 g/g food (mass = number of mole× molecular weight; therefore, maximum mass = 50 µmol/100 gfood × 22.99 = 0.00115000 g/100 g food or 0.0000115 g/g food) or1.15 mg/100 g food. An analysis of the composition of 400 differ-ent food products indicated that all components in Table 1 werefound to have molality greater than 50 µmol/100 g food. They are
Figure 1 --- Influence of a solute molality increment of thereference solute concentrations from 0 to 100 µmol/100g food on variation of initial freezing temperature (%AD ofTFi) from those at the reference solute concentrations of0.001 mol/100 g food (thick solid line) and 0.15 mol/100 gfood (thick dashed line) and on variation of unfrozen waterfraction as a function of temperature (SE of XU) from thoseat the reference solute concentrations of 0.001 mol/100 gfood (thin solid line) and 0.15 mol/100 g food (thin dashedline)
the key food components that are to be incorporated into the totalsolute molality term (
∑[mi/Mi]) in Equation 7 and 12. The rest of
the key components are total proteins, carbohydrates, and fiberswhose molecular weight is estimated as 50 kDa (also incorporatedinto the
∑(mi/Mi) term). mb can be calculated using Equation 8
(by mb = Xb × mT ). That means now the models for predictions ofinitial freezing temperature (Equation 12) and unfrozen water frac-tion (Equation 5 and 7) are more practical and effective. Knowingonly food composition (the water content and the key food solutes,14 components in Table 1, and total proteins, carbohydrates, andfibers), the food freezing properties can be predicted. Fortunately,the ratios of all these components of many food products havebeen reported and readily accessible from general food composi-tion handbooks. As a result, there has no longer been difficulty indetermination of the total solute molality term.
It should be noted that other solutes contributing larger than50 µmol/100 g food besides those recommended above may be keyfood components for particular food products. This solute molalitylevel is being used in making a decision to include or exclude a givenfood solute in the prediction of frozen food properties. For example,food products with high alcohols (for example, fermented fruits)contain ethanol in levels higher than 50 µmol/100 g food. In theseparticular cases, ethanol would become another key solute.
Prediction of frozen food properties basedon composition
Initial freezing temperature. The initial freezing temperaturesof 200 high-moisture (>70% water) food products were predictedusing the proposed prediction model (Equation 12), with the keycomponents contributing molalities at or above 50 µmol/100 g foodused as inputs. The products included model food systems, fruits,vegetables, meats, seafoods and dairy products. The experimentalinitial freezing temperatures for these products varied from −0.1 to−3.0 ◦C. A part of the predicted results is presented in Table 2. Theabsolute differences (AD) between the experimental and predictedinitial freezing temperatures were determined and are summarizedin Figure 2. The frequency of AD was distributed normally over thetemperature range from −1.0 to 1.0 ◦C. Nearly 45% of the differenceswere within an AD of ±0.15 ◦C. The SE for the differences betweenexperimental and predicted values was ±0.65 ◦C.
Table 1 --- Characteristics of food composition, molecularweight (MW), quantity (in a total of 100-g food), and foodsource
Food componenta Quantitya MW Food sourcea
Minerals and elementSodium, Na mg 22.99 GeneralMagnesium, Mg mg 24.31 GeneralPhosphorus, P mg 30.97 GeneralChloride, Cl mg 35.45 GeneralPotassium, K mg 39.10 GeneralCalcium, Ca mg 40.08 General
CarbohydratesMonosaccharide, C6H12O6 g 180.07 GeneralDisaccharide, C12H22O11 g 342.11 General
Acid and baseNitrate, NO3 mg 62.00 Vegetables,
cured meatOxalic acid, HOOCCOOH mg 90.03 GeneralLactic acid, CH3CH(OH)COOH mg 90.08 GeneralMalic acid, C4H6O5 mg 134.10 GeneralAscorbic acid, C6H8O6 mg 176.10 GeneralCitric and isocitric acid, mg 192.10 General
HOC(COOH)(CH2COOH)2
aSource: Souci and others (1994).
Vol. 72, Nr. 5, 2007—JOURNAL OF FOOD SCIENCE E257

E:FoodEngineering&PhysicalProperties
Composition-based ice fraction model . . .
The magnitudes of differences between predicted and experi-mental values are well within an acceptable range when consideringpotential errors associated with measurement of initial freezingtemperatures. Previous investigations (Pham 1996; Miles andothers 1997) have described the challenges in measurement ofinitial freezing temperature for an inhomogeneous food sample.Typical experimental data for initial freezing temperatures of a samefood product are reported within ±1 ◦C (Rahman 1994; Pham 1996;Miles and others 1997). For example, experimental initial freezingtemperature data for haddock, with 80.3% moisture content, rangedfrom −1.00 ◦C (Murakami and Okos 1989) to −2.94 ◦C (Charm andMoody 1966).
Another portion of the difference between predicted and experi-mental data may originate from the differences in food compositionfrom composition tables, as compared to composition of products
Table 2 --- Comparisons between experimental and pre-dicted initial freezing temperatures of a variety of high-moisture food models and food products
TFi (◦C)
Food itema Water (%) Experimental Predicted AD (±)
Food modelFructose solution 90.00 −1.17b −1.16 0.01Gelatin gel 98.28 −0.13c −0.11 0.02Tylose 77.00 −0.60d −0.60 0.00
FruitApplee 85.80 −1.45f −1.36 0.09Orange juice 89.00 −1.17g,h −1.18 0.01Peach 85.10 −1.56i −1.53 0.00Pear 83.50 −1.62j −1.62 0.00
VegetableAsparagus 92.60 −0.52k,l −0.53 0.01Onion 89.70 −0.90m −0.95 0.05Spinach 90.20 −0.56g −0.57 0.01Tomato 92.90 −0.72g,h −0.65 0.07
MeatBeef 74.00 −1.00n −1.00 0.00Chicken 76.00 −0.79k −0.69 0.10Pork, lean 76.00 −0.82o −0.85 0.03
SeafoodCarp 77.80 −0.80p,d −0.80 0.00Cod 80.30 −0.69j −0.69 0.00Perch 79.10 −0.86q −0.86 0.00
Dairy productMilk, skimmed 90.00 −0.60s,t −0.87 0.27Milk, whole 87.50 −0.60u −0.64 0.04
aAll food composition data used in this investigation are found in Souci andothers (1994).bWeast and Astle (1982).cWoinet and others (1998).dMannapperuma and Singh (1989).eAn example of initial freezing temperature calculation: The calculation used thekey components of 85.80%-moisture apple (Souci and others 1994), that is,0.32% proteins, 10.83% carbohydrates, 0.55% lipids, 1.90% fibers, 8.43%monosaccharide, 2.40% disaccharide, 0.0113% ascorbic acid, 0.0273% citricacid, 0.4011% malic acid, 0% lactic acid, 0.0005% oxalic acid, 0.0020% sodium,0.1356% potassium, 0.0060% magnesium, 0.0067% calcium, 0.0113%phosphorus, 0% chloride and 0.0023% nitrate. Incorporate these componentsinto the total solute molality term (
∑[mi /Mi ]) in Equation 12 by calculating mb
(Equation 8) using the a-factor value of 0.18, and mU and mT are equal to 85.80and 100, respectively.fRahman and Driscoll (1994).gHeldman and Singh (1981).hHeldman (1974).iASHRAE (1998).jASHRAE (1993).kDickerson (1969).lLarkin et al. (1984).mASHRAE (1998).nChen (1986).oLindsay and Lovatt (1994).pBartlett (1944).qPham (1987).rLacey and Payne (1996).sChen and Nagy (1987).tPham (1996).uPolly and others (1980).
used in investigations to measure initial freezing temperatures. In-herent variability in experimental data may exist due to productcomposition variations caused by breed, age, growing conditions,and so on. Composition variability among food products has beendiscussed by Souci and others (1994), USDA (1975), and Holland andothers (1991). For example, reported variability in phosphorus con-tent of swordfish would create a difference in the predicted initialfreezing temperature of 0.41 ◦C for this product.
Each food product category, food model, fruit, vegetable, meat,seafood, and dairy product was analyzed independently. The pre-dicted results for the food models (for example, fructose and su-crose solutions) were excellent. All experimental data were within±0.05 ◦C when compared to predicted initial freezing temperatures.The SE for the differences between predicted and experimental datawas 0.08 ◦C. For the meat product category, 52% of the experimentalvalues were within±0.15 ◦C of the predicted initial freezing tempera-tures. For other food product categories, similar levels of agreementwere found, with approximately 40% of experimental data within±0.15 ◦C.
A comparison has been made to another model, Miles and oth-ers (1997), which also predicted initial freezing temperatures basedon food composition. Miles and others (1997) reported results onprediction of initial freezing temperatures based on food compo-sition. These researchers found that 92% of the predicted resultswere within 1 ◦C of experimental data. The freezing temperaturedepression for fruits and vegetables was underestimated by theprediction model used by Miles and others (1997) (Figure 3). Themodel being proposed in this investigation did not underestimatethe initial freezing temperature of the same products. These compar-isons emphasize the importance of considering all food componentsimpacting the onset of ice crystal formation in the product. Theselection of components to be considered must be based on molal-ity, not concentration.
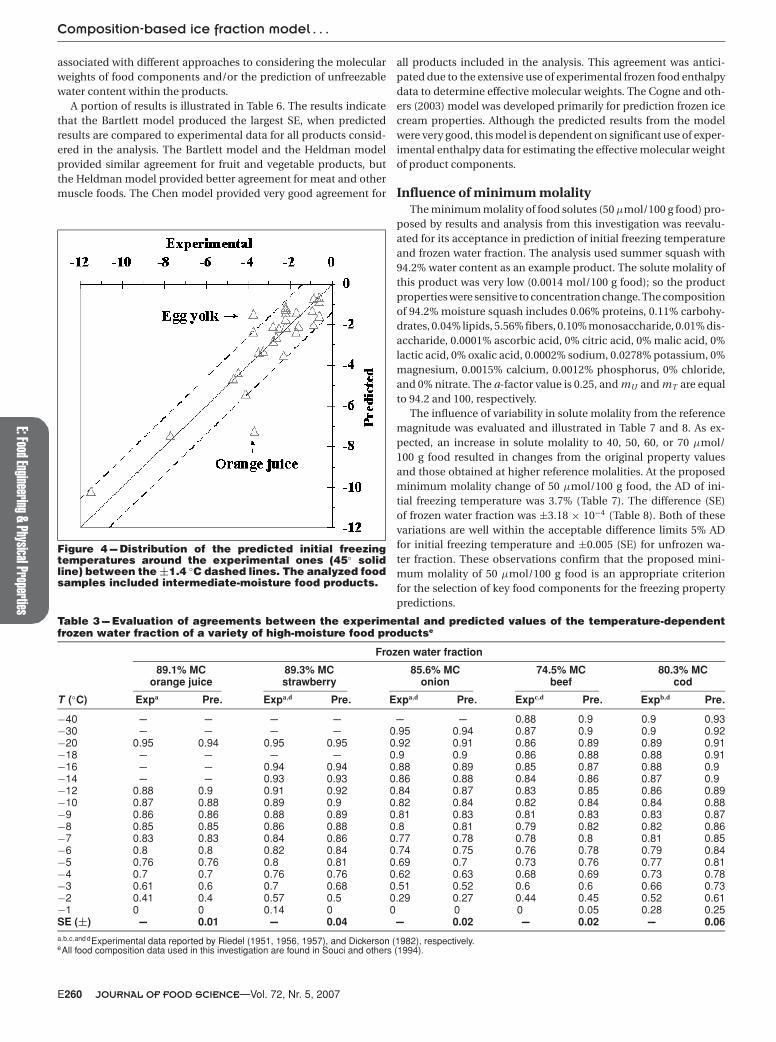
Twenty-nine intermediate-moisture (40% to 70% water) foodproducts were analyzed (Figure 4). The results indicated that theexperimental initial freezing temperatures of all products (except50% moisture egg yolk and 58% moisture orange juice) were in closeagreement with predicted values. Most of the predicted initial freez-ing temperature data for the intermediate-moisture food productswere within ±1.4 ◦C of experimental data. It seems that the initialfreezing temperature prediction is more accurate for high-moisturefood products (within ±1 ◦C) than for the intermediate-moisturefood products.
It was observed that there were unexpectedly large differences forexperimental initial freezing temperatures of the egg yolk and theorange juices reported by different studies. For example, the exper-imental values reported for 48.8% moisture content (ASHRAE 1998)and 50% moisture content (Lacey and Payne 1996) egg yolks were−0.60 and −3.75 ◦C, respectively. These large variations among ex-perimental initial freezing temperature values (3.15 ◦C) for egg yolkswith small differences in water content suggest potential errors inexperimental measurements. A similar situation was observed for50% and 58% moisture content orange juice products (Figure 4).These large differences in the experimental data suggested possi-ble errors in the initial freezing temperature measurement. On theother hand, if all the measurements were correct, the large variationof the initial freezing temperatures with small differences in watercontent would suggest food composition differences between theanalyzed products and those reported in the food composition ta-bles. It appeared that the compositions of key components from thefood composition tables were much closer to compositions used tomeasure initial freezing temperatures for the 48.80% moisture eggyolk and 50% moisture orange juice.
E258 JOURNAL OF FOOD SCIENCE—Vol. 72, Nr. 5, 2007

E:Fo
odEn
ginee
ring&
Phys
icalP
rope
rties
Composition-based ice fraction model . . .
Frozen water fraction. The relationships between frozen waterfraction and temperature were predicted for a variety of food prod-ucts. An example of temperature-dependent frozen water fractioncalculation is as follows: First, substitute TA in Equation 5 with tem-perature of interest to calculate n1. Second, substitute the n1 valuein Equation 7 and calculate corresponding mU (TA). The calculationused the key components of 89.3% moisture strawberry (Souci andothers 1994), that is, 0.89% proteins, 6.08% carbohydrates, 1.69%fibers, 5.42% monosaccharide, 1.21% disaccharide, 0.0776% ascor-bic acid, 0.9074% citric acid, 0.3676% malic acid, 0% lactic acid, 0%oxalic acid, 0.0030% sodium, 0.1083% potassium, 0.0102% magne-sium, 0.0309% calcium, 0.0302% phosphorus, 0.0110% chloride, and0.0010% nitrate. Incorporate these components into the total solutemolality term (
∑[mi/Mi]) in Equation 7 by calculating mb (Equ-
ation 8) using the a-factor value of 0.15, and mT are equal to 100.Third, use Equation 9 and 10 to calculate the frozen water fraction.
A total of 23 high-moisture food products were analyzed. Someof the results are presented in Table 3. The predicted relation-ships were in close agreement with published experimental data(SE ≤ ±0.04, except 80.3% moisture cod). It is anticipated that a por-tion of the difference between the experimental and predicted maybe due to the differences in compositions of the food products usedin the prediction model compared to composition of food productsused in the experimental investigations.
Figure 2 --- Histogram of temperaturedifference between theexperimental and predicted initialfreezing temperature of 200 foodproducts. The products includedfood model, fruit, vegetable, meat,seafood, and dairy products.Temperature difference was definedas the subtraction of the predictedfrom the experimental value.
Figure 3 --- Distribution of thepredicted initial freezingtemperatures around theexperimental ones (45◦ solid line)between the ±1 ◦C dashed lines. Thecurves demonstrated comparisonsthe prediction results of theproposed model (�) and Miles andothers model (�). The analyzed foodsamples included (a) fruit and (b)vegetable.
It was observed that the agreement between experimental frozenwater fractions/temperature relationships and predicted relation-ships was likely not as close for food products with intermedi-ate moisture contents (for example, concentrated orange juice anddried beef and cod with 50% water content, egg yolk with 40% watercontent, and ice cream with 63.4% water content) as compared tohigher water content products (SE closed to ±0.04) (Table 4). Theseobservations may be associated with the limitations in measure-ment of the properties of frozen concentrated foods.
The predicted relationships for individual food categories (for ex-ample, fruits, vegetables, meats, and seafoods) were analyzed. Theresults of the analysis indicate that the predicted frozen water frac-tions were very close to the experimental data for all food categories(0.020 < SE < 0.037). The experimental frozen water fraction datafor meats, fruits, and vegetables as measured by Riedel (1951, 1957)were in close agreement with the predicted relationships.
An analysis of several prediction models for frozen water fractioncompared with temperature was completed for 8 food products.The models included in the analysis (Table 5) are those proposedby Bartlett (1944), Heldman (1982), Miles and others (1983), Chen(1985a), and Cogne and others (2003), as well as the model proposedin this investigation. All models were derived from the Raoult’s lawof ideal binary solutions and account for the amounts of unfreezablewater in the products. The differences among the various models are
Vol. 72, Nr. 5, 2007—JOURNAL OF FOOD SCIENCE E259
E:FoodEngineering&PhysicalProperties
Composition-based ice fraction model . . .
associated with different approaches to considering the molecularweights of food components and/or the prediction of unfreezablewater content within the products.
A portion of results is illustrated in Table 6. The results indicatethat the Bartlett model produced the largest SE, when predictedresults are compared to experimental data for all products consid-ered in the analysis. The Bartlett model and the Heldman modelprovided similar agreement for fruit and vegetable products, butthe Heldman model provided better agreement for meat and othermuscle foods. The Chen model provided very good agreement for
Figure 4 --- Distribution of the predicted initial freezingtemperatures around the experimental ones (45◦ solidline) between the ±1.4 ◦C dashed lines. The analyzed foodsamples included intermediate-moisture food products.
Table 3 --- Evaluation of agreements between the experimental and predicted values of the temperature-dependentfrozen water fraction of a variety of high-moisture food productse
Frozen water fraction
89.1% MC 89.3% MC 85.6% MC 74.5% MC 80.3% MCorange juice strawberry onion beef cod
T (◦C) Expa Pre. Expa,d Pre. Expa,d Pre. Expc,d Pre. Expb,d Pre.
−40 --- --- --- --- --- --- 0.88 0.9 0.9 0.93−30 --- --- --- --- 0.95 0.94 0.87 0.9 0.9 0.92−20 0.95 0.94 0.95 0.95 0.92 0.91 0.86 0.89 0.89 0.91−18 --- --- --- --- 0.9 0.9 0.86 0.88 0.88 0.91−16 --- --- 0.94 0.94 0.88 0.89 0.85 0.87 0.88 0.9−14 --- --- 0.93 0.93 0.86 0.88 0.84 0.86 0.87 0.9−12 0.88 0.9 0.91 0.92 0.84 0.87 0.83 0.85 0.86 0.89−10 0.87 0.88 0.89 0.9 0.82 0.84 0.82 0.84 0.84 0.88−9 0.86 0.86 0.88 0.89 0.81 0.83 0.81 0.83 0.83 0.87−8 0.85 0.85 0.86 0.88 0.8 0.81 0.79 0.82 0.82 0.86−7 0.83 0.83 0.84 0.86 0.77 0.78 0.78 0.8 0.81 0.85−6 0.8 0.8 0.82 0.84 0.74 0.75 0.76 0.78 0.79 0.84−5 0.76 0.76 0.8 0.81 0.69 0.7 0.73 0.76 0.77 0.81−4 0.7 0.7 0.76 0.76 0.62 0.63 0.68 0.69 0.73 0.78−3 0.61 0.6 0.7 0.68 0.51 0.52 0.6 0.6 0.66 0.73−2 0.41 0.4 0.57 0.5 0.29 0.27 0.44 0.45 0.52 0.61−1 0 0 0.14 0 0 0 0 0.05 0.28 0.25SE (±) --- 0.01 --- 0.04 --- 0.02 --- 0.02 --- 0.06a,b,c,and dExperimental data reported by Riedel (1951, 1956, 1957), and Dickerson (1982), respectively.eAll food composition data used in this investigation are found in Souci and others (1994).
all products included in the analysis. This agreement was antici-pated due to the extensive use of experimental frozen food enthalpydata to determine effective molecular weights. The Cogne and oth-ers (2003) model was developed primarily for prediction frozen icecream properties. Although the predicted results from the modelwere very good, this model is dependent on significant use of exper-imental enthalpy data for estimating the effective molecular weightof product components.
Influence of minimum molalityThe minimum molality of food solutes (50 µmol/100 g food) pro-
posed by results and analysis from this investigation was reevalu-ated for its acceptance in prediction of initial freezing temperatureand frozen water fraction. The analysis used summer squash with94.2% water content as an example product. The solute molality ofthis product was very low (0.0014 mol/100 g food); so the productproperties were sensitive to concentration change. The compositionof 94.2% moisture squash includes 0.06% proteins, 0.11% carbohy-drates, 0.04% lipids, 5.56% fibers, 0.10% monosaccharide, 0.01% dis-accharide, 0.0001% ascorbic acid, 0% citric acid, 0% malic acid, 0%lactic acid, 0% oxalic acid, 0.0002% sodium, 0.0278% potassium, 0%magnesium, 0.0015% calcium, 0.0012% phosphorus, 0% chloride,and 0% nitrate. The a-factor value is 0.25, and mU and mT are equalto 94.2 and 100, respectively.
The influence of variability in solute molality from the referencemagnitude was evaluated and illustrated in Table 7 and 8. As ex-pected, an increase in solute molality to 40, 50, 60, or 70 µmol/100 g food resulted in changes from the original property valuesand those obtained at higher reference molalities. At the proposedminimum molality change of 50 µmol/100 g food, the AD of ini-tial freezing temperature was 3.7% (Table 7). The difference (SE)of frozen water fraction was ±3.18 × 10⁻⁴ (Table 8). Both of thesevariations are well within the acceptable difference limits 5% ADfor initial freezing temperature and ±0.005 (SE) for unfrozen wa-ter fraction. These observations confirm that the proposed mini-mum molality of 50 µmol/100 g food is an appropriate criterionfor the selection of key food components for the freezing propertypredictions.
E260 JOURNAL OF FOOD SCIENCE—Vol. 72, Nr. 5, 2007

E:Fo
odEn
ginee
ring&
Phys
icalP
rope
rties
Composition-based ice fraction model . . .
Table 4 --- Evaluation of agreements between the experimental and predicted values of the temperature-dependentfrozen water fraction of a variety of high-moisture food productsf
Frozen water fraction
50% MC 50% MC 40% MC 50% MC 63.4% MCorange juice beef egg yolk cod ice cream
T (◦C) Expa Pre. Expa,d Pre. Expa,d Pre. Expc,d Pre. Expb,d Pre.
−40 --- --- 0.64 0.64 0.8 0.82 0.61 0.59 --- ---−30 --- --- --- --- --- --- --- --- 0.89 0.85−20 0.45 0.46 0.63 0.59 --- --- 0.57 0.53 0.84 0.81−18 --- --- --- --- 0.78 0.79 --- --- 0.83 0.8−16 --- --- --- --- --- --- --- --- 0.81 0.78−14 --- --- --- --- 0.76 0.78 --- --- 0.78 0.76−12 0.06 0.14 0.55 0.53 --- --- 0.49 0.45 0.75 0.74−10 0 0 0.51 0.5 0.73 0.75 0.44 0.41 0.71 0.7−9 0 0 0.47 0.48 0.72 0.74 0.4 0.38 0.68 0.68−8 0 0 0.44 0.45 0.71 0.73 0.36 0.35 0.65 0.65−7 0 0 0.4 0.42 0.69 0.71 0.31 0.31 0.6 0.61−6 0 0 0.34 0.37 0.67 0.69 0.25 0.25 0.55 0.55−5 0 0 0.26 0.31 0.65 0.65 0.16 0.17 0.48 0.48−4 0 0 0.13 0.22 0.62 0.6 0.05 0.05 0.4 0.37−3 0 0 0.02 0.07 0.55 0.52 0 0 0.28 0.19−2 0 0 0 0 0.42 0.36 0 0 0.12 0−1 0 0 0 0 0.06 0 0 0 0 0SE (±) --- 0.00 --- 0.04 --- 0.03 --- 0.02 --- 0.04a,b,c,d,eExperimental data reported by Riedel (1951, 1956, 1957), Dickerson (1982), and Cogne and others (2003), respectively.fAll food composition data used in this investigation are found in Souci and others (1994).
Table 5 --- Proposed models of prediction of effective molecular weight of water-soluble solutes and unfreezable water
Food effective molecular weight Unfreezable water
I. Bartlett (1944)a
ME = MW XS
XW
[(exp
{−aTi f + bT2i f
}) − 1]
Tif = food initial freezing point a = λMW
/RT2
Ao = 9.703 × 10⁻³
(◦C)−1 and b = 4.794 × 10⁻⁶ (◦C)−2.
XB is expressed as: Xb = XW − aw(XW − 18XS
/ME)
1 − awby aw = water ac-
tivity calculated using an average experimental enthalpy (�H ) at T
and TAo: aw = exp
[18�H (T − TAo)
RTTAo
)or �H can be estimated using
�H = HO − 0.5�CP (TAo − T) where H0 is equal to latent heat of freez-ing of pure water (λ), and �CP in the temperature range from −1 to −60◦C is approximately 0.5 kCal/kg·◦C or 2093.4 J/kg·◦C.
II. Heldman (1982)a
ME = MW XS
XW
[(exp
{−a1Ti f
}) − 1]
where a1 = λMW
RTAoT
Experimentally defined as the unfrozen water at −40 ◦C.
III. Chen (1985a)
ME = XSRT2Ao
ttr(
H f
t−tr− 0.37 − 0.3XS
)Hf = enthalpy at a temperature T , in the range within 10◦ Cbelow freezing point, t = T − TAo and tr = −40◦ C
Xb = 1 −[
XS
ME
RT2Ao
λ
(ti f + 40
)−40ti f
]
tif = Tif – TAo; by substituting Tif with experimental initial freezingtemperature
V. Miles and others (1983) Use Eq. 7 by substitution with thedefined key food components, water, mono- anddi-saccharide, lactic, malic, citric, isocitric, acetic, tartaric andoxalic acids, alcohol, sodium, potassium, calcium,magnesium, iron, phosphorus, and chlorine.
Xb = 0.3 XC + 0.45 XP
XC and XP are mass fractions of carbohydrates and proteins,respectively.
IV. Cogne and others (2003)
ln(
(XW − Xb) /MW
(XW − Xb) /MW + XS/ME
)= λMW
R
(1TA
− 1TAo
)by
substitution with an experimental initial freezing temperatureof the ice cream (−2.5 ◦C) obtaining ME of 0.55 kg/mol
Experimentally determined as 23%.
aBartlett’s and Heldman’s models are similar. However, Heldman’s was not based on the assumption that TAoT ≈ T 2Ao although it is correct for small values of (T −
TAo). The term bT2if was considered negligibly small. “a1” ≈ “a”.
Vol. 72, Nr. 5, 2007—JOURNAL OF FOOD SCIENCE E261

E:FoodEngineering&PhysicalProperties
Composition-based ice fraction model . . .
Table 6 --- Comparison of predictive models of temperature-dependent frozen water fraction prediction
Frozen water fraction at T (◦C) SEModel −40 −30 −20 −18 −16 −14 −12 −10 −9 −8 −7 −6 −5 −4 −3 −2 −1 (±)
82% MC Codi
Exp.b 0.92 --- 0.90 --- --- --- 0.87 0.86 0.85 0.84 0.83 0.81 0.78 0.76 0.70 0.57 0.20 ---Chend 0.93 --- 0.90 --- --- --- 0.88 0.86 0.85 0.84 0.83 0.81 0.78 0.74 0.67 0.53 0.12 0.03Bartlette 0.98 --- 0.96 --- --- --- 0.93 0.91 0.90 0.88 0.86 0.83 0.79 0.71 0.57 0.13 0 0.14Heldmanf 0.89 --- 0.88 --- --- --- 0.87 0.86 0.85 0.84 0.84 0.82 0.79 0.75 0.61 0.24 0 0.11This work 0.90 --- 0.88 --- --- --- 0.86 0.84 0.84 0.83 0.81 0.80 0.77 0.74 0.68 0.56 0.22 0.02
50% MC Beefi
Exp.c 0.64 --- 0.63 --- --- --- 0.55 0.51 0.47 0.44 0.4 0.34 0.26 0.13 0.02 0 --- ---Chend 0.61 --- 0.57 --- --- --- 0.51 0.48 0.46 0.44 0.41 0.37 0.31 0.22 0.08 0 --- 0.04Bartlette 0.95 --- 0.88 --- --- --- 0.79 0.75 0.72 0.68 0.64 0.57 0.48 0.35 0.13 0 --- 0.21This work 0.64 --- 0.59 --- --- --- 0.53 0.50 0.48 0.45 0.42 0.37 0.31 0.22 0.07 0 --- 0.03
89% MC Orange juicei
Exp.a --- --- 0.95 --- --- --- 0.88 0.87 0.86 0.85 0.83 0.8 0.76 0.7 0.61 0.41 0 ---Chend --- --- 0.95 --- --- --- 0.91 0.89 0.88 0.86 0.84 0.81 0.77 0.71 0.62 0.42 0 0.01Bartlette --- --- 0.95 --- --- --- 0.91 0.89 0.88 0.86 0.84 0.81 0.77 0.71 0.61 0.42 0 0.01Heldmanf --- --- 0.95 --- --- --- 0.90 0.88 0.86 0.84 0.81 0.78 0.74 0.65 0.52 0.15 0 0.08This work --- --- 0.94 --- --- --- 0.9 0.88 0.87 0.85 0.83 0.80 0.76 0.7 0.61 0.41 0 0.01
63.4% M C Ice creami
Exp.g --- 0.89 0.84 0.83 0.81 0.78 0.75 0.71 0.68 0.65 0.6 0.55 0.48 0.4 0.28 0.12 0 ---Cogneg --- 0.81 0.78 0.77 0.76 0.74 0.71 0.67 0.65 0.6 0.58 0.53 0.45 0.35 0.17 0 0 0.00Milesh --- 0.91 0.87 0.86 0.84 0.82 0.79 0.75 0.73 0.7 0.66 0.61 0.52 0.40 0.18 0.02 0 0.05Heldmanf --- 0.83 0.8 0.78 0.76 0.74 0.72 0.69 0.65 0.62 0.6 0.53 0.46 0.35 0.16 0.01 0 0.05This work --- 0.85 0.81 0.8 0.78 0.76 0.74 0.70 0.68 0.65 0.61 0.55 0.48 0.37 0.19 0 0 0.04
a, b, cExperimental data reported by Riedel (1951, 1956, 1957), respectively.d, e, f, and gChen (1985a), Bartlett (1944), Heldman (1982), and Cogne and others (2003), respectively.hMiles and others (1983).iAll food composition data used in this investigation are found in Souci and others (1994).
Table 7 --- Discrepancy between the predicted initial freez-ing temperature (TFi) values at the reference concentra-tion (0.0014 mol/100 g food of 94.2% moisture summersquash) and those at various concentrations
Concentration incrementa
(µmol/100 g food) TFi (◦C) % ADb of TFi
0 −0.0274 ---40 −0.0282 2.950 −0.0284 3.760 −0.0286 4.370 −0.0288 5.1
aConcentration increment from the reference concentration.bStandard error is the error of the predicted values at the referenceconcentration compared to those at the given concentrations.
Table 8 --- Discrepancy between the predicted frozen wa-ter fraction (XI) values at the reference concentra-tion (0.0014 mol/100 g food of 94.2% moisture summersquash) and those at various concentrations
XI at various concentration incrementa
(µmol/100 g food)T(◦C) 0 40 50 60 70
−2 0.9715 0.9711 0.9711 0.9710 0.9709−4 0.9781 0.9779 0.9779 0.9779 0.9778−6 0.9804 0.9802 0.9802 0.9802 0.9801−8 0.9815 0.9814 0.9814 0.9813 0.9813
−10 0.9821 0.9821 0.9821 0.9820 0.9820−12 0.9826 0.9825 0.9825 0.9825 0.9825−14 0.9829 0.9829 0.9828 0.9828 0.9828−16 0.9831 0.9831 0.9831 0.9831 0.9831−18 0.9833 0.9833 0.9833 0.9833 0.9833−20 0.9835 0.9835 0.9834 0.9834 0.9834−22 0.9836 0.9836 0.9836 0.9836 0.9836−24 0.9837 0.9837 0.9837 0.9837 0.9837−26 0.9838 0.9838 0.9838 0.9838 0.9838−30 0.9839 0.9839 0.9839 0.9839 0.9839−35 0.9841 0.9840 0.9840 0.9840 0.9840±SEb (× 10−4) --- 2.56 3.18 3.83 4.45aConcentration increment from the reference concentration.bStandard error is the error of the predicted values at the referenceconcentration compared to those at the given concentrations.
Conclusions
Amodel for prediction of initial freezing temperature andfrozen water fraction based on concentration and molecular
weight of product components has been developed. The proposedmodel has been verified by demonstrating the influence of low-MW food components on initial freezing temperatures and thefrozen water fraction–temperature relationships. Low concentra-tions (50 µmol/100 g food) of low-MW (< 1000) components havesignificant influence on the relationships, while higher concentra-tions of high MW have no impact. The proposed model providesan effective approach to optimizing relationships between productformulations and the freezing process.
ReferencesASHRAE. 1981. Handbook of fundamentals. New York: Amer. Soc. Heating, Refrigerat-
ing and Air Conditioning Engineers.ASHRAE. 1998. Thermal properties of foods. In: Refrigeration. Atlanta, Ga.: American
Society of Heating, Refrigerating and Air Conditioning Engineers. p 8.1–8.30.Bartlett LH. 1944. A thermodynamic examination of the latent heat of food. Refrig Eng
47:377.Becker BR, Fricke BA. 1999a. Freezing times of regularly shaped food items. Int Com
Heat Mass Trans 26:617–26.Becker BR, Fricke BA. 1999b. Food thermophysical property models. Int Com Heat
Mass Trans 26:627–36.Boonsupthip W, Heldman, DR. 2005. A composition-based model for prediction of
frozen muscle food quality. [PhD thesis]. Rutgers, The State Univ. of New Jersey.Charm SE, Moody P. 1966. Bound water in haddock muscle. ASHRAE J 8:39–42.Chen CS. 1985a. Thermodynamic analysis of the freezing and thawing of foods: en-
thalpy and apparent specific heat. J Food Sci 50:1158–62.Chen CS. 1985b. Thermodynamic analysis of the freezing and thawing of foods: ice
content and Mollier diagram. J Food Sci 50:1163–6.Chen CS. 1986. Effective molecular weight of aqueous solutions and liquid foods cal-
culated from the freezing point depression. J Food Sci. 51:1537–9.Chen CS, Nagy S. 1987. Prediction and correlation of freezing point depression of
aqueous solutions. Trans ASAE 30:1176.Cleland AC, Earle RL. 1984. Assessment of freezing time prediction methods. J Food
Sci 49:1034–42.Cleland DJ, Valentas KJ. 1997. Prediction of freezing time and design of food freezers.
In: Valentas KJ, Rotstein E, Singh RP, editors. Handbook of food engineering practice.Boca Raton, Fla.: CRC Press. p 71–123.
Cogne C, Andrieu J, Laurent P, Besson A, Nocquet J. 2003. Experimental data andmodeling of thermal properties of ice creams. J Food Eng 58:331–41.
Dickerson RW Jr. 1969. Thermal properties of foods. In: Tressler DK, Van Arsdel WB,Copley MJ, editors. The freezing preservation of foods. Westport, Conn.: AVI Publ.Co. p 26–51.
E262 JOURNAL OF FOOD SCIENCE—Vol. 72, Nr. 5, 2007

E:Fo
odEn
ginee
ring&
Phys
icalP
rope
rties
Composition-based ice fraction model . . .
Donhowe DP, Hartel RW, Bradley RL, Jr. 1991. Determination of ice crystal size distri-butions in frozen desserts. J Dairy Sci 74:3334–44.
Duckworth RB. 1971. Differential Thermal analysis of frozen food systems: the deter-mination of unfreezable water. J Food Technol 6:317.
Franks F. 1982. Water: a comprehensive treatise: water and aqueous solutions at sub-zero temperature. 484 p.
Hartel RW. 2001. Introduction. In: Hartel RW, editor. Crystallization in foods. Md.:Aspen Publishers Inc. p 1–9.
Heldman DR. 1974. Predicting the relationship between unfrozen water fraction andtemperature during freezing using freezing point depression. Trans ASAE 17:63.
Heldman DR. 1982. Food properties during freezing. Food Technol 36:92.Heldman DR. 1992. Food freezing. In: Heldman DR, Lund DB, editors. Handbook of
food engineering. New York: Marcel Dekker Inc. p 277–316.Heldman DR, Singh RP. 1981. Food process engineering. 2nd ed. Westport, Conn.: AVI.Heldman DR., Taylor TA. 1997. Modeling of food freezing. In: Erickson MC, Hung Y-C,
editors. Intl. Thomson Publishing. p 51–64.Holland B, Welch AA, Unwin ID, Buss DH, Paul AA, Southgate DAT. 1991. McCance and
Widdowson’s: the composition of foods, royal society of chemistry and ministry ofagriculture, fisheries and food. U.K.: Cambridge. 147 p.
Hsu C-L, Heldman DR. 2004. Prediction models for the thermal conductivity of aque-ous starch. Int J Food Sci Technol 39:737–43.
Hung YC, Thompson DR. 1983. Freezing time prediction for slab shape foodstuffs byan improved analytical method. J Food Sci 48:555–60.
Lacey RE, Payne FA. 1996. A model to estimate thermodynamic properties of biologicalmaterials during freezing. Trans ASAE 34:1836–1841.
Larkin JL, Heldman DR, Steffe JF 1984. An analysis of factors influencing precision ofthermal property values during freezing. Revue Internationale du Froid 86–109.
Lindsay DT, Lovatt SJ. 1994. Further enthalpy values of foods measured by an adiabaticcalorimeter. J Food Eng 23:609–20.
Mannapperuma JD, Singh RP. 1988. Prediction of freezing and thawing times of foodsusing a numerical method based on enthalpy formation. J Food Sci 53(2):626–30.
Mannapperuma JD, Singh RP 1989. A computer-aided method for the prediction ofproperties and freezing/thawing times of foods. J Food Eng 9:275–303.
Martino MN, Otero L, Sanz PD, Zaritzky NE. 1998. Size and location of ice crystals inpork frozen by high-pressure-assisted freezing as compared to classical methods.Meat Sci 50:303–13.
Mickley HS, Sherwood TK, Reed CE. 1957. Applied mathematics in chemical engineer-ing. New York: McGraw-Hill. 413 p.
Miles CA. 1974. Meat freezing – why and how? Proceedings of the meat research Inst.Symp. nr 3. Bristol 151–7.
Miles CA, Van Beek G, Veerkaamp CH. 1983. Calculation of thermophysical propertiesof food. In: Jowitt R, Escher F, Hallstrom B, Meffert HFT, Spiess WEL, editors. Physicalproperties of foods, Vol. 16. p 269–312.
Miles CA, Mayer Z, Morley MJ, Houska M. 1997. Estimating the initial freezing pointof foods from composition data. Int J Food Sci Technol 32:389–400.
Mortimer RG. 1993. Multicomponent system. In: Mortimer RG, editor. Physical chem-istry. Calif.: The Benjamin/Cummings Publishing Co. Inc. p 203–60.
Murakami EG, Okos MR. 1989. Measurement and prediction of thermal propertiesof foods. In: Singh RP, Medina AG, editors. Food properties and computer-aidedengineering food processing systems. London, U.K: Kluwer Academic Publishers. p3–48.
Noggle JH. 1989. Solutions. In: Noggle JH, editor. Physical chemistry. Ill.: Scott, Fores-man and Co. p 328–91.
Pham QT. 1987. Calculation of bound water in frozen foods. J Food Sci 52:210–12.Pham QT. 1996. Prediction of calorimetric properties and freezing time of foods from
composition data. J Food Eng 30:95–107.Polley SL, Snyder OP, Kotnour P. 1980. A compilation of thermal properties of foods.
Food Technol 34:76–94.Rahman MS. 1994. The accuracy of prediction of the freezing point of meat from
general models. J Food Eng 21:127–36.Rahman S. 1995a. Phase transitions in food. In: Rahman MS, editor. Food properties
handbook. Boca Raton, Fla.: CRC Press. p 87–95.Rahman S. 1995b. Physical properties of food. In: Rahman MS, editor. Food properties
handbook. Boca Raton, Fla.: CRC Press. p 179–224.Rahman MS, Driscoll RH. 1994. Thermal conductivity of seafoods: calamari, octopus
and prawn. Food Australia 43:356–60.Riedel L. 1951. The refrigerating effect required to freeze fruits and vegetables. Refrig
Eng 59:670.Riedel L. 1956. Calorimetric investigation of the freezing of fish meat. Kaltetechnik
8:374.Riedel L. 1957. Calorimetric investigation of the meat freezing process. Kaltetechnik
9:38.Riedel L. 1977. Enthalpy determination of food. Chem Mikrobiol Technol Lebensm
5:118–27.Salvadori VO, De Michelis A, Mascheroni RH. 1997. Prediction of freezing times for
regular multi-dimensional foods using simple formulae. Leb-Wis Technol 30:30–5.Schwartzberg HG. 1976. Effective heat capacities for the freezing and thawing of food.
J Food Sci 41:152–6.Souci SW, Fachmann W, Kraut H. 1994. Food composition and nutrition tables.
London, U.K.: CRC Press. 1091 p.[USDA] U.S. Department of Agriculture. 1975. Composition of foods, agricultural hand-
book nr 8. Washington, D.C.: U.S. Dept. of Agriculture.Weast RC, Astle MJ. 1982. CRC handbook of chemistry and physics, 63rd. Boca Raton,
Fla.: CRC Press.Woinet B, Andrieu J, Laurent M, Min SG. 1998. Experimental and theoretical study of
model food freezing. Part II. Characterization and modeling of the ice crystal size. JFood Eng 35:395–407.
Wolfe J., Bryant G, Koster K. 2002. What is “unfreezable water”, how unfreezable is itand how much is there? Cryo Letters 23:157–66.
Vol. 72, Nr. 5, 2007—JOURNAL OF FOOD SCIENCE E263