bootstrapping and tree reliability - fasta and tree reliability ... • bootstrapping –given a set...
TRANSCRIPT

1
Bootstrapping and Tree reliability
• Rooting trees (outgroups)• Bootstrapping
– given a set of sequences– sample positions randomly, with replacement– build trees (using distance, ML, or parsimony)– compare trees with consens
• Tree reliability– pathological situations - the �Felsenstein zone�– performance with different methods (Distance, ML,
MP)– performance with different rate models– performance on real data
fasta.bioch.virginia.edu/biol4230 1
Biol4230 Tues, March 13, 2018Bill Pearson [email protected] 4-2818 Pinn 6-057
To learn more:• Pevsner, Ch. 7, pp. 266-269• Hillis, D. M., Allard, M. W., and Miyamoto, M. M. (1993)
Analysis of DNA sequence data: phylogenetic inference. Meth. Enzymol. 224:456-487.
• Hillis, D. M., Heulsenbeck, J. P., and Cunningham, C. W. (1994) Application and accuracy of molecular phylogenies. Science 264:671-677.
• Hillis, D. M., Huelsenbeck, J. P., and Swofford, D. L. (1994) Hobgoblin of phylogenetics. Nature 369:363-364.
• Medina, M., Collins, A. G., Silberman, J. D., and Sogin, M. L. (2001) Evaluating hypotheses of basal animal phylogeny using complete sequences of large and small subunit rRNA.. ProcNatl Acad Sci U S A 98:9707-9712.
fasta.bioch.virginia.edu/biol4230 2

2
Rooting a tree: outgroups and midpoints• Molecular sequence data is "time-reversible"
– A->G or G->A, no way to tell• Trees based on sequence data only are unrooted
• The root of the tree specifies a direction from past to present– Mid-point rooting: put the root between the most
distant taxa– Outgroup rooting: use a known distant homolog to
specify the root (chickens vs mammals; must be orthologs)
fasta.bioch.virginia.edu/biol4230 3
r1
EDCBA
r1
E DC B A
E D C B A
r2
A B C DE
r3
r1
E
DC
B
A
r2
r3
Trees – Rooted and UnRooted
fasta.bioch.virginia.edu/biol4230 4
Unrooted tree
Rooted r1
Rooted r2 Rooted r3
Rooted r1equivalent

3
0.04
GSTM4_RAT
GSTM5_RAT
GSTM1_BOV
GSTM5_H
UMGSTM3_HUM
GSTMU_CRI
GSTM7_MU
S
GSTM2_RAT
GSTM2_
MUS
GSTM1_M
US
GSTM2_HUM
GSTM5_MUS
GSTM1_HU
M GSTM
4_HUM
GSTMU_ME
S
GSTM2_CHK
GSTM6_MUS
GSTM4_MUS GSTM1_RA
T
0.030.04
0.03
0.090.06
0.03
0.05
0.05 0.04
0.02
0.03
0.01
0.05
0 .02
0.02
0 .13
0.07
0.02
0.01
0.07
0
0.04
0.03
0.07
0.02
0
0.01
0 .03
0.03
0.01
0.07
0.3
0.09
0.05
0.03
Trees – Rooted and Un-Rooted
fasta.bioch.virginia.edu/biol4230 5
0.04
GSTM5_MUS
GSTM2_RA
T
GSTM1_MUS
GSTM3_HU
M
GSTM2_MUS
GSTM4_RA
T
GSTM7_MUS
GSTM2_CH
K
GSTM6_MUS
GSTM
U_CR
I
GSTM4_MUS
GSTM1_BO
V
GSTM
U_MES
GSTM2_HU
M
GSTM5_RA
T
GSTM4_HU
M
GSTM1_HU
M
GSTM5_HU
M
GSTM1_RA
T
0.04
0.02
0.07
0.02
0.03
0.01
0.03
0.04
0.09
0.09
00.04
0.02
0.07
0.05
0.03
0.03
0
0.01
0.01
0.03
0.03
0.13
0.03
0.02
0.02
0.26
0.01
0.05
0.05
0.07
0.07
0.03
0.05
0.05
0.06
Midpoint root supports outgroup
Trees – Rooted and UnRooted• Sequence data is reversible – additional data for root
(mid-point implies clock-like tree)• Some data (Alu repeat insertions) is less reversible –
insertions go in and stay
fasta.bioch.virginia.edu/biol4230 6
Hormozdiari, PNAS 2013 110:13457
root

4
Bootstrapping and Tree reliability
Evolutionary tree reliability:• Trees describe events in the past. They cannot
be confirmed for real data– simulations guarantee "correct" answer, but do they
simulate biology?• Tree space is enormous, and tree finding
methods tend to find similar trees– are there "almost as good" trees that are very
different topologically• Do some methods prefer certain kinds of trees?
– long branch attraction
fasta.bioch.virginia.edu/biol4230 7
Building (and evaluating) evolutionary trees
Hillis (1993) Meth. Enz. 224:456-487.fasta.bioch.virginia.edu/biol4230 8

5
Estimating true phylogenies with Bootstraps
Hillis (1993) Syst. Biol. 42:182-192
Bootstraps introduced by Felsenstein (1985) to estimate the "repeatability” (not “accuracy”) of a tree.
fasta.bioch.virginia.edu/biol4230 9
• precision: do bootstrap proportions from N bootstraps represent all bootstraps (not correct phylogeny)
• repeatability: do bootstrap proportions represent what would happen with more (independent) data
• accuracy: does the data (or the bootstraps) induce the correct phylogeny
Hillis (1993) Meth. Enz.224:456-487.
fasta.bioch.virginia.edu/biol4230 10

6
Bootstrapping with PHYLIPwrpmpb 22% seqbootseqboot: can't find input file "infile"Please enter a new file name> gstm.phy_n
Bootstrapping algorithm, version 3.63
Settings for this run:D Sequence, Morph, Rest., Gene Freqs? Molecular sequencesJ Bootstrap, Jackknife, Permute, Rewrite? Bootstrap% Regular or altered sampling fraction? regularB Block size for block-bootstrapping? 1 (regular bootstrap)R How many replicates? 100W Read weights of char acters? NoC Read categories of sites? NoS Write out data sets or just weights? Data setsI Input sequences interleaved? Yes0 Terminal type (IBM PC, ANSI, none)? ANSI1 Print out the data at start of run No2 Print indications of progress of run Yes
Y to accept these or type the letter for one to changeyRandom number seed (must be odd)?12345
Produces 100 randomly sampled datasets for dnadist/fitch, dnapars, dnaml
fasta.bioch.virginia.edu/biol4230 11
Bootstrapping with PHYLIPfranklin: 1 $ fseqboot -help
Standard (Mandatory) qualifiers:[-sequence] seqset (Aligned) sequence set filename and optional
format, or reference (input USA)[-outfile] outfile [*.fseqboot] Phylip seqboot_seq program output file
Additional (Optional) qualifiers (* if not always prompted):-categories properties File of input categories-test menu [b] Choose test (Values: b (Bootstrap); j
(Jackknife); c (Permute species for eachcharacter); o (Permute character order); s(Permute within species); r (Rewrite data))
* -seqtype menu [d] Output format (Values: d (dna); p(protein); r (rna))
* -blocksize integer [1] Block size for bootstraping (Integer 1or more)
• -reps integer [100] How many replicates (Integer 1 or more)
* -seed integer [1] Random number seed between 1 and 32767(must be odd) (Integer from 1 to 32767)
fasta.bioch.virginia.edu/biol4230 12
Produces 100 randomly sampled datasets for dnadist/fitch, dnapars, dnaml
7
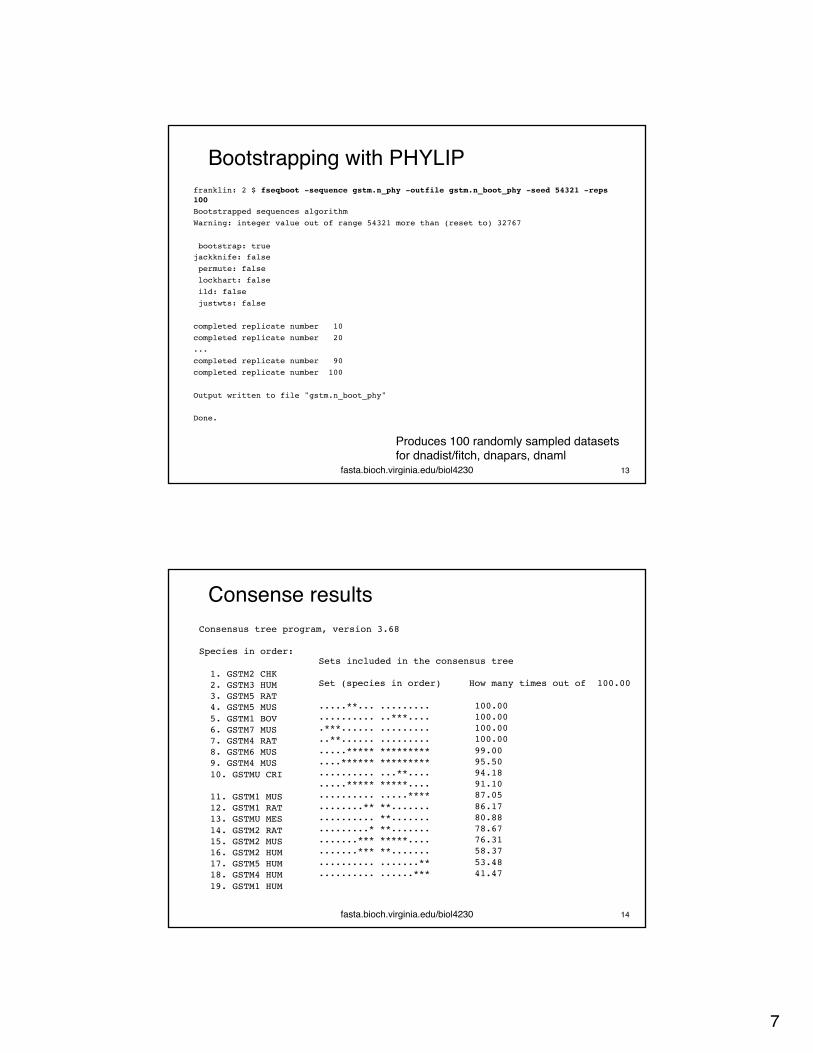
Bootstrapping with PHYLIPfranklin: 2 $ fseqboot -sequence gstm.n_phy -outfile gstm.n_boot_phy -seed 54321 -reps 100
Bootstrapped sequences algorithmWarning: integer value out of range 54321 more than (reset to) 32767
bootstrap: truejackknife: falsepermute: falselockhart: falseild: falsejustwts: false
completed replicate number 10completed replicate number 20...completed replicate number 90completed replicate number 100
Output written to file "gstm.n_boot_phy"
Done.
fasta.bioch.virginia.edu/biol4230 13
Produces 100 randomly sampled datasets for dnadist/fitch, dnapars, dnaml
Consense results
fasta.bioch.virginia.edu/biol4230 14
Consensus tree program, version 3.68
Species in order:
1. GSTM2 CHK2. GSTM3 HUM3. GSTM5 RAT4. GSTM5 MUS5. GSTM1 BOV6. GSTM7 MUS7. GSTM4 RAT8. GSTM6 MUS9. GSTM4 MUS10. GSTMU CRI
11. GSTM1 MUS12. GSTM1 RAT13. GSTMU MES14. GSTM2 RAT15. GSTM2 MUS16. GSTM2 HUM17. GSTM5 HUM18. GSTM4 HUM19. GSTM1 HUM
Sets included in the consensus tree
Set (species in order) How many times out of 100.00
.....**... ......... 100.00
.......... ..***.... 100.00
.***...... ......... 100.00
..**...... ......... 100.00
.....***** ********* 99.00
....****** ********* 95.50
.......... ...**.... 94.18
.....***** *****.... 91.10
.......... .....**** 87.05
........** **....... 86.17
.......... **....... 80.88
.........* **....... 78.67
.......*** *****.... 76.31
.......*** **....... 58.37
.......... .......** 53.48
.......... ......*** 41.47
8
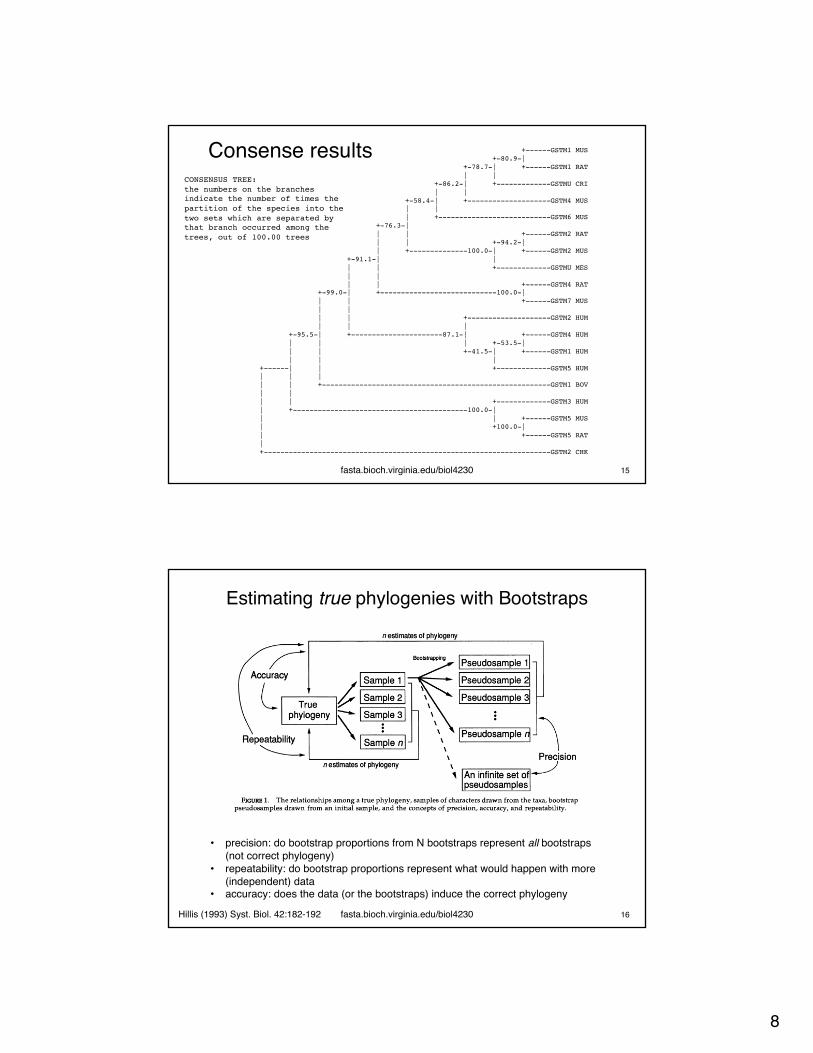
Consense results
fasta.bioch.virginia.edu/biol4230 15
+------GSTM1 MUS+-80.9-|
+-78.7-| +------GSTM1 RAT| |
+-86.2-| +-------------GSTMU CRI| |
+-58.4-| +--------------------GSTM4 MUS| || +---------------------------GSTM6 MUS
+-76.3-|| | +------GSTM2 RAT| | +-94.2-|| +--------------100.0-| +------GSTM2 MUS
+-91.1-| || | +-------------GSTMU MES| || | +------GSTM4 RAT
+-99.0-| +----------------------------100.0-|| | +------GSTM7 MUS| || | +--------------------GSTM2 HUM| | |
+-95.5-| +----------------------87.1-| +------GSTM4 HUM| | | +-53.5-|| | +-41.5-| +------GSTM1 HUM| | |
+------| | +-------------GSTM5 HUM| | || | +-------------------------------------------------------GSTM1 BOV| || | +-------------GSTM3 HUM| +------------------------------------------100.0-|| | +------GSTM5 MUS| +100.0-|| +------GSTM5 RAT|+---------------------------------------------------------------------GSTM2 CHK
CONSENSUS TREE:the numbers on the branches indicate the number of times the partition of the species into the two sets which are separated by that branch occurred among the trees, out of 100.00 trees
Estimating true phylogenies with Bootstraps
Hillis (1993) Syst. Biol. 42:182-192 fasta.bioch.virginia.edu/biol4230 16
• precision: do bootstrap proportions from N bootstraps represent all bootstraps (not correct phylogeny)
• repeatability: do bootstrap proportions represent what would happen with more (independent) data
• accuracy: does the data (or the bootstraps) induce the correct phylogeny

9
Bootstraps estimate repeatability
Hillis (1993) Syst. Biol. 42:182-192
50 characterbootstrap
50 char.sample
50 - 1000 characters
fasta.bioch.virginia.edu/biol4230 17
small change
large change
more correct than bootstrap predicts
small changelarge change
medium change
Bootstrap accuracy on �balanced� (left) and �asymmetric� (right) trees
Hillis (1993) Syst. Biol. 42:182-192fasta.bioch.virginia.edu/biol4230 18
more correct than bootstrap predicts similar accuracy

10
Application and Accuracy of Molecular PhylogeniesHillis, Huelsenbeck, and Cunningham (1994) Science 264-671
• Accuracy of phylogenetic methods can be assessed with numerical simulations or �observed evolution�
• Approaches are complementary - simulations more general, but include simplifications (independence, substitutions equally probable)
• Measures of accuracy - consistency (converge with more data), accuracy
• What is the appropriate level of complexity? 4 taxa? (exhaustive seach possible) 100 taxa? (heuristic search only)
fasta.bioch.virginia.edu/biol4230 19
Long Branch attraction:The �Felsenstein zone�
fasta.bioch.virginia.edu/biol4230 20
11
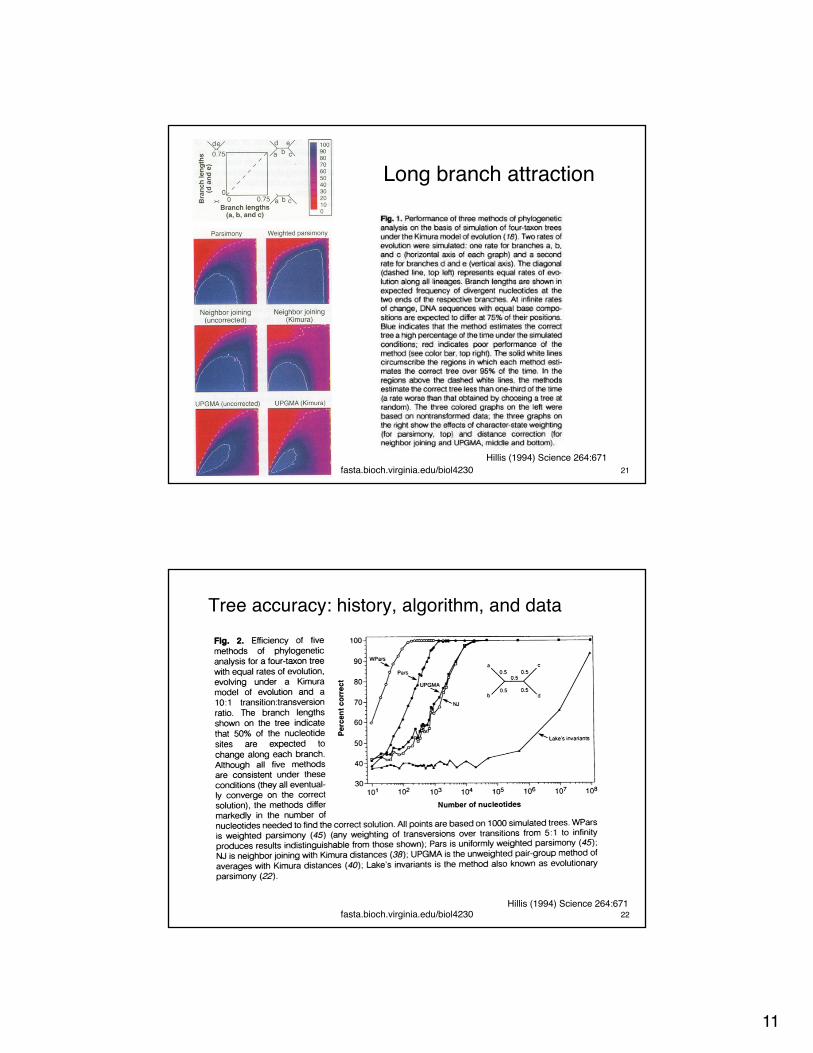
Long branch attraction
Hillis (1994) Science 264:671fasta.bioch.virginia.edu/biol4230 21
Tree accuracy: history, algorithm, and data
fasta.bioch.virginia.edu/biol4230 22Hillis (1994) Science 264:671
12
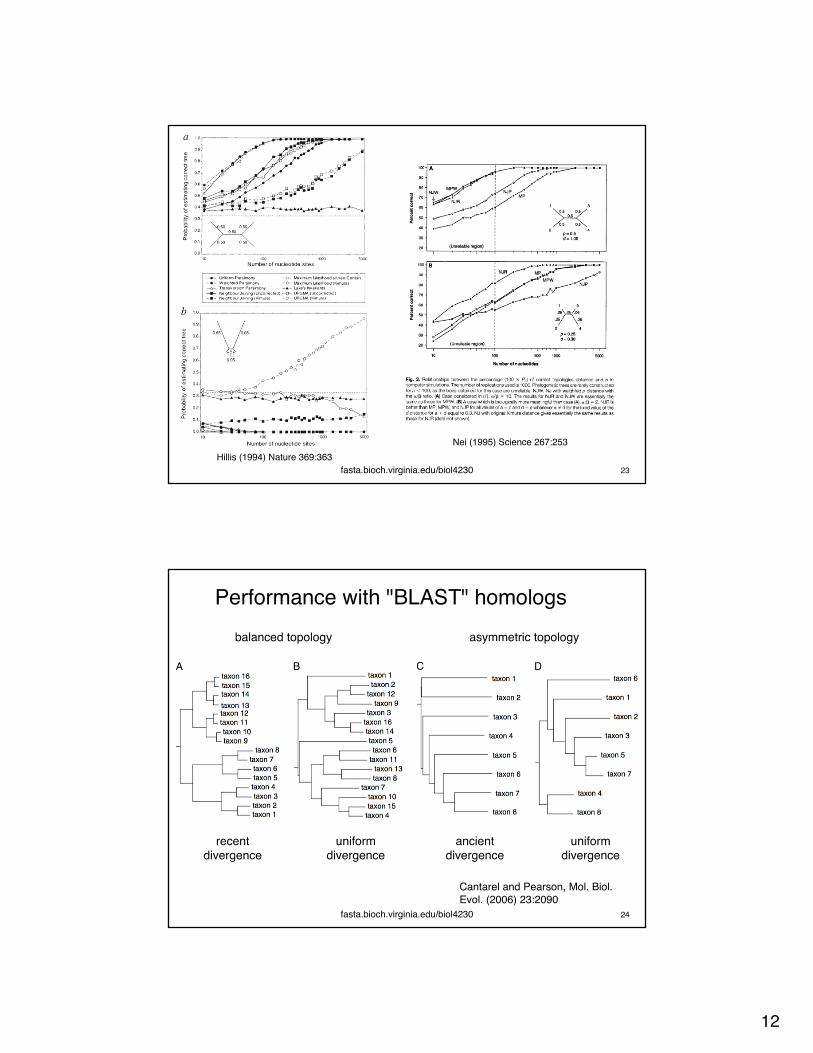
Nei (1995) Science 267:253
fasta.bioch.virginia.edu/biol4230 23Hillis (1994) Nature 369:363
Performance with "BLAST" homologs
fasta.bioch.virginia.edu/biol4230 24
Cantarel and Pearson, Mol. Biol. Evol. (2006) 23:2090
recentdivergence
ancientdivergence
uniformdivergence
balanced topology asymmetric topology
uniformdivergence

13
Protein families at different distances
fasta.bioch.virginia.edu/biol4230 25
Cantarel and Pearson, Mol. Biol. Evol. (2006) 23:2090
Tree accuracy with different methods
fasta.bioch.virginia.edu/biol4230 26
Cantarel and Pearson, Mol. Biol. Evol. (2006) 23:2090
recent
uniformancient
14
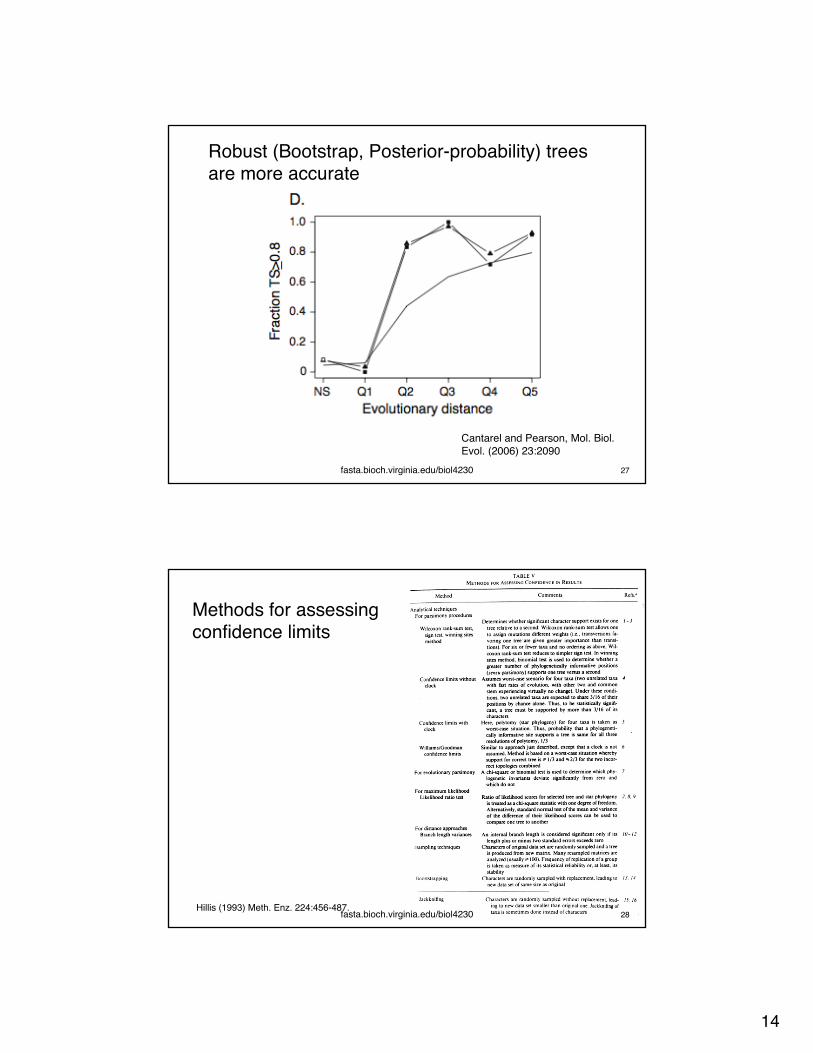
Robust (Bootstrap, Posterior-probability) trees are more accurate
fasta.bioch.virginia.edu/biol4230 27
Cantarel and Pearson, Mol. Biol. Evol. (2006) 23:2090
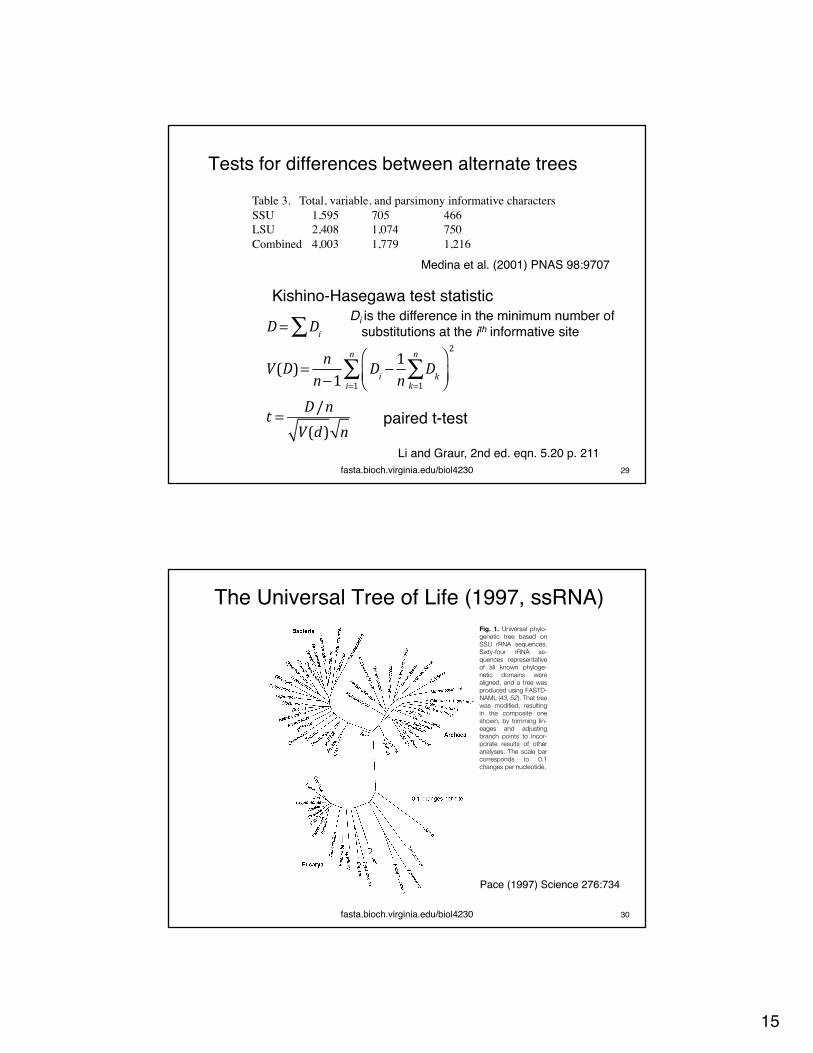
Methods for assessing confidence limits
Hillis (1993) Meth. Enz. 224:456-487.fasta.bioch.virginia.edu/biol4230 28
15
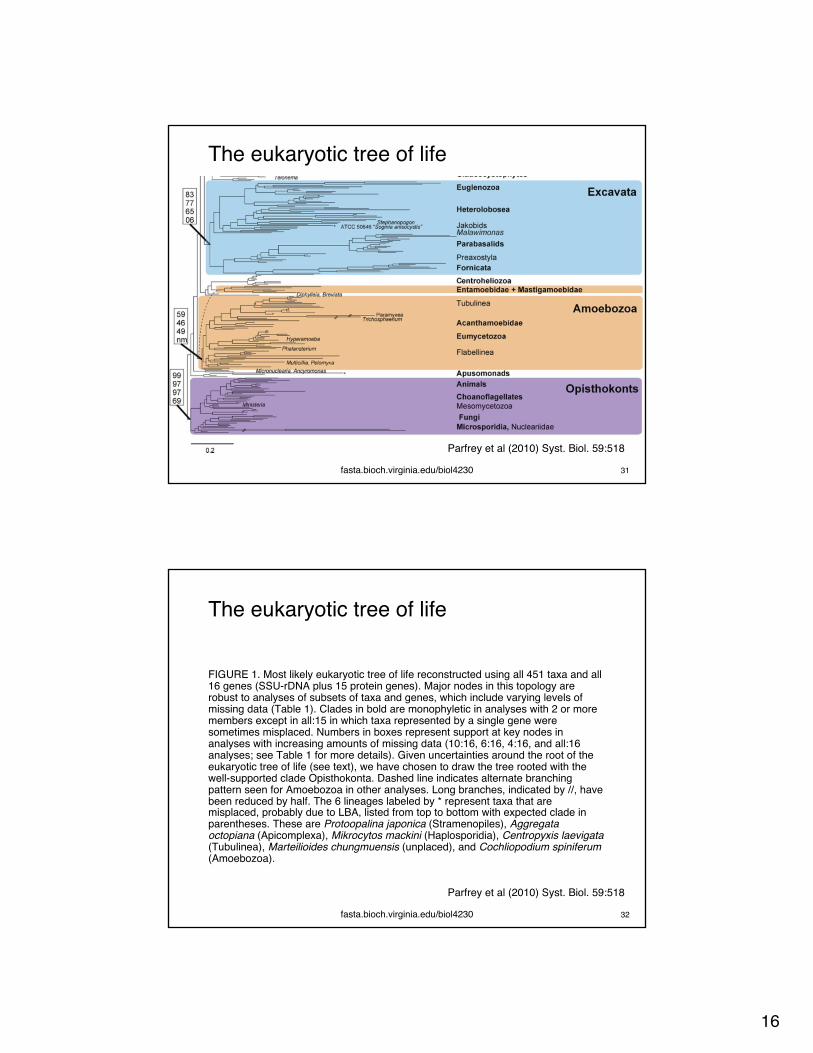
Table 3. Total, variable, and parsimony informative charactersSSU 1,595 705 466LSU 2,408 1,074 750Combined 4,003 1,779 1,216
Medina et al. (2001) PNAS 98:9707
!!
D= Di∑
V(D)= nn−1 D
i− 1n
Dk
k=1
n
∑⎛⎝⎜
⎞⎠⎟i=1
n
∑2
t = D/nV(d) n
Kishino-Hasegawa test statistic
Li and Graur, 2nd ed. eqn. 5.20 p. 211
Di is the difference in the minimum number of substitutions at the ith informative site
Tests for differences between alternate trees
fasta.bioch.virginia.edu/biol4230 29
paired t-test
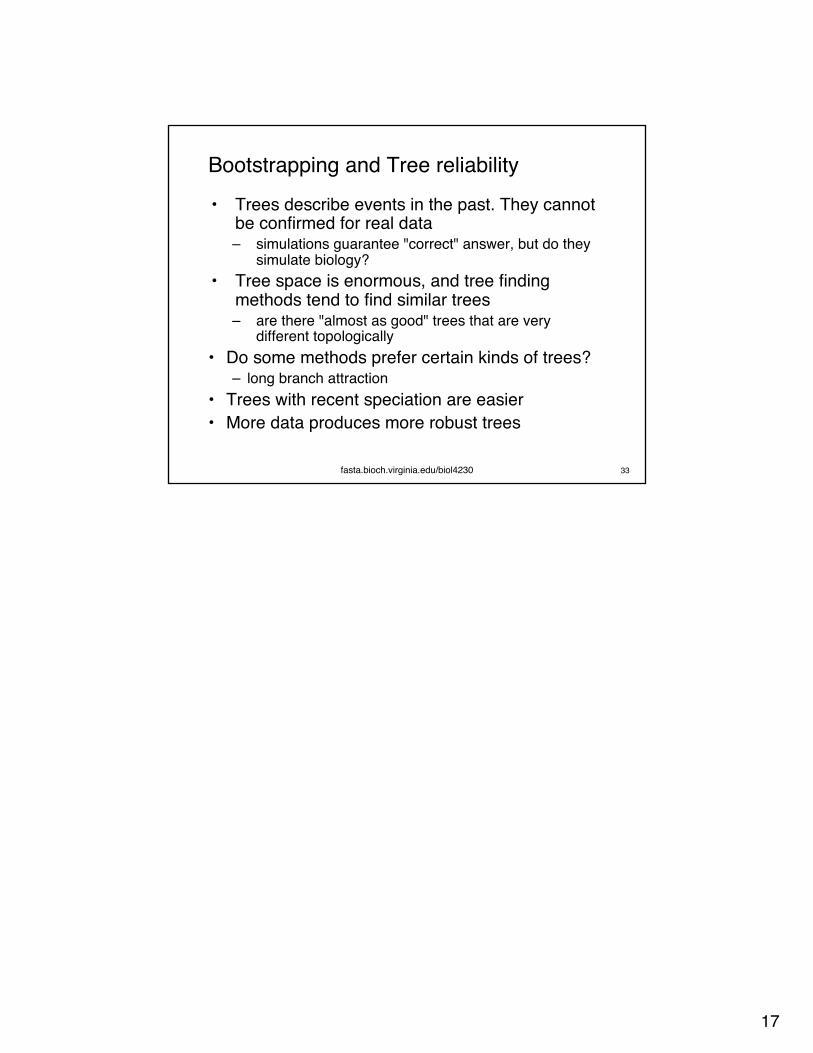
The Universal Tree of Life (1997, ssRNA)
fasta.bioch.virginia.edu/biol4230 30
The tree can be considered a rough map ofthe evolution of the genetic core of thecellular lineages that led to the modernorganisms (sequences) included in the tree.The time of occurrence of evolutionaryevents cannot be extracted reliably fromphylogenetic trees, despite common at-tempts to do so. Time cannot be accuratelycorrelated with sequence change becausethe evolutionary clock is not constant indifferent lineages (7). This disparity is evi-denced in Fig. 1 by the fact that linesleading to the different reference organismsare not all the same length; these differentlineages have experienced different extentsof sequence change. Nonetheless, the orderof occurrence of branchings in the trees canbe interpreted as a genealogy, and intrigu-ing insights into the evolution of cells areemerging.
A sobering aspect of large-scale phyloge-netic trees such as that shown in Fig. 1 isthe graphical realization that most of ourlegacy in biological science, historicallybased on large organisms, has focused on anarrow slice of biological diversity. Thus,we see that animals (represented in Fig. 1 byHomo), plants (Zea), and fungi (Coprinus)constitute small and peripheral branches ofeven eukaryotic cellular diversity. If theanimals, plants, and fungi are taken to com-prise taxonomic “kingdoms,” then we mustrecognize as kingdoms at least a dozen othereucaryotic groups, all microbial, with asmuch or more independent evolutionaryhistory than that which separates the threetraditional eukaryotic kingdoms (13).
The rRNA and other molecular datasolidly confirm the notion stemming fromthe last century that the major organelles ofeukaryotes—mitochondria and chloro-plasts—are derived from bacterial symbi-onts that have undergone specializationthrough coevolution with the host cell. Se-quence comparisons establish mitochondriaas representatives of Proteobacteria (thegroup in Fig. 1 including Escherichia andAgrobacterium) and chloroplasts as derivedfrom cyanobacteria (Synechococcus andGloeobacter in Fig. 1) (14). Thus, all respi-ratory and photosynthetic capacity of eu-karyotic cells was obtained from bacterialsymbionts; the “endosymbiont hypothesis”for the origin of organelles is no longerhypothesis but well-grounded fact. The nu-clear component of the modern eukaryoticcell did not derive from one of the pro-karoytic lineages, however. The rRNA andother molecular trees show that the eukary-otic nuclear line of descent extends as deep-ly into the history of life as do the bacterialand archaeal lineages. The mitochondrionand chloroplast came in relatively late. Thislate evolution is evidenced by the fact thatmitochondria and chloroplasts diverged
from free-living organisms that branch pe-ripherally in molecular trees. Moreover, themost deeply divergent eukaryotes even lackmitochondria (15). These latter organisms,little studied but sometimes troublesomecreatures such as Giardia, Trichomonas, andVairimorpha, nonetheless contain at least afew bacterial-type genes (16). These genesmay be evidence of an earlier mitochondrialsymbiosis with Eucarya that was lost (11) orperhaps other symbiotic or gene-transferevents between the evolutionary domains.
The root of the universal tree in Fig. 1,the point of origin of the modern lineages,cannot be established using sequences ofonly one type of molecule. However, recentphylogenetic studies of gene families thatoriginated before the last common ancestorof the three domains have positioned theroot of the universal tree deep on the bacte-rial line (10). Therefore, Eucarya and Ar-chaea had a common history that excludedthe descendants of the bacterial line. Thisperiod of evolutionary history shared byEucarya and Archaea was an important timein the evolution of cells, during which therefinement of the primordial information-processing mechanisms occurred. Thus,modern representatives of Eucarya and Ar-chaea share many properties that differ frombacterial cells in fundamental ways. One ex-
ample of similarities and differences is in thenature of the transcription machinery. TheRNA polymerases of Eucarya and Archaearesemble each other in subunit compositionand sequence far more than either resemblesthe bacterial type of polymerase. Moreover,whereas all bacterial cells use sigma factors toregulate the initiation of transcription, euca-ryal and archaeal cells use TATA-bindingproteins (17, 18).
Because of the shared history of Eucaryaand Archaea, we should, perhaps, look tothe Archaea to identify fundamental prop-erties of far more complex cells such as ourown. The eukaryotic nuclear membrane, forinstance, is considered by cell biologists tobe an intrinsic component of the nucleus,somehow responsible for its integrity. Thefact that Archaea remained “prokaryotic,”that is, did not develop a nuclear mem-brane, indicates that a membrane is notrequired for nuclear function, which Ar-chaea certainly achieve (as do Bacteria, forthat matter). Indeed, the archaeal nuclearzone even seems to exclude ribosomes (19),and the genome of M. jannaschii is sprinkledwith homologs of eucaryal nuclear and nu-cleolar structural genes (12). What consti-tutes a “nucleus?” Certainly the acquisitionof the nuclear membrane was a relativelylate event in the establishment of the eu-
Fig. 1. Universal phylo-genetic tree based onSSU rRNA sequences.Sixty-four rRNA se-quences representativeof all known phyloge-netic domains werealigned, and a tree wasproduced using FASTD-NAML (43, 52). That treewas modified, resultingin the composite oneshown, by trimming lin-eages and adjustingbranch points to incor-porate results of otheranalyses. The scale barcorresponds to 0.1changes per nucleotide.
ARTICLES
www.sciencemag.org z SCIENCE z VOL. 276 z 2 MAY 1997 735
on March 13, 2018
http://science.sciencem
ag.org/D
ownloaded from
Pace (1997) Science 276:734
16
The eukaryotic tree of life
fasta.bioch.virginia.edu/biol4230 31
Parfrey et al (2010) Syst. Biol. 59:518
The eukaryotic tree of life
FIGURE 1. Most likely eukaryotic tree of life reconstructed using all 451 taxa and all 16 genes (SSU-rDNA plus 15 protein genes). Major nodes in this topology are robust to analyses of subsets of taxa and genes, which include varying levels of missing data (Table 1). Clades in bold are monophyletic in analyses with 2 or more members except in all:15 in which taxa represented by a single gene were sometimes misplaced. Numbers in boxes represent support at key nodes in analyses with increasing amounts of missing data (10:16, 6:16, 4:16, and all:16 analyses; see Table 1 for more details). Given uncertainties around the root of the eukaryotic tree of life (see text), we have chosen to draw the tree rooted with the well-supported clade Opisthokonta. Dashed line indicates alternate branching pattern seen for Amoebozoa in other analyses. Long branches, indicated by //, have been reduced by half. The 6 lineages labeled by * represent taxa that are misplaced, probably due to LBA, listed from top to bottom with expected clade in parentheses. These are Protoopalina japonica (Stramenopiles), Aggregataoctopiana (Apicomplexa), Mikrocytos mackini (Haplosporidia), Centropyxis laevigata(Tubulinea), Marteilioides chungmuensis (unplaced), and Cochliopodium spiniferum(Amoebozoa).
fasta.bioch.virginia.edu/biol4230 32
Parfrey et al (2010) Syst. Biol. 59:518
17
Bootstrapping and Tree reliability• Trees describe events in the past. They cannot
be confirmed for real data– simulations guarantee "correct" answer, but do they
simulate biology?• Tree space is enormous, and tree finding
methods tend to find similar trees– are there "almost as good" trees that are very
different topologically• Do some methods prefer certain kinds of trees?
– long branch attraction• Trees with recent speciation are easier• More data produces more robust trees
fasta.bioch.virginia.edu/biol4230 33