boral limited level 3, 40 north sydney nsw 2060 po box ... · 5. based on various indicators of...
TRANSCRIPT

13 February 2018 The Manager, Listings Australian Securities Exchange ASX Market Announcements Level 14, Exchange Centre 20 Bridge Street Sydney NSW 2000
Dear Sir Results for half year ended 31 December 2017 – Investor Presentation We attach a copy of the investor presentation in respect of Boral’s half year results. This presentation will be webcast on Boral’s website at www.boral.com.au from 11.00am (Sydney time) today.
The information contained in this announcement should be read in conjunction with today’s announcement of Boral’s half year results and Boral’s most recent annual financial report. Yours faithfully
Dominic Millgate Company Secretary
Boral Limited Level 3, 40 Mount Street North Sydney NSW 2060 PO Box 1228 North Sydney NSW 2059
T: +61 (02) 9220 6300 F: +61 (02) 9233 6605
www.boral.com.au
Boral Limited ABN 13 008 421 761
For
per
sona
l use
onl
y

RESULTSFor the half year to 31 December 2017
13 February 2018
Delivering significant earnings growth and transformation
Contents
2
1H FY2018 Results Presentation
Results Overview 4
Financial Results 17
Strategic Priorities & Outlook 23
Supplementary Information
Corporate Profile 30
Headwaters & Meridian Brick update 41
Market Data 46
Market Forecasts 55
Financial Data 63
For
per
sona
l use
onl
y

Agenda
• Results Overview Mike Kane
• Financial Results Ros Ng
• Strategic Priorities & Outlook Mike Kane
3
USG Boral acoustical ceiling tiles and metal grid being installed in a commercial building in Melbourne, Victoria
Boral today: Performance, transformation & growth
4
1. Delivering strong results in Australia and maintaining leading positions• Key supplier to Australia’s booming infrastructure and strong residential and non-residential construction markets, with
leading capabilities and operations• Maintaining valuable quarry resource positions and downstream concrete and asphalt networks through reinvestments• Strengthening margins through innovation and operational, customer and commercial excellence programs
2. Earnings growth and innovation-based competitive advantage in USG Boral• Organic and innovation-based growth in plasterboard markets in Asia, Australia and the Middle East, including Sheetrock®
products, technical board and non-board• Positioned well to respond to changes in demand cycles and competitive pressures
3. Transformational growth in North America• Headwaters acquisition is delivering transformational growth and substantial synergies• Further growth through market recovery and innovation• Addressing short-term operational issues in some businesses• Benefits from US corporate tax rate cuts
4. Solid balance sheet and growing shareholder returns• At 31-Dec-2017, gearing (net debt / net debt + equity) of 30%• 17% growth in EPSA1
1. Refer to pages 68-69 for reconciliation and explanation; 1H FY2018 on prior corresponding period
For
per
sona
l use
onl
y

Half year results highlightsDelivering significant earnings growth and transformation
5
1. Excluding significant items2. Refer to pages 68-69 for reconciliation and explanation of these items
1H FY2018 vs 1H FY2017
A$m A$m cents
EBITDA1,2 NPATA1,2 EPSA1,2
$500m 50% $237m 58% 20.2c 17%
EBITA1,2 NPAT1,2 EPS1,2
$350m 66% $214m 44% 18.2c 6%
EBIT1,2 Statutory NPAT2 Half year dividend
$316m 50% $173m 13% 12.5c from 12.0
1.9 1.9 1.8 1.3 1.5 1.5 1.1
15.5
11.710.3
7.5 6.6 6.9 7.2
FY13 FY14 FY15 FY16 FY17 1H FY17 1H FY18
Safety performanceCompany-wide commitment to Zero Harm Today
• Record low LTIFR of 1.1, down from 1.5• MTIFR increased to 7.2 from 6.9,
reflecting new businesses2
- Base businesses MTIFR improved 4% to 6.6
• RIFR of 8.3 broadly steady- Base businesses RIFR improved 7% to 7.8
• Improving performance in Headwaters businesses since completing acquisition
• Determined to learn from two tragic incidents in late 2017
6
Employee and Contractor RIFR1(per million hours worked)
LTIFRMTIFRRIFR
17.4
13.612.1
8.88.1
1. Recordable Injury Frequency Rate (RIFR) per million hours worked is made up of Lost Time Injury Frequency Rate (LTIFR) and Medical Treatment Injury Rate (MTIFR)
2. Includes employees and contractors in all businesses, including Headwaters and all joint venture operations regardless of equity interest
8.4 8.3
Does not include Headwaters. Includes employees and contractors in 100%-owned businesses and 50%-owned joint venture operations only
2
For
per
sona
l use
onl
y

333
500
30
144
(2)
(5)
Discontinued Operations
Significant increase in earnings Driven by Headwaters acquisition and Boral Australia
Boral North America3
1H FY2017 EBITDA1
1H FY2018 EBITDA1
EBITDA1 variance, A$m
1H FY2018 vs 1H FY2017
USG Boral2
1. Excluding significant items2. Represents Boral’s 50% post-tax equity accounted income from the USG Boral JV3. Earnings from combined Boral USA and Headwaters businesses and Boral’s 50% post-tax equity accounted income from Meridian Brick JV formed on 1 November 2016 7
Boral Australia
Australia Asia & Middle East5 USA
RHS&B2 Korea Total housing starts6 1%Non-residential3 11% Thailand - Single 9%
Total housing starts4 6% China - Multi 15%- Detached 4% Indonesia Repair & Remodel7 10%- Multi 8% Other emerging markets Non-residential8 4%
Alterations & additions3 3% Infrastructure9 3%
Strong activity in our key marketsIncreased exposure to growing US markets post Headwaters acquisition
1. Based on 1H FY2018 external revenue. USG Boral represents underlying revenue split. Boral North America revenue includes Boral‘s 50% share of revenue from Meridian Brick JV which is not included in reported revenue
2. Roads, highways, subdivisions and bridges. Value of work done (VWD) is forecast to increase 17% in FY2018f based on an average of Macromonitor and BIS Oxford Economics forecasts
3. VWD from ABS in 2015/16 constant prices; December 2017 quarter based on average of Macromonitor and BIS Oxford Economics forecasts
4. ABS original housing starts; December 2017 quarter based on average of HIA, Macromonitor and BIS Oxford Economics forecasts 8
5. Based on various indicators of building and construction activity in key markets in Boral‘s respective countries of operation. For China this is defined as the high-end market in regions in which USG Boral operates. Other emerging markets include Vietnam, India and the Philippines
6. US Census Bureau seasonally adjusted housing starts7. Moody‘s Retail Sales of Building Products, January 20188. Dodge Data & Analytics, Non-residential square foot area, November 2017; forecast for Dec-17Q9. McGraw Hill Dodge, Infrastructure Ready Mix Demand, November 2017; forecast for Dec-17Q
USG Boral joint venture, %
36
24 12
6 11
11 AustraliaSouth KoreaThailandIndonesiaChinaOther
35
816
16
11
12 2 RHS&B2
Other engineeringNon-residentialDetached dwellingMulti-dwellingAlterations & additionsOther
Boral Australia, %
Mar
ket a
ctiv
ity:
1H F
Y20
18e
vs 1
H F
Y20
17R
even
ue1
by
end-
mar
ket,
%
38
820
15
19
Repair & Remodel
Single-familyMulti-family
Non-residentialInfrastructure
Boral North America, %
For
per
sona
l use
onl
y

Boral AustraliaStrong result underpinned by growing infrastructure & non-residential activity
• EBITDA (excluding Property) up 15%, driven by growth in construction materials businesses, particularly NSW and Qld
• Accelerating infrastructure work, strong non-residential demand and only modest softening in residential demand
• Higher average selling prices across all businesses, except WA• Benefiting from favourable weather on east coast in Q1
1. Excluding significant items2. Moving annual total EBIT return on divisional funds employed 3. Includes inflationary, operational, production and SG&A cost increases4. Other: includes restructuring costs
A$m 1H FY2018
1H FY2017 Var, %
Revenue 1,804 1,616 12
EBITDA1 294 264 12
EBITDA ROS1, % 16.3 16.3
Property 0 9
EBITDA1 excl Property 294 255 15
EBITDA excl Prop ROS1, %. 16.3 15.9
EBIT1 194 164 18
EBIT ROS1, % 10.8 10.2
Net Assets 2,450 2,401 2
ROFE1,2, % 15.4 12.9
9
Revenue
$1.8b 12%
EBITDA1
$294m 12%
264294
EBIT
DA1
varia
nce,
A$m
Vol
ume
Pric
e
Oth
er4
Cos
tin
crea
ses3
Cos
t re
duct
ion
Pro
perty
1H FY17 EBITDA1
1H FY18EBITDA1
USG BoralSolid revenue growth offset by higher input costs, one-off costs & price pressures
• Revenue underpinned by continued growth in Sheetrock® & technical board, pricing gains and higher non-board revenue
• EBITDA impacted by higher input costs, $8m in one-off costs and competitive pricing pressures in Thailand, Indonesia and Vietnam; excluding one-offs, EBITDA up 5%
• Strong Australia contribution with earnings steady excluding one-off costs
• Significant earnings growth in Korea and China with softer earnings from Thailand, Indonesia and Vietnam
1. Post-tax equity income from Boral‘s 50% share of USG Boral JV2. Excluding significant items3. Moving annual total EBIT return on divisional funds employed 4. Includes inflationary, operational, production and SG&A cost increases5. Other includes $8m in one-off costs and foreign exchange impacts 10
A$m 1H FY2018 1H FY2017 Var, %Reported resultEquity income1,2 38 40 (4)
Underlying resultRevenue 815 735 11
EBITDA2 149 151 (1)
EBITDA ROS2, % 18.3 20.5
EBIT2 113 117 (3)
EBITDA ROS2, % 13.9 15.9
Net Assets 1,921 1,902 –
ROFE2,3, % 11.1 10.7
Underlying EBITDA2
$149m 1%
Underlying Revenue
$815m 11%
151 149
1H FY17 EBITDA2
1H FY18EBITDA2
Und
erly
ing
EBIT
DA2
varia
nce,
A$m
Vol
ume
Pric
e
Oth
er5
Cos
tin
crea
ses4
Cos
t re
duct
ion
For
per
sona
l use
onl
y

• Substantial lift in revenue to US$884m and EBITDA to US$144m
• Synergies of US$18m achieved; on track to exceed US$35m synergies in FY2018
Compared to 1H FY2017 proforma
• EBITDA growth tempered by severe weather events, plant operational issues & commissioning costs, and lower Meridian Brick earnings
• Construction Materials: Improved result largely driven by higher Fly Ash revenue and earnings
• Building Products: modest earnings growth with revenue lift of 13%, largely offset by US$4m weather impact and US$7m in plant operational issues
• Meridian Brick JV: higher operating costs and lower volumes due to declining brick intensity and smaller rationalised network
Boral North AmericaSubstantial earnings lift through acquisition
A$m 1H FY2018 1H FY2017 1H FY2017 proforma3
Revenue 1,133 477 1,208
EBITDA1 184 41 185
EBITA1 135 19 130
EBIT1 101 18 113
Net Assets 4,428 949
US$mRevenue 884 357 904
EBITDA1 144 30 139
EBITDA ROS1, % 16.3 8.5 15.3
EBITA1 105 15 98
EBITA ROS1, % 11.9 4.1 10.8
EBIT1 79 14 85
ROFE1,2, % 4.6 5.711
1. Excluding significant items2. Moving annual total EBIT on average monthly divisional funds employed (segment assets
less segment liabilities)3. Proforma consolidated Boral and Headwaters businesses for the six months to December
2016, with Headwaters on a comparable basis to previously reported results
EBITDA1
A$184m
Revenue
A$1.1b
Boral North AmericaUS$10m impact from major weather events in 1H FY2018
12
Hurricane Harvey, Aug 2017• Plants impacted: Katy (Roofing),
Alleyton (Block) & Elgin plants, and Houston distribution site (Meridian Brick)
• Sales impacted in Block, Roofing & Fly Ash
• Higher transport costs for Meridian Brick & Windows
• Increased input costs for LBP • Fly Ash availability and
transportation impacted
Hurricane Irma, Sep 2017• Electricity availability impacted
in FL, GA, AL, SC, NC & TN • Roof tile plants in FL all
impacted, including Okeechobee and Lake Wales
• Fly Ash availability impacted
1. Based on Boral North America 1H FY2018 external revenue, including Boral‘s 50% share of Meridian Brick JV revenue which is not included in reported revenue2. Southeast – AL, FL, GA, KY, MS, NC, SC, TN, VA, WV; Southwest – AR, LA, OK, TX; West – AK, AZ, CA, CO, HI, ID, MT, NM, NV, OR, UT, WA, WY; Midwest – IA, IL, IN, KS, MI, MN, MO, ND, NE,
OH, SD, WI; Northeast - CT, DC, DE, MA, MD, ME, NH, NJ, NY, PA, RI, VT
Southwest
West
Northeast
Midwest
SoutheastCalifornia wildfires, Oct 2017Napa stone plant disrupted Building projects in area delayed
Boral North America geographic exposure1,2, %
SoutheastSouthwestWestMidwestNortheastInternational
26
2522
16
8 3
For
per
sona
l use
onl
y

139144
109
9
918
10
75
64
Boral North AmericaEarnings growth impacted by weather, operational issues and costs
13
1. Excluding significant items2. Proforma consolidated Boral and Headwaters businesses for the six months to 31 December 2016, with Headwaters on a comparable basis to previously reported results3. Impact of Hurricanes Harvey and Irma, and California wildfires4. Includes impact of weather events5. Costs & other includes: US$6m benefit from aligning accounting policy between Boral and Headwaters in relation to Stone molds, US$4m Purchase Price Accounting adjustment reflecting the
expensing of fair value inventory uplift, and other cost increases
1H FY17 EBITDA1
Boral legacy Vol
ume
Pric
e 1H FY18EBITDA1
Pla
nt o
pera
tiona
l is
sues
EBITDA1 variance, US$m
1H FY2018 vs 1H FY2017 proforma2
1H FY17PF EBITDA1,2
Wea
ther
im
pact
s3
Mer
idia
n Br
ick
JV4
1H FY17 EBITDA1
Headwaters reported Sy
nerg
ies
Fly
Ash
m
argi
n
Includes:- Plant commissioning costs: Lake Wales Roofing,
Greencastle Stone, Kleer LBP- Integration of businesses acquired by Headwaters:
Entegra Roofing (FL), Oceanside metal roofing (CA) and Magnolia Windows
- Safety interventions: Stonecraft30
Includes $5m benefit from Fly Ash
Includes margin impact of supply constraints associated with
intermittent closure of power plants and contract renewals
Includes $4m benefit from Fly Ash
Cos
ts &
oth
er5
14
Boral North AmericaOverall, integration of Headwaters acquisition has progressed well
Exceeded expectation: Challenges & responses:
Cultural alignment and support from employees and customers in both organisations
Synergy opportunities – confidence in exceeding US$35m in year 1 and US$100m within 4 years
Fly Ash – attractive medium- and longer-term opportunities around storage and landfill reclamation
Light Building Products – better performance and growth opportunities
Block and Windows – offering attractive opportunities
• Safety performance and equipment – requiring increased management time and ~US$10m of capital
• Operational and integration issues in Roofing &Stone requiring strengthened leadership and a focused improvement program
• Some share loss in Stone, which has been included as a ‘dis-synergy’ in the US$18m of 1H FY2018synergies
• Clubhouse Decking, Enviroshake® roofing (in Canada) and the Energy business, all small underperforming businesses which have been divested
• Integration of Magnolia Windows into Krestmark Windows requiring strengthened leadership and afocused improvement program
For
per
sona
l use
onl
y

1. Synergies include cost synergies and estimated cross-selling and distribution revenue synergies, and exclude one-off integration costs estimated at US$90 - US$100m over FY2018 & FY20192. Includes Block and Windows
Year 4 targeted synergies1
Year 4Year 4
>US$100m per annum within four years
Procurement
Operations
SG&A
Cross-Selling& Distribution
Corporate
Roofing
Light Building Products
Fly Ash
Stone
15
1H FY2018 synergies by business1
US$m
Boral North AmericaWell on track to exceed targeted Year 1 synergies
18.06.94.1
2.64.0 1.8
(1.4)
Includes share loss
Corporate Fly Ash Stone Roofing LBP Other2 1H FY2018 reported
>US$50-55m target
FY2018 target
End FY2018 run rate
Expect to exceed
US$35m
1HFY2017
1HFY2018
5.7 4.6
1HFY2017
1HFY2018
10.7 11.1
Positioned to improve ROFEBoral Australia and USG Boral exceeding the cost of capital
Divisional EBIT return on funds employed (ROFE), %
1. EBIT (excluding significant items) return on funds employed (divisional funds employed is segment assets less segment liabilities). ROFE calculated on a moving annual total basis as at 31 December. 2. Based on USG Boral’s underlying moving annual total EBIT (excluding significant items) on funds employed at 31 December3. ROFE for 1H FY2018 calculated as moving annual total EBIT (excluding significant items) on average monthly funds employed for the 12 months to December to better reflect the impact of the
Headwaters acquisition
1HFY2017
1HFY2018
12.9 15.4
Group ROFE1,3, %
Boral Australia1 BoralNorth America1,3
4.14.7
7.28.2
9.0 9.2 9.28.5
FY2012 FY2013 FY2014 FY2015 FY2016 FY2017 1HFY2017
1HFY2018
USG Boral2
16
For
per
sona
l use
onl
y

Financial ResultsRos Ng – Chief Financial Officer
Boral’s concrete block plant at Alleyton, TexasENVISIA® Concrete used in the unique 99-domed ceiling
of Punchbowl Mosque in Sydney, NSW, Australia
Group financial performanceFull period contribution from Headwaters and growth in Boral Australia
A$m 1H FY2018 1H FY2017 Var %Revenue 2,937 2,093 40EBITDA1,2 500 333 50Depreciation and amortisation2 (150) (122) 23EBITA1,2 350 211 66Amortisation of acquired intangibles (34) (1)EBIT1,2 316 211 50Net interest (50) (27) 84Tax1 (52) (35) 51Net profit after tax1,2 214 149 44Significant items (net) (41) 4Statutory net profit after tax 173 153 13Net profit after tax and before amortisation1,2 237 149 58Effective tax rate 20% 19%
Non-IFRS Information: Earnings before significant items is a non-IFRS measure that is reported to provide a greater understanding of underlying business performance of the Group. Further details of non-IFRS information is included in the Results Announcement while details of significant items are provided in Note 6 of the Half Year Financial Report. Non-IFRS information has not been subject to audit or review.1. Excluding significant items2. Refer to pages 68-69 for reconciliation and explanation of these items (Figures may not add due to rounding) 18
For
per
sona
l use
onl
y

Significant itemsNet expense of $41m from integration costs and site rehabilitation provision
Non-IFRS Information: Management has provided an analysis of significant items reported during the period. These items have been considered in relation to their size and nature and have been adjusted from the reported information to assist users to better understand the performance of the underlying businesses. These items are detailed in Note 6 of the Half Year Financial Report and relate to amounts that are associated with significant business restructuring and integration, business acquisition or disposals, impairment or individual transactions.
(Figures may not add due to rounding)
1. Costs primarily relating to redundancies, employee incentives implemented by Headwaters, consultant fees supporting integration, integration of IT systems, brand consolidation, and asset impairments in concrete roofing business
2. Recognition of provision for rehabilitation of limestone quarry attached to Waurn Ponds cement facility in Victoria
3. Includes a $6m impact from adjustments to deferred tax assets (including US tax losses and timing differences), offset by a $6m benefit from recognition of previously unrecognised tax losses, resulting in no net impact on profit
A$m 1H FY2018 Notes
Headwaters integration costs (32) 1
Waurn Ponds rehabilitation and closure costs (24) 2
Expense before interest and tax (56)
Reassessment of US tax balances - 3
Tax benefit 15
Significant items (net) (41)
19
Cash flowStrong operating cash flow
1. Excluding significant items2. Institutional equity placement and retail entitlement offer completed December 2016
(Figures may not add due to rounding)
• Operating cash flow up 37% to $216m due to:- significant lift in earnings from Boral North
America and Boral Australia- partially offset by higher restructuring and
integration costs and higher interest and tax payments
• Free cash flow lower due to:- capital expenditure up 14% to $164m - lower proceeds on sales of assets
Cash flow, A$m 1H FY2018 1H FY2017EBITDA1 500 333Change in working capital (67) (93)Fly ash contract investments (2) (6)Share acquisition rights vested (22) (4)Interest and tax (99) (53)Equity earnings less dividends (12) (7)Restructuring, acquisition and integration costs paid (82) (12)
Operating cash flow 216 158Capital expenditure (164) (144)Investments - (9)Cash acquiredProceeds on disposal of assets 18 145Free cash flow 71 151Capital raisings2 - 2,018Dividends paid (141) (86)
Other items (6) 3
Cash flow (76) 2,08620
For
per
sona
l use
onl
y

126
203 211
281 288
124 149
18365 39
43 52
2015
307261
249247
260
122150
FY13 FY14 FY15 FY16 FY17 1H FY17 1H FY18
Capital expenditureDisciplined approach to capital management
• Total capex up 14% to $164m, driven by increased stay in business capex
• Capital spend included:- Quarry upgrades at Deer Park (Vic), Orange Grove
(WA) and Ormeau (Qld)- New concrete plant at Redbank Plains (Qld)- Replacement concrete plant (Vic) & asphalt plant - SIB1 and safety equipment in Boral North America
Total capital expenditureA$m
1. Stay in business capital expenditure2. Excludes amortisation of acquired intangibles
SIB1 Growth Depreciation and amortisation2
21
• FY2018 capex expected to be at the lower end of ~$425m–$475m range
1H FY2018 capital expenditure, %
Boral AustraliaBoral North America
Total = A$164m68
32
-
250
500
750
1,000
FY18
FY19
FY20
FY21
FY22
FY23
FY24
FY25
FY26
FY27
FY28
FY29
FY30
Balance sheetMaintaining a robust financial position
1. Consists of syndicated bank debt, US Private Placement notes and Swiss franc notes issued under EMTN program
2. Gross debt / (gross debt + equity)3. EBIT before significant items / net interest expense
Gearing (net debt / net debt + equity), % • Net debt of $2.4b at 31 Dec 2017, up from $2.3b at 30 June 2017
• Principal debt gearing covenant2 of 32%, unchanged from 30 June-17 (threshold is less than 60%)
• Weighted average debt facility maturity increased to ~5 years following acquisition loan refinance
• Net interest cover3 of 6.3 times, down from 7.8 times in 1H FY2017
Debt maturity profileNet debt reconciliation, A$m 1H FY2018
Opening balance (2,333)
Cash flow (76)
Non cash (FX) 43
Closing balance (2,366)
22
30
18 19 20
30
0
30
FY13 FY14 FY15 FY16 FY17 1H FY17 1H FY18
Undrawn syndicated facilities Drawn debt1
144A / Reg SA$m
0
For
per
sona
l use
onl
y

Strategic Priorities & OutlookMike Kane – CEO & Managing Director
Boral employees at Berrima Cement Works, NSW, Australia Boral employees at the Discovery Center, San Antonio, TX
Transforming Boral
Across Boral’s three strong divisions, we are building a transformative culture to deliver performance excellence, capture growth and respond to a changing world
Boral Australia USG Boral Boral North America
• Strengthening our leading position in Australia through quarry and plant network reinvestments
• Leveraging diverse markets with multi-year growth in major roads & infrastructure
• Margin growth through customer, commercial and operational excellence
• Developing innovation platform
• Delivering long-term organic growth through:o Innovationo Asian economic growtho Product penetration for
interior linings and related products
• Defend and improve high regional market shares through additional capacity and next gen Sheetrock®
• Transformational growth and improved performance through:o Headwaters acquisitiono Meridian Brick JVo New product development and
innovationo Market recovery / growth
• Shift from high fixed cost capital intensive to variable cost model to better respond to cycles
24
We are building a transformative culture to grow, innovate and be responsive
For
per
sona
l use
onl
y

Outlook for FY2018B
oral
Aus
tralia • Expect high-single digit EBITDA growth and low double digit EBIT growth in FY2018, excluding property in
both years• Continue to expect Property earnings at lower end of historical range ($8m – $46m)• Expect mid-single digit EBITDA growth and high single digit EBIT growth including Property
US
G
Bor
al • Profit expected to grow at mid-single digit rate in FY2018, with strong year on year growth in 2H
• 2H earnings expected to be lower than 1H due to typical seasonality impacts, despite one-off cost impacts in 1H• Growth in China, Korea and Australia expected to offset slower than expected recovery in Thailand and Indonesia,
competitive pressures in Vietnam, and higher raw material and energy costs
Bor
al N
orth
A
mer
ica
• Expect significantly higher EBITDA in FY2018 reflecting Headwaters acquisition, synergy delivery and market growth
• EBITDA to be substantially skewed to 2H due to: progress in resolving operational issues, a return to normal weather conditions, price growth across all businesses, normal seasonal impacts which typically result in higher activity in Q4, and underlying market growth including ~4% in housing starts (to ~1.25m), ~9% in repair & remodel, ~4% in non-residential and ~5% in infrastructure1
• Meridian Brick JV expected to deliver positive and improved earnings in 2H
25
Earnings growth across all divisions, with significant lift in Boral North America as we deliver on Headwaters acquisition objectives
1. Housing starts based on average of Dodge, Wells Fargo, NAR, NAHB, Fannie Mae, Freddi Mac and MBA analysts between Dec-17 and Jan-18; Repair & Remodel from Moody’s Retail Sales of Building Products, January 2018; Non-residential from Dodge Data & Analytics, November 2017; and Infrastructure Ready Mix Demand from McGraw Hill Dodge , November 2017
Questions
For
per
sona
l use
onl
y

27
Area FY2018 implications
Synergies • Headwaters acquisition year 1 synergies to exceed US$35m• Meridian Brick JV synergies of US$25m p.a. within 4 years (by Nov 2020)
Corporate costs • FY18 to be slightly higher than FY17 due to additional Innovation spend
Depreciation & Amortisation
• Headwaters post acquisition PPA adjustments underway, additional D&A likely to be ~US$30-35m p.a.• Group D&A ~A$390-410m in FY18, including amortisation of acquired intangibles of ~A$70-80m
Capex • Total Boral capex expected to be at the lower end of ~A$425-475m p.a. range (including incremental Headwaters capex)
Debt & gearing • Cost of debt ~ 4.25% to 4.5% p.a. • Gearing of 30% within comfort range – expect to reduce to ~25% in coming years
HW significant items • Implementation costs – expect US$90-100m over two years, FY2018 & FY2019
Taxation • Effective tax rate projected to be ~ 22-24% in FY2018• Cash flow benefits of US tax loss carried forward
Dividends & franking
• Franking to align with earnings mix from Australia; FY2018 dividends to be partially franked in range of 50-70%• Dividend Policy: payout ratio ~50-70% of earnings before significant items, subject to Company’s financial position
FY2018 financial considerations
28
Issue Implications / considerations
US corporate tax rate reducing from ~35%
to 21% at federal level
• Boral’s expected tax rate on US earnings reduces from ~38% (35% Federal + state taxes) to:• ~32% (28% federal + state taxes) in FY2018• ~26% (21% federal + state taxes) from FY2019
• Resulting in overall effective tax rate for Boral at a Group level of:• ~22-24% in FY2018 (including other one-off items recorded in 1H FY2018)• ~21-23% in FY2019
• Delivers P&L benefits from FY2018 but no immediate cashflow benefits due to carry forward losses in the USA
US carry forward losses
• Continuing to recognise Boral’s and Headwaters’ carry forward losses, with cashflow benefits expected to continue for next few years
• Non-cash balance sheet adjustment to US carry forward losses of A$106m, but offset by adjustment to deferred tax liabilities (A$100m) and recognition of previously unrecognised tax losses (A$6m) – no net impact to profit
• As at 31 December 2017:
Impacts of US corporate tax rate changes
Tax losses US$m Gross value Tax effected value
Recognised on balance sheet 674 185
Unrecognised 178 49
Total 852 234
For
per
sona
l use
onl
y

Supplementary information
Corporate Profile
Boral’s concrete plant at Granville, NSW, Australia Boral roof tiles on home in Florida, USA
For
per
sona
l use
onl
y

Boral Group: snapshot
31
Australian based, ASX listed international building & construction materials group
A$8.7b market capitalisation1
S&P/ASX 100 company
17 countries
~700 operating sites2
~16,600 employees3
1. As at 12 February 20182. As at 30 June 2017. Includes joint ventures3. Full-time equivalent employees, including in joint ventures, as at 31
December 20174. Includes external revenue only. Includes Boral’s 50% share of underlying
revenue from USG Boral and Meridian Brick joint ventures, which are not included in Group reported revenue
5. Excluding significant items6. Includes proforma consolidated Boral and Headwaters businesses for the
six months to 31 December16, with Headwaters on a comparable basis to previously reported results
7. Roads, highways, subdivisions & bridges
52
12
36
1H FY2018 revenue by division4, %1H FY2018 revenue by division4, %
519 556 605 645720
333477 500
FY13
FY14
FY15
FY16
FY17
1H FY17
1HFY
17P
F
1H FY18
EBITDA5
A$m
Boral AustraliaUSG Boral
Boral North America
Australian RHS&B7 &other engineeringAustralian non-residentialAustralian detached dwellingAustralian multi-dwelling
Asia & Middle East
USA multi-familyUSA repair & remodel
Australian alterations & additions
USA single-family
USA non-residentialUSA roads & engineeringOther
Boral 1H FY2018 revenue4 by end-market, %
22
9
1067
8
14
38
57 1
6
46
23
24
7
QLD
NSW/ACT
VIC/TAS
1
20162
16
221 49313 9
1
161
468
SA
110
111
2
WA1
91
122
NT 21
Boral AustraliaDiversified geographic exposure across construction materials
4. Includes cement manufacturing plant, bagging plant and lime plant in NSW, a clinker grinding plant in Victoria and a clinker grinding JV in Queensland
5. Includes 8 Boral Hardwood mills and one JV Softwood operation32
1. Boral Australia external revenue for the six months ended 31 December 20172. Bricks & Roofing includes Masonry revenues. Other includes Transport, Landfill
and Property revenues3. As at 30 June 2017
Revenue1 by region, %
NSW / ACT
VIC / TAS/ SA
QLD
WA
OPERATING FOOTPRINT (total number of operating sites3)
Quarries
4
3
1
41
6
78
225
9
Bricks WA
Concrete
Asphalt
Cement4
Roof tiles
Timber5
Masonry
Revenue1 by business2, %
ConcreteQuarriesAsphaltCementConcrete placingBricks & RoofingTimberOther
44
11
21
94
5 4 2For
per
sona
l use
onl
y

• ~7m m3 p.a. • Per m3 concrete
~0.3t cementitious material~1.0t aggregates~0.9t sand
• ~25-35% Quarry volumes sold internally to Concrete2
• >2m tonnes of asphalt p.a.
• Per tonne asphalt~0.055t bitumen~0.7t aggregates~0.2t sand
• ~50% of bitumen supplied by JV plants2
Vertically integrated positions in key markets, especially on East Coast
QuarriesAggregates & sand
Cement BitumenBIA JV
Concrete Asphalt
End Customer
1. Includes Boral’s share of 1.5m tonnes of grinding capacity in 50% owned Sunstate Cement JV 2. Based on FY2017 data. Long-term historical averages differ as follows: ~40-50% Quarry volumes sold internally to Concrete; ~ 35-55% Quarry volumes sold externally & ~35% of bitumen supplied by JV plants
• >30m tonnes p.a.• Close to 1 billion tonnes
reserves• ~20-50 years reserves in
key metro quarries• ~5-15% Quarry volumes
sold internally to Asphalt
~50-70% Quarry volumes sold
externally2
33
• ~70% manufactured clinker, ~30% imported
• 1.5m tonne p.a. clinker kiln capacity
• 3m tonne p.a. cement grinding capacity1
• ~ 50-60% Cement volumes sold internally to Concrete
UpstreamDownstream
Boral Australia – Property is managed as an integrated and ongoing feature of the business
Integrated Property Life
Cycle
New need defined
Site opportunitylocated
Developmentapproval
Capitalapproval
Operationsplanning
Operationallife
End usestrategy
Rehabilitation
New landuse approvals
Development /disposal
34
For
per
sona
l use
onl
y
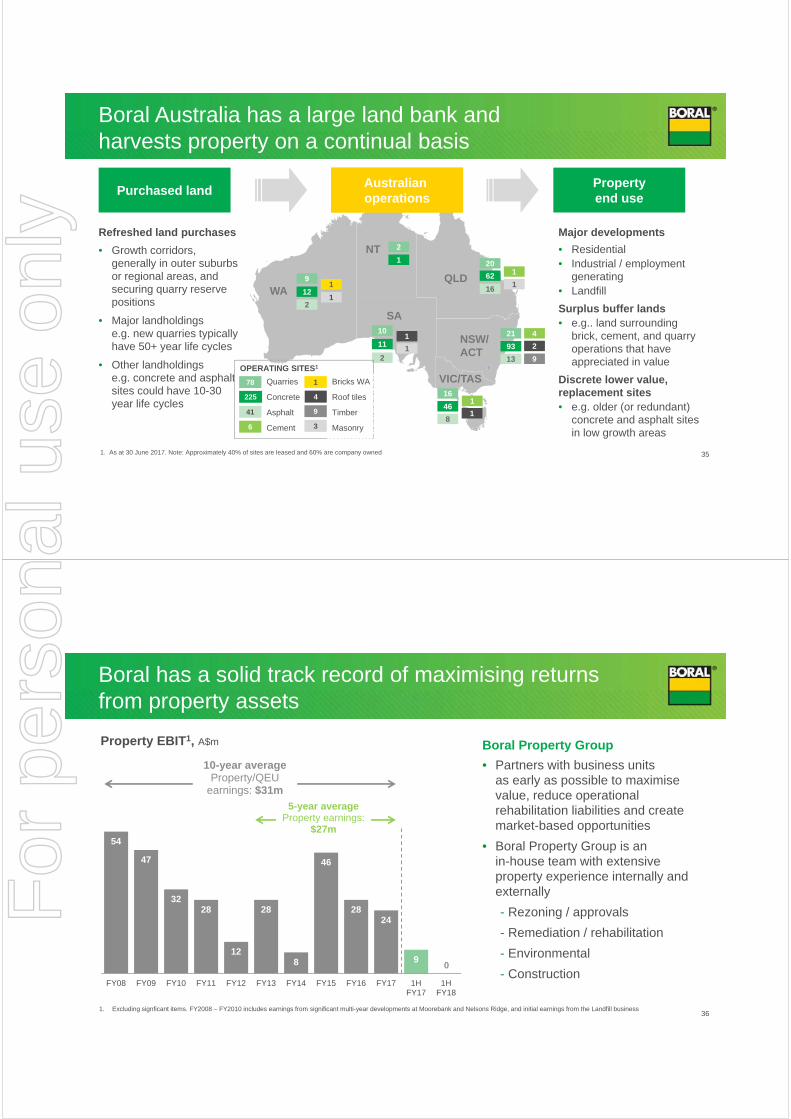
Boral Australia has a large land bank and harvests property on a continual basis
351. As at 30 June 2017. Note: Approximately 40% of sites are leased and 60% are company owned
Propertyend usePurchased land
• Growth corridors, generally in outer suburbs or regional areas, and securing quarry reserve positions
• Major landholdings e.g. new quarries typically have 50+ year life cycles
• Other landholdings e.g. concrete and asphalt sites could have 10-30 year life cycles
Major developments• Residential• Industrial / employment
generating• Landfill Surplus buffer lands• e.g.. land surrounding
brick, cement, and quarry operations that have appreciated in value
Discrete lower value, replacement sites• e.g. older (or redundant)
concrete and asphalt sites in low growth areas
Refreshed land purchases
QLD
NSW/ACT
VIC/TAS
1
20162
16
221 49313 9
1
161
468
SA
110
111
2
WA1
91
122
NT 21
Australian operationsAustralian operations
OPERATING SITES1
Quarries
Concrete
Asphalt
Cement
4
3
1
41
6
78
225
9
Bricks WA
Roof tiles
Timber
Masonry
54
47
3228
12
28
8
46
2824
9 0
FY08 FY09 FY10 FY11 FY12 FY13 FY14 FY15 FY16 FY17 1HFY17
1HFY18
Boral has a solid track record of maximising returns from property assets
36
10-year averageProperty/QEU
earnings: $31m5-year average
Property earnings:$27m
1. Excluding signficant items. FY2008 – FY2010 includes earnings from significant multi-year developments at Moorebank and Nelsons Ridge, and initial earnings from the Landfill business
Boral Property Group• Partners with business units
as early as possible to maximise value, reduce operational rehabilitation liabilities and create market-based opportunities
• Boral Property Group is an in-house team with extensive property experience internally and externally - Rezoning / approvals- Remediation / rehabilitation- Environmental- Construction
Property EBIT1, A$m
0
For
per
sona
l use
onl
y

USG Boral50%-owned joint venture in Australasia, Asia & Middle East
External Revenue1, %
36
24
12
6
11
11
Australia/NZ
Thailand
Other
South Korea
China
Indonesia
Indonesia
South Korea
Malaysia
Australia
Middle East
China
NZ
India Vietnam
Thailand
1 1 3
48
32
13
3 413
113
2
21
22
1
MANUFACTURING FOOTPRINT (total number of operating sites2)
Plasterboard plants 617m m2 capacity (23 board lines / 6 ceiling lines)
Gypsum mines
Other plants3
mineral fibre ceiling tile, metal ceiling grid, metal products, joint compounds, mineral wool and cornice production
18
3
31
1. Based on split of 1H FY2018 underlying revenue for USG Boral. USG Boral’s revenue is not reported in Boral’s income statement as this 50% investment is equity accounted
2. As at 30 June 2017. Certain manufacturing facilities and gypsum mines held in joint venture with third parties
3. Production of plasterboard and other products may be at the same physical location 37
New warehouse completed
Plans to add 17m m2
board capacity
Plans to add 30m m2
board capacity
65%
70%
75%
80%
85%
90%
250
300
350
400
450
500
550
600
650
700
FY07
FY08
FY09
FY10
FY11
FY12
FY13
FY14
FY15
FY16
FY17
1H F
Y18
Production volume
Capacity at year end
Capacity utilisation (RHS)
USG Boral6% CAGR in plasterboard volumes and strengthened capacity utilisation
1. Includes plasterboard and gypsum ceiling tile volumes2. Based on total production capacity at financial year end and annualised for 1H FY20183. Compound annual growth rate
• Average plant capacity utilisation of ~82% for 1H FY2018, up from ~76% in 1H FY2017
• Since FY2007 plasterboard production volume CAGR3 of 6% p.a. (including Aus/NZ) and 7% p.a. in Asia (excluding Aus/NZ)
USG Boral plasterboard capacity utilisation and production volume1
mill
ion
m2
Capacity
utilisation2
38
For
per
sona
l use
onl
y

Boral North America
1. Based on 1H FY2018 external revenue, including Boral’s 50% share of Meridian Brick JV revenue, which is not included in reported revenue2. Southeast – AL, FL, GA, KY, MS, NC, SC, TN, VA, WV; Southwest – AR, LA, OK, TX; West – AK, AZ, CA, CO, HI, ID, MT, NM, NV, OR, UT, WA, WY; Midwest – IA, IL, IN, KS, MI, MN, MO, ND,
NE, OH, SD, WI; Northeast - CT, DC, DE, MA, MD, ME, NH, NJ, NY, PA, RI, VT. 3. As at December 2017 39
1
2
Trinidad (mothballed)
Mexico & Philippines
1
Southwest
West
North-east
Midwest
Southeast
Ontario
1
232
2
1
2
2
6
99
9
33
37 6
1
1
113
4
6
62
45
57
3
8
3 112
12
1
11
1
1
7
3
1
12
2
1
5 1
2
2
1
1
1
1
1
2
11
1 6~215 Operating Sites3
Fly ash 14
4
8
8
146
6
8
Stone
21
Block
Denver CM
Roofing
Light Building Products
WindowsMeridian Brick
Revenue1 by geography2, %
2 1
18 5
Construction Materials and Building Products
SoutheastSouthwestWestMidwestNortheastInternational
26
2522
16
8 3
Revenue1 by business, %
28
65
1614
13
810 Fly Ash
BlockDenverRoofingStoneLight Building ProductsWindowsMeridian Brick
Our strategic prioritiesMaking good progress in all divisions
40
Boral Australia USG Boral Boral USA
Ongoing ~$200m of quarry reinvestment projects plus concrete and asphalt plant investments
Restructured Bricks WA in line with market downturn
Finalised plans to build clinker grinding and cement storage facility at Port of Geelong, Victoria
Benefits being delivered from Customer, Operational and Commercial excellence initiatives
Sheetrock® technology roll-out completed in Dec-2017; total capex of ~US$46m (below budget of US$50m)
Sheetrock® adoption on target Total synergies exceed targeted
US$50m p.a. synergies(including technologies, adjacent products, procurement & supply chain)
Next generation Sheetrock®
technology being pilotedAdding board production capacity
in VietnamBuilding new 30m m2 board plant
in India
Meridian Brick joint venture formed in Nov-16; 8 plants and 14 distribution sites closed
Investment in growth of lightweight Trim & Siding business
Integrating US$2.6b Headwaters acquisition
Improve safety performance of new businesses
Expect Brick JV cost synergies of US$25m within 4 yrs
Expect Headwaters synergies >US$100m p.a. within 4 yrs; currently expect Year 1 synergies to exceed ~US$35m
For
per
sona
l use
onl
y

Headwaters & Meridian Brick update
42
Boral North America organisational structureExperienced executives from Boral and Headwaters
Building Products Group
Chris Fenwick
Building Products Group
Chris Fenwick
WindowsDavid Decker
WindowsDavid Decker
Innovation Factory
Russell Hill
Innovation Factory
Russell Hill
StoneBrent Spann
StoneBrent Spann
Roofing3
Darren Schulz
Roofing3
Darren Schulz
Light Building Products
Brian Below
Light Building Products
Brian Below
Fly Ash West: Jimmy Lambert
East: Terry Peterson
Fly Ash West: Jimmy Lambert
East: Terry Peterson
Denver Ready-MixBob Kepford
Denver Ready-MixBob Kepford
1. Note that for external reporting Windows is reported with Building Products Group businesses2. Former President of the Fly Ash business Bill Gehrmann has transitioned to support management through a multi-year consulting agreement3. Darren Schulz re-joined Boral in December 2017
HRTommy Balas
HRTommy Balas
SafetyRich Stevens
SafetyRich Stevens
CFOOren Post
CFOOren Post
Strategy & IntegrationAmit Swarup
Strategy & IntegrationAmit Swarup
Cor
pora
te S
taff
Construction Materials Group
Keith Depew
Construction Materials Group
Keith Depew
BlockBob Whisnant
BlockBob Whisnant
LegalErnie McLean
LegalErnie McLean
President & CEODavid Mariner
President & CEODavid Mariner
Windows1 and Innovation
Joel Charlton
Windows1 and Innovation
Joel Charlton
Fly Ash2
Bill Gehrmann
For
per
sona
l use
onl
y
43
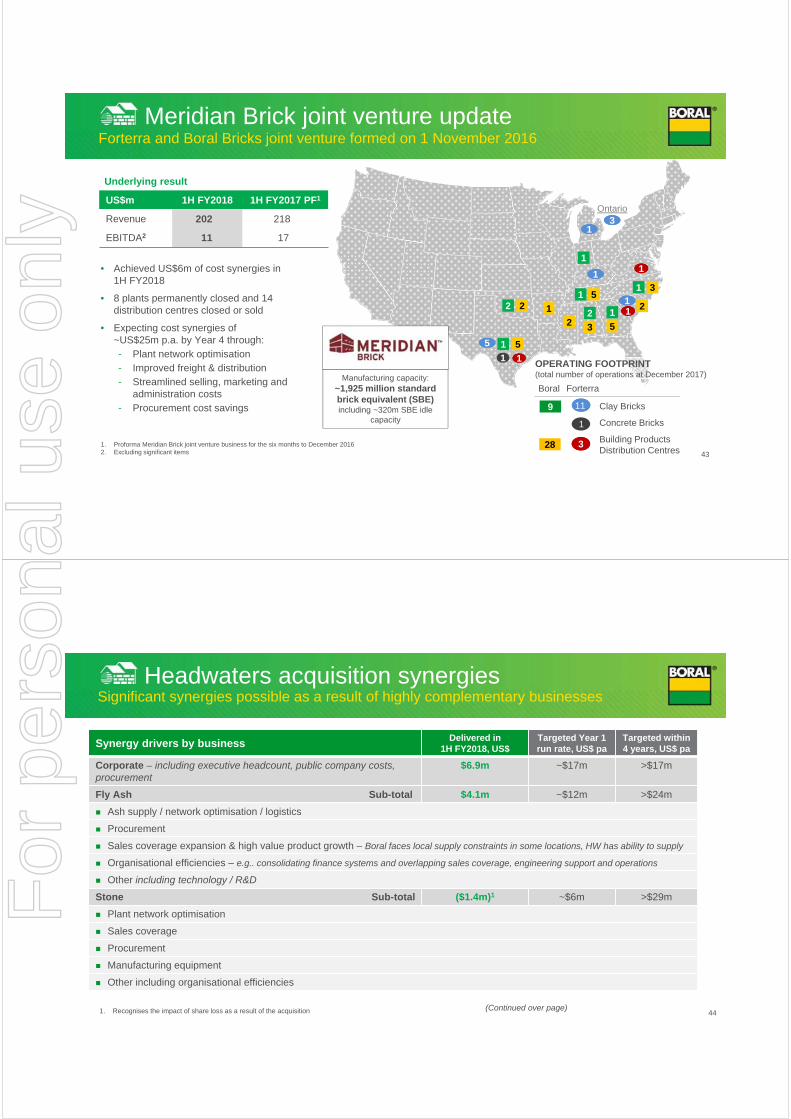
Meridian Brick joint venture updateForterra and Boral Bricks joint venture formed on 1 November 2016
• Achieved US$6m of cost synergies in 1H FY2018
• 8 plants permanently closed and 14 distribution centres closed or sold
• Expecting cost synergies of ~US$25m p.a. by Year 4 through:- Plant network optimisation- Improved freight & distribution- Streamlined selling, marketing and
administration costs- Procurement cost savings
Underlying result
US$m 1H FY2018 1H FY2017 PF1
Revenue 202 218
EBITDA2 11 17
1. Proforma Meridian Brick joint venture business for the six months to December 20162. Excluding significant items
1
1
3
1
2 1
1
1 52 2
5
2 3 5
2
11
11
11
55
33Ontario
1
11
OPERATING FOOTPRINT (total number of operations at December 2017)
9 Clay Bricks
Concrete Bricks
Building Products Distribution Centres28
Boral Forterra
11
1
33
Manufacturing capacity:~1,925 million standard brick equivalent (SBE)including ~320m SBE idle
capacity
11
11
Headwaters acquisition synergies Significant synergies possible as a result of highly complementary businesses
(Continued over page)
Synergy drivers by business Delivered in 1H FY2018, US$
Targeted Year 1 run rate, US$ pa
Targeted within 4 years, US$ pa
Corporate – including executive headcount, public company costs, procurement
$6.9m ~$17m >$17m
Fly Ash Sub-total $4.1m ~$12m >$24m
Ash supply / network optimisation / logistics
Procurement
Sales coverage expansion & high value product growth – Boral faces local supply constraints in some locations, HW has ability to supply
Organisational efficiencies – e.g.. consolidating finance systems and overlapping sales coverage, engineering support and operations
Other including technology / R&D
Stone Sub-total ($1.4m)1 ~$6m >$29m
Plant network optimisation
Sales coverage
Procurement
Manufacturing equipment
Other including organisational efficiencies
1. Recognises the impact of share loss as a result of the acquisition 44
For
per
sona
l use
onl
y

Synergy drivers by business Delivered in 1H FY2018, US$
Targeted Year 1 run rate, US$ pa
Targeted within 4 years, US$ pa
Roofing Sub-total $2.6m ~$11m >$19m
Procurement
Cross-selling portfolio – e.g.. re-sale products account for ~20% of Boral’s Roofing sales, while Headwaters has minimal exposure
Manufacturing & network optimisation
Manufacturing efficiencies
Other including organisational efficiencies
Light Building Products Sub-total $4.0m ~$6m >$11m
Procurement
Sales coverage, cross selling, retail presence
Organisational efficiencies
Other
Other: including Block & Windows Sub-total $1.8m
Total $18m >$50-55m >$100m
45
Headwaters acquisition synergies cont.Significant synergies possible as a result of highly complementary businesses
Market Data
Boral TruExteriorTM Siding on a home in Rhode Island, USABoral Asphalt used on the Bolte Bridge, Victoria Boral TruExterior® Siding on an apartment block in San Francisco, CA
For
per
sona
l use
onl
y

Australian RHS&B activity is increasingGrowth in all regions
47
7.59.1
3.3 3.7 3.94.7
1.2 1.4 2.0 2.2
FY17FY18F FY17FY18F FY17FY18F FY17FY18F FY17FY18F
RHS&B1, by state FY2018f v FY2017 (value of work done, $b)
RHS&B1
(value of work done, $b)
+15%
+12%
+21%
+22%
NSW VIC QLD SA WA
+11%
20.3
16.515.3
16.2
18.7
21.9
FY13 FY14 FY15 FY16 FY17 FY18F
+17%
1. RHS&B refers to roads, highways, subdivisions and bridges. Source: ABS, average of BIS Oxford Economics and Macromonitor forecasts, 2015/16 constant prices
Australian non-residential activity improvingStronger activity forecast in all regions; significant boost expected in Victoria
481. Original series (constant 2015/16 prices) from ABS. Average of BIS Oxford Economics and Macromonitor forecast for December 2017 quarter. Six monthly data annualised
Non-residential, by state1
1H FY2018f v 1H FY2017 (value of work done, $b)
35.737.5 37.4 37.5 37.1 37.2 36.9
41.2
FY13 FY14 FY15 FY16 FY17 1HFY17
2HFY17
1HFY18f
11.3 12.09.8
12.4
7.1 7.5
1.9 2.3
4.8 4.8
1HFY17
1HFY18f
1HFY17
1HFY18f
1HFY17
1HFY18f
1HFY17
1HFY18f
1HFY17
1HFY18f
NSW VIC QLD SA WA
+18%
+27%+7%
+5%
+1%
Non-residential1(value of work done, $b)
+11%
For
per
sona
l use
onl
y

Australian residential activity remains strongHousing starts remain at historically strong levels
96 108 117 116 115 124 106 119
70 77102 117 106 114
98 105
FY13 FY14 FY15 FY16 FY17 1HFY17
2HFY17
1HFY18f
185219
166
234 238
-6%
221 204
33 2937 38
26 27
8 815 14
5042 28 34
23 14
3 45 4
1HFY17
1HFY18f
1HFY17
1HFY18f
1HFY17
1HFY18f
1HFY17
1HFY18f
1HFY17
1HFY18f
DetachedOther
8.0 8.1 8.2 8.5 8.7 9.3 8.2 9.0
FY13 FY14 FY15 FY16 FY17 1HFY17
2HFY17
1HFY18f
49
Housing starts1
(‘000)
1. Original series housing starts from ABS to Sep-17 quarter. Average of BIS Oxford Economics, Macromonitor and HIA forecast for Dec-17 quarter. Six monthly data annualised
2. Original series (constant 2015/16 prices) from ABS. Average of BIS Shrapnel and Macromonitor forecast for Dec-17 quarter. Six monthly data annualised
Figures may not add due to rounding
Alterations & additions (A&A)2
(value of work done, $b)
Detached Other
-15%
-8%+13%
7166
71
4841
11 1221 19
83
NSW VIC QLD SA WA
+9%
-15%
-3%
Housing starts, by state1
1H FY2018f vs 1H FY2017 (‘000)
224
Single family growing, affordability high, supply remains challenged US housing activity continues to recover
Single and multi family housing starts1
(‘000)
475
594 623675
760815 797 832 869
209
283332
380389
386 402 370 342
684
877955
1,056
1,1491,201 1,199 1,202 1,211
FY12 FY13 FY14 FY15 FY16 FY17 1HFY17
2HFY17
1HFY18
Multi-family
Single family
72% ~5 percentage points above 1H FY2017; above long-term average of 71%
Single Family Growth1 (1H FY2018 % of Total)
160 5.6% down year-on-year but significantly above historical average of 100
Affordability Index2
0.28m14.1% up year-on-year; in line with 0.36m long-term average
New Housing Stock3
1.7m9.7% down year-on-year; below long-term average of 2.2m
Existing Housing Stock2
1. Source: US Census seasonally adjusted annualised housing starts2. Source: National Association of Realtors (NAR); November 2017 3. Source: National Association of Home Builders (NAHB); November 2017
+1%
50
For
per
sona
l use
onl
y

127 134 148 150 163 154 172 168
49 53 47 55 38 40 36 22
FY13 FY14 FY15 FY16 FY17 1HFY17
2HFY17
1HFY18
127 130 145 172 182 179 185 203
61 75 8284
100 100 100 78
FY13 FY14 FY15 FY16 FY17 1HFY17
2HFY17
1HFY18
West – 22% of Boral’s US revenue1,2
Continued growth in Northeast, Southeast and West with Southwest & Midwest softerUS housing starts by region
199 209 234 272 297 285 309 31781 95 111
110 110 109 112 99
FY13 FY14 FY15 FY16 FY17 1HFY17
2HFY17
1HFY18
304 345280
382 394
+6%
407 416
Southeast – 26% of Boral’s US revenue1,2
420
Hou
sing
sta
rts (‘
000)
99 103 104 115 122 124 120 129
41 47 59 63 66 77 56 57
FY13 FY14 FY15 FY16 FY17 1HFY17
2HFY17
1HFY18
150 164140
178 201
-7%
188 186
Midwest – 16% of Boral’s US revenue1,2
176
Hou
sing
sta
rts (‘
000)
205227
188
256279
+1%282 281285
Hou
sing
sta
rts (‘
000)
42 46 44 51 50 55 46 53
5162 81 77 72 76
6786
FY13 FY14 FY15 FY16 FY17 1HFY17
2HFY17
1HFY18
108125
93
128 131
+6%
122139
113
Hou
sing
sta
rts (‘
000)
Northeast – 8% of Boral’s US revenue1,2
187 195 205 194
-2%
201 190208
Hou
sing
sta
rts (‘
000)
Southwest – 25% of Boral’s US revenue1,2
1. Source: US Census seasonally adjusted annualised housing starts2. Based on 1H FY2018 external revenue, including Boral’s 50% share of Meridian Brick JV revenue, which is not included in reported revenue. Southeast – AL, FL, GA, KY, MS, NC, SC, TN, VA, WV;
Southwest – AR, LA, OK, TX; West – AK, AZ, CA, CO, HI, ID, MT, NM, NV, OR, UT, WA, WY; Midwest – IA, IL, IN, KS, MI, MN, MO, ND, NE, OH, SD, WI; Northeast - CT, DC, DE, MA, MD, ME, NH, NJ, NY, PA, RI, VT; international sales comprise the remainder of the revenue split
51
176
325 312281
257 262278 291 308 323 343
362 353 371388
FY07
FY08
FY09
FY10
FY11
FY12
FY13
FY14
FY15
FY16
FY17
1H F
Y17
2H F
Y17
1H F
Y18
Home improvement sales continue to rise as homeowners take advantage of rising equity valuesRepair and Remodel (R&R)
52
Building products retail sales1
(Nominal US$b)
1. Source: Moody’s Retail Sales of Building Products, January 2018
+10%
For
per
sona
l use
onl
y

Warehousing, office and education segments driving construction activityUS non-residential activity
53
33
1816
11
10
9
Public Religious, 1%
Education
Retail
Healthcare
Hotel
1H FY2018 breakdown by non-residential segment3, %
1,446
1,023864
946 984 1,003 1,038968
1,076
FY12
FY13
FY14
FY15
FY16
FY17
1H F
Y17
2H F
Y17
1H F
Y18
F
Non-residential construction1,2
(million square foot area)
1. Source: Dodge Data & Analytics. Non-residential square feet area (millions), November 2017; forecast used for December 2017 quarter2. Half-year data annualised for comparison3. Source: Dodge Data & Analytics
+4%
Warehousing
Office
21
174 167175
185177 170 173 167
178
FY12
FY13
FY14
FY15
FY16
FY17
1H F
Y17
2H F
Y17
1H F
Y18
F
Highways continue to be the main driver in the infrastructure segmentInfrastructure
54
Infrastructure activity, ready mix demand1,2
(cubic yards, millions)
1. Source: Dodge Data & Analytics, Infrastructure Ready Mix Demand; November 2017; forecast used for December 2017 quarter2. Half year data annualised for comparison3. Source: Portland Cement Association
76
9
44
2 2 1Highways
Harbors & Dams
Public Transit
Freight & Rail
State Water
NextGen Transportation
Pedestrian
Airports
2
Infrastructure cement consumption3, %
+3%
For
per
sona
l use
onl
y

Market Forecasts
Boral TruExteriorTM Siding on a home in Rhode Island, USABoral Asphalt used on the Bolte Bridge, VictoriaBoral North America product display
- 25 50 75
100 125
FY00
FY02
FY04
FY06
FY08
FY10
FY12
FY14
FY16
FY18
F
FY20
F
FY22
F
-
2.5
5.0
7.5
10.0
FY00
FY02
FY04
FY06
FY08
FY10
FY12
FY14
FY16
FY18
F
FY20
F
FY22
F
-
40,000
80,000
120,000
FY00
FY02
FY04
FY06
FY08
FY10
FY12
FY14
FY16
FY18
F
FY20
F
FY22
F
-
40,000
80,000
120,000
FY00
FY02
FY04
FY06
FY08
FY10
FY12
FY14
FY16
FY18
F
FY20
F
FY22
F
External revenue by end-market1, %External revenue by end-market1, %
16
11
12
168
35
2
RHS&B3Multi-dwellings
Other engineeringNon-residential
Other Detached dwellings
Alterations& additions
1. Based on split of 1H FY2018 Boral Australia external revenues2. Source: ABS, BIS Oxford Economics and Macromonitor forecasts, constant 2015/16 dollarsNote charts have been based on 2015/16 dollars unless otherwise noted
- 10 20 30 40 50
FY00
FY02
FY04
FY06
FY08
FY10
FY12
FY14
FY16
FY18
F
FY20
F
FY22
F
Non-residential2, VWD A$b Alterations & additions2, VWD A$b
Multi-dwellings5, # starts
Detached dwellings5, # starts
3. Roads, highways, subdivisions and bridges4. Source: ABS, Macromonitor forecasts, constant 2015/16 dollars5. Source: ABS, BIS Oxford Economics, Macromonitor and HIA forecasts
- 5
10 15 20 25
FY00
FY02
FY04
FY06
FY08
FY10
FY12
FY14
FY16
FY18
F
FY20
F
FY22
F
RHS&B2,3, VWD A$b
Other engineering4, VWD A$b
56
Boral AustraliaRevenues are derived from various market segments
For
per
sona
l use
onl
y

Australian major transport projects pipelineMulti-year growth trajectory for roads and rail segments
571. Chart prepared exclusively by Macromonitor based on publicly available data. Boral has not independently verified either the historical data or forecasts. Chart shows financial years and projects with total value >A$500m only2. Forecast spending represents Macromonitor’s indicative estimation of likely spending based on currently available information. There can be no assurance that actual results will be as forecasted and such differences can be material.
There can be no assurance regarding the proportion of forecast project spending that represents requirements for which Boral is a potential supplier, or that Boral will be successful in generating revenue from any of these projects
Australian major transport infrastructure construction projects1,2
(A$b)
Boral’s Australian project pipelineAs at February 2018
Projects committed TimingBringelly Road Stage 1, NSW Est. completion 2018Northern Beaches hospital, NSW Est. completion 2018NorthLink stage 1, WA Est. completion 2018Pacific Hwy, NSW Est. completion 2018Toowoomba Second Range, Qld Est. completion 2018Warrego Highway stage 2, Qld Est. completion 2018Amrun Project, Qld Est. completion 2019Forrestfield – Airport Link, WA Est. completion 2019Gateway Upgrade North, Qld Est. completion 2019Kingsford Smith Drive, Qld Est. completion 2019NorthConnex, NSW Est. completion 2019Northern Connector, SA Est. completion 2020Melbourne Metro (Precast), VIC Est. completion 2020Northern Road stage 2, NSW Est. completion 2019Northern Road stage 3, NSW Est. completion 2020Pacific Motorway, Qld Est. completion 2020Sydney Metro (City/SW precast), NSW Est. completion 2020Warrego Highway stage 3, Qld Est. completion 2020
Projects under tender StatusAlbion Park Rail Bypass, NSW Currently tenderingBrisbane Airport Runway, Qld Currently tenderingHaughton River Bridge, Qld Currently tenderingInland Rail, Qld, NSW, Vic Currently tenderingLogan Motorway, Qld Currently tenderingMelbourne Airport Runway, Vic Currently tenderingMelbourne Metro (Insitu), Vic Currently tenderingNewell Hwy Upgrade, NSW Currently tenderingOuter Suburban Arterial Roads, Vic Currently tenderingPacific Hwy W2B, NSW Currently tenderingPerth Metro Road Maintenance, WA Currently tenderingSmithfield Transport Corridor, Qld Currently tenderingPrinces Hwy Upgrade, NSW Currently tenderingSunshine Coast Airport, Qld Currently tenderingSydney Metro (Stations), NSW Currently tenderingWestConnex Stage 3, NSW Currently tenderingWest Gate Tunnel, Vic Currently tenderingBadgery’s Creek Airport, NSW Pre-tendering
Projects recently awarded to Boral are highlighted in grey 58
For
per
sona
l use
onl
y

Concrete demand in Australia
59
Industry demand forecast to remain at high levels
Macromonitor forecast1 pre mix concrete demand across all Australian construction markets(‘000) m3
1. Source: Macromonitor, Construction Materials forecast, November 2017 estimates2. Compound annual growth rate3. Roads, highways, subdivisions & bridges
• Total concrete volumes are forecast to grow in FY2018 before declining back below FY2017 levels in FY2020
• Near-term growth in RHS&B3 and non-residential building activity forecast to offset decline in multi-residential activity
-
5,000
10,000
15,000
20,000
25,000
30,000
FY06
FY07
FY08
FY09
FY10
FY11
FY12
FY13
FY14
FY15
FY16
FY17
FY18
f
FY19
f
FY20
f
FY21
fQLD
NSW / ACT
VIC / TAS / SA
WA / NT
Forecast volumes
Asphalt demand in Australia
60
Industry demand forecast to increase and remain at high levels
Macromonitor forecast1 asphalt demand across all Australian construction markets(‘000) tonne3
1. Source: Macromonitor, Construction Materials forecast, November 2017 estimates2. Compound annual growth rate
• Total asphalt volumes are forecast to grow in FY2018 and FY2019, before moderating slightly in FY2020 and FY2021
• ~5.5% CAGR2 in asphalt volumes forecast from FY2017 to FY2021, with significant uplift in FY2018 and FY2019
• Growth in major roads infrastructure underpinning strong increase in forecast demand
• Forecast growth in demand driven by most states (particularly Qld, Vic and SA) in FY2018, with Qld driving further uplift in FY2019
-
2,000
4,000
6,000
8,000
10,000
12,000
14,000
FY06
FY07
FY08
FY09
FY10
FY11
FY12
FY13
FY14
FY15
FY16
FY17
FY18
fFY
19f
FY20
fFY
21f
QLD
NSW / ACT
VIC / TAS / SA
WA / NT
Forecast volumes
For
per
sona
l use
onl
y

1. Source: US Census seasonally adjusted annualised housing starts. Forecasts based on an average of analysts’ forecasts (December 2017 and January 2018) sourced from NAHB, MBA, Wells Fargo, NAR, Fannie Mae and Freddie Mac
2. Source: Moody’s Retail Sales of Building Products, January 20183. Source: Dodge Data & Analytics, Non-Residential Area. Forecast used for December 2017 quarter4. Source: Dodge Data & Analytics, Infrastructure Ready Mix Demand, November 2017. Forecast used for December 2017 quarter
Boral North America
61
Positive outlook across all markets
USA New Residential: 46% of BNA revenue1 USA Repair & Remodel: 20% of BNA revenue2
USA Non-residential: 15% of BNA revenue3 USA Infrastructure: 19% of BNA revenue4
1,24
2
1,31
3
1,39
3
1,58
7
1,66
3
1,68
1
1,24
2
807
459
501
427
475
594
623
675
760
815
875
329 333 336 358 353 355
304
326
187 93 143 209 283 332 380 389 386 375
1,57
1
1,64
6
1,72
9
1,94
5
2,01
6
2,03
6
1,54
6
1,13
2
646
594
570
684 87
7
955
1,05
6
1,14
9
1,20
1
1,25
0
FY01
FY02
FY03
FY04
FY05
FY06
FY07
FY08
FY09
FY10
FY11
FY12
FY13
FY14
FY15
FY16
FY17
FY18
F
142
149
151
141
137
146
154
159
160 18
6
186
174
167
175
185
177
170
178
FY01
FY02
FY03
FY04
FY05
FY06
FY07
FY08
FY09
FY10
FY11
FY12
FY13
FY14
FY15
FY16
FY17
FY18
FRM
X c
ubic
yar
ds (m
’s)1,
716
1,47
7
1,35
2
1,35
9
1,36
8
1,53
4
1,48
6
1,47
3
1,38
9
1,39
0
1,43
3
1,44
6
1,02
3
864
946
984
1,00
3
1,04
2
FY01
FY02
FY03
FY04
FY05
FY06
FY07
FY08
FY09
FY10
FY11
FY12
FY13
FY14
FY15
FY16
FY17
FY18
F
Sq F
t Are
a (m
’s)
227
233
251 28
0 308 336
325
312
281
257
262
278
291
308
323
343
362 39
6
FY01
FY02
FY03
FY04
FY05
FY06
FY07
FY08
FY09
FY10
FY11
FY12
FY13
FY14
FY15
FY16
FY17
FY18
F
US
$ bi
llion
s
US housing continues to recover in all regions
1. Housing starts forecasts based on the average of Dodge, Wells Fargo, NAR, NAHB, Fannie Mae, Freddie Mac and MBA analysts between Dec 2017 and Jan 2018. Historical data – US Census Bureau2. SOUTHEAST consists of AL, DE, FL, GA, KY, MD, MS, NC, SC, TN, WV, VA | SOUTHWEST consists of AR, LA, OK, TX | NORTHEAST consists of CT, MA, ME, NH, NJ, NY, PA, RI, VT | MIDWEST
consists of IA, IL, IN, KS, MI, MN, MO, ND, NE, OH, SD, WI | WEST consists of AK, AZ, CA, CO, HI, ID, MT, NM, NV, OR, UT, WA, WY. 3. Based on 1H FY2018 Boral North America external revenue, including Boral’s 50% share of Meridian Brick JV revenue which is not included in reported revenue
Forecasters1 expect ~1.25m housing starts in FY2018
62
26%
25%22%
16%
8%3%
Southeast
Midwest
Northeast
West
0
50
100
150
200
250
FY90
FY92
FY94
FY96
FY98
FY00
FY02
FY04
FY06
FY08
FY10
FY12
FY14
FY16
FY18
F
Midwest1,2 Housing Starts
Northeast1,2 Housing Starts
West1,2 Housing Starts
‘000Geographic2,3
International
Southwest
0
100
200
300
400
FY90
FY92
FY94
FY96
FY98
FY00
FY02
FY04
FY06
FY08
FY10
FY12
FY14
FY16
FY18
F
‘000
0100200300400500600
FY90
FY92
FY94
FY96
FY98
FY00
FY02
FY04
FY06
FY08
FY10
FY12
FY14
FY16
FY18
F
‘000
0
200
400
600
800
1,000
FY90
FY92
FY94
FY96
FY98
FY00
FY02
FY04
FY06
FY08
FY10
FY12
FY14
FY16
FY18
F
Southeast1,2 Housing Starts‘000
050
100150200250300350
FY90
FY92
FY94
FY96
FY98
FY00
FY02
FY04
FY06
FY08
FY10
FY12
FY14
FY16
FY18
F
Southwest1,2 Housing Starts‘000
Multi Family
Single Family
For
per
sona
l use
onl
y
Financial Data
Boral TruExteriorTM Siding on a home in Rhode Island, USABoral Asphalt used on the Bolte Bridge, Victoria
1H FY2018 segment revenue and EBITDA
External revenue, A$m EBITDA3, A$m1H FY2018 1H FY2017 Var, % 1H FY2018 1H FY2017 Var, %
Boral Australia 1,804 1,616 12 294 264 12
USG Boral1 – – 38 40 (4)
Boral North America 1,133 477 184 41
Unallocated – – (17) (16) 1
Discontinued Operations2 – – – 5
TOTAL 2,937 2,093 40 500 333 50
1. Represents Boral’s 50% post-tax equity accounted income from the USG Boral joint venture2. Discontinued Operations includes Boral’s 40% share of Boral CSR Bricks sold to CSR in October 2016 3. Excluding significant items
(Figures may not add due to rounding)64
For
per
sona
l use
onl
y

Earnings and dividends per share
Earnings and dividends per share
• EPS1 of 18.2 cents, up 6%
• EPSA1 of 20.2 cents, up 17%
• Interim dividend of 12.5 cents per share (50% franked), up 4% on 1H FY2017
• Dividend payout ratio of 68%- In line with Boral’s Dividend Policy of
between 50-70% of earnings before significant items, subject to the Company’s financial position
A$ cents
1. Refer to pages 68 – 69 for reconciliation and explanation of these items2. In accordance with AASB 133, historical EPS has been revised to reflect the bonus element in the equity raising completed December 2016
65
11.0 11.015.0 18.0
22.5 24.0
12.0 12.5
12.7 12.7
20.5
29.733.3 33.7
17.2 18.2
FY12 FY13 FY14 FY15 FY16 FY17 1H FY17 1H FY18
DPS EPS2
88
12
Debt profile
Debt facilities, A$m 1H FY2018 1H FY2017
US Private Placement Notes 740 1,154
Swiss Franc notes1 197 203
Syndicated bank loan2 360 -
US 144A Senior Notes 1,204 -
Other 13 3
Gross debt 2,514 1,360
Net debt 2,366 (1,179)
USDAUD
Gross debt currency exposure, %As at 31 December 2017
Total = A$2,514m
1. Issued under EMTN program. Swapped to USD2. AUD and USD drawn bank loans
66
For
per
sona
l use
onl
y

181
117
33
31
Boral Australia USG Boral BoralNorth America
Total
67
Boral’s energy and fuel costsEnergy and fuel costs make up ~6% of Boral’s overall cost base
• Gas and electricity costs in Australia expected to be ~$20m higher in FY2018
Total energy and fuel costs - 1H FY2018 A$m
1. Based on 50% of USG Boral’s energy and fuel costs, reflecting Boral’s 50% equity interest in the joint venture2. Includes 50% of Meridian Brick JV’s energy and fuel costs
2
1
Non-IFRS information
Boral Limited’s statutory results are reported under International Financial Reporting Standards. Earnings before significant items is a non-IFRS measure reported to provide a greater understanding of the underlying business performance of the Group. Significant items are detailed in Note 6 of the Half Year Financial Report and relate to amounts of income and expense that are associated with significant business restructuring, business disposals, impairment or individual transactions.
A reconciliation of these non-IFRS measures to reported statutory profit is detailed on the next page.
The USG Boral division commentary also includes a non-IFRS measure of underlying results excluding significant items, representing the 6 months trading results to assist users to better understand the trading results of this division.
The results announcement has not been subject to review or audit, however it contains disclosures which are extracted or derived from the Half Year Financial Report for the half year ended 31 December 2017. This Half Year Financial Report for the half year ended 31 December 2017 is prepared in accordance with the ASX listing rules and should be read in conjunction with any announcements to the market made by the Group during the year.
68
For
per
sona
l use
onl
y

Non-IFRS information (continued)
69
A reconciliation of non-IFRS measures to reported statutory profit is detailed below:
A$m Earnings before significant items
Significant items
Reported Result
Sales revenue 2,937.0 - 2,937.0
Profit before depreciation, amortisation, interest & income tax EBITDA 500.2 (55.9) 444.3Depreciation & amortisation, excluding amortisation of acquired intangibles (150.0) - (150.0)
Profit before amortisation of acquired intangibles, interest & tax EBITA 350.2 (55.9) 294.3Amortisation of acquired intangibles (33.9) - (33.9)
Profit before interest & income tax EBIT 316.3 (55.9) 260.4Interest (50.1) - (50.1)
Profit before tax PBT 266.2 (55.9) 210.3Tax benefit / (expense) (52.3) 15.0 (37.3)
Net profit after tax NPAT 213.9 (40.9) 173.0Add back: Amortisation of acquired intangibles 33.9
Less: Tax effect of amortisation of acquired intangibles (11.0)
Net profit after tax & before amortisation of acquired intangibles NPATA 236.8Weighted average number of shares on issue 1,172,331,924
Basic earnings per share EPS 18.2 14.8Basic earnings per share before amortisation of acquired intangibles EPSA 20.2
The material contained in this document is a presentation of information about the Group’s activities current at the date of the presentation, 13 February 2018. It is provided in summary form and does not purport to be complete. It should be read in conjunction with the Group’s periodic reporting and other announcements lodged with the Australian Securities Exchange (ASX).
To the extent that this document may contain forward-looking statements, such statements are not guarantees or predictions of future performance, and involve known and unknown risks, uncertainties and other factors, many of which are beyond our control, and which may cause actual results to differ materially from those expressed in the statements contained in this release.
This document is not intended to be relied upon as advice to investors or potential investors and does not take into account the investment objectives, financial situation or needs of any particular investor.
Disclaimer
70
For
per
sona
l use
onl
y