braf v600e mutation detection using high resolution probe ... · 7 braf v600e mutation detection...
TRANSCRIPT

7
BRAF V600E Mutation Detection Using High Resolution Probe Melting Analysis
Jennifer E. Hardingham1,2, Ann Chua1, Joseph W. Wrin1, Aravind Shivasami1, Irene Kanter1,
Niall C. Tebbutt3 and Timothy J. Price1,2 1The Queen Elizabeth Hospital, Adelaide, SA, 5011
2University of Adelaide, SA, 5005 3Ludwig Institute for Cancer Research, Austin Health, Melbourne, VIC, 3084
Australia
1. Introduction
Activation of oncogenic proteins is an important mechanism in carcinogenesis. The BRAF
gene, located on chromosome 7q34, encodes a serine-threonine kinase that acts downstream
of RAS in the RAS/RAF/MEK/ERK signaling pathway involved in regulating cell
proliferation and survival. On activation of RAS, the BRAF kinase is activated and
sequentially phosphorylates and activates MEK and ERK. A mutation in BRAF leads to
constitutive hyperactivation of this pathway through evasion of the inhibitory feedback loop
resulting in increased ERK signaling output which drives proliferative and anti-apoptotic
signaling (Pratilas et al. 2009). Mutations in BRAF have been reported to occur at high
frequency (66%) in melanoma with lower frequencies in colon and other tumours (Davies et
al. 2002); BRAF is thus considered to be an important therapeutic target in melanoma
(Bollag et al. 2010; Flaherty et al. 2010; Paraiso et al. 2011). Although over 30 single site
missense mutations have been identified, 90% occur at nucleotide 1799 resulting in a T-A
transition and an amino acid substitution at residue 600 (V600E) in the activation segment
(Wan et al. 2004).
In colorectal cancer (CRC) mutations in BRAF have been found in about 9-12% of tumours
overall (Di Nicolantonio et al. 2008); (Deng et al. 2004; Jensen et al. 2008). However there is a
distinct difference in frequency of BRAF mutations between mismatch repair (MMR)
deficient (the microsatellite unstable (MSI-H) tumours) and the mismatch repair intact,
microsatellite stable (MSS) tumours (Jensen et al. 2008). This is important clinically as
tumours that are MSI-H have a better prognosis (Popat, Hubner, and Houlston 2005). BRAF
is mutated in almost all sporadic CRCs with MSI-H (Jensen et al. 2008) but not in tumours
arising in patients with an inherited form of MMR deficiency, hereditary nonpolyposis
colon cancer (HNPCC), known as Lynch syndrome. Thus a major indication for BRAF
mutation testing is for a differential diagnosis of Lynch Syndrome in a CRC that is MSI-H. If
BRAF is mutated, the tumour is more likely to be sporadic, rather than the heritable type
(Sharma and Gulley 2010).
www.intechopen.com

Polymerase Chain Reaction
144
Mutated BRAF has also been associated with non response to anti-EGFR monoclonal antibody therapy (cetuximab or panitumamab) in metastatic CRC (mCRC) patients (Cappuzzo et al. 2008). In a larger study it was reported that 0/11 patients with a BRAF mutation responded to cetuximab or panitumumab, conversely none of the responders carried BRAF mutations (Di Nicolantonio et al. 2008). BRAF mutation has also been found to be a prognostic factor for poorer outcome in mCRC (Di Nicolantonio et al. 2008); (Price et al. 2011); (Samowitz et al. 2005); (Saridaki et al. 2010); (Souglakos et al. 2009; Tol, Nagtegaal, and Punt 2009); (Van Cutsem et al. 2011).
Although PCR-sequencing to detect BRAF mutations has been the gold standard technique, the improvement in instrumentation for high resolution analysis of PCR amplicon melt curves has opened up the way for the detection of single-base changes in short (approximately 100-200 bp) amplicons (Wittwer et al. 2003). Subsequently an improved method was developed, using melt curve analysis of an oligo-probe, annealing across the region of the mutation (Zhou et al. 2004). As the BRAF mutation is a class IV (T-A) change, we opted for this improved method using commercially available primer and probe sequences. Here we describe the optimisation and validation of this technique for the detection of the BRAF V600E mutation in formalin-fixed paraffin-embedded (FFPE) colorectal tumour tissue and, using the Kaplan-Meier method, the impact of this mutation on survival in the study cohort.
2. Materials and methods
2.1 Tumour collection and processing
Patient samples were obtained from the MAX phase III clinical trial colorectal tumour cohort, described in Price et al. (Price et al. 2011). The MAX study design and eligibility criteria have been reported previously (Tebbutt et al. 2010). Eligible patients were enrolled in this trial between July 2005 and June 2007. After enrollment, patients were randomly assigned to receive capecitabine (C), capecitabine and bevacizumab (CB), and capecitabine, bevacizumab and mitomycin C (CBM). Patient demographic and clinical characteristics are shown in Table 1. Patients in these three groups were evaluated for tumour response or progression every 6 weeks by means of radiologic imaging. Treatment was continued until the disease progressed or until the patient could not tolerate the toxic effects. Samples of tumour tissue from archived FFPE specimens collected at the time of diagnosis were retrieved from storage at participating hospital pathology departments. All patients participating in biomarker studies provided written informed consent at the time of study enrolment. Ethics approval was obtained centrally (Ethics Committee, Cancer Institute of NSW, Australia).
2.2 DNA extraction
DNA was extracted from 1-2 FFPE tissue sections (10 μm) mounted on plain glass slides,
with an adjacent section stained with haematoxylin and eosin for reference. In cases that
were deemed to have <50% presence of malignant crypts in the section (reviewed by a
histopathologist), the tissue was manually dissected to ensure a high proportion of tumour
cells. We used a single 10 μm section unless the size of the tissue section was <1 cm, in
which case 2 10 μm sections were used. Paraffin was removed by xylene and DNA extracted
www.intechopen.com

BRAF V600E Mutation Detection Using High Resolution Probe Melting Analysis
145
using the QIAamp DNA FFPE tissue kit (Qiagen, Valencia, CA, USA), according to the
manufacturer's protocol. DNA was quantified using the Nanodrop (Thermo Scientific,
Wilmington, DE, USA), ensuring the ratio 260/280 was >1.7.
Baseline characteristic All patients (%)
(n=471) BRAF MUT (%) (n=33)
BRAF WT (%) (n=280) P
Age (years) Median 67 71 68 0.27 Range 32-86 36-85 32-86 Sex Male 63 58 64 0.47 ECOG performance status 0-1 94 88 94 0.11 2 6 12 6 Capecitabine dosage 2000mg/m2/day 67 60 68 0.38 Disease-free interval > 12 months 27 18 30 0.17 Prior adjuvant chemotherapy 22 9 23 0.06 Prior Radiotherapy 13 6 10 0.47 Primary site of cancer Caecum 10 21 9 0.02 Ascending colon 10 24 11 0.04 Transverse colon 6 15 5 0.02 Descending colon 3 6 4 0.48 Sigmoid colon 30 18 32 0.11 Recto-sigmoid colon 11 3 13 0.1 Rectum 23 6 22 0.03 Primary tumour resected 79 91 86 0.47 Any metastases resected 10 3 9 0.23 Extent of disease at baseline Local disease (colon or rectum) 36 15 33 0.03 Liver metastases 75 62 75 0.19 Lymph node metastases 47 59 45 0.09 Lung metastases 39 21 41 0.03 Bone metastases 4 0 4 0.23 Peritoneal metastases 18 21 16 0.49 Other metastases 10 24 10 0.01
Table 1. Patient demographic and clinical characteristics (Reproduced with permission from the Journal of Clinical Oncology).
www.intechopen.com

Polymerase Chain Reaction
146
2.3 Mutation analyses
Mutation status of BRAF was determined using high resolution melting analysis (HRM)
PCR on the Rotorgene 6000 real-time instrument (Qiagen). BRAF HRM PCR (119 bp
amplicon) was performed on 10 ng DNA in triplicate reactions using SsoFast™ EvaGreen®
Supermix (Bio-Rad Laboratories Inc., Hercules, USA) and a primer/probe combination
(RaZor® probe HRM assay, PrimerDesign, Southampton, UK). The sequences were
5'ATGAAGACCTCACAGTAAAAATAGG (sense), CTCAATTCTTACCATCCACAAAATG
(antisense) and 5'GTGAAATCTGGATGGAGTGGGTCCCATCA (probe). Appropriate
mutant and wild type (WT) controls were included. A 'touch-down' PCR cycling protocol
was used for the first 9 cycles to avoid primer mis-priming events and, due to the
asymmetric design, 50 cycles were performed according to the manufacturer's protocol. The
sensitivity of detection of mutant sequences was determined by assaying dilutions (100%,
50%, 25%, 12.5%, 6.25%) of a tumour DNA sample, with known homozygous BRAF
mutation status, in BRAF WT cell line DNA. Using the Rotor Gene 6000 (Qiagen) software
analysis features for HRM, patient samples (n=315) were classified as having mutated
(MUT) or WT BRAF respectively. Direct PCR sequencing was used to validate all mutant
BRAF results and an additional 106 randomly chosen samples (45% of samples in total). The
primers for BRAF sequencing reactions were designed in-house and obtained commercially
(Geneworks, Thebarton, SA, Australia): 5'AATGCTTGCTCTGATAGGAAAA (sense) and
5'AGTAACTCAGCAGCATCTCAGG (antisense). PCR products were purified using
ExoSAP-IT (GE Healthcare, Buckinghamshire, UK) to remove unwanted deoxynucleotides
and primers according to the manufacturer's protocol. Sequencing was performed by
Flinders Sequencing Facility (Flinders Medical Centre, Bedford Park, SA, Australia) using
BigDye Terminator v3.1 chemistry and the Applied Biosystems 3130xl Genetic Analyser
(Life Technologies, Carlsbad, CA, USA).
2.4 Statistical analyses
All randomly assigned patients for whom data on BRAF mutation status were available
were included in the analysis (n=313). PFS, the primary endpoint, was defined as the time
from randomisation until documented evidence of disease progression, the occurrence of
new disease or death from any cause. The secondary endpoint was overall survival (OS),
defined as the time from randomisation until death from any cause. The PFS and OS of
patients according to BRAF status were summarised with the use of Kaplan–Meier curves,
and the difference between these groups was compared with the use of the log-rank test. All
reported P values were two-sided.
3. Results and discussion
Although significantly less DNA was isolated from the microdissected sections (P=0.0001),
the range of values obtained overall, 60 ng -31.3 µg, meant that all samples were well within
the amount required for the PCR (30 ng) (Figure 1).
In interpreting the HRM results, the first criterion of robust PCR amplification must be met
(Figure 2A), so that the duplicates must show close Ct values (standard deviation <0.5)
otherwise samples must be excluded from the HRM analysis and the PCR repeated.
www.intechopen.com

BRAF V600E Mutation Detection Using High Resolution Probe Melting Analysis
147
Samples that show poor amplification with late Ct values may give erroneous results on
HRM as shown in Figure 2B. The samples in the boxed area need to be excluded from the
analysis to avoid misinterpretation of the difference plot as mutant calls. The poor
amplification of a DNA sample may be due to the presence of inhibitors, and we have found
that subsequent isolation of DNA from microdissected sections gave much better, more
reproducible amplification results. This also suggests that minimising the amount of
paraffin in the DNA preparation may be contributing to the improvement in PCR
performance.
whole sections microdissected0.01
0.1
1
10
100
DN
A (
µg
)
Fig. 1. Dot plot of DNA yields. The average amount of DNA obtained from whole sections was 6.5±0.25 μg and from manually microdissected sections 4.2±0.48 μg.
The positioning of the normalisation regions 1 and 2 in the first HRM analysis window is
also a very important parameter in the correct calling of genotypes. This is user-defined and
performed separately for HRM analysis of the probe region or the amplicon region. The
correct positioning may be determined by monitoring the normalised graph to show the
best separation of mutant versus WT curves.
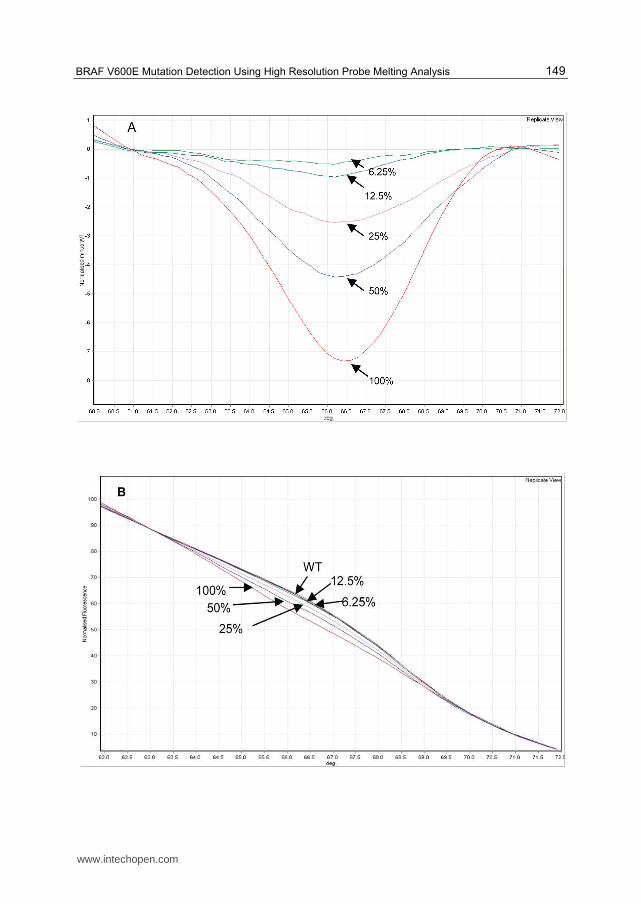
To determine the level of sensitivity of detection, serial doubling dilutions of a tumour
sample carrying a homozygous BRAF V600E mutation were tested. The difference graph,
normalised to the WT control, shows that the mutation could be detected down to a dilution
of 6.25% mutant DNA in WT DNA (Figure 3A). Although there is a distinct difference
between the WT control used for normalisation and the 6.25% and 12.5% dilutions, in
practice the software cannot call these with any confidence. From the normalised graph and
the melt curves graph (Figure 3B and 3C), 25% mutant DNA appears to be the lower limit of
detection. However to increase the probability of correctly assigning a genotype we aimed
for at least 50% epithelial tumour cells, hence all of the tumour tissue in the cohort was
reviewed to ensure at least 50% epithelial tumour cells were present. Manual
microdissection was performed in 1/5 of the cohort to ensure >50% enrichment of tumour
cells, relative to muscularis mucosa and other cell types such as lymphoid aggregates, in the
sample.
www.intechopen.com

Polymerase Chain Reaction
148
Fig. 2. A: amplification curves; B: difference plot normalised to WT. The boxed curves in A show samples with aberrant late amplification. The same samples boxed in B show the abnormal difference plots that could be incorrectly interpreted as mutant. Black arrow in B points to the heterozygous mutant control, red arrow shows the homozygous mutant control.
www.intechopen.com
BRAF V600E Mutation Detection Using High Resolution Probe Melting Analysis
149
www.intechopen.com

Polymerase Chain Reaction
150
Fig. 3. A: Difference plot normalised to WT, with dilutions of homozygous MUT control DNA in WT DNA shown in replicate view (average of 3 for each dilution). Arrows indicate the plots for the dilutions of MUT control DNA in WT DNA from 100% MUT to 6.25%MUT; B: Normalised melting curves of the probe region. From this view it was not possible to distinguish the 12.5% or 6.25% dilutions of mutant sequence from WT; C: Melt curve showing Tm's for both the probe region and amplicon. The probe region HRM analysis was much easier to interpret than the amplicon HRM, however the 12.5% and 6.25%dilutions were indistinguishable from WT pattern.
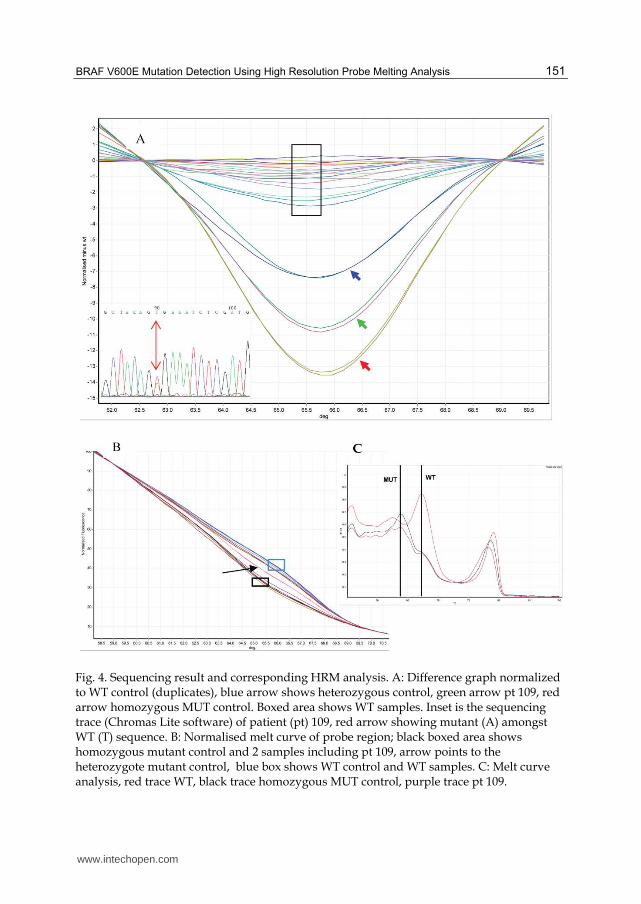
We have found that it was of critical importance to select the control genotypes (WT or mutant) for the normalisation carefully. The DNA of these controls needed to be extracted from a similar tissue (i.e. colonic tissue FFPE), and be processed in exactly the same way as the test samples. Using cell line derived DNA as the controls resulted in too many mutation calls with low confidence (false positives), however when we used tumour samples of known BRAF status as the controls, the confidence of the software calls of the test samples reached >99%. Often we found it was more informative to look at the shape of the curves in the difference plot, even if a curve deflected away from the horizontal normalised line, the angle of deflection was much greater for mutant genotypes and shallower for WT (Figure 4). This visual interpretation usually correlated with the software calls and was a useful adjunct in interpretation where the confidence of the software calls was low.
Sequencing was used to validate the results and correlated with the HRM results. In some
cases though sequencing showed a very small A peak which could be overlooked whereas
HRM showed a very convincing shift and was called as a mutation with 99% confidence. An
example is shown in Figure 5.
www.intechopen.com
BRAF V600E Mutation Detection Using High Resolution Probe Melting Analysis
151
Fig. 4. Sequencing result and corresponding HRM analysis. A: Difference graph normalized to WT control (duplicates), blue arrow shows heterozygous control, green arrow pt 109, red arrow homozygous MUT control. Boxed area shows WT samples. Inset is the sequencing trace (Chromas Lite software) of patient (pt) 109, red arrow showing mutant (A) amongst WT (T) sequence. B: Normalised melt curve of probe region; black boxed area shows homozygous mutant control and 2 samples including pt 109, arrow points to the heterozygote mutant control, blue box shows WT control and WT samples. C: Melt curve analysis, red trace WT, black trace homozygous MUT control, purple trace pt 109.
www.intechopen.com

Polymerase Chain Reaction
152
Fig. 5. An example of a sequencing result (pt 269) called WT (T) by the sequencing software that did in fact show a small A peak. The difference plot of the HRM analysis (normalized to WT control) showed a definite downward shifted curve (green arrow) between the homozygous BRAF MUT control (red arrow) and the heterozygous control (blue arrow). The boxed curves show the WT samples.
Of 471 patients who underwent random assignment, a total of 315 tumour specimens (n=103
from the capecitabine group, n=111 from the CB group, and n=101 from the CBM group,
accounting for 66.9% of the total study population) were examined for BRAF mutation
status by HRM. BRAF V600E mutations were detected in 10.5% of 313 tumours (2 samples
were not evaluable). A proportion of samples were also genotyped using sequencing and
showed 100% correlation with the HRM result.
A total of 313 patients were included in the survival analysis with a median follow-up time
of 26.5 months (range, 0.4 to 37.6 months). There was no significant difference in PFS
between patients with WT tumours and those with mutated tumours. The median PFS was
4.5 months among the patients with V600E tumours as compared with 8.2 months among
those with WT tumours (HR: BRAF WT vs MUT, 0.80; 95% CI, 0.54 to 1.18; P=0.26). In
contrast, there was a significant difference in OS between patients with WT tumours and
those with V600E tumours. The median OS was 8.6 months among the patients with
mutated BRAF tumours as compared with 20.8 months among those with WT tumours (HR:
BRAF WT vs MUT, 0.49; 95% CI, 0.33 to 0.73; P=0.001) (Figure 6). BRAF status remained
prognostically significant after adjustment of pre-defined baseline prognostic factors
www.intechopen.com

BRAF V600E Mutation Detection Using High Resolution Probe Melting Analysis
153
including age, sex, ECOG performance status, inoperable local disease, and prior
chemotherapy (HR: BRAF WT vs MUT, 0.45; 95% CI, 0.30 to 0.68; P<0.0001).
Fig. 6. Kaplan-Meier analysis for overall survival comparing patients WT or MUT for BRAF . The curves are significantly different (P=0.001, log-rank test). Reproduced with permission from the Journal of Clinical Oncology.
4. Conclusion
HRM analysis is a useful fast technique to determine BRAF mutations using the platform of
real-time PCR. It is both reproducible and reliable provided the preceding guidelines are
followed and rigorous attention is given to the PCR performance as well as to the use of the
software analysis package. Here we have described how the technique can be applied to the
analysis of DNA extracted from archived FFPE tissue sections, which in many cases is the
only source of tumour tissue available for retrospective analyses. The survival analysis
showed that metastatic CRC patients with tumours carrying the V600E mutation had
significantly poorer overall survival outcomes compared to those without the mutation. This
HRM analysis could equally be applied to the assessment of tumours from patients
diagnosed with other diseases known to have a significant BRAF mutation rate.
www.intechopen.com

Polymerase Chain Reaction
154
5. References
Bollag, Gideon, Peter Hirth, James Tsai, Jiazhong Zhang, Prabha N. Ibrahim, Hanna Cho,
Wayne Spevak, Chao Zhang, Ying Zhang, Gaston Habets, Elizabeth A. Burton,
Bernice Wong, Garson Tsang, Brian L. West, Ben Powell, Rafe Shellooe, Adhirai
Marimuthu, Hoa Nguyen, Kam Y. J. Zhang, Dean R. Artis, Joseph Schlessinger, Fei
Su, Brian Higgins, Raman Iyer, Kurt D/'Andrea, Astrid Koehler, Michael Stumm,
Paul S. Lin, Richard J. Lee, Joseph Grippo, Igor Puzanov, Kevin B. Kim, Antoni
Ribas, Grant A. McArthur, Jeffrey A. Sosman, Paul B. Chapman, Keith T. Flaherty,
Xiaowei Xu, Katherine L. Nathanson, and Keith Nolop. 2010. Clinical efficacy of a
RAF inhibitor needs broad target blockade in BRAF-mutant melanoma. Nature 467
(7315):596-599.
Cappuzzo, F., M. Varella-Garcia, G. Finocchiaro, M. Skokan, S. Gajapathy, C. Carnaghi, L.
Rimassa, E. Rossi, C. Ligorio, L. Di Tommaso, A. J. Holmes, L. Toschi, G. Tallini, A.
Destro, M. Roncalli, A. Santoro, and P. A. Janne. 2008. Primary resistance to
cetuximab therapy in EGFR FISH-positive colorectal cancer patients. Br J Cancer 99
(1):83-89.
Davies, Helen, Graham R. Bignell, Charles Cox, Philip Stephens, Sarah Edkins, Sheila Clegg,
Jon Teague, Hayley Woffendin, Mathew J. Garnett, William Bottomley, Neil Davis,
Ed Dicks, Rebecca Ewing, Yvonne Floyd, Kristian Gray, Sarah Hall, Rachel Hawes,
Jaime Hughes, and Vivian Kosmidou. 2002. Mutations of the BRAF gene in human
cancer. Nature 417 (6892):949.
Deng, Guoren, Ian Bell, Suzanne Crawley, James Gum, Jonathan P. Terdiman, Brian A.
Allen, Brindusa Truta, Marvin H. Sleisenger, and Young S. Kim. 2004. BRAF
Mutation Is Frequently Present in Sporadic Colorectal Cancer with Methylated
hMLH1, But Not in Hereditary Nonpolyposis Colorectal Cancer. Clin Cancer Res 10
(1):191-195.
Di Nicolantonio, F., M. Martini, F. Molinari, A. Sartore-Bianchi, S. Arena, P. Saletti, S. De
Dosso, L. Mazzucchelli, M. Frattini, S. Siena, and A. Bardelli. 2008. Wild-type BRAF
is required for response to panitumumab or cetuximab in metastatic colorectal
cancer. J Clin Oncol 26 (35):5705-12.
Flaherty, Keith T., Igor Puzanov, Kevin B. Kim, Antoni Ribas, Grant A. McArthur, Jeffrey A.
Sosman, Peter J. O'Dwyer, Richard J. Lee, Joseph F. Grippo, Keith Nolop, and Paul
B. Chapman. 2010. Inhibition of Mutated, Activated BRAF in Metastatic Melanoma.
New England Journal of Medicine 363 (9):809-819.
Jensen, L. H., J. Lindebjerg, L. Byriel, S. Kolvraa, and D. G. Cruger. 2008. Strategy in clinical
practice for classification of unselected colorectal tumours based on mismatch
repair deficiency. Colorectal Disease 10 (5):490-497.
Paraiso, Kim H. T., Yun Xiang, Vito W. Rebecca, Ethan V. Abel, Y. Ann Chen, A. Cecilia
Munko, Elizabeth Wood, Inna V. Fedorenko, Vernon K. Sondak, Alexander R. A.
Anderson, Antoni Ribas, Maurizia Dalla Palma, Katherine L. Nathanson, John M.
Koomen, Jane L. Messina, and Keiran S. M. Smalley. 2011. PTEN Loss Confers
BRAF Inhibitor Resistance to Melanoma Cells through the Suppression of BIM
Expression. Cancer Research 71 (7):2750-2760.
Popat, S., R. Hubner, and R. S. Houlston. 2005. Systematic review of microsatellite instability
and colorectal cancer prognosis. J Clin Oncol 23 (3):609-18.
www.intechopen.com

BRAF V600E Mutation Detection Using High Resolution Probe Melting Analysis
155
Pratilas, Christine A., Barry S. Taylor, Qing Ye, Agnes Viale, Chris Sander, David B. Solit,
and Neal Rosen. 2009. V600EBRAF is associated with disabled feedback inhibition
of RAF-MEK signaling and elevated transcriptional output of the pathway.
Proceedings of the National Academy of Sciences 106 (11):4519-4524.
Price, T. J., J. E. Hardingham, C. K. Lee, A. Weickhardt, A. R. Townsend, J. W. Wrin, A.
Chua, A. Shivasami, M. M. Cummins, C. Murone, and N. C. Tebbutt. 2011. Impact
of KRAS and BRAF Gene Mutation Status on Outcomes From the Phase III AGITG
MAX Trial of Capecitabine Alone or in Combination With Bevacizumab and
Mitomycin in Advanced Colorectal Cancer. J Clin Oncol 29 (19):2675-82.
Samowitz, W. S., C. Sweeney, J. Herrick, H. Albertsen, T. R. Levin, M. A. Murtaugh, R. K.
Wolff, and M. L. Slattery. 2005. Poor survival associated with the BRAF V600E
mutation in microsatellite-stable colon cancers. Cancer Res 65 (14):6063-9.
Saridaki, Z., D. Papadatos-Pastos, M. Tzardi, D. Mavroudis, E. Bairaktari, H. Arvanity, E.
Stathopoulos, V. Georgoulias, and J. Souglakos. 2010. BRAF mutations,
microsatellite instability status and cyclin D1 expression predict metastatic
colorectal patients' outcome. Br J Cancer 102 (12):1762-8.
Sharma, Shree G., and Margaret L. Gulley. 2010. BRAF Mutation Testing in Colorectal
Cancer. Archives of Pathology & Laboratory Medicine 134 (8):1225-1228.
Souglakos, J., J. Philips, R. Wang, S. Marwah, M. Silver, M. Tzardi, J. Silver, S. Ogino, S.
Hooshmand, E. Kwak, E. Freed, J. A. Meyerhardt, Z. Saridaki, V. Georgoulias, D.
Finkelstein, C. S. Fuchs, M. H. Kulke, and R. A. Shivdasani. 2009. Prognostic and
predictive value of common mutations for treatment response and survival in
patients with metastatic colorectal cancer. Br J Cancer 101 (3):465-72.
Tebbutt, N. C., K. Wilson, V. J. Gebski, M. M. Cummins, D. Zannino, G. A. van Hazel, B.
Robinson, A. Broad, V. Ganju, S. P. Ackland, G. Forgeson, D. Cunningham, M. P.
Saunders, M. R. Stockler, Y. Chua, J. R. Zalcberg, R. J. Simes, and T. J. Price. 2010.
Capecitabine, bevacizumab, and mitomycin in first-line treatment of metastatic
colorectal cancer: results of the Australasian Gastrointestinal Trials Group
Randomized Phase III MAX Study. J Clin Oncol 28 (19):3191-8.
Tol, J., I. D. Nagtegaal, and C. J. Punt. 2009. BRAF mutation in metastatic colorectal cancer.
N Engl J Med 361 (1):98-9.
Van Cutsem, E., C. H. Kohne, I. Lang, G. Folprecht, M. P. Nowacki, S. Cascinu, I.
Shchepotin, J. Maurel, D. Cunningham, S. Tejpar, M. Schlichting, A. Zubel, I. Celik,
P. Rougier, and F. Ciardiello. 2011. Cetuximab Plus Irinotecan, Fluorouracil, and
Leucovorin As First-Line Treatment for Metastatic Colorectal Cancer: Updated
Analysis of Overall Survival According to Tumor KRAS and BRAF Mutation
Status. J Clin Oncol 29 (15):2011-9.
Wan, Paul T. C., Mathew J. Garnett, S. Mark Roe, Sharlene Lee, Dan Niculescu-Duvaz,
Valerie M. Good, Cancer Genome Project, C. Michael Jones, Christopher J.
Marshall, Caroline J. Springer, David Barford, and Richard Marais. 2004.
Mechanism of Activation of the RAF-ERK Signaling Pathway by Oncogenic
Mutations of B-RAF. Cell 116 (6):855-867.
Wittwer, Carl T., Gudrun H. Reed, Cameron N. Gundry, Joshua G. Vandersteen, and Robert
J. Pryor. 2003. High-Resolution Genotyping by Amplicon Melting Analysis Using
LCGreen. Clin Chem 49 (6):853-860.
www.intechopen.com

Polymerase Chain Reaction
156
Zhou, Luming, Alexander N. Myers, Joshua G. Vandersteen, Lesi Wang, and Carl T.
Wittwer. 2004. Closed-Tube Genotyping with Unlabeled Oligonucleotide Probes
and a Saturating DNA Dye. Clin Chem 50 (8):1328-1335.
www.intechopen.com
Polymerase Chain ReactionEdited by Dr Patricia Hernandez-Rodriguez
ISBN 978-953-51-0612-8Hard cover, 566 pagesPublisher InTechPublished online 30, May, 2012Published in print edition May, 2012
InTech EuropeUniversity Campus STeP Ri Slavka Krautzeka 83/A 51000 Rijeka, Croatia Phone: +385 (51) 770 447 Fax: +385 (51) 686 166www.intechopen.com
InTech ChinaUnit 405, Office Block, Hotel Equatorial Shanghai No.65, Yan An Road (West), Shanghai, 200040, China
Phone: +86-21-62489820 Fax: +86-21-62489821
This book is intended to present current concepts in molecular biology with the emphasis on the application toanimal, plant and human pathology, in various aspects such as etiology, diagnosis, prognosis, treatment andprevention of diseases as well as the use of these methodologies in understanding the pathophysiology ofvarious diseases that affect living beings.
How to referenceIn order to correctly reference this scholarly work, feel free to copy and paste the following:
Patricia Hernandez-Rodriguez and Arlen Gomez Ramirez (2012). Polymerase Chain Reaction: Types, Utilitiesand Limitations, Polymerase Chain Reaction, Dr Patricia Hernandez-Rodriguez (Ed.), ISBN: 978-953-51-0612-8, InTech, Available from: http://www.intechopen.com/books/polymerase-chain-reaction/polymerase-chain-reaction-types-utilities-and-limitations

© 2012 The Author(s). Licensee IntechOpen. This is an open access articledistributed under the terms of the Creative Commons Attribution 3.0License, which permits unrestricted use, distribution, and reproduction inany medium, provided the original work is properly cited.