brandywine road speed study final report - … · 2017-01-27 · brandywine road speed study final...
TRANSCRIPT

Brandywine Road
Speed Study
FINAL REPORT
City of Albuquerque
Brandywine Road Speed Study
Final Report
Albuquerque, New Mexico
City of Albuquerque
May, 2016
Brandywine Road Speed Study
Final Report City of Albuquerque – Department of Municipal Development
Page | i
Table of Contents
1. INTRODUCTION ................................................................................................................................................................. 1
1.A. PROJECT PURPOSE ...................................................................................................................................................... 1
1.B. PROJECT DESCRIPTION ............................................................................................................................................... 1
1.C. BACKGROUND OF SPEED LIMITS ................................................................................................................................ 3
1.D. SETTING SPEED LIMITS ................................................................................................................................................ 3
2. EXISTING CONDITIONS .................................................................................................................................................... 5
2.A. COUNT LOCATIONS ....................................................................................................................................................... 5
2.B. EXISTING CONDITIONS ................................................................................................................................................. 5
3. DATA ................................................................................................................................................................................... 7
3.A. AADT ................................................................................................................................................................................ 7
3.B. SPEED STUDY RESULTS ............................................................................................................................................... 7
3.C. CRASH DATA .................................................................................................................................................................. 8
4. U.S. LIMITS SPEED LIMITS PROGRAM ............................................................................................................................ 8
5. CONCLUSION ..................................................................................................................................................................... 9
Appendices ............................................................................................................................................................................ 10
Brandywine Road Speed Study
Final Report City of Albuquerque – Department of Municipal Development
Page | ii
List of Tables
Table 3.A.1. Brandywine ADT.............................................................................................................................................. 7
Table 3.B.1. Brandywine East Speed Study ........................................................................................................................ 7
Table 3.B.2. Brandywine North Speed Study....................................................................................................................... 7
Table 3.B.3. Brandywine ADT ≥ 25 mph .......................................................................................................................................... 8
Table 5.1. COA NMTP Traffic Calming Measures ....................................................................................................................... 9

Brandywine Road Speed Study
Final Report City of Albuquerque – Department of Municipal Development
Page | iii
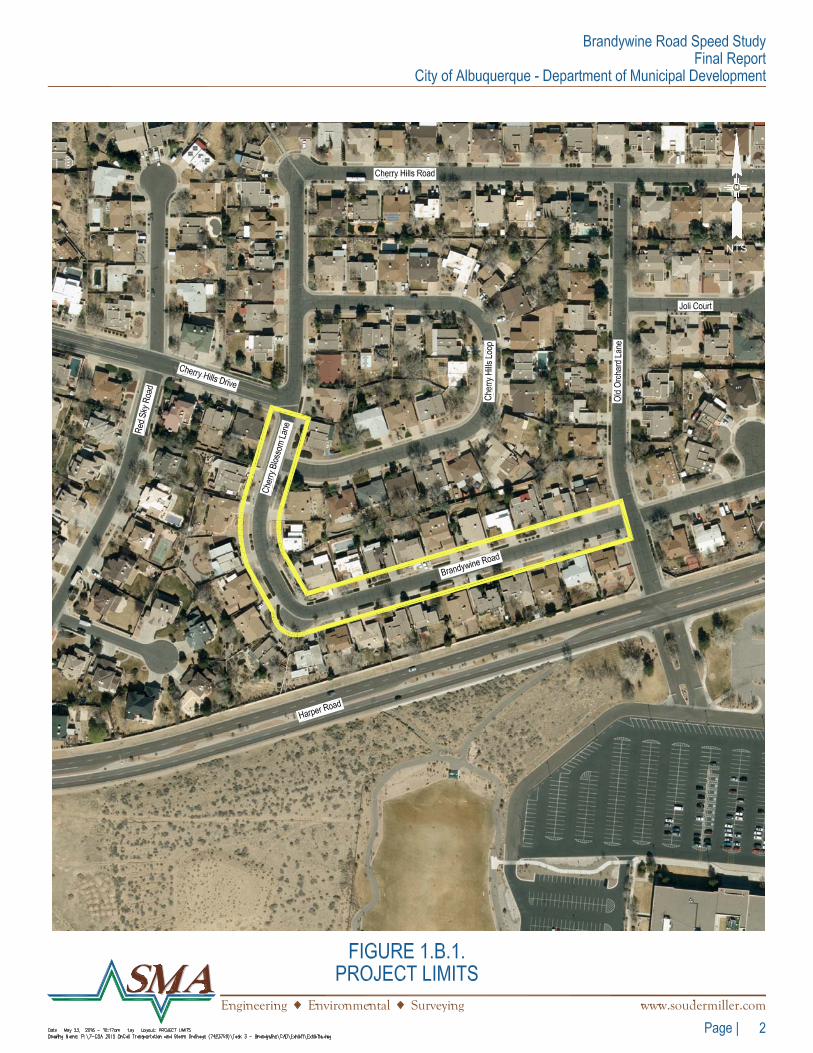
List of Figures FIGURE 1.B.1. PROJECT LIMITS ........................................................................................................................................ 2
FIGURE 2.1. COUNT LOCATIONS ................................................................................................................................... 6
FIGURE 2.2. EXISTING TYPICAL SECTION .................................................................................................................... 6

Brandywine Road Speed Study
Final Report City of Albuquerque – Department of Municipal Development
Page | 1
1. INTRODUCTION The City of Albuquerque – Department of Municipal Development (Traffic Engineering Design Division) has requested
that Souder, Miller & Associates conduct at speed study along Brandywine Road in northeast Albuquerque.
1.A. PROJECT PURPOSE
A speed study on Brandywine Road and Cherry Blossom Lane was conducted to determine the following:
Evaluate the 85th percentile speed along Brandywine Lane at two (2) locations
Calculate average and daily peak hour traffic volumes from Brandywine Road
As part of this study, an evaluation and cataloging of existing roadway conditions, collection of historical ADT and crash data, and evaluation of survey data will be completed.
1.B. PROJECT DESCRIPTION
The project area will be a 0.22 mile section of Brandywine Road and Cherry Blossom Lane between Cherry Hills Drive and Old Orchard Lane, ending at Cherry Hills Drive and Old Orchard Lane. Figure 1.B.1. on page 2 displays the project limits.
Brandywine Road Speed Study
Final Report City of Albuquerque – Department of Municipal Development
Page | 3
1.C. BACKGROUND OF SPEED LIMITS
Speed limits are established on roadways of virtually all classifications, from interstate freeways to low volume local streets. The primary purpose of speed limits is to give motorists clear instruction as to what is a reasonable speed for them to drive at while traveling on a given roadway.
Among regulatory signage, speed limit signs arguably contain the most critical information that motorists need to be
informed of while driving (next to stop signs, which are considered the highest impact regulatory sign). Drivers unfamiliar with a roadway often do not realize what characteristics the roadway has, and properly established speed limit signs give them the information they need to drive the roadway safely.
The NMDOT has guidelines for analyzing and establishing posted speed limits; the following text is based on one such
example:
Realistic posted speed limits are of public importance for many reasons:
They invite public compliance by conforming to the behavior or the driving majority
They give clear reminders of safe and reasonable speeds to non-conforming violators
They offer the most effective tool for law enforcement of safe driving
They will minimize public antagonism toward law enforcement that results from unreasonable regulations
Improperly, or artificially low, posted speed limits can cause problems for state and local agencies for several reasons:
They do not encourage voluntary compliance, since they do not reflect the behavior of the majority
They make the behavior of the majority unlawful
The maximize public antagonism toward law enforcement, since the perception is that the police are enforcing a “speed trap”
The create a bad image for a community in the eyes of tourists / visitors
1.D. SETTING SPEED LIMITS
In accordance with Section 66-7-303 of the New Mexico Criminal and Traffic Law Manual, the speed limit on state highways shall be set by the Cabinet Secretary of the Department of Transportation, based on an engineering survey and traffic investigation that includes the following parameters.
Spot speed studies (typically consisting of 100 vehicles)
Roadway geometry/number of lanes
Roadside environment and characteristics
Building setbacks (if within a commercial business district)
Driveway and intersection spacing/density
Historical crash data for the roadway study area
Many speed limits are established using the theory of 85th percentile. Out of the (typically) 100 vehicles surveyed, beginning with the fasted vehicle speed recorded the 15th vehicle from that speed is determined to show where the 85th percentile speed is. This is assuming that most drivers (85%) drive within reasonable limits. The posted speed limit can be established and is usually the 5 – mph increment just below the 85th percentile speed. For example, if the 85th percentile speed
Brandywine Road Speed Study
Final Report City of Albuquerque – Department of Municipal Development
Page | 4
has been determined by an engineering survey to be 57 mph, the posted speed would be 55 mph. This method of posting speed limits allows for a reasonable posted speed limit that can be enforced by local agencies, without creating a speed trap.
For surveys with a different amount than 100 vehicles, the 85th percentile speed is determined by the following formula:
100/15 = # of vehicles surveyed/X (where x = the vehicle at the 85th percentile). For example, a 50 vehicle survey would result in:
100
15=
50
𝑥
Where x = 7.5, or the 8th vehicle in the survey
Other methods are frequently used to further analyze the posting of speed limits – these are the mode, median, and geometric mean:
Mode is the most frequently clocked vehicle speed in a given survey. For example, in a 100 vehicle survey where 12 vehicles were clocked traveling 55 mph and no other speed was observed as frequently, the mode is 55 mph.
Median is the numerical midpoint of a given survey. For example, in a survey of 100 vehicles, the speeds of the 50th and 51st vehicles are added and divided by 2 to obtain the median speed. If the 50th vehicle of such a survey was traveling at 56 mph and the 51st vehicle was also traveling at 56 mph, the resulting median would be (56 + 56)÷2 = 112÷2 = 56 mph
Geometric mean is described as follows: “an average of a set of numbers that is calculated by multiplying all the numbers (“n”), and taking the nth root of the total.”
Formula for Geometric Mean:
𝐺𝑒𝑜𝑚𝑒𝑡𝑟𝑖𝑐 𝑀𝑒𝑎𝑛 = ((𝑋1)(𝑋2) … … . . (𝑋𝑛))1/𝑁 X = Individual score (speed)
N = Sample size (number of scores) Geometric Mean Example: Sample speeds = 51, 52, 55, 58, and 60 mph Step 1:
N = 5, the total number of values, 1
𝑁= 0.2
Step 2: Determine geometric mean using the formula.
𝐺𝑒𝑜𝑚𝑒𝑡𝑟𝑖𝑐 𝑀𝑒𝑎𝑛 = ((51)(52)(55)(58)(60))0.2 = 55.09 𝑚𝑝ℎ
In most cases, the geometric mean of a speed study will be of similar value of the median, often within 1 to 2 mph of either side of the median. In the above example, the median speed would be the third vehicle surveyed (55 mph), and the geometric mean is 55.09 mph.
Brandywine Road Speed Study
Final Report City of Albuquerque – Department of Municipal Development
Page | 5
2. EXISTING CONDITIONS
2.A. COUNT LOCATIONS
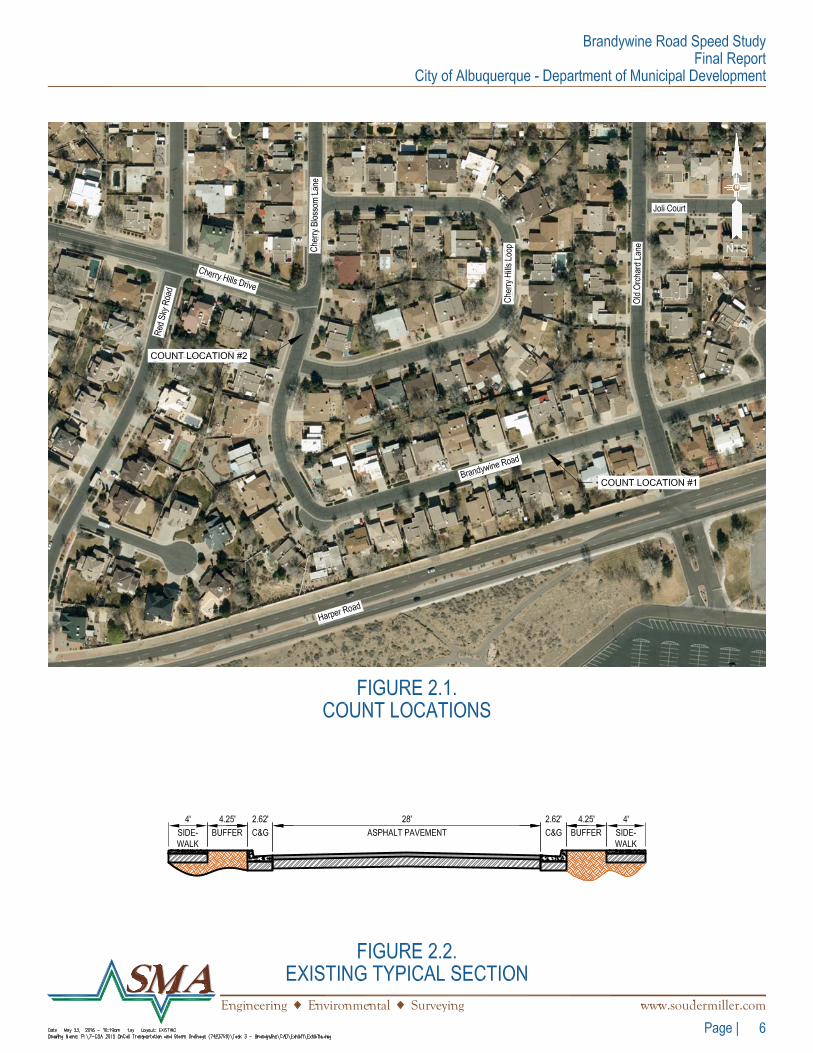
The study area included two traffic/speed count locations which were at the following locations:
Brandywine Road East
Brandywine Road North
Figure 2.1. on page 6 displays the traffic count locations.
2.B. EXISTING CONDITIONS
Figure 2.2. on page 6 displays the existing typical section of Brandywine Road and Cherry Blossom Lane.
Also to be noted is the BOP and EOP intersection are three-legged intersections. Near the EOP of the Cherry Blossom Lane / Cherry Hills Drive is the additional intersection of Cherry Blossom Lane / Cherry Hills Loop. There are 31 driveways within the project area which provide access to residential homes. Also between the BOP and EOP is an approximate right angle curve where Brandywine Road turns northbound to Cherry Blossom Lane.
Brandywine Road Speed Study
Final Report City of Albuquerque – Department of Municipal Development
Page | 7
3. DATA
3.A. AADT
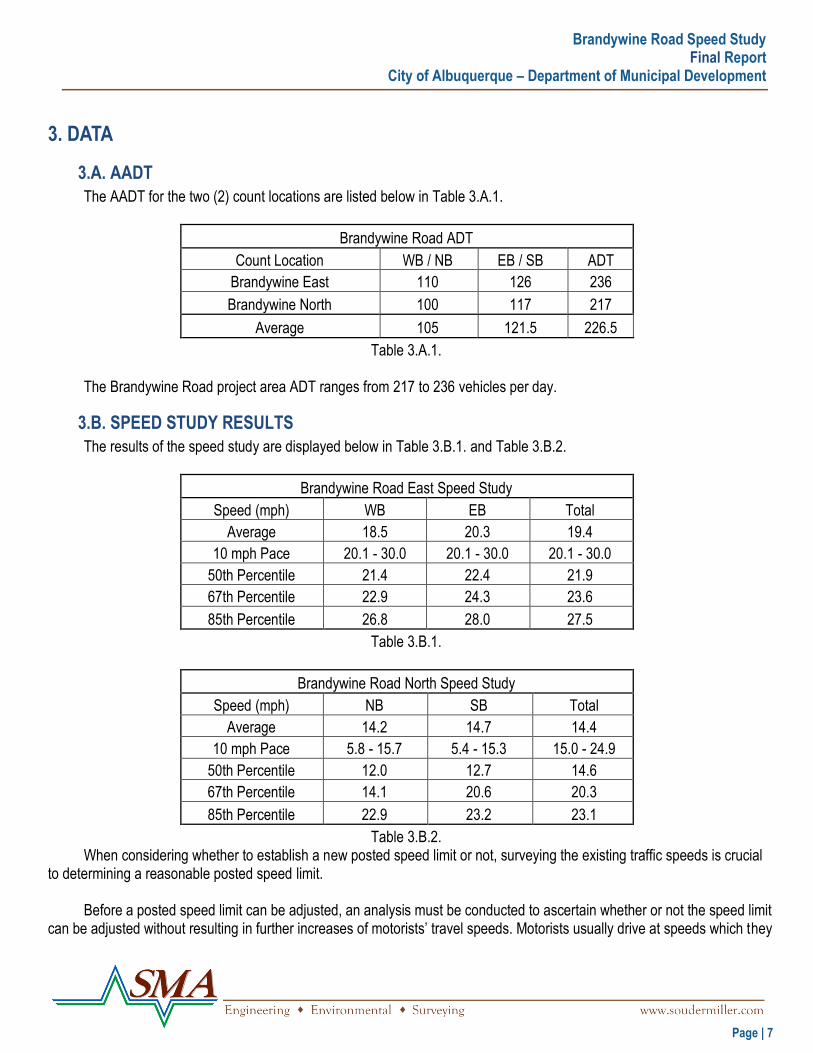
The AADT for the two (2) count locations are listed below in Table 3.A.1.
Brandywine Road ADT
Count Location WB / NB EB / SB ADT
Brandywine East 110 126 236
Brandywine North 100 117 217
Average 105 121.5 226.5
Table 3.A.1.
The Brandywine Road project area ADT ranges from 217 to 236 vehicles per day.
3.B. SPEED STUDY RESULTS
The results of the speed study are displayed below in Table 3.B.1. and Table 3.B.2.
Brandywine Road East Speed Study
Speed (mph) WB EB Total
Average 18.5 20.3 19.4
10 mph Pace 20.1 - 30.0 20.1 - 30.0 20.1 - 30.0
50th Percentile 21.4 22.4 21.9
67th Percentile 22.9 24.3 23.6
85th Percentile 26.8 28.0 27.5
Table 3.B.1.
Brandywine Road North Speed Study
Speed (mph) NB SB Total
Average 14.2 14.7 14.4
10 mph Pace 5.8 - 15.7 5.4 - 15.3 15.0 - 24.9
50th Percentile 12.0 12.7 14.6
67th Percentile 14.1 20.6 20.3
85th Percentile 22.9 23.2 23.1
Table 3.B.2. When considering whether to establish a new posted speed limit or not, surveying the existing traffic speeds is crucial
to determining a reasonable posted speed limit.
Before a posted speed limit can be adjusted, an analysis must be conducted to ascertain whether or not the speed limit can be adjusted without resulting in further increases of motorists’ travel speeds. Motorists usually drive at speeds which they

Brandywine Road Speed Study
Final Report City of Albuquerque – Department of Municipal Development
Page | 8
perceive as safe, based on the observable roadway conditions. A flat and straight roadway may result in a different travel speed than the posted speed limit due to the driver’s observation of the roadway condition.
In relation to Brandywine Road, the posted speed limit is 25 mph, roadway conditions are consistent; controlled
access, satisfactory pavement conditions, two travel lanes, and on-street parking. The only unusual roadway condition is a curve near the middle of the project area. Table 3.B.3 displays that 14 percent of the total ADT of the two count locations recorded speeds greater than the posted speed limit of 25 mph.
Brandywine Road ADT ≥ 25 mph
Speed (mph) 0 - 19.9 20 - 24.9 ≥ 25 Avg. ADT
Brandywine North 143 66 7.5 217
Brandwine East 83.5 92 54 230
Total 226.5 158 61.5 447
% Total 51% 35% 14% -
Table 3.B.3.
3.C. CRASH DATA
Crash data was requested form the Mid-Region Council of Governments. The crash data requested showed there was one recorded crash in 2011 within the project area at the corner of Brandywine Road and Cherry Blossom Lane which was a property damage only crash resulting from driver inattention and backing into a parked car.
4. U.S. LIMITS SPEED LIMITS PROGRAM U.S. Limits is an FHWA sponsored program used to analyze speed limits. This program calculates a recommended
speed limit based on the criteria given, which is listed on the website as follows:
Density of surrounding development (e.g. high density, low density, or rural);
Frequency of roadside access (e.g. number of residential driveways, commercial, industrial, shopping, and special activity properties, and the number and type of intersection roads);
Road function (e.g. traffic movement vs. access to abutting properties);
Road characteristics (e.g. paved width, divided or undivided, lane width, number and lanes, and sight restrictions);
Road conditions and important high speed road characteristics (e.g. interchange spacing, AADT, and shoulders);
Existing vehicle operating speeds;
Adjoining speed limits: and
Any special conditions that may exist on the road section (e.g. adverse alignment, pedestrian and roadside activities, high crash rates, etc.)
This analysis was used for Brandywine Road and based on the data entered into http://www.uslimits.com for the
above-listed categories, the program concluded that a 20 mph was warranted for the corridor. The output sheet is shown in
Brandywine Road Speed Study
Final Report City of Albuquerque – Department of Municipal Development
Page | 9
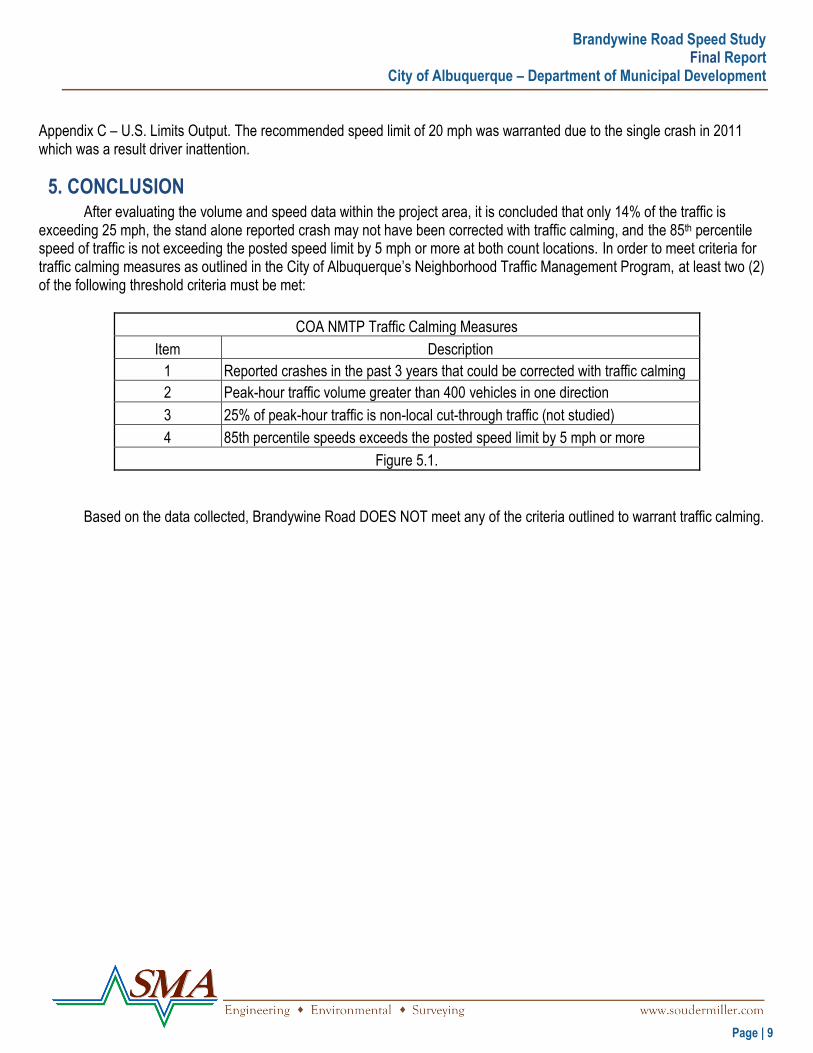
Appendix C – U.S. Limits Output. The recommended speed limit of 20 mph was warranted due to the single crash in 2011 which was a result driver inattention.
5. CONCLUSION After evaluating the volume and speed data within the project area, it is concluded that only 14% of the traffic is
exceeding 25 mph, the stand alone reported crash may not have been corrected with traffic calming, and the 85th percentile speed of traffic is not exceeding the posted speed limit by 5 mph or more at both count locations. In order to meet criteria for traffic calming measures as outlined in the City of Albuquerque’s Neighborhood Traffic Management Program, at least two (2) of the following threshold criteria must be met:
COA NMTP Traffic Calming Measures
Item Description
1 Reported crashes in the past 3 years that could be corrected with traffic calming
2 Peak-hour traffic volume greater than 400 vehicles in one direction
3 25% of peak-hour traffic is non-local cut-through traffic (not studied)
4 85th percentile speeds exceeds the posted speed limit by 5 mph or more
Figure 5.1.
Based on the data collected, Brandywine Road DOES NOT meet any of the criteria outlined to warrant traffic calming.

Brandywine Road Speed Study
Final Report City of Albuquerque – Department of Municipal Development
Page | 10
Appendices • Appendix A – USLIMITS2 Speed Zoning Report • Appendix B – Volume and Speed Data • Appendix C – Crash Data
Brandywine Road Speed Study
Final Report City of Albuquerque – Department of Municipal Development
Page | A 1
Appendix A
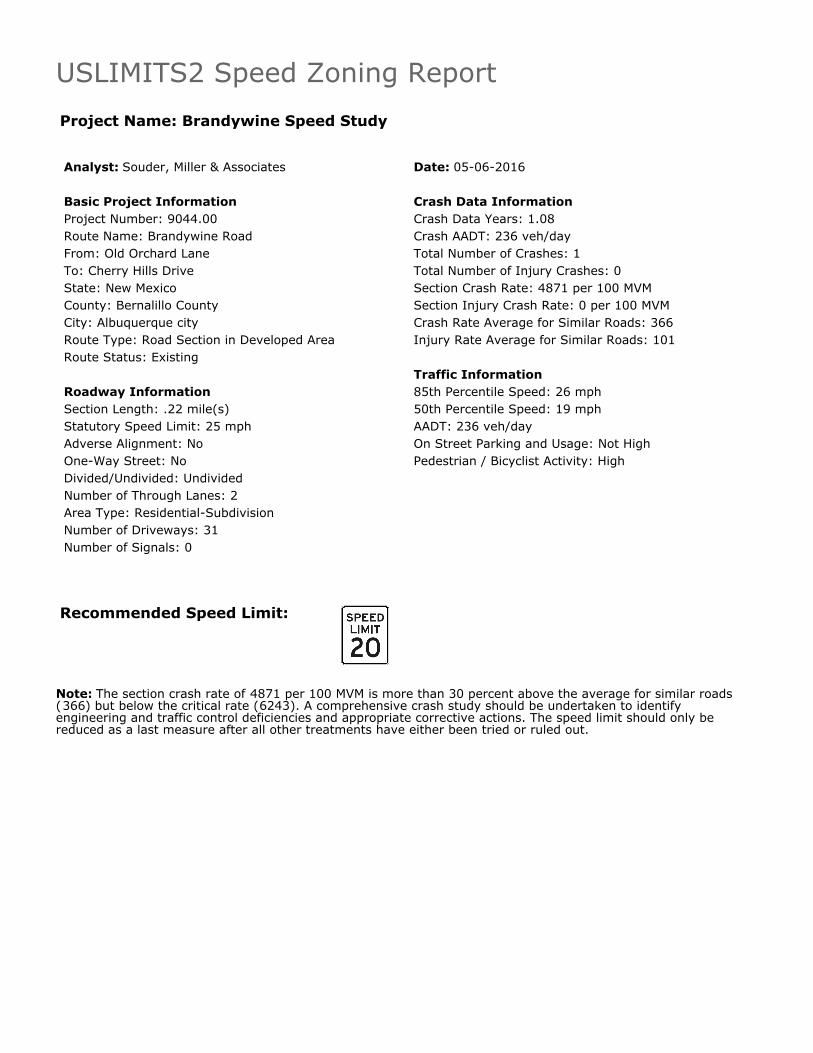
USLIMITS2 Speed Zoning ReportProject Name: Brandywine Speed Study Analyst: Souder, Miller & Associates Basic Project InformationProject Number: 9044.00Route Name: Brandywine RoadFrom: Old Orchard LaneTo: Cherry Hills DriveState: New MexicoCounty: Bernalillo CountyCity: Albuquerque cityRoute Type: Road Section in Developed AreaRoute Status: Existing Roadway Information Section Length: .22 mile(s)Statutory Speed Limit: 25 mphAdverse Alignment: NoOne-Way Street: NoDivided/Undivided: Undivided Number of Through Lanes: 2Area Type: Residential-SubdivisionNumber of Driveways: 31Number of Signals: 0
Date: 05-06-2016 Crash Data InformationCrash Data Years: 1.08Crash AADT: 236 veh/dayTotal Number of Crashes: 1Total Number of Injury Crashes: 0Section Crash Rate: 4871 per 100 MVMSection Injury Crash Rate: 0 per 100 MVMCrash Rate Average for Similar Roads: 366Injury Rate Average for Similar Roads: 101 Traffic Information85th Percentile Speed: 26 mph50th Percentile Speed: 19 mphAADT: 236 veh/dayOn Street Parking and Usage: Not HighPedestrian / Bicyclist Activity: High
Recommended Speed Limit:
Note: The section crash rate of 4871 per 100 MVM is more than 30 percent above the average for similar roads(366) but below the critical rate (6243). A comprehensive crash study should be undertaken to identifyengineering and traffic control deficiencies and appropriate corrective actions. The speed limit should only bereduced as a last measure after all other treatments have either been tried or ruled out.
Brandywine Road Speed Study
Final Report City of Albuquerque – Department of Municipal Development
Page | B 1
Appendix B
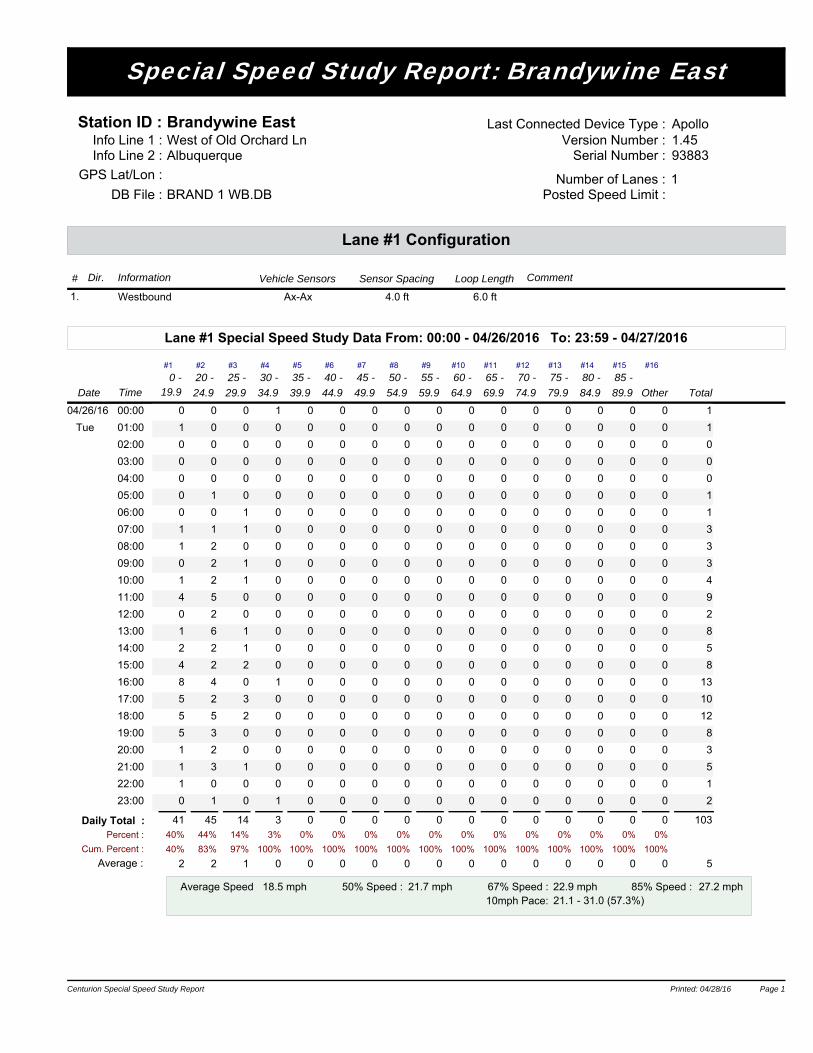
Special Speed Study Report: Brandywine East
Station ID : Brandywine EastInfo Line 1 : West of Old Orchard LnInfo Line 2 : Albuquerque
DB File : BRAND 1 WB.DBNumber of Lanes : 1
Posted Speed Limit :
938831.45ApolloLast Connected Device Type :
Version Number :Serial Number :
GPS Lat/Lon :
Lane #1 Configuration
# Dir. Vehicle SensorsInformation Sensor Spacing Loop Length Comment
1. Westbound Ax-Ax 4.0 ft 6.0 ft
Lane #1 Special Speed Study Data From: 00:00 - 04/26/2016 To: 23:59 - 04/27/2016
Date Time
#1 #2 #3 #5#4 #7#6 #8 #9 #10 #11 #12 #13 #16#15#14
Total
0 - 19.9
20 -
24.9
25 -
29.9
30 -
34.9
35 -
39.9
40 -
44.9
45 -
49.9
50 - 55 - 60 - 65 - 70 - 75 -
54.9 59.9 64.9 69.9 74.9 79.9 Other89.9
85 -
84.9
80 -
04/26/16 00:00 0 0 0 1 0 0 0 0 0 0 0 0 0 0 0 0 1
Tue 01:00 1 0 0 0 0 0 0 0 0 0 0 0 0 0 0 0 1
02:00 0 0 0 0 0 0 0 0 0 0 0 0 0 0 0 0 0
03:00 0 0 0 0 0 0 0 0 0 0 0 0 0 0 0 0 0
04:00 0 0 0 0 0 0 0 0 0 0 0 0 0 0 0 0 0
05:00 0 1 0 0 0 0 0 0 0 0 0 0 0 0 0 0 1
06:00 0 0 1 0 0 0 0 0 0 0 0 0 0 0 0 0 1
07:00 1 1 1 0 0 0 0 0 0 0 0 0 0 0 0 0 3
08:00 1 2 0 0 0 0 0 0 0 0 0 0 0 0 0 0 3
09:00 0 2 1 0 0 0 0 0 0 0 0 0 0 0 0 0 3
10:00 1 2 1 0 0 0 0 0 0 0 0 0 0 0 0 0 4
11:00 4 5 0 0 0 0 0 0 0 0 0 0 0 0 0 0 9
12:00 0 2 0 0 0 0 0 0 0 0 0 0 0 0 0 0 2
13:00 1 6 1 0 0 0 0 0 0 0 0 0 0 0 0 0 8
14:00 2 2 1 0 0 0 0 0 0 0 0 0 0 0 0 0 5
15:00 4 2 2 0 0 0 0 0 0 0 0 0 0 0 0 0 8
16:00 8 4 0 1 0 0 0 0 0 0 0 0 0 0 0 0 13
17:00 5 2 3 0 0 0 0 0 0 0 0 0 0 0 0 0 10
18:00 5 5 2 0 0 0 0 0 0 0 0 0 0 0 0 0 12
19:00 5 3 0 0 0 0 0 0 0 0 0 0 0 0 0 0 8
20:00 1 2 0 0 0 0 0 0 0 0 0 0 0 0 0 0 3
21:00 1 3 1 0 0 0 0 0 0 0 0 0 0 0 0 0 5
22:00 1 0 0 0 0 0 0 0 0 0 0 0 0 0 0 0 1
23:00 0 1 0 1 0 0 0 0 0 0 0 0 0 0 0 0 2
Daily Total : 0 0 0 0 0 0 0 0 0 0 0 0 10341 45 14 340% 44% 14% 3% 0% 0% 0% 0% 0% 0% 0% 0% 0% 0% 0% 0% Percent :
Cum. Percent :
Average :40% 83% 97% 100% 100% 100% 100% 100% 100% 100% 100% 100% 100% 100% 100% 100%
2 2 1 0 0 0 0 0 0 0 0 0 0 0 0 0 5
Average Speed 50% Speed : 67% Speed : 85% Speed : 18.5 mph 21.7 mph 22.9 mph 27.2 mph10mph Pace: 21.1 - 31.0 (57.3%)
Centurion Special Speed Study Report Printed: 04/28/16 Page 1Centurion Special Speed Study Report Printed: 04/28/16 Page 1
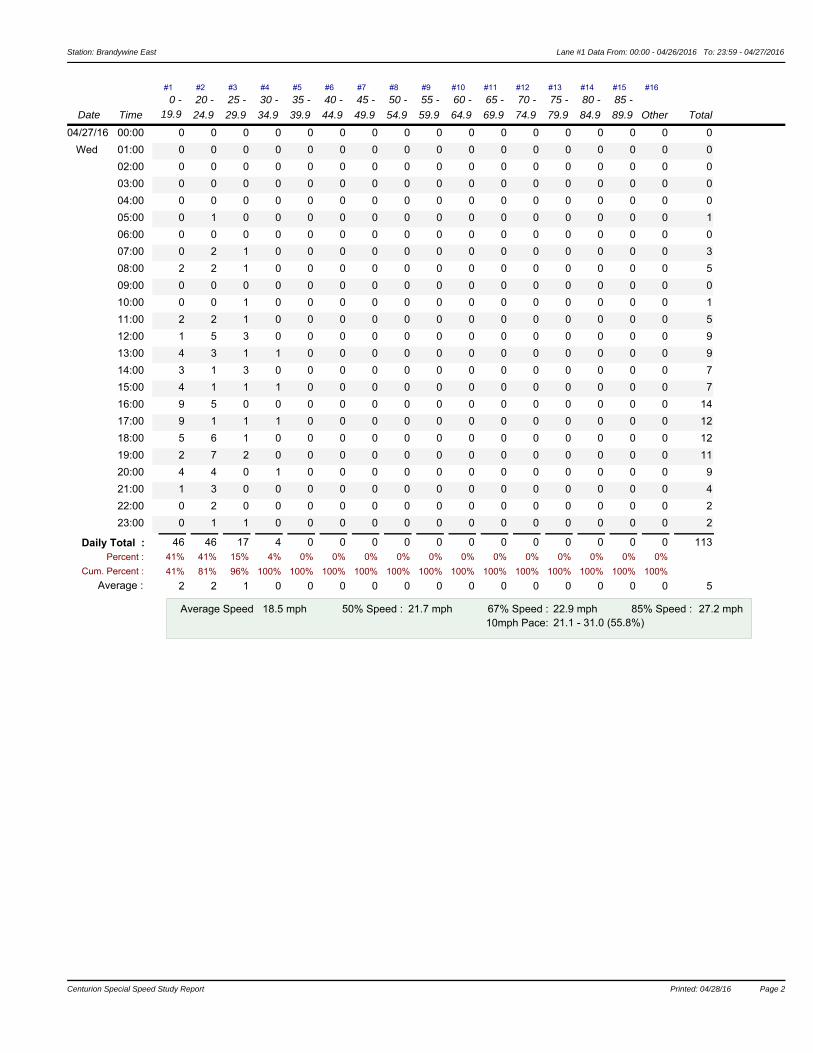
Station: Brandywine East Lane #1 Data From: 00:00 - 04/26/2016 To: 23:59 - 04/27/2016
Date Time
#1 #2 #3 #5#4 #7#6 #8 #9 #10 #11 #12 #13 #16#15#14
Total
0 - 19.9
20 -
24.9
25 -
29.9
30 -
34.9
35 -
39.9
40 -
44.9
45 -
49.9
50 - 55 - 60 - 65 - 70 - 75 -
54.9 59.9 64.9 69.9 74.9 79.9 Other89.9
85 -
84.9
80 -
04/27/16 00:00 0 0 0 0 0 0 0 0 0 0 0 0 0 0 0 0 0
Wed 01:00 0 0 0 0 0 0 0 0 0 0 0 0 0 0 0 0 0
02:00 0 0 0 0 0 0 0 0 0 0 0 0 0 0 0 0 0
03:00 0 0 0 0 0 0 0 0 0 0 0 0 0 0 0 0 0
04:00 0 0 0 0 0 0 0 0 0 0 0 0 0 0 0 0 0
05:00 0 1 0 0 0 0 0 0 0 0 0 0 0 0 0 0 1
06:00 0 0 0 0 0 0 0 0 0 0 0 0 0 0 0 0 0
07:00 0 2 1 0 0 0 0 0 0 0 0 0 0 0 0 0 3
08:00 2 2 1 0 0 0 0 0 0 0 0 0 0 0 0 0 5
09:00 0 0 0 0 0 0 0 0 0 0 0 0 0 0 0 0 0
10:00 0 0 1 0 0 0 0 0 0 0 0 0 0 0 0 0 1
11:00 2 2 1 0 0 0 0 0 0 0 0 0 0 0 0 0 5
12:00 1 5 3 0 0 0 0 0 0 0 0 0 0 0 0 0 9
13:00 4 3 1 1 0 0 0 0 0 0 0 0 0 0 0 0 9
14:00 3 1 3 0 0 0 0 0 0 0 0 0 0 0 0 0 7
15:00 4 1 1 1 0 0 0 0 0 0 0 0 0 0 0 0 7
16:00 9 5 0 0 0 0 0 0 0 0 0 0 0 0 0 0 14
17:00 9 1 1 1 0 0 0 0 0 0 0 0 0 0 0 0 12
18:00 5 6 1 0 0 0 0 0 0 0 0 0 0 0 0 0 12
19:00 2 7 2 0 0 0 0 0 0 0 0 0 0 0 0 0 11
20:00 4 4 0 1 0 0 0 0 0 0 0 0 0 0 0 0 9
21:00 1 3 0 0 0 0 0 0 0 0 0 0 0 0 0 0 4
22:00 0 2 0 0 0 0 0 0 0 0 0 0 0 0 0 0 2
23:00 0 1 1 0 0 0 0 0 0 0 0 0 0 0 0 0 2
Daily Total : 0 0 0 0 0 0 0 0 0 0 0 0 11346 46 17 441% 41% 15% 4% 0% 0% 0% 0% 0% 0% 0% 0% 0% 0% 0% 0% Percent :
Cum. Percent :
Average :41% 81% 96% 100% 100% 100% 100% 100% 100% 100% 100% 100% 100% 100% 100% 100%
2 2 1 0 0 0 0 0 0 0 0 0 0 0 0 0 5
Average Speed 50% Speed : 67% Speed : 85% Speed : 18.5 mph 21.7 mph 22.9 mph 27.2 mph10mph Pace: 21.1 - 31.0 (55.8%)
Centurion Special Speed Study Report Printed: 04/28/16 Page 2Centurion Special Speed Study Report Printed: 04/28/16 Page 2
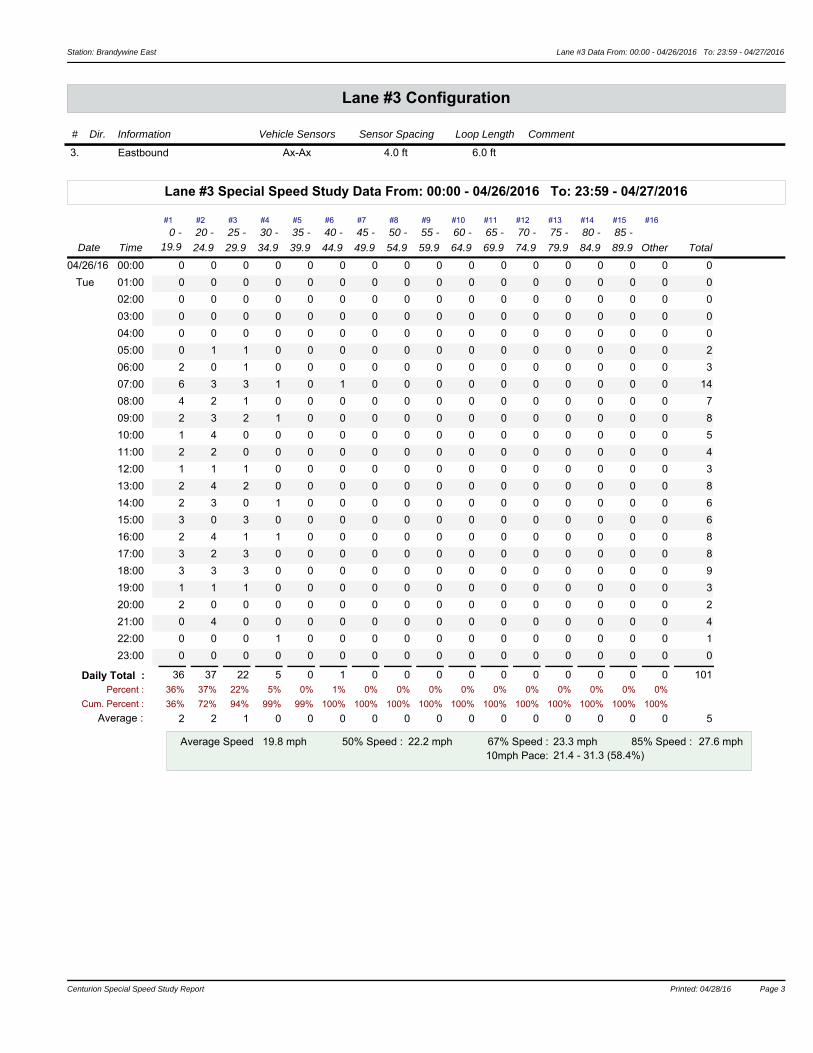
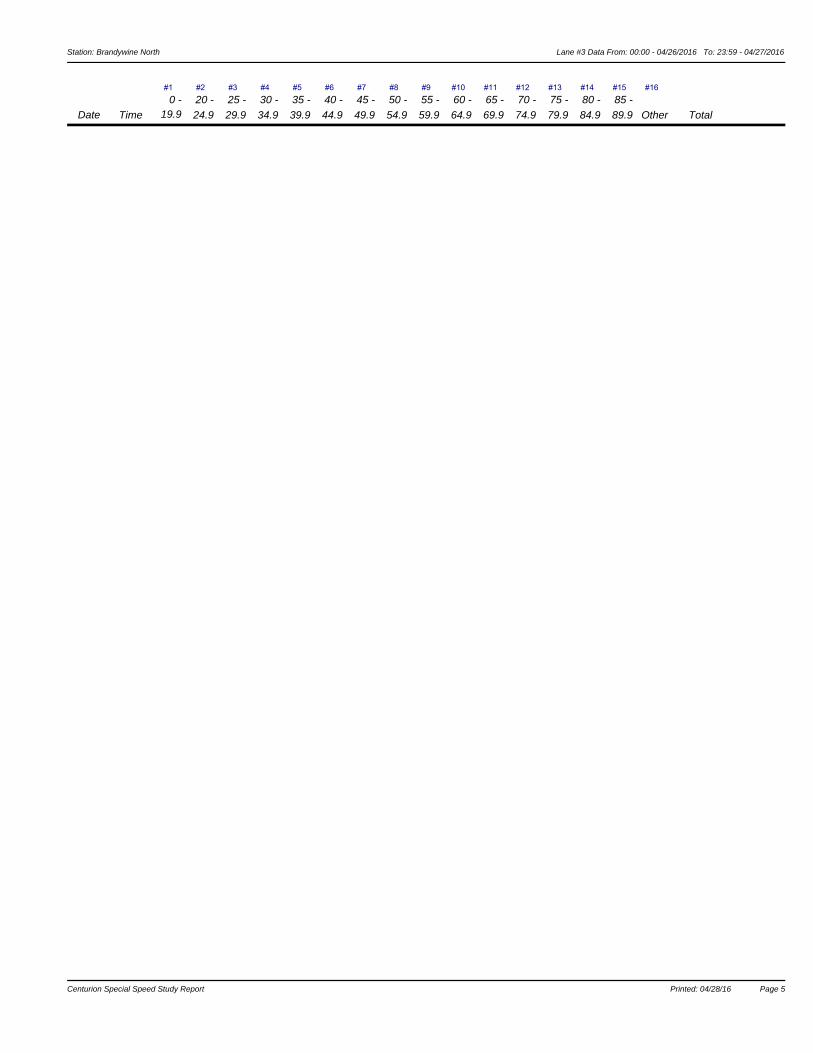
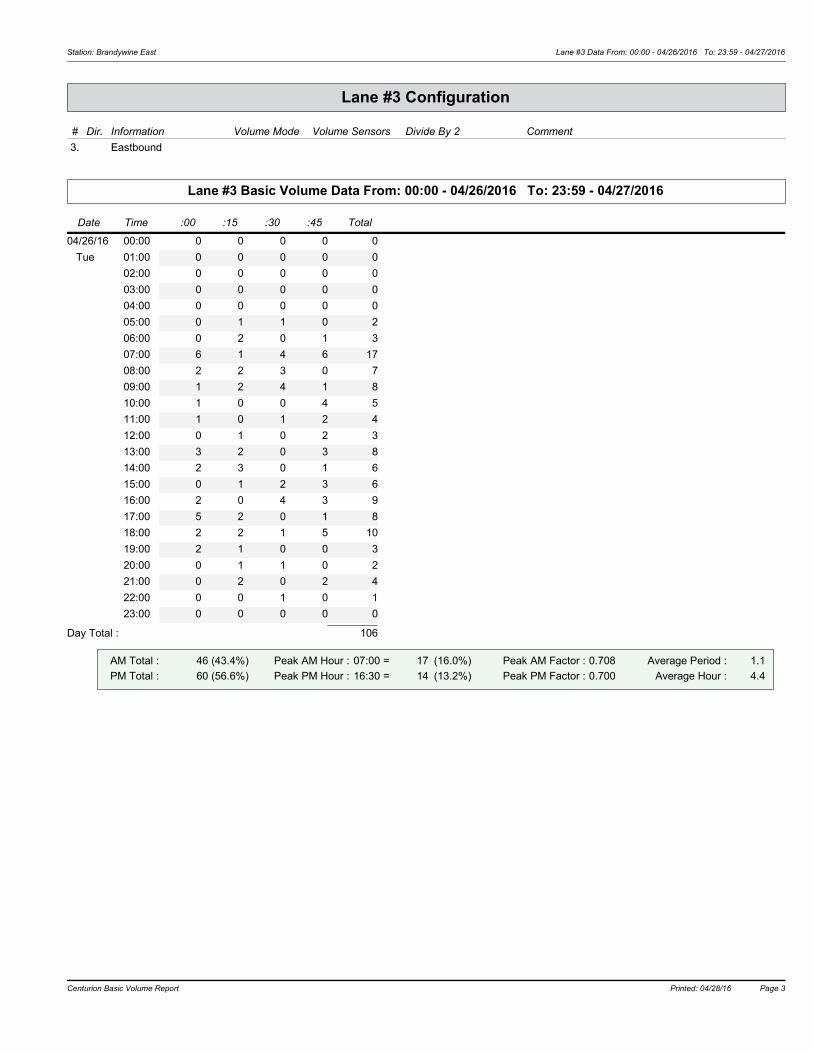
Station: Brandywine East Lane #3 Data From: 00:00 - 04/26/2016 To: 23:59 - 04/27/2016
Lane #3 Configuration
# Dir. Information Vehicle Sensors Sensor Spacing Loop Length Comment
3. Eastbound Ax-Ax 4.0 ft 6.0 ft
Lane #3 Special Speed Study Data From: 00:00 - 04/26/2016 To: 23:59 - 04/27/2016
Date Time
#1 #2 #3 #5#4 #7#6 #8 #9 #10 #11 #12 #13 #16#15#14
Total
0 - 19.9
20 -
24.9
25 -
29.9
30 -
34.9
35 -
39.9
40 -
44.9
45 -
49.9
50 - 55 - 60 - 65 - 70 - 75 -
54.9 59.9 64.9 69.9 74.9 79.9 Other89.9
85 -
84.9
80 -
04/26/16 00:00 0 0 0 0 0 0 0 0 0 0 0 0 0 0 0 0 0
Tue 01:00 0 0 0 0 0 0 0 0 0 0 0 0 0 0 0 0 0
02:00 0 0 0 0 0 0 0 0 0 0 0 0 0 0 0 0 0
03:00 0 0 0 0 0 0 0 0 0 0 0 0 0 0 0 0 0
04:00 0 0 0 0 0 0 0 0 0 0 0 0 0 0 0 0 0
05:00 0 1 1 0 0 0 0 0 0 0 0 0 0 0 0 0 2
06:00 2 0 1 0 0 0 0 0 0 0 0 0 0 0 0 0 3
07:00 6 3 3 1 0 1 0 0 0 0 0 0 0 0 0 0 14
08:00 4 2 1 0 0 0 0 0 0 0 0 0 0 0 0 0 7
09:00 2 3 2 1 0 0 0 0 0 0 0 0 0 0 0 0 8
10:00 1 4 0 0 0 0 0 0 0 0 0 0 0 0 0 0 5
11:00 2 2 0 0 0 0 0 0 0 0 0 0 0 0 0 0 4
12:00 1 1 1 0 0 0 0 0 0 0 0 0 0 0 0 0 3
13:00 2 4 2 0 0 0 0 0 0 0 0 0 0 0 0 0 8
14:00 2 3 0 1 0 0 0 0 0 0 0 0 0 0 0 0 6
15:00 3 0 3 0 0 0 0 0 0 0 0 0 0 0 0 0 6
16:00 2 4 1 1 0 0 0 0 0 0 0 0 0 0 0 0 8
17:00 3 2 3 0 0 0 0 0 0 0 0 0 0 0 0 0 8
18:00 3 3 3 0 0 0 0 0 0 0 0 0 0 0 0 0 9
19:00 1 1 1 0 0 0 0 0 0 0 0 0 0 0 0 0 3
20:00 2 0 0 0 0 0 0 0 0 0 0 0 0 0 0 0 2
21:00 0 4 0 0 0 0 0 0 0 0 0 0 0 0 0 0 4
22:00 0 0 0 1 0 0 0 0 0 0 0 0 0 0 0 0 1
23:00 0 0 0 0 0 0 0 0 0 0 0 0 0 0 0 0 0
Daily Total : 0 1 0 0 0 0 0 0 0 0 0 0 10136 37 22 536% 37% 22% 5% 0% 1% 0% 0% 0% 0% 0% 0% 0% 0% 0% 0% Percent :
Cum. Percent :
Average :36% 72% 94% 99% 99% 100% 100% 100% 100% 100% 100% 100% 100% 100% 100% 100%
2 2 1 0 0 0 0 0 0 0 0 0 0 0 0 0 5
Average Speed 50% Speed : 67% Speed : 85% Speed : 19.8 mph 22.2 mph 23.3 mph 27.6 mph10mph Pace: 21.4 - 31.3 (58.4%)
Centurion Special Speed Study Report Printed: 04/28/16 Page 3Centurion Special Speed Study Report Printed: 04/28/16 Page 3

Station: Brandywine East Lane #3 Data From: 00:00 - 04/26/2016 To: 23:59 - 04/27/2016
Date Time
#1 #2 #3 #5#4 #7#6 #8 #9 #10 #11 #12 #13 #16#15#14
Total
0 - 19.9
20 -
24.9
25 -
29.9
30 -
34.9
35 -
39.9
40 -
44.9
45 -
49.9
50 - 55 - 60 - 65 - 70 - 75 -
54.9 59.9 64.9 69.9 74.9 79.9 Other89.9
85 -
84.9
80 -
04/27/16 00:00 1 0 1 0 0 0 0 0 0 0 0 0 0 0 0 0 2
Wed 01:00 0 0 0 0 0 0 0 0 0 0 0 0 0 0 0 0 0
02:00 0 0 0 0 0 0 0 0 0 0 0 0 0 0 0 0 0
03:00 0 0 0 0 0 0 0 0 0 0 0 0 0 0 0 0 0
04:00 0 0 0 0 0 0 0 0 0 0 0 0 0 0 0 0 0
05:00 0 1 0 0 0 0 0 0 0 0 0 0 0 0 0 0 1
06:00 1 1 0 0 0 0 0 0 0 0 0 0 0 0 0 0 2
07:00 6 5 5 4 0 0 0 0 0 0 0 0 0 0 0 0 20
08:00 4 1 3 0 0 0 0 0 0 0 0 0 0 0 0 0 8
09:00 2 4 1 1 0 0 0 0 0 0 0 0 0 0 0 0 8
10:00 1 1 1 0 0 0 0 0 0 0 0 0 0 0 0 0 3
11:00 0 6 2 0 0 0 0 0 0 0 0 0 0 0 0 0 8
12:00 0 1 3 0 0 0 0 0 0 0 0 0 0 0 0 0 4
13:00 3 2 2 0 0 0 0 0 0 0 0 0 0 0 0 0 7
14:00 2 2 1 3 0 0 0 0 0 0 0 0 0 0 0 0 8
15:00 4 7 4 1 0 0 0 0 0 0 0 0 0 0 0 0 16
16:00 6 6 0 2 0 0 0 0 0 0 0 0 0 0 0 0 14
17:00 2 1 0 0 0 0 0 0 0 0 0 0 0 0 0 0 3
18:00 6 6 3 0 0 0 0 0 0 0 0 0 0 0 0 0 15
19:00 2 3 0 1 0 0 0 0 0 0 0 0 0 0 0 0 6
20:00 1 3 1 0 0 0 0 0 0 0 0 0 0 0 0 0 5
21:00 1 4 0 0 0 0 0 0 0 0 0 0 0 0 0 0 5
22:00 2 2 2 1 0 0 0 0 0 0 0 0 0 0 0 0 7
23:00 0 0 0 0 0 0 0 0 0 0 0 0 0 0 0 0 0
Daily Total : 0 0 0 0 0 0 0 0 0 0 0 0 14244 56 29 1331% 39% 20% 9% 0% 0% 0% 0% 0% 0% 0% 0% 0% 0% 0% 0% Percent :
Cum. Percent :
Average :31% 70% 91% 100% 100% 100% 100% 100% 100% 100% 100% 100% 100% 100% 100% 100%
2 2 1 1 0 0 0 0 0 0 0 0 0 0 0 0 6
Average Speed 50% Speed : 67% Speed : 85% Speed : 20.6 mph 22.5 mph 24.0 mph 27.8 mph10mph Pace: 20.8 - 30.7 (59.9%)
Centurion Special Speed Study Report Printed: 04/28/16 Page 4Centurion Special Speed Study Report Printed: 04/28/16 Page 4

Station: Brandywine East Lane #3 Data From: 00:00 - 04/26/2016 To: 23:59 - 04/27/2016
Date Time
#1 #2 #3 #5#4 #7#6 #8 #9 #10 #11 #12 #13 #16#15#14
Total
0 - 19.9
20 -
24.9
25 -
29.9
30 -
34.9
35 -
39.9
40 -
44.9
45 -
49.9
50 - 55 - 60 - 65 - 70 - 75 -
54.9 59.9 64.9 69.9 74.9 79.9 Other89.9
85 -
84.9
80 -
Centurion Special Speed Study Report Printed: 04/28/16 Page 5
Station: Brandywine East Data From: 00:00 - 04/26/2016 To: 23:59 - 04/27/2016
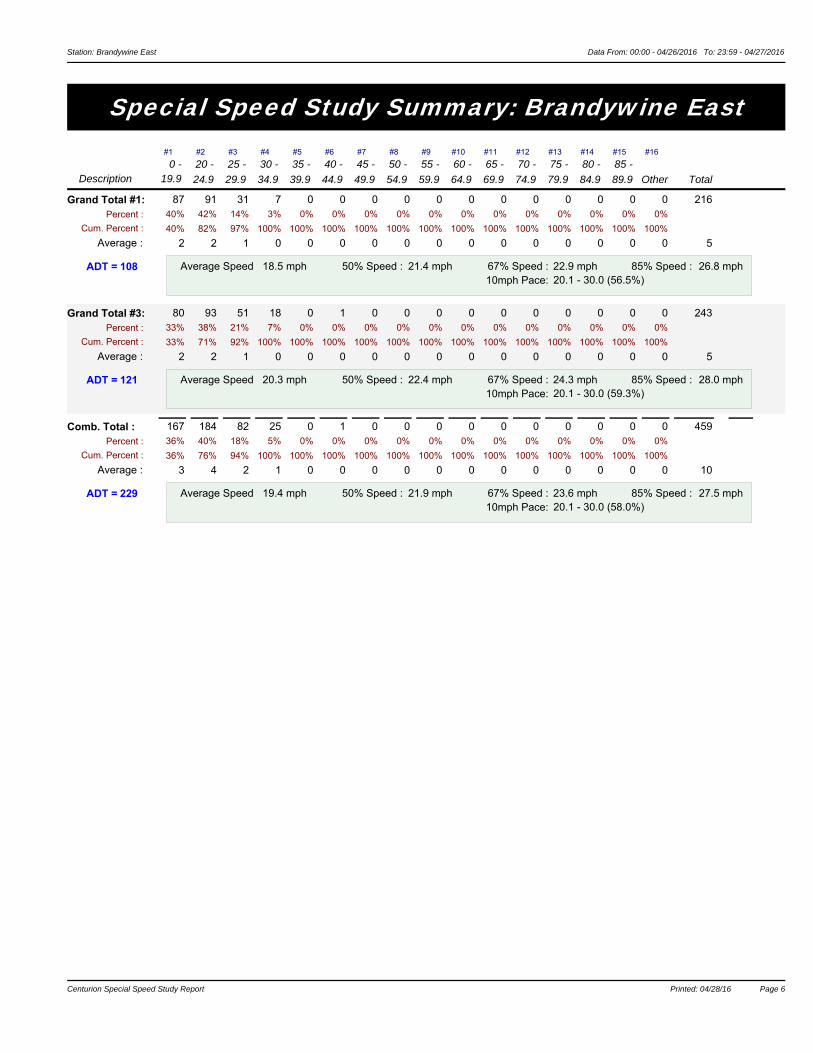
Special Speed Study Summary: Brandywine East
Description 19.9 0 -
#1 #2
20 -
24.9 29.9
25 - #3
30 -
34.9
#4 #5
35 -
39.9 44.9
40 - #6
49.9
45 - #7 #8
50 -
54.9 59.9
55 - #9 #10
60 -
64.9 69.9
65 - #11 #12
70 -
74.9 79.9
75 - #13 #14
80 -
84.9 89.9
85 - #15 #16
Other Total
Grand Total #1: 87 91 31 7 0 0 0 0 0 0 0 0 0 0 0 21640% 42% 14% 3% 0% 0% 0% 0% 0% 0% 0% 0% 0% 0% 0% 0% Percent :
Cum. Percent :
Average :
0
40% 82% 97% 100% 100% 100% 100% 100% 100% 100% 100% 100% 100% 100% 100% 100%
2 2 1 0 0 0 0 0 0 0 0 0 0 0 0 0 5
Average Speed 18.5 mph 50% Speed : 21.4 mph 67% Speed :10mph Pace: 20.1 - 30.0 (56.5%)
22.9 mph 85% Speed : 26.8 mphADT = 108
Grand Total #3: 80 93 51 18 0 1 0 0 0 0 0 0 0 0 0 24333% 38% 21% 7% 0% 0% 0% 0% 0% 0% 0% 0% 0% 0% 0% 0% Percent :
Cum. Percent :
Average :
0
33% 71% 92% 100% 100% 100% 100% 100% 100% 100% 100% 100% 100% 100% 100% 100%
2 2 1 0 0 0 0 0 0 0 0 0 0 0 0 0 5
Average Speed 20.3 mph 50% Speed : 22.4 mph 67% Speed :10mph Pace: 20.1 - 30.0 (59.3%)
24.3 mph 85% Speed : 28.0 mphADT = 121
Comb. Total : 167 184 82 25 0 1 0 0 0 0 0 0 0 0 0 45936% 40% 18% 5% 0% 0% 0% 0% 0% 0% 0% 0% 0% 0% 0% 0% Percent :
Cum. Percent :
Average :
0
36% 76% 94% 100% 100% 100% 100% 100% 100% 100% 100% 100% 100% 100% 100% 100%
3 4 2 1 0 0 0 0 0 0 0 0 0 0 0 0 10
Average Speed 19.4 mph 50% Speed : 21.9 mph 67% Speed :10mph Pace: 20.1 - 30.0 (58.0%)
23.6 mph 85% Speed : 27.5 mphADT = 229
Centurion Special Speed Study Report Printed: 04/28/16 Page 6
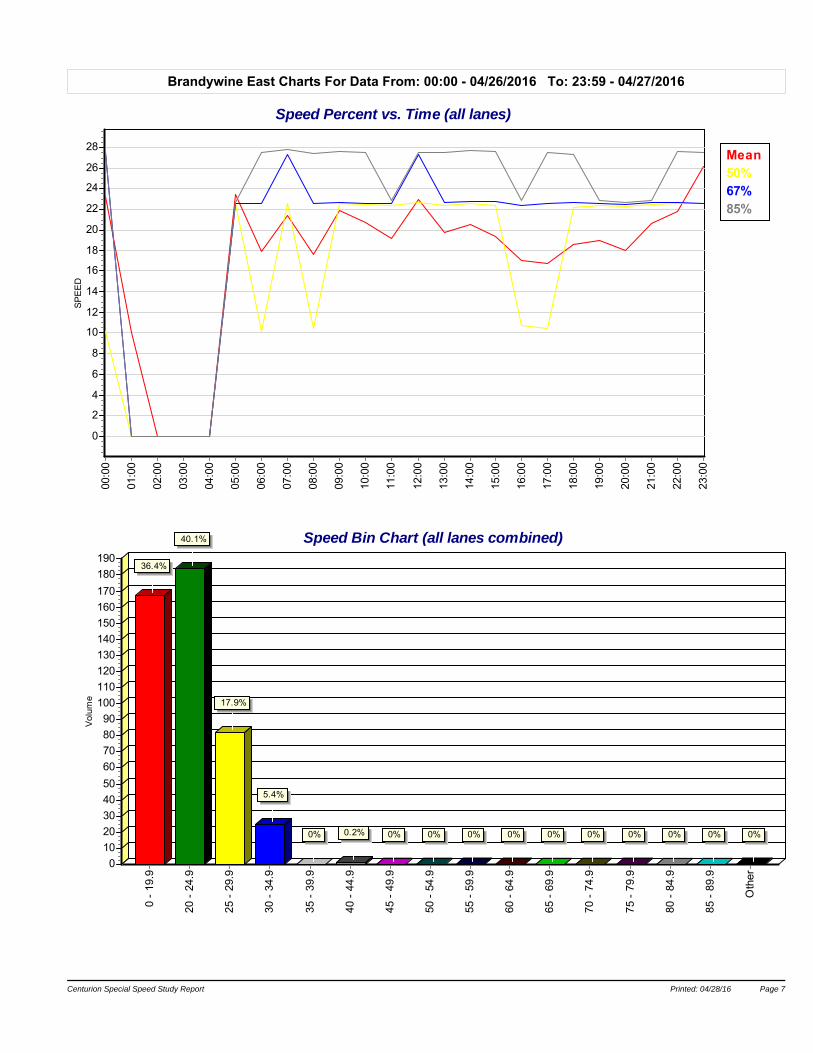
Brandywine East Charts For Data From: 00:00 - 04/26/2016 To: 23:59 - 04/27/2016
Mean50%67%85%
Speed Percent vs. Time (all lanes)00
:00
01:0
0
02:0
0
03:0
0
04:0
0
05:0
0
06:0
0
07:0
0
08:0
0
09:0
0
10:0
0
11:0
0
12:0
0
13:0
0
14:0
0
15:0
0
16:0
0
17:0
0
18:0
0
19:0
0
20:0
0
21:0
0
22:0
0
23:0
0
SP
EE
D
28
26
24
22
20
18
16
14
12
10
8
6
4
2
0
Speed Bin Chart (all lanes combined)
0 -
19.9
20 -
24.
9
25 -
29.
9
30 -
34.
9
35 -
39.
9
40 -
44.
9
45 -
49.
9
50 -
54.
9
55 -
59.
9
60 -
64.
9
65 -
69.
9
70 -
74.
9
75 -
79.
9
80 -
84.
9
85 -
89.
9
Oth
er
Vol
ume
190
180
170
160
150
140
130
120
110
100
90
80
70
60
50
40
30
20
10
0
36.4%
40.1%
17.9%
5.4%
0% 0.2% 0% 0% 0% 0% 0% 0% 0% 0% 0% 0%
Centurion Special Speed Study Report Printed: 04/28/16 Page 7

Special Speed Study Report: Brandywine North
Station ID : Brandywine NorthInfo Line 1 : South of Cherry Hills LpInfo Line 2 : Albuquerque
DB File : BRAND NOR 1SB.DBNumber of Lanes : 1
Posted Speed Limit :
214951.63ApolloLast Connected Device Type :
Version Number :Serial Number :
GPS Lat/Lon :
Lane #1 Configuration
# Dir. Vehicle SensorsInformation Sensor Spacing Loop Length Comment
1. Southbound Ax-Ax 4.0 ft 6.0 ft
Lane #1 Special Speed Study Data From: 00:00 - 04/26/2016 To: 23:59 - 04/27/2016
Date Time
#1 #2 #3 #5#4 #7#6 #8 #9 #10 #11 #12 #13 #16#15#14
Total
0 - 19.9
20 -
24.9
25 -
29.9
30 -
34.9
35 -
39.9
40 -
44.9
45 -
49.9
50 - 55 - 60 - 65 - 70 - 75 -
54.9 59.9 64.9 69.9 74.9 79.9 Other89.9
85 -
84.9
80 -
04/26/16 00:00 0 0 0 0 0 0 0 0 0 0 0 0 0 0 0 0 0
Tue 01:00 0 0 0 0 0 0 0 0 0 0 0 0 0 0 0 0 0
02:00 0 0 0 0 0 0 0 0 0 0 0 0 0 0 0 0 0
03:00 0 0 0 0 0 0 0 0 0 0 0 0 0 0 0 0 0
04:00 0 0 0 0 0 0 0 0 0 0 0 0 0 0 0 0 0
05:00 0 1 0 0 0 0 0 0 0 0 0 0 0 0 0 0 1
06:00 1 2 0 0 0 0 0 0 0 0 0 0 0 0 0 0 3
07:00 5 3 0 0 0 0 0 0 0 0 0 0 0 0 0 0 8
08:00 2 2 0 0 0 0 0 0 0 0 0 0 0 0 0 0 4
09:00 1 6 0 0 0 0 0 0 0 0 0 0 0 0 0 0 7
10:00 7 1 0 0 0 0 0 0 0 0 0 0 0 0 0 0 8
11:00 6 0 0 0 0 0 0 0 0 0 0 0 0 0 0 0 6
12:00 5 0 0 0 0 0 0 0 0 0 0 0 0 0 0 0 5
13:00 4 1 0 0 0 0 0 0 0 0 0 0 0 0 0 0 5
14:00 3 1 0 0 0 0 0 0 0 0 0 0 0 0 0 0 4
15:00 4 2 0 0 0 0 0 0 0 0 0 0 0 0 0 0 6
16:00 7 2 0 0 0 0 0 0 0 0 0 0 0 0 0 0 9
17:00 6 4 0 0 0 0 0 0 0 0 0 0 0 0 0 0 10
18:00 7 1 1 0 0 0 0 0 0 0 0 0 0 0 0 0 9
19:00 3 0 0 0 0 0 0 0 0 0 0 0 0 0 0 0 3
20:00 1 2 0 0 0 0 0 0 0 0 0 0 0 0 0 0 3
21:00 3 0 0 0 0 0 0 0 0 0 0 0 0 0 0 0 3
22:00 0 1 0 0 0 0 0 0 0 0 0 0 0 0 0 0 1
23:00 0 0 0 0 0 0 0 0 0 0 0 0 0 0 0 0 0
Daily Total : 0 0 0 0 0 0 0 0 0 0 0 0 9565 29 1 068% 31% 1% 0% 0% 0% 0% 0% 0% 0% 0% 0% 0% 0% 0% 0% Percent :
Cum. Percent :
Average :68% 99% 100% 100% 100% 100% 100% 100% 100% 100% 100% 100% 100% 100% 100% 100%
3 1 0 0 0 0 0 0 0 0 0 0 0 0 0 0 4
Average Speed 50% Speed : 67% Speed : 85% Speed : 14.0 mph 10.9 mph 11.9 mph 22.6 mph10mph Pace: 8.0 - 17.9 (68.4%)
Centurion Special Speed Study Report Printed: 04/28/16 Page 1Centurion Special Speed Study Report Printed: 04/28/16 Page 1
Station: Brandywine North Lane #1 Data From: 00:00 - 04/26/2016 To: 23:59 - 04/27/2016
Date Time
#1 #2 #3 #5#4 #7#6 #8 #9 #10 #11 #12 #13 #16#15#14
Total
0 - 19.9
20 -
24.9
25 -
29.9
30 -
34.9
35 -
39.9
40 -
44.9
45 -
49.9
50 - 55 - 60 - 65 - 70 - 75 -
54.9 59.9 64.9 69.9 74.9 79.9 Other89.9
85 -
84.9
80 -
04/27/16 00:00 2 0 0 0 0 0 0 0 0 0 0 0 0 0 0 0 2
Wed 01:00 0 0 0 0 0 0 0 0 0 0 0 0 0 0 0 0 0
02:00 0 0 0 0 0 0 0 0 0 0 0 0 0 0 0 0 0
03:00 0 0 0 0 0 0 0 0 0 0 0 0 0 0 0 0 0
04:00 0 0 0 0 0 0 0 0 0 0 0 0 0 0 0 0 0
05:00 0 1 0 0 0 0 0 0 0 0 0 0 0 0 0 0 1
06:00 0 0 0 0 0 0 0 0 0 0 0 0 0 0 0 0 0
07:00 4 6 1 0 1 0 0 0 0 0 0 0 0 0 0 0 12
08:00 3 5 0 0 0 0 0 0 0 0 0 0 0 0 0 0 8
09:00 3 5 1 0 0 0 0 0 0 0 0 0 0 0 0 0 9
10:00 7 1 0 0 0 0 0 0 0 0 0 0 0 0 0 0 8
11:00 3 3 0 0 0 0 0 0 0 0 0 0 0 0 0 0 6
12:00 5 2 0 0 0 0 0 0 0 0 0 0 0 0 0 0 7
13:00 5 2 0 0 0 0 0 0 0 0 0 0 0 0 0 0 7
14:00 3 3 1 0 0 0 0 0 0 0 0 0 0 0 0 0 7
15:00 7 9 0 0 0 0 0 0 0 0 0 0 0 0 0 0 16
16:00 12 1 2 0 0 0 0 0 0 0 0 0 0 0 0 0 15
17:00 5 3 0 0 0 0 0 0 0 0 0 0 0 0 0 0 8
18:00 13 1 0 0 0 0 0 0 0 0 0 0 0 0 0 0 14
19:00 5 2 0 0 0 0 0 0 0 0 0 0 0 0 0 0 7
20:00 3 0 0 0 0 0 0 0 0 0 0 0 0 0 0 0 3
21:00 3 1 0 0 0 0 0 0 0 0 0 0 0 0 0 0 4
22:00 2 2 1 0 0 0 0 0 0 0 0 0 0 0 0 0 5
23:00 0 0 0 0 0 0 0 0 0 0 0 0 0 0 0 0 0
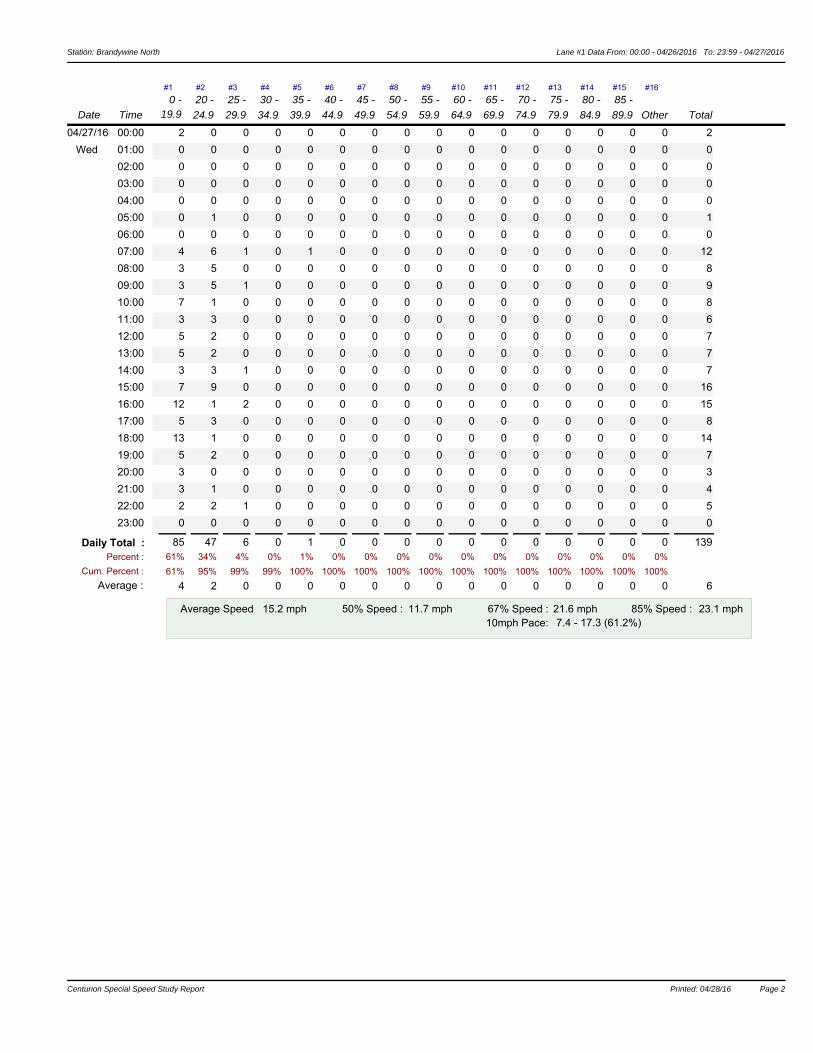
Daily Total : 1 0 0 0 0 0 0 0 0 0 0 0 13985 47 6 061% 34% 4% 0% 1% 0% 0% 0% 0% 0% 0% 0% 0% 0% 0% 0% Percent :
Cum. Percent :
Average :61% 95% 99% 99% 100% 100% 100% 100% 100% 100% 100% 100% 100% 100% 100% 100%
4 2 0 0 0 0 0 0 0 0 0 0 0 0 0 0 6
Average Speed 50% Speed : 67% Speed : 85% Speed : 15.2 mph 11.7 mph 21.6 mph 23.1 mph10mph Pace: 7.4 - 17.3 (61.2%)
Centurion Special Speed Study Report Printed: 04/28/16 Page 2Centurion Special Speed Study Report Printed: 04/28/16 Page 2

Station: Brandywine North Lane #3 Data From: 00:00 - 04/26/2016 To: 23:59 - 04/27/2016
Lane #3 Configuration
# Dir. Information Vehicle Sensors Sensor Spacing Loop Length Comment
3. Northbound Ax-Ax 4.0 ft 6.0 ft
Lane #3 Special Speed Study Data From: 00:00 - 04/26/2016 To: 23:59 - 04/27/2016
Date Time
#1 #2 #3 #5#4 #7#6 #8 #9 #10 #11 #12 #13 #16#15#14
Total
0 - 19.9
20 -
24.9
25 -
29.9
30 -
34.9
35 -
39.9
40 -
44.9
45 -
49.9
50 - 55 - 60 - 65 - 70 - 75 -
54.9 59.9 64.9 69.9 74.9 79.9 Other89.9
85 -
84.9
80 -
04/26/16 00:00 0 0 1 0 0 0 0 0 0 0 0 0 0 0 0 0 1
Tue 01:00 1 0 0 0 0 0 0 0 0 0 0 0 0 0 0 0 1
02:00 0 0 0 0 0 0 0 0 0 0 0 0 0 0 0 0 0
03:00 0 0 0 0 0 0 0 0 0 0 0 0 0 0 0 0 0
04:00 0 0 0 0 0 0 0 0 0 0 0 0 0 0 0 0 0
05:00 1 0 0 0 0 0 0 0 0 0 0 0 0 0 0 0 1
06:00 2 4 1 0 0 0 0 0 0 0 0 0 0 0 0 0 7
07:00 3 1 0 0 0 0 0 0 0 0 0 0 0 0 0 0 4
08:00 3 0 0 0 0 0 0 0 0 0 0 0 0 0 0 0 3
09:00 3 1 0 0 0 0 0 0 0 0 0 0 0 0 0 0 4
10:00 8 1 0 0 0 0 0 0 0 0 0 0 0 0 0 0 9
11:00 3 2 0 0 0 0 0 0 0 0 0 0 0 0 0 0 5
12:00 5 2 0 0 0 0 0 0 0 0 0 0 0 0 0 0 7
13:00 5 0 0 0 0 0 0 0 0 0 0 0 0 0 0 0 5
14:00 2 3 0 0 0 0 0 0 0 0 0 0 0 0 0 0 5
15:00 5 2 0 0 0 0 0 0 0 0 0 0 0 0 0 0 7
16:00 3 2 0 0 0 0 0 0 0 0 0 0 0 0 0 0 5
17:00 5 3 0 0 0 0 0 0 0 0 0 0 0 0 0 0 8
18:00 7 2 0 0 0 0 0 0 0 0 0 0 0 0 0 0 9
19:00 5 0 0 0 0 0 0 0 0 0 0 0 0 0 0 0 5
20:00 2 1 0 0 0 0 0 0 0 0 0 0 0 0 0 0 3
21:00 1 2 0 0 0 0 0 0 0 0 0 0 0 0 0 0 3
22:00 0 0 0 0 0 0 0 0 0 0 0 0 0 0 0 0 0
23:00 1 0 0 0 0 0 0 0 0 0 0 0 0 0 0 0 1
Daily Total : 0 0 0 0 0 0 0 0 0 0 0 0 9365 26 2 070% 28% 2% 0% 0% 0% 0% 0% 0% 0% 0% 0% 0% 0% 0% 0% Percent :
Cum. Percent :
Average :70% 98% 100% 100% 100% 100% 100% 100% 100% 100% 100% 100% 100% 100% 100% 100%
3 1 0 0 0 0 0 0 0 0 0 0 0 0 0 0 4
Average Speed 50% Speed : 67% Speed : 85% Speed : 13.9 mph 10.9 mph 11.9 mph 22.6 mph10mph Pace: 8.0 - 17.9 (69.9%)
Centurion Special Speed Study Report Printed: 04/28/16 Page 3Centurion Special Speed Study Report Printed: 04/28/16 Page 3
Station: Brandywine North Lane #3 Data From: 00:00 - 04/26/2016 To: 23:59 - 04/27/2016
Date Time
#1 #2 #3 #5#4 #7#6 #8 #9 #10 #11 #12 #13 #16#15#14
Total
0 - 19.9
20 -
24.9
25 -
29.9
30 -
34.9
35 -
39.9
40 -
44.9
45 -
49.9
50 - 55 - 60 - 65 - 70 - 75 -
54.9 59.9 64.9 69.9 74.9 79.9 Other89.9
85 -
84.9
80 -
04/27/16 00:00 0 0 0 0 0 0 0 0 0 0 0 0 0 0 0 0 0
Wed 01:00 0 0 0 0 0 0 0 0 0 0 0 0 0 0 0 0 0
02:00 0 0 0 0 0 0 0 0 0 0 0 0 0 0 0 0 0
03:00 0 0 0 0 0 0 0 0 0 0 0 0 0 0 0 0 0
04:00 0 0 0 0 0 0 0 0 0 0 0 0 0 0 0 0 0
05:00 1 0 0 0 0 0 0 0 0 0 0 0 0 0 0 0 1
06:00 1 2 1 0 0 0 0 0 0 0 0 0 0 0 0 0 4
07:00 3 2 0 0 0 0 0 0 0 0 0 0 0 0 0 0 5
08:00 4 3 0 0 0 0 0 0 0 0 0 0 0 0 0 0 7
09:00 4 0 0 0 0 0 0 0 0 0 0 0 0 0 0 0 4
10:00 2 2 0 0 0 0 0 0 0 0 0 0 0 0 0 0 4
11:00 4 0 0 0 0 0 0 0 0 0 0 0 0 0 0 0 4
12:00 5 4 0 0 0 0 0 0 0 0 0 0 0 0 0 0 9
13:00 5 3 0 0 0 0 0 0 0 0 0 0 0 0 0 0 8
14:00 4 2 0 0 0 0 0 0 0 0 0 0 0 0 0 0 6
15:00 2 2 2 0 0 0 0 0 0 0 0 0 0 0 0 0 6
16:00 12 2 0 0 0 0 0 0 0 0 0 0 0 0 0 0 14
17:00 7 3 0 1 0 0 0 0 0 0 0 0 0 0 0 0 11
18:00 5 3 0 0 0 0 0 0 0 0 0 0 0 0 0 0 8
19:00 5 1 0 0 0 0 0 0 0 0 0 0 0 0 0 0 6
20:00 3 1 1 0 0 0 0 0 0 0 0 0 0 0 0 0 5
21:00 4 0 0 0 0 0 0 0 0 0 0 0 0 0 0 0 4
22:00 0 0 0 0 0 0 0 0 0 0 0 0 0 0 0 0 0
23:00 0 0 0 0 0 0 0 0 0 0 0 0 0 0 0 0 0
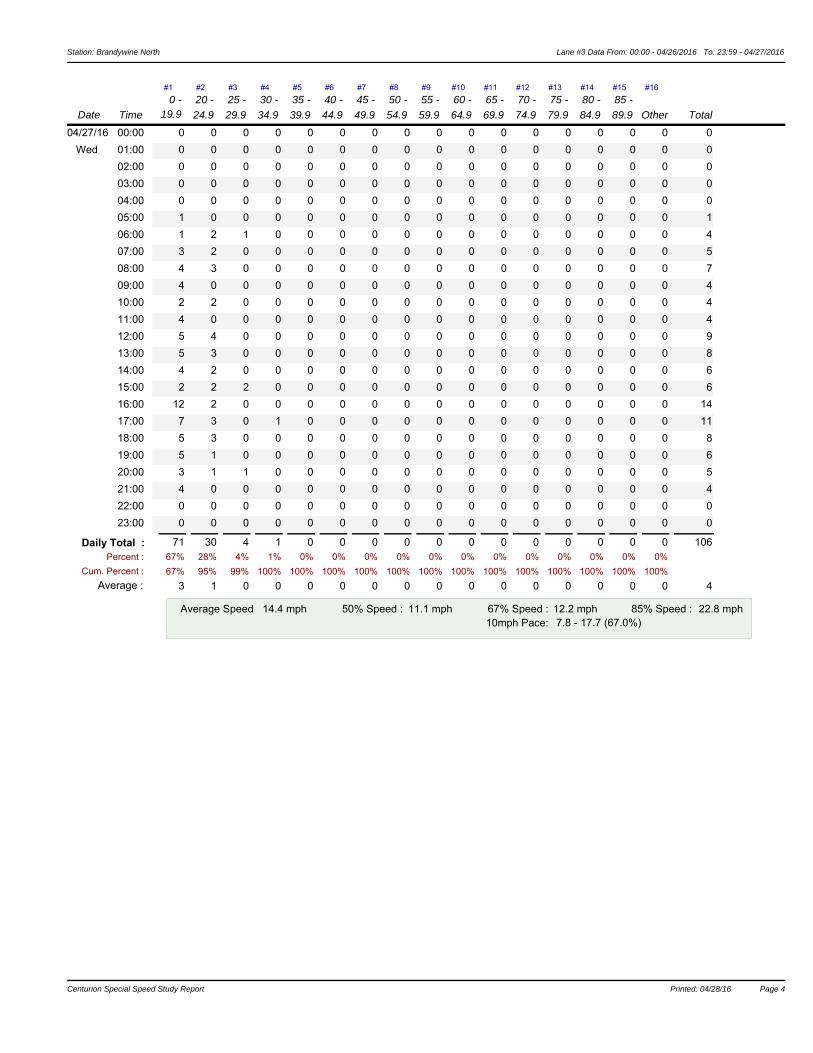
Daily Total : 0 0 0 0 0 0 0 0 0 0 0 0 10671 30 4 167% 28% 4% 1% 0% 0% 0% 0% 0% 0% 0% 0% 0% 0% 0% 0% Percent :
Cum. Percent :
Average :67% 95% 99% 100% 100% 100% 100% 100% 100% 100% 100% 100% 100% 100% 100% 100%
3 1 0 0 0 0 0 0 0 0 0 0 0 0 0 0 4
Average Speed 50% Speed : 67% Speed : 85% Speed : 14.4 mph 11.1 mph 12.2 mph 22.8 mph10mph Pace: 7.8 - 17.7 (67.0%)
Centurion Special Speed Study Report Printed: 04/28/16 Page 4Centurion Special Speed Study Report Printed: 04/28/16 Page 4
Station: Brandywine North Lane #3 Data From: 00:00 - 04/26/2016 To: 23:59 - 04/27/2016
Date Time
#1 #2 #3 #5#4 #7#6 #8 #9 #10 #11 #12 #13 #16#15#14
Total
0 - 19.9
20 -
24.9
25 -
29.9
30 -
34.9
35 -
39.9
40 -
44.9
45 -
49.9
50 - 55 - 60 - 65 - 70 - 75 -
54.9 59.9 64.9 69.9 74.9 79.9 Other89.9
85 -
84.9
80 -
Centurion Special Speed Study Report Printed: 04/28/16 Page 5
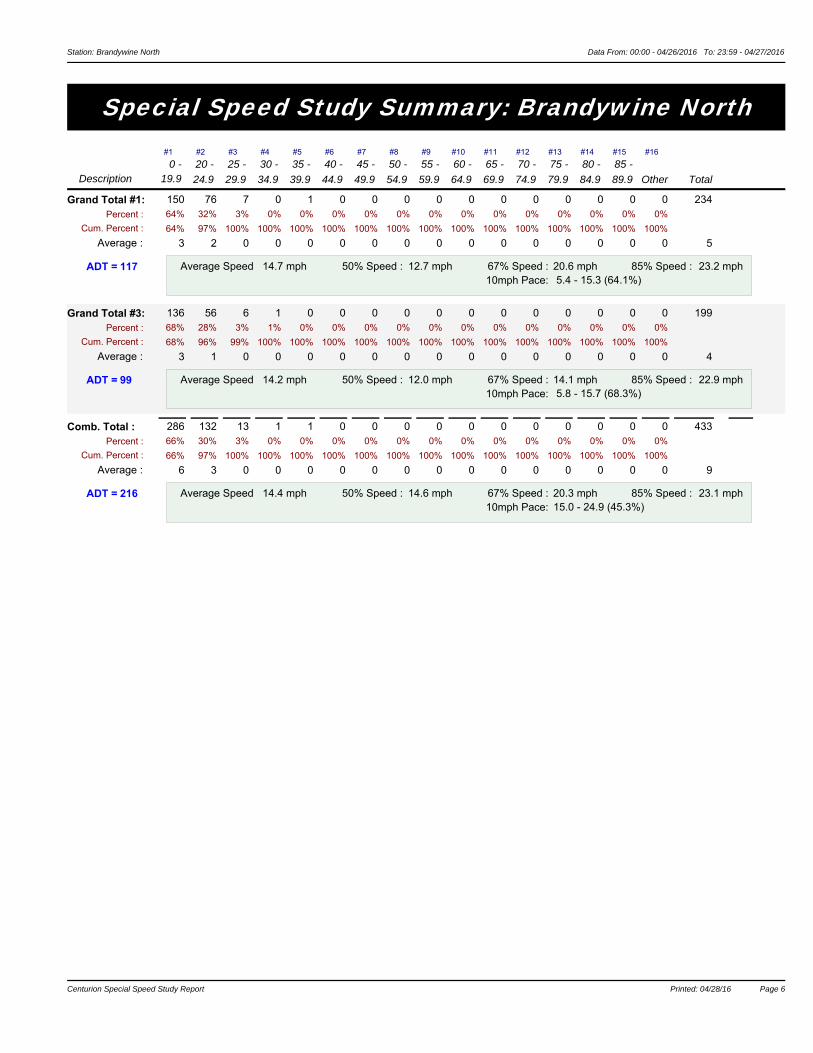
Station: Brandywine North Data From: 00:00 - 04/26/2016 To: 23:59 - 04/27/2016
Special Speed Study Summary: Brandywine North
Description 19.9 0 -
#1 #2
20 -
24.9 29.9
25 - #3
30 -
34.9
#4 #5
35 -
39.9 44.9
40 - #6
49.9
45 - #7 #8
50 -
54.9 59.9
55 - #9 #10
60 -
64.9 69.9
65 - #11 #12
70 -
74.9 79.9
75 - #13 #14
80 -
84.9 89.9
85 - #15 #16
Other Total
Grand Total #1: 150 76 7 0 1 0 0 0 0 0 0 0 0 0 0 23464% 32% 3% 0% 0% 0% 0% 0% 0% 0% 0% 0% 0% 0% 0% 0% Percent :
Cum. Percent :
Average :
0
64% 97% 100% 100% 100% 100% 100% 100% 100% 100% 100% 100% 100% 100% 100% 100%
3 2 0 0 0 0 0 0 0 0 0 0 0 0 0 0 5
Average Speed 14.7 mph 50% Speed : 12.7 mph 67% Speed :10mph Pace: 5.4 - 15.3 (64.1%)
20.6 mph 85% Speed : 23.2 mphADT = 117
Grand Total #3: 136 56 6 1 0 0 0 0 0 0 0 0 0 0 0 19968% 28% 3% 1% 0% 0% 0% 0% 0% 0% 0% 0% 0% 0% 0% 0% Percent :
Cum. Percent :
Average :
0
68% 96% 99% 100% 100% 100% 100% 100% 100% 100% 100% 100% 100% 100% 100% 100%
3 1 0 0 0 0 0 0 0 0 0 0 0 0 0 0 4
Average Speed 14.2 mph 50% Speed : 12.0 mph 67% Speed :10mph Pace: 5.8 - 15.7 (68.3%)
14.1 mph 85% Speed : 22.9 mphADT = 99
Comb. Total : 286 132 13 1 1 0 0 0 0 0 0 0 0 0 0 43366% 30% 3% 0% 0% 0% 0% 0% 0% 0% 0% 0% 0% 0% 0% 0% Percent :
Cum. Percent :
Average :
0
66% 97% 100% 100% 100% 100% 100% 100% 100% 100% 100% 100% 100% 100% 100% 100%
6 3 0 0 0 0 0 0 0 0 0 0 0 0 0 0 9
Average Speed 14.4 mph 50% Speed : 14.6 mph 67% Speed :10mph Pace: 15.0 - 24.9 (45.3%)
20.3 mph 85% Speed : 23.1 mphADT = 216
Centurion Special Speed Study Report Printed: 04/28/16 Page 6

Brandywine North Charts For Data From: 00:00 - 04/26/2016 To: 23:59 - 04/27/2016
Mean50%67%85%
Speed Percent vs. Time (all lanes)00
:00
01:0
0
02:0
0
03:0
0
04:0
0
05:0
0
06:0
0
07:0
0
08:0
0
09:0
0
10:0
0
11:0
0
12:0
0
13:0
0
14:0
0
15:0
0
16:0
0
17:0
0
18:0
0
19:0
0
20:0
0
21:0
0
22:0
0
23:0
0
SP
EE
D
24
22
20
18
16
14
12
10
8
6
4
2
0
Speed Bin Chart (all lanes combined)
0 -
19.9
20 -
24.
9
25 -
29.
9
30 -
34.
9
35 -
39.
9
40 -
44.
9
45 -
49.
9
50 -
54.
9
55 -
59.
9
60 -
64.
9
65 -
69.
9
70 -
74.
9
75 -
79.
9
80 -
84.
9
85 -
89.
9
Oth
er
Vol
ume
280
260
240
220
200
180
160
140
120
100
80
60
40
20
0
66.1%
30.5%
3%0.2% 0.2% 0% 0% 0% 0% 0% 0% 0% 0% 0% 0% 0%
Centurion Special Speed Study Report Printed: 04/28/16 Page 7
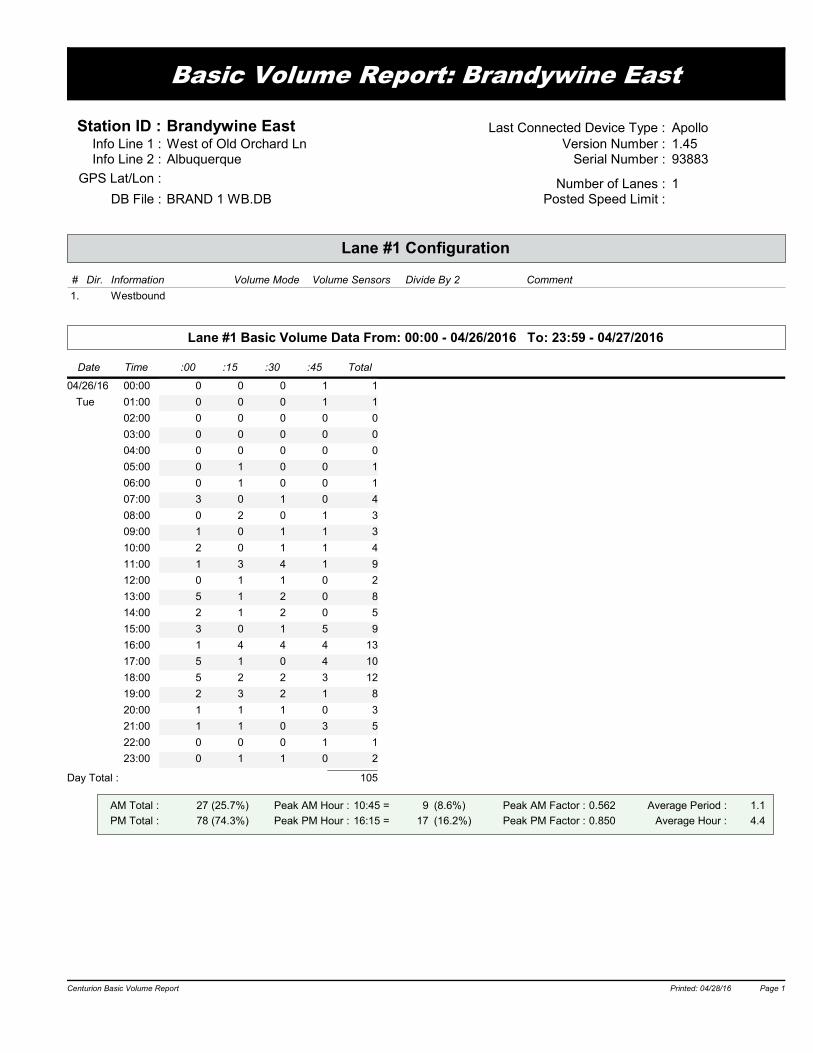
Basic Volume Report: Brandywine EastStation ID : Brandywine East
Info Line 1 : West of Old Orchard LnInfo Line 2 : Albuquerque
DB File : BRAND 1 WB.DBNumber of Lanes : 1
Posted Speed Limit :
938831.45ApolloLast Connected Device Type :
Version Number :Serial Number :
Lane #1 Configuration# Dir. Information Volume Mode Volume Sensors Divide By 2 Comment1. Westbound
GPS Lat/Lon :
Lane #1 Basic Volume Data From: 00:00 - 04/26/2016 To: 23:59 - 04/27/2016Date Time :00 :15 :30 :45 Total
04/26/16 00:00 0 0 0 1 1 Tue 01:00 0 0 0 1 1
02:00 0 0 0 0 003:00 0 0 0 0 004:00 0 0 0 0 005:00 0 1 0 0 106:00 0 1 0 0 107:00 3 0 1 0 408:00 0 2 0 1 309:00 1 0 1 1 310:00 2 0 1 1 411:00 1 3 4 1 912:00 0 1 1 0 213:00 5 1 2 0 814:00 2 1 2 0 515:00 3 0 1 5 916:00 1 4 4 4 1317:00 5 1 0 4 1018:00 5 2 2 3 1219:00 2 3 2 1 820:00 1 1 1 0 321:00 1 1 0 3 522:00 0 0 0 1 123:00 0 1 1 0 2
Day Total : 105AM Total :PM Total :
Peak AM Hour :Peak PM Hour :
Average Period :Average Hour :
Peak AM Factor :Peak PM Factor :
27 (25.7%)78 (74.3%)
0.5620.850
1.14.4
10:45 =16:15 =
9 (8.6%)17 (16.2%)
Centurion Basic Volume Report Printed: 04/28/16 Page 1Centurion Basic Volume Report Printed: 04/28/16 Page 1
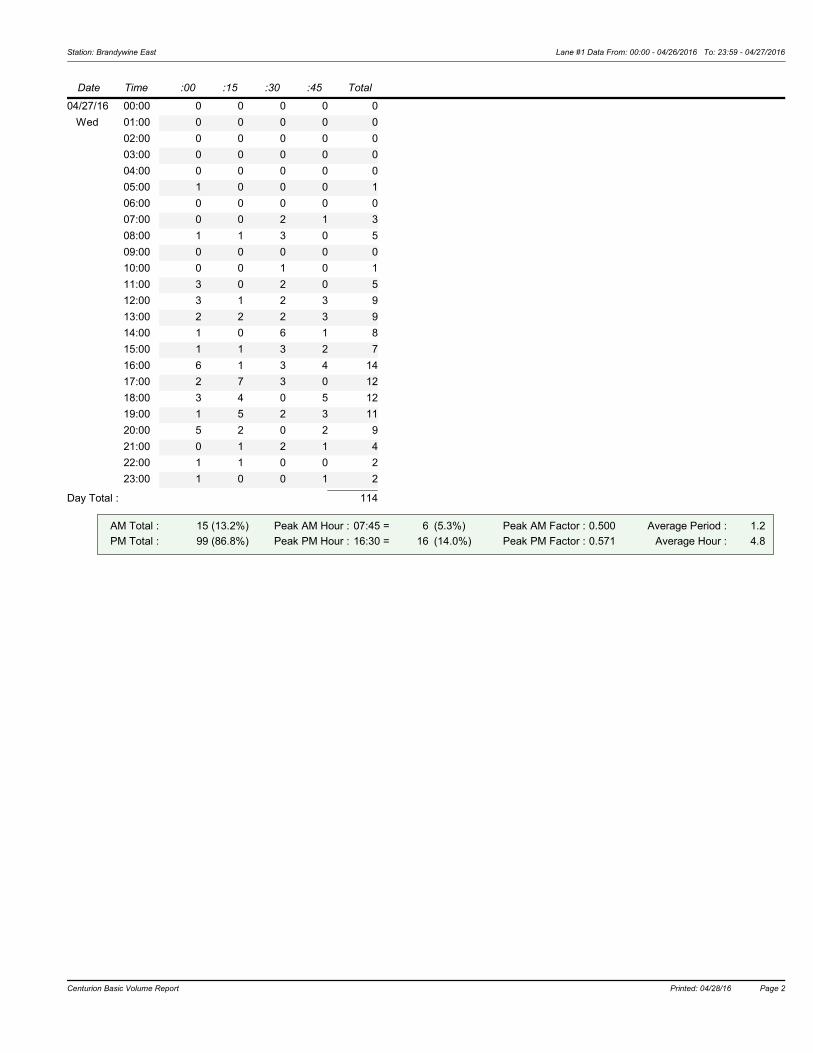
Station: Brandywine East Lane #1 Data From: 00:00 - 04/26/2016 To: 23:59 - 04/27/2016
Date Time :00 :15 :30 :45 Total 04/27/16 00:00 0 0 0 0 0 Wed 01:00 0 0 0 0 0
02:00 0 0 0 0 003:00 0 0 0 0 004:00 0 0 0 0 005:00 1 0 0 0 106:00 0 0 0 0 007:00 0 0 2 1 308:00 1 1 3 0 509:00 0 0 0 0 010:00 0 0 1 0 111:00 3 0 2 0 512:00 3 1 2 3 913:00 2 2 2 3 914:00 1 0 6 1 815:00 1 1 3 2 716:00 6 1 3 4 1417:00 2 7 3 0 1218:00 3 4 0 5 1219:00 1 5 2 3 1120:00 5 2 0 2 921:00 0 1 2 1 422:00 1 1 0 0 223:00 1 0 0 1 2
Day Total : 114AM Total :PM Total :
Peak AM Hour :Peak PM Hour :
Average Period :Average Hour :
Peak AM Factor :Peak PM Factor :
15 (13.2%)99 (86.8%)
0.5000.571
1.24.8
07:45 =16:30 =
6 (5.3%)16 (14.0%)
Centurion Basic Volume Report Printed: 04/28/16 Page 2
Station: Brandywine East Lane #3 Data From: 00:00 - 04/26/2016 To: 23:59 - 04/27/2016
Lane #3 Configuration
Lane #3 Basic Volume Data From: 00:00 - 04/26/2016 To: 23:59 - 04/27/2016
# Dir. Information Volume Mode Volume Sensors Divide By 2 Comment3. Eastbound
Date Time :00 :15 :30 :45 Total 04/26/16 00:00 0 0 0 0 0 Tue 01:00 0 0 0 0 0
02:00 0 0 0 0 003:00 0 0 0 0 004:00 0 0 0 0 005:00 0 1 1 0 206:00 0 2 0 1 307:00 6 1 4 6 1708:00 2 2 3 0 709:00 1 2 4 1 810:00 1 0 0 4 511:00 1 0 1 2 412:00 0 1 0 2 313:00 3 2 0 3 814:00 2 3 0 1 615:00 0 1 2 3 616:00 2 0 4 3 917:00 5 2 0 1 818:00 2 2 1 5 1019:00 2 1 0 0 320:00 0 1 1 0 221:00 0 2 0 2 422:00 0 0 1 0 123:00 0 0 0 0 0
Day Total : 106AM Total :PM Total :
Peak AM Hour :Peak PM Hour :
Average Period :Average Hour :
Peak AM Factor :Peak PM Factor :
46 (43.4%)60 (56.6%)
0.7080.700
1.14.4
07:00 =16:30 =
17 (16.0%)14 (13.2%)
Centurion Basic Volume Report Printed: 04/28/16 Page 3Centurion Basic Volume Report Printed: 04/28/16 Page 3

Station: Brandywine East Lane #3 Data From: 00:00 - 04/26/2016 To: 23:59 - 04/27/2016
Date Time :00 :15 :30 :45 Total 04/27/16 00:00 1 0 1 0 2 Wed 01:00 0 0 0 0 0
02:00 0 0 0 0 003:00 0 0 0 0 004:00 0 0 0 0 005:00 1 0 0 0 106:00 1 1 0 0 207:00 7 3 4 7 2108:00 1 3 2 2 809:00 0 3 3 2 810:00 0 2 1 0 311:00 1 3 1 3 812:00 1 2 0 1 413:00 1 2 0 4 714:00 3 1 4 0 815:00 1 4 6 6 1716:00 4 4 1 5 1417:00 1 0 1 2 418:00 5 5 3 2 1519:00 4 1 1 0 620:00 1 1 1 2 521:00 1 2 0 2 522:00 1 3 1 2 723:00 0 0 0 0 0
Day Total : 145AM Total :PM Total :
Peak AM Hour :Peak PM Hour :
Average Period :Average Hour :
Peak AM Factor :Peak PM Factor :
53 (36.6%)92 (63.4%)
0.7500.833
1.56.0
07:00 =15:15 =
21 (14.5%)20 (13.8%)
Centurion Basic Volume Report Printed: 04/28/16 Page 4Centurion Basic Volume Report Printed: 04/28/16 Page 4

Centurion Basic Volume Report Printed: 04/28/16 Page 5
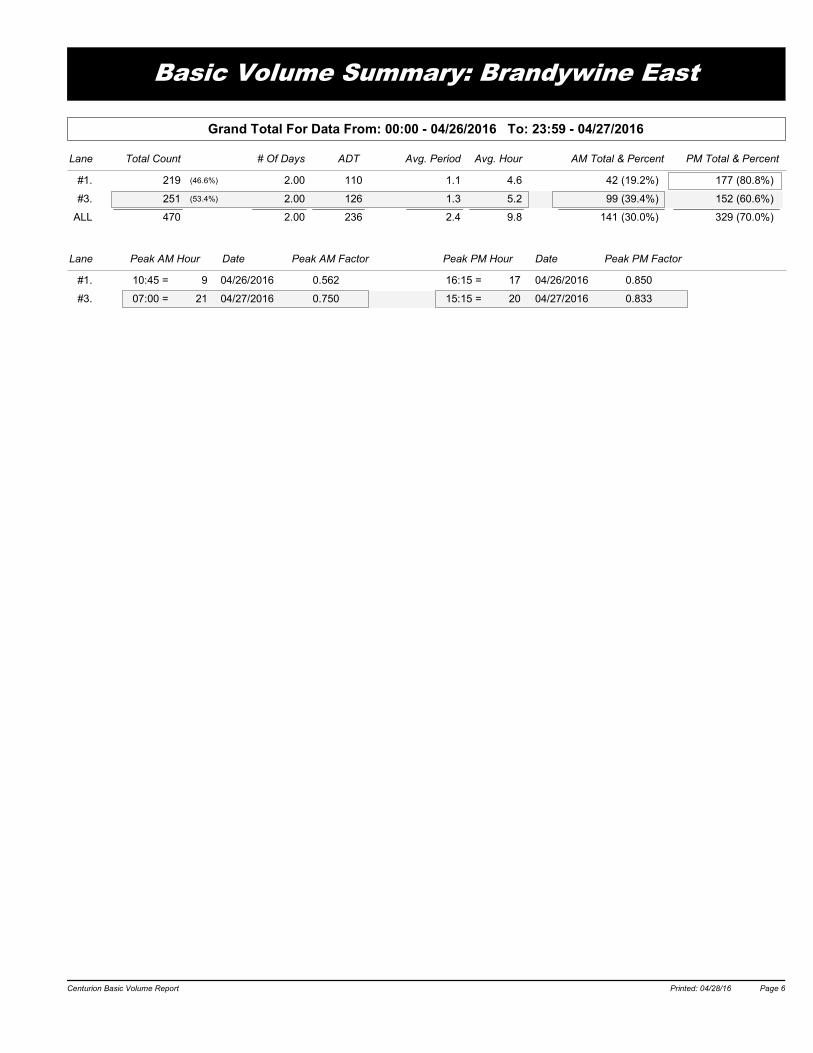
Basic Volume Summary: Brandywine EastGrand Total For Data From: 00:00 - 04/26/2016 To: 23:59 - 04/27/2016
Total Count # Of Days ADT Avg. Period PM Total & PercentAvg. Hour AM Total & PercentLane #1. 219 2.00 110 1.1 4.6 42 177(46.6%) (80.8%)(19.2%) #3. 251 2.00 126 1.3 5.2 99 152(53.4%) (60.6%)(39.4%) ALL 470 2.00 236 2.4 9.8 141 329 (70.0%)(30.0%)
Lane Peak AM Hour Peak AM Factor Peak PM Hour Peak PM FactorDate Date #1. 10:45 = 9 0.562 16:15 = 17 0.85004/26/2016 04/26/2016 #3. 07:00 = 21 0.750 15:15 = 20 0.83304/27/2016 04/27/2016
Centurion Basic Volume Report Printed: 04/28/16 Page 6
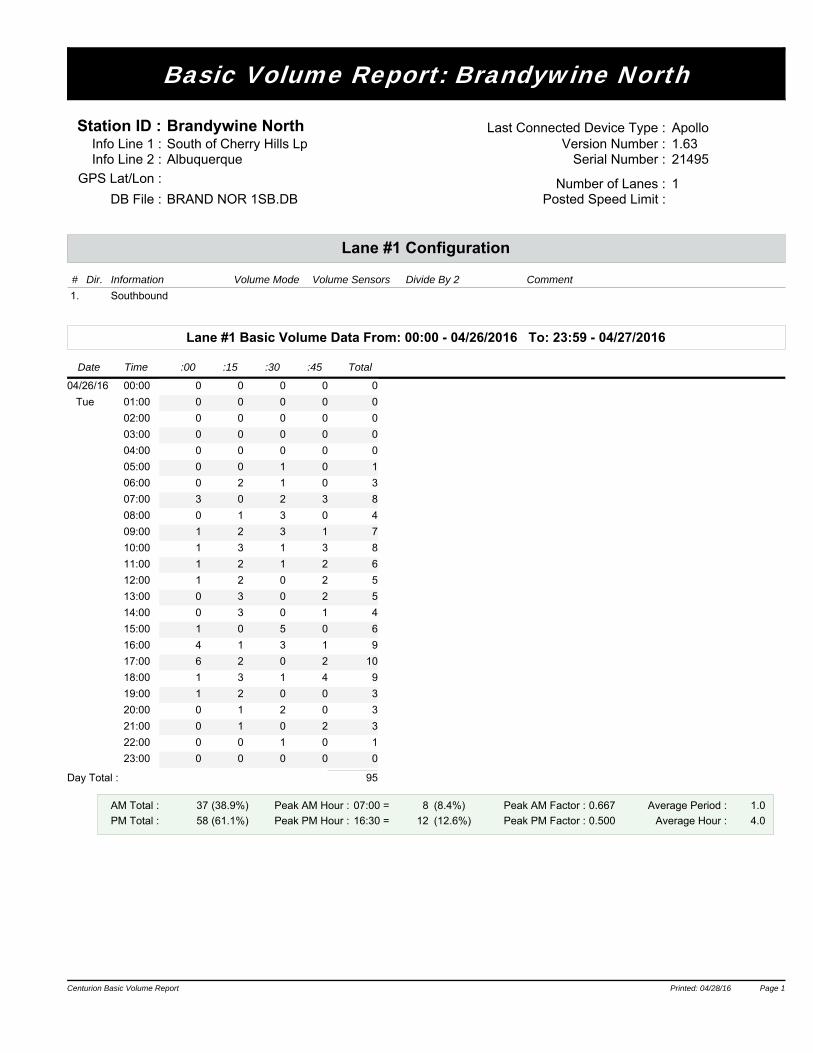
Basic Volume Report: Brandywine North
Station ID : Brandywine NorthInfo Line 1 : South of Cherry Hills LpInfo Line 2 : Albuquerque
DB File : BRAND NOR 1SB.DBNumber of Lanes : 1
Posted Speed Limit :
214951.63ApolloLast Connected Device Type :
Version Number :Serial Number :
Lane #1 Configuration
# Dir. Information Volume Mode Volume Sensors Divide By 2 Comment
1. Southbound
GPS Lat/Lon :
Lane #1 Basic Volume Data From: 00:00 - 04/26/2016 To: 23:59 - 04/27/2016
Date Time :00 :15 :30 :45 Total
04/26/16 00:00 0 0 0 0 0
Tue 01:00 0 0 0 0 0
02:00 0 0 0 0 0
03:00 0 0 0 0 0
04:00 0 0 0 0 0
05:00 0 0 1 0 1
06:00 0 2 1 0 3
07:00 3 0 2 3 8
08:00 0 1 3 0 4
09:00 1 2 3 1 7
10:00 1 3 1 3 8
11:00 1 2 1 2 6
12:00 1 2 0 2 5
13:00 0 3 0 2 5
14:00 0 3 0 1 4
15:00 1 0 5 0 6
16:00 4 1 3 1 9
17:00 6 2 0 2 10
18:00 1 3 1 4 9
19:00 1 2 0 0 3
20:00 0 1 2 0 3
21:00 0 1 0 2 3
22:00 0 0 1 0 1
23:00 0 0 0 0 0
Day Total : 95
AM Total :
PM Total :
Peak AM Hour :
Peak PM Hour :
Average Period :
Average Hour :
Peak AM Factor :
Peak PM Factor :
37 (38.9%)
58 (61.1%)
0.667
0.500
1.0
4.0
07:00 =
16:30 =
8 (8.4%)
12 (12.6%)
Centurion Basic Volume Report Printed: 04/28/16 Page 1Centurion Basic Volume Report Printed: 04/28/16 Page 1

Station: Brandywine North Lane #1 Data From: 00:00 - 04/26/2016 To: 23:59 - 04/27/2016
Date Time :00 :15 :30 :45 Total
04/27/16 00:00 1 0 1 0 2
Wed 01:00 0 0 0 0 0
02:00 0 0 0 0 0
03:00 0 0 0 0 0
04:00 0 0 0 0 0
05:00 1 0 0 0 1
06:00 0 0 0 0 0
07:00 5 2 2 3 12
08:00 0 3 2 3 8
09:00 0 4 4 1 9
10:00 2 4 1 1 8
11:00 1 3 0 2 6
12:00 1 3 1 2 7
13:00 1 1 2 3 7
14:00 2 1 4 0 7
15:00 1 4 7 4 16
16:00 5 5 1 4 15
17:00 3 1 2 2 8
18:00 4 6 3 1 14
19:00 4 3 0 0 7
20:00 1 1 1 0 3
21:00 1 1 0 2 4
22:00 1 2 1 1 5
23:00 0 0 0 0 0
Day Total : 139
AM Total :
PM Total :
Peak AM Hour :
Peak PM Hour :
Average Period :
Average Hour :
Peak AM Factor :
Peak PM Factor :
46 (33.1%)
93 (66.9%)
0.600
0.750
1.4
5.8
07:00 =
15:30 =
12 (8.6%)
21 (15.1%)
Centurion Basic Volume Report Printed: 04/28/16 Page 2

Station: Brandywine North Lane #3 Data From: 00:00 - 04/26/2016 To: 23:59 - 04/27/2016
Lane #3 Configuration
Lane #3 Basic Volume Data From: 00:00 - 04/26/2016 To: 23:59 - 04/27/2016
# Dir. Information Volume Mode Volume Sensors Divide By 2 Comment
3. Northbound
Date Time :00 :15 :30 :45 Total
04/26/16 00:00 0 0 0 1 1
Tue 01:00 0 0 0 1 1
02:00 0 0 0 0 0
03:00 0 0 0 0 0
04:00 0 0 0 0 0
05:00 0 1 0 0 1
06:00 0 3 3 1 7
07:00 1 1 1 1 4
08:00 0 2 0 1 3
09:00 1 0 1 2 4
10:00 2 3 2 2 9
11:00 1 2 2 0 5
12:00 2 2 2 1 7
13:00 2 0 3 0 5
14:00 2 0 2 1 5
15:00 3 1 1 2 7
16:00 1 2 1 1 5
17:00 3 1 1 3 8
18:00 2 3 2 2 9
19:00 0 2 2 1 5
20:00 1 1 1 0 3
21:00 2 1 0 0 3
22:00 0 0 0 0 0
23:00 0 1 0 0 1
Day Total : 93
AM Total :
PM Total :
Peak AM Hour :
Peak PM Hour :
Average Period :
Average Hour :
Peak AM Factor :
Peak PM Factor :
35 (37.6%)
58 (62.4%)
0.750
0.833
1.0
3.9
09:45 =
17:45 =
9 (9.7%)
10 (10.8%)
Centurion Basic Volume Report Printed: 04/28/16 Page 3Centurion Basic Volume Report Printed: 04/28/16 Page 3

Station: Brandywine North Lane #3 Data From: 00:00 - 04/26/2016 To: 23:59 - 04/27/2016
Date Time :00 :15 :30 :45 Total
04/27/16 00:00 0 0 0 0 0
Wed 01:00 0 0 0 0 0
02:00 0 0 0 0 0
03:00 0 0 0 0 0
04:00 0 0 0 0 0
05:00 1 0 0 0 1
06:00 0 1 1 2 4
07:00 0 1 3 1 5
08:00 1 0 5 1 7
09:00 1 2 0 1 4
10:00 1 0 2 1 4
11:00 3 0 0 1 4
12:00 3 2 1 3 9
13:00 3 0 1 4 8
14:00 2 0 4 0 6
15:00 1 2 0 3 6
16:00 4 4 2 4 14
17:00 2 4 4 1 11
18:00 2 3 1 2 8
19:00 0 3 1 2 6
20:00 1 2 0 2 5
21:00 0 2 1 1 4
22:00 0 0 0 0 0
23:00 0 0 0 0 0
Day Total : 106
AM Total :
PM Total :
Peak AM Hour :
Peak PM Hour :
Average Period :
Average Hour :
Peak AM Factor :
Peak PM Factor :
29 (27.4%)
77 (72.6%)
0.450
0.875
1.1
4.4
08:30 =
16:00 =
9 (8.5%)
14 (13.2%)
Centurion Basic Volume Report Printed: 04/28/16 Page 4Centurion Basic Volume Report Printed: 04/28/16 Page 4

Centurion Basic Volume Report Printed: 04/28/16 Page 5
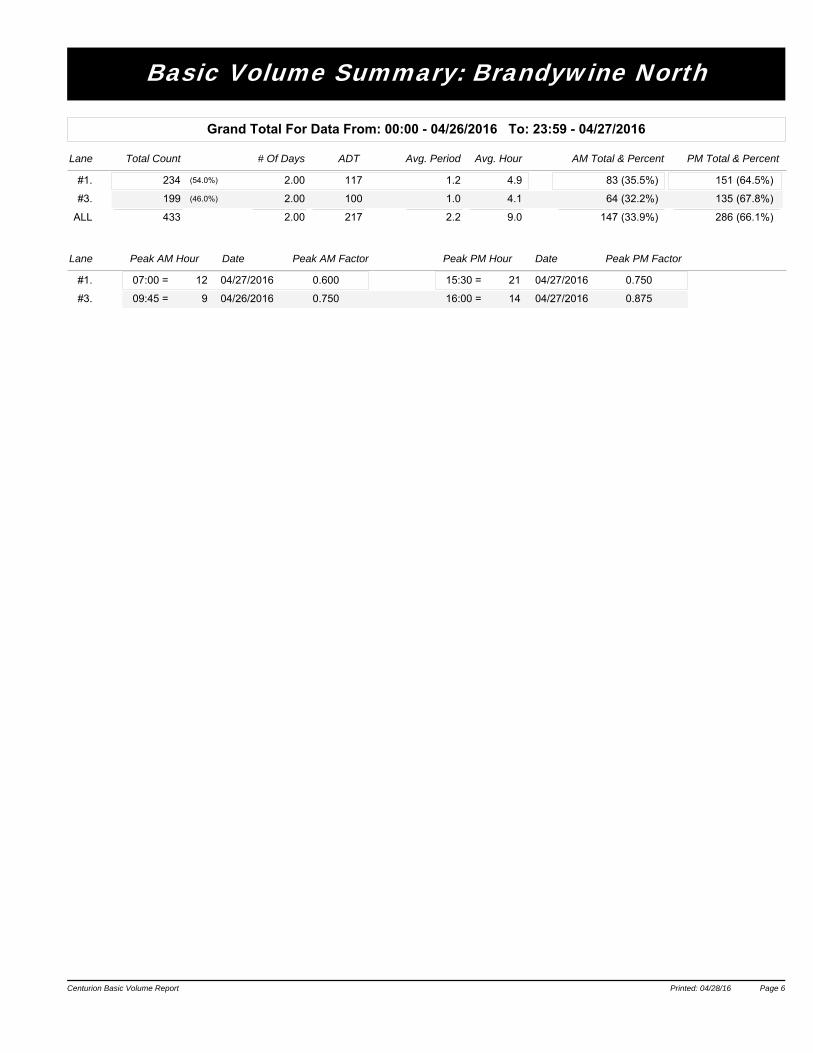
Basic Volume Summary: Brandywine North
Grand Total For Data From: 00:00 - 04/26/2016 To: 23:59 - 04/27/2016
Total Count # Of Days ADT Avg. Period PM Total & PercentAvg. Hour AM Total & PercentLane
#1. 234 2.00 117 1.2 4.9 83 151(54.0%) (64.5%)(35.5%)
#3. 199 2.00 100 1.0 4.1 64 135(46.0%) (67.8%)(32.2%)
ALL 433 2.00 217 2.2 9.0 147 286 (66.1%)(33.9%)
Lane Peak AM Hour Peak AM Factor Peak PM Hour Peak PM FactorDate Date
#1. 07:00 = 12 0.600 15:30 = 21 0.75004/27/2016 04/27/2016
#3. 09:45 = 9 0.750 16:00 = 14 0.87504/26/2016 04/27/2016
Centurion Basic Volume Report Printed: 04/28/16 Page 6

Brandywine Road Speed Study
Final Report City of Albuquerque – Department of Municipal Development
Page | C 1
Appendix C

REPORT DATE MONTH DY YEAR TIME HOUR DAY
23249052 2/4/2011 2 4 2011 1030 10 Friday
COUNTY CITY AGENCY ASTREET BSTREET ROUTE MILEPOST VNUM
Bernalillo
Albuquerqu
e
Driver
Report
8601
BRANDYWI
NE RD NE
UNKNOWN -
NOT GIVEN 0.00 2
TOTAL KILLED CLASSA CLASSB CLASSC UNHURT SEVERITY CLASS
2 0 0 0 0 2
Property
Damage
Only Crash Parked Vehicle
TOPCFACC ANALYSIS ALCINV DRUGINV PEDINV MCINV PECINV TRKINV
Driver
Inattention
Back Into
Parked
None
Indicated
None
Indicated
Not
Involved
Not
Involved
Not
Involved Not Involved
HZINV LIGHT WEATHER HITRUN DOTPROP MAXDAM MAXENF SYSTEM
Not
Involved Daylight Clear Yes Other Veh Urban
FUNCTCL ELEMENT ROADREL CHARACT GRADE FEET MILES IDRECT
Urban Local
Non-
Intersection
Off The
Roadway Straight Level 9998 0.00 U
DIRECT
Mid-Region Council of Governments Crash Records from Brandywine Road