brazilian pulp and paper industry - an binh paper index industry overview 3 main world and pulp and...
TRANSCRIPT

Brazilian Pulp And Paper Industry
May 2013

2
Index
Industry Overview 3
Main World And Pulp and Paper Producers 2009 4
Planted Forests by the Brazilian Pulp and Paper Industry 5
Planted Forests Area in the World 6
Planted Forests Productivity Evolution 7
Forestry: Brazil, World Benchmark 8
Rotation And Yield Comparison Hardwood Pulp Species 9
Rotation And Yield Comparison Softwood Pulp Species 10
Forest Area Required for Pulp Mill 11
Contribution to the Environment 12
Energy Matrix 13
Social Contribution 14
Brazilian Pulp and Paper Production 15
Recycled Paper Recovery Rate 16
Recycled Paper 17
Paper Apparent Consumption per Capita 18
Industry Trade Balance Evolution 19
Agribusiness selected products 20
Industry Performance 21
Paper Domestic Sales 22
Industry Trade Balance 23
Brazilian Pulp Export by Destination 2011 24
Brazilian Pulp Export by Destination 25
China Imports by Origin Bleached Hardwood Kraft Pulp 26
Brazilian Paper Export by Destination 27
Members Companies 28

3
Industry Overview
Arquivo Celso Foelkel
3
220 companies spread in 540 municipalities, located in 18 States
2.2 million hectares of planted area for industrial use
2.9 million hectares of preserved forests
Total certified forest area: 2.7 million hectares
Exports 2012: US$ 6.7 billion
Trade Balance 2012: US$ 4.7 billion
Taxes: R$ 3.5 billion
Jobs: 128 thousand direct jobs (industry 77 thousand, forests 51 thousand)
and 640 thousand indirect jobs

4
Main World and Pulp and Paper Producers 2011
1,000 tons 1,000 tons
1. USA 49,740 1. China 99,300
2. China 19,542 2. USA 75,083
3. Canada 18,308 3. Japan 26,627
4. Brazil * 13,922 4. Germany 22,698
5. Sweden 11,859 5. Canada 12,112
6. Finland 10,363 6. South Korea 11,492
7. Japan 9,020 7. Finland 11,329
8. Russia 7,453 8. Sweden 11,298
9. Indonesia 6,805 9. Brazil 10,159
10. Chile 4,876 10. Indonesia 10,035
11. India 3,999 11. India 9,655
12. Germany 2,725 12. Italy 9,130
Other 25,215 Other 89,959
TOTAL WORLD 183,827 TOTAL WORLD 398,877
Source: RISI
* Source: Bracelpa
Country Country
PULP PAPER
5
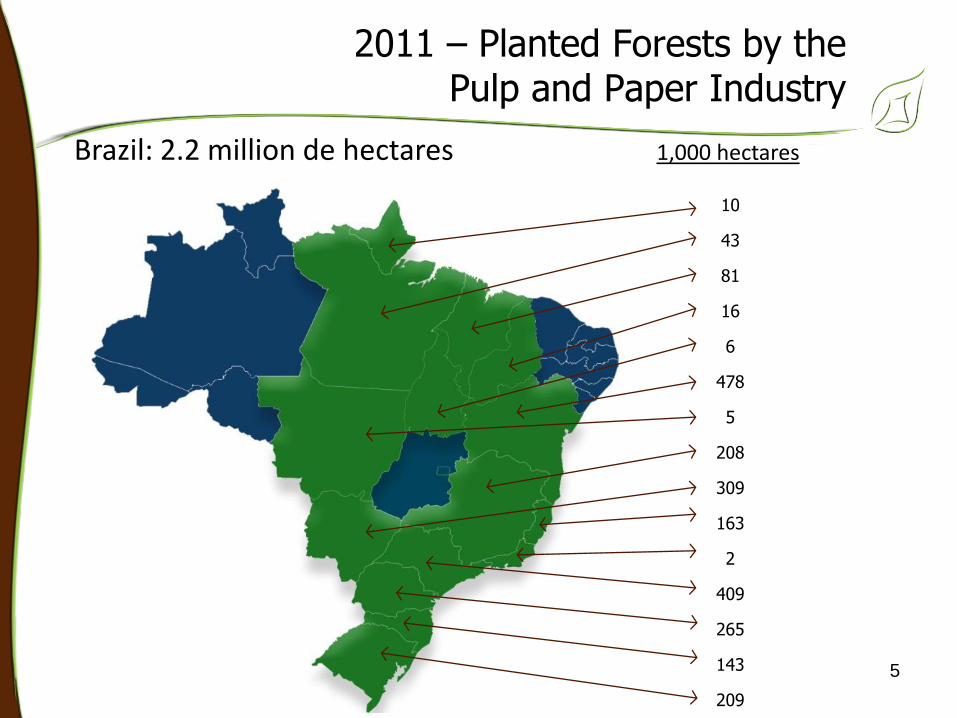
2011 – Planted Forests by the Pulp and Paper Industry
1,000 hectares Brazil: 2.2 million de hectares
10
43
81
16
6
478
5
208
309
163
2
409
265
143
209
6
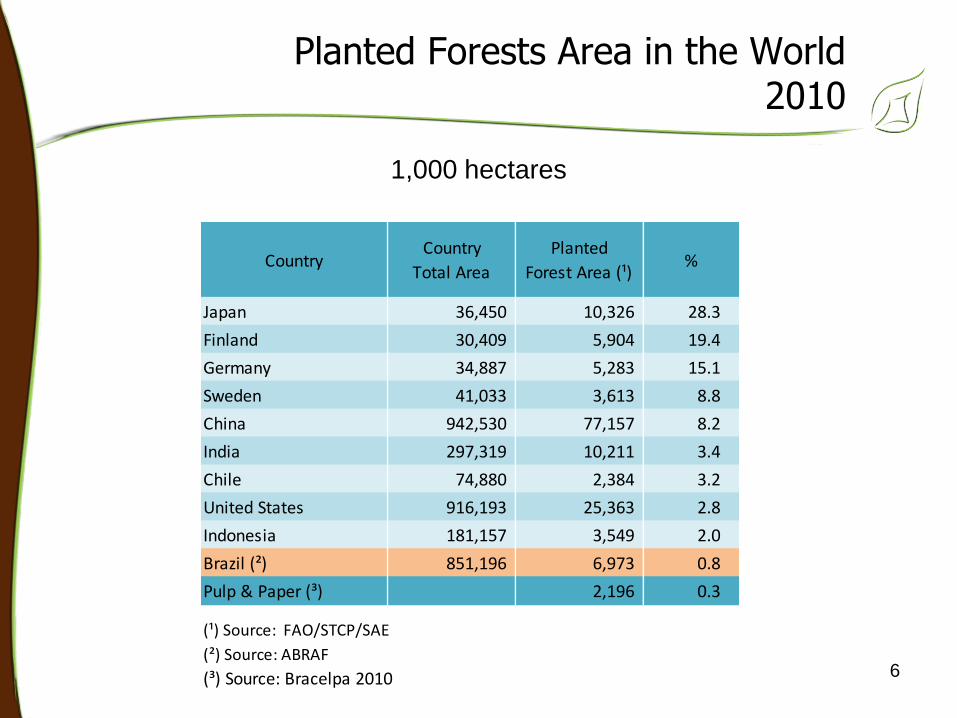
Planted Forests Area in the World 2010
1,000 hectares
CountryCountry
Total Area
Planted
Forest Area (¹)%
Japan 36,450 10,326 28.3
Finland 30,409 5,904 19.4
Germany 34,887 5,283 15.1
Sweden 41,033 3,613 8.8
China 942,530 77,157 8.2
India 297,319 10,211 3.4
Chile 74,880 2,384 3.2
United States 916,193 25,363 2.8
Indonesia 181,157 3,549 2.0
Brazil (²) 851,196 6,973 0.8
Pulp & Paper (³) 2,196 0.3
(¹) Source: FAO/STCP/SAE
(²) Source: ABRAF
(³) Source: Bracelpa 2010

7
Planted Forests Productivity Evolution
REASONS FOR HIGH PRODUCTIVITY LEVELS
Climate and soilResearchOrganized private sectorHigh qualified labor force
TECHNOLOGICAL ADVANCES
GeneticsBiotechnologyHigh quality raw materialSocio-environmental planningSustainable Forest ManagementRotation
Species 1980 2011Growth
Rate
• Eucalyptus 24 44 83%
• Pinus 19 38 100%
WOOD FOR PULP PRODUCTION
Productivity (m³/ha/year)
8
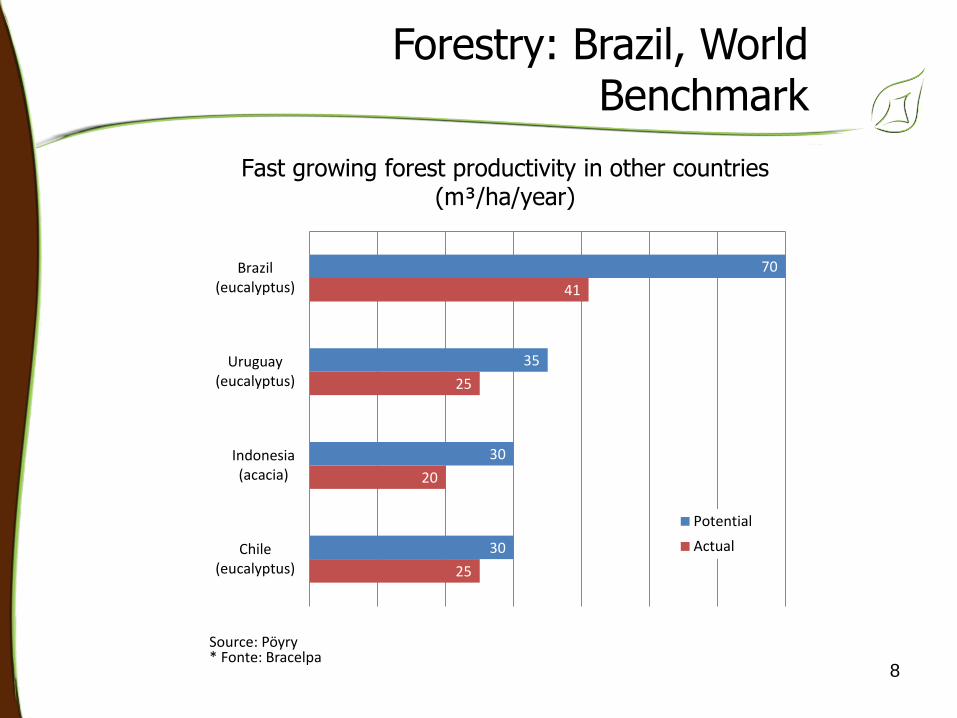
Fast growing forest productivity in other countries (m³/ha/year)
Source: Pöyry * Fonte: Bracelpa
Forestry: Brazil, World Benchmark
25
20
25
41
30
30
35
70
Chile(eucalyptus)
Indonesia(acacia)
Uruguay(eucalyptus)
Brazil(eucalyptus)
Potential
Actual

9
Rotation and Yield Comparison Hardwood Pulp Species
Species CountryRotation
(years)
Yield
m3/ha/year
Eucalyptus Brazil 7 44
Eucalyptus South Africa 8-10 20
Eucalyptus Chile 10-12 25
Eucalyptus Portugal 12-15 12
Eucalyptus Spain 12-15 10
Birch Sweden 35-40 6
Birch Finland 35-40 4
Source: Pöyry

10
Rotation and Yield Comparison Softwood Pulp Species
Species CountryRotation
(years)
Yield
m3/ha/year
Pinus spp Brazil 15 38
Pinus radiata Chile 25 22
Pinus radiata New Zealand 25 22
Pinus elliottii / taeda United States 25 10
Douglas Fir Canada (coast) 45 7
Picea abies Sweden 70-80 4
Picea abies Finland 70-80 4
Picea glauca Canada (inland) 55 3
Picea mariana Canada (east) 90 2
Source: Pöyry

11
Forest Area (ha) Required for a 1,0 million tons/year Admit Pulp Mill
Source: Pöyry
Brazil 100.000
Iberian Peninsula300.000
Scandinavia720.000

12
Contribution to the Environment by the Sector’s Planted Forests
Planted forests do not compete with traditional agriculture
Restoration of degraded land
Soil conservation
Using land not fit for agriculture
Mixing plantations and natural forests
Biodiversity protection
Watershed protection
CO2 sequestration
Less pressure on natural forests12

13
1970-2010 – Energy Matrix of the Pulp and Paper Industry
Source: Brazilian National Energy Balance* Sub Product (Firewood)
18
33
4752
65 65 6628
15
27 21
19 19 18
4548
18 1907 06 06
02 05 07 08 081004 05 03 02 02 02
0%
20%
40%
60%
80%
100%
1970 1980 1990 2000 2008 2009 2010
Black Licor Firewood Fuel Oil Natural Gas Other

14
Social Contribution
14
Pulp and paper industry has a prominent presence by motivating economic and social development in regions far away from big urban centers, investing in projects and initiatives in areas as:
Education
Health
Environmental responsibility
Income and jobs generation
Forest Fostering

15
Brazilian Pulp and Paper Production
1970 1980 1990 2008 2010 2012
Pulp 0,8 3,1 4,4 13 14 14
Paper 1,1 3,4 4,7 09 10 10
0
2
4
6
8
10
12
14
16
milh
ões
t
Annual Growth AveragePulp 7.1%
Paper 5.4%

16
Recycled Paper Recovery Rate
36%35%
38%
47%
45%
0
1.500
3.000
4.500
6.000
7.500
9.000
10.500
1990 1995 2000 2005 2011
tons
Paper Apparent Consumption Recovered Paper Consumption Recovery Rate %

17
2010 - Recycled Paper
* Volume of recovered paper in the country divided by paper apparent consumption
Source: RISI
** Source Bracelpa
Selected Countries
South Korea 91.6%
Germany 84.8%
Japan 79.3%
United Kingdom 78.7%
Spain 73.8%
United States 63.6%
Italy 62.8%
Indonesia 53.4%
Finland 48.9%
Mexico 48.8%
Argentina 45.8%
Brazil ** 45.5%
China 40.0%
Russia 36.4%
India 25.9%
Recovery Rate *

18
Paper Apparent Consumption Per Capita
Source: RISI *Source: Bracelpa
281
243
240,2
220
185
178
168
152
79
69
64
61
49
Finland
Germany
USA
Japan
Canada
Italy
UK
France
Chile
China
Mexico
Argentina
Brazil *
SELECTED COUNTRIESkg per capita
World Average57.0 kg per capita

19
Industry Trade Balance Evolution 1993-2012
Source: SECEX
0
1.000
2.000
3.000
4.000
5.000
6.000
7.000
8.000
93 94 95 96 97 98 99 00 01 02 03 04 05 06 07 08 09 10 11 12
US$
Mill
ion
Export Import Balance

20
Agribusiness Selected Products Exports x Planted Area in 2011
Source: CONAB/FNP/MAPA/SECEX
PRODUCTSEXPORTS
US$ million
PLANTED AREA
thousand haUS$ / ha
Soy Complex 24,154 25,018 965
Sugar + Alcohol 16,404 8,567 1,915
Coffee 8,731 2,753 3,171
Pulp & Paper 7,190 2,347 3,063
Corn 2,766 15,451 179
Cotton 1,977 1,430 1,383

21
Industry Perfomance 1,000 tons
2012 2013 (2)
.Production 13,922 13,999 0.6 4,688 4,834 3.1
.Import (1) 392 411 4.8 128 145 13.3
.Export (1) 8,478 8,513 0.4 2,837 2,967 4.6
.Apparent Consumption 5,836 5,897 1.0 1,979 2,012 1.7
2012 2013 (2)
.Production 10,159 10,171 0.1 3,369 3,435 2.0
.Import (1) 1,455 1,396 -4.1 472 430 -8.9
.Export (1) 2,052 1,875 -8.6 667 619 -7.2
.Apparent Consumption 9,562 9,692 1.4 3,174 3,246 2.3
(1) Source: SECEX(2) Preliminary data
PULP
PAPER
2011
2011
2012
2012
%
%
Jan-Apr
Jan-Apr
%
%

22
Paper Domestic Sales 1,000 tons
* Preliminary data
300
325
350
375
400
425
450
475
500
Jan Feb Mar Apr May Jun Jul Aug Sep Oct Nov Dez
2012 2013
+ 5
.8 %
300
500
700
900
1.100
1.300
1.500
1.700
1.900
Jan-Apr2012
Jan-Apr2013*

23
Industry Trade Balance US$ Million FOB
2012 2013 %
Export 7,190 6,657 -7.4 2,194 2,246 2.4
.Pulp 5,002 4,706 -5.9 1,537 1,589 3.4
.Paper 2,188 1,951 -10.8 657 657 0.0
Import 2,128 1,945 -8.6 657 604 -8.1
.Pulp 374 339 -9.4 110 112 1.8
.Paper 1,754 1,606 -8.4 547 492 -10.1
Balance 5,062 4,712 -6.9 1,537 1,642 6.8
.Pulp 4,628 4,367 -5.6 1,427 1,477 3.5
.Paper 434 345 -20.5 110 165 50.0
Source: SECEX
2011 2012 %Jan-Apr

24
Pulp Paper
Source: SECEX
Brazilian Exports by Destination 2012
LatinAmerica
1%
Europe46%
NorthAmerica
19%
Africa0%
Asia &Oceania
8%
China26%
US$ 4.7 billion
LatinAmerica
59%Europe
15%
NorthAmerica
10%
Africa5%
Asia &Oceania
7%
China4%
US$ 2.0 billion

25
Jan-Apr/ 2012 Jan-Apr/2013
Source: SECEX
Brazilian Pulp Exports by Destination
LatinAmerica
1%
Europe44%
NorthAmerica
17%
Africa0%
Asia &Oceania
9%
China29%
US$ 1.5 billion
LatinAmerica
1%
Europe40%North
America18%
Africa0%
Asia &Oceania
8%
China33%
US$ 1.6 billion

26
China – Imports By Origin Bleached Hardwood Kraft Pulp
24 Source: SVEN DATA
By Region of Origin US$ millions 1,000 t
Europe Asia Brazil OtherOther America
625 707
498 534
921 739
0
500
1.000
1.500
2.000
2.500
Jan-Apr/2012 Jan-Apr/2013
-20 %
7 %
13 %
Var.12/11
349 419
279335
512460
0
200
400
600
800
1.000
1.200
1.400
Jan-Apr/2012 Jan-Apr/2013
-10 %
20 %
20 %
Var.12/11

27
Brazilian Paper Exports by Destination
25
Jan-Apr/2012 Jan-Apr/2013
Source: SECEX
LatinAmerica
54%
Europe16%
NorthAmerica
9%
Africa8%
Asia &Oceania
8%
China5%
US$ 657 million
LatinAmerica
54%
Europe16%
NorthAmerica
12%
Africa5%
Asia &Oceania
9%
China4%
US$ 657 million

28
Members Companies
Fellow Members Manufacturing Members
Adami
Arauco do Brasil
Arjo Wiggins Security
Bahia Specialty Cellulose
Bignardi
Bonet
Celulose Irani
Celulose Riograndense
Cenibra
Cocelpa
Copapa
Eldorado
Facepa
Fibria
Ibema
Iguaçu
International Paper
Grupo Orsa - Jari Celulose
Kimberly-Clark
Klabin
KM Papel
Lwarcel
Manikraft
MD Papéis
Melhoramentos Florestal
Melhoramentos Papéis
Miguel Forte
Mili
Multiverde
Nobrecel
Norske Skog Pisa
OJI Papéis
Papirus
Primo Tedesco
Rigesa
Sanovo
Santa Maria
Santher
Stora Enso
Suzano
SWM
Trombini
Veracel
Viscofan
Vitopel
Albany International Brazil
ArborGen
Carbocloro
Eka Chemicals
Poyry Technologia

29
Rua Olimpíadas, 66 - 9º andar São Paulo – SP - Brazil
CEP 04551-000 Phone: +55 11 3018-7800
Fax: +55 11 3018-7813
www.bracelpa.org.br [email protected]