bridging standards a - european commission · • sdmx, which stands for statistical data and...
TRANSCRIPT
Bridging standards – a case study for a SDMX-XBRL(DPM) mapping
Zlatina Hofmeister
European Central Bank
Ole Sørensen
European Central Bank
[Please select]
[Please select]
Rubric
www.ecb.europa.eu ©
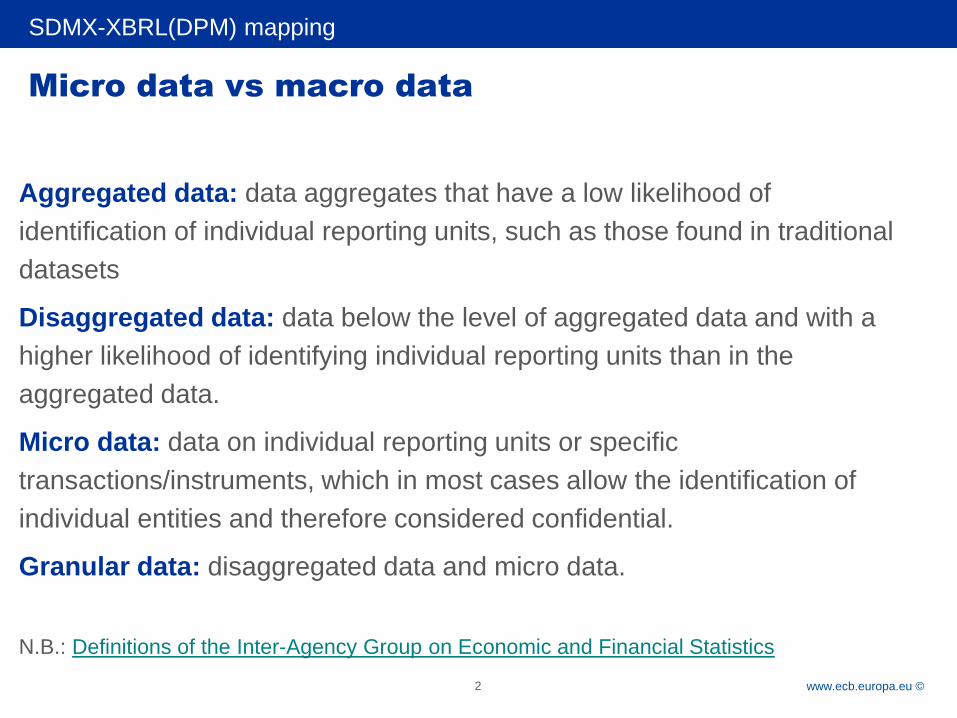
Micro data vs macro data
Aggregated data: data aggregates that have a low likelihood of
identification of individual reporting units, such as those found in traditional
datasets
Disaggregated data: data below the level of aggregated data and with a
higher likelihood of identifying individual reporting units than in the
aggregated data.
Micro data: data on individual reporting units or specific
transactions/instruments, which in most cases allow the identification of
individual entities and therefore considered confidential.
Granular data: disaggregated data and micro data.
N.B.: Definitions of the Inter-Agency Group on Economic and Financial Statistics
SDMX-XBRL(DPM) mapping
2
Rubric
www.ecb.europa.eu ©
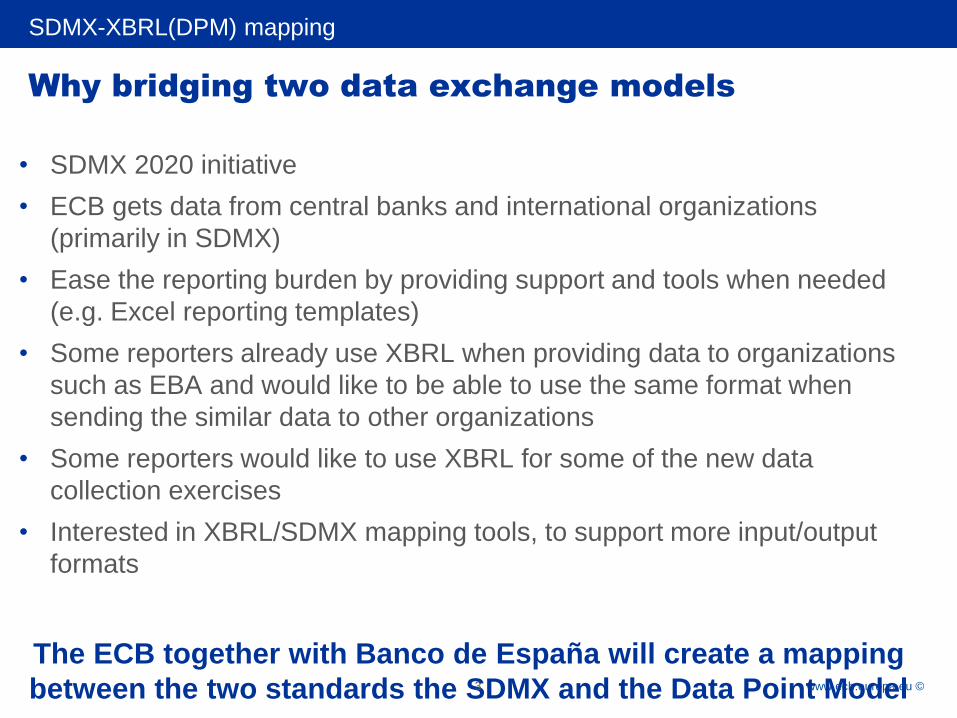
Why bridging two data exchange models
• SDMX 2020 initiative
• ECB gets data from central banks and international organizations
(primarily in SDMX)
• Ease the reporting burden by providing support and tools when needed
(e.g. Excel reporting templates)
• Some reporters already use XBRL when providing data to organizations
such as EBA and would like to be able to use the same format when
sending the similar data to other organizations
• Some reporters would like to use XBRL for some of the new data
collection exercises
• Interested in XBRL/SDMX mapping tools, to support more input/output
formats
The ECB together with Banco de España will create a mapping
between the two standards the SDMX and the Data Point Model
SDMX-XBRL(DPM) mapping
3
Rubric
www.ecb.europa.eu ©
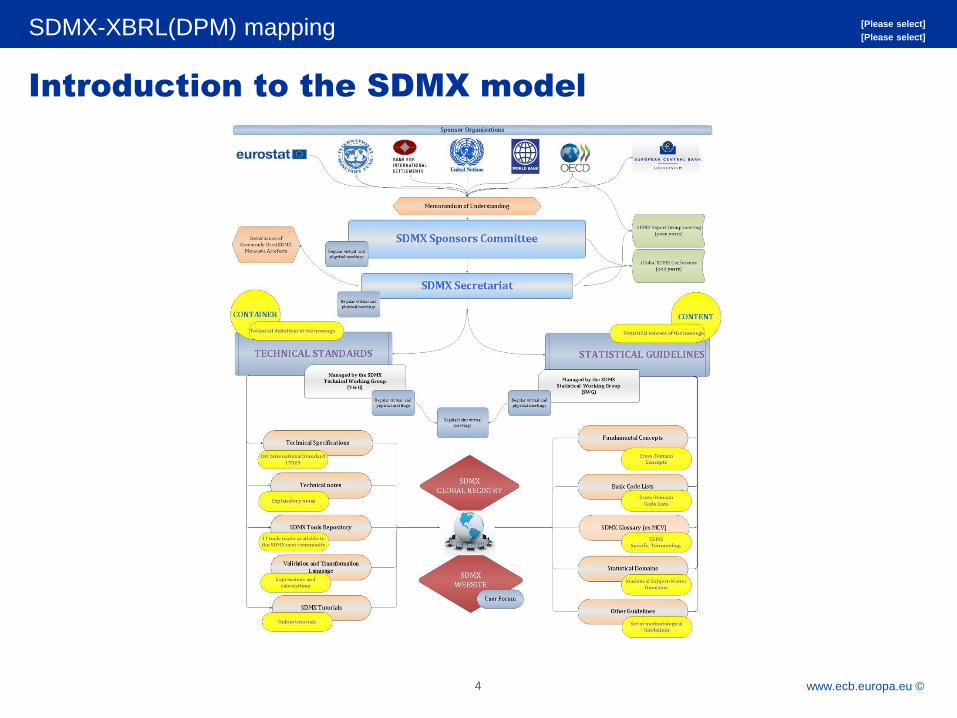
Introduction to the SDMX model
4
SDMX-XBRL(DPM) mapping [Please select]
[Please select]

Rubric
www.ecb.europa.eu ©
Introduction to the SDMX model
• SDMX, which stands for Statistical Data and Metadata eXchange is an international
initiative that aims at standardising and modernising (“industrialising”) the mechanisms and
processes for the exchange of statistical data and metadata among international
organisations and their member countries.
• SDMX is sponsored by seven international organisations including the Bank for International
Settlements (BIS), the European Central Bank (ECB), Eurostat (Statistical Office of the
European Union), the International Monetary Fund (IMF), the Organisation for Economic
Cooperation and Development (OECD), the United Nations Statistical Division (UNSD), and
the World Bank.
5
SDMX-XBRL(DPM) mapping [Please select]
[Please select]
From www.sdmx.org
Rubric
www.ecb.europa.eu ©
Introduction to the SDMX model
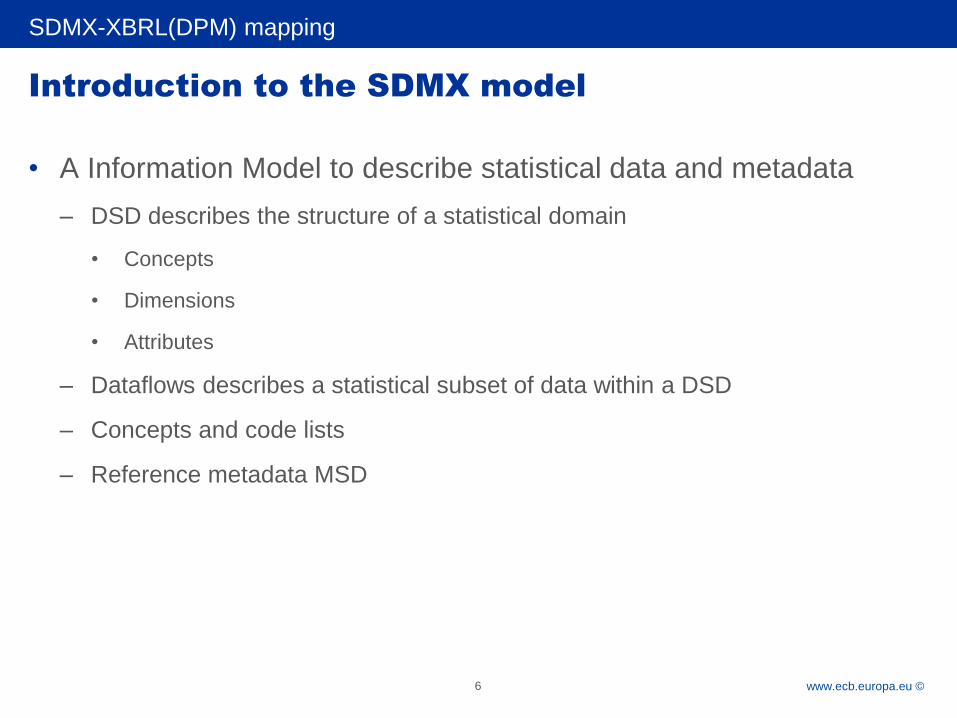
• A Information Model to describe statistical data and metadata
– DSD describes the structure of a statistical domain
• Concepts
• Dimensions
• Attributes
– Dataflows describes a statistical subset of data within a DSD
– Concepts and code lists
– Reference metadata MSD
SDMX-XBRL(DPM) mapping
6

Rubric
www.ecb.europa.eu ©
Introduction to the SDMX model
• A standard for automated communication from machine to
machine (push and pull)
• Different exchange formats
– XML
– JSON
– CSV
– Gesmes
SDMX-XBRL(DPM) mapping
7
Rubric
www.ecb.europa.eu ©
Introduction to the DPM model
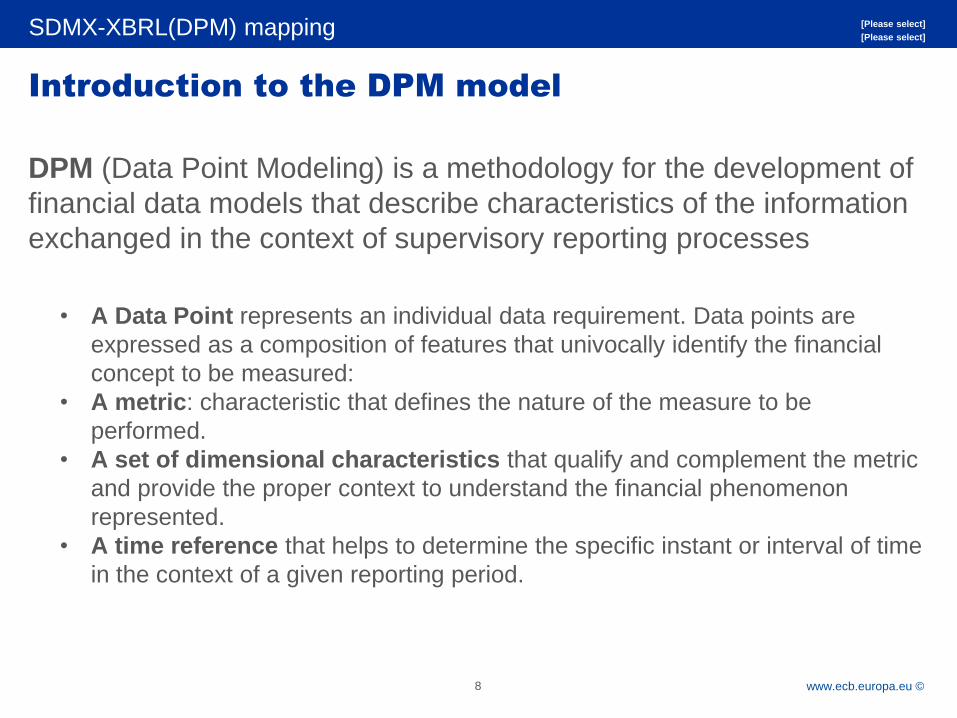
DPM (Data Point Modeling) is a methodology for the development of
financial data models that describe characteristics of the information
exchanged in the context of supervisory reporting processes
• A Data Point represents an individual data requirement. Data points are
expressed as a composition of features that univocally identify the financial
concept to be measured:
• A metric: characteristic that defines the nature of the measure to be
performed.
• A set of dimensional characteristics that qualify and complement the metric
and provide the proper context to understand the financial phenomenon
represented.
• A time reference that helps to determine the specific instant or interval of time
in the context of a given reporting period.
8
SDMX-XBRL(DPM) mapping [Please select]
[Please select]

Rubric
www.ecb.europa.eu ©
Main differences between SDMX and XBRL-DPM
• Entity identification
• Period or frequency
• Use of dimensions
• Metrics vs measure dimensions
• Graphical representation
• Validation rules
• Use of attributes
9
SDMX-XBRL(DPM) mapping
Rubric
www.ecb.europa.eu ©
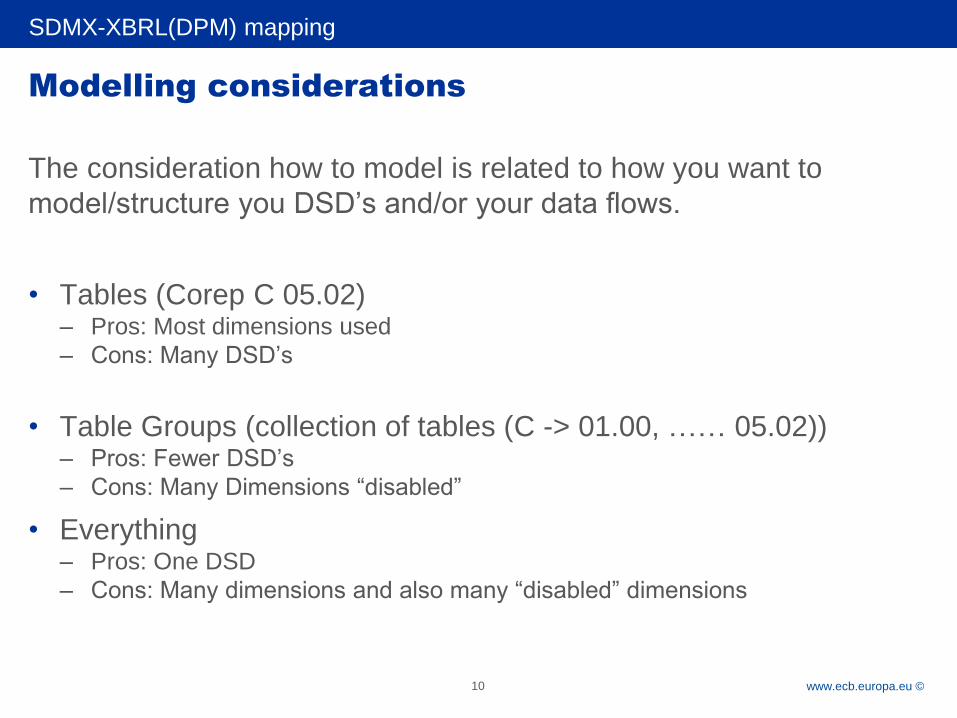
Modelling considerations
The consideration how to model is related to how you want to
model/structure you DSD’s and/or your data flows.
• Tables (Corep C 05.02)– Pros: Most dimensions used
– Cons: Many DSD’s
• Table Groups (collection of tables (C -> 01.00, …… 05.02))– Pros: Fewer DSD’s
– Cons: Many Dimensions “disabled”
• Everything– Pros: One DSD
– Cons: Many dimensions and also many “disabled” dimensions
SDMX-XBRL(DPM) mapping
10

Rubric
www.ecb.europa.eu ©
SDMX-DPM Case study
Set up and assumptions of the case study:
• The mapping could be done in both directions– in the case study we map DPM into SDMX
• The EBA C 05.02 table taken as the initial DPM file
• This table belongs to a table group with 5 additional templates
which do not use the same number of dimensions
SDMX-XBRL(DPM) mapping
11
Rubric
www.ecb.europa.eu ©
SDMX-DPM Case study
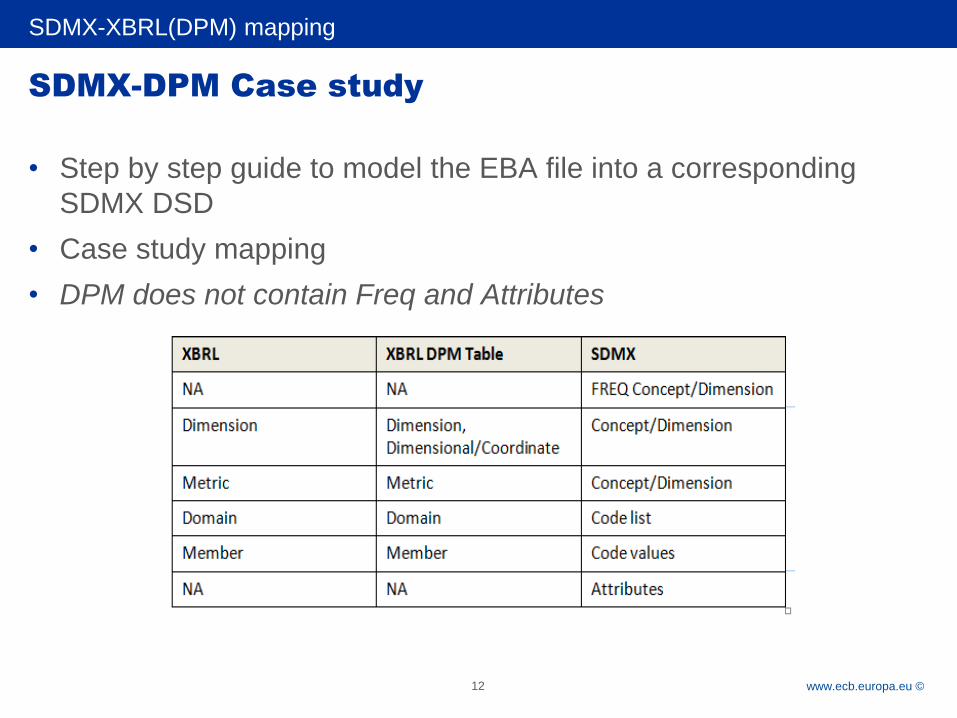
• Step by step guide to model the EBA file into a corresponding
SDMX DSD
• Case study mapping
• DPM does not contain Freq and Attributes
SDMX-XBRL(DPM) mapping
12

Rubric
www.ecb.europa.eu ©
SDMX-DPM Case study-mapping
SDMX-XBRL(DPM) mapping
13
Corep C 05.02 table view

Rubric
www.ecb.europa.eu ©
SDMX-DPM Case study
SDMX-XBRL(DPM) mapping
14
C 05.02 mapping DPM Dimension/Metrics to SDMX dimensions
Rubric
www.ecb.europa.eu ©
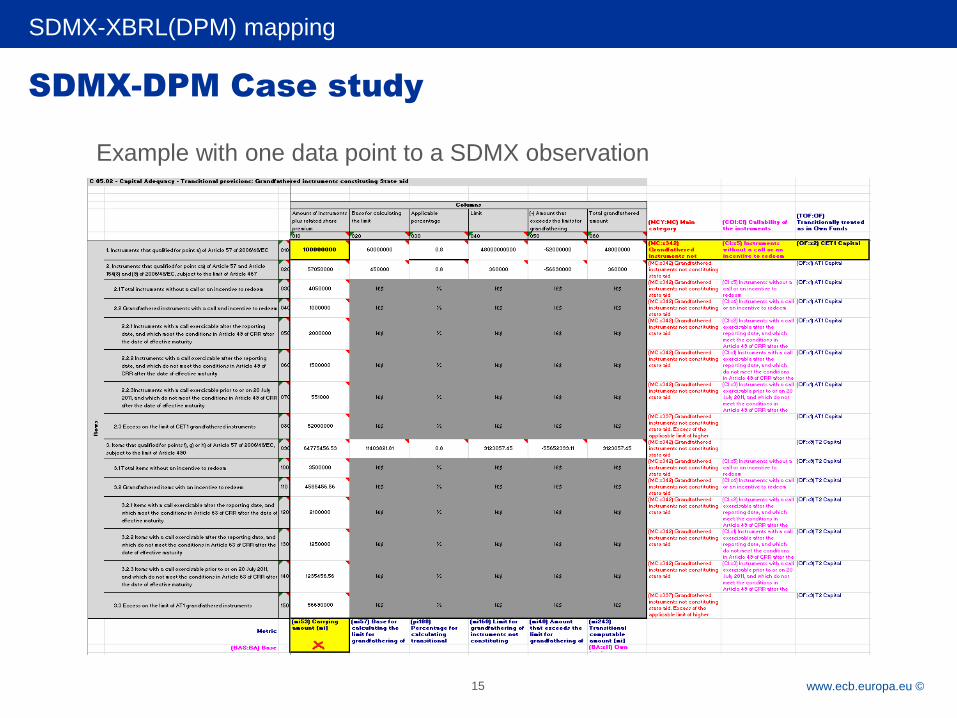
SDMX-DPM Case study
SDMX-XBRL(DPM) mapping
15
Example with one data point to a SDMX observation
Rubric
www.ecb.europa.eu ©
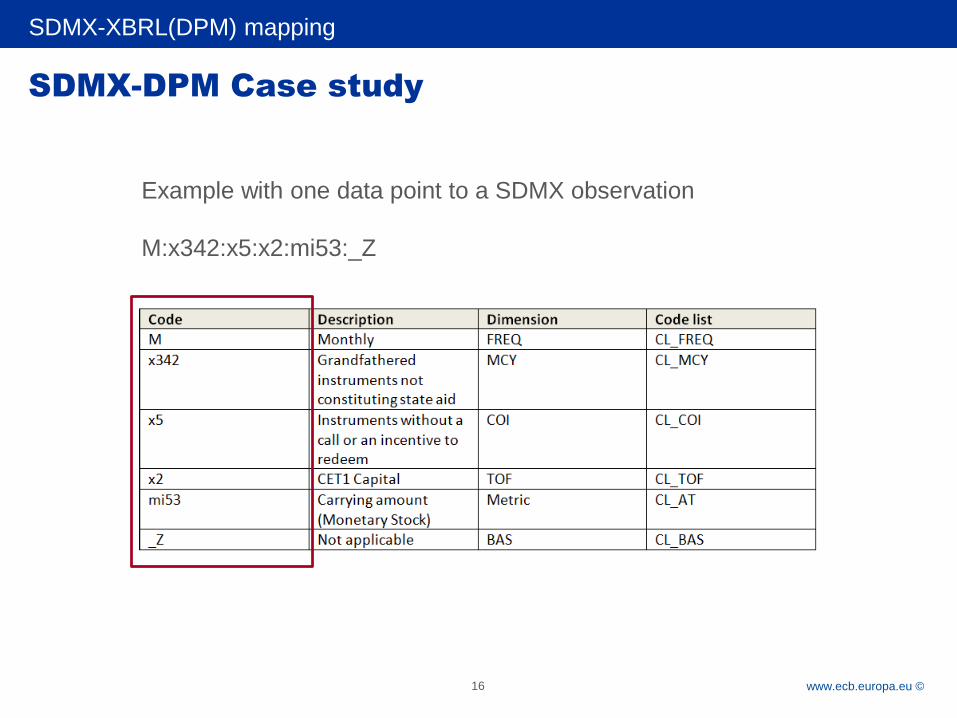
SDMX-DPM Case study
SDMX-XBRL(DPM) mapping
16
Example with one data point to a SDMX observation
M:x342:x5:x2:mi53:_Z
Rubric
www.ecb.europa.eu ©
Summary
• There is not a direct mapping between SDMX and DPM
• Different Decisions/Considerations have to made in different
implementations
• The work will continue to finalize the mapping accroding to the
Roadmap 2020.
SDMX-XBRL(DPM) mapping
17