bridging the tenant-provider gap in cloud...
TRANSCRIPT

Bridging the Tenant-Provider Gap in Cloud Services
Virajith Jalaparti†∧ Hitesh Ballani† Paolo Costa†‡[email protected] [email protected] [email protected]
Thomas Karagiannis† Ant Rowstron†[email protected] [email protected]
†Microsoft Research ∧University of Illinois ‡Imperial CollegeCambridge, UK Urbana, IL, USA London, UK
ABSTRACTThe disconnect between the resource-centric interface ex-posed by today’s cloud providers and tenant goals hurts bothentities. Tenants are encumbered by having to translate theirperformance and cost goals into the corresponding resourcerequirements, while providers suffer revenue loss due to un-informed resource selection by tenants. Instead, we argue fora “job-centric” cloud whereby tenants only specify high-levelgoals regarding their jobs and applications. To illustrate ourideas, we present Bazaar, a cloud framework offering a job-centric interface for data analytics applications.
Bazaar allows tenants to express high-level goals and pre-dicts the resources needed to achieve them. Since multipleresource combinations may achieve the same goal, Bazaarchooses the combination most suitable for the provider. Us-ing large-scale simulations and deployment on a Hadoopcluster, we demonstrate that Bazaar enables a symbiotictenant-provider relationship. Tenants achieve their perfor-mance goals. At the same time, holistic resource selectionbenefits providers in the form of increased goodput.
Categories and Subject Descriptors: C.2.3 [Computer-Communication Networks]: Network Operations
General Terms: Algorithms, Design, Performance
Keywords: Cloud, Provider Interface, Resource Malleabil-ity, Job-centric, Resource selection, Cloud pricing
1. INTRODUCTIONThe resource elasticity offered by today’s cloud providers
is often touted as a key driver for cloud adoption. Providersexpose a minimal interface– users or tenants simply ask forthe compute instances they require and are charged on apay-as-you-go basis. Such resource elasticity enables elasticapplication performance; tenants can demand more or lesscompute instances to match performance needs.
While simple and elegant, there is a disconnect betweenthis resource-centric interface exposed by providers and what
Permission to make digital or hard copies of all or part of this work forpersonal or classroom use is granted without fee provided that copies arenot made or distributed for profit or commercial advantage and that copiesbear this notice and the full citation on the first page. To copy otherwise, torepublish, to post on servers or to redistribute to lists, requires prior specificpermission and/or a fee.SOCC’12, October 14-17, 2012, San Jose, CA USACopyright 2012 ACM 978-1-4503-1761-0/12/10 ...$15.00.
tenants actually require. Tenants are primarily interested inpredictable performance and costs for their applications [2,28]; for instance, tenants want to satisfy constraints regard-ing their application completion time [9,14,20,35,39]. Withtoday’s setup, tenants bear the burden of translating thesehigh-level goals into the corresponding resource requirements.Motivated by this disconnect, we argue for refactoring thetenant-provider relationship to improve cloud usability. In-stead of today’s resource-centric interface, providers shouldoffer a job-centric interface whereby tenants only specifyperformance and cost goals for their jobs and applications.
Such a job-centric interface requires the provider to maptenant goals into resource requirements. While burdeningthe provider, a job-centric interface also opens up opportuni-ties for them. Providers now have flexibility regarding whichand how many resources to dedicate to a job and when to doso. As an example, many cloud applications are malleable intheir resource requirements with multiple resource combina-tions yielding the same performance; for instance, to achievea completion time goal, a MapReduce job can be run on afew virtual machines (VMs) with a lot of network bandwidthbetween them, a lot of VMs with a little network bandwidth,or somewhere in between these extremes. Similarly, a job tobe completed in x hours could be finished much sooner us-ing idle resources, thus allowing the provider to better servesubsequent tenants. The rigidity of today’s resource-centricinterface does not permit such provider flexibility.
In this paper, we take a first stab at a job-centric inter-face for cloud datacenters. Our examination of typical cloudapplications from three different domains (data analytics,web-facing and HPC) shows that they exhibit resource mal-leability. This, along with performance predictability, is a keycondition that our target applications must satisfy. For suchapplications, we devise mechanisms to automatically choosethe resource combination, among those that can achieve ten-ant performance goals, that is most suitable for the provider.Thus, the impetus of this paper is on satisfying tenant goalswhile capitalizing on the flexibility offered by a job-centricsetup.
We illustrate our mechanisms in the context of data analyt-ics by focusing on MapReduce as an example cloud applica-tion. We design Bazaar, a cloud framework that takes tenantconstraints regarding the completion time of their MapRe-duce job, and determines the resource combination mostamenable to the provider that satisfies the constraints. Ourchoice of MapReduce was motivated by the fact that dataanalytics represent a significant workload for cloud infras-

tructures [41,44], with some multi-tenant datacenters havingentire clusters dedicated to running them [5,41]. Further, themalleability and predictability conditions mentioned abovehold very well for MapReduce.
A key challenge in enabling a job-centric interface is shareddatacenter resources. While tenants get dedicated computeinstances with today’s cloud offerings, other resources likethe internal network and the cloud storage are shared andtheir performance can vary significantly [26,30,45]. This canlead to unpredictable application performance [15, 30, 36].The problem of unpredictable performance has promptedefforts to provide guaranteed performance atop shared dat-acenter resources like the internal network [2, 13] and cloudstorage [12, 21, 32]. These proposals allow tenants to explic-itly request for resources beyond compute instances. Suchmulti-resource elasticity makes a job-centric interface fea-sible. Hence, we build upon these efforts to ensure tenantgoals are met.
Though our core ideas apply to general multi-resource set-tings, we begin by focusing on two specific resources, com-pute instances (N) and the network bandwidth (B) betweenthem. Bazaar uses a performance prediction component todetermine the resource tuples < N,B > that can achievethe completion time desired by the tenant. Since multipleresource tuples may achieve the same completion time, theyare ranked in terms of the provider’s cost to accommodatethe tuple. Bazaar selects the resource tuple with the leastcost to the provider, thus improving provider efficiency.
While a lot of recent work looks at performance predictionfor analytics jobs [9, 10, 14, 29, 35, 37, 39, 46], the predictionproblem for Bazaar is both simpler and harder. Avoidingshared resources by explicitly dedicating network bandwidthto jobs makes prediction simpler. However, exploring multi-ple resource combinations requires fast prediction. We adopta hybrid approach (simple model + profiling) to predict howthe performance of a MapReduce job scales in terms of mul-tiple resources. Experiments show that the prediction is fastand has good accuracy (<12% average error). To counteroutliers and failures that hinder perfect prediction, Bazaarrelies on “slack” by finishing jobs earlier than desired. Suchslack allows Bazaar to satisfy tenant goals in spite of imper-fect prediction.
To demonstrate the feasibility of our approach, we built aBazaar prototype and evaluate it on Emulab running HadoopMapReduce jobs. To study the performance at scale, wecomplement these experiments with large-scale simulations.The results show that smart resource selection to satisfytenant goals can yield significant gains for the provider. Theprovider can accept 3-14% more requests. Further, bigger(resource intensive) requests can be accepted which improvesthe datacenter goodput by 7-87%. Overall, Bazaar’s higher-level tenant-provider interface benefits both entities. Ten-ants achieve their goals, while the resource selection flexi-bility improves datacenter goodput and hence, provider rev-enue.
In summary, this paper makes the following contributions:
• We propose a job-centric cloud interface that decouplesthe performance and cost goals of tenants from the under-lying resource allocation. This better aligns the interestsof tenants and the cloud provider.
• We measure the malleability of representative cloud ap-plications, and show that different combinations of com-
pute and network resources can achieve the same appli-cation performance.
• We devise a metric for the cost of accommodating multi-resource requests from the provider’s perspective. Thisallows one resource tuple to be compared against another.
• We extend our metric to exploit malleability along thetime domain, i.e., finishing jobs earlier than required bydedicating them idle resources. We find this can furtherreduce median job completion time by more than 50%.
• We present the design, implementation and evaluation ofBazaar, and illustrate how tenant performance goals canbe met in a multi-resource setting.
While this paper intentionally focuses on completion timegoals, a job-centric interface can also accommodate cost goals.In Section 6, we briefly discuss a novel job-centric pricingmodel that, when coupled with Bazaar, can allow tenants toachieve their cost goals too.
2. BACKGROUND AND MOTIVATIONCloud providers today allow tenants to ask for virtual
machines or VMs on demand. The VMs can vary in size;small, medium or large VMs are typically offered reflectingthe available processing power, memory and local storage.For ease of exposition, the discussion here assumes a singleVM class. A tenant request can thus be characterized by N ,the number of VMs requested. Tenants pay a fixed amountper hour per VM; thus, renting N VMs for T hours costs$kv ∗ NT , where kv is the hourly VM price. For AmazonEC2, kv = $0.08 for small VMs.
Data analytics in the cloud. Analysis of big data setsunderlies many web businesses [41, 43, 44] migrating to thecloud. Parallel frameworks like MapReduce [6], Scope [5],Dryad [16] cater to such data analytics, and form a key com-ponent of cloud workloads. Despite a few differences, theseframeworks are broadly similar and operate as follows. Eachjob typically consists of three phases, (i). reading input dataand applying a grouping function, (ii). shuffling intermediatedata among the compute instances across the network, (iii).applying an aggregation function to generate the final out-put. For example, in the case of MapReduce, these phasesare known as map, shuffle, and reduce phases. Computationmay involve a series of such jobs.
Predictable performance. The parallelism provided bydata parallel frameworks is an ideal match for the resourceelasticity offered by cloud computing since the completiontime of a job can be tuned by varying the resources devotedto it. Tenants often have high-level performance or cost re-quirements for their data-analytics. Such requirements maydictate, for example, that a job needs to finish by a certaintime. However, with today’s setup, tenants are responsiblefor mapping such high-level completion time goals down tospecific resources needed for their jobs. While several recentefforts tackle this problem [9,14,35,39], most of them focusonly on the number and kind of VMs (or slots) required, andnone account for the shared network.
Yet, the performance of most data analytic jobs dependson factors well-beyond the number of VMs devoted to them.For instance, apart from the actual processing of data, a jobrunning in the cloud also involves reading input data off thecloud storage service and shuffling data between VMs over

the internal network. Since the storage service and the inter-nal network are shared resources, their performance can varysignificantly [26,30]. This, in turn, impacts application per-formance. For instance, Schad et al. [30] found that the com-pletion time of the same job executing on the same numberof VMs on Amazon EC2 can vary considerably, with the un-derlying network contributing significantly to the variation.Thus, without accounting for resources beyond simply thecompute units, the goal of determining the number of VMsneeded to achieve a desired completion time is intractable.
Multi-resource elasticity. Performance issues with sha-red resources, such as the ones described above, prompteda slew of proposals that offer guaranteed performance atopsuch resources [2,12,13]. With these, tenants can request re-sources beyond just VMs; for instance, tenants can specifythe network bandwidth between their VMs [2, 13]. We notethat providing tenants with a guaranteed amount of indi-vidual resources makes the problem of achieving high-levelperformance goals tractable.
Our approach leverages such multi-resource elasticity andbuilds upon efforts that provide guaranteed resources. Weconsider a two-resource setting whereby the provider candedicate VMs and a network slice to tenant jobs. As pro-posed in [2], a tenant’s resources are characterized by a twotuple <N,B> which gives the tenant N VMs, each with anaggregate network bandwidth of B Mbps to other VMs ofthe same tenant. However, before discussing how such re-source elasticity can be exploited in a job-centric setup, wefirst quantify its impact on typical cloud applications.
2.1 Malleability of data-analytics applicationsWe first focus on data analytic frameworks, and use MapRe-
duce as a running example. Our goal is to study how itsperformance is affected when varying different resources.
Hadoop Job Input Data Set
Sort 200GB using Hadoop’s RandomWriterWordCount 68GB of Wikipedia articlesGridmix 200GB using Hadoop’s RandomTextWriterTF-IDF 68GB of Wikipedia articles
LinkGraph 10GB of Wikipedia articles
Table 1: MapReduce jobs and the size of their inputdata.
We experimented with the small yet representative set ofMapReduce jobs listed in Table 1. These jobs capture theuse of data analytics in different domains and the varyingcomplexity of such workloads (through multi-stage jobs).Sort and WordCount are popular for MapReduce perfor-mance benchmarking, not to mention their use in businessdata processing and text analysis respectively [38]. Gridmixis a synthetic benchmark modeling production workloads,Term Frequency-Inverse Document Frequency or TF-IDF isused in information retrieval, and LinkGraph is used to cre-ate large hyperlink graphs. Of these, Gridmix, LinkGraph,and TF-IDF are multi-stage jobs.
We used Hadoop MapReduce on Emulab to execute thejobs while varying the number of nodes devoted to them(N). We also used rate-limiting on the nodes to control thenetwork bandwidth between them (B). For each <N,B>tuple, we executed a job fives times to measure the comple-tion time for the job and its individual phases. While the
0
100
200
300
400
500
600
50 100 150 200 250 300
Com
ple
tion T
ime (
sec)
Network Bandwidth (Mbps)
N=10N=20
(a) LinkGraph
0
2000
4000
6000
8000
50 100 150 200 250 300
Com
ple
tion T
ime (
sec)
Network Bandwidth (Mbps)
N=10N=20
(b) Sort
Figure 1: Completion time for jobs with varying net-work bandwidth. Error bars represent Min–Max val-ues.
experiment setup is further detailed in §4.1, here we justfocus on the performance trends.
Figure 1(a) shows the completion time for LinkGraph ona cluster with 10 and 20 nodes and varying network band-width. As the bandwidth between the nodes increases, thetime to shuffle the intermediate data between map and re-duce tasks shrinks, and thus, the completion time reduces.However, the total completion time stagnates beyond 250Mbps. This is because the local disk on each node providesan aggregate bandwidth of 250 Mbps. Hence, increasing thenetwork bandwidth beyond this value does not help sincethe job completion time is dictated by the disk performance.This is an artifact of the disks on the testbed nodes. If thedisks were to offer higher bandwidth, increasing the net-work bandwidth beyond 250 would still shrink the comple-tion time.
The same trend holds for the other jobs we tested. For in-stance, Figure 1(b) shows that the completion time for Sortreduces as the number of nodes and the network bandwidthbetween the nodes is increased. Note however that the pre-cise impact of either resource is job-specific. For instance,we found that the relative drop in completion time withincreasing network bandwidth is greater for Sort than forWordCount. This is because Sort is I/O intensive with a lotof data shuffled which means that its performance is heavilyinfluenced by the network bandwidth between the nodes.
Apart from varying network bandwidth, we also executedthe jobs with varying number of nodes. The results are de-tailed in §4.1 (Figures 6(a) and 6(b)) and show that thecompletion time for a job is inversely proportional to thenumber of nodes devoted to it. This is a direct consequenceof the data-parallel nature of MapReduce.
2.2 Malleability of other cloud applicationsThe findings in the previous section extend to other cloud
applications as well. We briefly discuss two examples here.Three-tier, web application. We used a simple, unopti-
mized ASP.net web application with a SQL backend as a rep-resentative of web-facing workloads migrating to the cloud.We varied the number of nodes (N) running the middle ap-plication tier and the bandwidth (B) between the applica-tion tier (middle nodes) and the database-storage tier (back-end nodes). We used the Apache benchmarking tool (ab) togenerate web requests and determine the peak throughputfor any given resource combination. Figure 2(a) shows thatthe application throughput improves in an expected fashionas either resource is increased.
0 50
100 150 200 250 300 350 400 450 500
100 1000
Thro
ughput
(req
s/se
c)
Network Bandwidth (Mbps)
N=4N=2N=1
(a) Web application
0
2000
4000
6000
8000
10000
10 100 1000
Com
ple
tion T
ime (
sec)
Network Bandwidth (Mbps)
N=8N=12N=16
(b) MPI application
Figure 2: Performance for cloud applications varieswith both N and B.
MPI application. We used an MPI application generat-ing the Crout-LU decomposition of an input matrix as anexample of cloud HPC and scientific workloads. Figure 2(b)shows the completion time for a 8000x8000 matrix with vary-ingN and B. Given the CPU-intensive nature of the applica-tion, increasing the number of nodes improves performancesignificantly. As a contrast, the impact of the network islimited. For instance, improving the bandwidth from 10 to100 Mbps improves completion time only by 15-25%.
Overall, the experiments above lead to two expected yet keyfindings.(1). The performance of typical cloud applications dependson resources beyond just the number of compute instances.(2). They confirm the resource malleability of such applica-tions; an application can achieve the same performance withdifferent resource combinations, thus allowing one resourceto be traded-off for the other. For instance, the throughputfor the web application above with two nodes and 250 Mbpsof network bandwidth is very similar to that with four nodesand 125 Mbps of network. Table 2 further emphasizes thisfor data analytic applications by showing examples wherea number of different compute-node and bandwidth com-binations achieve almost the same completion time for theLinkGraph and WordCount jobs. This flexibility is importantin a job-centric cloud; it allows for improved cloud efficiencyand hence, greater provider revenue.
Hadoop Job – <Nodes, Bandwidth (Mbps)>Completion Time (sec) alternatives
LinkGraph – <34, 75>, <20, 100>300 (±5%) <10, 150>, <8, 250>LinkGraph – <30, 60>, <10, 75>400 (± 5%) <8, 150>, <6, 200>WordCount – <30, 45>, <20, 50>900 (± 3%) <10, 100>, <8, 300>WordCount – <32, 50>, <20, 75>630 (± 3%) <14, 100>, <12, 300>
Table 2: Examples of WordCount and LinkGraph jobsachieving similar completion times with different re-source combinations.
2.3 Scope and assumptionsIn this paper, we aim to build a job-centric cloud interface.
We identify two conditions that our target applications mustsatisfy:
TenantJob details
Completion time goal
PerformancePrediction
ResourceSelection
Cloud
CandidateResource Tuples
<N1, B1>, <N2, B2>,
….
Bazaar
Datacenter
State
Chosen Resource Tuple <N, B> and (estimated) cost
Figure 3: Bazaar offers a job-centric interface.
(1). Performance predictability. It should be feasible to pre-dict the performance of the application when running on agiven set of resources.
(2). Resource malleability. The application performanceshould vary with the resources dedicated to it. Further, itshould be possible to trade-off one resource for the otherwithout impacting performance.
To help ground our arguments, we hereon focus on MapRe-duce as an example cloud application. Based on this, wedesign Bazaar, a cloud framework that offers a job-centricinterface to data analytics workloads. We note that MapRe-duce is a very suitable candidate for this exercise since– (i).it is popular as a data analytic framework and has significantpresence in cloud workloads [41,44] and (ii). it satisfies bothour conditions very well. Its performance scales with the tworesources we consider (condition 2) and as we show later, thewell-defined architecture of MapReduce lends itself well forautomatic analysis and low-overhead profiling (condition 1).However, the core ideas in this paper can be extended bothto applications beyond two resources, as shown in §4.4, andbeyond MapReduce [27,33].
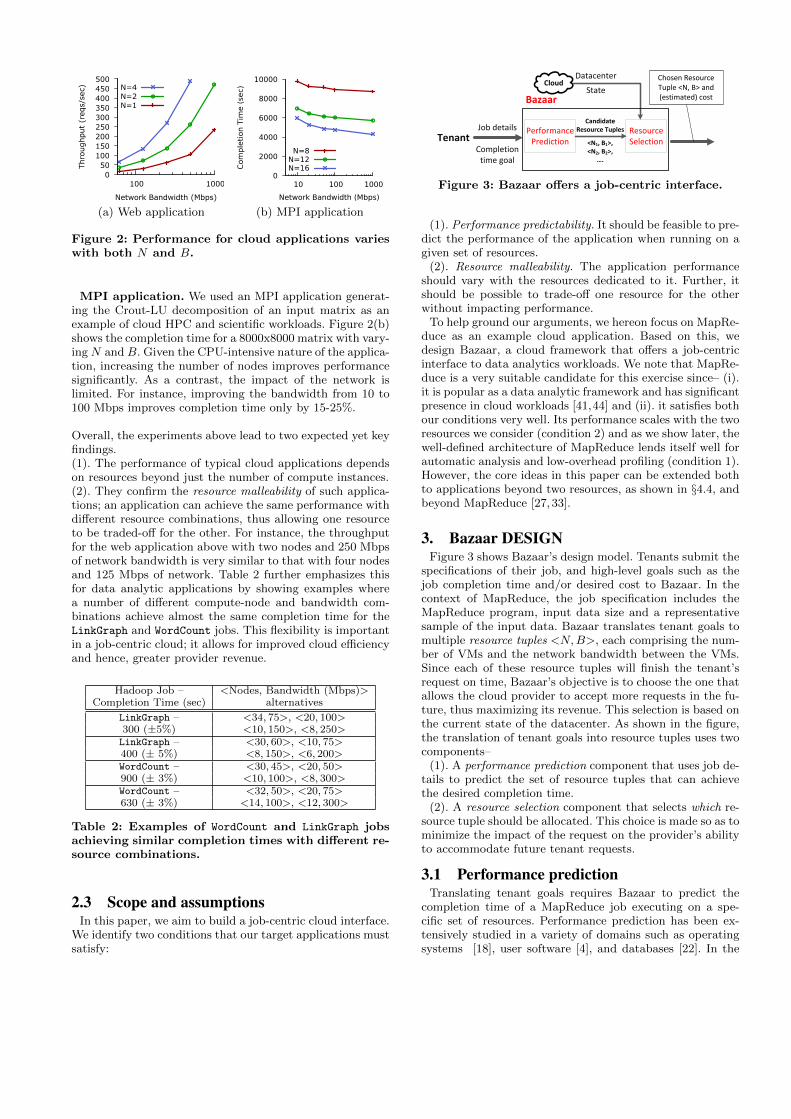
3. Bazaar DESIGNFigure 3 shows Bazaar’s design model. Tenants submit the
specifications of their job, and high-level goals such as thejob completion time and/or desired cost to Bazaar. In thecontext of MapReduce, the job specification includes theMapReduce program, input data size and a representativesample of the input data. Bazaar translates tenant goals tomultiple resource tuples <N,B>, each comprising the num-ber of VMs and the network bandwidth between the VMs.Since each of these resource tuples will finish the tenant’srequest on time, Bazaar’s objective is to choose the one thatallows the cloud provider to accept more requests in the fu-ture, thus maximizing its revenue. This selection is based onthe current state of the datacenter. As shown in the figure,the translation of tenant goals into resource tuples uses twocomponents–
(1). A performance prediction component that uses job de-tails to predict the set of resource tuples that can achievethe desired completion time.
(2). A resource selection component that selects which re-source tuple should be allocated. This choice is made so as tominimize the impact of the request on the provider’s abilityto accommodate future tenant requests.
3.1 Performance predictionTranslating tenant goals requires Bazaar to predict the
completion time of a MapReduce job executing on a spe-cific set of resources. Performance prediction has been ex-tensively studied in a variety of domains such as operatingsystems [18], user software [4], and databases [22]. In the

MapWave 1
map
map
...
Map Wave N
map
map
...
...
Reduce Wave
Execution Time
reduce
reduce
...
Tmap Treduce Tshuffle
(a) Job execution timeline
Map Phase
B D
map
BPmap
𝑩𝒎𝒂𝒑 = 𝐦𝐢𝐧 𝑩𝑫, 𝑩𝒎𝒂𝒑𝑷
BDDisc
(b) Map phase
Figure 4: Timeline of a MapReduce job and overviewof the map phase.
context of MapReduce, efforts like Mumak [46] and MR-Perf [37] have built detailed MapReduce simulators that canbe used for prediction. However, this results in non-trivialprediction times. To allow for an exploration of differentresource combinations, Bazaar requires fast prediction. Indesigning Bazaar, we explicitly chose to simplify our predic-tion model, thereby favoring fast prediction over accuracy.This choice is also motivated by the observation that eventhe most accurate model will not be able to accurately ac-count for all outliers. Instead, to compensate for any modelinaccuracies, we introduce “slack” into our prediction. Thishelps us deal with common sources of prediction errors suchas hardware heterogeneity and workload imbalance.
Inspired by profiling-based approaches for fast databasequery optimization [22], we capitalize on the well-definednature of the MapReduce framework to predict the perfor-mance of MapReduce jobs. To this end, we design a predic-tion tool called MRCute or MapReduce Completion TimeEstimator. MRCute adopts a hybrid approach for perfor-mance prediction by complementing an analytical modelwith job profiling. We first developed a high-level model ofthe operation of MapReduce jobs which yields a closed-formanalytical expression for a job’s completion time. This ex-pression consists of job-specific and infrastructure-specificparameters. We determine these parameters by profiling thetenant job with a sample dataset on the provider’s infras-tructure.
At a high-level, the operation of MRCute can be summa-rized as follows. Given the program P for a MapReduce job,size of the input data |I|, a sample of the input data Is,and a resource tuple <N,B>, MRCute estimates the jobcompletion time:
MRCute(P, |I|, Is, N,B)→ Testimate. (1)
3.1.1 Job modelingAs shown in Figure 4(a), the execution of MapReduce jobs
consists of three phases, each comprising multiple tasks. Alltasks in a phase may not run simultaneously. Instead, thetasks execute in waves. For instance, the map phase in Fig-ure 4(a) has N waves.
Typically, the three phases in a job execute sequentially.Hence, the completion time for a job is the sum of thetime to complete individual phases, i.e., Testimate = Tmap +Tshuffle + Treduce. The completion time for each phase de-pends on the number of waves in the phase, the amount ofdata consumed or generated by each task in the phase andthe phase bandwidth. The phase bandwidth is the rate atwhich a given phase processes data. For instance, the com-
pletion time for the map phase is given by
Tmap = Wmap ∗ Imap
Bmap,
where Wmap is the number of waves in the phase, Imap is thedata consumed by each map task and Bmap is the map phasebandwidth. Of these, it is particularly challenging to deter-mine the phase bandwidth. Since each phase uses multipleresources (CPU, disk, network), the slowest or the bottle-neck resource governs the phase bandwidth. To determinethe bandwidth for individual phases, and hence, the com-pletion time of a job, we develop an analytical model byapplying bottleneck analysis [24] to the MapReduce frame-work.
For example, during the map phase (Figure 4(b)), eachmap task reads its input off the local disk (assuming theinput is locally available), applies the map function andwrites the intermediate data to local disk. Thus, a maptask involves the disk and CPU, and the map phase band-width is governed by the slowest of the two resources. Hence,Bmap = Min{BD, BPmap}, where BD is the disk I/O band-
width per map task and BPmap is the rate at which data canbe processed by the map function of the program P (assum-ing no other bottlenecks). Similarly, we derive expressionsfor the bandwidth for the shuffle and the reduce phase, andconsequently, a closed-form expression for the job’s comple-tion time. To simplify exposition, the complete descriptionof the analytical model is provided in the Appendix.
3.1.2 Job ProfilingBesides the input parameters specified in eq. 1, our closed-
form expression for a job’s completion time involves twoother types of parameters: i). Parameters specific to theMapReduce configuration, such as the map slots per VM,which are known to the provider. ii). Parameters that de-pend on the infrastructure and the actual tenant job. Theseinclude the data selectivity of map and reduce tasks (Smapand Sreduce), the map and reduce phase bandwidths (Bmapand Breduce), and the physical disk bandwidth (BD).
To determine the latter set of parameters, we profile theMapReduce program P by executing it on a single machineusing a sample of the input data Is. The profiler determinesthe execution time for each task and each phase, the amountof data consumed and generated by each task, etc. All thisinformation is gathered from the log files generated duringexecution, and is used to determine the data selectivity andbandwidth for each phase. Concretely,
Profiler(P, Is)→ {Smap, Sreduce, Bmap, Breduce, BD}.
For instance, the ratio of the data consumed by individualmap tasks to the map task completion time yields the band-width for the job’s map phase (Bmap). The reduce phasebandwidth is determined similarly. Since the profiling in-volves only a single VM with no network transfers, the ob-served bandwidth for the shuffle phase is not useful for themodel. Instead, we measure the disk I/O bandwidth (BD)under MapReduce-like access patterns, and use it to deter-mine the shuffle phase bandwidth.
3.1.3 Candidate resource tuplesBazaar uses MRCute to determine the resource tuples that
can achieve the completion time desired by the tenant. Thisinvolves two steps. First, the tenant job is profiled to de-termine infrastructure-specific and job-specific parameters.

These parameters are then plugged into the analytical ex-pression to estimate the job’s completion time when exe-cuted on a given resource tuple <N,B>. The latter oper-ation is low overhead and is repeated to explore the entirespace for the two resources. In practice, we envision the pro-vider will offer a few classes (in the order of five-ten) ofinternal network bandwidth which reduces the search spacesignificantly. For each possible bandwidth class, Bazaar de-termines the number of compute instances needed to satisfythe tenant goal. These < N,B > combinations are the can-didate resource tuples for the tenant request.
3.1.4 Dealing with prediction errorsAs with any profiling-based approach, MRCute assumes
that the behavior observed during profiling is representa-tive of actual job operation. For example, the sample dataused for profiling should be representative and of sufficientsize.1 Similarly, the machine used for profiling should offerthe same performance as any other machine in the datacen-ter. While physical machines in a datacenter often have thesame hardware configuration, their performance can vary,especially disk performance [23]. Overall, these assumptionsdo not always hold and can result in prediction errors.
Further, tasks of a job can fail or can lag behind (outliers),causing the actual job execution to deviate from “ideal”behavior and hence, prediction errors. Mantri’s analysis ofoutliers in production settings identified three main rootcauses [1]– (i) network contention, (ii) bad machines, and(iii) workload imbalance. We address the first two causesand mask the last one as follows:
Network contention. Bazaar dedicates both VMs anda network slice to each job. The latter guarantees the net-work bandwidth for VMs. This avoids inter-job network con-tention, thus avoiding outliers due to poor network perfor-mance.
Bad machines. Even on our small testbed, we foundsignificant variability in the completion time of the sametask on different machines. We tracked this to variable diskperformance which is observed in production datacenterstoo [1]. To account for such variability, MRCute maintainsstatistics regarding the disk bandwidth of individual ma-chines. In practice, this can be obtained by profiling themachines periodically, for instance, when they are not allo-cated to tenants. Our evaluation shows that this improvesthe prediction accuracy significantly.
Workload imbalance. The amount of data processed bytasks belonging to the same phase can vary significantlywhich, in turn, leads to outliers. It is difficult to quantifysuch imbalance during prediction.
Broadly speaking, it is very hard to account for all possiblecauses that can result in inaccurate prediction. Hence, weuse slack to mask such inaccuracies. A slack of 10% meanswe actually estimate the resources required to complete thejob in 90% of the desired time, thus allowing 10% slack formisprediction. In §4.2.3, we study how the provider can setthe slack to ensure tenant goals are met even in the presenceof outliers.
1If sample is too small, external factors such as the OSpage cache can influence the measurements and the observedbandwidth will be different from that seen by the actual job.We use MapReduce configuration parameters regarding thememory dedicated to each task to determine the minimumsize of the sample data.
3.2 Resource selectionA job-centric interface offers flexibility to the provider.
Since all the candidate tuples for a job achieve similar com-pletion times, the provider can select which resource tupleto allocate. Bazaar takes advantage of this flexibility by se-lecting the resource tuple most amenable to the provider’sability to accommodate subsequent tenants, thus maximiz-ing the provider revenue. This comprises the two followingsub-problems.
The feasibility problem involves determining the set ofcandidate resource tuples that can actually be allocated inthe datacenter, given its current utilization. For our two di-mensional resource tuples, this requires ensuring that thereare both enough unoccupied VM slots on physical machinesand enough bandwidth on the network links connecting thesemachines. Oktopus [2] presents a greedy allocation algorithmfor such tuples which ensures that if a feasible allocation ex-ists, it is found. We use this algorithm to determine feasibleresource tuples.
The resource selection problem requires selecting thefeasible resource tuple that maximizes the provider’s abil-ity to accept future requests. However, in our setting, theresources required for a given tuple depend not just on thetuple itself, but also on the specific allocation. As an exam-ple, consider a tuple <4, 200> requiring 4 VMs each with200 Mbps of network bandwidth to other VMs. If all theseVMs are allocated on a single physical machine, no band-width is required on the network link for the machine. On theother hand, if two of the VMs are allocated on one machineand two on another machine, the bandwidth required on thenetwork links between them is 400 Mbps (2*200 Mbps).
To address this, we use the above allocation algorithm toconvert each feasible resource tuple to a utilization vectorcapturing the utilization of physical resources in the data-center after the tuple has been allocated. Specifically,
Allocation(< N,B >)→ U =< u1, . . . , ud >,
where U is a vector with the utilization of all datacenterresources, i.e., all physical machines and links. The vectorcardinality d is the total number of machines and links inthe datacenter. For a machine k, uk is the fraction of the VMslots on the machine that are occupied while for a link k, ukis the fraction of the link’s capacity that has been reservedfor the allocated VMs.
Overall, given the set of utilization vectors correspondingto the feasible tuples, the objective is to select the resourcetuple that will minimize the number of rejected requests inthe future. This problem has been studied in various con-texts, such as online ad allocation [8] and online routing andadmission control in virtual circuit networks [19]. Dependingon the context, one can show that different cost functions(that measure the cost for accepting a request) yield optimalscheduling for different request allocation models [3]. We ex-perimented with a number of such cost functions and foundthat a cost function that captures the resource imbalancecaused by the allocation of a resource tuple performs verywell in terms of minimizing rejected requests. In our set-ting, minimizing resource imbalance translates to choosingthe utilization vector that balances the capacity left acrossall resources after the request has been allocated. Precisely,

our selection heuristic aims to minimize the following
minimize
d∑j=1
(1− uj)2.
Hence, the resource imbalance is defined as the square of thefractional under-utilization for each resource. The lower thisvalue, the better the residual capacity across resources isbalanced. In literature, this is referred to as the Norm-basedGreedy heuristic [25]. An extra complication in our settingis the hierarchical nature of typical datacenters. This leadsto a hierarchical set of resources corresponding to datacenterhosts, racks and pods. Below we detail how this heuristic isextended to such a setting.
3.2.1 Resource imbalance heuristicThe resource imbalance heuristic applies trivially to a sin-
gle machine scenario. Consider a single machine with a net-work link. Say the machine has Nmax VM slots of whichN left are unallocated. Further, the outbound link of themachine has a capacity Bmax of which Bleft is unallocated.The utilization vector for this machine is
< u1, u2 >=< 1− N left
Nmax, 1− Bleft
Bmax> .
Thus, the resource imbalance for the machine is
2∑j=1
(1− uj)2 =
{N left
Nmax
}2
+
{Bleft
Bmax
}2
.
Since physical machines in a datacenter are arranged inracks which, in turn, are arranged in pods, there is a hierar-chy of resources in the datacenter. To capture the resourceimbalance at each level of the datacenter, we extend the setof datacenter resources to include racks and pods. Hence, thedatacenter utilization is given by the vector < u1, . . . , um >,where m is the sum of physical machines, racks, pods andlinks in the datacenter. For a rack k, uk is the fraction of VMslots in the rack that are occupied and the same for pods.Hence, for a resource tuple being considered, the overall re-source imbalance is the sum of the imbalance at individualresources, represented by set C, whose utilization changesbecause of the tuple being accepted, i.e.,
∑j∈C(1− uj)2.
A lower resource imbalance indicates a better positionedprovider. Hence, Bazaar chooses the utilization vector andthe corresponding resource tuple that minimizes this imbal-ance. Since the allocation algorithm is fast (median alloca-tion time is less than 1ms), we simply try to allocate allfeasible tuples to determine the resulting utilization vectorand the imbalance it causes.
3.2.2 Resource selection exampleWe now use a simple example to illustrate how Bazaar’s
imbalance-based resource selection works. Consider a rackof physical machines, each with 2 VM slots and a Giga-bit link. Also, imagine a tenant request with two feasibletuples <N,B> (B in Mbps): <3, 500> and <6, 200>. Fig-ure 5 shows allocations for these two resource tuples. Net-work links in the figure are annotated with the (unreserved)residual bandwidth on the link after the allocation. The fig-ure also shows the imbalance values for the resulting data-center states. The former tuple has a lower imbalance andis chosen by Bazaar.
600
600
1000 Mbps
600500
500
1000
1000 Mbps
State 1
Allocation involves two physical machinesResource Imbalance = Imbalance on machine1 + link1 + machine2 + link2= (0)2 slots + (500/1000)2 Mbps + (½)2 slots + (500/1000)2 Mbps
Total resource imbalance = ¼ + ½ = ¾
VMs allocated to tenant
Empty VM slots
Top of Rack(ToR) Switch
Top of Rack(ToR) Switch
(a). Request <3 VMs, 500 Mbps> (b). Request <6 VMs, 200 Mbps>
State 2Allocation involves three machinesImbalance on machine1 + link1 + machine2 + link2 + machine3 + link3 = 3 * {(0)2 slots + (600/1000)2 Mbps}
Total resource imbalance = 3 * (600/1000)2 = 1.08
Figure 5: Selecting amongst two feasible resourcetuples. Each physical machine has 2 VM slots andan outbound link of capacity 1000 Mbps. Each linkis annotated with its residual bandwidth.
To understand this choice, we focus on the resources left inthe datacenter after the allocations. After the allocation ofthe <3, 500> tuple, the provider is left with five empty VMslots, each with an average network bandwidth of 500 Mbps(state-1). As a contrast, the allocation of <6, 200> results intwo empty VM slots, again with an average network band-width of 500 Mbps (state-2). We note that any subsequenttenant request that can be accommodated by the provider instate-2 can also be accommodated in state-1. However, thereverse is not true. For instance, a future tenant requiringthe tuple <3, 400> can be allocated in state-1 but not state-2. Hence, the first tuple is more desirable for the providerand is the one chosen by the resource imbalance metric.
4. EVALUATIONIn this section, we evaluate Bazaar, focusing on its two maincomponents, namely MRCute and resource selection. Ourevaluation combines MapReduce experiments, simulationsand a testbed deployment. Specifically:
(1). We quantify the prediction accuracy of MRCute. Re-sults indicate that MRCute accurately determines the re-sources required to achieve tenant goals with low overheadand an average prediction error of less than 12% (§4.1).
(2). We use large scale simulations to evaluate the benefitsof Bazaar. Capitalizing on resource malleability significantlyimproves datacenter goodput (§4.2).
(3). We deploy and benchmark our prototype on a 26-nodeHadoop cluster. We further use this deployment to cross-validate our simulation results (§4.3).
4.1 Performance predictionWe use MRCute to predict the job completion of the five
MapReduce jobs described in §2.1 (Table 1). For each job,MRCute predicts the completion time for varying number ofnodes (N) and the network bandwidth between them (B).The prediction involves profiling the job with sample dataon a single node, and using the resulting job parameters todrive the analytical model.
To determine actual completion times, we executed eachjob on a 35-node Emulab cluster with Cloudera’s distribu-tion of Hadoop MapReduce (version 0.20.2). Each node hasa quad-core Intel Xeon 2.4 GHz processor, 12 GB RAM and

0
4000
8000
12000
16000
20000
24000
4 8 12 16 20 24 28 32
Com
ple
tion T
ime (
sec)
Number of nodes
50Mbps (obs)50Mbps (pred)300Mbps (obs)
300Mbps (pred)
(a) Sort
0
500
1000
1500
2000
2500
3000
4 8 12 16 20 24 28 32
Com
ple
tion T
ime (
sec)
Number of nodes
50Mbps (obs)50Mbps (pred)300Mbps (obs)
300Mbps (pred)
(b) WordCount
Figure 6: Predicted completion time for Sort (an I/Ointensive job) and WordCount (a CPU intensive job)matches the observed time.
0 1000 2000 3000 4000 5000 6000 7000
Obs Pred
Hom Obs Pred
Hom Obs Pred
Hom Obs Pred
Hom
Tim
e (
sec)
ReduceShuffle
Map
N=32N=24N=16N=8
Figure 7: Per-phase breakdown of the observed(Obs) and predicted (Pred) completion time for Sort
with bandwidth = 300 Mbps. Hom represents thepredicted time assuming homogeneous disk perfor-mance.
a 1 Gbps network interface. The unoptimized jobs were runwith default Hadoop configuration parameters. The numberof mappers and reducers per node is 8 and 2 respectively,HDFS block size is 128 MB, and the total number of re-ducers is twice the number of nodes used. While parametertuning can improve job performance significantly [14], ourfocus here is not improving individual jobs, but rather pre-dicting the performance for a given configuration. Hence, theresults presented here apply as long as the same parametersare used for job profiling and for the actual execution.
We first focus on the results for Sort and WordCount, twojobs at extreme ends of the spectrum. Sort is an I/O inten-sive job while WordCount is processor intensive. Figures 6(a)and 6(b) plot the observed and predicted completion timefor five runs of these jobs when varying N and B. The fig-ures show that the predicted and observed completion timesare close throughout, with 8.9% prediction error on averagefor Sort and 20.5% at the 95th percentile.
To understand the root cause of the prediction errors, welook at the per-phase completion time. Figure 7 presents thisbreakdown for Sort with varying number of nodes. The barslabeled Obs and Pred represent the observed and predictedcompletion time respectively. The figure shows that the pre-dicted time for the map phase is very accurate; most of theprediction error results from the shuffle and reduce phases.
The reason for this difference in the prediction accuracy isthat the map phase typically consists of a number of waves.Consequently, any outlier map tasks that are straggling inthe earlier waves get masked by the latter waves and theydo not influence the observed phase completion time signifi-cantly. In contrast, the shuffle and reduce phases execute in
a single wave since the number of reduce tasks is the sameas the number of reduce slots on the nodes. As a result, anyoutlier reduce tasks inflate the phase and in turn, the jobcompletion time. Overall, such outliers introduce errors inthe predicted completion time.
Beyond Sort and WordCount, the predicted estimates forthe other jobs show similar trends. For brevity, we sum-marize the prediction errors in Figure 8. Overall, we find amaximum average error of 11.5% and a 95th percentile of20.5%.
4.1.1 Accounting for outliersThe basic MRCute model predicts job completion time as-
suming “ideal” operation. However, data analytics in pro-duction settings is far from ideal; nodes and tasks fail, andmany tasks are outliers. While guaranteed network band-width avoids outliers due to network contention, here wedescribe how MRCute deals with outliers due to bad ma-chines and quantify the impact of workload imbalance.
Bad machines. To account for disk performance variabil-ity, MRCute maintains statistics regarding the disk band-width of individual machines. To highlight the benefits ofsuch benchmarking, the bars in figure 7 labeled Hom (Ho-mogeneous) show the predicted times when MRCute doesnot account for disk performance heterogeneity, and instead,uses a constant value for the disk bandwidth in the analyti-cal model. Since the performance of the disks on individualnodes varies, such an approach underestimates the reducephase time which leads to a high prediction error.
Workload imbalance. The amount of data processed bytasks belonging to the same phase can vary significantlywhich, in turn, leads to outliers. To quantify the impact ofsuch outliers on MRCute, we artificially introduced skew forthe Sort job by choosing input keys from a skewed distribu-tion. Here skew is the coefficient of variation ( stdev
mean) for in-
put across tasks belonging to the same phase. Figure 9 showsthat the prediction error increases almost linearly with in-creasing skew. This is expected given that MRCute profilesthe job only on sample data and does not explicitly accountfor input data skew. Mantri reported a median data skewof 0.34 which leads to 26% prediction error for MRCute. Toaccount for such outliers resulting from workload imbalanceand other factors, we use slack when determining resourcesfor a job. As we show later, this allows us to satisfy tenantgoals in the presence of outliers.
4.1.2 Prediction overheadMRCute profiles a job on sample input data to determine
the job parameters. This imposes two kinds of overhead.(1). Sample data. We use information about the MapRe-
duce configuration parameters, such as when data is spilledto the disk, to calculate the size of the sample data neededfor the job. This is shown in Figure 8. Other than Gridmix,the jobs require <3 GB of sample data, a non-negligibleyet small value compared to typical datasets used in dataintensive workloads [7]. Gridmix is a multi-stage job withhigh selectivity. Hence, we need more sample data to ensureenough data for the last stage when profiling as data gets ag-gregated across stages. This overhead could be reduced byprofiling individual stages separately but requires detailedknowledge about the input required by each stage.
(2). Profiling time. Figure 8 also shows the time to profileindividual jobs. For Sort and WordCount, the profiling takes

Hadoop Job Stages Sample Profiling Time Prediction error (all runs)Data Size Average 95%ile
Sort 1 1GB 100.8s 8.9% 20.5%WordCount 1 450MB 67.5s 8.4% 19.7%Gridmix 3 16GB 546s 11.5% 17.8%TF-IDF 3 3GB 335s 5.6% 9.7%
LinkGraph 4 3GB 554.8s 8.2% 12.3%
Figure 8: Prediction overhead and error of MRCute for Hadoop jobs.
0
10
20
30
40
50
60
0 0.2 0.4 0.6 0.8 1
Pre
dic
tion E
rror
(%)
Data Skew
Figure 9: Impact of skew.
around 100 seconds. For the multi-stage jobs, profiling timeis higher since more data needs to be processed. However, ajob needs to be profiled only once to predict the completiontime for all resource tuples, and we can also use informationfrom past runs.
To summarize, these experiments indicate that MRCute canindeed generate good completion time estimates for MapRe-duce jobs.
4.2 Resource selectionPerformance prediction allows Bazaar to determine the
candidate resource tuples that can satisfy a tenant’s com-pletion time goals. Here, we evaluate the potential gains re-sulting from smart selection of the resource tuple to use.
4.2.1 Simulation setupGiven the small size of our testbed, we developed a sim-
ulator to evaluate Bazaar at scale. The simulator coarselymodels a multi-tenant datacenter. It uses a three-level treetopology with no path diversity. Racks of 40 machines withone 1 Gbps link each and a Top-of-Rack switch are con-nected to an aggregation switch. The aggregation switches,in turn, are connected to the datacenter core switch. Theresults in the following sections involve a datacenter with16,000 physical machines and 4 VMs per machine, resultingin a total of 64,000 VMs. The network has an oversubscrip-tion of 1:10 and we vary this later. Each VM has a localdisk. While high-end SSDs can offer bandwidth in excess of200 MB/s for even random access patterns [47], we conser-vatively use a disk I/O bandwidth of 125 MB/s = 1 Gbpssuch that it can saturate the network interface.MapReduce jobs. We use a simple model for MapReducejobs. The program P associated with a job is characterizedby four parameters– the rate at which data can be processedby the map and reduce function when there are no I/O bot-tlenecks (BPmap, B
Preduce) and the selectivity of these func-
tions (Smap, Sreduce). Given the input size, the selectivityparameters are used to determine the size of the intermedi-ate and output data generated by the job. Note that an I/Ointensive job like Sort can process data fast and has highvalues for BPmap and BPreduce. To capture the entire spec-trum of MapReduce jobs, we choose these parameters froman exponential distribution with a mean of 500 Mbps. Wealso experiment with other mean values.Tenant Requests. Each tenant request consists of a MapRe-duce job, input size and a completion time goal. This in-formation is fed to the analytical model to determine thecandidate resource tuples for the job. From these candidatetuples, one tuple <N,B> is chosen based on the selectionstrategies described below. The corresponding resources, NVMs with B Mbps of network bandwidth, are allocated us-
ing the allocation algorithm in [2]. If the request cannot beallocated because of insufficient resources, it is rejected.
We simulate all three phases of MapReduce jobs. We do notmodel the disk and CPU operations. Instead, the duration ofthe map and the reduce phase is simply calculated a prioriby invoking the MRCute analytical model. As part of theshuffle phase, we simulate all-to-all traffic matrix with N2
network flows between the N VMs allocated to the tenant.Given the bandwidth between VMs, we use max-min fairnessto calculate the rate achieved by each flow. The shuffle phasecompletes when all flows complete.Resource selection strategies. We evaluate three strate-gies to select a resource tuple.
(1). Baseline. This strategy does not take advantage ofa job’s resource malleability. Instead, one of the candidatetuples is designated as the baseline tuple <Nbase, Bbase>.The job is executed using this baseline resource tuple.
(2). Bazaar-R (random selection). A tuple is randomly se-lected from the list of candidates, and if it can be allocatedin the datacenter, it is chosen. Otherwise the process is re-peated. This strategy takes advantage of resource malleabil-ity to accommodate requests that otherwise would have beenrejected. However, it does not account for the impact that atuple bears on the provider.
(3). Bazaar-I (imbalance-based selection). For each tuple,we determine how it would be allocated and calculate the re-sulting utilization vector and resource imbalance. The tuplewith the lowest resource imbalance is chosen.Workload. To model the operation of cloud datacenters,we simulate tenant requests arriving over time. By varyingthe tenant arrival rate, we vary the target VM occupancyfor the datacenter. Assuming Poisson tenant arrivals with amean arrival rate of λ, the target occupancy on a datacenterwith M total VMs is λNT
M, where T is the mean completion
time for the requests and N is the mean number of requestedVMs in the Baseline scenario.
4.2.2 Selection benefitsWe simulate the arrival and execution of 15,000 tenant
requests. The desired completion time for each request ischosen such that the number of compute nodes (Nbase) andnetwork bandwidth (Bbase) required in the Baseline scenariois exponentially distributed. The mean value for Nbase is50, which is consistent with the mean number of VMs thattenants request in cloud datacenters [31].
Workloads and metrics. Two primary variables are usedin the following experiments to capture different workloads.First, we vary the mean bandwidth required by tenants (Bbase).This reflects tenants having varying completion time require-ments. Second, we vary the target occupancy to control thetenant request arrival rate.
From a provider’s perspective, we look at two metrics toquantify the potential benefits of resource selection. First

0
5
10
15
20
25
30
10 25 50 75 100
Rej
ecte
d R
eques
ts (
%)
Target Occupancy (%)
BaselineBazaar-RBazaar-I
(a) Mean BW = 500Mbps
0
5
10
15
20
25
30
100 300 500 700 900
Rej
ecte
d R
eques
ts (
%)
Network Bandwidth (Mbps)
BaselineBazaar-RBazaar-I
(b) Target Occupancy = 75%
Figure 10: Percentage of rejected requests, varyingmean bandwidth and target occupancy.
1
1.2
1.4
1.6
1.8
2
10 25 50 75 100
Goo
dput
(re
lative
to
Bas
elin
e)
Target Occupancy (%)
Bazaar-IBazaar-R
(a) Mean BW = 500Mbps
1
1.2
1.4
1.6
1.8
2
100 300 500 700 900
Goo
dput
(re
lative
to
Bas
elin
e)
Network Bandwidth (Mbps)
Bazaar-IBazaar-R
(b) Target Occupancy = 75%
Figure 11: Datacenter goodput with varying meanbandwidth and varying target occupancy.
is the fraction of requests that are rejected. However, this,by itself, does not represent the full picture since individualrequests are of different sizes, i.e., each request processes adifferent amount of data. To capture this, we also look atthe sum of input data consumed across all requests. Thisrepresents the total useful work in the datacenter and is,thus, termed as the datacenter goodput.
Impact of varying mean bandwidth and target oc-cupancy. Figure 10(a) plots the percentage of rejected re-quests with varying target occupancy. For all selection strate-gies, the rejection ratio increases with increasing target oc-cupancy. This is because requests start arriving faster and,hence, a greater fraction have to be rejected. The figureshows that, depending on the occupancy, Bazaar-I resultsin 3-14% fewer requests being rejected. Bazaar-R rejectsaround 2-5% more requests than Bazaar-I. However, as weexplain below, the actual benefit of the imbalance-based se-lection is larger.
To put this in perspective, operators like Amazon EC2 tar-get an average occupancy of 70-80% [42]. Figure 10(b) plotsthe rejected requests for a target occupancy of 75%. The fig-ure shows that the difference between the fraction of requestsrejected by both Bazaar strategies as compared to Baselineincreases with increasing mean bandwidth. Increasing thebandwidth required by the job implies tighter completiontime requirements which, in turn, means there are greatergains to be had from selecting the appropriate resource com-bination. At mean bandwidth of 900 Mbps, Bazaar-I rejects19.9% fewer requests than Baseline.
Figure 11 shows the datacenter goodput for the Bazaarselection strategies relative to Baseline. Depending on theoccupancy and bandwidth, Bazaar-I improves the goodput by7-87% over Baseline, while Bazaar-R provides improvements
of 0-66%. As an example, at typical occupancy of 75% and amean bandwidth of 500 Mbps, Bazaar-I and Bazaar-R offer56% and 39% benefits relative to Baseline respectively. Notethat the gains with Bazaar-R show how resource malleabilitycan be used to accommodate tenant requests that wouldotherwise have been rejected. The further gains with Bazaar-I represent the benefits to be had by smartly selecting theresources to use.
In figure 11(a), the relative improvement in goodput withBazaar strategies first increases with target occupancy andthen declines. This is because, at both low and high occu-pancy, there is not as much room for improvement. At lowoccupancy, requests arrive far apart in time and most canalso be accepted by Baseline. At high occupancy, the arrivalrate is high and the datacenter is heavily utilized. In fig-ure 11(b), the gains increase with increasing bandwidth. Asexplained above, this results from shrinking completion timerequirements which allow Bazaar strategies to accept morerequests as compared to Baseline. Further, Bazaar is ableto accept bigger requests resulting in even higher relativegains.
Impact of simulation parameters. We also determinedthe impact of other simulation parameters on Bazaar per-formance and the results stay qualitatively the same. Due tospace constraints, we only show the results of varying over-subscription and briefly discuss the impact of varying themean disk and other parameters.
Figure 12 shows the relative goodput with varying networkoversubscription. Even in a network with no oversubscrip-tion, e.g., [11], Bazaar-I is able to accept 10% more requestsand improves the goodput by 27% relative to Baseline. Fur-ther, the relative improvement with Bazaar increases withincreasing oversubscription before flattening out. This is be-cause the physical network becomes more constrained andBazaar can benefit by reducing the network requirements oftenants while increasing their VMs.
We also ran experiments using different values of the diskbandwidth. As expected, low values of the disk bandwidthreduce the benefits of Bazaar-I. When the disk bandwidthis extremely low (250 Mbps), increasing the network band-width beyond this value does not improve performance. Thus,there are very few candidate resource tuples and the gainswith Bazaar are small (2% over Baseline). However, as thedisk bandwidth improves, there are more candidate tuplesto choose from and the performance improves.
Finally, we varied the mean task bandwidth (map and re-duce) and also the datacenter size (up to a maximum of32,000 servers and 128,000 VMs) and the results confirmedthe trends observed in Figure 10 and 11.
Comparison with today’s setup. Today, cloud pro-viders do not offer any bandwidth guarantees to tenants.VMs are allocated using a greedy locality-aware strategy andbandwidth is fair-shared across tenants using TCP. In Fig-ure 13(a), we compare the performance of Bazaar-I againsta setup representative of today’s scenario, which we de-note as Fair-sharing. For low values of occupancy, Fair-sharing achieves a slight better performance than Bazaar-I. The reason is that Bazaar-I reserves the network band-width throughout the entire duration of a tenant’s job. Thisalso includes the map and reduce phase, which are typicallycharacterized by little or no network activity. In contrast, inFair-sharing, the network bandwidth is not exclusively as-signed to tenants and, hence, due to greater multiplexing, it

1 1.1 1.2 1.3 1.4 1.5 1.6 1.7 1.8 1.9
1 5 10 20
Goo
dput
(re
lative
to
Bas
elin
e)
Oversubscription (1:X)
Bazaar-IBazaar-R
Figure 12: Network oversub-scription (occupancy is 75%).
0
5
10
15
20
25
30
35
10 25 50 75 100
Rej
ecte
d R
eques
ts (
%)
Target Occupancy (%)
Bazaar-IFair-sharing
(a) Rejected requests.
0
0.25
0.5
0.75
1
0.25 1 4 16
CD
F (r
eques
ts)
Actual / desired completion time
Bazaar-IFair-sharing
(b) CDF of completion time.
Figure 13: Comparing against today’s setup (Mean BW is 500 Mbps).
0
10
20
30
0 10 20 30 40 50 60 70
Reje
cted R
equest
s (%
)
Slack (%)
Oracle
Bazaar-I
(a) Rejected requests
0
20
40
60
80
0 10 20 30 40 50 60 70
Late
jobs
(%)
Slack (%)
Bazaar-I
(b) Late jobs
Figure 14: Using slack to offset impact of outliers.
achieves a higher network utilization. Yet, for high values ofoccupancy, which are typical of today’s datacenters [42], re-jected requests significantly increase. This is due to the highcongestion incurred in the core of the network, caused bythe sub-optimal placement of VMs and corresponding flows.
The main drawback of Fair-sharing, however, is highlightedin Figure 13(b), which shows that the completion time isextended for at least 50% of the jobs and for 12% of thejobs the actual completion time is at least twice the desiredcompletion time. Since tenants pay based on the time theyoccupy VMs, this also inflates tenant costs.
4.2.3 Mitigating outliers with slackThe results above assume perfect prediction. Since our pre-
diction does not account for all possible outliers, the pre-dicted completion time for a job can be off which, in turn,would cause the job to be late. To counter this, Bazaar relieson slack. To evaluate how much slack is needed in practice,we use the outlier distribution from Bing’s production clus-ters (reported in [1]) to introduce outlier tasks in our experi-ments. Such tasks extend jobs past the predicted completiontime. Given this, we measure the impact of varying slack onrejected requests (relevant for the provider) and late jobs(relevant for the tenants).
Figure 14(a) shows that more requests are rejected withincreasing slack. As slack increases, it is harder to accommo-date requests since they need to be finished sooner and thus,require more resources. For slack less than 50%, Bazaar-Irejects fewer requests than an “Oracle” that can do perfectprediction but does not capitalize on resource selection. Ineffect, smart resource selection allows us to offset predictioninaccuracies. The same trends hold for goodput too.
Figure 14(b) shows the percentage of jobs that finish be-yond the goal completion time. With no slack, ∼90% of jobsare late, a consequence of 90% of jobs having at least one
outlier. As slack increases, the late requests decrease almostlinearly, and with a slack of 50%, no requests are late. Over-all, the slack parameter gives the provider a knob to satisfytenant goals even in the presence of outliers at the expenseof greater rejections. For instance, the provider may use his-torical job information to determine the amount of slack toprovision so as to bound the probability of breached SLAs.
4.3 DeploymentWe complement our simulation analysis with experiments
on a small-scale Hadoop cluster using a prototype implemen-tation of Bazaar. We deployed Bazaar on 26 Emulab servers,using the same hardware setup described in Section 4.1 andthe Cloudera distribution of Hadoop. We used the LinuxTraffic Control API on individual servers to enforce the ratelimits.
We configured one of the testbed servers as the clusterhead node and the rest of the servers as compute nodes. Thehead node is responsible of generating tenant requests andallocate them on the compute nodes. The workload consistedof 100 Sort job requests with an exponentially generatedinput data size (the mean value was 5.7 GB). Like in theprevious experiments, we used a target occupancy of 75%,mean Bbase of 500 Mbps and mean Nbase equal to 9.
The goal of these experiments is threefold. First, we quan-tify the benefits of Bazaar. Second, we cross-validate theaccuracy of our simulator. Finally, we verify the scalabilityof our implementation to allocate requests in a much biggernetwork.Benefits. Figure 15 shows that Bazaar-I is able to accept11.43% more Sort jobs than Baseline (i.e., 8 extra jobs)and increases goodput by 15.47%. This is despite limitedopportunities– the deployment is small and the disk band-width available is low. Also, with Bazaar-I, less than 2% ofthe accepted requests completed later than expected. Note,however, that in these experiments we did not add any slack,which would have enabled all requests to complete on time.Cross-validation. To validate the accuracy of our simula-tor, we replicated the same workload in the simulator, i.e. thesame stream of jobs arrive in the simulator as on the testbed.Across all cases, the maximum difference in the number ofaccepted requests and goodput is approximately 5.12%, and8.43% respectively. This cross-validation gives us confidencein our simulation results.Scalability analysis. To evaluate the performance of ourprototype at scale, we measured the time to allocate tenantrequests on a datacenter with 128,000 VMs. This includesboth the time to generate the set of candidate resource tu-ples using the analytical model (Section 3.1.1) and to selectthe resources (Section 3.2). This does not include the job

0
5
10
15
20
Accepted jobs Goodput
Gai
n (
%)
(r
ela
tive
to
Bas
elin
e)
Figure 15: On testbed,Bazaar-I can acceptmore Hadoop jobsand increase goodputrelative to Baseline.
1
1.2
1.4
1.6
1.8
2
10 25 50 75 100
Goo
dput
(re
lative
to
Bas
elin
e)
Target Occupancy (%)
Bazaar-TBazaar-I
Strawman
Figure 16: Datacentergoodput when exploit-ing time malleability.
profiling time. Over 10,000 requests, the median allocationtime is 950.17 ms with a 99th percentile of 983.29 ms. Notethat this only needs to be run when a tenant is admitted,and, hence, the overhead introduced is negligible.
4.4 Beyond two resources: time malleabilityOur evaluation considered application malleability along
two dimensions, i.e., N and B. However, a job-centric cloudallows the provider to exploit malleability across other re-sources and across time. Here, we briefly explore this oppor-tunity. The provider can devote additional (idle) resourcesto tenant jobs, so that they complete before the desiredtime. In this way, the resources used by the job can be re-claimed earlier, and a larger number of requests can poten-tially be accommodated in the future. Tenants would benefittoo since they would experience shorter than desired com-pletion times.
We denote this further selection strategy as Bazaar-T. Thekey difference between Bazaar-T and Bazaar-I is that thelatter only considers tuples < N,B > that yield a comple-tion time T = Tdesired while Bazaar-T also consider tupleswhere T < Tdesired. Among these, Bazaar-T selects the tuplethat minimizes the product of the tuple resource imbalanceand T . Figure 16 shows that, at high values of the targetoccupancy, exploiting time flexibility significantly improvesthe ability of the provider to accommodate more requestsand, hence, the goodput increases. Bazaar-T is also benefi-cial for tenants as the median completion time is reduced bymore than 50%, and for 20% of the jobs the completion timeis reduced by 80%. In Figure 16 we also consider a naive ap-proach, Strawman, that always selects the tuple that yieldsthe lowest completion time, irrespective of the resource im-balance. Such a strategy performs poorly as it tends to over-provision the resources for the early requests, which reducesthe ability to accommodate future ones.
5. RELATED WORKWhile we discussed a lot of relevant work in Section 2, we
briefly comment on other efforts here. The prominence ofdata analytics has prompted a slew of proposals for improv-ing analytics frameworks; for example, determining goodconfiguration parameters [14, 20], better scheduling [17, 40],etc.
The observation that today’s provider interface is discon-nected from tenant needs has also led to recent efforts totackle the problem [9, 14, 35, 39]. Elasticiser [14] and Con-ductor [39] translate tenant goals into cloud resource require-ments, while Aria [35] and Jockey [9] focus on private set-tings. All these proposals involve a performance prediction
component; Conductor uses a model while Jockey uses a sim-ulator. Like Bazaar, Aria and Elasticiser combine profilingwith modeling. Aria uses historical information for profilingand has a model that estimates performance bounds. Elasti-ciser profiles using instrumentation and relies on a statisticalmodel.
The key difference in Bazaar is our focus on enabling ajob-centric interface. Further, we account for multiple re-sources. Specifically, we dedicate a network slice to tenantjobs. The fact that the network is a shared yet distributedresource makes this hard. However, as explained below, do-ing so makes the translation of tenant goals simpler andbenefits the provider. First, guaranteed network resourcesavoid inter-job contention and make model-based predic-tion tractable. Second, a per-tenant network slice, combinedwith the notion of slack, avoids the need for dynamic adap-tation [9, 39]. Finally, by exploiting the trade-off betweenresources (VMs, network) and between time, the providerachieves greater flexibility and revenue.
There has also been a lot of progress towards data analyt-ics performance prediction. For example, Mumak [46] andMRPerf [37] are discrete-event simulators for MapReduce,Ganapathi et al. [10] use statistical analysis to discover fea-ture vectors and predict job performance, ParaTimer [29] isa job progress estimator that relies on debug runs of the job.Bazaar needs fast prediction, so it cannot use detailed sim-ulators like MRPerf that take minutes per simulation [14];exploring 100 resource tuples would take 100s of minutes.Instead, we adopt a hybrid approach that trades off accu-racy for prediction speed. Tian et al. [34] use a similar tactinvolving profiling on sample data and then linear regressionfor prediction. Finally, there has been work towards perfor-mance prediction for other cloud applications (eg., web [27]and ERP applications [33]). Coupling our resource selectionstrategies with future prediction frameworks would allowBazaar to offer a job-centric interface to applications beyondMapReduce.
6. PRICING DISCUSSIONBazaar’s job-centric interface achieves a better alignment
of provider-tenant interests. This opens up interesting op-portunities to investigate new pricing models.
Today, tenants pay based on the amount of time they usecompute resources. For instance, with today’s setup, the costfor a tenant renting N VMs for T hours is $kv ·NT , where kvis the hourly VM price. Such resource-based pricing can benaively extended to multiple resources. A simple extensionto a two-resource setting would be to charge for the networkbandwidth too. So a tenant with N VMs and B Mbps ofnetwork bandwidth would pay $kc · NBT , where kc is thehourly combined price for VMs and bandwidth. However,this results in a mismatch of tenant and provider interests.The cheapest resource tuple to achieve the tenant’s goal maynot concur with the provider’s preferred resource combina-tion. Further, resource based pricing entails tenants have topay based on a job’s actual completion time. Hence, from apricing perspective, there is a disincentive for the providerto reduce the completion time.
By decoupling the tenants from the underlying resources,Bazaar offers the opportunity of moving away from resourcebased pricing. Instead, tenants could be charged based onlyon the characteristics of their job, the input data size andthe desired completion time. Such job-based pricing can ben-

efit both entities. Tenants specify what they desire and arecharged accordingly; providers decide how to efficiently ac-commodate the tenant request based on job characteristicsand current datacenter utilization. Further, since the finalprice does not depend on the completion time, providers nowhave an incentive to complete tenant jobs on time, possiblyeven earlier than the desired time as in Bazaar-T.
A job-centric cloud, coupled with job-based pricing, canthus enable a symbiotic tenant provider relationship wheretenants benefit due to fixed costs upfront and better-than-desired performance while providers use the increased flexi-bility to improve goodput and, consequently, total revenue.
7. CONCLUSIONSBazaar enables a job-centric cloud interface for data an-
alytics. It translates high-level tenant goals to datacenterresources. This involves predicting application resource re-quirements. Further, Bazaar exploits the resource malleabil-ity of cloud applications to select the resource combinationthat will achieve tenant goals while improving provider effi-ciency. Our evaluation shows that, by serving as a conduitfor exchange of information between tenants and providers,Bazaar provides benefits for both entities.
AcknowledgementsWe are grateful to Christos Gkantsidis, Greg O’Shea, andBozidar Radunovic for their helpful comments and sugges-tions.
8. REFERENCES
[1] G. Ananthanarayanan, S. Kandula, A. Greenberg,I. Stoica, Y. Lu, B. Saha, and E. Harris. Reining inthe Outliers in Map-Reduce Clusters using Mantri. InOSDI, 2010.
[2] H. Ballani, P. Costa, T. Karagiannis, andA. Rowstron. Towards Predictable DatacenterNetworks. In SIGCOMM, 2011.
[3] A. Borodin and R. El-Yaniv. Online Computation andCompetitive Analysis. Cambridge University Press,2005.
[4] B. M. Cantrill, M. W. Shapiro, and A. H. Leventhal.Dynamic instrumentation of production systems. InUSENIX ATC, 2004.
[5] R. Chaiken, B. Jenkins, P.-A. Larson, B. Ramsey,D. Shakib, S. Weaver, and J. Zhou. SCOPE: easy andefficient parallel processing of massive data sets. InVLDB, 2008.
[6] J. Dean and S. Ghemawat. MapReduce: SimplifiedData Processing on Large Clusters. In OSDI, 2004.
[7] J. Dean and S. Ghemawat. MapReduce: SimplifiedData Processing on Large Clusters. Comm.of ACM,51(1),2008.
[8] N. R. Devanur, K. Jain, B. Sivan, and C. A. Wilkens.Near optimal online algorithms and fastapproximation algorithms for resource allocationproblems. In EC, 2011.
[9] A. Ferguson, P. Bodik, S. Kandula, E. Boutin, andR. Fonseca. Jockey: guaranteed job latency in dataparallel clusters. In EuroSys, 2012.
[10] A. Ganapathi, Y. Chen, A. Fox, R. H. Katz, andD. A. Patterson. Statistics-Driven Workload Modelingfor the Cloud. In SMDB, 2010.
[11] A. Greenberg, J. R. Hamilton, N. Jain, S. Kandula,C. Kim, P. Lahiri, D. A. Maltz, P. Patel, andS. Sengupta. VL2: a scalable and flexible data centernetwork. In SIGCOMM, 2009.
[12] A. Gulati, I. Ahmad, and C. A. Waldspurger.PARDA: proportional allocation of resources fordistributed storage access. In FAST, 2009.
[13] C. Guo, G. Lu, H. J. Wang, S. Yang, C. Kong, P. Sun,W. Wu, and Y. Zhang. SecondNet: A Data CenterNetwork Virtualization Architecture with BandwidthGuarantees. In CoNEXT, 2010.
[14] H. Herodotou, F. Dong, and S. Babu. No One(Cluster) Size Fits All: Automatic Cluster Sizing forData-intensive Analytics. In ACM SOCC, 2011.
[15] A. Iosup, N. Yigitbasi, and D. Epema. On thePerformance Variability of Production Cloud Services.Technical report, Delft University of Technology, 2010.
[16] M. Isard, M. Budiu, Y. Yu, A. Birrell, and D. Fetterly.Dryad: Distributed Data-Parallel Programs fromSequential Building Blocks. In EuroSys, 2007.
[17] M. Isard, V. Prabhakaran, J. Currey, U. Wieder,K. Talwar, and A. Goldberg. Quincy: Fair Schedulingfor Distributed Computing Clusters. In SOSP, 2009.
[18] N. Joukov, A. Traeger, R. Iyer, C. P. Wright, andE. Zadok. Operating system profiling via latencyanalysis. In OSDI, 2006.
[19] A. Kamath, O. Palmon, and S. Plotkin. Routing andadmission control in general topology networks withpoisson arrivals. In ACM-SIAM SODA, 1996.
[20] K. Kambatla, A. Pathak, and H. Pucha. TowardsOptimizing Hadoop Provisioning in the Cloud. InHotCloud, 2009.
[21] M. Karlsson, C. Karamanolis, and X. Zhu. Triage:Performance differentiation for storage systems usingadaptive control. ACM Trans. Storage, 1, 2005.
[22] M. Kremer and J. Gryz. A Survey of QueryOptimization in Parallel Databases. Technical report,York University, 1999.
[23] E. Krevat, J. Tucek, and G. R. Ganger. Disks AreLike Snowflakes: No Two Are Alike. In HotOS, 2011.
[24] E. Lazowska, J. Zahorjan, S. Graham, and K. Sevcik.Quantitative system performance: computer systemanalysis using queuing network models. 1984.
[25] S. Lee, R. Panigrahy, V. Prabhakaran,V. Ramasubramanian, K. Talwar, L. Uyeda, andU. Wieder. Validating Heuristics for Virtual MachinesConsolidation. Technical Report MSR-TR-2011-9,MSR, 2011.
[26] A. Li, X. Yang, S. Kandula, and M. Zhang.CloudCmp: comparing public cloud providers. In IMC,2010.
[27] A. Li, X. Zong, S. Kandula, X. Yand, and M. Zhang.CloudProphet: Towards Application PerformancePrediction in Cloud. In SIGCOMM (Poster), 2011.
[28] Michael Armburst et al. Above the Clouds: ABerkeley View of Cloud Computing. Technical report,UCB, 2009.

[29] K. Morton, M. Balazinska, and D. Grossman.ParaTimer: a progress indicator for MapReduceDAGs. In SIGMOD, 2010.
[30] J. Schad, J. Dittrich, and J.-A. Quiane-Ruiz. Runtimemeasurements in the cloud: observing, analyzing, andreducing variance. In VLDB, 2010.
[31] A. Shieh, S. Kandula, A. Greenberg, and C. Kim.Sharing the Datacenter Network. In NSDI, 2011.
[32] D. Shue, M. J. Freedman, and A. Shaikh. PerformanceIsolation and Fairness for Multi-Tenant CloudStorage. In OSDI, 2012.
[33] D. Tertilt and H. Krcmar. Generic PerformancePrediction for ERP and SOA Applications. In ECIS,2011.
[34] F. Tian and K. Chen. Towards Optimal ResourceProvisioning for Running MapReduce programs inPublic Cloud. In CLOUD, 2011.
[35] A. Verma, L. Cherkasova, and R. Campbell. ARIA:automatic resource inference and allocation formapreduce environments. In ICAC, 2011.
[36] E. Walker. Benchmarking Amazon EC2 forhigh-performance scientific computing. Login, 2008.
[37] G. Wang, A. R. Butt, P. Pandey, and K. Gupta. ASimulation Approach to Evaluating Design Decisionsin MapReduce Setups. In MASCOTS, 2009.
[38] T. White. Hadoop: The Definitive Guide. O’Reilly,2009.
[39] A. Wieder, P. Bhatotia, A. Post, and R. Rodrigues.Orchestrating the Deployment of Computations in theCloud with Conductor. In NSDI, 2012.
[40] M. Zaharia, D. Borthakur, J. Sen Sarma,K. Elmeleegy, S. Shenker, and I. Stoica. DelayScheduling: a Simple Technique for Achieving Localityand Fairness in Cluster Scheduling. In EuroSys, 2010.
[41] Amazon Elastic MapReduce.http://aws.amazon.com/elasticmapreduce/.
[42] Amazon’s EC2 Generating 220M+ Annually.http://bit.ly/8rZdu.
[43] Big Data @ Foursquare . http://goo.gl/FAmpz.
[44] Hadoop Wiki: PoweredBy. http://goo.gl/Bbfu.
[45] Measuring EC2 system performance.http://bit.ly/48Wui.
[46] Mumak: Map-Reduce Simulator.http://bit.ly/MoOax.
[47] Tom’s Hardware Blog. http://bit.ly/rkjJwX.
APPENDIXAs described in Section 3.1.1, the completion time for eachphase of a map reduce job depends on the number of wavesin the phase, the amount of data consumed or generated byeach task in the phase and the phase bandwidth. Here weanalytically determine these values, and use them to derivean expression for the job completion time.
1). Phase bandwidth. We described the modeling of themap phase in §3.1.1. Following the same logic for the reducephase, Breduce = Min{BD, BPreduce}. During the shufflephase (Figure 17), reduce tasks complete two operations.Each reduce task first reads its partition of the intermediate
BN
network
Disc
BD B
D
ReduceBP
reduce BD
Reduce PhaseShuffle Phase
𝑩𝒓𝒆𝒅𝒖𝒄𝒆 = 𝐦𝐢𝐧 𝑩𝑫, 𝑩𝒓𝒆𝒅𝒖𝒄𝒆𝑷
merge
𝑩𝒔𝒉𝒖𝒇𝒇𝒍𝒆 = {𝟏
𝐦𝐢𝐧 𝑩𝑵, 𝑩𝑫 +
𝒇
𝑩𝑫}−𝟏
Disc
merge
Figure 17: Detailed description of the resources in-volved in the shuffle and reduce phase.
data across the network, and then merges and writes it todisk. Hence, bandwidth = Min{BD, BN}, where BN is thenetwork bandwidth. Next, the data is read off the disk andan external merge sort is performed before the data is con-sumed by the reduce phase. This operation is bottleneckedat the disk, i.e., bandwidth = BD. Note that the externalmerge sort can proceed in multiple steps leading to a largeramount of data being written to disk than that read fromthe map phase. We account for this through a factor f thatcaptures the extra data written to disk relative to the dataread in. Thus, we model the shuffle phase as two steps withbandwidths Min{BD, BN} and BD respectively.
2). Data consumed. For a MapReduce job with M maptasks, R reduce tasks and input of size |I|, each map task
consumes |I|M
bytes, while each reduce task consumes |I|Smap∗R
bytes and generates |I|Smap∗Sreduce∗R
bytes with Smap and
Sreduce being the data selectivity of map and reduce tasksrespectively.
3). Waves. For a job using N VMs with Mc map slotsper-VM, the maximum number of simultaneous mappers isN ∗ Mc. Consequently, the map tasks execute in d M
N∗Mce
waves. Similarly, the reduce tasks execute in d RN∗Rc
e waves,where Rc is the number of reduce slots per-VM.
Since tasks belonging to a phase execute in waves, the com-pletion time for a phase depends on the number of waves andthe completion time for the tasks within each wave. Hence,for the map phase,
Tmap = Wavesmap ∗ Inputmap
Bmap= d M
N∗Mce ∗{ |I|/MBmap
}.
Using similar logic for the shuffle and reduce phase com-pletion time, the estimated job completion time is
Testimate = Tmap + Tshuffle + Treduce
= d MN∗Mc
e ∗{ |I|/MBmap
}+
⌈R
N∗Rc
⌉∗ |I|{Smap∗R} ∗
{1
Min(BD,BN )+ f
BD
}+
⌈R
N∗Rc
⌉∗{|I|/{Smap∗Sreduce∗R}
Breduce
}.
The discussion above assumes that the map tasks are sched-uled so that their input is available locally and the outputgenerated by reducers is written locally with no further repli-cation. Further, the reduce tasks are separated from the mapphase by a barrier and execute once all the map tasks are fin-ished [1]. While these assumptions helped the presentation,MRCute does not rely on them. For instance, to account fornon data-local maps, the network bandwidth is also consid-ered when estimating Bmap.