brighton & hove connected and partnerships & partnership... · brighton & hove...
TRANSCRIPT

Simon Newell, Head of Partnerships & External
Relations, Brighton & Hove Connected
Brighton & Hove Connected and
Partnerships
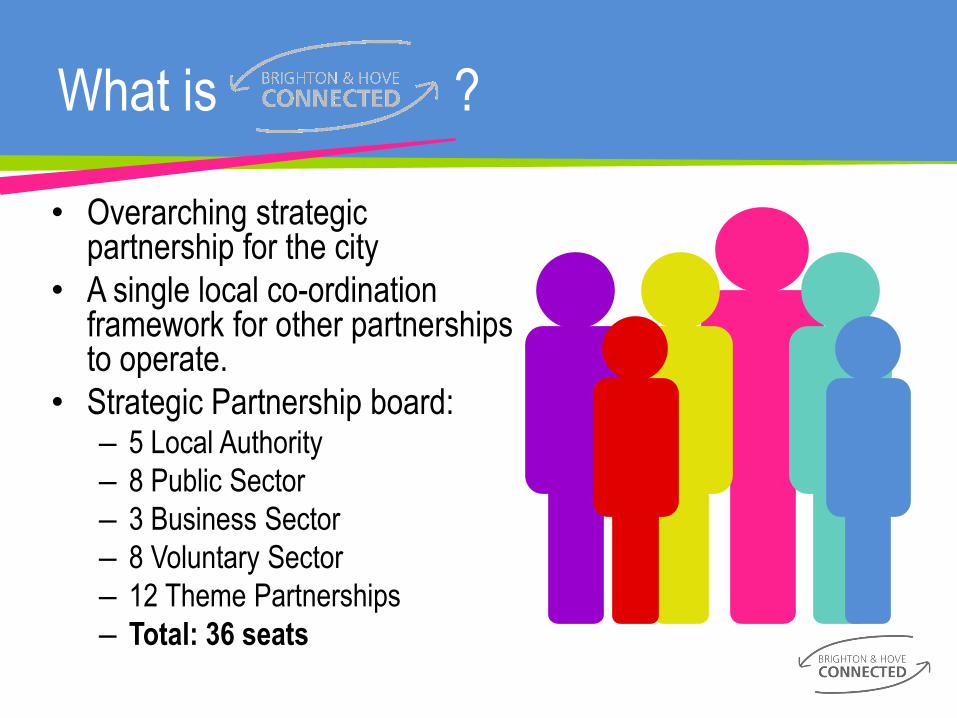
What is ?
• Overarching strategic partnership for the city
• A single local co-ordination framework for other partnerships to operate.
• Strategic Partnership board: – 5 Local Authority
– 8 Public Sector
– 3 Business Sector
– 8 Voluntary Sector
– 12 Theme Partnerships
– Total: 36 seats
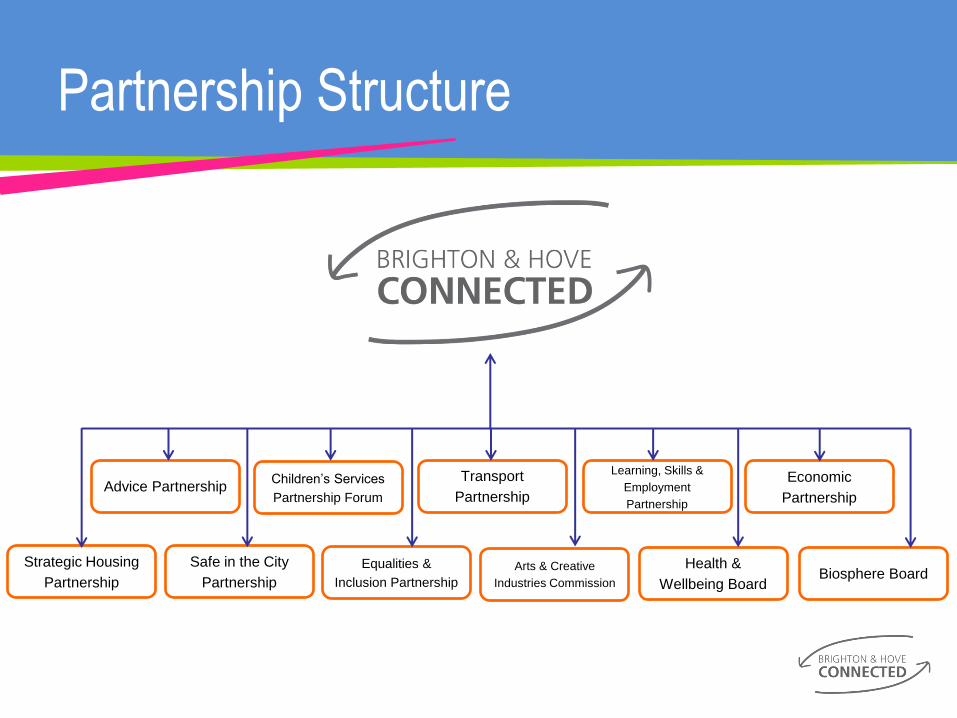
Partnership Structure
Children’s Services
Partnership Forum
Strategic Housing
Partnership
Safe in the City
Partnership
Equalities &
Inclusion Partnership
Arts & Creative
Industries Commission
Transport
Partnership
Health &
Wellbeing Board
Economic
Partnership
Learning, Skills &
Employment
Partnership
Advice Partnership
Biosphere Board
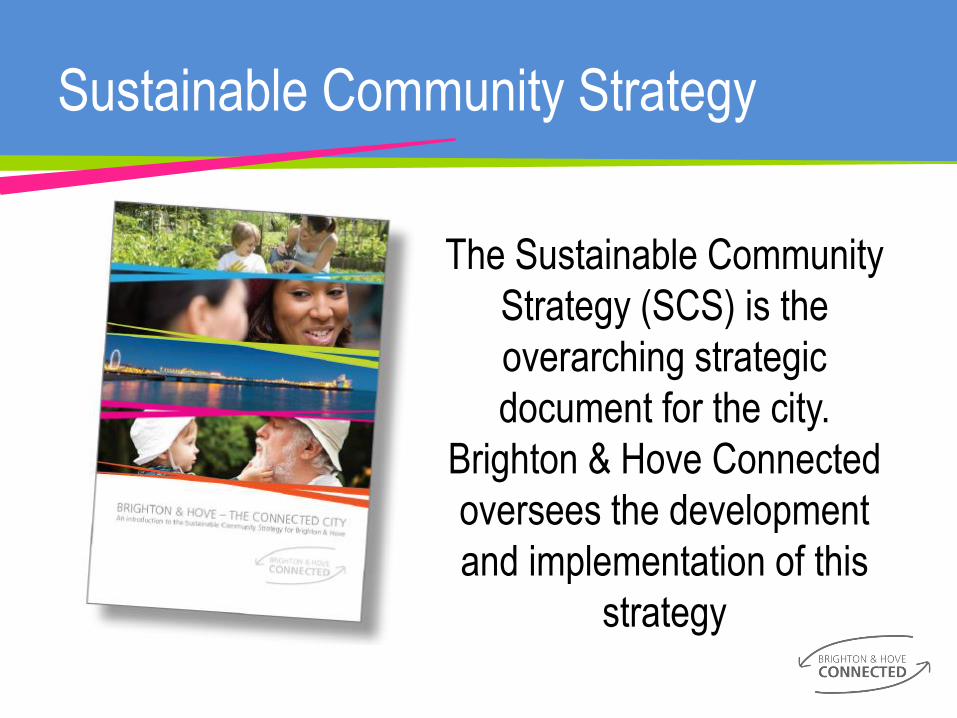
Sustainable Community Strategy
The Sustainable Community
Strategy (SCS) is the
overarching strategic
document for the city.
Brighton & Hove Connected
oversees the development
and implementation of this
strategy
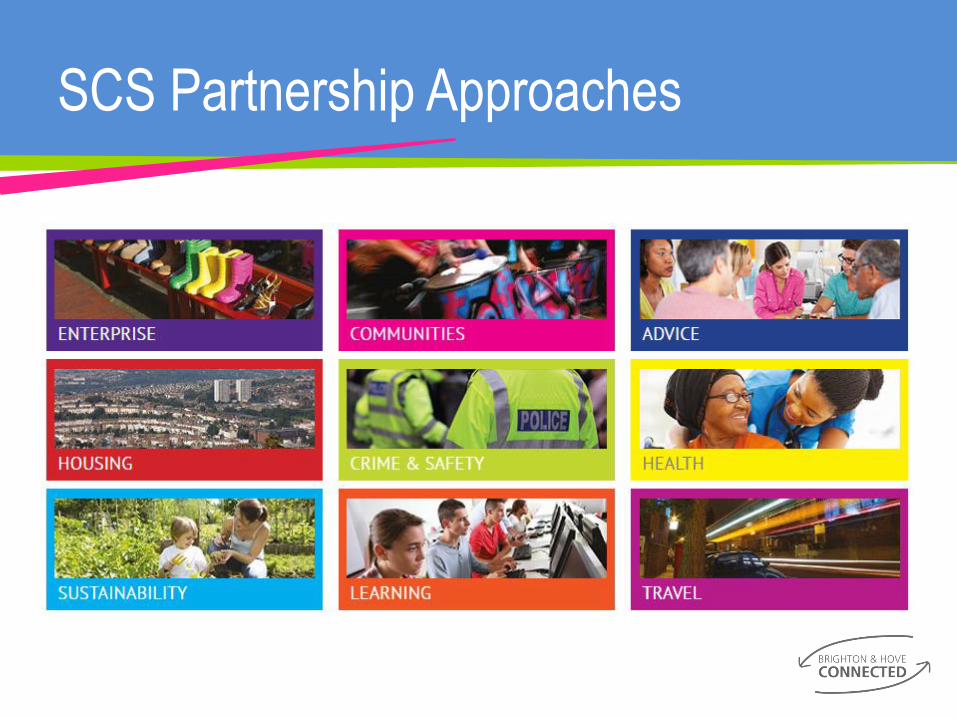
SCS Partnership Approaches
ECONOMY
• Sarah Springford
Director, Brighton & Hove Chamber of Commerce
Business Sector Rep.
• Dean Orgill
Chairman, Mayo Wynne Baxter LLP
Chair, Economic Partnership
• Gavin Stewart
Executive Director, Economic Partnership

Housing
• Julie Frith
Director, Mishon Mackay Land and New Homes
Strategic Housing Partnership Rep.
• Martin Reid
Head of Housing Strategy, Brighton & Hove City
Council
Housing in Brighton and Hove
Martin Reid Head of Housing Strategy, Development & Private Sector Housing
t: +44 (0)1273 293321
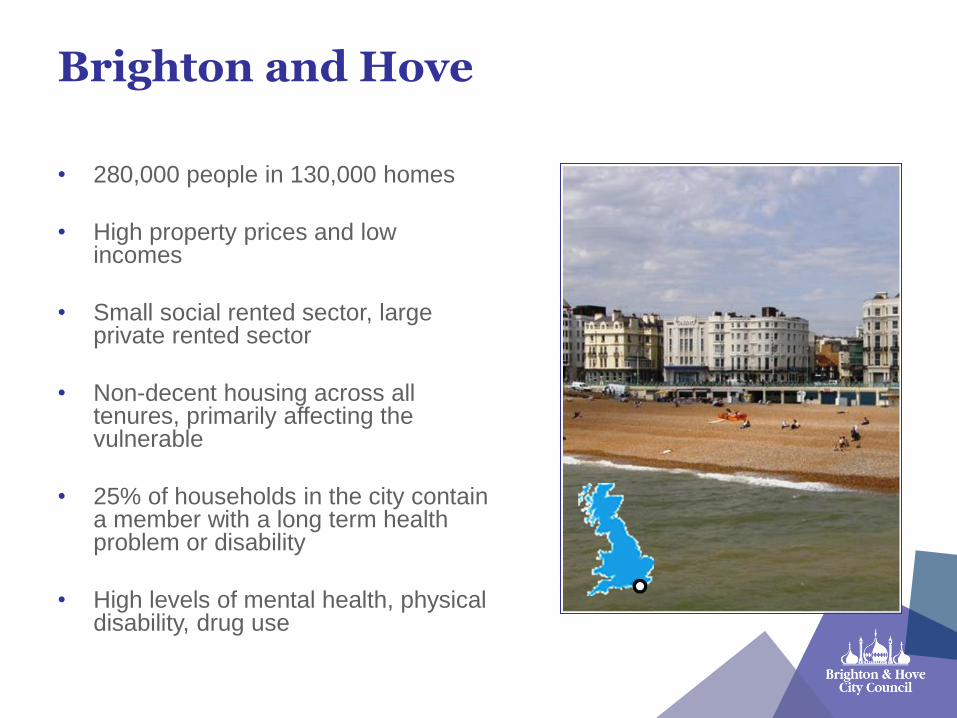
Brighton and Hove
• 280,000 people in 130,000 homes
• High property prices and low incomes
• Small social rented sector, large private rented sector
• Non-decent housing across all tenures, primarily affecting the vulnerable
• 25% of households in the city contain a member with a long term health problem or disability
• High levels of mental health, physical disability, drug use
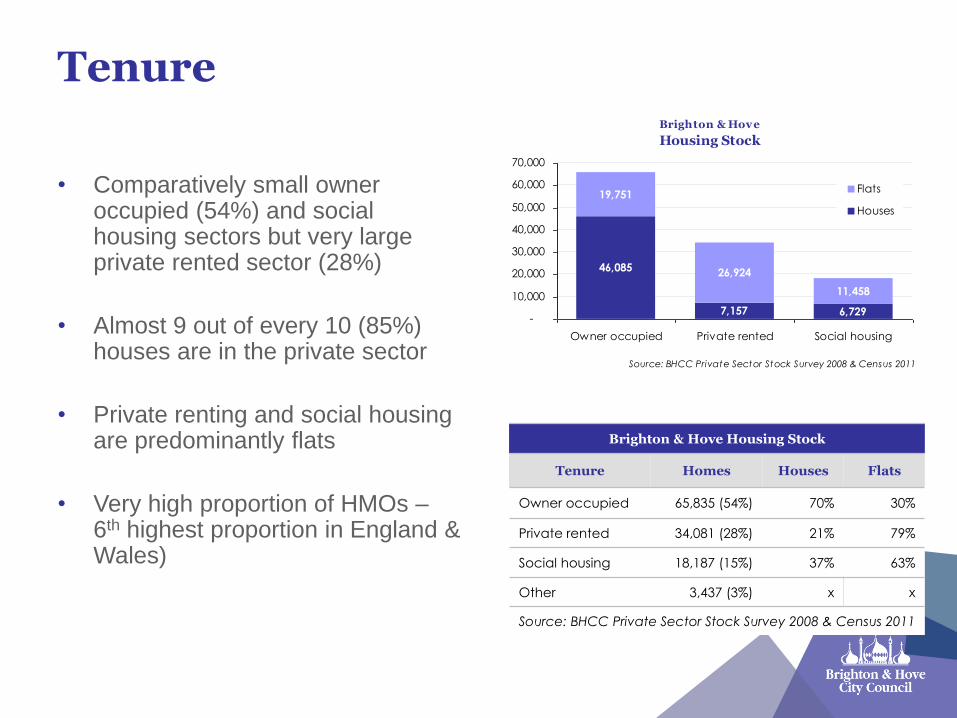
Tenure
• Comparatively small owner occupied (54%) and social housing sectors but very large private rented sector (28%)
• Almost 9 out of every 10 (85%) houses are in the private sector
• Private renting and social housing are predominantly flats
• Very high proportion of HMOs – 6th highest proportion in England & Wales)
Brighton & Hove Housing Stock
Tenure Homes Houses Flats
Owner occupied 65,835 (54%) 70% 30%
Private rented 34,081 (28%) 21% 79%
Social housing 18,187 (15%) 37% 63%
Other 3,437 (3%) x x
Source: BHCC Private Sector Stock Survey 2008 & Census 2011
Brighton & Hove
Housing Stock
46,085
7,157 6,729
19,751
26,924
11,458
-
10,000
20,000
30,000
40,000
50,000
60,000
70,000
Owner occupied Private rented Social housing
Flats
Houses
Source: BHCC Private Sector Stock Survey 2008 & Census 2011
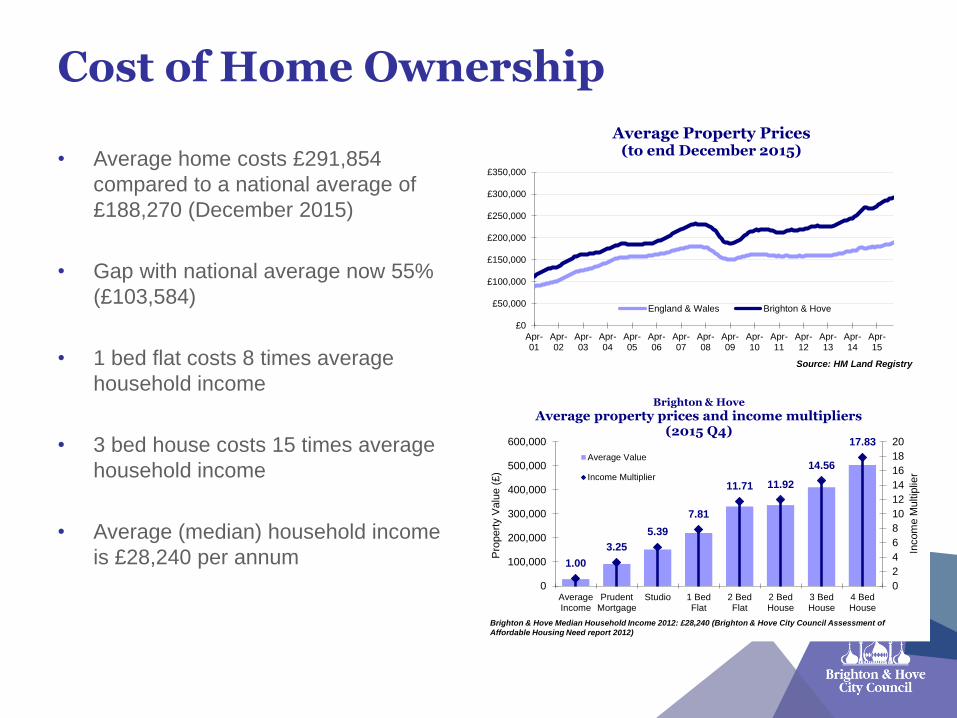
Cost of Home Ownership
• Average home costs £291,854
compared to a national average of
£188,270 (December 2015)
• Gap with national average now 55%
(£103,584)
• 1 bed flat costs 8 times average
household income
• 3 bed house costs 15 times average
household income
• Average (median) household income
is £28,240 per annum
£0
£50,000
£100,000
£150,000
£200,000
£250,000
£300,000
£350,000
Apr-01
Apr-02
Apr-03
Apr-04
Apr-05
Apr-06
Apr-07
Apr-08
Apr-09
Apr-10
Apr-11
Apr-12
Apr-13
Apr-14
Apr-15
Average Property Prices (to end December 2015)
England & Wales Brighton & Hove
Source: HM Land Registry
1.00
3.25
5.39
7.81
11.71 11.92
14.56
17.83
0
2
4
6
8
10
12
14
16
18
20
0
100,000
200,000
300,000
400,000
500,000
600,000
AverageIncome
PrudentMortgage
Studio 1 BedFlat
2 BedFlat
2 BedHouse
3 BedHouse
4 BedHouse
Incom
e M
ultip
lier
Pro
pert
y V
alu
e (
£)
Brighton & Hove
Average property prices and income multipliers (2015 Q4)
Average Value
Income Multiplier
Brighton & Hove Median Household Income 2012: £28,240 (Brighton & Hove City Council Assessment of
Affordable Housing Need report 2012)
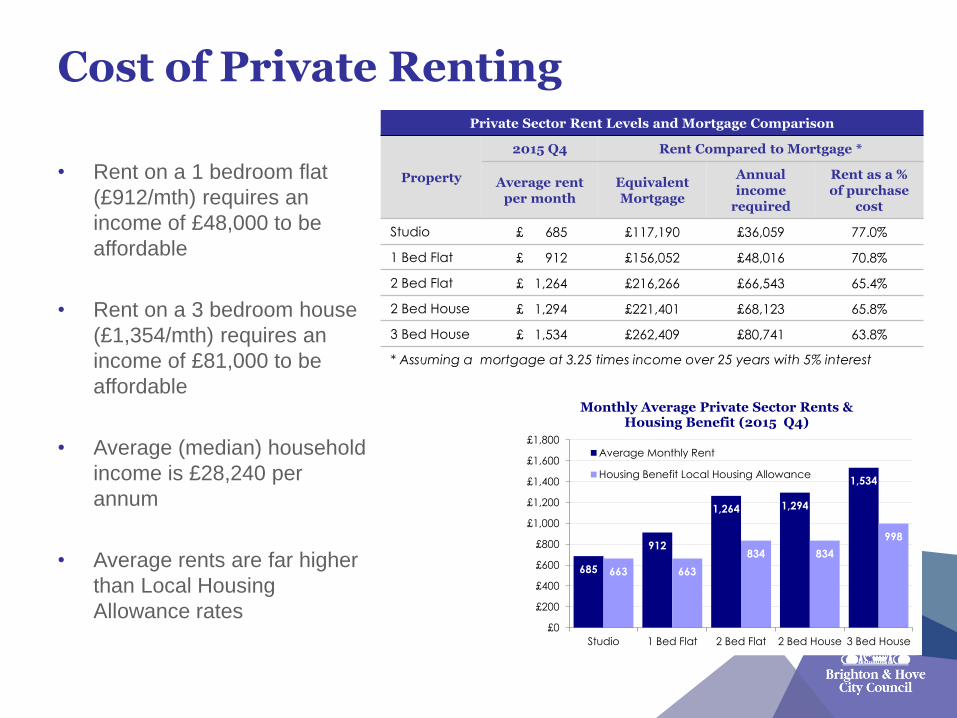
Cost of Private Renting
• Rent on a 1 bedroom flat
(£912/mth) requires an
income of £48,000 to be
affordable
• Rent on a 3 bedroom house
(£1,354/mth) requires an
income of £81,000 to be
affordable
• Average (median) household
income is £28,240 per
annum
• Average rents are far higher
than Local Housing
Allowance rates
Private Sector Rent Levels and Mortgage Comparison
Property
2015 Q4 Rent Compared to Mortgage *
Average rent per month
Equivalent Mortgage
Annual income
required
Rent as a % of purchase
cost
Studio £ 685 £117,190 £36,059 77.0%
1 Bed Flat £ 912 £156,052 £48,016 70.8%
2 Bed Flat £ 1,264 £216,266 £66,543 65.4%
2 Bed House £ 1,294 £221,401 £68,123 65.8%
3 Bed House £ 1,534 £262,409 £80,741 63.8%
* Assuming a mortgage at 3.25 times income over 25 years with 5% interest
685
912
1,264 1,294
1,534
663 663
834 834
998
£0
£200
£400
£600
£800
£1,000
£1,200
£1,400
£1,600
£1,800
Studio 1 Bed Flat 2 Bed Flat 2 Bed House 3 Bed House
Monthly Average Private Sector Rents & Housing Benefit (2015 Q4)
Average Monthly Rent
Housing Benefit Local Housing Allowance
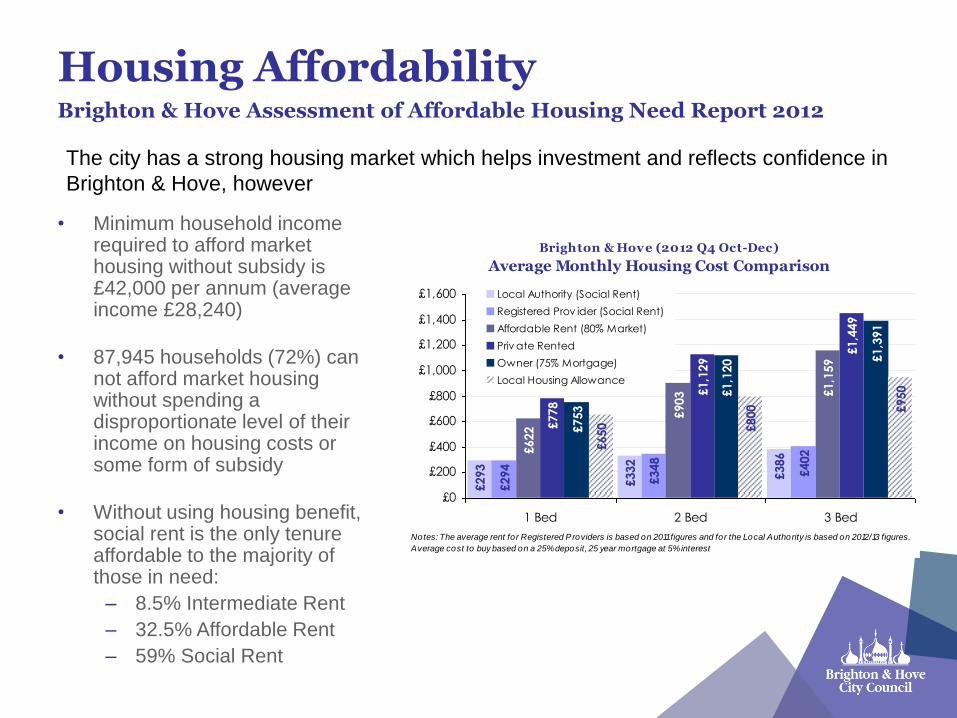
Housing Affordability
• Minimum household income required to afford market housing without subsidy is £42,000 per annum (average income £28,240)
• 87,945 households (72%) can not afford market housing without spending a disproportionate level of their income on housing costs or some form of subsidy
• Without using housing benefit, social rent is the only tenure affordable to the majority of those in need:
– 8.5% Intermediate Rent
– 32.5% Affordable Rent
– 59% Social Rent
Brighton & Hove Assessment of Affordable Housing Need Report 2012
Brighton & Hove (2012 Q4 Oct-Dec)
Average Monthly Housing Cost Comparison
£293
£332
£386
£402£
622
£903 £
1,1
59
£778
£1,1
29
£1,4
49
£753
£1,1
20 £
1,3
91
£650 £800 £950
£348
£294
£0
£200
£400
£600
£800
£1,000
£1,200
£1,400
£1,600
1 Bed 2 Bed 3 Bed
Local Authority (Social Rent)
Registered Prov ider (Social Rent)
Affordable Rent (80% Market)
Priv ate Rented
Owner (75% Mortgage)
Local Housing Allowance
Notes: The average rent for Registered Providers is based on 2011 figures and for the Local Authority is based on 2012/13 figures.
Average cost to buy based on a 25% deposit, 25 year mortgage at 5% interest
The city has a strong housing market which helps investment and reflects confidence in
Brighton & Hove, however

Homelessness
• 2,000+ households have their homelessness prevented each year through detailed casework
• Homelessness is decreasing (21% in last 2 years)
• Over 2/3 of all homeless cases involve households with either children or a pregnant family member
• Proportion of homelessness due to physical disability or mental illness is generally double the national average
754 825
978
1,108
1,348 1,284
1,107
368 426
496 506 510 420 402
0
200
400
600
800
1,000
1,200
1,400
2009/10 2010/11 2011/12 2012/13 2013/14 2014/15 2015/16
Hou
se
ho
lds
Brighton & Hove
Homeless Decisions & Acceptances
Homelessness Decisions
Homeless Acceptances
Source: P1E
487 692 594
1,436 1,543 1,010
1,812
2,059 1,858
1,545 1,441
1,528
0
500
1,000
1,500
2,000
2,500
3,000
2009/10 2010/11 2011/12 2012/13 2013/14 2014/15
Hou
se
ho
lds
Brighton & Hove City Council Prevention Casework Outcomes
Sustained Accommodation Alternative Accommodation
Rough Sleeping
• Rough sleeping has been increasing in recent years:
– Estimate 78 people sleeping rough (Nov 2015)
– Brighton & Hove has third highest number after Westminster and Bristol
– 1,129 cases involving 776 people (2014/15)
– Approximately 4 in 10 have a local B&H connection, 4 in 10 are from the rest of UK, 2 in 10 are international
– Average of more than 2 new people every day seen by services
– Almost 300 hostel beds full with around 200 on the waiting list
– Nationally, the average age of death of someone sleeping rough is 47 compared to 77 for population as a whole
• New Rough Sleeping Strategy in development
– Final strategy expected to be recommended to B&H Connected for approval on 5 July 2016
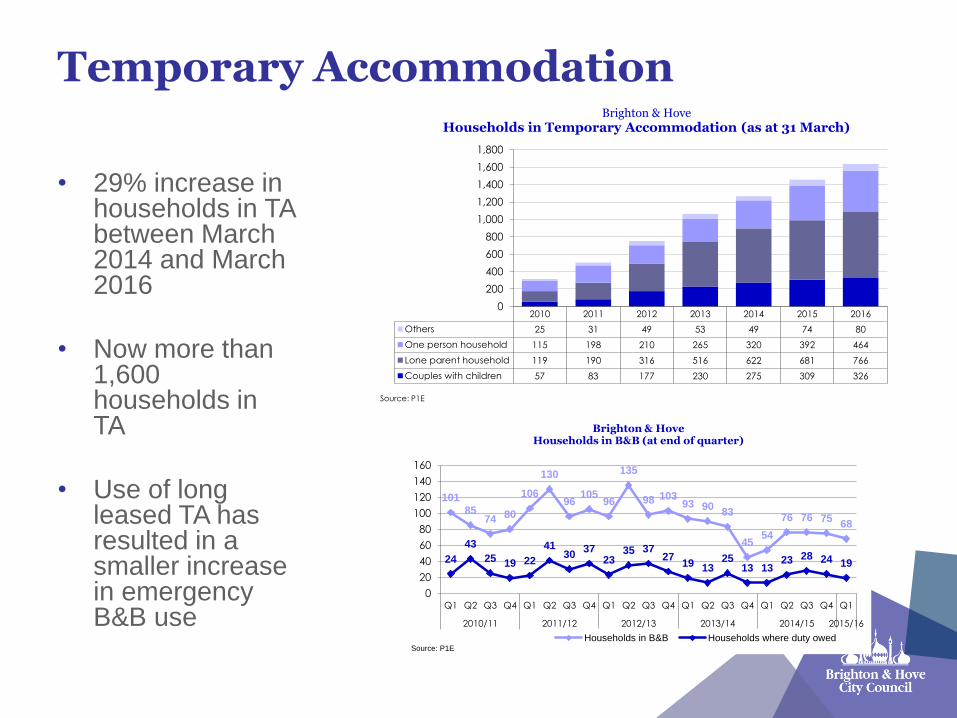
Temporary Accommodation
• 29% increase in households in TA between March 2014 and March 2016
• Now more than 1,600 households in TA
• Use of long leased TA has resulted in a smaller increase in emergency B&B use
2010 2011 2012 2013 2014 2015 2016
Others 25 31 49 53 49 74 80
One person household 115 198 210 265 320 392 464
Lone parent household 119 190 316 516 622 681 766
Couples with children 57 83 177 230 275 309 326
0
200
400
600
800
1,000
1,200
1,400
1,600
1,800
Brighton & Hove
Households in Temporary Accommodation (as at 31 March)
Source: P1E
101
85 74 80
106
130
96 105
96
135
98 103 93 90
83
45 54
76 76 75 68
24
43
25 19 22
41 30
37 23
35 37 27
19 13 25
13 13 23 28 24 19
0
20
40
60
80
100
120
140
160
Q1 Q2 Q3 Q4 Q1 Q2 Q3 Q4 Q1 Q2 Q3 Q4 Q1 Q2 Q3 Q4 Q1 Q2 Q3 Q4 Q1
2010/11 2011/12 2012/13 2013/14 2014/15 2015/16
Brighton & Hove Households in B&B (at end of quarter)
Households in B&B Households where duty owedSource: P1E
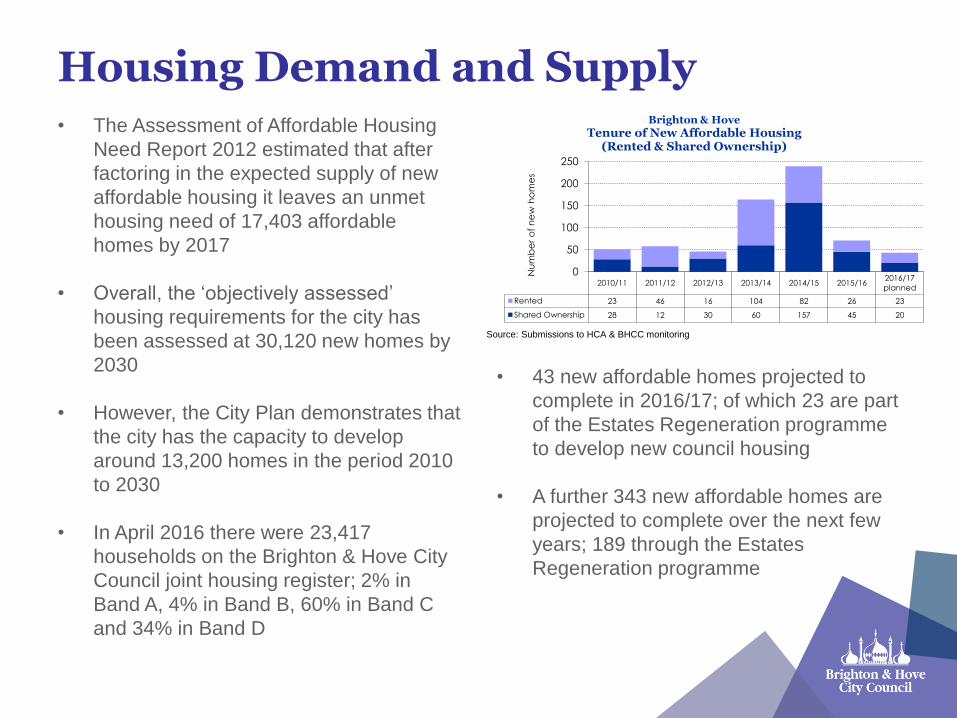
Housing Demand and Supply • The Assessment of Affordable Housing
Need Report 2012 estimated that after
factoring in the expected supply of new
affordable housing it leaves an unmet
housing need of 17,403 affordable
homes by 2017
• Overall, the ‘objectively assessed’
housing requirements for the city has
been assessed at 30,120 new homes by
2030
• However, the City Plan demonstrates that
the city has the capacity to develop
around 13,200 homes in the period 2010
to 2030
• In April 2016 there were 23,417
households on the Brighton & Hove City
Council joint housing register; 2% in
Band A, 4% in Band B, 60% in Band C
and 34% in Band D
• 43 new affordable homes projected to
complete in 2016/17; of which 23 are part
of the Estates Regeneration programme
to develop new council housing
• A further 343 new affordable homes are
projected to complete over the next few
years; 189 through the Estates
Regeneration programme
2010/11 2011/12 2012/13 2013/14 2014/15 2015/162016/17
planned
Rented 23 46 16 104 82 26 23
Shared Ownership 28 12 30 60 157 45 20
0
50
100
150
200
250
Nu
mb
er
of
ne
w h
om
es
Brighton & Hove
Tenure of New Affordable Housing (Rented & Shared Ownership)
Source: Submissions to HCA & BHCC monitoring

Non-Decent Housing
• Poor quality housing has a direct impact on resident’s quality of life and a subsequent impact on the public purse due to illness and being out of work
• Almost a third of the city’s housing stock (up to 37,000 homes) is considered to be non-decent (99.9% in the private sector)
• More than 4 in 10 of the city’s LSOAs (Lower Super Output Areas) are in the bottom 20% nationally for housing quality
• 11.9% of households (15,500) are in fuel poverty
Figure 3: 39% of Brighton & Hove Lower Super Output Areas are in the lowest 20% nationally on the Indoor Living Environment sub domain (Index of Multiple Deprivation 2015)
Ma
p ©
20
15
Go
og
le

Student Housing
• Increasing student numbers – currently 33,360
• By 2014/15 University of Brighton predict that 6,347 students will reside off campus in private rented accommodation
• Has directly led to a loss of family homes, through concentrations of HMOs – particularly around the Lewes Road corridor
• Student Housing Strategy – actions to address include HMO additional licensing, Article 4 Planning directive and increasing purpose built accommodation

Supporting Independence
• The Council funds housing support to more than 3,500 residents to maintain their independence
• Our programme (approximately £8m) is estimated to save the wider public sector an additional £33m after allowing for our costs
• Targeted services such as hostels for
rough sleepers, the domestic violence
refuge and special projects working
with a range of groups such as those
with learning disabilities or mental
health problems
• Every £1 spent saves an additional £4.10 in care, health, police and housing costs
• 25% of households in the city contain a member with a long term health problem or disability (Census 2011)
• The proportion of homelessness acceptances that are related to a physical disability are around double the national average
• Spending £2,000-£20,000 on adaptations to support an older person at home can save £6,000 per year in care costs
• During 2014/15 we completed 179 Disabled Facilities Grant assisted major adaptations to support private sector households plus 238 major and 655 minor adaptations to council properties worth £2.6m

Delivering our Housing Strategy
• Improving housing supply:
– Building new council housing with more than 250 homes in the pipeline
– Exploring the potential for a joint venture company to develop new affordable housing (looking at options such as modern off-site manufacture, living wage rents and mortgages)
– Helping owners bring more than 150 empty homes back into use each year
• Improving housing quality:
– Expanding additional licensing of houses in multiple occupation into the city centre wards
– Exploring the evidence to support or reject the need for licensing across those whole private rented sector (citywide or in certain locations)
– Continuing to invest in council homes
• Improving housing support:
– Improving the provision of adaptations and disabled facilities grants to support residents to be independent at home
– Working with partners on early interventions to sustain tenancies and tackle, prevent and reduce homelessness
– Providing a comprehensive home options service for those seeking homes as a first point of contact with the council, including sustaining tenancies and early interventions with hospitals and GPs to prevent homelessness
– Developing a new Rough Sleeping Strategy to make sure no one in Brighton & Hove has the need to sleep rough by 2020 (for B&H Connected approval on 5 July 2016)
LEARNING, SKILLS AND EMPLOYMENT
Learning, Skills & Employment
Partnership
Update for Brighton & Hove Connected

Marcelo Staricoff Headteacher of Balfour Primary and
representing the Learning, Skills and
Employment Partnership
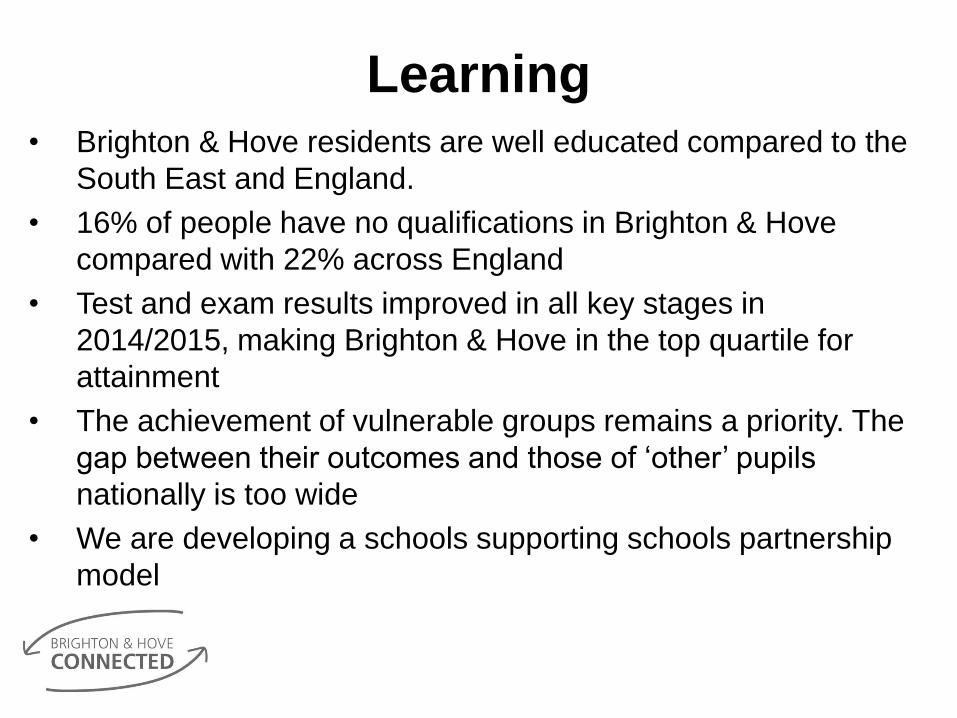
Learning • Brighton & Hove residents are well educated compared to the
South East and England.
• 16% of people have no qualifications in Brighton & Hove
compared with 22% across England
• Test and exam results improved in all key stages in
2014/2015, making Brighton & Hove in the top quartile for
attainment
• The achievement of vulnerable groups remains a priority. The
gap between their outcomes and those of ‘other’ pupils
nationally is too wide
• We are developing a schools supporting schools partnership
model
Skills and Employment
• There has been a focus this year on the City Employment and Skills Plan.
• Emerging priorities include:
- Assisting people back into the labour market
- Increase and make systematic the number of Apprenticeships
- Review and improve Careers and IAG offer
- Consider work readiness
Work and Life Readiness
• Primary Phase has a central role to play
• Developing children from an early age as • Resourceful Individuals (e.g Values)
• Lifelong Learners (e.g. JONK & GM)
• Successful Citizens (e.g. RRS & Pupil Voice)
• Promoting Links and Providing Opportunities • Local Community
• Business
• Experts
Challenges ahead
- The recent Government White Paper, ‘Educational Excellence Everywhere’
- Changes to the national testing arrangements for all key stages
- Implementing the recommendations of the Citywide Employment and Skills Plan

LEARNING, SKILLS AND EMPLOYMENT
Children’s Services Partnership Forum
Update for Brighton & Hove Connected
Pinaki Ghoshal Executive Director, Children's Services
Brighton & Hove City Council
Children’s Services Successes
over past 12 months
- Ofsted inspection. Most judgements were ‘Good’ including Leadership Management & Governance
- GCSE results – most improved local authority in country, above averages
- Reduction in open social care cases and numbers of children in care
- Continued best practice in early years including breastfeeding and take up of 2yr old places – our priority to offer the best start in life
- MJ Award finalist for our Youth Employability Service
Partnership Forums
• Advice, Information & Guidance for Young
People – followed by development of Youth &
Employability Trust, Apprenticeship Pledge, Post 16
Area Wide Review
• Emotional Wellbeing & Mental Health – followed by mental health practioners based in
schools, review of CAMHS services, new text service
for young people launched via schools
Challenges ahead
- More inspections. Two new challenging frameworks for multi-agency safeguarding and services for SEND
- Significant amount of change and restructures underway
- Continued challenge of managing budget in context of fluctuating demand
- Income streams such as Stronger Families Programme under increasing pressure to deliver more for reduced financial offer
A future with greater
partnership working
- It takes a city to raise a child – join our discussions on 21st June on creating a child centred city
- Maintain the focus on tackling the causes of poverty
- How can we do more to ensure there is greater coordination on both preventative and more intensive early help?

COMMUNITIES AND EQUALITIES
• Sally Polanski
Chief Executive, Brighton & Hove Community Works
Community Works Rep.
• Geraldine Des Moulins
Chief Officer, The Fed Centre for Independent Living
Equalities & Inclusion Partnership Rep.
• Emma McDermott
Head of Communities & Equality, Brighton & Hove City
Council
Communities: recent successes
• Community collaboration and asset building
• Targeted work: BME, LGBT, disability, faith
• Employment engagement (BME/disability)
• NCE and EQUIP
• Fairness Commission
• Power of Volunteering

Power of Volunteering Vision & Commitments
Brighton & Hove, a city which champions volunteering:
valuing the contribution that volunteers make; striving to
ensure positive volunteering experiences; and recognising
the impact of volunteering on the economic, social,
cultural, leisure and environmental life of the city.

Communities: challenges
• Neighbourhood hubs
• Service redesign involving residents and providers
• Commissioning
• Social Value Framework
• Third Sector Investment Programme
• Need and capacity
Communities: further collaboration needed
• Power of Volunteering: implementing the pledge
• Equalities: embedded approach within BHC
partnerships
• Local Giving: strategies to increase it
• Health inequalities: community resilience in the
context of changing primary care
HEALTH AND WELLBEING
• Simon Newell
Head of Partnerships & External Relations, Brighton
& Hove Connected
Independent Secretariat
Brighton and Hove CCG Achievements and Challenges
John Child
April 2016
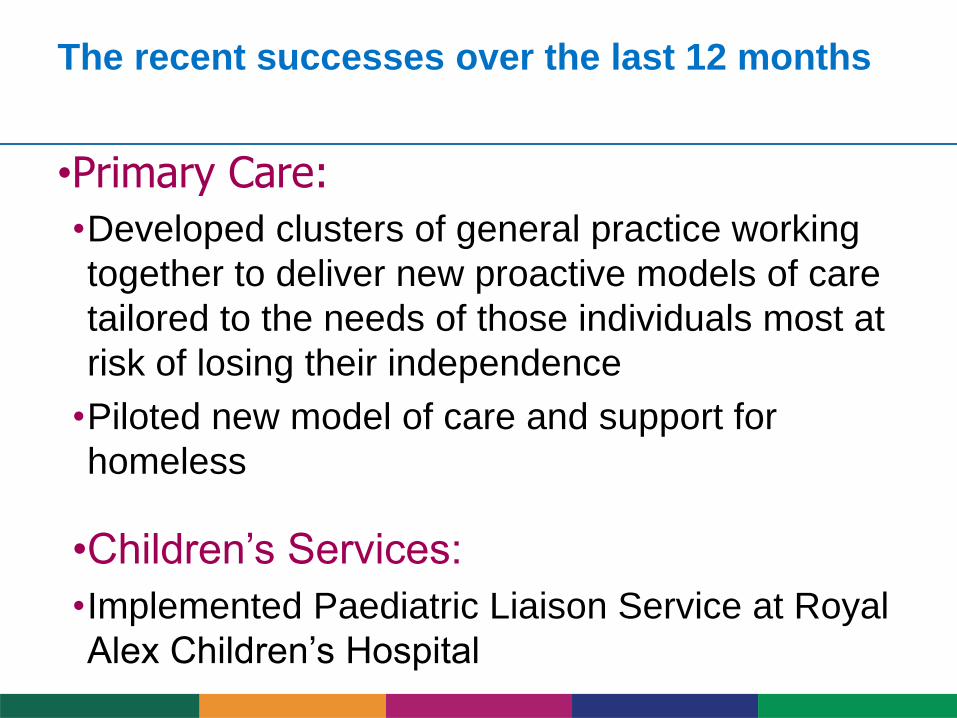
The recent successes over the last 12 months
•Primary Care:
•Developed clusters of general practice working
together to deliver new proactive models of care
tailored to the needs of those individuals most at
risk of losing their independence
•Piloted new model of care and support for
homeless
•Children’s Services:
•Implemented Paediatric Liaison Service at Royal
Alex Children’s Hospital
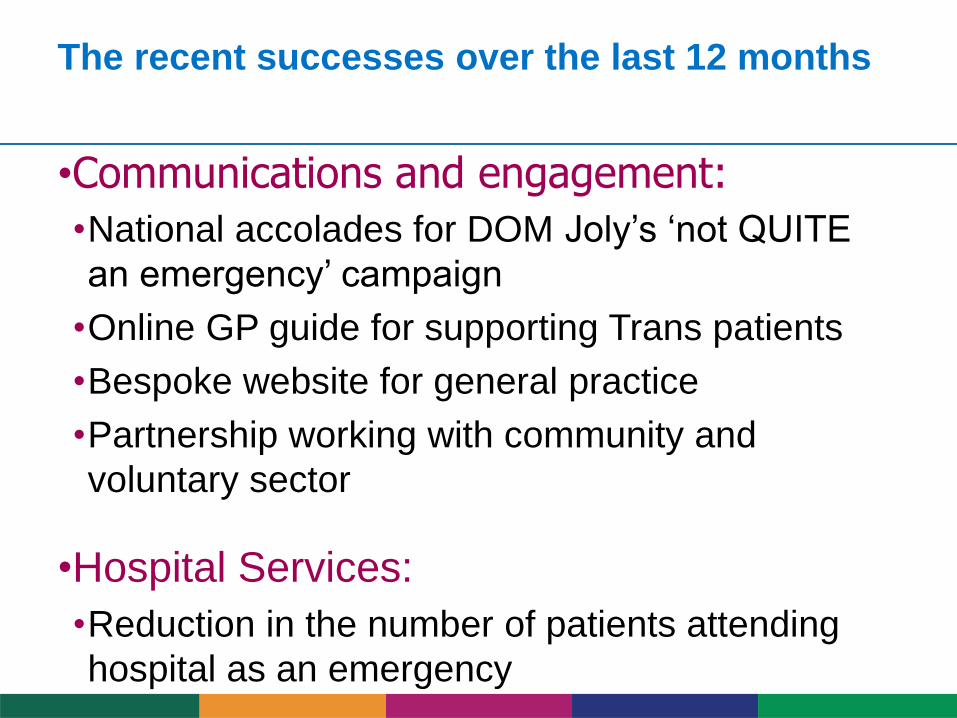
The recent successes over the last 12 months
•Communications and engagement:
•National accolades for DOM Joly’s ‘not QUITE
an emergency’ campaign
•Online GP guide for supporting Trans patients
•Bespoke website for general practice
•Partnership working with community and
voluntary sector
•Hospital Services:
•Reduction in the number of patients attending
hospital as an emergency
•
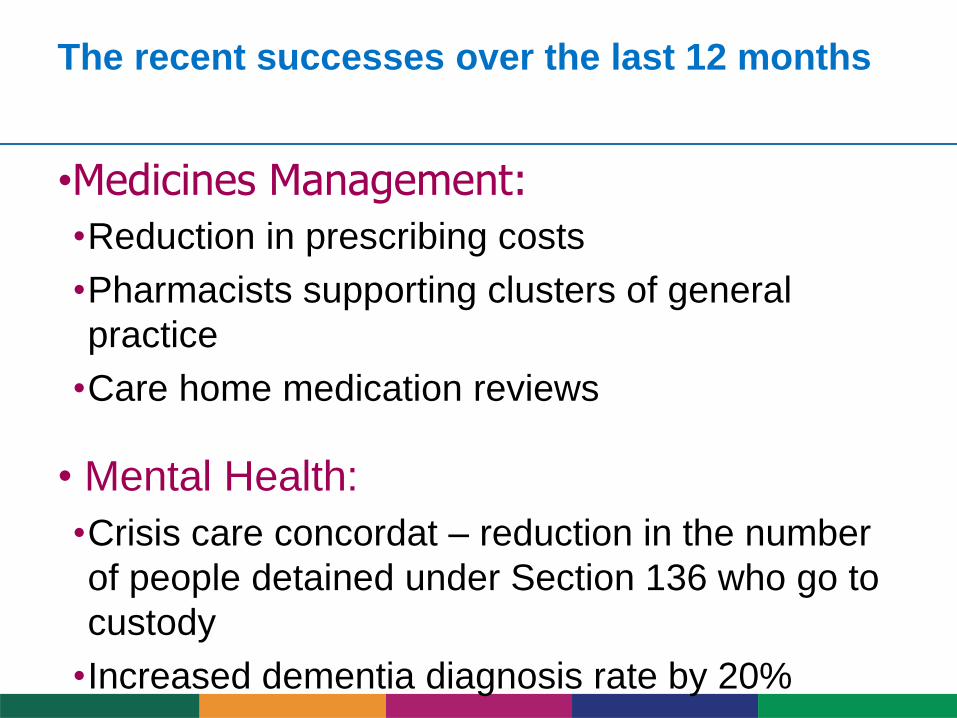
The recent successes over the last 12 months
•Medicines Management:
•Reduction in prescribing costs
•Pharmacists supporting clusters of general
practice
•Care home medication reviews
• Mental Health:
•Crisis care concordat – reduction in the number
of people detained under Section 136 who go to
custody
•Increased dementia diagnosis rate by 20%

The challenges for the next year
• Health & Well Being: life limiting illness, social
isolation, mental health & substance misuse,
homelessness
• Care & Quality Gap: NHS Constitutional targets-
A&E performance, referral to treatment, cancer
outcomes & care home admission targets, need
to sustain and develop primary care
• Finance & efficiency gap: CCG achieved a
surplus for 15/16, provider deficit for 15/16 &
financial challenges within City Council
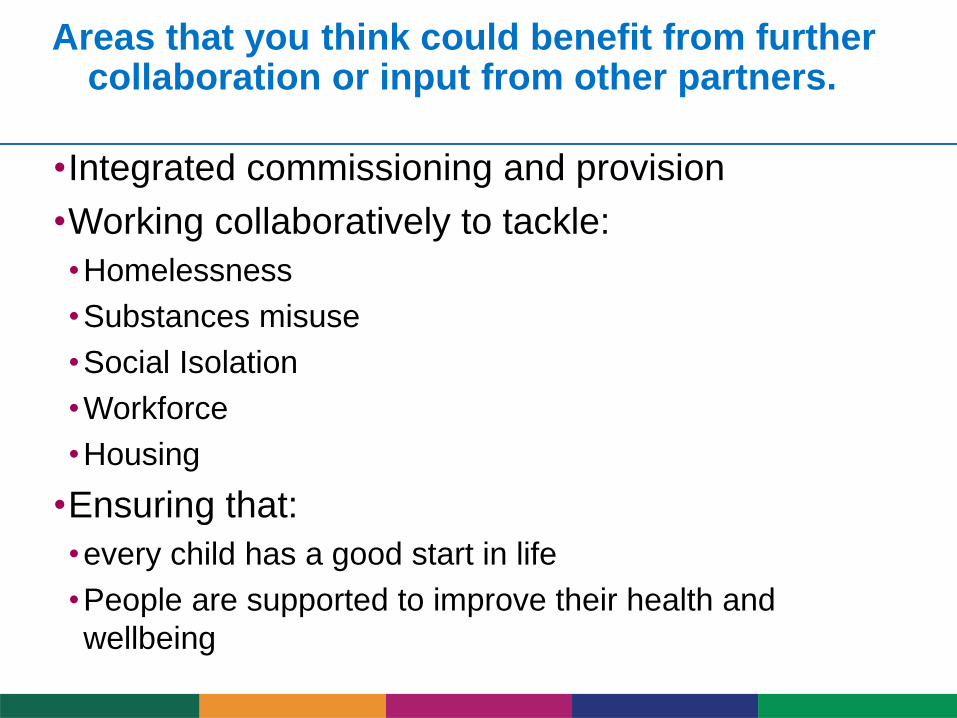
Areas that you think could benefit from further collaboration or input from other partners.
•Integrated commissioning and provision
•Working collaboratively to tackle:
•Homelessness
•Substances misuse
•Social Isolation
•Workforce
•Housing
•Ensuring that:
•every child has a good start in life
•People are supported to improve their health and
wellbeing
ADVICE AND WELFARE
• Jackie Grigg
Chief Executive, Money Advice Plus
• Emily Ballantyne
Moneyworks Co-ordinator, Brighton & Hove
Citizen's Advice Bureau

Brighton and Hove Advice Partnership –
working together to help residents with debt,
benefits, housing, social care and employment
problems
Emily Ballantyne – Citizens Advice
Jackie Grigg – Money Advice Plus
Brighton and Hove Advice Partnership

Working in partnership to make Brighton & Hove a
fairer place
What does the Advice sector do?
We provide free, confidential and impartial advice, and give evidence to
policy makers about the big issues affecting people’s lives.
Our goal is to help everyone find a way forward, whatever problems
they face. We help people from all walks of life cope with life events
such as job loss, relationship breakdown, moving home and dealing
with ill health.
People come to us with all sorts of issues, mainly about benefits, debt,
housing and employment.
Last year the CAB and Money Advice Plus alone advised over 10,000
individual residents
Quality Assured Services
Expert advice:
• Debt and money
management
• Welfare Benefits
• Housing
Impact on residents and the city
The Advice Sector
• Keeps people in employment or helps them back to work
• Prevents housing evictions and statutory homelessness
• Reduces the demand for mental health and GP services
• Improves residents’ wellbeing and family relationships
• Benefits the local economy by increasing people’s income
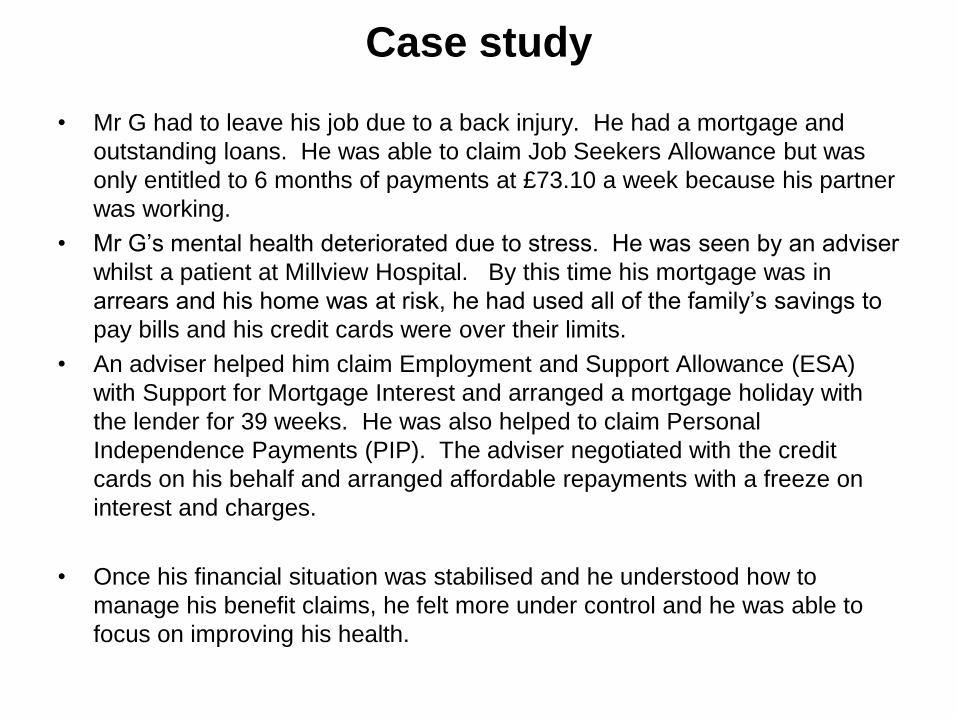
• Mr G had to leave his job due to a back injury. He had a mortgage and
outstanding loans. He was able to claim Job Seekers Allowance but was
only entitled to 6 months of payments at £73.10 a week because his partner
was working.
• Mr G’s mental health deteriorated due to stress. He was seen by an adviser
whilst a patient at Millview Hospital. By this time his mortgage was in
arrears and his home was at risk, he had used all of the family’s savings to
pay bills and his credit cards were over their limits.
• An adviser helped him claim Employment and Support Allowance (ESA)
with Support for Mortgage Interest and arranged a mortgage holiday with
the lender for 39 weeks. He was also helped to claim Personal
Independence Payments (PIP). The adviser negotiated with the credit
cards on his behalf and arranged affordable repayments with a freeze on
interest and charges.
• Once his financial situation was stabilised and he understood how to
manage his benefit claims, he felt more under control and he was able to
focus on improving his health.
Case study
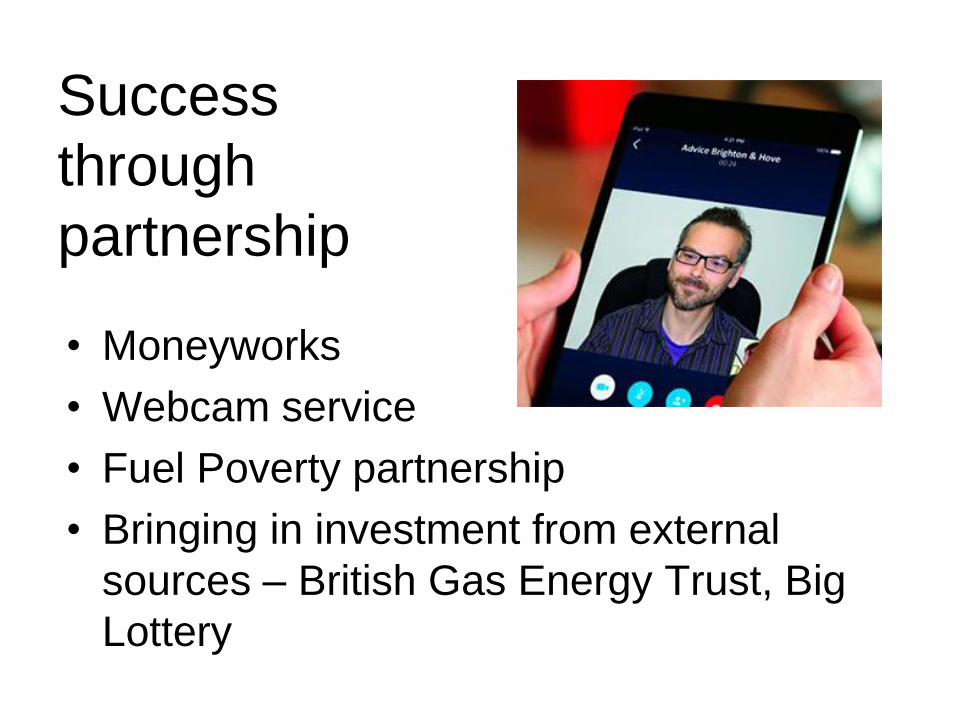
Success
through
partnership
• Moneyworks
• Webcam service
• Fuel Poverty partnership
• Bringing in investment from external
sources – British Gas Energy Trust, Big
Lottery
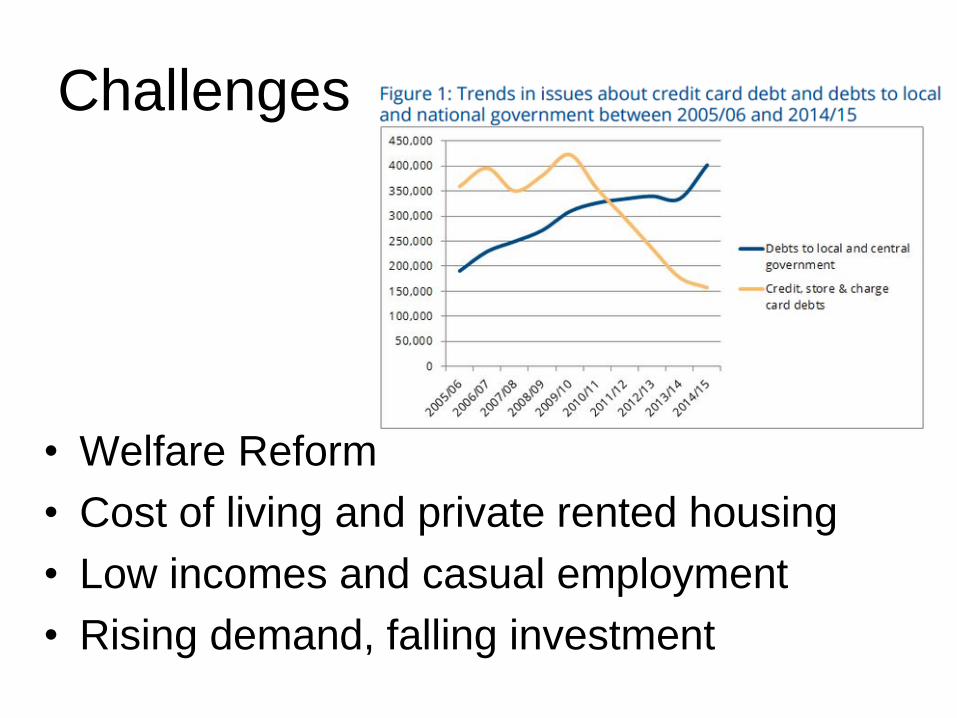
Challenges
• Welfare Reform
• Cost of living and private rented housing
• Low incomes and casual employment
• Rising demand, falling investment
ENVIRONMENT
• James Farrell
Environment Planning and Engagement Manager,
Environment Agency
• Vic Borrill
Director, Food Partnership
Biosphere Delivery Board Rep. and Vice-Chair
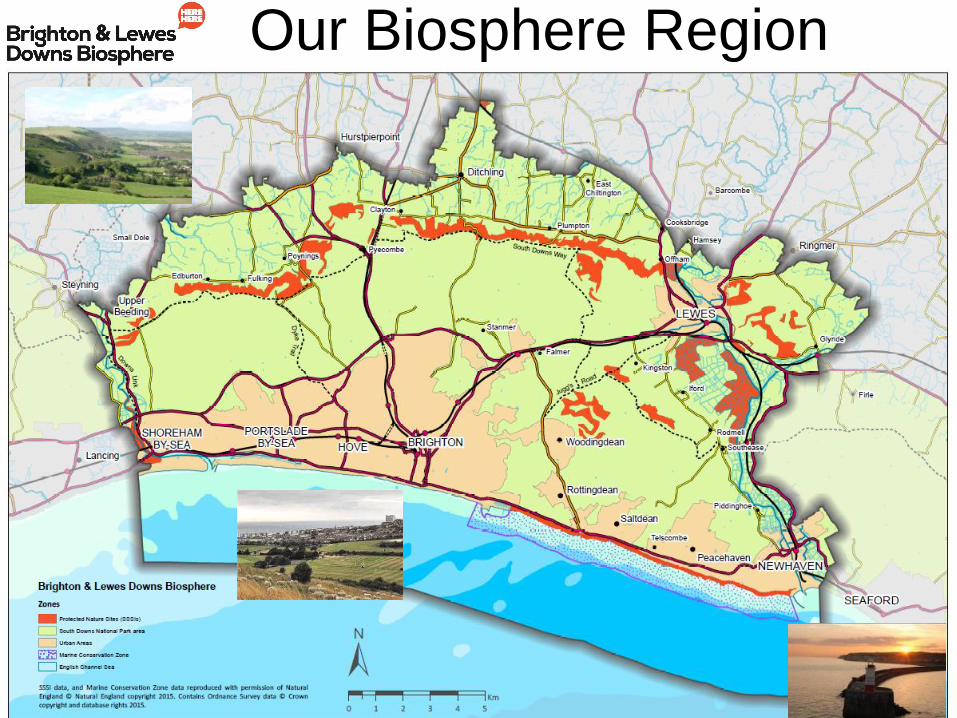
Our Biosphere Region

Our Biosphere Region
“Together we will create a
world-class environment, that
is economically successful and
enjoyed by all – forever”
Thematic partnership for Brighton & Hove Connected
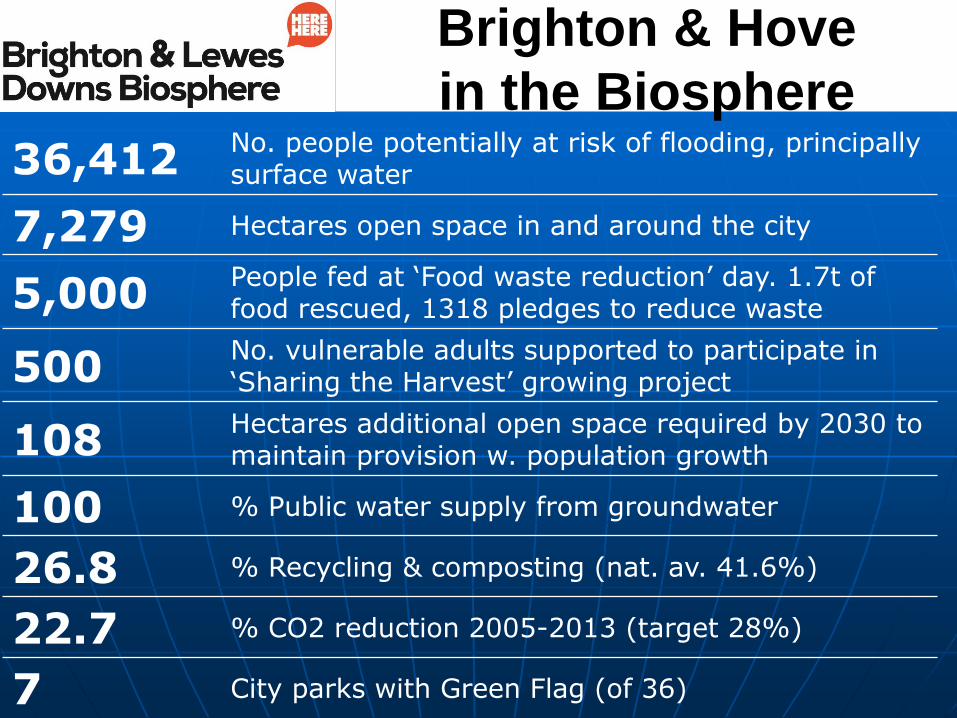
36,412 No. people potentially at risk of flooding, principally surface water
7,279 Hectares open space in and around the city
5,000 People fed at ‘Food waste reduction’ day. 1.7t of food rescued, 1318 pledges to reduce waste
500 No. vulnerable adults supported to participate in ‘Sharing the Harvest’ growing project
108 Hectares additional open space required by 2030 to maintain provision w. population growth
100 % Public water supply from groundwater
26.8 % Recycling & composting (nat. av. 41.6%)
22.7 % CO2 reduction 2005-2013 (target 28%)
7 City parks with Green Flag (of 36)
Brighton & Hove
in the Biosphere
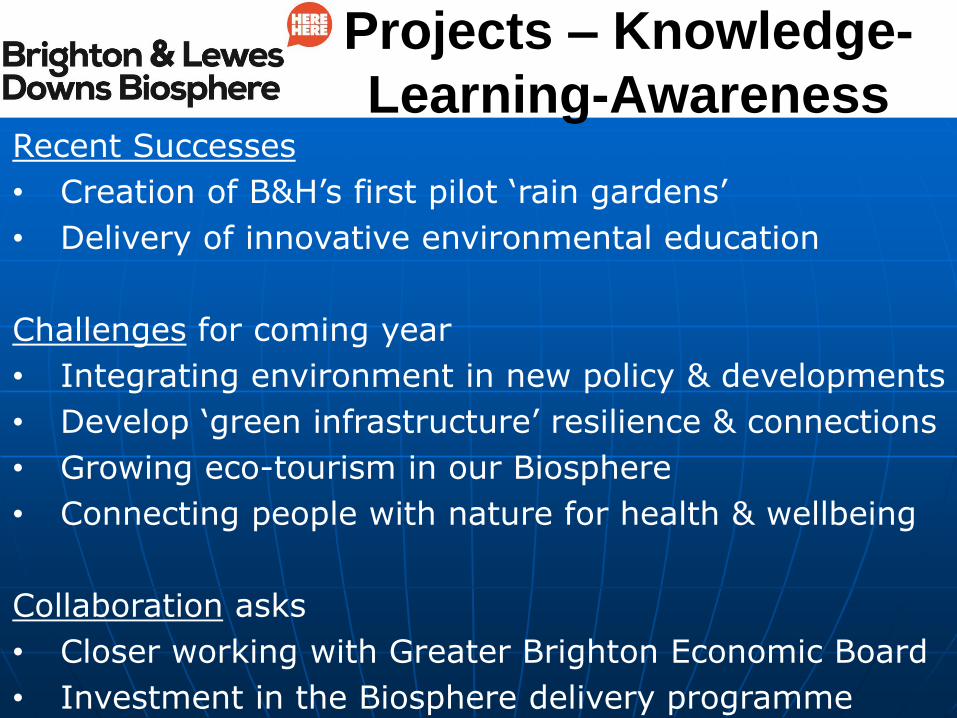
Projects – Knowledge-
Learning-Awareness Recent Successes
• Creation of B&H’s first pilot ‘rain gardens’
• Delivery of innovative environmental education
Challenges for coming year
• Integrating environment in new policy & developments
• Develop ‘green infrastructure’ resilience & connections
• Growing eco-tourism in our Biosphere
• Connecting people with nature for health & wellbeing
Collaboration asks
• Closer working with Greater Brighton Economic Board
• Investment in the Biosphere delivery programme
TRAVEL
• Martin Harris
Managing Director, Brighton & Hove Bus Company
Transport Partnership Rep.
• Simon Newell
Head of Partnerships & External Relations, Brighton
& Hove Connected
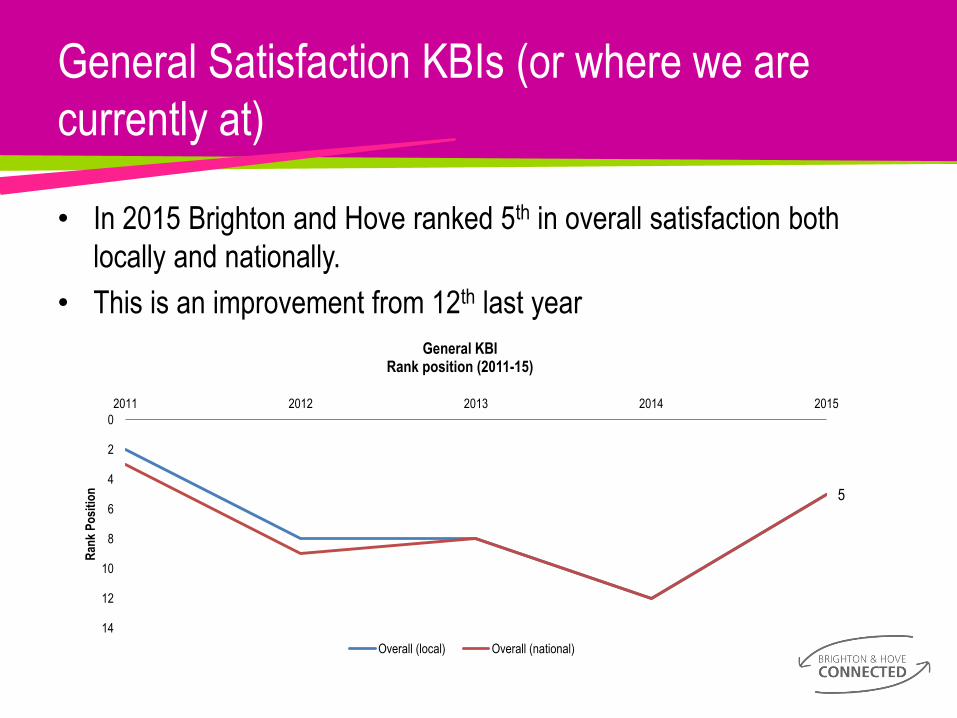
General Satisfaction KBIs (or where we are
currently at)
• In 2015 Brighton and Hove ranked 5th in overall satisfaction both
locally and nationally.
• This is an improvement from 12th last year
5
0
2
4
6
8
10
12
14
2011 2012 2013 2014 2015
Ran
k P
osi
tio
n
General KBI Rank position (2011-15)
Overall (local) Overall (national)

• Our overall satisfaction scores were also improved from last
year
59.2
58.9
59.2 59
57.1
56.8 56.6
56.4
57.6 57.4
55
55.5
56
56.5
57
57.5
58
58.5
59
59.5
Overall (local) Overall (national)
Sat
isfa
ctio
n S
core
KBI Performance Indicators
KBI Performance Overall
2011
2012
2013
2014
2015
57.6 57.4 55.2 55.3
0
10
20
30
40
50
60
Overall (local) Overall (national)
Sat
isfa
ctio
n S
core
KBI Performance Indicators
Satisfaction Scores
B&H satisfaction
Peer average
• Brighton and Hove satisfaction scores were also higher than
the peer average.

The Tackling Congestion KBI Satisfaction scores are as below.
43.77
48.23
58.46
45.22 45.25
56.37
43.3 46
53.7
40.6 47.5
54.2
40.9 47.4
55.9
0
10
20
30
40
50
60
70
Traffic levels & congestion Management of roadworks Traffic management
Sat
isfa
ctio
n S
core
KBI Performance Indicators
KBI Performance - Tackling Congestion
2011
2012
2013
2014
2015
Only one of the indicators has slipped slightly in satisfaction from
last year, however we must note that two of the indicators are still
below 50% satisfaction.

Road Safety KBIs
There are 3 KBIs for road safety.
Our national rankings are shown below.
10
24 25
0
5
10
15
20
25
30
35
40
45
50
2011 2012 2013 2014 2015
Ran
k P
osi
tio
n
Road Safety KBI Rank position (2011-15)
Road safety locally Road safety environment Road safety education
We have climbed significantly on all three since last year.

Compared to the peer group average we perform better across all
KBIs.
68.5
74.1
65.7
70.6
58.6 60 60.4
48.9
66.8
57.4
0
10
20
30
40
50
60
70
80
Local bus services Local bus services(BVPI 103)
Public TransportInfo (BVPI 103)
Taxi/mini cabservices
CommunityTransport
Sat
isfa
ctio
n S
core
KBI Performance Indicators
Public Transport KBI Satisfaction Scores
B&H Satsifaction
Peer Average
In particular we perform better on bus services and public transport
information.
Recent Successes
• The Transport Partnership itself
• Modal shift within the City
• Road Safety is improving
• Air quality is improving
• Accessibility
• Multi operator Smart Ticketing
• New bus links to the seafront
Current Challenges
• Coordination of Travel and traffic planning with
major capital investment programme
• Success of City as a whole leads to extra demand
on limited resources
• Congestion impacting journey times
• Brighton Station and Clocktower
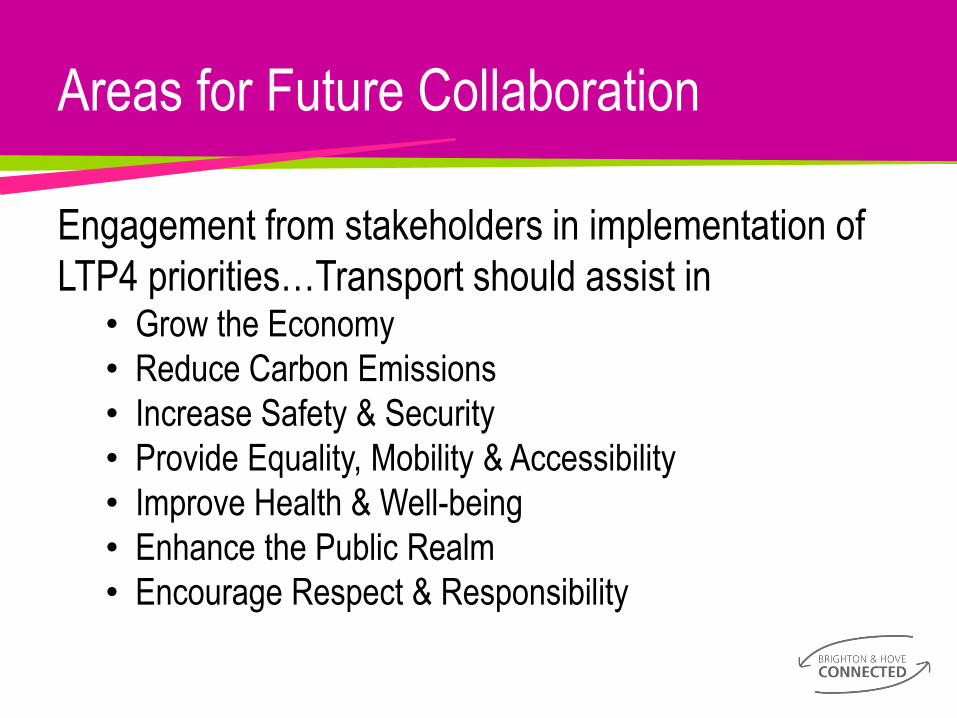
Areas for Future Collaboration
Engagement from stakeholders in implementation of
LTP4 priorities…Transport should assist in • Grow the Economy
• Reduce Carbon Emissions
• Increase Safety & Security
• Provide Equality, Mobility & Accessibility
• Improve Health & Well-being
• Enhance the Public Realm
• Encourage Respect & Responsibility

More Areas for Future Collaboration
• Coach Strategy
• Freight/Delivery Strategy
• Interchange Strategy
• Information Strategy
• Corridor/Route Hierarchy

COMMUNITY SAFETY
• James Collis
Superintendent, Sussex Police
• Jayne Dando
Superintendent, Sussex Police
• Peter Castleton
Head of Community Safety, Brighton & Hove City
Council
Brighton and Hove Connected April 2016
73 Sussex Police
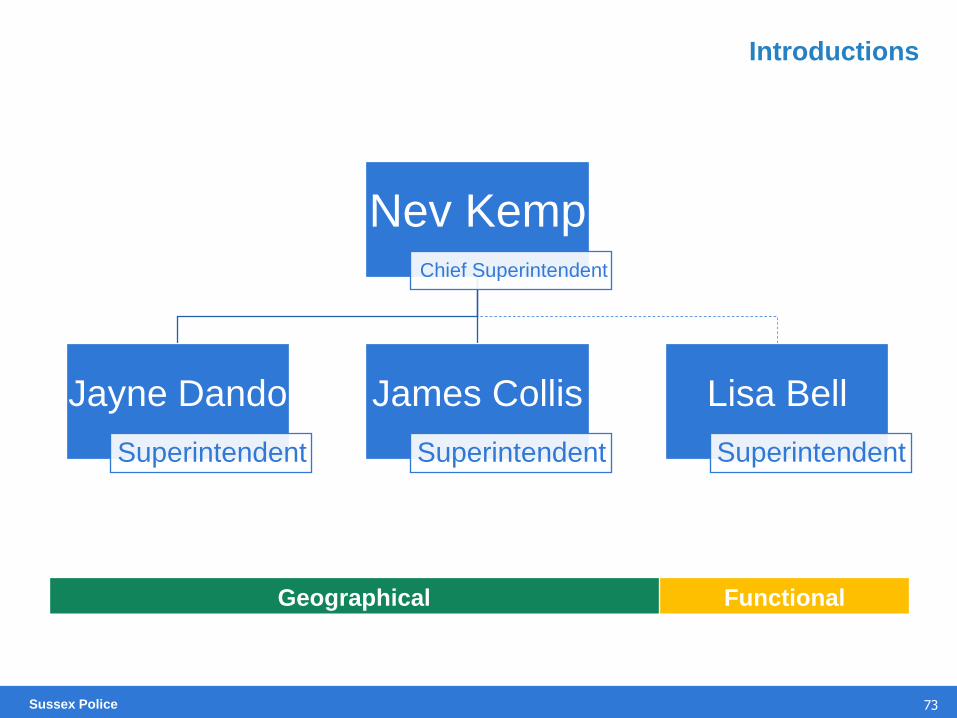
Introductions
Nev Kemp Chief Superintendent
Jayne Dando
Superintendent
James Collis
Superintendent
Lisa Bell
Superintendent
Geographical Functional
74 Sussex Police
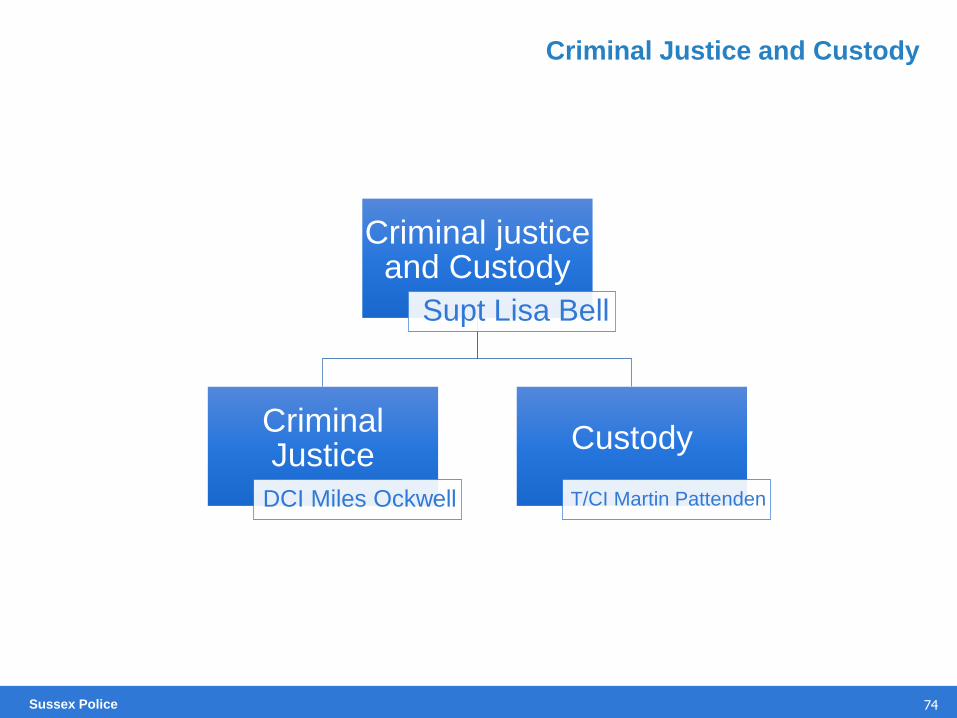
Criminal Justice and Custody
Criminal justice and Custody
Supt Lisa Bell
Criminal Justice
DCI Miles Ockwell
Custody
T/CI Martin Pattenden

75 Sussex Police
Crime and Operations
Crime and Operations
Supt Jayne Dando
Operations
CI Chris Veale
Response
CI Katy Woolford
Investigations
DCI Steve Boniface
Public Protection
DCI Richard Bates
Licensing
Public Order
Events
Protests
Football
SAGs Chrysler
LST
Low level investigations
Mispers
1st Response Mental Health
RIT
CID
OCG
DA / DV
Drug Deaths
Coroners
SIU
76 Sussex Police
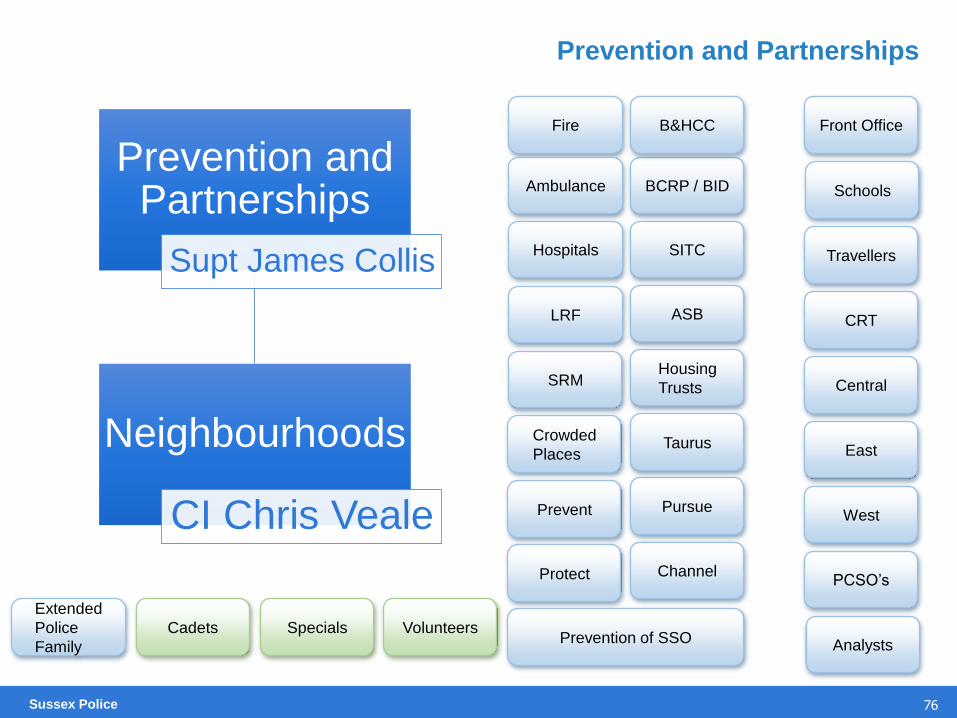
Prevention and Partnerships
Prevention and Partnerships
Supt James Collis
Neighbourhoods
CI Chris Veale
Fire
BCRP / BID Ambulance
Hospitals
B&HCC
Housing
Trusts
LRF
Extended
Police
Family
Volunteers Specials Cadets
SRM
Prevent Pursue
Protect Channel
Taurus Crowded
Places
SITC
Front Office
ASB
Schools
CRT
Analysts
West
East
Central
Travellers
Prevention of SSO
PCSO’s
77 Sussex Police
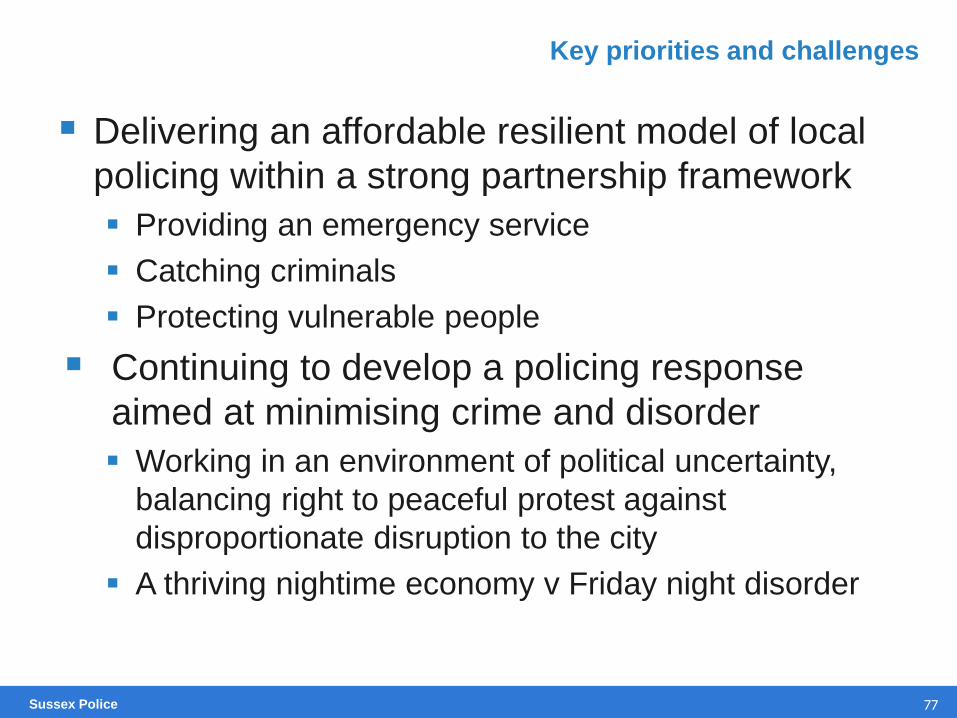
Key priorities and challenges
Delivering an affordable resilient model of local
policing within a strong partnership framework
Providing an emergency service
Catching criminals
Protecting vulnerable people
Continuing to develop a policing response
aimed at minimising crime and disorder
Working in an environment of political uncertainty,
balancing right to peaceful protest against
disproportionate disruption to the city
A thriving nightime economy v Friday night disorder

78 Sussex Police
Key priorities and challenges
Development of sustainable multiagency
approaches to complex problems
Rough Sleeping and Street Community
ASB
Overt drug use in public places
Management of expectations and multiagency
approaches to:
Reducing of the statutory footprint in the communities
Promoting self-sufficiency through improving
communications throughout the whole system
Setting the tone for the city

79 Sussex Police
Questions
Any Questions ?