brio 6 manual - purdue university · demo 1: employee education level and years of service.....24...
TRANSCRIPT

BrioQuery 6
Training Guide
Purdue University
IT Computing Services Staff Computer Training
www.purdue.edu/itap/itcs/sct Revised: June 7, 2001

Copyright © 2001 by Purdue University. All rights reserved. No part of this book may be copied or reproduced in any form by any means without written permission of IT Computing Services, Purdue University.

Table of Contents ABOUT THIS TRAINING............................................................................................................................................1
TRAINING OBJECTIVES ...........................................................................................................................................1
STANDARD CONVENTIONS FOR DOCUMENTATION....................................................................................2
KEYBOARD CONVENTIONS....................................................................................................................................2
MOUSE CONVENTIONS ............................................................................................................................................2
RELATIONAL DATABASE CONCEPTS ................................................................................................................3
Database...............................................................................................................................................................3 Relational Database ..........................................................................................................................................3 DataModel ...........................................................................................................................................................3 Table .....................................................................................................................................................................3 Column .................................................................................................................................................................3 Row........................................................................................................................................................................3 Fact Table............................................................................................................................................................4 Dimension Table.................................................................................................................................................4 Join........................................................................................................................................................................4 Index .....................................................................................................................................................................4 Query.....................................................................................................................................................................4
WHAT IS BRIOQUERY?.............................................................................................................................................5
BENEFITS OF BRIOQUERY.......................................................................................................................................5
WHAT DOES BRIOQUERY DO? ..............................................................................................................................5
BRIOQUERY SECTIONS (SECTION PANE)..........................................................................................................5
BRIOQUERY WINDOW FEATURES AND TOOLS..............................................................................................6
MENU BAR..................................................................................................................................................................6 REQUEST LINE............................................................................................................................................................6 LIMIT LINE..................................................................................................................................................................6 SORT LINE...................................................................................................................................................................7 TOOLBARS...................................................................................................................................................................7 SECTION PANE ...........................................................................................................................................................9 CATALOG PANE .........................................................................................................................................................9 CONTENTS PANE .......................................................................................................................................................9 STATUS BAR.............................................................................................................................................................10 WHAT VERSION OF BRIOQUERY DO YOU HAVE? ..............................................................................................10
OPEN CATALOG EXTENSIONS ............................................................................................................................13
CREATING YOUR OWN OCE...................................................................................................................................13
CHANGING YOUR DATABASE PASSWORD ....................................................................................................16
USING SHARED DATAMODELS............................................................................................................................18
LOADING A DATAMODEL......................................................................................................................................19

TABLE VIEWS...........................................................................................................................................................22 Structure View...................................................................................................................................................22 Detail View ........................................................................................................................................................22
CREATING QUERIES AND FORMATTING RESULTS......................................................................................24
CREATE A SIMPLE QUERY.....................................................................................................................................24
DEMO 1: EMPLOYEE EDUCATION LEVEL AND YEARS OF SERVICE ................................................................24 Create the Query Request ...............................................................................................................................25 Format the Results ...........................................................................................................................................26 Additional Formatting Tips...........................................................................................................................26 Export the Data ................................................................................................................................................28 Retain Results ...................................................................................................................................................30 Save a Query ......................................................................................................................................................31 Open a Query .....................................................................................................................................................31
DEMO 2: EMPLOYEE EDUCATION LEVEL...........................................................................................................33 Limit Results......................................................................................................................................................36
CLASS EXERCISE .......................................................................................................................................................39
REFINE A QUERY.......................................................................................................................................................41
DEMO 1: CURRENT DEPARTMENT FTE..............................................................................................................41 Add a Data Function.......................................................................................................................................42 Print Your Results.............................................................................................................................................43
DEMO 2: CURRENT FACULTY AND ELIGIBLE FACULTY ..................................................................................46 DEMO 3: ADMINISTRATIVE EMPLOYEE ANNUAL RATE AND HOURLY RATE.............................................48
Create a Computed Column...........................................................................................................................49 CLASS EXERCISE .......................................................................................................................................................52
CREATING PIVOT REPORTS.................................................................................................................................54
DEMO 1: CURRENT CLERICAL, SERVICE, FACULTY, AND A/P STAFF FROM WEST LAFAYETTE CAMPUS....................................................................................................................................................................................54
Build a Pivot Report ........................................................................................................................................55 Develop a Pivot Report ...................................................................................................................................56 Format a Pivot Report ....................................................................................................................................56 Generate Totals.................................................................................................................................................57 Sort a Pivot Report...........................................................................................................................................58 Duplicate a Pivot Report ................................................................................................................................59 Rename a Pivot Report ...................................................................................................................................59 Change the Background Color of a Pivot Report .....................................................................................60 Chart a Pivot Report........................................................................................................................................61 Set Refresh .........................................................................................................................................................62
CLASS EXERCISE .......................................................................................................................................................63
CREATING REPORTS...............................................................................................................................................66
DEMO 1: TOTAL FTE PER DEPARTMENT IN WEST LAFAYETTE CAMPUS..................................................66 Create a Report.................................................................................................................................................67 Format a Report ...............................................................................................................................................68 Add Report Headers and Footers .................................................................................................................69 Add a Grand Total to your Report................................................................................................................70 Add Page Headers and Footers ....................................................................................................................70 Insert and Remove a Page Break..................................................................................................................71 Change the Column Titles ..............................................................................................................................72 Sort a Report .....................................................................................................................................................73

Add a Chart to a Report..................................................................................................................................74 CLASS EXERCISE .......................................................................................................................................................75
BRIOQUERY TIPS......................................................................................................................................................78
RESTRICTING THE NUMBER OF ROWS RETURNED............................................................................................78 AUTO LOGON ...........................................................................................................................................................79 LIMIT TABLE ............................................................................................................................................................81 STANDARD DATA FUNCTIONS..............................................................................................................................83 DATA TYPES.............................................................................................................................................................85 WORLD WIDE WEB URLS......................................................................................................................................86


BrioQuery Training Page 1
About This Training This BrioQuery training assists the learner in the use of the BrioQuery software. The training is intended for a new user with little or no prior experience in using this type of software. Prior knowledge of the use of the Microsoft Windows 95/NT operating system is required.
Training Objectives This training will cover an introduction to relational databases and the Query, Results, Pivot, Charts and Report sections of the BrioQuery Tool.
In this training you will learn:
• Relational Database Concepts
• What BrioQuery Can Do For You
• Open Catalog Extensions
• How to Use Shared DataModels
• How to Create Queries
• How to Format Query Results
• How to Create Pivot Reports
• How to Create Reports
• How to Create Charts
• BrioQuery Tips

Page 2 BrioQuery Training
Standard Conventions for Documentation • Actions are bolded and CAPITALIZED
• Special notes are italicized
• Button and menu names are set to 14 point font size and underlined.
• File names, paths or directories are printed in Courier New
Keyboard Conventions • Names of keys that you press during hands-on exercises are in small capital letters, for example,
TAB and SHIFT.
• A plus sign (+) between two key names means those keys must be presses at the same time. For example, “Press ALT+TAB” means to hold down ALT while pressing TAB.
• A comma (,) between two or more key names means that you must press each of the keys consecutively, not together. For example, “Press ALT, T, X” means to press and release each key in sequence. “Press ALT+W, L” means to first press ALT and W together, release them, and then and press L.
Mouse Conventions • Click means to point to an object and then press and release the mouse button. The word
“click” is used for selecting command buttons, option buttons, and check boxes.
• Drag means hold down the mouse button while moving the mouse.
• Double-click means to rapidly press and release the mouse button twice.
• Click the right mouse button means to point to an object and then press and release the right mouse button. Clicking the right mouse button opens a shortcut menu that provides easy access to commands associated with the current action.

BrioQuery Training Page 3
Relational Database Concepts
This part of the training introduces and explains many of the terms used to describe databases, and the concepts those terms describe.
Database A database is a collection of information organized in a way that allows the user to select desired pieces of data quickly. Databases are typically organized by fields, records, and files.
Relational Database The term relational database means that the information in the database is divided into different tables that are related. The tables are joined by relating like fields.
DataModel Every DataModel is a set of tables with related topics that are linked or joined together in a useful way. They contain fact tables and dimension tables.
Table A table contains data or information about a topic. Data is separated into different tables by logically grouping it by type of data. This makes it easier to find data since it is categorized into common groups.
Column A column is data of a specific type. Another name for a column is “field”.
Row A row is data for one item or data about an instance. Another name for row is “record”.

Page 4 BrioQuery Training
Fact Table A “fact” table contains information about events that occur repeatedly. For example, Account Balance is a fact table; an account has a balance this month, it had one last month, and it will have one next month. The data in a fact table could change weekly, monthly or annually, depending on the type of table.
Dimension Table A “dimension” table contains information about static items. This re-usable information doesn’t change much from time to time. For example, the name and number of a department doesn’t change very often. A dimension table adds dimension to a fact table.
Join This term means “related”. The database tables “join” or “link” data fields. The visual joins you see in the BrioQuery datamodel reflect the joins in the Oracle database.
Index A database index is an organized way for the database to store data. Indexed fields in tables allow quick retrieval of data.
Query A “query” is a question to the database. When creating a query, certain fields from a table are identified by the user to be returned. The entire table may not need to be viewed. A few fields from a table would be adequate. Added limits to the query will filter the data. For example, you might query the account balance table and limit the query to bring back only those account balances greater than 200 dollars. BrioQuery allows you to create and save multiple queries in one *.bqy file.

BrioQuery Training Page 5
What is BrioQuery? BrioQuery is a query and reporting tool for accessing databases from the Windows desktop. It allows access of data that is stored on database servers without understanding the complexity of query programming language. BrioQuery allows the user to create a query (or question) of the database. The information is retrieved in a spreadsheet-like format, and various reports can be created from that information.
Benefits of BrioQuery • User-friendly Tool
• Pre-defined DataModels, Queries, and Reports stored in the repository
• User may create queries
• User may create reports that help answer management decisions with a reasonable response time
• User may focus on information without worrying about file structure
• User may save queries for later use or modifications
What Does BrioQuery Do? BrioQuery filters large quantities of data to select only what is desired. It also quickly formats data so results can be evaluated and understood.
BrioQuery Sections (Section Pane) • Query - Specifies the database fields that are to be retrieved and optional limit and sort
conditions on the data values. Multiple queries can be created in a single *.bqy file.
• Datamodel – A visual representation of an actual database.
• Results - Displays the data that matches the query’s criteria using a table format.
• Pivot - Constructs pivot reports summarizing query result data by various categories.
• Report - Formats reports that display and group the query results.

Page 6 BrioQuery Training
• Table - Displays a columnar representation of your data. The table section functions like the Results section in that Pivots and Charts can be based on a table’s dataset.
• Chart – Creates a 3-D graphic representation of data results.
• Executive Information System (EIS) – Allows users to build and deploy analytic applications. The EIS section is a pushbutton approach to querying a database. It is a document front-end that makes it easy for end-users to access information.
BrioQuery Window Features and Tools There are a number of features and tools included in the BrioQuery screen display which are very useful. These include: the Standard Toolbar, the Request Line, Section Panes, and the Status Bar. The following graphics show menus, toolbars and lines which appears when BrioQuery is launched. This includes the BrioQuery menu bar, the Standard Toolbar, and the Request Line. Menu Bar The menu bar shown is from the Query section and will be the menu bar shown at startup. Each section of BrioQuery has its own menu bar. While the File and Edit menus are standard across all sections, other menus will appear depending on which section is active. Menu Bar
Request Line The Request Line is the area where named items (columns) are placed to return data from the database. Request Line
Limit Line The Limit Line is the area where "limits" or criteria are placed on named items (columns) so that a smaller, more specific, subset of data is returned from the database. To view the Limit Line, CLICK on the Limits button in the Section Title Bar.

BrioQuery Training Page 7
Sort Line The Sort Line is the area where sort conditions on data fields are placed so that the data is returned in a specific order. To view the Sort Line, CLICK on the Sort button in the Section Title Bar.
Toolbars The Standard Toolbar can be opened using the View menu. Whenever a query is created or opened this toolbar will be displayed. You can choose not to display this toolbar; however it is extremely useful. When you choose not to display the toolbar, it will not reappear when the tool is opened again. In BrioQuery, typically there are at least three methods for performing most activities, a button on a Toolbar, a menu option, or a drag and drop method. If you choose not to use the Standard Toolbar, you have the option to use various menus to perform the same functions. Features from some of the menus are duplicated in the Standard Toolbar. Toolbar
Limit button Sort button

Page 8 BrioQuery Training
The functions available via the buttons in the Standard Toolbar are:
The Formatting toolbar is available in the View Menu. This toolbar will allow you to customize your reports to highlight important information and polish the look.
The Formatting toolbar is a graphical representation of the functions supported by the various options in the Format menu. The Format menu is useful for making changes in all the sections: the Results section, the Pivot section and the Report section. The Section toolbar is only available in specific sections and provides commands to use in those sections.

BrioQuery Training Page 9
Section Pane The Section Pane is located to the left of the Contents Pane. The Section Pane allows quick access to every section of the BrioQuery window: the Query section, the Results section, the Pivot section, the Chart section, and the Report section. There can be multiple Pivots, Charts and/or Reports, and therefore multiple sections. Pivot, Report and Chart do not automatically appear in the Section Pane. To create them, you must insert them from the Insert menu. To view the different sections, CLICK on each section and view it in the Contents Pane or you can use the previous and back arrows in the Section Title bar. Catalog Pane The Catalog Pane is also located to the left of the Contents Pane. The Catalog Pane contains the data and objects that are used to build Pivot Reports, Charts, Tables and Reports. To use the Catalog Pane, drag an object from the Catalog Pane to the Contents Pane or to the Outliner. Contents Pane The Contents Pane is the lower right area of the window. The Contents Pane provides a view of the section you are using. It will show a Data Model, a Query, a Report, a Pivot or a Chart.

Page 10 BrioQuery Training
Status Bar At the very bottom of the BrioQuery window is the Status Bar. This feature gives you information about the number of rows returned by a query, the number of columns selected for the query, a graphic to show whether the database connection is active, and an information area which provides help information when you move the cursor to different areas of the window. The status bar will provide status statements during connection and processing.
What Version of BrioQuery do you have? If you are interested in what version of BrioQuery you are running on your computer, follow the steps below:
Section Pane
CatalogPane
Contents Pane

BrioQuery Training Page 11
1. From the Help pull-down menu, SELECT About BrioQuery….

Page 12 BrioQuery Training
NOTES

BrioQuery Training Page 13
Open Catalog Extensions Open Catalog Extensions (OCE) are small files that preserve connection information for quick and easy access to data sources. OCE’s store information such as which database is being connected to, your name, and the connection software being used. OCE’s are particularly useful for new database users, or for people who log on to more than one database. Instead of needing to remember the connection information and re-enter it each time you log on to a new or different database, you select an OCE from a list and type your password. The same OCE can be distributed to many users, even across desktop platforms. Creating your own OCE Creating an OCE is easy, but you should contact your Database Administrator to find out what information you need to enter. To create a new Open Catalog Extension: 1. When BrioQuery opens, the following dialog box will appear. SELECT A New Database
Connection File (if the OCE you want to use is not listed) and CLICK OK.
2. SELECT the appropriate Connection Software and Database you want to connect to. For

Page 14 BrioQuery Training
these exercises, you will need to SELECT SQL *Net for Windows NT for the Connection Software, and Oracle 8.0 for the Database you want to connect to and CLICK Next.
3. You will then need to fill in a Data Source. This always requires a Username and Password along with the Database or Host name. The Username and Password will be given to you by the instructor. The Host name for these exercises is DSSQA. CLICK Next.
4. CLICK Finish to save your settings as a connection file.
5. CLICK Yes to save your OCE.

BrioQuery Training Page 15
6. Use a descriptive file name to describe the connection information in the Save Open Catalog dialog box. For this exercise, name the OCE, “Training”. SAVE it in the Open Catalog Extensions directory by CLICKING Save.
IMPORTANT: Since OCE’s do not save passwords, they can safely be given to other BrioQuery users who connect to the same database server.

Page 16 BrioQuery Training
Changing Your Database Password You can change your password if you are logged into an Oracle Server, Red Brick Warehouse Server, Microsoft SQL Server, or Sybase Database Server. 1. Make sure you are connected to your database, indicated by the Connection icon on the right
of the Status bar.
2. From the Tools pull-down menu, SELECT Connection Manager. A dialog box appears.
3. CLICK on the OCE for which you wish to change the password and CLICK on Change Database Password. (Note: This will change the password for the database you are connecting to, regardless of the OCE you use to connect to that database.)
4. TYPE your old and new passwords in the appropriate fields, verify your new password, and then CLICK OK.

BrioQuery Training Page 17
Some database servers support case-sensitive passwords and/or require a minimum password length. Oracle passwords require the following: • Must be from 1 to 30 characters long. Recommended length is 6 or more. • Passwords may not contain quotation marks. • Passwords are not case sensitive. • Passwords must begin with an alphabetic character. • Password can only contain alphanumeric characters (A-Z, 0-9) and the characters_,$,
and #. • A password cannot be an Oracle reserved word. For more information on Oracle reserved
words contact your Database Administrator.

Page 18 BrioQuery Training
Using Shared DataModels A DataModel is a set of tables joined or linked together. These shared DataModels may be accessed through the Repository, which stores DataModels, Queries, Reports, Templates, and Style Sheets that have been created for user access. With BrioQuery you can either create your own DataModel or use a DataModel that has already been created. If you choose to create your own DataModel you must be able to accurately join the tables being used. If you incorrectly join the tables the data you receive from your query will not be accurate. It is advisable to use the shared DataModels from the Repository if you do not know how to join tables. This training will use a database that contains four tables that describe Employee Appointment data. The tables define Employee information, Employee Appointment information, Organizational Unit information, and Position Code information. Below is a picture of the DataModel. Note the lines between the tables; these show how the tables are joined to one another.
Warning: If you choose to build your own DataModel by accessing the Table Catalog, you must understand how to link or join the tables together. If you link or join the tables incorrectly your data will be inaccurate.
Fact Table
Dimension Table Dimension Table
Dimension Table

BrioQuery Training Page 19
Loading a DataModel 1. From the File pull-down menu, SELECT Open from Repository, SELECT.
2. This will prompt you to select an OCE. SELECT Training and CLICK Open.
3. This will prompt you for your username and password.

Page 20 BrioQuery Training
4. Within the Host User field, TYPE the “Host User” provided by your instructor.
5. Within the Host Password field, TYPE the “Password” provided by your instructor.
6. CLICK OK. Once you click OK, BrioQuery will connect you to the Repository located on the server.
NOTE: The Host User entered in the previous step will only access the training data. If you need to access the DSS data, make sure you select the correct OCE and type in your DSS Host User, password, and Host or Server name that you want to access.
7. SELECT the TRAINING folder from the Repository folder. You may have access to a number of repositories, so at this point, SELECT the one that contains the DataModel you want to work with.

BrioQuery Training Page 21
8. SELECT the Data Model folder within the TRAINING folder and SELECT Employee Appointment from the Data Model folder. CLICK Open or DOUBLE-CLICK on the DataModel you wish to access. The Data Model folder contains all of the DataModels within the Repository that was selected in the previous step. The Description area gives a brief description of the DataModel that is highlighted.
9. Selecting a DataModel name and pressing the Open button will cause the selected DataModel to appear. This DataModel will include a pre-defined, user friendly view of the database. It is locked and the end user cannot modify the Datamodel. Therefore, all users who view a DataModel from the repository will have consistent data.
Note: The text "LOCKED DATA MODEL" on the Status Bar. If you have loaded an incorrect DataModel, you will have to close the file and select the correct datamodel from the Repository. To view a list of the Standard Queries, or Standard Queries with Reports, that have been saved in the Repository, select either button. Selecting a name from the list will cause the Query, with its DataModel to be returned to the query window. You are then able to execute the query as usual by clicking the Process button. A Query saved with its Report will also provide the Pivot and/or Report formatting.

Page 22 BrioQuery Training
Table Views When you select a DataModel from the Repository Catalog, the individual table descriptions are displayed in either Structure View, Detail View, or Icon View.
Structure View This format lists all the column names in the table, and is a compact representation of the table.
Detail View To obtain an idea of the actual data that resides in a table, CLICK on the DataModel section, RIGHT-CLICK on the table and SELECT Detail View. A default of 10 rows of data will be read and returned from the database. All of the columns are returned with this function. This gives you the opportunity to scan the actual data before selecting a column.
NOTE: You can only use the Detail view in the Datamodel section. The Detail view is not available in the Query section.

BrioQuery Training Page 23
Warning: If you wish to view the data via Detail view and the particular table you are viewing is a Fact Table, the database may take a while before returning the sample data to you. Some Fact Tables contain many rows of information and the database will read through all of the rows before returning the first ten.

Page 24 BrioQuery Training
Creating Queries and Formatting Results Once your DataModel is loaded, you can begin building queries by dragging columns or fields from the tables in your DataModel.
Create a Simple Query Demo 1: Employee education level and years of service “Show me a list of all the employees at the University along with their title, education level, and years of service. Sort the list in ascending order by last name.” Your final report should look as follows:

BrioQuery Training Page 25
Create the Query Request
1. OPEN the Repository by SELECTING the correct OCE.
2. LOG onto the database.
3. LOAD the Employee Appointment DataModel.
4. ADD the columns Name Last, Name First, Title, Edu Level, Yrs Service from the Employee table to the Request Line. SELECT the column and then DRAG the column to the Request Line, or RIGHT-CLICK on the column name and SELECT Add Selected Items.
Use shift-click for continuous selections and ctrl-click for non-adjacent selections.
If you select the columns in a different order, you can rearrange them by dragging them into the correct order within the Request line. If you add an incorrect column, SELECT that column in the Request Line, and CLICK the Remove button on the Toolbar or RIGHT CLICK on the field and SELECT Remove.
Note: If you will be selecting all of the columns in the table for a query, you can SELECT the title bar of the table and RIGHT CLICK and SELECT Add Selected Items. This will add all of the column names to the Request Line. If you need to remove all of the column names in the Request Line, you can CLICK the Request button at the beginning of the line and CLICK the Remove button on the Toolbar. This will remove all the columns from the Request Line. 5. Sort the list by Last Name. SELECT the Sort button above the Request Line to view the
Sort Line.
6. Once you have the Sort Line visible, DRAG the Name Last column from the Request Line to the Sort Line.
7. CLICK the Process button. Status information will appear in the Status Bar to let you know that the request is being processed, and that data is being retrieved. The status bar at the bottom

Page 26 BrioQuery Training
of the screen will update during the processing of the query, telling you how many rows and columns are being returned.
Note: At any time, after the first row of data is returned, you can cancel a query by pressing ALT-END on your keyboard. You may have to hold the ALT key down and press the END key 40 or 50 times before the query will end. If this process does not end the query, DO NOT Re-boot! Call 6-7200 for assistance.
Format the Results
After you receive the Results, some of the information might be partially hidden. To view the data properly, it is necessary to make the column wider. 1. CLICK on the column(s) you want to enlarge.
2. MOVE your cursor to the edge of the column. Your cursor will turn into a bi-directional arrow. When this happens, CLICK and DRAG the cursor to the right, making the column wider. You can also DOUBLE-CLICK between columns to make the column wide enough for the longest data field.
Additional Formatting Tips
In addition to this manual method of re-sizing columns, you can use the Format menu, Column, Auto-Size width, to automatically re-size a column to fit the data. To use this option, SELECT the columns you wish to enlarge, using the CTRL key to select more than 1 column, and SELECT Auto-Size width from the Column command under the Format menu. Notice how the columns are sized to widths that allow the data to fit properly. It is also possible to use the Select All command in the Edit menu before re-sizing all of the columns. In this case, only columns that need to be re-sized will actually be affected by the Auto-Size command. The Auto-Size command will always re-size a column to the proper width for the widest value. Manually re-sizing a column requires that you scan all the rows returned to find the widest column value, in order to be sure that no value will be truncated.

BrioQuery Training Page 27
There are a variety of formatting options that you can use to enhance the presentation of your data. You can change the font, font size, or font style to be bold, italic or underlined. You can choose to left, right or center justify the data in a column. There are also a number of other formatting options available for use with numeric data. SELECT the Formatting Toolbar from the View menu and SELECT the Size menu. SELECT a smaller size to better fit the data. To page through your results, CLICK on the Print Preview button and SELECT Next Page or Previous Page from the Print Preview menu.

Page 28 BrioQuery Training
Export the Data
BrioQuery can export any Results, Pivot or Report from a Query into other applications. If you have Microsoft Excel, Lotus 1-2-3, or an application that can accept tab-delimited text available on your computer, complete the following exercise to try the export function: 1. From the File pull-down menu, SELECT Export then Section. The following window
will appear:
2. SELECT the appropriate drive and directory in which you want the exported file to be saved.
3. SAVE the exported file with a meaningful name.
4. SELECT the appropriate data type for the application that you will be exporting to, i.e. Excel (*.xls).

BrioQuery Training Page 29
The following Results section was exported to Excel from the Query you created without any editing having been done.
Note: You can also Copy/Paste the data to applications other than those listed in the export function.

Page 30 BrioQuery Training
Retain Results
Now your query is complete, and the results should match the Results listing shown at the beginning of this demo. The Query that you have created can be saved for future use. The default when saving a Query is to not save the Results. If you wish to save the Results (the actual data at this point in time), as well as the Query, you can select Save Query Results With document from the Save Options command under the File pull-down menu. To retain your Results: 1. From the File pull-down menu, SELECT Save Options and then, Save Query Results
With document. The following dialog box will appear.
2. SELECT Query and CLICK OK. Now the Results will be saved when the Query is saved.
3. SAVE the Query by following the steps outlined below.
Note: If you choose to retain results it will increase the size of your file depending on the amount of data retrieved. If you create a report in the Pivot and Report section of Brio the results are retained automatically.
Compress a Document The Compress Document feature condenses the number of bytes in a document in a compressed file format. The compressed files are transmitted more quickly and save valuable storage space. Compression concentrates the number of bytes by removing empty data fields and unnecessary information. The decompression happens automatically when the file is retrieved and reopened.

BrioQuery Training Page 31
1. SELECT Save Options from the File menu, and then CLICK Compress Document.
A check mark will be displayed next to the Compress Document feature.
Note: You can also configure BrioQuery to save all documents in a compressed file format by enabling the Compress All Documents option. SELECT the Tools pull down menu, SELECT Options, and then SELECT Program Options to see the BrioQuery Options dialog box. SELECT the Compress all documents checkbox and CLICK OK.
Save a Query
To save this file, which consists of both the Query and its Results: 1. SELECT Save As from the File menu and TYPE in a name. Be sure to make note of the
folder name, or directory, where the document is saved. This saves the Query definition and any formatting.
2. To close this document, SELECT Close from the File menu.
Open a Query

Page 32 BrioQuery Training
1. To reopen the Query you saved, SELECT Open from the File menu, or CLICK the Open
Query button on the Toolbar. Enter your password and CLICK OK. The Results data will be the same as previously retrieved, if you retained your results. Notice that the formatting and the sort sequence are exactly the same as when the Query was saved.
NOTE: Any queries you save can be re-opened, modified and used again. If you add another column to a Query and again select Process, the new column will be added, while the formatting on columns previously selected will be retained.

BrioQuery Training Page 33
Demo 2: Employee Education Level “Show me a list of all of the current types of employees at the University along with their departments who have a Masters Degree. Once you have all of the results, limit the results to list only Administrative/Professional staff and sort by Department Title.” Your final report should look as follows:
1. OPEN the Repository by SELECTING the correct OCE.
2. LOG onto the database.
3. LOAD the Employee Appointment DataModel.
4. ADD the columns Dept Title, and Staff Type to the Request line.
5. SELECT Limit Line, if necessary.
6. Limit the query to only bring back Staff Types with Masters Degrees. You can do this the following ways:
a. RIGHT CLICK on Edu Level in the Employee table and SELECT Limit….
b. DOUBLE-CLICK on Edu Level in the Employee table.
c. SELECT Edu Level in the Employee table and SELECT Add Limit(s) from the Query menu.
d. DRAG Edu Level into the Limit Line from the Employee table.

Page 34 BrioQuery Training
The Limit window opens:
In this window, the title of the column is listed. Notice the pull-down menu for the limit operators, such as =Equal, > Greater than, etc.
Note: The Not option is available to allow the negation of any operator. For more information on Limit operators, go to the BrioQuery Tips Section.
7. To decide what values the column can be limited on, SELECT Show Values. This will
show a list of all available values. This feature should only be used when it is known that there is only a small number of rows, but you are not sure of the exact spelling of these fields. In general it is OK to do a Show Values for Dimension Tables, but not Fact Tables.
The other options, Custom Values and Custom SQL, allow you to type in your own value or create an SQL line of code that limits the data. Select All selects all the values for limiting and Transfer transfers selected values to the Custom Values list. It is important to recognize that the Show Values feature might take a long time in a large database where there are a large number of rows for a column.
8. CLICK on MASTERS DEGREE to select it.
9. Make sure the operator is set to =Equal and CLICK OK. Notice the equal sign next to Edu Level column list in the Employee table. This denotes that a limit of "equal" has been placed on that column. A not equal operation would be represented by “<>” before the column name.
BrioQuery Training Page 35
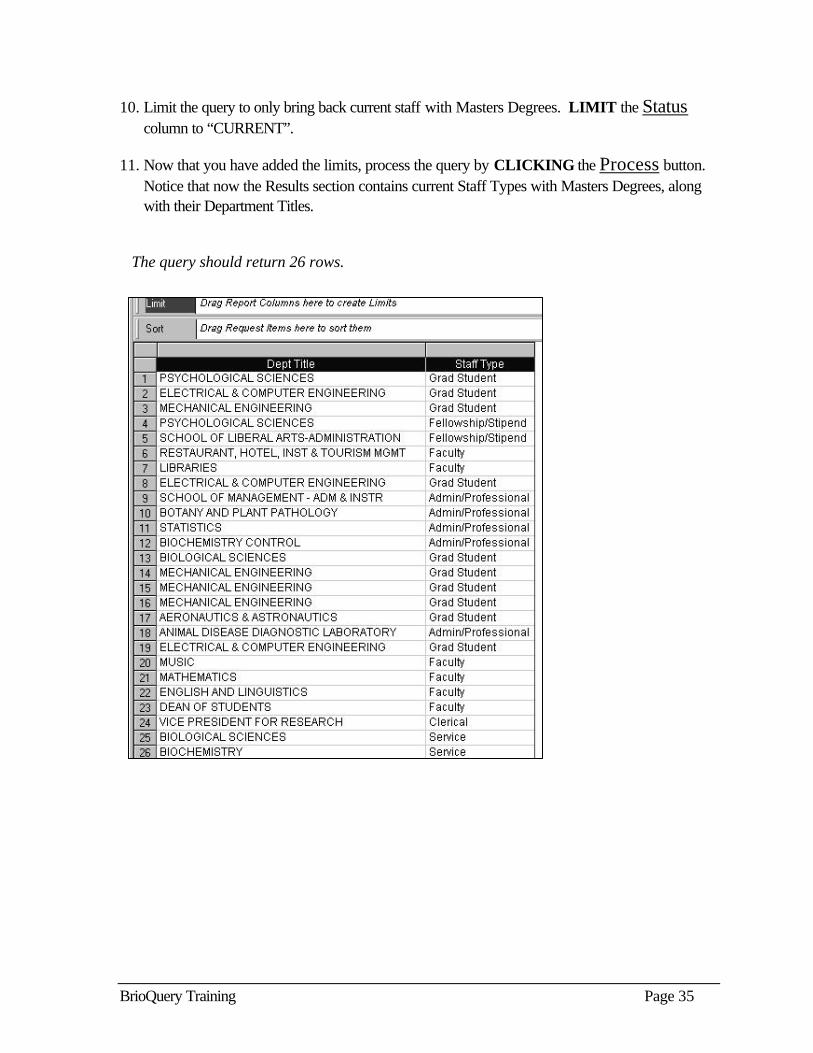
10. Limit the query to only bring back current staff with Masters Degrees. LIMIT the Status column to “CURRENT”.
11. Now that you have added the limits, process the query by CLICKING the Process button. Notice that now the Results section contains current Staff Types with Masters Degrees, along with their Department Titles.
The query should return 26 rows.

Page 36 BrioQuery Training
Limit Results There are actually two places where it is possible to add limits, in the Query section, and in the Results section. While a Query can be limited on a column which is not actually returned to the Results section, the Results section can only be limited on columns which are included in the Query's returned results. A Query limit reduces the total number of rows of data brought back to the Results section. The limits you just placed were Query limits on the columns Edu Level and Status.
A limit placed in the Results section places a limit on data already retrieved and reports a smaller subset of that data. It can be placed on the data to get a more focused view. A Results limit can be removed and all of the retrieved data will again be viewable without having to reprocess the Query. A Results limit allows you to focus your data searches and reports in a more dynamic way, without the necessity for retrieving the data from the database again and again. The addition, or removal, of a Query limit would require the reprocessing of the Query in order to obtain the new results.
1. SELECT the Limit Line from the Section Toolbar, if necessary.
2. DOUBLE-CLICK in the gray area above the column, Staff Type. CLICK the Show Values button, and CLICK to highlight “Admin/Professional”.

BrioQuery Training Page 37
3. CLICK OK. The results are automatically updated to reflect the limit.
The status bar should indicate that you have 5 of 26 rows.
4. SELECT Sort Line, if necessary.
5. DRAG Dept Title from the Catalog Pane to the Sort Line and CLICK the Sort Now button.
Your Report is now sorted by Department Title.

Page 38 BrioQuery Training

BrioQuery Training Page 39
Class Exercise “Show me a list of the current Calumet employees along with their Staff Id, Staff Type, and Term Description. After the results are returned, limit the results to only those employees with an “Academic” term. Sort the list in ascending order by Last name.” Your query should return 5 rows and your final report should look as follows:
1. OPEN the Repository by SELECTING the correct OCE.
2. LOG onto the database.
3. LOAD the Employee Appointment DataModel.
4. ADD Name Last, Name First, Staff Id, Staff Type, and Term Descrip to the Request line.
5. If the Limit Line is not displayed, CLICK on Limits above the Request Line.
6. LIMIT Status to “CURRENT”.
7. LIMIT Campus Name to “CALUMET”.
8. Now that you have added the limits, process the query by CLICKING the Process button.
9. If the Limit Line is not displayed in the results section, CLICK on Limits above the Contents Pane.
10. LIMIT Term Descrip to “ACADEMIC”. You will notice by limiting on Term Descrip , the row count went from 5 to 4.

Page 40 BrioQuery Training
11. If the Sort Line is not displayed in the results section, CLICK on Sort above the Contents Pane. DRAG Name Last from the Catalog Pane to the Sort Line, and CLICK Sort Now.
12. ADD formatting to your Results Report by using the Auto-Size Width feature.

BrioQuery Training Page 41
Refine a Query
Demo 1: Current Department FTE “Show me a current list of departments, and the staff type within those departments along with their FTE. Sort the list in ascending order by department title.” Your original query should return 122 rows. Your revised query should return 96 rows and your final report should look as follows:
1. OPEN the Repository by SELECTING the correct OCE.
2. LOG onto the database.
3. LOAD the Employee Appointment DataModel.
4. ADD the Dept Title, Staff Type, and Fte columns to the Request line.

Page 42 BrioQuery Training
5. SELECT the Limit line, if necessary.
6. Limit the Status column to “CURRENT”.
7. SELECT Sort line, if necessary.
8. DRAG Dept Title down from the Request line to the Sort line.
9. CLICK the Process button.
Notice that the Results consist of duplicate rows for some of the items. This is because there is more than one graduate student in Agronomy. BrioQuery returns a row for each graduate student in Agronomy in the database.
Add a Data Function
To combine these duplicate rows into a more meaningful report, you need to sum the data to give a single row with the total value of FTE for each Department and Staff Type. 1. CLICK on Query in the Section Pane to return to the Query Section.
2. SELECT Fte in the Request line and RIGHT CLICK on Fte. SELECT Data Functions, Sum. The request item will be renamed to show the data function attached to that item. When the query is processed, the aggregated data will be returned from the database.
3. CLICK the Process button. You will notice by adding the SUM function, the row count went from 122 to 96.

BrioQuery Training Page 43
4. ADD any additional formatting to your final Results Report if needed. You may want to use the Auto-Size Width feature.
Print Your Results
Before you print the report, it is possible to preview what the report will look like. The PrintPreview option allows you to view the document exactly as it will print. You can add headers and/or footers from the PrintPreview Menu. It is also possible to format the margins while in the Print Preview window.
1. SELECT Print Preview from the File menu, or use the PrintPreview button on the Toolbar.
2. SELECT Page Header from the Insert menu and create a header with as much information as you desire. You may add multiple headers and/or footers, as desired.
3. SELECT Page Footer from the Insert menu and create a footer with only the Page number.

Page 44 BrioQuery Training

BrioQuery Training Page 45
4. To print the document SELECT the Print command from the File menu and CLICK OK.

Page 46 BrioQuery Training
Demo 2: Current Faculty and Eligible Faculty “Show me a list of current employees along with their Staff Type, Education Level, and Campus Name that are either Faculty or have a Masters Degree.” Your query should return 50 rows and your final report should look as follows:
1. OPEN the Repository by SELECTING the correct OCE.
2. LOG onto the database.
3. LOAD the Employee Appointment DataModel.
4. ADD Name Last, Name First, Staff Type, Edu Level, and Campus Name to the Request line.
5. SELECT Limit Line, if necessary.
6. LIMIT Status to “CURRENT”.
7. LIMIT Staff Type to “Faculty”.

BrioQuery Training Page 47
8. LIMIT Edu Level to “MASTERS DEGREE”.
9. CHANGE the AND between Staff Type and Edu Level to OR. Do this by CLICKING on the AND button between Staff Type and Edu Level.
10. SELECT the arrow next to the Limit button at the beginning of the Limit Line to further modify your logic. An extension appears which offers more options. With this you can group columns together within parentheses to further control the logic of the limitation.
11. To have the "or" limit logic performed before the "and" limit, you need to ADD parentheses around Staff Type and Edu Level. SHIFT-CLICK to select both these column names in the Limit line and CLICK the ( ) button.
Note: The columns shown in the Limit Line are specific to whether the Limit Line has been chosen from the Query sheet or the Results sheet. The Limit Line Extension is only available in the Query section. In the Results section you can only choose "and" logic.
12. CLICK the Process button.
13. Format the results by SELECTING the Edit pull-down menu, then CLICK Select All. From the Format pull-down menu, SELECT Column, Auto-Size Width.

Page 48 BrioQuery Training
Demo 3: Administrative employee annual rate and hourly rate
“Show me a list of all the current Administrative/Professional employees at the University along with their Dept Title, Full Time Annual Rate, and Hourly Rate. Sort the list in ascending order based on the Full Time Annual Rate”.
Your query should return 20 rows and your final report should look as follows:
1. OPEN the Repository by SELECTING the correct OCE.
2. LOG onto the database.
3. LOAD the Employee Appointment DataModel.
4. ADD Name Last, Name First, Dept Title, Full-Time Annual Rate to the Request Line.
5. SELECT the Limit Line, if necessary.
6. LIMIT Status to “CURRENT”, and LIMIT Staff Type to “Admin/Professional”.

BrioQuery Training Page 49
Create a Computed Column
BrioQuery offers the ability to create a column for display in the Results section which does not actually exist in the database. This is done by allowing the creation of a column as the calculation of two or more columns from the Query section. To use this function, you will refer to the Full Time Annual Rate column, and then request that the value be divided by 2080 in order to obtain a value representing Hourly Rate. To create the column:
1. CLICK on the Request button in the Request Line, SELECT Add Computed Item from the Query pull-down menu.
2. RENAME the Column from “Computed” to “Hourly Rate”.
3. SELECT the Reference Button. Selecting the Reference button will cause a list of the tables in the DataModel to be displayed for selection. In addition to the table name list, "Request" is displayed which allows you to choose any item in the Request line for the calculation.

Page 50 BrioQuery Training
4. SELECT Employee Appointment from the Topic list and SELECT Full Time Annual Rate from the Item list.
5. Once your Topic and Item are selected, CLICK OK.
6. CLICK the division sign (/) at the bottom of the window, and TYPE “2080”.
7. The equation is now complete. CLICK OK.
8. CLICK the Process button to process the query.
9. From the Edit pull-down menu, SELECT Select All.
10. From the Format pull-down menu, SELECT Column, Auto-Size Width.

BrioQuery Training Page 51
11. SELECT the Sort Line, if necessary.
12. DRAG Full Time Annual Rate from the Catalog Pane to the Sort Line, and CLICK Sort Now.
13. FORMAT the Full Time Annual Rate column as Currency with no decimal places and the Hourly Rate column as Currency with 2 decimal places. SELECT Number from the Format menu. CHOOSE Currency and SELECT the correct number format.

Page 52 BrioQuery Training
Class Exercise “Show me a list of the current departments at the University along with a count of their Fte and a sum of their Fte. Create a computed column that is the average percentage Fte per department. Sort the list by Dept Title in Ascending order.” Your query should return 69 rows and your final report should look as follows:
1. OPEN the Repository by SELECTING the correct OCE.
2. LOG onto the database.
3. LOAD the Employee Appointment DataModel.
4. ADD Dept Title, and Fte to the Request Line.
5. ADD an additional Fte field to the Request Line.
6. Modify the first Fte field to compute the sum of Fte per Dept instead of the value. HIGHLIGHT the first Fte field on the Request Line, and RIGHT CLICK on it.
BrioQuery Training Page 53
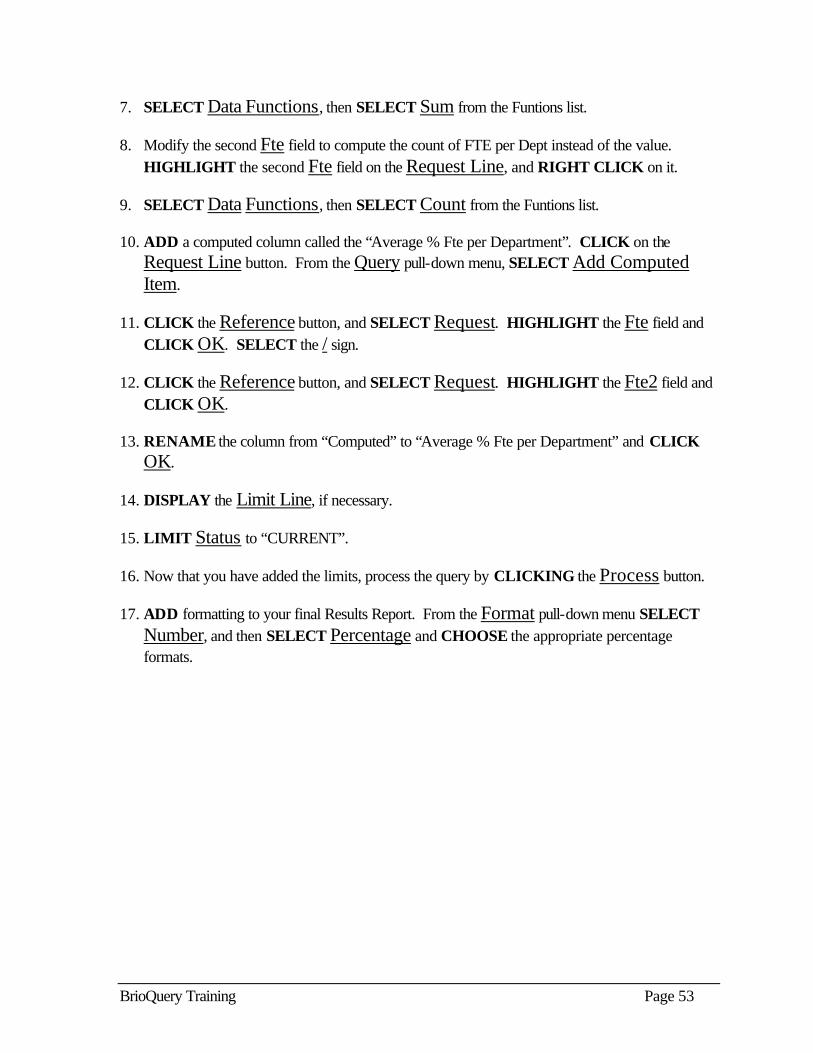
7. SELECT Data Functions, then SELECT Sum from the Funtions list.
8. Modify the second Fte field to compute the count of FTE per Dept instead of the value. HIGHLIGHT the second Fte field on the Request Line, and RIGHT CLICK on it.
9. SELECT Data Functions, then SELECT Count from the Funtions list.
10. ADD a computed column called the “Average % Fte per Department”. CLICK on the Request Line button. From the Query pull-down menu, SELECT Add Computed Item.
11. CLICK the Reference button, and SELECT Request. HIGHLIGHT the Fte field and CLICK OK. SELECT the / sign.
12. CLICK the Reference button, and SELECT Request. HIGHLIGHT the Fte2 field and CLICK OK.
13. RENAME the column from “Computed” to “Average % Fte per Department” and CLICK OK.
14. DISPLAY the Limit Line, if necessary.
15. LIMIT Status to “CURRENT”.
16. Now that you have added the limits, process the query by CLICKING the Process button.
17. ADD formatting to your final Results Report. From the Format pull-down menu SELECT Number, and then SELECT Percentage and CHOOSE the appropriate percentage formats.

Page 54 BrioQuery Training
Creating Pivot Reports In this section you will learn how to create Pivot reports. The Pivot reporting feature offers a great deal of benefit to the BrioQuery user because it allows the creation of reports that cross-tabulate data in a variety of ways. Pivot reports are great for dynamic and rapid summaries. They allow you to interactively drill-down, re-orient, or consolidate large data sets used for analysis. Demo 1: Current Clerical, Service, Faculty, and A/P Staff from West Lafayette Campus “Show me a list of all the current clerical, service, faculty, and A/P employees from the West Lafayette Campus along with their Staff Type, Rank Class, Staff ID, Head Count Dept, and FTE. In your Pivot Report, generate a total Dept count and FTE for each Staff Type, and sort on Staff Type in descending order based on FTE.” Your query should return 56 rows and your final report should look as follows:

BrioQuery Training Page 55
1. OPEN pivot.bqy, SELECT an OCE and LOG onto the Database.
2. PROCESS the query. The results section will display all of the data requested.
Build a Pivot Report
1. SELECT New Pivot from the Insert menu.
2. You can create a Pivot report by using the Outliner to design the report layout. CLICK on
the Outliner on the Section Title Bar to toggle the Outliner on and off. The placement of the data in the Pivot report will correspond to the areas shown in the Outliner at the bottom of the screen.
Outliner toggle button
Outliner

Page 56 BrioQuery Training
Develop a Pivot Report
1. DRAG Staff Type, Rank Class, Name Last, Name First from the Catalog Pane to
the Side Labels section. Notice that the report is being built step-by-step.
2. DRAG Head Count Dept, and Fte from the Catalog Pane to the Facts section.
The following is the final Outliner format you should create for the Pivot report:
Format a Pivot Report
You can format Top and Side Labels either by SELECTING the handles on the bottom (or side) of each row, or by CLICKING within the column. BrioQuery will format only the items in the Pivot section that have been highlighted. Clicking on a handle will cause the entire column to be highlighted. Clicking within the column itself will highlight only the specific value that was clicked on. USE SHIFT-CLICK (CTRL-CLICK) to highlight more than one item.
Note: In a Pivot report, changing the font type or size will only affect highlighted data. This feature of the Pivot section enables you to format one value within a column to have a different font type, size or characteristic than others within the same column. This can be useful if you wish to emphasize one value within a column by changing it to bold or italic. 1. To highlight a Side Label, and all the attendant data in the row, ALT-CLICK on the row to
highlight it.
2. CLICK the B button to bold the font in that row.
3. There are two different ways to change the width of a column or a row. One way is to CLICK within the open area above a column or to the left of a row. A line will appear at the edge of the column or row. SLIDE the arrow toward the edge until the bi-directional arrow appears. Now you can DRAG the column width (depth) in either direction.

BrioQuery Training Page 57
4. In addition to this manual method of re-sizing columns, you can use the Format menu and SELECT Auto-Size Width, to automatically re-size label columns to fit the data. SELECT the handle of the column Staff Type to highlight it, and SELECT Auto-Size Width from the Format menu. Notice the column was re-sized to fit the largest Staff Type.
5. It is possible to use the Justify function from the Format menu to Center, Left or Right justify a column heading and/or the data within the column. Since numbers automatically justify right, and text automatically justify left, you will usually want to use the justify feature to align the column headings on numeric data columns. CLICK on the Staff Type tab to select it.
6. From the Format pull-down menu, SELECT Justify, then SELECT Center.
7. You can change the name of any column heading by DOUBLE CLICKING on the column heading and TYPING in the new name. DOUBLE CLICK on the Head Count Dept Label, and CHANGE the Name field to “Department Count”.
Generate Totals
BrioQuery offers a feature that allows you to easily obtain totals on any column that has a tab at the bottom or on the right side. You can generate a total for a column by CLICKING on the tab of
the column and SELECTING the button from the Toolbar.
1. CLICK on the handle beneath the Rank Class column, SELECT the Sum or Grand Total
button. Note the Total generated. This results in a total for Head Count Dept and Fte for

Page 58 BrioQuery Training
each Staff Type.
2. To remove a total, SELECT the word "Total" in the column and CLICK the Remove button.
Sort a Pivot Report There are two options within Pivot reports for sorting. Sort By allows you to choose whether you want to sort the data alphabetically by the data Labels or numerically by the data Values. This sorting criteria allows you to view the same report in two completely different ways. The Sort Order can either be ascending or descending.
1. SELECT the Sort Line from the Section Title Bar, if necessary
2. SELECT Staff Type for “Sort”, SELECT Fte for “by” and Sum for “using”.
3. Sort in Descending Order by CLICKING on the Descending Sort button on the Sort Line.

BrioQuery Training Page 59
Duplicate a Pivot Report
Within BrioQuery, you can create multiple reports with the same data. If you would like to create a new pivot report to display the data a little differently, but you don’t want to start from scratch, follow the steps below to duplicate the report.
1. From the Edit pull-down menu, SELECT Duplicate Section.
2. You will notice a new section in the Section Pane named Pivot2.
Rename a Pivot Report
If you would like to rename your report to a more meaningful name, follow the steps below.
1. From the Edit pull-down menu, SELECT Rename Section OR DOUBLE-CLICK on the Report tab.
2. CLICK within the Label field and TYPE the new name.
3. CLICK OK.

Page 60 BrioQuery Training
Change the Background Color of a Pivot Report
To change the background color of your current pivot report, follow the steps below. 1. HIGHLIGHT the entire report. To do this, SELECT the Edit pull-down menu, and
SELECT Select All or SELECT only the columns for which you want to change the colors.
2. CLICK on the drop down arrow next to the Fill Color button on the Formatting toolbar. This will display the Fill Color list. The Fill Color list shows a grid of colors from which you can select a color.
To change the background color of future pivot reports, follow the steps below. 1. From the Tools pull-down menu, SELECT Options.
2. SELECT Default Formats.
3. SELECT the Pivot tab.
4. SELECT Labels under the Settings area.

BrioQuery Training Page 61
5. CLICK on the drop down arrow for Background and SELECT a color.
6. CLICK OK.
Chart a Pivot Report
Once you have created a Pivot report, you can automatically generate a chart from your Pivot report. 1. REMOVE Rank Class, Last Name and First Name from the Outliner’s Side
Labels . We only want to chart a summary of the data.
2. From the Insert menu, SELECT Chart This Pivot.
3. Your chart will look like this. To change the chart options, SELECT Properties from the
Chart menu.

Page 62 BrioQuery Training
4. To change the chart type, SELECT the drop down arrow on the Chart button on the toolbar.
Set Refresh An important feature to note in the Pivot report section is the Refresh Data option in the Pivot menu. After Process, When Section Displayed and Manually are three of the options within the Refresh Data option.
After Process (default) establishes an automatic link to the Results section to update the report whenever the query is processed. This option can significantly slow query times if a document has numerous report sections. When Section Displayed updates only when the section is accessed and displayed. Manually requests an immediate refresh to the current section.

BrioQuery Training Page 63
Class Exercise “Show me a list of all the current West Lafayette Campus employees by department with their Annual Rate and their FTE. Generate the total Annual Rate and FTE per department. Sort department by FTE in descending order.” Your query should return 106 rows and your final report should look as follows.
1. LOAD the Employee Appointment DataModel.
2. LOG onto the database.
3. ADD Name Last, Name First, Dept, Fte, and Annual Rate, to the Request Line.
4. LIMIT Status to “CURRENT”.
5. LIMIT Campus Name to “West Lafayette”.
6. PROCESS the Query.
7. SELECT New Pivot from the Insert menu.

Page 64 BrioQuery Training
8. CLICK on the Outliner button if the Outliner is not visible.
9. DRAG Dept, Name Last, Name First to the Side Labels .
10. DRAG Annual Rate, and Fte to the Facts Section.
11. Generate a total by SELECTING the Name Last tab and CLICKING the Sum or Grand Total button on the toolbar.
12. HIGHLIGHT the total row by holding the ALT key down and CLICKING it. CLICK the B on the formatting toolbar to bold the row.
13. SORT Dept by Fte in descending order.
14. ADD any formatting that you would like to your final Pivot Report.

BrioQuery Training Page 65
NOTES

Page 66 BrioQuery Training
Creating Reports In this section you will learn how to create Reports. Reports are in a band-style layout and they present data broken down by category with grand totals, nested subtotals, and other calculated values. Demo 1: Total Fte per Department in West Lafayette Campus. “Show me a list of the current West Lafayette campus employees for each department along with their staff id and total FTE. List the names based on Staff Type per department, and include a total FTE per department. Sort by Dept Title in ascending order.” Your query should return 106 rows and your final report should look as follows.
1. From the File pull-down menu, OPEN report.bqy.
2. PROCESS the query. The results section will display all of the data requested.

BrioQuery Training Page 67
To build a report, use the Outliner at the bottom of the screen. By dragging fields from the Catalog Pane into the appropriate areas in the Outliner, you will see your report being built step-by-step. The Outliner for the Report section is different than the Outliner in the Pivot section. Note the different names of the sections within the Outliner for the Report Section: Report Group 1, Table Dimensions, and Table Facts.
Create a Report
1. To insert a Report section, SELECT New Report from the Insert menu.
2. SELECT and DRAG Dept Title to the Report Group 1 pane in the Outliner.
3. SELECT and DRAG Staff Type to the Report Group 2 pane in the Outliner.
4. ADD Name Last, Name First, and Staff ID to the Table Dimensions pane in the Outliner.
5. ADD Fte to the Table Facts area of the Outliner.
In the Report Group portion of the Report, the name of the column will not be shown. Only the value of the data in the column will be shown. In the Table Dimensions portion of the Report, the name of the column is listed as a header (column title) for the values. In the Table Facts portion of the Report, columns added will be aggregated together. Place an amount in this area and notice the subtotals will automatically be created.

Page 68 BrioQuery Training
Format a Report
1. To format the width of the columns, CLICK on the Column Heading. Selection handles
will appear. FLOAT over the selection handles until the bi-directional arrow appears. DRAG the column's selection handles to make the column wider.
2. When you click on the field, the report will display whether a particular line is a Report Group Header or the Body of the report. CLICK on various fields to see the notation for Report Group Header and Body or SELECT Section Boundaries from the Report menu.

BrioQuery Training Page 69
3. Use the Justify feature on the Format menu to right justify the Fte column. CLICK on the Column name to highlight an item to format.
Add Report Headers and Footers
The Report Header and Footer will print once at the beginning of the report and at the end of the report. This differs from the page header and footer that will repeat on each page. 1. To add a Report Header or Footer, SELECT Headers and Footers from the Report
menu, and then SELECT Report Header, Report Footer, or Show Both.
2. CLICK to SELECT the Report Header.
3. From the Report menu, SELECT Insert Field.
4. CLICK and DRAG to draw a field in which to type your header.
5. In the Expression bar, type in a header between the quotation marks and PRESS Enter.

Page 70 BrioQuery Training
Add a Grand Total to your Report
The Grand total will print on the last page of the report.
1. To add a Grand Total, add a Report Footer to your report (see instructions above).
2. CLICK to SELECT the Report Footer or SELECT Section Boundaries from the Report menu to display the Report Footer area.
3. DRAG the field you want to sum, i.e. Fte, from the Catalog Pane and DROP it into the Report Footer.
Add Page Headers and Footers
The page header and footer allow you to specify data that you may want to repeat on every page, such as the page number.
1. To add a Page Header, SELECT Headers and Footers from the Report menu, and then SELECT Page Header, Page Footer, or Show Both.
Drop Fte into the Report Footer.

BrioQuery Training Page 71
2. SELECT the Page Header area on the report and TYPE in your Page Header between the quotation marks in the expression bar.
3. If the Expression bar is not showing, CLICK on the Expression button to display it.
Insert and Remove a Page Break
You may want to report information on separate pages, so that each Department’s information begins on a separate page. You can insert a page break before or after a report group label.

Page 72 BrioQuery Training
To insert a page break:
1. SELECT the area of the report where you want to insert the page break.
2. CLICK the INSERT menu, and CLICK Page Break Before or Page Break After.
To remove a page break:
1. SELECT the area of the report associated with the page break.
2. CLICK the INSERT menu, and CLICK Page Break Before or Page Break After to deselect the option that is checked.
Change the Column Titles 1. HIGHLIGHT the Table in your report. CLICK on Name Last Column title to select it.
2. Place your cursor in the Expression bar. TYPE in “Last Name” (quotes included) and PRESS Enter.

BrioQuery Training Page 73
3. HIGHLIGHT the Name First Column title and CHANGE it to “First Name” on the Expression bar. PRESS Enter.
Sort a Report
1. SELECT the Sort Line, if necessary.
2. SORT by Dept Title in ascending order. HIGHLIGHT the Report Group 1 Header by CLICKING on the Dept Title.
3. DRAG Dept Title to the Sort line next to the words “Report Group 1:”.

Page 74 BrioQuery Training
Add a Chart to a Report You can add a chart to a report. The information depicted in the chart depends on the Report area selected. For example, if the Report Header is selected, the chart will depict information for the entire report. 1. CLICK on the Chart in the Catalog Pane and DRAG it to your Report Header. You
may need to enlarge your Report Header before adding the chart. Once the chart is added to your report, you may need to re-size it.
Note: You can also add graphics to your report by expanding the Graphics folder in the Catalog pane and dragging a graphic object from the Catalog Pane to your report in the Contents pane.

BrioQuery Training Page 75
Class Exercise “Show me a list of current employees along with their Staff Type, Education Level, and FTE who have PHDs. List the employees based on Staff Type, and sort the Last Name in ascending order.” Your query should return 25 rows and your final report should look as follows:
1. LOAD the Employee Appointment DataModel.
2. LOG onto the database.
3. ADD Name Last, Name First, Staff Type, Edu Level, and Fte to the Request Line.
4. LIMIT Status to “CURRENT”.
5. LIMIT Edu Level to “PHD DEGREE”.
6. PROCESS the query.
7. SELECT New Report from the Insert menu to insert a report.
8. DRAG Staff Type and Edu Level to the Report Header Group pane of the Outliner.
9. DRAG Name Last and Name First to the Table Dimensions pane of the Outliner.

Page 76 BrioQuery Training
10. DRAG Fte to the Table Facts pane of the Outliner.
11. SORT by Name Last in ascending order.
12. CHANGE the Name Last column title to “Last Name”, and CHANGE the Name First header to “First Name”.
13. ADD any formatting that you would like to your final Report.

BrioQuery Training Page 77
NOTES

Page 78 BrioQuery Training
BrioQuery Tips Restricting the Number of Rows Returned BrioQuery provides an option to restrict the number of rows returned from a query. For instance, if you want to test your query on a small amount of data, or if you want to analyze a small result set, this feature is useful. To set the query to return a specific number of rows: 1.CLICK the Query section tab to bring you back into the Query section.
2.DOUBLE-CLICK the Request line button to show the Query Properties dialog box.
3. In the Process area, you can specify the number of rows you want returned from the database. If you specify 100 rows, then the Status bar will read “100 of 100 rows” after the query is processed. Another way to bring up this dialog box is to SELECT Query Options from the Query menu.
Note: A Time Limit checkbox is available. This option allows you to enter the maximum number of minutes for a query to take processing.
Note: The Custom Group By check box is only enabled when you are connected to a Red Brick Warehouse database server.

BrioQuery Training Page 79
Auto Logon BrioQuery provides an Auto Logon feature that uses the current connection settings to automatically log you on to a database. Use the Auto Logon shortcut to connect to the same database when you create a new document and do not wish to repeat the logon procedure. If you create a new document when automatic logon is enabled, BrioQuery gives you the choice of using the current connection settings to connect to a database, or canceling the automatic logon and setting up a different connection. 1. Verify that the active document is connected to the database (indicated by the connection icon
on the Status bar).
2. SELECT Options from the Tools pull-down menu and then SELECT Program Options. Select the General tab, and verify that there is a check mark beside Auto Logon.
3. SELECT Open from Repository from the File pull-down menu and SELECT the OCE you are working with.

Page 80 BrioQuery Training
4. View the documents you have open by looking in the Window pull-down menu. The document with a check mark beside it is the active window.

BrioQuery Training Page 81
Limit Table
Limit Type Operation Performed to Select
Data Data on which this comparison is valid
Equal = Only data where the requested item(s) is equal to the specified value(s) will be retrieved.
text, numbers, dates
Not Equal <> Only data where the requested item(s) is NOT equal to the specified value(s) will be retrieved.
text, numbers, dates
Less Than < Only data where the requested item(s) is less than the specified value(s) will be retrieved.
text, numbers, dates
Less or Equal <=
Only data where the requested item(s) is less than or equal to the specified value(s) will be retrieved.
text, numbers, dates
Greater Than > Only data where the requested item(s) is greater than the specified value(s) will be retrieved.
text, numbers, dates
Greater or Equal >=
Only data where the requested item(s) is greater than or equal to the specified value(s) will be retrieved.
text, numbers, dates
Begins With Only data where the requested item(s) begin with the specified value(s) will be retrieved.
text
Contains Only data where the specified value(s) is somewhere in the requested item(s) will be retrieved.
text
Ends width Only data where the requested item(s) ends with the specified value(s) will be retrieved
text

Page 82 BrioQuery Training
Limit Type Operation Performed to Select
Data Data on which this comparison is valid
Like Similar to contains; this matches the SQL LIKE command and requires that you use wild card characters to specify where arbitrary characters can be inserted; for most SQL databases such as Oracle, the wild card characters are % (any additional characters to the end of the string) and _ (any single character) when entering the specified value. Additional wild card characters may be available and the wild card characters may vary for different databases. In addition, special characters may need to be entered in a specific fashion. e.g. Job_title like “T%” would retrieve records for jobs like Testing, Typist, Truckdriver, etc. e.g. Part_number like “F_ABC%” would retrieve items with part number F1ABC999 and FKABCn3646-S.
text
Between Only data where the requested item(s) is between the specified value(s) will be retrieved. Note that data retrieved can also be equal to the specified beginning and ending values.
numbers, text, dates
Is Null Only data where the requested item(s) has not been set will be retrieved. Blank strings (i.e. spaces) and zero ARE NOT null values. Only items that have not been set to any value are considered to be null. In DSS, no text is set to Null; numbers or dates are set to Null when no value has been collected. For instance SAT score would be Null if the student had not taken the test.
text, numbers, dates

BrioQuery Training Page 83
Standard Data Functions Function Section
Used in:
Operation SQL Function Generated
None Query Returns unaggregated values as stored in the database. This is the default in Query.
Sum All Calculates the sum of the column in each group (numerical data only)
SUM(column definition)
Average All Calculates the average of the column for each group (numerical data only)
AVERAGE(column definition)
Non-Null Average
Pivot Chart Report
Returns average of underlying values; null values excluded.
Minimum All Returns the smallest entry in each group (numerical data only). You must set the datatype to include text and dates.
MIN(column definition)
Maximum All Returns the largest entry in each group (numerical data only). You must set the datatype to include text and dates.
MAX(column definition)
Count All Counts the number of appearances in each group of each unique value.
Count(column definition)
Count Distinct Query Same as Count but excludes identical rows
COUNT(column definition)
Null Count Pivot Chart Report
Returns number of nulls among underlying values.
Non-Null Count
Pivot Chart Report
Returns number of underlying values; null values excluded.
Standard Deviation
Query Returns standard deviation of values. STDDEV(column definition)
Variance Query Calculates the variance of the selected measure evaluated over the specified dataset.
VARIANCE(column definition)
Weight Query Used to compute weighted values in Pivot reports.
WEIGHT(column definition)
Rank Pivot Returns the rank of a number in a column of numbers.
RANK (numbers, break_col)
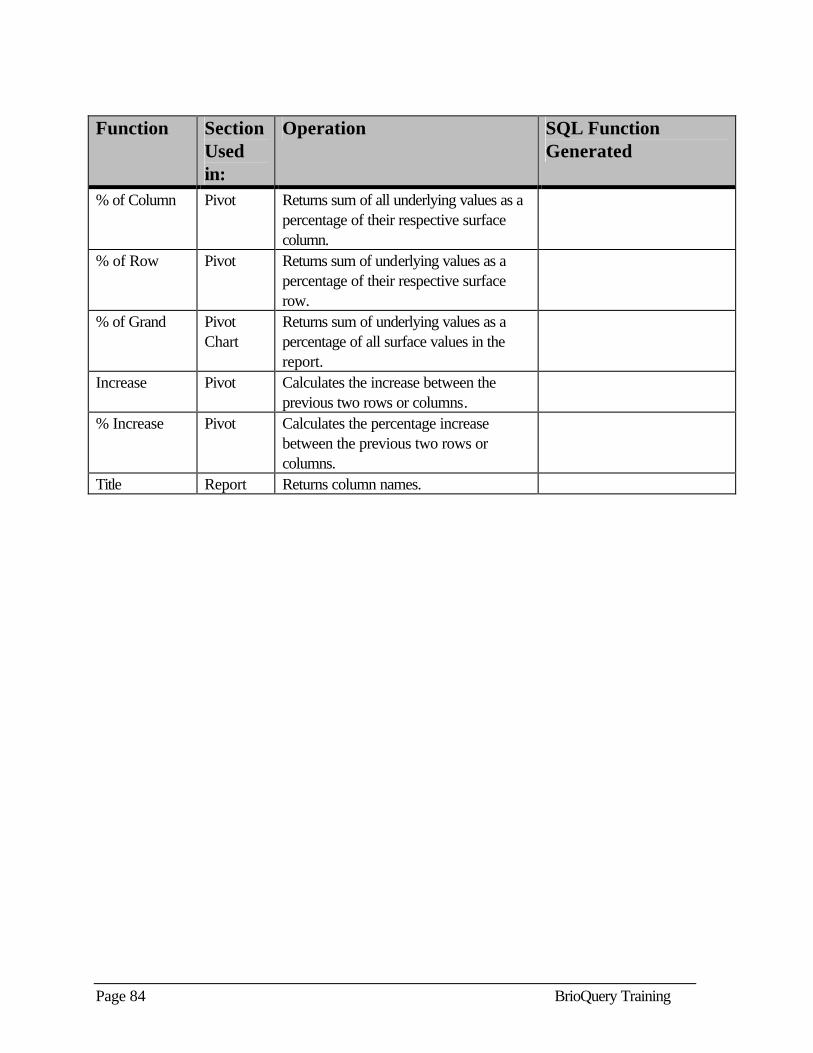
Page 84 BrioQuery Training
Function Section
Used in:
Operation SQL Function Generated
% of Column Pivot Returns sum of all underlying values as a percentage of their respective surface column.
% of Row Pivot Returns sum of underlying values as a percentage of their respective surface row.
% of Grand Pivot Chart
Returns sum of underlying values as a percentage of all surface values in the report.
Increase Pivot Calculates the increase between the previous two rows or columns.
% Increase Pivot Calculates the percentage increase between the previous two rows or columns.
Title Report Returns column names.

BrioQuery Training Page 85
Data Types
Data Type Usage
Automatic BrioQuery will automatically determine the data type returned from the database. This is the default and should be the normal choice.
Byte A single byte of computer storage. Bytes can take numeric values from 0 to 255 and can also be used to store a single text character.
Date Calendar date. This will be stored in the format selected, typically mm/dd/yy.
Integer (16 bit) A 16-bit value (2 bytes). A 16-bit integer can take values from 0 to 65,536. If the integer is signed, it can take values ranging from +32,768 to -32,768.
Integer (32 bit) A 32-bit value (4 bytes). A 32-bit integer can take values from 0 to 16,777,216. If the integer is signed, it can take values ranging from +8,388,608 to -8,388,608.
Long Text Very long text fields. Maximum length is defined by the database and connection API.
Real Numbers with decimal points. Up to 5 positions are allowed to the right of the decimal. The range of values depends on the number of decimal points.
String Text characters. Maximum length is 256 characters.
Time Time. The format used for times is set by user preference.
TimeStamp Date/time combination. The format used is set by user preference.

Page 86 BrioQuery Training
World Wide Web URLs The following URLs outline a few of the problems that have been reported in DSS. A few of these are product bugs, while others may be database limitations and/or problems inherent to the nature of our environment. BRIO Frequently asked questions and their answers http://www.adpc.purdue.edu/DC-CS/problems/briofaq.htm
DSS Homepage http://www.adpc.purdue.edu/DSS/
WAI home page --
http://www.adpc.purdue.edu/WAI/