brisbane bayside state college (2104) queensland … department of education, training and...
TRANSCRIPT

T
DEPARTMENT OF EDUCATION, TRAINING AND EMPLOYMENT
Brisbane Bayside State College (2104)
Queensland State School Reporting
2012 School Annual Report
YPEOVER TO INSERT SCHOOL NAME
Postal address PO Box 326 Wynnum Central 4178
Phone (07) 3893 5333
Fax (07) 3393 6050
Email [email protected]
Webpages Additional reporting information pertaining to Queensland state schools is located on the My School website and the Queensland Government data website.
Contact Person The Principal
Principal’s foreword
Introduction
Welcome to Brisbane Bayside State College’s Annual Report for 2012. With over 900 students and opened in 2010, the College is proudly creating traditions of excellence in the academic, cultural and sporting arenas. This Annual Report provides a snapshot of what the College values and acts on in terms of teaching and learning priorities, curriculum and extra -curricular offerings, support for students and engagement of parents and the wider community. Specific data is provided with regards to learning outcomes – NAPLAN and Year 12 outcomes, student attendance, staff profile, and satisfaction ratings by students and parents.
To gain a further insight into Brisbane Bayside State College please join us for one of our Open Mornings on either July 25, September 5, October 24 and November 7 commencing at 9.00am.
School progress towards its goals in 2012
In 2012 Brisbane Bayside State College focused on three specific improvement priorities.
BBSC Priority One was improvement in National Assessment Program Literacy and Numeracy group results as detailed below:
Reading BBSC Target 90% of students at or above National minimum standard, and 14% attainment of Upper Two Band result. Achievement based on 2012 NAPLAN Report summary was 90.2% above National minimum standard, and 9.3% in U2B.
Writing BBSC Target 88% of students at or above National minimum standard, and 16% attainment of Upper Two Band result. Achievement based on 2012 NAPLAN Report summary was 69.5% above National minimum standard, and 4.1% in U2B.
Numeracy BBSC Target 92% of students at or above National min imum standard, and 15% attainment of Upper Two Band result. Achievement based on 2012 NAPLAN Report summary was 91.9% above National minimum standard, and 8.1% in U2B.
BBSC Priority Two was enhancement of the Learning Culture in every classroom. The target through pro-active behavior management practices was a 10% reduction in school disciplinary absences and a 10% reduction in behaviour incident referrals. Behaviour outcomes indicated target achievement with 40.6% reduction in school disciplinary absences and 25% reduction in behavior referrals.
BBSC Priority Three was enhancement in delivery of effective teaching practices to improve student achievement outcomes. Identified targets were 47% ‘A’ and ‘B’ achievement levels awarded, and <13% ‘D, ‘E’ or ‘NR’ achievement levels awarded. Actual achievement results awarded were 46.6% ‘A’ and ‘B’ levels, and 14.3% ‘D’, ‘E’ or ‘NR’. The concentration on improving student learning outcomes in 2012 was evidenced by the Year 12 results. 71% of OP
DEPARTMENT OF EDUCATION, TRAINING AND EMPLOYMENT
Queensland State School Reporting
2012 School Annual Report
eligible students received an OP 1-15. This was an improvement of 16% from 2010 and 31% in 2011. 98% of students received a SAT;QCE; IBD or VET qualification .
Future outlook
At Brisbane Bayside State College we are committed to improving student learning outcomes. Three main priorities for 2013 are a continuation of those enacted in 2012. Our direction in these three areas have been verified by the College’s excellent feedback from Education Queensland’s Teaching and Learning Audit where we received High and Outstanding ratings. The three priorities are:
*Literacy and Numeracy improvement
*A culture that promotes learning in every classroom
*Effective teaching practices
2013 Systemic priorities include:
Continued implementation of the Australian Curriculum
Plan to transition Year 7 to high school including the construction of a new Junior School Building
Continue to develop productive partnerships with students, parents and the community.
Our school at a glance
School Profile
Coeducational or single sex: Coeducational
Year levels offered in 2012: Year 8 - Year 12
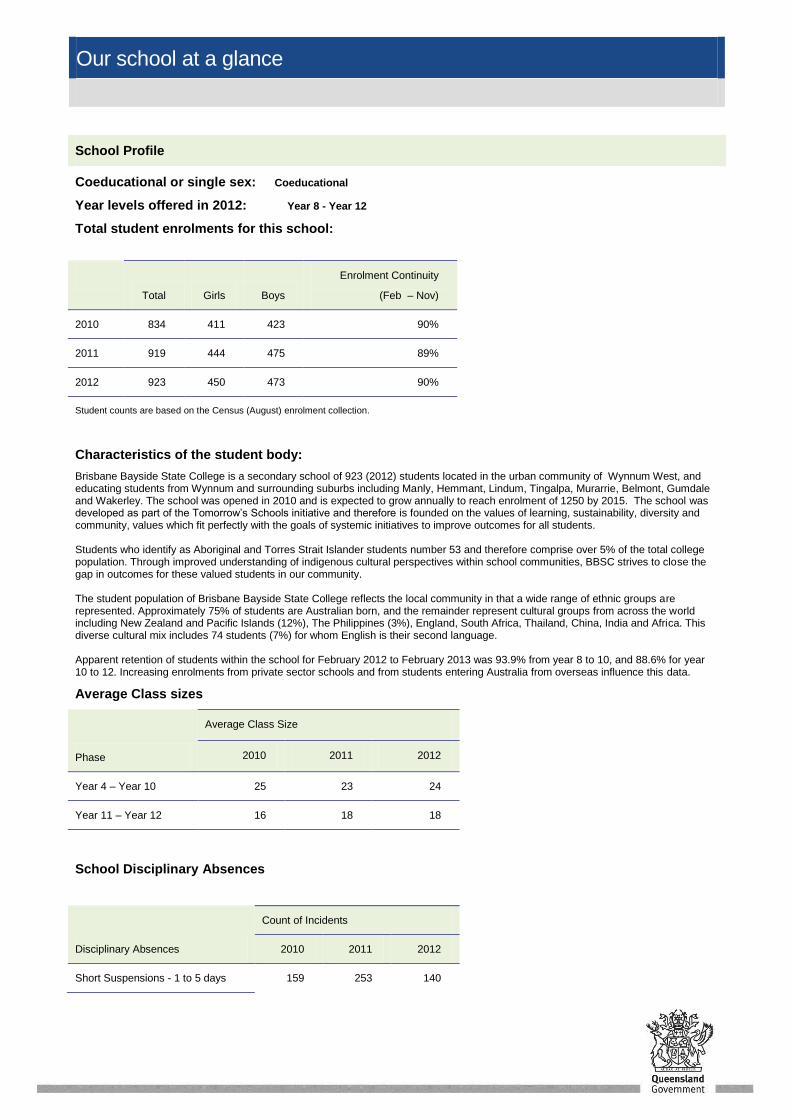
Total student enrolments for this school:
Total Girls Boys
Enrolment Continuity
(Feb – Nov)
2010 834 411 423 90%
2011 919 444 475 89%
2012 923 450 473 90%
Student counts are based on the Census (August) enrolment collection.
Characteristics of the student body:
Brisbane Bayside State College is a secondary school of 923 (2012) students located in the urban community of Wynnum West, and educating students from Wynnum and surrounding suburbs including Manly, Hemmant, Lindum, Tingalpa, Murarrie, Belmont, Gumdale and Wakerley. The school was opened in 2010 and is expected to grow annually to reach enrolment of 1250 by 2015. The school was developed as part of the Tomorrow’s Schools initiative and therefore is founded on the values of learning, sustainability, diversity and community, values which fit perfectly with the goals of systemic initiatives to improve outcomes for all students. Students who identify as Aboriginal and Torres Strait Islander students number 53 and therefore comprise over 5% of the total college population. Through improved understanding of indigenous cultural perspectives within school communities, BBSC strives to close the gap in outcomes for these valued students in our community. The student population of Brisbane Bayside State College reflects the local community in that a wide range of ethnic groups are represented. Approximately 75% of students are Australian born, and the remainder represent cultural groups from across the world including New Zealand and Pacific Islands (12%), The Philippines (3%), England, South Africa, Thailand, China, India and Africa. This diverse cultural mix includes 74 students (7%) for whom English is their second language. Apparent retention of students within the school for February 2012 to February 2013 was 93.9% from year 8 to 10, and 88.6% for year 10 to 12. Increasing enrolments from private sector schools and from students entering Australia from overseas influence this data.
Average Class sizes
Phase
Average Class Size
2010 2011 2012
Year 4 – Year 10 25 23 24
Year 11 – Year 12 16 18 18
School Disciplinary Absences
Disciplinary Absences
Count of Incidents
2010 2011 2012
Short Suspensions - 1 to 5 days 159 253 140

Our school at a glance
Long Suspensions - 6 to 20 days 37 49 13
Exclusions 1 3 3
Cancellations of Enrolment 0 0 13
Curriculum offerings
Our distinctive curriculum offerings
Brisbane Bayside State College has set high-level targets across all aspects of schooling. The Junior Secondary phase of Learning Program has been renewed to focus on a Gateways model including three learning pathway options in Year 8 and 9 studies based upon learning styles most suited to students’ interests and abilities. The school maintains a strong focus on providing students with a supportive curriculum. The junior secondary phase of learning philosophy stipulates that year 8s remain with their key or core teachers for the majority of their learning. Complimenting this is a college pedagogical framework and established explicit classroom routines that are established for all teachers and classes. All classes include embedded literacy learning in the form of uninterrupted silent sustained reading, spelling and vocabulary, and contextual writing. A college Numeracy plan to ensure consistency of approach across all learning areas is also being implemented with strategies to embed ‘numeracy moments’ being implemented across all key learning areas. Further fostering the support ethos, a welfare program is in place that provides guided support for all students from year 8 through to year 12.
Junior School Specifics
Brisbane Bayside State College’s curriculum is organised in the Junior School through three Learning Gateways. Each Gateway uses a different style of teaching to match an individual student’s learning style. The three Gateways are Arts and Culture – Learning through performance; Inquiry and Discovery – learning through inquiry and Innovation, Technology and Enterprise – learning through design. Students in year 8s, 9s and 10s study the core subjects of English, Maths, Science, History and Physical Education and they have the choice of electives throughout the three years. In Year 10 these subjects are designed to prepare students for Year 11 and 12.
Senior School Specifics
BBSC offers a comprehensive subject selection in the Senior School. In 2012 students could choose from 27 authority subjects including three through virtual schooling/distance education and 17 non authority subjects. Many of our students also take advantage of completing a School-based traineeships/Apprenticeship) attending a TAFE college one day a week to complete a certificate level course or to enrol into University partnership programs. Through the Students Education Transition Plan (SETP) process and ongoing support structures, staff plan with parents and students a pathway to achieve post school ambitions and goals.
Extra curricula activities
Brisbane Bayside State College offers many opportunities to be active participants through cultural, sporting and academic pursuits. In 2012 some of the ways students were encouraged to be active participants included:
*Leadership positions and an active student council. The student council raised money for the 40 hour famine, and Shave for a Cure and organised a well- attended school social in Term 4.
*The School Captains host full school assemblies each fortnight and on special occasions such as ANZAC Day and the Leadership Assembly
*A thriving instrumental music program and choir. The Bands represented the College at the Exhibition, the Biennial Fanfare Festival (Silver and Bronze awards); The Redlands Eisteddfod(1
st and 2
nd place); Manly Waterfront Festival; local
primary schools and shopping centres.
*Year 8 Camp and Year 11 Leadership Camp
*Academic competitions including the ICAS Maths Competition, UQ Titration Competition, Readers Cup, Australian History Essay Competition
*Human Powered Vehicle competition in Maryborough
*Student tutorial program every afternoon in the school library supported by staff and past students who are now attending University.
*Performance Evenings
*Greater Brisbane Sport Saturday competition plus and the Gateway sporting competition on a Wednesday afternoon.

Our school at a glance
*District and Regional sporting opportunities
*School trips – Ski trip
How Information and Communication Technologies are used to assist learning
Brisbane Bayside State College believes that daily access to technology is vitally important in enhancing learning for all students. BBSC has invested in ensuring our curriculum provides learning and assessment opportunities that allow students to inquire, create and communicate with ICTs. There are currently over 800 individual computers at BSSC which ensures students have access to ICTs to meet their daily learning needs. Below is a snapshot of the ICTs available at BBSC.
Every teaching space in the school has an electronic whiteboard to support student engagement with learning, with a roof
mounted data projector, built in speaker; all connected to a desktop computer for teacher and student use
Each classroom has eight desktop computers available for student learning
126 laptops – class sets available for HPE and Science classes and 65 located in the library for general student use
16 dedicated ICT learning areas – ranging from 14 to 28 computers
Two custom built computer labs that cater for the high end computing needs of both our Film and Television, and Graphics
students
688 desktop computers throughout the school
Adobe Master Collection CS6 – One comprehensive toolkit for design, web, and video applications
Autodesk 2013 - Industry leader in 2D and 3D CAD design, drafting, modelling, architectural drawing, and engineering
software
MOODLE - BBSC’s dynamic learning environment that students use to submit assignments electronically, participate in
forums and allows teachers to deliver online lessons
eChalk – Subscription to a collection online resources designed specifically for interactive whiteboards and which focus on learning through fun. Ideal for Warm Ups.
ClickView – Subscription to a digital content library that enables teachers to deliver video of over 30,000 curriculum based titles
Keepad Interactive - audience response devices to provide feedback for students on their learning
The implementation of ICTs throughout Brisbane Bayside State College is supported by an expert team of skilled technicians with the full time equivalency of 2.0 positions. The ICT support team are critical in managing the school network, maintaining our facilities and supporting new initiatives.
Social climate
Brisbane Bayside State College is a strong school community with an emphasis on support for students and positive relationships and productive partnerships between all members of the school community. This is evidenced by:
*All students being assigned to a House Group as well as welfare Roll Class. Students remain in the same welfare class throughout their time at BBSC and where possible have the same welfare teacher and welfare leader each year. The House system aims to promote House as well as school spirit by involving students in a range of pursuits (cultural, sporting and academic) in which they can

Our school at a glance
gain House points to contribute towards an overall award of Champion House of the Year.
*An individual rewards system aims to recognise those students who ‘do the right thing’ in areas such as punctuality, attendance, having the correct equipment, supporting others, following rules and meeting expectations. These students have been rewarded with individual ‘Golden Tickets’ that places them in the draw for monthly rewards and prizes. Year level reward days are available in the Junior School to recognise students who have maintained the expected standard of behaviour and engagement in learning.
*A well- documented and well enacted Positive Behaviour Plan. The Welfare Program across all year levels is a crucial component of BBSC’s whole school approach to positive behaviour support. All students have a welfare lesson each week as well as a welfare teachers and a year level welfare leader. Specific lessons and programs target development of interpersonal skills, goal settings, career pathways, resilience training and social development. Further support, available through the guidance officer, Chaplain, school nurse, career pathways co-ordinator and Community Education Counsellor enhances this program. A consistent expectation for students to demonstrate our four core College rules is the basis for positive management of student behaviour in all College activity – classroom learning, around the school, at functions and events, and travelling to and from the College. The four rules, well known and adhered to by the school community are – Be a learner, Be responsible; Show respect; Contribute to our community.
The success of this approach can be seen in the School Opinion Surveys where 96.7% of parents agreed that their child feels safe at BBSC and 90.6% of students felt the same. Parents believe that their child likes being at BBSC -90% and 89% of students agree.
Parent, student and staff satisfaction with the school
2012 at Brisbane Bayside State College has been a year of positive growth for our school and this is supported by the School Opinion Survey issued to parents, students and staff by Education Queensland. The school community was overwhelming positive about BBSC. Some highlights include 97% of students believing their teachers expect them to do their best, 96.4% of parents would recommend this school to others and 95.3% of students satisfied with the access to computers and other technologies at the school.
Performance measure (Nationally agreed items shown*)
Percentage of parents/caregivers who agree that: 2012#
their child is getting a good education at school 90.0%
this is a good school 93.1%
their child likes being at this school* 90.0%
their child feels safe at this school* 96.7%
their child's learning needs are being met at this school* 86.2%
their child is making good progress at this school* 93.1%
teachers at this school expect their child to do his or her best* 89.3%
teachers at this school provide their child with useful feedback about his or her school work* 86.7%
teachers at this school motivate their child to learn* 80.0%
teachers at this school treat students fairly* 80.0%
they can talk to their child's teachers about their concerns* 86.7%
this school works with them to support their child's learning* 90.0%
this school takes parents' opinions seriously* 85.2%
student behaviour is well managed at this school* 62.1%
this school looks for ways to improve* 89.7%
this school is well maintained* 86.2%

Our school at a glance
Performance measure (Nationally agreed items shown*)
Percentage of students who agree that: 2012#
they are getting a good education at school 89.1%
they like being at their school* 89.1%
they feel safe at their school* 90.6%
their teachers motivate them to learn* 86.7%
their teachers expect them to do their best* 97.6%
their teachers provide them with useful feedback about their school work* 84.3%
teachers treat students fairly at their school* 71.7%
they can talk to their teachers about their concerns* 61.6%
their school takes students' opinions seriously* 65.1%
student behaviour is well managed at their school* 65.1%
their school looks for ways to improve* 92.8%
their school is well maintained* 82.4%
their school gives them opportunities to do interesting things* 86.6%
Performance measure (Nationally agreed items shown*)
Percentage of school staff who agree: 2012#
that they have good access to quality professional development 83.0%
with the individual staff morale items 89.5%
* Nationally agreed student and parent/caregiver items were incorporated in the School Opinion Survey in 2012.
# Percentage of respondents who Somewhat Agree, Agree or Strongly Agree with the statement. Due to changes to the School Opinion Surveys in 2012,
comparisons with results for previous years are not recommended.
DW = Data withheld to ensure confidentiality.
Our school at a glance
Involving parents in their child’s education
Brisbane Bayside State College encourages and welcomes the involvement of parents/caregivers in their child’s education. The committed and active Parents and Citizen’s Association meet every second Tuesday at 7.30pm. The P and C manage the Uniform and Canteen.
Other opportunities for parent participation include:
*Parent/Teacher interviews twice a year in Terms 1 and 3
*School Open Mornings
*Performances
*Sporting events including swimming, cross country and athletics carnival, GBS sport on Saturdays
*Special assemblies including ANZAC and Leadership
Other ways of communicating to parents:
*Texting
*Electronic noticeboard
*Website – includes information such as school policies, staff members contact details and curriculum information
*Fortnightly newsletters
*Student Planners
*School magazine – BAYSIDER
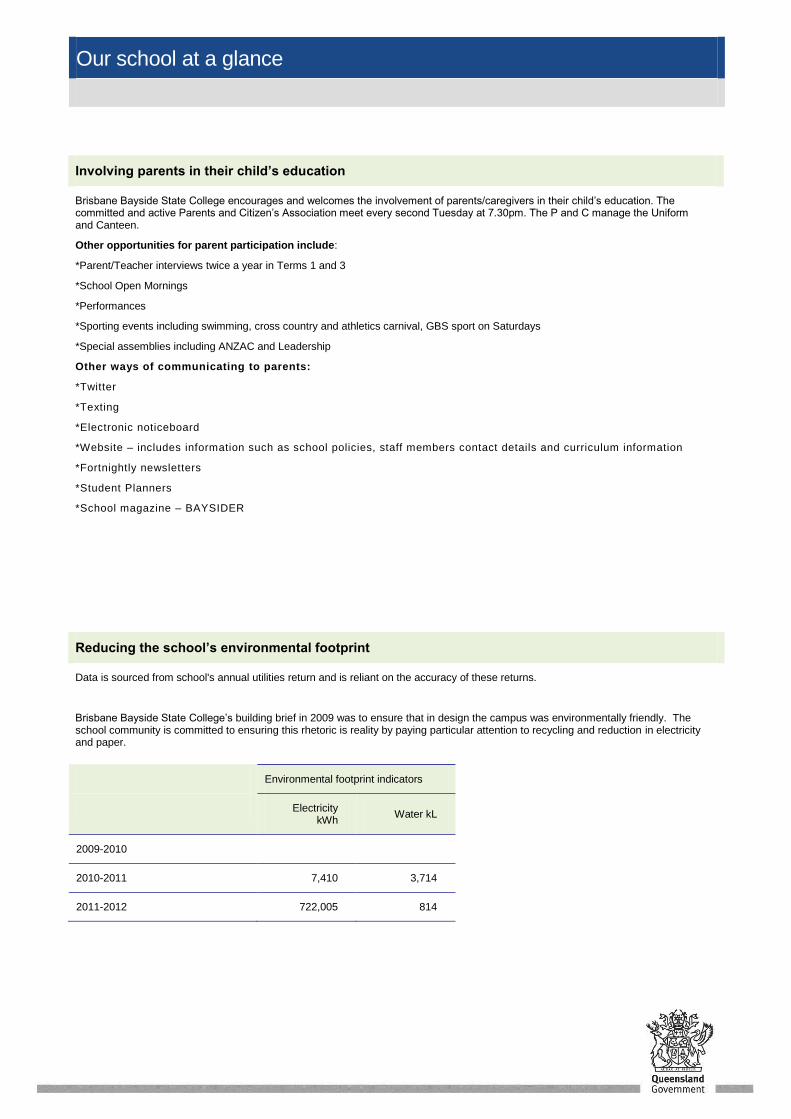
Reducing the school’s environmental footprint
Data is sourced from school's annual utilities return and is reliant on the accuracy of these returns.
Brisbane Bayside State College’s building brief in 2009 was to ensure that in design the campus was environmentally friendly. The school community is committed to ensuring this rhetoric is reality by paying particular attention to recycling and reduction in electricity and paper.
Environmental footprint indicators
Electricity kWh
Water kL
2009-2010
2010-2011 7,410 3,714
2011-2012 722,005 814

Our staff profile
Staff composition, including Indigenous staff
2012 Workforce Composition
Teaching Staff
Non-teaching Staff
Indigenous Staff
Headcounts 75 32 <5
Full-time equivalents 70.4 22 <5
Qualifications of all teachers
Highest level of
attainment
Number of
classroom
teachers and
school leaders
at the school
Doctorate 2
Masters 8
Bachelor degree 70
Diploma 2
Certificate 0
010203040506070
2 8
70
2 0
Doctorate Masters
Bachelor degree Diploma
Certificate
Expenditure on and teacher participation in professional development
The total funds expended on teacher professional development in 2012 were $ 57 203. The major professional development initiatives were as follows:
*Effective Teaching PD – Suzanna Falls
*PD by Mischief Motivation Attitude looking at consistency across the school
*Metropolitan Region Explicit Teaching PD – John Fleming
*Australian Curriculum PD
*Art and Science of Teaching PD

Our staff profile
*Assessment for Learning Masterclass – QSA
*Gifted Leadership
*Professional Development Network PD – Pedagogical Frameworks
*Watching others Work – links to cluster primary schools
*Maths Department – Explicit teaching model in action
*WYMSEA cluster group PD and guest speakers
*QELi Emerging Principals’ Program X2
*2012 Metropolitan Region Aspiring Leaders
*HOD reading circles
*Essential Learnings
The proportion of the teaching staff involved in professional development activities during 2012 was 100%.
Average staff attendance 2010 2011 2012
Staff attendance for permanent and temporary staff and school leaders. 95.8% 95.7% 96.1%
Proportion of staff retained from the previous school year
From the end of the previous school year, 95.7% of staff was retained by the school for the entire 2012 school year.
School income broken down by funding source
School income broken down by funding source is available via the My School website at http://www.myschool.edu.au/.
To access our income details, click on the My School link above. You will then be taken to the My School website with the following ‘Find a school’ text box.
Where it says ‘Search by school name’, type in the name of the school you wish to view, and select <GO>. Read and follow the instructions on the next screen; you will be asked to accept the Terms of Use and Privacy Policy before being given access to the school’s My School entry web page.
School financial information is available by selecting ‘School finances’ in the menu box in the top left corner of the school’s entry web page. If you are unable to access the internet, please contact the school for a paper copy of income by funding source.
Performance of our students
Key student outcomes
e
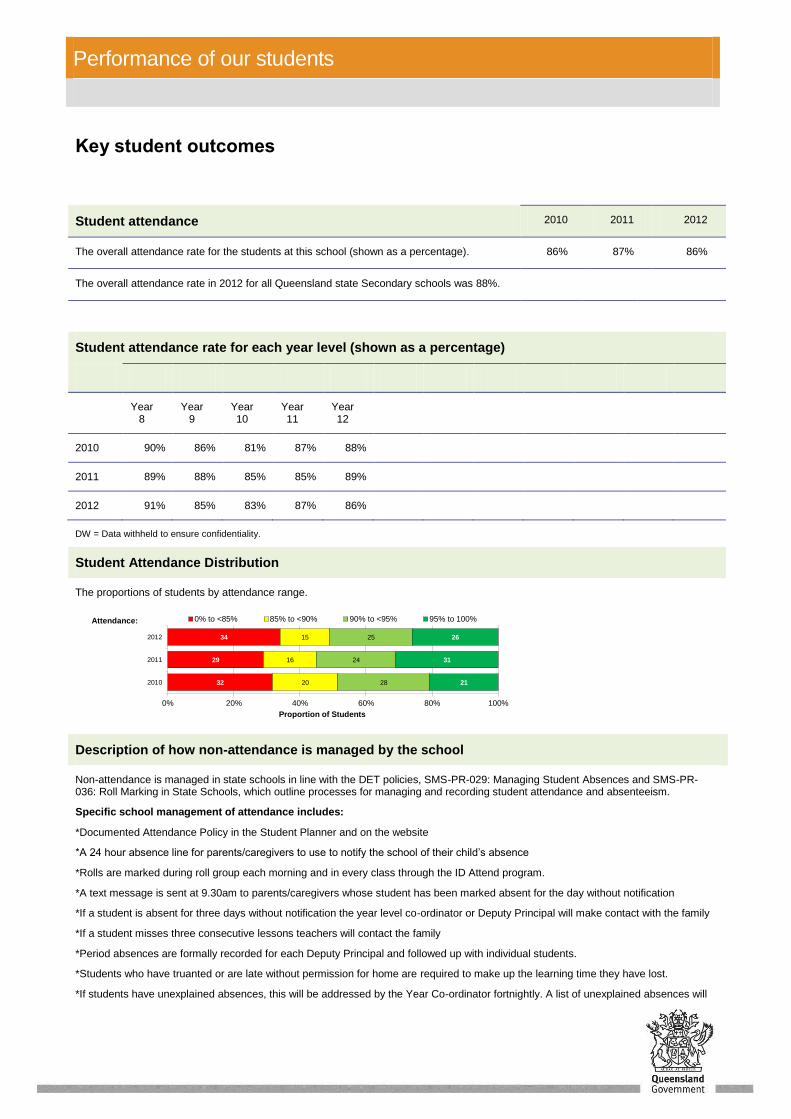
Student attendance 2010 2011 2012
The overall attendance rate for the students at this school (shown as a percentage). 86% 87% 86%
The overall attendance rate in 2012 for all Queensland state Secondary schools was 88%.
Student attendance rate for each year level (shown as a percentage)
Year 8
Year 9
Year 10
Year 11
Year 12
2010 90% 86% 81% 87% 88%
2011 89% 88% 85% 85% 89%
2012 91% 85% 83% 87% 86%
DW = Data withheld to ensure confidentiality.
Student Attendance Distribution
The proportions of students by attendance range.
32
29
34
20
16
15
28
24
25
21
31
26
0% 20% 40% 60% 80% 100%
2010
2011
2012
Proportion of Students
0% to <85% 85% to <90% 90% to <95% 95% to 100%Attendance:
Description of how non-attendance is managed by the school
Non-attendance is managed in state schools in line with the DET policies, SMS-PR-029: Managing Student Absences and SMS-PR-036: Roll Marking in State Schools, which outline processes for managing and recording student attendance and absenteeism.
Specific school management of attendance includes:
*Documented Attendance Policy in the Student Planner and on the website
*A 24 hour absence line for parents/caregivers to use to notify the school of their child’s absence
*Rolls are marked during roll group each morning and in every class through the ID Attend program.
*A text message is sent at 9.30am to parents/caregivers whose student has been marked absent for the day without notification
*If a student is absent for three days without notification the year level co-ordinator or Deputy Principal will make contact with the family
*If a student misses three consecutive lessons teachers will contact the family
*Period absences are formally recorded for each Deputy Principal and followed up with individual students.
*Students who have truanted or are late without permission for home are required to make up the learning time they have lost.
*If students have unexplained absences, this will be addressed by the Year Co-ordinator fortnightly. A list of unexplained absences will

Performance of our students
also be posted home to parents at the end of each term.
*Communication to the school community regarding “Every Day Counting’ through newsletter articles, electronic notice board and whole school and year level assemblies.
*Congratulatory letters home to students with 100% attendance record
*Compulsory schooling policy enacted if student’s absence is of concern.
National Assessment Program – Literacy and Numeracy (NAPLAN) results – our reading, writing, spelling, grammar and punctuation, and numeracy results for the Years 3, 5, 7 and 9. (The School
results below are available within OneSchool. For parents / caregivers who are provided with a printed School Annual Report, NAPLAN results must be attached.)
Our reading, writing, spelling, grammar and punctuation, and numeracy results for the Years 3, 5, 7 and 9 are available via the My School website at http://www.myschool.edu.au/.
To access our NAPLAN results, click on the My School link above. You will then be taken to the My School website with the following ‘Find a school’ text box.
Where it says ‘Search by school name’, type in the name of the school whose NAPLAN results you wish to view, and select <GO>.
Read and follow the instructions on the next screen; you will be asked to accept the Terms of Use and Privacy Policy before being able to access NAPLAN data.
If you are unable to access the internet, please contact the school for a paper copy of our school’s NAPLAN results.
Performance of our students
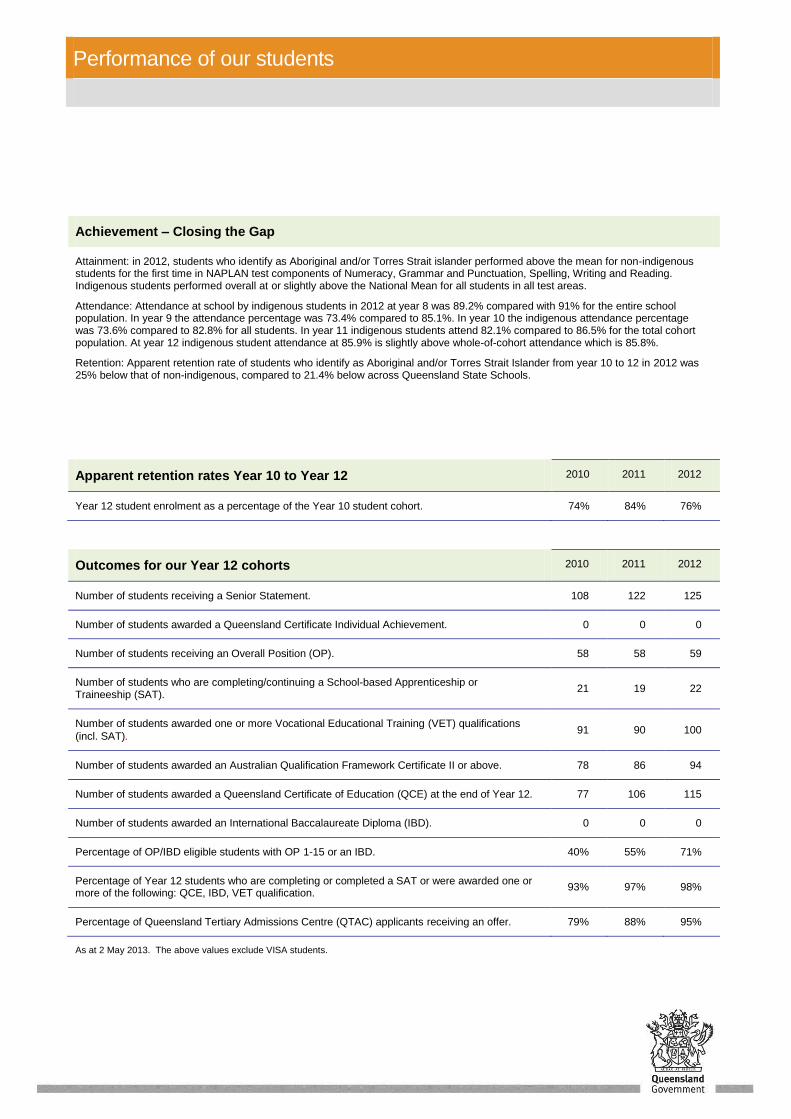
Achievement – Closing the Gap
Attainment: in 2012, students who identify as Aboriginal and/or Torres Strait islander performed above the mean for non-indigenous students for the first time in NAPLAN test components of Numeracy, Grammar and Punctuation, Spelling, Writing and Reading. Indigenous students performed overall at or slightly above the National Mean for all students in all test areas.
Attendance: Attendance at school by indigenous students in 2012 at year 8 was 89.2% compared with 91% for the entire school population. In year 9 the attendance percentage was 73.4% compared to 85.1%. In year 10 the indigenous attendance percentage was 73.6% compared to 82.8% for all students. In year 11 indigenous students attend 82.1% compared to 86.5% for the total cohort population. At year 12 indigenous student attendance at 85.9% is slightly above whole-of-cohort attendance which is 85.8%.
Retention: Apparent retention rate of students who identify as Aboriginal and/or Torres Strait Islander from year 10 to 12 in 2012 was 25% below that of non-indigenous, compared to 21.4% below across Queensland State Schools.
Apparent retention rates Year 10 to Year 12 2010 2011 2012
Year 12 student enrolment as a percentage of the Year 10 student cohort. 74% 84% 76%
Outcomes for our Year 12 cohorts 2010 2011 2012
Number of students receiving a Senior Statement. 108 122 125
Number of students awarded a Queensland Certificate Individual Achievement. 0 0 0
Number of students receiving an Overall Position (OP). 58 58 59
Number of students who are completing/continuing a School-based Apprenticeship or Traineeship (SAT).
21 19 22
Number of students awarded one or more Vocational Educational Training (VET) qualifications
(incl. SAT). 91 90 100
Number of students awarded an Australian Qualification Framework Certificate II or above. 78 86 94
Number of students awarded a Queensland Certificate of Education (QCE) at the end of Year 12. 77 106 115
Number of students awarded an International Baccalaureate Diploma (IBD). 0 0 0
Percentage of OP/IBD eligible students with OP 1-15 or an IBD. 40% 55% 71%
Percentage of Year 12 students who are completing or completed a SAT or were awarded one or more of the following: QCE, IBD, VET qualification.
93% 97% 98%
Percentage of Queensland Tertiary Admissions Centre (QTAC) applicants receiving an offer. 79% 88% 95%
As at 2 May 2013. The above values exclude VISA students.

Performance of our students
Overall Position Bands (OP)
Number of students in each Band for OP 1 to 25.
OP 1-5 OP 6-10 OP 11-15 OP 16-20 OP 21-25
2010 2 9 12 18 17
2011 4 12 16 16 10
2012 7 18 17 12 5
As at 2 May 2013. The above values exclude VISA students.
Vocational Educational Training qualification (VET)
Number of students awarded certificates under the Australian Qualification Framework (AQF).
Certificate I Certificate II Certificate III or above
2010 61 73 13
2011 43 84 9
2012 48 82 27
As at 2 May 2013. The above values exclude VISA students.
The three Certificate 1 courses undertaken by BBSC students include Work Readiness, Construction and Work Education.
Post-school destination information
At the time of publishing this School Annual Report, the results of the 2012 Year 12 cohort's post-school destinations survey, Next Step – Student Destination Report for the school were not available. Information about these post-school destinations of our students will be incorporated into this Report in September.
Early leavers information
The destinations of young people who left the school in Years 10, 11 and prior to completing Year 12.
Brisbane Bayside State College works with its community to ensure all students exit into a pathway. For some students this means exiting school before the completion of Year 12. These students are supported by our Guidance and student services staff who are assist them with transition arrangements. Our priority is ensuring students are placed in a program, work or at another educational facility if they leave prior to year 12.