british columbia lottery corporation service planbclc’s major lines of business (lottery and...
TRANSCRIPT

2017/18 – 2019/20 SERVICE PLAN
February 2017
For more information on BC Lottery Corporation (BCLC) contact:
74 West Seymour Street, Kamloops, B.C. V2C 1E2
250-828-5500
Email: [email protected]
or visit our website at www.bclc.com
BCLC
2017/18 – 2019/20 Service Plan 3
Accountability Statement
The 2017/18 - 2019/20 BCLC service plan was prepared under the Board’s direction in accordance with the Budget Transparency and Accountability Act and the BC Reporting Principles. The plan is consistent with government's strategic priorities and fiscal plan. The Board is accountable for the contents of the plan, including what has been included in the plan and how it has been reported. The Board is responsible for the validity and reliability of the information included in the plan.
All significant assumptions, policy decisions, events and identified risks, as of February 8, 2017 have been considered in preparing the plan. One outstanding risk that has not been recognized in the current service plan is the potential for a decrease in net income as BCLC transitions to a new commission structure in its Casino and Community Gaming division. The performance measures presented are consistent with the Taxpayer Accountability Principles, BCLC’s mandate and goals, and focus on aspects critical to the organization’s performance. The targets in this plan have been determined based on an assessment of BCLC’s operating environment, forecast conditions, risk assessment and past performance.
Bud Smith
Chair, Board of Directors
BCLC
2017/18 – 2019/20 Service Plan 4
Table of Contents
Accountability Statement ........................................................................................................................................................................................................................ 3
Strategic Direction and Context ................................................................................................................................................................................................... 5
Performance Plan ................................................................................................................................................................................................................................................ 7
Financial Plan ............................................................................................................................................................................................................................................................ 15 Summary Financial Outlook .......................................................................................................................................................................................................... 15
Major Capital Projects ............................................................................................................................................................................................................................ 18
Significant IT Projects ............................................................................................................................................................................................................................ 18
Appendices ................................................................................................................................................................................................................................................................... 19 Appendix A: Hyperlinks to Additional Information .................................................................................................................................. 19
Appendix B: Subsidiaries and Operating Segments ................................................................................................................................... 20
Appendix C: Operating Expense Breakdown ...................................................................................................................................................... 23
BCLC
2017/18 – 2019/20 Service Plan 5
Strategic Direction and Context Strategic Direction
Specific direction from Government to BCLC is provided in the 2017/18 Mandate Letter directing BCLC to take specific actions, in accordance with Government policy and directives, and the Taxpayer Accountability Principles. These principles and mandate form part of our strategic context and, along with economic and market trends, inform the business choices we make and ensure public interest is being served.
Specifically, in the Mandate Letter, the Government of B.C. has outlined four strategic actions, directing BCLC to: optimize our financial performance and sustain net return to the Province; submit bi-annual progress reports on the implementation of commitments BCLC is responsible for in the Plan for Public Health and Gambling; report on the implementation of the recommendations of the Crown Review; and provide a quarterly report on the implementation of the government’s Anti-Money Laundering Strategy.
BCLC’s unique nature as a Crown corporation requires that we continue to make smart, responsible investments to grow our business; while balancing our commitment to managing our operating costs in the best interest of the Province and the people of British Columbia and in accordance with the Taxpayer Accountability Principles.
Operating Environment Since 1998 and up until 2010, BCLC had been operating in a largely supply driven environment, where the market for gambling entertainment was undersupplied and hence revenue increased as supply was added. As of 2010, the supply gap has been largely filled and there has been a shift from a supply driven to a demand driven environment that requires BCLC to meet the demands and preferences of customers who now have a wide range of entertainment and gambling options to choose from. This shift to a demand driven environment is driving a critical need for innovation, challenging the status quo and requires investments in developing new products and services. Mature markets and relevance of our products to a changing player base
BCLC’s major lines of business (lottery and casino) are maturing and innovation will be critical to sustaining and growing revenues. We expect the industry to remain customer driven and dynamic, with impacts from many competitive and market forces. With fewer new distribution opportunities we will focus on customer relationship management, enhancing gambling facilities and amenities for our customers, and new product development. BCLC will also focus on leveraging and enhancing our online and mobile platforms to deliver a more tailored customer experience with relevant offerings.
Changing demographics and consumer expectations combined with increasing direct competition from other gambling entertainment options such as online gambling, fantasy sports and social gaming underscore the need for BCLC to continue to be agile and responsive to the marketplace. BCLC’s traditional bricks and mortar distribution channels are close to meeting existing market demand and our gambling product portfolio is facing declining relevance due to changing demographics and
BCLC
2017/18 – 2019/20 Service Plan 6
expectations. Our product mix is less relevant in particular to younger adults who have different expectations for entertainment and service based on the experiences they encounter elsewhere. Ensuring product relevance and a strong entertainment value proposition is critical to our future success. BCLC is focused on continuing to serve our core player’s expectations, attracting new players and increasing participation from light and casual player segments through the creation of new content and better integrating our digital and bricks and mortar experiences.
Evolving player expectations for new content and experiences
Driven largely by advances in technology, consumers are demanding more from the products, services and experiences they engage with. The line between physical and digital is blurring as demonstrated in the retail sector where retailers are leveraging the capabilities of both environments together with personalization to deliver a better experience for their customers. Trends in entertainment are changing as well where experiences related to social connectivity and competition are driving the entertainment choices for many. Mobile devices are providing a convenient outlet for those looking for the “quick escape” from their day whether they are at home or away. BCLC must embrace these changes and address player needs by investing in new content and delivering a seamless customer experience across channels and touchpoints. We must also continue to invest in our core products, for example LottoMax, Lotto 6/49 and our existing properties in order to meet and exceed our players’ expectations. A key aspect of a positive customer experience is minimizing any potential harms associated with the use of our products through the promotion of responsible gambling. Over-consumption of any product can potentially have harmful consequences to the consumer, which is why BCLC continues to invest in GameSense (https://gamesense.bclc.com/), the corporation’s communication platform for harm reduction and responsible gambling awareness. Competition for Talent The Government of B.C. is projecting that, starting in 2019, there will be a province-wide labour shortage and by 2022 there will be at least a 28,400 workforce deficit. Statistics Canada is also reporting a projected decrease in the unemployment rate nationally as the labour force participation rate decreases due to the ageing population. The Conference Board of Canada indicates that the most anticipated challenges for B.C. employers will be recruiting in the market for: • skilled trades • computer and information science • engineering and electronics • business and management
This means it will be a job-seeker’s market and successful employers will need to focus on retention and knowledge transfer as key internal strategies. BCLC must provide a competitive total rewards program that includes reward, recognition and developmental opportunities that meet both our
BCLC
2017/18 – 2019/20 Service Plan 7
workforce planning needs and individual career progression while being consistent with Government’s Taxpayer Accountability Principles and Public Sector Employers’ Council guidelines.
Performance Plan Goals, Strategies, Performance Measures and Targets
Goal 1: Player – we are creating an integrated player focused entertainment company.
Strategies
Reduce gambling related harm. BCLC is committed to reducing the negative health impacts our business may have on people and communities. To do so, we are evolving our approach to responsible gambling, changing our strategic focus from risk awareness to harm reduction. Across all our games, we focus on programming that encourages healthy gambling decisions, and we will continue to engage public health stakeholders to ensure that our programs reflect best practices in harm reduction and responsible gambling.
Improve the gambling entertainment experience with new content and enhanced facilities. A major focal point of our strategy is improving the gambling experience through new content. Content represents the entertainment experience that players seek when they engage with us and includes our games, amenities at our facilities and the relationships we have with our customers. BCLC will focus on a more detailed understanding of customer preferences, the entertainment industry and gambling trends to increase BCLC’s entertainment value. This understanding will allow us to make decisions on new content and the best way to engage our players in fun and entertaining experiences. We believe that enhancing the content we offer will be key to realizing our vision and serve as a catalyst for future growth. Improve customer relationships. We will build on the customer relationship management (CRM) foundation currently being implemented to optimize customer communications across email, mobile push and social touchpoints to engage in relevant, personalized conversations with our players. This will deliver customized and relevant BCLC promotions, content and service to players based on an improved understanding of interactions across all BCLC touchpoints. We will continue to enhance the services delivered through the customer support centre and embrace social responsibility in how we engage customers by integrating harm reduction strategies into our CRM approach. Optimize our points of distribution and simplify the way our players access and experience our products.
BCLC
2017/18 – 2019/20 Service Plan 8
We will continue to leverage investments in our digital and technology infrastructure to deliver exciting games and experiences to our players in our facilities and through our retailers. We will continue to ensure that current facilities are in the right locations and deliver the experiences our customers expect in order to capture the full potential of each facility. BCLC’s competitive advantage is that, unlike competitors who operate solely online or solely in bricks and mortar, we manage products and channels in retail, hospitality, casino, community gaming centres, web and mobile to create a customer entertainment experience. We will simplify the way players access and experience our products. Our objective is to enhance the gambling experience no matter where a player chooses to engage with our products.
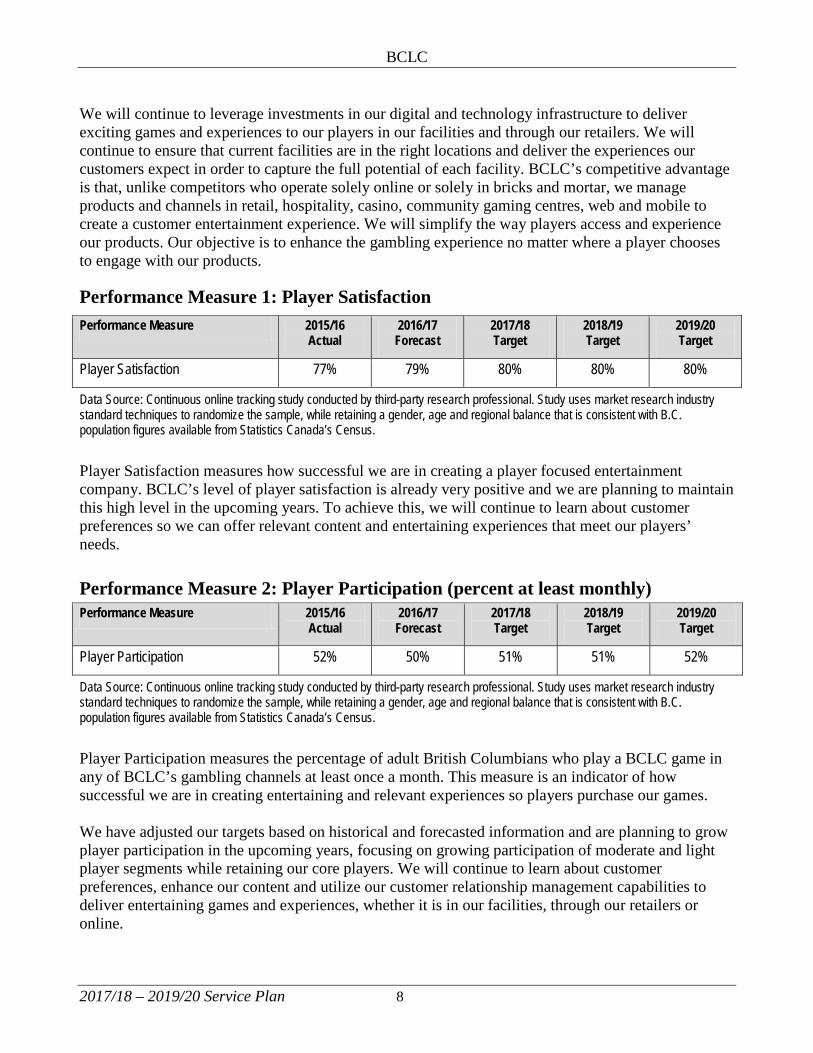
Performance Measure 1: Player Satisfaction Performance Measure 2015/16
Actual 2016/17
Forecast 2017/18 Target
2018/19 Target
2019/20 Target
Player Satisfaction 77% 79% 80% 80% 80%
Data Source: Continuous online tracking study conducted by third-party research professional. Study uses market research industry standard techniques to randomize the sample, while retaining a gender, age and regional balance that is consistent with B.C. population figures available from Statistics Canada’s Census.
Player Satisfaction measures how successful we are in creating a player focused entertainment company. BCLC’s level of player satisfaction is already very positive and we are planning to maintain this high level in the upcoming years. To achieve this, we will continue to learn about customer preferences so we can offer relevant content and entertaining experiences that meet our players’ needs.
Performance Measure 2: Player Participation (percent at least monthly) Performance Measure 2015/16
Actual 2016/17
Forecast 2017/18 Target
2018/19 Target
2019/20 Target
Player Participation 52% 50% 51% 51% 52%
Data Source: Continuous online tracking study conducted by third-party research professional. Study uses market research industry standard techniques to randomize the sample, while retaining a gender, age and regional balance that is consistent with B.C. population figures available from Statistics Canada’s Census.
Player Participation measures the percentage of adult British Columbians who play a BCLC game in any of BCLC’s gambling channels at least once a month. This measure is an indicator of how successful we are in creating entertaining and relevant experiences so players purchase our games. We have adjusted our targets based on historical and forecasted information and are planning to grow player participation in the upcoming years, focusing on growing participation of moderate and light player segments while retaining our core players. We will continue to learn about customer preferences, enhance our content and utilize our customer relationship management capabilities to deliver entertaining games and experiences, whether it is in our facilities, through our retailers or online.

BCLC
2017/18 – 2019/20 Service Plan 9
Performance Measure 3: Player Awareness of Responsible Gambling Activities Performance Measure 2015/16
Actual 2016/17
Forecast 2017/18 Target
2018/19 Target
2019/20 Target
Player Awareness of Responsible Gambling Activities 76% 76% 76% 76% 76%
Data Source: Continuous online tracking study conducted by third-party research professional. Study uses market research industry standard techniques to randomize the sample, while retaining a gender, age and regional balance that is consistent with B.C. population figures available from Statistics Canada’s Census.
BCLC is committed to promoting responsible gambling programs that encourage positive gambling choices. Player Awareness of Responsible Gambling Activities measures how effective we are at educating our players regarding responsible gambling tools and resources, so they can make informed choices. Although we are presently shifting resources from public awareness programs to harm reduction programs, we expect that awareness of responsible gambling activities will remain stable due to continued provision of information at the point of sale. Based on recommendations made in the Crown Review Report on BCLC and the Plan for Public Health and Gambling, we expect to introduce new measures of harm reduction in future service plans that better align with our harm reduction strategy.
Performance Measure 4: Net Win per Capita Performance Measure 2014/15
Benchmarks1 2015/16 Actual
2016/17 Forecast
2017/18 Target
2018/19 Target
2019/20 Target
Net Win per Capita BCLC: $482
LQ: $293 OLG: $344
$501 $500 $496 $497 $497
Data Source: Net win is from BCLC’s financial plan. B.C. population projections are from Statistics Canada (Table 052-0005). Actual population estimates are from Statistics Canada (Catalogue no. 91-215-X). 1. Benchmarks are calculated using figures from Ontario Lottery and Gaming (OLG) and Loto-Québec’s (LQ) fiscal 2014/15 financial
statements provided in their published annual reports.
Net Win per Capita tells us how successful we are in growing revenue in relation to the provincial population. Net win is calculated for lottery and bingo games by deducting prizes from gross sales. Casino game prizes are paid during game play. The net win is divided by B.C.’s total population based on publicly reported population figures to obtain per capita metrics. Population estimates and projections are updated annually.
Indexing to the total population allows us to benchmark to other jurisdictions, as the age at which legal gambling is permitted varies between jurisdictions. Net Win per Capita will not grow if the population rate of growth is higher than the projected rate of net win growth. Since this measure is widely used in the gambling industry, consistent benchmarking is possible. BCLC has consistently outperformed the benchmark organizations. B.C. has been successful in attracting tourism to our facilities contributing to our net win; however tourism is not considered part of the population counts for B.C.
BCLC
2017/18 – 2019/20 Service Plan 10
In 2015/16, BCLC’s Net Win per Capita increased over the previous year primarily due to net win generated from Big Lotto products as a result of the successful implementation of the increased Lotto Max jackpot cap to $60 million and a record number of large jackpots experienced for both Lotto Max and Lotto 6/49 products. Net win from these brands in the future years are expected to return to normalized levels as record number of large jackpots for these products are not expected to repeat.
Goal 2: People – we are building an engaged workforce and strong culture. We strive to demonstrate the value of our work by complying with a rigorous and standardized approach to performance management and employee compensation, consistent with Government’s Taxpayer Accountability Principles and other provincial Crown corporations in B.C. BCLC’s talent strategy provides a framework to guide the application of all aspects of our human resources practices. It is intended to achieve the outcome of “Our people and culture deliver exceptional business results”. The talent strategy provides the foundation to build organizational capacity and capability, while promoting a culture of service excellence focused on employee engagement.
Strategies
We hire and develop the right talent. BCLC must continue to focus on employee development and leadership in order to prepare for changing workforce demographics, and ensure BCLC has the right talent to deliver exceptional business results in an environment of changing demands and evolution of the business. We are developing a Strategic Workforce Plan to meet longer term business needs. This will be supported by enhancing leadership and employee development programs to support career progression opportunities. We attract, retain and engage through a competitive employee value proposition. For ten consecutive years BCLC has been selected as a top employer in British Columbia. Competition for qualified talent is strong and therefore we continue to pursue excellence in the programs, services and experiences we offer to our workforce. We are developing a diversity and inclusion strategy which will provide employees with the information and tools needed to create a more inclusive workplace, fostering greater innovation and customer focus.
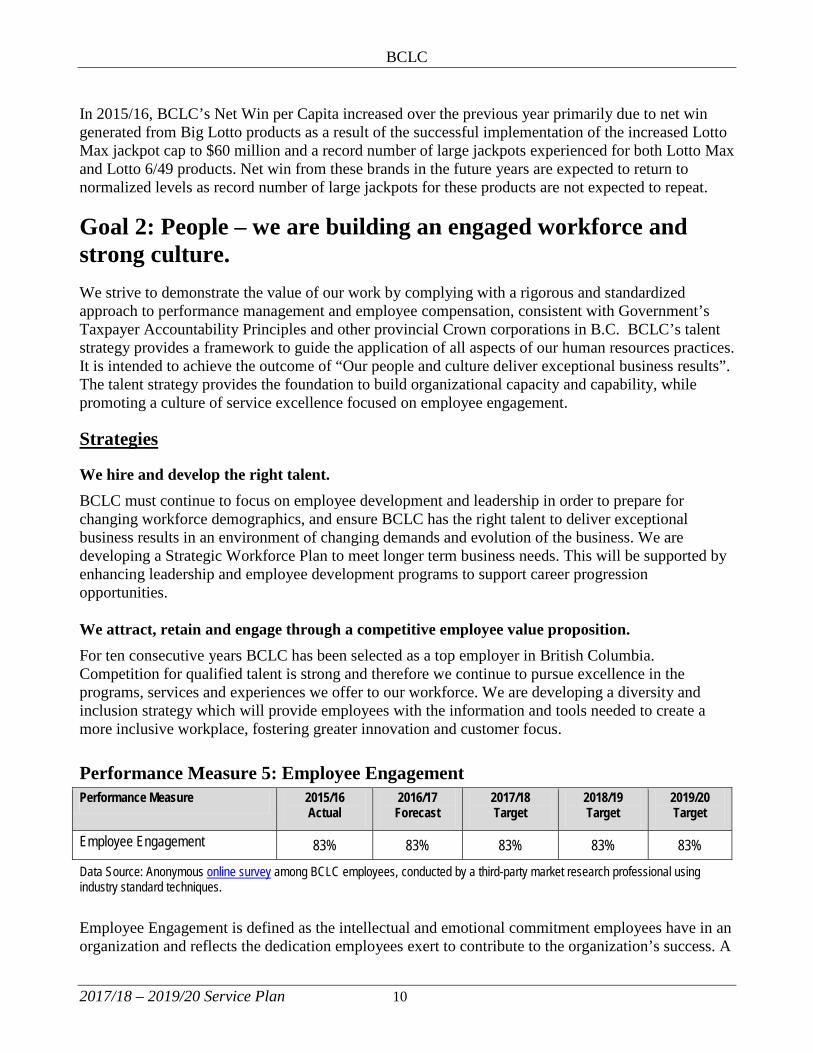
Performance Measure 5: Employee Engagement Performance Measure 2015/16
Actual 2016/17
Forecast 2017/18 Target
2018/19 Target
2019/20 Target
Employee Engagement 83% 83% 83% 83% 83%
Data Source: Anonymous online survey among BCLC employees, conducted by a third-party market research professional using industry standard techniques.
Employee Engagement is defined as the intellectual and emotional commitment employees have in an organization and reflects the dedication employees exert to contribute to the organization’s success. A
BCLC
2017/18 – 2019/20 Service Plan 11
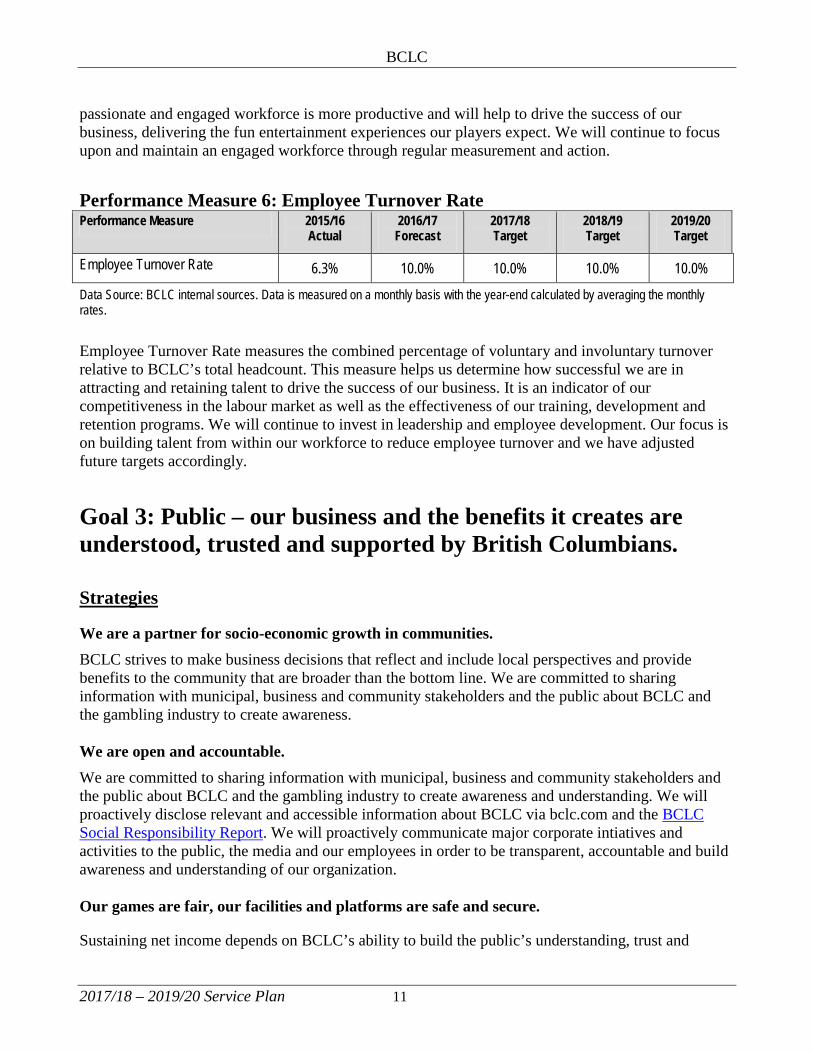
passionate and engaged workforce is more productive and will help to drive the success of our business, delivering the fun entertainment experiences our players expect. We will continue to focus upon and maintain an engaged workforce through regular measurement and action. Performance Measure 6: Employee Turnover Rate Performance Measure 2015/16
Actual 2016/17
Forecast 2017/18 Target
2018/19 Target
2019/20 Target
Employee Turnover Rate 6.3% 10.0% 10.0% 10.0% 10.0%
Data Source: BCLC internal sources. Data is measured on a monthly basis with the year-end calculated by averaging the monthly rates.
Employee Turnover Rate measures the combined percentage of voluntary and involuntary turnover relative to BCLC’s total headcount. This measure helps us determine how successful we are in attracting and retaining talent to drive the success of our business. It is an indicator of our competitiveness in the labour market as well as the effectiveness of our training, development and retention programs. We will continue to invest in leadership and employee development. Our focus is on building talent from within our workforce to reduce employee turnover and we have adjusted future targets accordingly.
Goal 3: Public – our business and the benefits it creates are understood, trusted and supported by British Columbians. Strategies
We are a partner for socio-economic growth in communities. BCLC strives to make business decisions that reflect and include local perspectives and provide benefits to the community that are broader than the bottom line. We are committed to sharing information with municipal, business and community stakeholders and the public about BCLC and the gambling industry to create awareness. We are open and accountable. We are committed to sharing information with municipal, business and community stakeholders and the public about BCLC and the gambling industry to create awareness and understanding. We will proactively disclose relevant and accessible information about BCLC via bclc.com and the BCLC Social Responsibility Report. We will proactively communicate major corporate intiatives and activities to the public, the media and our employees in order to be transparent, accountable and build awareness and understanding of our organization. Our games are fair, our facilities and platforms are safe and secure.
Sustaining net income depends on BCLC’s ability to build the public’s understanding, trust and
BCLC
2017/18 – 2019/20 Service Plan 12
support of our business by being a good corporate citizen, demonstrating integrity in what we deliver and how we deliver it, and being transparent in how we manage and conduct our business. It is paramount the public understands our products are fair and our facilities are safe.
We will continue to grow upon a best-in-class anti-money laundering (AML) program that will both continue to meet federal compliance regulations pertaining to the Proceeds of Crime (Money Laundering) and Terrorist Financing Act of Canada and also solidify the integrity of the gambling industry in B.C. We are committed to performing ongoing reviews of our AML and investigative policies and processes to ensure continuous improvement of the program.
We will continue to to support the Joint Illegal Gaming Investigation Team (JIGIT) whose objective is to disrupt organized crime and gang involvement in illegal gambling and prevent criminals from using B.C. gambling facilities who may seek to legalize the proceeds of crime.
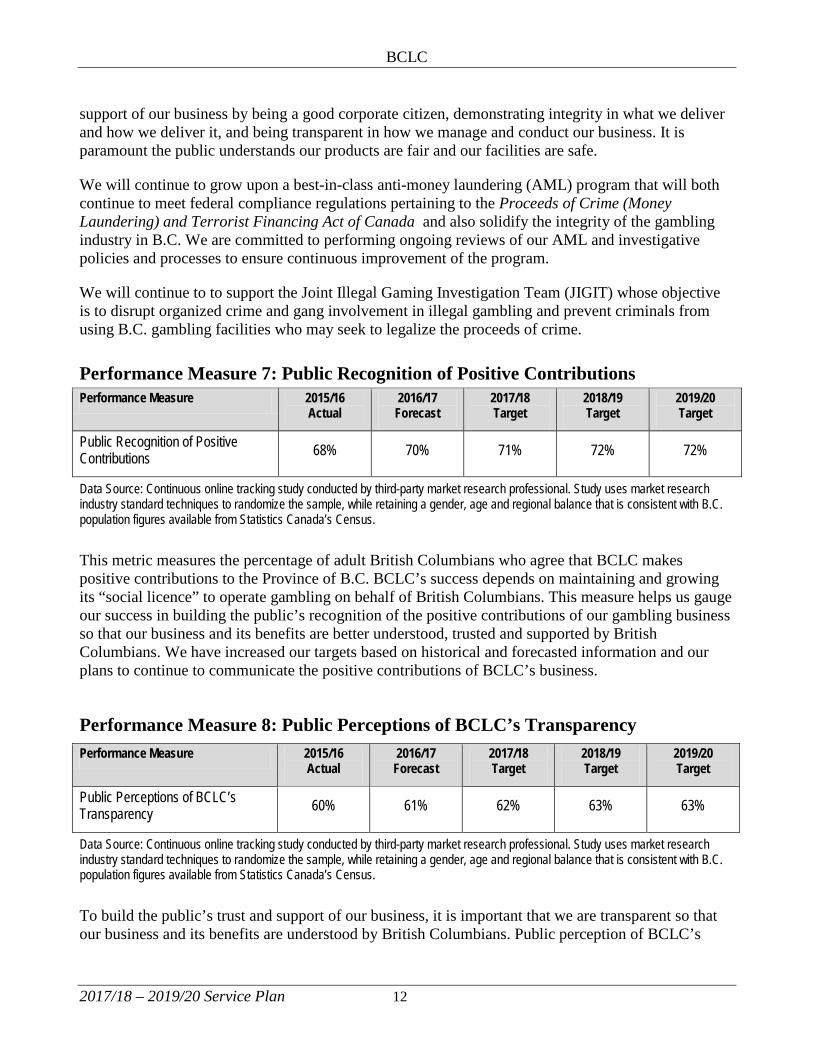
Performance Measure 7: Public Recognition of Positive Contributions Performance Measure 2015/16
Actual 2016/17
Forecast 2017/18 Target
2018/19 Target
2019/20 Target
Public Recognition of Positive Contributions 68% 70% 71% 72% 72%
Data Source: Continuous online tracking study conducted by third-party market research professional. Study uses market research industry standard techniques to randomize the sample, while retaining a gender, age and regional balance that is consistent with B.C. population figures available from Statistics Canada’s Census.
This metric measures the percentage of adult British Columbians who agree that BCLC makes positive contributions to the Province of B.C. BCLC’s success depends on maintaining and growing its “social licence” to operate gambling on behalf of British Columbians. This measure helps us gauge our success in building the public’s recognition of the positive contributions of our gambling business so that our business and its benefits are better understood, trusted and supported by British Columbians. We have increased our targets based on historical and forecasted information and our plans to continue to communicate the positive contributions of BCLC’s business.
Performance Measure 8: Public Perceptions of BCLC’s Transparency Performance Measure 2015/16
Actual 2016/17
Forecast 2017/18 Target
2018/19 Target
2019/20 Target
Public Perceptions of BCLC’s Transparency 60% 61% 62% 63% 63%
Data Source: Continuous online tracking study conducted by third-party market research professional. Study uses market research industry standard techniques to randomize the sample, while retaining a gender, age and regional balance that is consistent with B.C. population figures available from Statistics Canada’s Census.
To build the public’s trust and support of our business, it is important that we are transparent so that our business and its benefits are understood by British Columbians. Public perception of BCLC’s
BCLC
2017/18 – 2019/20 Service Plan 13
transparency helps us gauge our success in becoming increasingly open and forthcoming. We have increased our targets based on historical and forecasted information and our plans to become increasingly transparent. We will continue to act with integrity, be proactive in our communication about our business and engage with municipal, business and community stakeholders and the public.
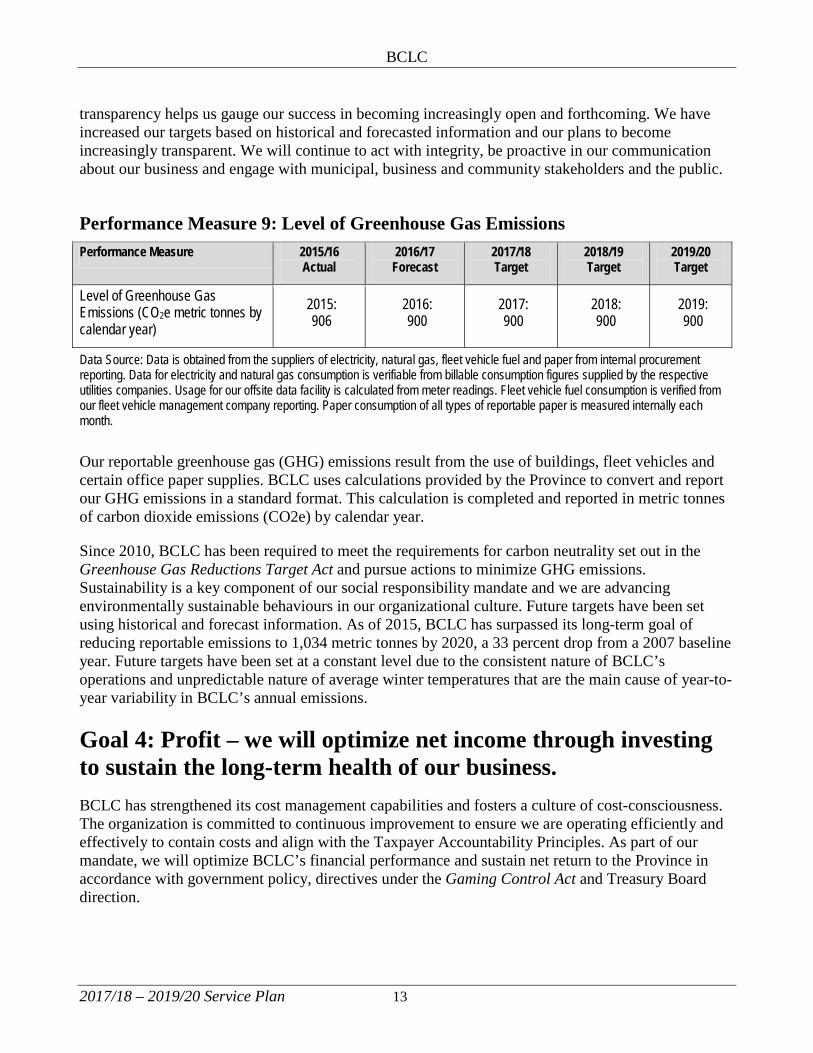
Performance Measure 9: Level of Greenhouse Gas Emissions Performance Measure 2015/16
Actual 2016/17
Forecast 2017/18 Target
2018/19 Target
2019/20 Target
Level of Greenhouse Gas Emissions (CO2e metric tonnes by calendar year)
2015: 906
2016: 900
2017: 900
2018: 900
2019: 900
Data Source: Data is obtained from the suppliers of electricity, natural gas, fleet vehicle fuel and paper from internal procurement reporting. Data for electricity and natural gas consumption is verifiable from billable consumption figures supplied by the respective utilities companies. Usage for our offsite data facility is calculated from meter readings. Fleet vehicle fuel consumption is verified from our fleet vehicle management company reporting. Paper consumption of all types of reportable paper is measured internally each month.
Our reportable greenhouse gas (GHG) emissions result from the use of buildings, fleet vehicles and certain office paper supplies. BCLC uses calculations provided by the Province to convert and report our GHG emissions in a standard format. This calculation is completed and reported in metric tonnes of carbon dioxide emissions (CO2e) by calendar year.
Since 2010, BCLC has been required to meet the requirements for carbon neutrality set out in the Greenhouse Gas Reductions Target Act and pursue actions to minimize GHG emissions. Sustainability is a key component of our social responsibility mandate and we are advancing environmentally sustainable behaviours in our organizational culture. Future targets have been set using historical and forecast information. As of 2015, BCLC has surpassed its long-term goal of reducing reportable emissions to 1,034 metric tonnes by 2020, a 33 percent drop from a 2007 baseline year. Future targets have been set at a constant level due to the consistent nature of BCLC’s operations and unpredictable nature of average winter temperatures that are the main cause of year-to-year variability in BCLC’s annual emissions. Goal 4: Profit – we will optimize net income through investing to sustain the long-term health of our business. BCLC has strengthened its cost management capabilities and fosters a culture of cost-consciousness. The organization is committed to continuous improvement to ensure we are operating efficiently and effectively to contain costs and align with the Taxpayer Accountability Principles. As part of our mandate, we will optimize BCLC’s financial performance and sustain net return to the Province in accordance with government policy, directives under the Gaming Control Act and Treasury Board direction.

BCLC
2017/18 – 2019/20 Service Plan 14
Strategies
Define and integrate the innovative experiences our players want. We will leverage investments in the PlayNow.com infrastructure to provide the digital connection with our bricks and mortar environment in order to create a better player experience.We continue to monitor consumer trends so that we can deliver relevant products and experiences that meet player expectations and provide value for money. With player understanding as a cornerstone and working with best-in-class partners, we will continue to invest in content innovation to deliver engaging gambling experiences to our players and grow net income in a socially responsible manner.
Improve operational efficiency and effectiveness We will continue to manage the business in alignment with government direction, including the Taxpayer Accountability Principles, which are reflected in its performance framework. We will implement a new performance framework to better enable leaders to effectively manage the business while linking organizational goals to divisions.
Performance Measure 10: Net Income Performance Measure 2015/16
Actual 2016/17
Forecast 2017/18 Target
2018/19 Target
2019/20 Target
Net Income (millions) 1,313.5 1,314.5 1,294.3 1,311.3 1,324.6 Data Source: BCLC’s financial plan, see next page.
Net Income is the total amount of income generated by BCLC and delivered to the Province and benefits all British Columbians by funding public health care, education and charitable community programs. Actual results are calculated in accordance with International Financial Reporting Standards (IFRS). This measure is a direct indicator of our success in meeting our mandate to generate net income for the benefit of all British Columbians.
Performance Measure 11: Comprehensive Cost Ratio Performance Measure 2015/16
Actual 2016/17
Forecast 2017/18 Target
2018/19 Target
2019/20 Target
Comprehensive Cost Ratio (% of Net Win)
42.0 % 42.5 % 43.4 % 43.5 % 43.6 %
Data Source: BCLC’s financial plan, see next page.
The Comprehensive Cost Ratio is the sum of direct, gaming support, operating, amortization and other costs (excluding taxes) divided by net win and expressed as a percentage. Cost ratios are used to gauge operational efficiency.
The Comprehensive Cost Ratio is sensitive to shifts in product mix since direct costs such as retailer and service provider commission rates comprise the majority of the comprehensive cost base and commission rates vary by product category. Future year targets incorporate the impact of expected product mix shifts on our Comprehensive Cost Ratio.
BCLC
2017/18 – 2019/20 Service Plan 15
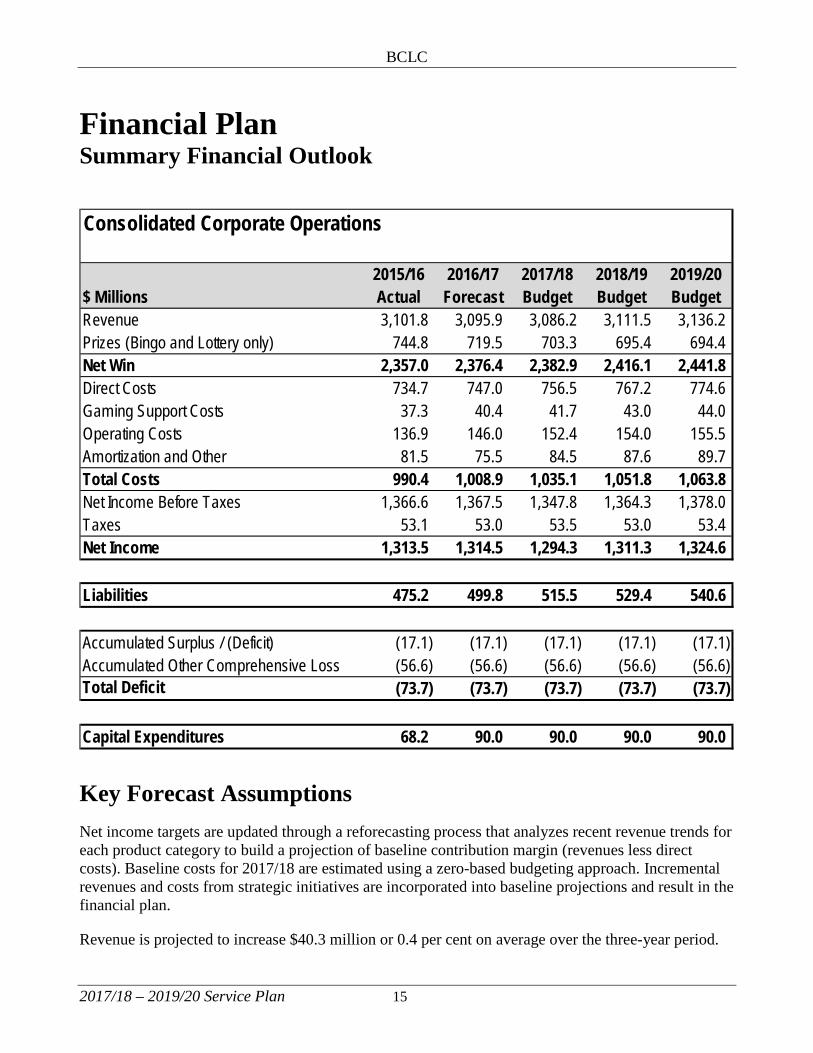
Financial Plan Summary Financial Outlook
Key Forecast Assumptions Net income targets are updated through a reforecasting process that analyzes recent revenue trends for each product category to build a projection of baseline contribution margin (revenues less direct costs). Baseline costs for 2017/18 are estimated using a zero-based budgeting approach. Incremental revenues and costs from strategic initiatives are incorporated into baseline projections and result in the financial plan.
Revenue is projected to increase $40.3 million or 0.4 per cent on average over the three-year period.
Consolidated Corporate Operations
2015/16 2016/17 2017/18 2018/19 2019/20$ Millions Actual Forecast Budget Budget BudgetRevenue 3,101.8 3,095.9 3,086.2 3,111.5 3,136.2 Prizes (Bingo and Lottery only) 744.8 719.5 703.3 695.4 694.4 Net Win 2,357.0 2,376.4 2,382.9 2,416.1 2,441.8 Direct Costs 734.7 747.0 756.5 767.2 774.6 Gaming Support Costs 37.3 40.4 41.7 43.0 44.0 Operating Costs 136.9 146.0 152.4 154.0 155.5 Amortization and Other 81.5 75.5 84.5 87.6 89.7 Total Costs 990.4 1,008.9 1,035.1 1,051.8 1,063.8 Net Income Before Taxes 1,366.6 1,367.5 1,347.8 1,364.3 1,378.0 Taxes 53.1 53.0 53.5 53.0 53.4 Net Income 1,313.5 1,314.5 1,294.3 1,311.3 1,324.6
Liabilities 475.2 499.8 515.5 529.4 540.6
Accumulated Surplus / (Deficit) (17.1) (17.1) (17.1) (17.1) (17.1)Accumulated Other Comprehensive Loss (56.6) (56.6) (56.6) (56.6) (56.6)Total Deficit (73.7) (73.7) (73.7) (73.7) (73.7)
Capital Expenditures 68.2 90.0 90.0 90.0 90.0

BCLC
2017/18 – 2019/20 Service Plan 16
Due to an expected shift in product mix, with lottery and bingo comprising a lower share of the mix, prizes are estimated to decrease by $25.1 million or 1.2 per cent on average over the three-year period. Net win, which is revenue after prizes paid, is projected to increase by $65.4 million or 0.9 per cent on average over the three-year period.
Direct costs include private sector service provider and retailer commissions, lottery ticket and bingo paper printing, supplies and leases. These are driven by revenue projections of each product category. Direct costs are forecasted to increase $27.6 million or 1.2 per cent on average over the three-year period.
Gaming support costs are expenses that support revenue generation including systems support, data transmission, equipment installation and maintenance, product delivery, sports odds-setting and internet-based software licence and service fees. These costs are projected to increase by $3.6 million or 2.9 per cent on average over the three-year period. Costs in this area are forecasted to increase in line with industry trends as BCLC continues to make investments in technology to sustain and enhance core systems that support our player experiences. Also, systems support costs associated with maintaining our online and mobile-enabled gambling site, PlayNow.com, are expected to rise to keep pace with upgrades to our players’ desktop operating systems, browsers, security systems and mobile devices.
Operating costs include marketing investment, staffing costs, research and development, professional fees, rent, equipment and goods, communications and financial costs. Operating costs are projected to increase by $9.5 million or 2.1 per cent on average over the three-year period to support and sustain continued year over year growth in net win.
BCLC is expecting to exceed its net income target for the year ended March 31, 2017 due to strong performance in the slot and eGaming business, partially offset by the volatility of the national lotto and high-limit table business.
Sensitivity Analysis As indicated above, the business planning process involves a thorough analysis of revenue trends by product category to determine baseline organic growth assumptions. Incremental revenue is added from new and strategic initiatives. As a result, the three-year plan is sensitive to changes in sales mix along with risks associated with future initiatives, such as execution risk, market acceptance and success of new products and facilities.
Below is a table outlining the sensitivities at a net win level given the above factors.

BCLC
2017/18 – 2019/20 Service Plan 17
Management Perspective on Future Financial Outlook Delivering on our net income commitments to Government continues to be challenging given market conditions and trends. The overall gambling industry in B.C. is at a mature stage with stable net income and a modest growth outlook.
Our two major business units (lottery and casino) are mature and face market saturation. Revenues are flattening and margins are sensitive to shifts in product mix. Lottery revenues are heavily dependent on the national games’ jackpot rolls, resulting in lottery revenue volatility. As well, revenues from these business units rely predominantly on a core, aging player base.
BCLC’s gambling products are mature and we depend heavily on their performance, with the core six products (Slots, Tables, Lotto Max, Lotto 6/49, Keno, and Scratch & Win) making up more than 90 per cent of our total contribution margin (revenue less prizes and direct costs).
The projections presented above position BCLC to continue our focus on innovation to retain our existing players by supporting and enhancing existing products and to broaden our player base and engage new demographics of players by developing new content and experiences. These opportunities take time and investment before we will realize net income growth but are necessary to ensure the long-term health of our business.
BCLC is committed to managing our business responsibly in this ever-evolving environment. Investment decisions must carefully consider return, risk, expected benefits, the size of the investment required and our commitments for future net income. We are continually managing costs and looking for ways to operate our business more efficiently and effectively.
High Low High Low High Low
Net Win Target 2,383 2,383 2,416 2,416 2,442 2,442
Forecast Risks and Sensitivities1% change in Slot Growth Assumption 13 (13) 13 (13) 13 (13) Volatility in High Limit Table play (30) (30) (30) Market adoption/success of new initiatives (19) (33) (38)
Net Win Risk Adjusted 2,396 2,321 2,429 2,340 2,455 2,362
2017/18 2018/19 2019/20
BCLC
2017/18 – 2019/20 Service Plan 18
Major Capital Projects Currently there are no major capital projects (over $50 million) approved through our business planning process.
Kamloops Head Office Property Development
BCLC’s head office in Kamloops is over 50 years old and requires significant upgrades and maintenance. Avison Young (Commercial Real Estate Advisor) has been hired to assist in determining the next steps for the Kamloops head office property development including the evaluation of building needs and business requirements, as well as assisting with the request for quote and request for proposal processes. As the project is currently in the requirements gathering stage, an estimate cannot be reasonably determined at this time and accordingly, is not included in the capital expenditure projections.
Significant IT Projects
Lottery Terminal Replacement
This project involves the replacement of equipment identified as high risk as it is near its anticipated end-of-life and the majority of lottery revenue relies on this critical equipment. Management identified this project as a priority and this was further supported by Government in the 2014/15 Crown Review of BCLC which recommended replacement of key legacy systems. A request for proposal to identify a vendor is currently underway. The best capital cost estimate available at this time is approximately $45M over the next three fiscal years and it is estimated to be complete in 2019/20.
BCLC
2017/18 – 2019/20 Service Plan 19
Appendix A: Hyperlinks to Additional Information
Corporate Governance • Governance and Oversight • BCLC Senior Executive
The Board governance information on the corporation’s website includes all information required by the Board Resourcing and Development Office's board governance disclosure requirements.
Organizational Overview
• Mission and Values • Who we are • What we do • Customer support

BCLC
2017/18 – 2019/20 Service Plan 20
Appendix B: Subsidiaries and Operating Segments
Active Subsidiaries The consolidated financial statements of BCLC include a wholly-owned subsidiary, B.C. Lottotech International Inc. (“Lottotech”). The primary purpose of Lottotech is to purchase capital assets for BCLC. These assets are leased back to BCLC and the major expense is the amortization on the capital acquisitions. The management and oversight of Lottotech is consolidated within BCLC operations and the Board reviews and approves capital budgets through the business planning process. All BCLC capital expenditures (refer to Financial Plan) are planned to be purchased through Lottotech, the only exception being employee costs related to developing assets or attributable to preparing the asset for its intended use. Lottotech adheres to the Taxpaper Accountability Principles and business activites are in alignment with BCLC’s mandate, strategic priorities and fiscal plan.
Lottotech’s publicly available financial statements can be found in BCLC’s Annual Service Plan Report.
2015/16 2016/17 2017/18 2018/19 2019/20$ Millions Actual Forecast Budget Budget BudgetRevenues 65.6 61.9 67.7 70.4 72.2
Expenses 65.5 61.7 67.5 70.2 72.0
Income from Operations 0.1 0.2 0.2 0.2 0.2
Other Income (Expenses) (1.2) 0.4 0.4 0.4 0.4
0.6 Net Income (1.1) 0.6 0.6 0.6

BCLC
2017/18 – 2019/20 Service Plan 21
Business Units’ Income Statements Summary Financial Outlook
Actual Projection$ millions 2015/16 2016/17 2017/18 2018/19 2019/20
LotteryRevenue 1,151.7 1,088.2 1,049.3 1,031.9 1,027.5 Prizes 651.8 622.3 601.0 590.2 587.5 Net win 499.9 465.9 448.3 441.7 440.0 Less: direct expenses 84.4 81.5 80.2 79.0 78.9
415.5 384.4 368.1 362.7 361.1 Operating expenses:
General Operating 42.3 43.8 44.2 44.5 44.8 Gaming Support 13.8 13.9 14.0 14.4 14.6 Amortization 11.5 9.6 10.7 14.3 18.4 Other 2.1 1.1 1.4 1.4 1.4
69.7 68.4 70.3 74.6 79.2 Net Income Before Taxes 345.8 316.0 297.8 288.1 281.9
Taxes 11.0 11.5 11.3 11.4 11.7 Net income 334.8 304.5 286.5 276.7 270.2
e-GamingRevenue 135.5 152.6 172.4 190.1 198.9 Prizes 46.3 50.8 58.4 62.4 65.2 Net win 89.2 101.8 114.0 127.7 133.7 Less: direct expenses 14.5 17.9 22.6 25.3 26.4
74.7 83.9 91.4 102.4 107.3 Operating expenses:
General Operating 18.2 11.4 13.0 13.1 13.2 Gaming Support 9.0 9.5 9.9 10.6 11.3 Amortization 7.5 6.1 5.3 4.7 3.6 Other 1.1 0.5 0.8 0.8 0.8
35.8 27.5 29.0 29.2 28.9 Net Income Before Taxes 38.9 56.4 62.4 73.2 78.4
Taxes 4.4 3.4 3.8 3.2 3.2 Net income 34.5 53.0 58.6 70.0 75.2
Casino & Community GamingRevenue 1,814.6 1,855.1 1,864.5 1,889.5 1,909.8 Prizes 46.7 46.4 43.9 42.8 41.7 Net win 1,767.9 1,808.7 1,820.6 1,846.7 1,868.1 Less: direct expenses 635.8 647.6 653.7 662.9 669.3
1,132.1 1,161.1 1,166.9 1,183.8 1,198.8 Operating expenses:
General Operating 76.4 90.8 95.2 96.4 97.5 Gaming Support 14.5 17.0 17.8 18.0 18.1 Amortization 54.7 52.8 59.0 59.0 58.0 Other 4.6 5.4 7.3 7.4 7.5
150.2 166.0 179.3 180.8 181.1 Net Income Before Taxes 981.9 995.1 987.6 1,003.0 1,017.7
Taxes 37.7 38.1 38.4 38.4 38.5 Net income 944.2 957.0 949.2 964.6 979.2
Projections
BCLC
2017/18 – 2019/20 Service Plan 22
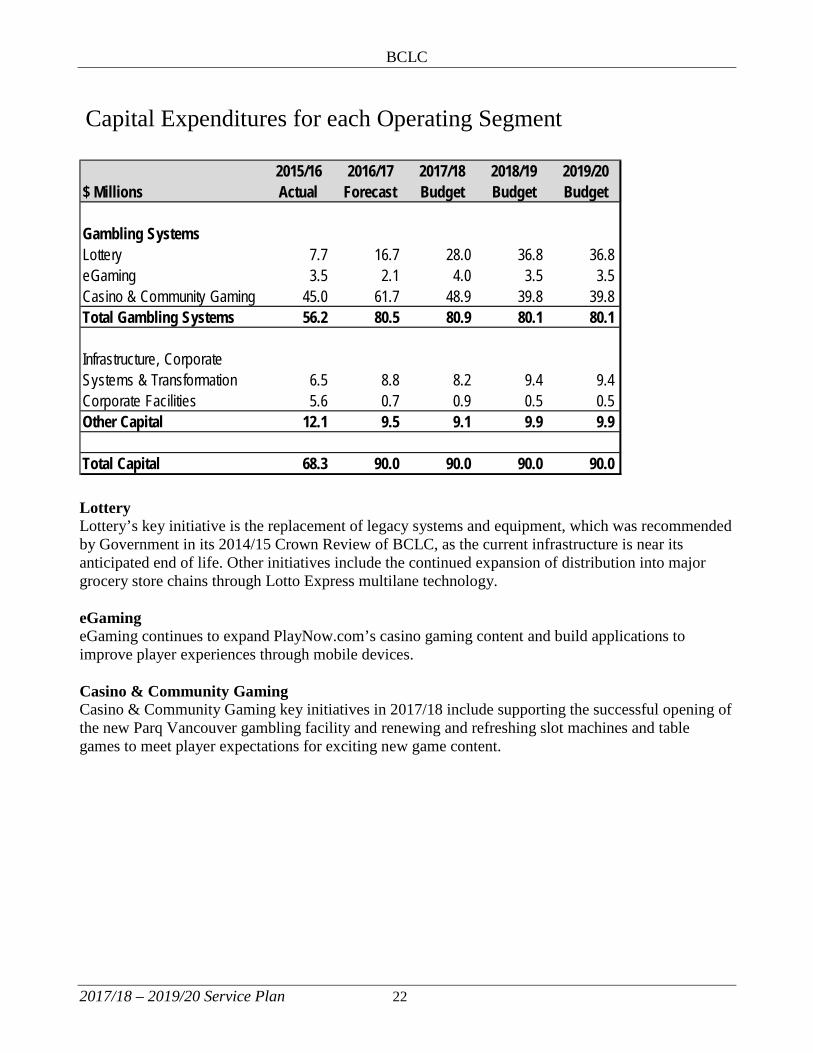
Capital Expenditures for each Operating Segment
Lottery Lottery’s key initiative is the replacement of legacy systems and equipment, which was recommended by Government in its 2014/15 Crown Review of BCLC, as the current infrastructure is near its anticipated end of life. Other initiatives include the continued expansion of distribution into major grocery store chains through Lotto Express multilane technology. eGaming eGaming continues to expand PlayNow.com’s casino gaming content and build applications to improve player experiences through mobile devices. Casino & Community Gaming Casino & Community Gaming key initiatives in 2017/18 include supporting the successful opening of the new Parq Vancouver gambling facility and renewing and refreshing slot machines and table games to meet player expectations for exciting new game content.
2015/16 2016/17 2017/18 2018/19 2019/20$ Millions Actual Forecast Budget Budget Budget
Gambling SystemsLottery 7.7 16.7 28.0 36.8 36.8 eGaming 3.5 2.1 4.0 3.5 3.5 Casino & Community Gaming 45.0 61.7 48.9 39.8 39.8 Total Gambling Systems 56.2 80.5 80.9 80.1 80.1
Infrastructure, Corporate Systems & Transformation 6.5 8.8 8.2 9.4 9.4 Corporate Facilities 5.6 0.7 0.9 0.5 0.5 Other Capital 12.1 9.5 9.1 9.9 9.9
Total Capital 68.3 90.0 90.0 90.0 90.0

BCLC
2017/18 – 2019/20 Service Plan 23
Appendix C: Operating Expense Breakdown
Total Expenditures Total expenditures for fiscal 2017/18 are projected at $1.8 billion.
Data Source: BCLC’s financial plan, refer to page 15. Operating Costs Breakdown
Data Source: BCLC’s financial plan, refer to page 15.