broad market bond index fund
TRANSCRIPT
ML_27 Page 1 of 162
Broad Market Bond Index Fund ....................................................................................................................................................................................................................................................................................................................................................................................................................................................................................................................................................................................................................................................................................BenchmarkBBgBarc US Agg Bond TR USD
Overall Morningstar Rating™ Morningstar Return Morningstar Risk
QQQ Average Above AverageRated against 902 Intermediate-Term Bond funds.
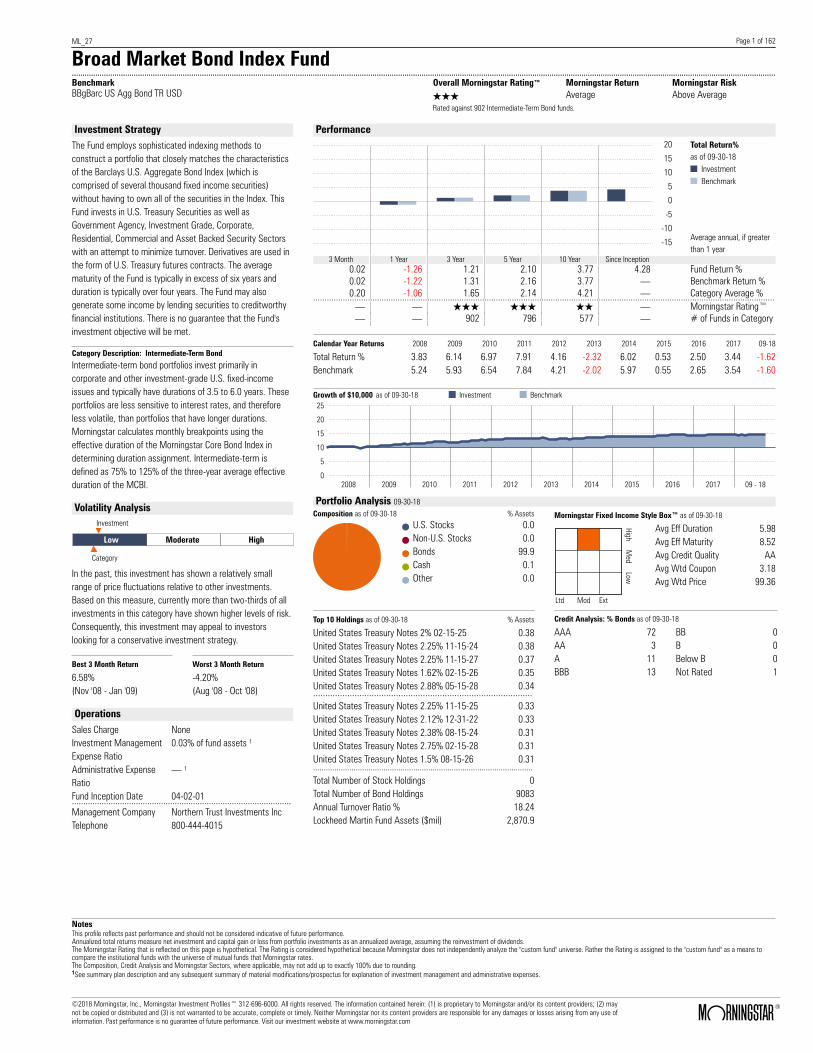
Investment StrategyThe Fund employs sophisticated indexing methods to construct a portfolio that closely matches the characteristics of the Barclays U.S. Aggregate Bond Index (which is comprised of several thousand fixed income securities) without having to own all of the securities in the Index. This Fund invests in U.S. Treasury Securities as well as Government Agency, Investment Grade, Corporate, Residential, Commercial and Asset Backed Security Sectors with an attempt to minimize turnover. Derivatives are used in the form of U.S. Treasury futures contracts. The average maturity of the Fund is typically in excess of six years and duration is typically over four years. The Fund may also generate some income by lending securities to creditworthy financial institutions. There is no guarantee that the Fund's investment objective will be met.
Category Description: Intermediate-Term Bond
Intermediate-term bond portfolios invest primarily incorporate and other investment-grade U.S. fixed-incomeissues and typically have durations of 3.5 to 6.0 years. Theseportfolios are less sensitive to interest rates, and thereforeless volatile, than portfolios that have longer durations.Morningstar calculates monthly breakpoints using theeffective duration of the Morningstar Core Bond Index indetermining duration assignment. Intermediate-term isdefined as 75% to 125% of the three-year average effectiveduration of the MCBI.
Volatility Analysis
Low Moderate High
Investment
Category
In the past, this investment has shown a relatively smallrange of price fluctuations relative to other investments.Based on this measure, currently more than two-thirds of allinvestments in this category have shown higher levels of risk.Consequently, this investment may appeal to investorslooking for a conservative investment strategy.
Best 3 Month Return Worst 3 Month Return
6.58% -4.20%(Nov '08 - Jan '09) (Aug '08 - Oct '08)
OperationsSales Charge NoneInvestment ManagementExpense Ratio
0.03% of fund assets ¹
Administrative ExpenseRatio
. ¹
Fund Inception Date 04-02-01................................................................................................Management Company Northern Trust Investments IncTelephone 800-444-4015
Performance
5
10
15
20
0
-5
-10
-15
YTD YTD YTD YTD YTD YTD
Total Return%as of 09-30-18
InvestmentBenchmark
Average annual, if greaterthan 1 year
3 Month 1 Year 3 Year 5 Year 10 Year Since Inception0.02 -1.26 1.21 2.10 3.77 4.28 Fund Return %0.02 -1.22 1.31 2.16 3.77 . Benchmark Return %0.20 -1.06 1.65 2.14 4.21 . Category Average %........................................................................................................................................................................................................... . QQQ QQQ QQ . Morningstar Rating™. . 902 796 577 . # of Funds in Category
Calendar Year Returns 2008 2009 2010 2011 2012 2013 2014 2015 2016 2017 09-18
Total Return % 3.83 6.14 6.97 7.91 4.16 -2.32 6.02 0.53 2.50 3.44 -1.62Benchmark 5.24 5.93 6.54 7.84 4.21 -2.02 5.97 0.55 2.65 3.54 -1.60
Growth of $10,000 as of 09-30-18 Investment Benchmark
2008 2009 2010 2011 2012 2013 2014 2015 2016 2017 09 - 18
25
20
15
10
5
0
Portfolio Analysis 09-30-18
Composition as of 09-30-18 % AssetsU.S. Stocks 0.0Non-U.S. Stocks 0.0Bonds 99.9Cash 0.1Other 0.0
Morningstar Fixed Income Style Box™ as of 09-30-18
HighM
edLow
Ltd Mod Ext
Avg Eff Duration 5.98Avg Eff Maturity 8.52Avg Credit Quality AAAvg Wtd Coupon 3.18Avg Wtd Price 99.36
Top 10 Holdings as of 09-30-18 % Assets
United States Treasury Notes 2% 02-15-25 0.38United States Treasury Notes 2.25% 11-15-24 0.38United States Treasury Notes 2.25% 11-15-27 0.37United States Treasury Notes 1.62% 02-15-26 0.35United States Treasury Notes 2.88% 05-15-28 0.34..........................................................................................United States Treasury Notes 2.25% 11-15-25 0.33United States Treasury Notes 2.12% 12-31-22 0.33United States Treasury Notes 2.38% 08-15-24 0.31United States Treasury Notes 2.75% 02-15-28 0.31United States Treasury Notes 1.5% 08-15-26 0.31.......................................................................................................Total Number of Stock Holdings 0Total Number of Bond Holdings 9083Annual Turnover Ratio % 18.24Lockheed Martin Fund Assets ($mil) 2,870.9
Credit Analysis: % Bonds as of 09-30-18
AAA 72 BB 0AA 3 B 0A 11 Below B 0BBB 13 Not Rated 1
NotesThis profile reflects past performance and should not be considered indicative of future performance.Annualized total returns measure net investment and capital gain or loss from portfolio investments as an annualized average, assuming the reinvestment of dividends.The Morningstar Rating that is reflected on this page is hypothetical. The Rating is considered hypothetical because Morningstar does not independently analyze the "custom fund" universe. Rather the Rating is assigned to the "custom fund" as a means tocompare the institutional funds with the universe of mutual funds that Morningstar rates.The Composition, Credit Analysis and Morningstar Sectors, where applicable, may not add up to exactly 100% due to rounding.1See summary plan description and any subsequent summary of material modifications/prospectus for explanation of investment management and administrative expenses.
©2018 Morningstar, Inc., Morningstar Investment Profiles™ 312-696-6000. All rights reserved. The information contained herein: (1) is proprietary to Morningstar and/or its content providers; (2) maynot be copied or distributed and (3) is not warranted to be accurate, complete or timely. Neither Morningstar nor its content providers are responsible for any damages or losses arising from any use ofinformation. Past performance is no guarantee of future performance. Visit our investment website at www.morningstar.com ß
®

Page 2 of 162
Broad Market Bond Index Fund.......................................................................................................................................................................................................................................................................................................................................
Total Stocks Total Bonds Total Cash0 9083 28
Bond Portfolio Analysis as of 09-30-18Security Name Net Assets % Market Value $ Amount $ Maturity Date
United States Treasury Notes 2% 0.38 32,464,307 34,470,599 2025-02-15United States Treasury Notes 2.25% 0.38 32,090,040 33,485,725 2024-11-15United States Treasury Notes 2.25% 0.37 31,496,817 33,649,871 2027-11-15United States Treasury Notes 1.62% 0.35 29,567,732 32,582,924 2026-02-15United States Treasury Notes 2.88% 0.34 29,100,730 29,546,228 2028-05-15................................................................................................................................................................................................................................................................................................United States Treasury Notes 2.25% 0.33 27,927,904 29,382,082 2025-11-15United States Treasury Notes 2.12% 0.33 27,554,815 28,479,281 2022-12-31United States Treasury Notes 2.38% 0.31 26,527,348 27,432,852 2024-08-15United States Treasury Notes 2.75% 0.31 26,405,885 27,084,042 2028-02-15United States Treasury Notes 1.5% 0.31 26,088,432 29,217,936 2026-08-15................................................................................................................................................................................................................................................................................................United States Treasury Notes 2% 0.31 25,995,989 27,740,625 2025-08-15United States Treasury Notes 1.5% 0.30 25,607,800 25,935,022 2019-10-31United States Treasury Notes 2.5% 0.30 25,533,857 26,181,241 2024-05-15United States Treasury Notes 2.38% 0.30 25,012,679 26,345,387 2027-05-15United States Treasury Notes 2.12% 0.29 24,867,051 26,263,314 2025-05-15................................................................................................................................................................................................................................................................................................United States Treasury Notes 2.25% 0.29 24,860,984 26,509,532 2027-08-15United States Treasury Notes 2.5% 0.29 24,684,578 25,196,367 2023-08-15United States Treasury Notes 2% 0.29 24,462,638 25,442,585 2023-02-15United States Treasury Notes 2.25% 0.29 24,412,351 25,935,022 2027-02-15United States Treasury Notes 2% 0.29 24,197,044 25,114,294 2022-11-30................................................................................................................................................................................................................................................................................................United States Treasury Notes 2% 0.27 22,854,989 24,703,929 2026-11-15United States Treasury Notes 2.75% 0.27 22,790,995 22,980,399 2023-04-30United States Treasury Notes 1.62% 0.25 21,456,471 23,719,055 2026-05-15United States Treasury Notes 2.62% 0.24 20,750,424 20,846,505 2020-11-15United States Treasury Notes 2.75% 0.24 20,336,279 20,518,214 2023-07-31................................................................................................................................................................................................................................................................................................United States Treasury Notes 2.75% 0.24 20,318,633 20,518,214 2023-11-15United States Treasury Notes 1.75% 0.24 20,030,906 20,518,214 2020-12-31United States Treasury Notes 1.75% 0.23 19,772,431 20,846,505 2023-05-15United States Treasury Notes 1.12% 0.23 19,591,202 20,600,287 2021-08-31United States Treasury Bonds 3.75% 0.23 19,136,458 17,476,840 2043-11-15................................................................................................................................................................................................................................................................................................United States Treasury Bonds 3.62% 0.23 19,068,762 17,751,280 2044-02-15United States Treasury Notes 2% 0.22 18,935,361 19,451,267 2021-11-15United States Treasury Notes 2.75% 0.22 18,711,585 18,876,757 2023-08-31United States Treasury Bonds 3.12% 0.22 18,708,747 18,961,311 2048-05-15United States Treasury Notes 1.38% 0.22 18,516,928 18,876,757 2020-02-29................................................................................................................................................................................................................................................................................................United States Treasury Bonds 3.38% 0.22 18,265,342 17,713,857 2044-05-15United States Treasury Notes 3.62% 0.21 18,198,692 17,891,882 2021-02-15United States Treasury Notes 1.38% 0.21 17,996,274 18,712,611 2021-05-31United States Treasury Notes 2.62% 0.21 17,991,135 18,056,028 2020-08-31United States Treasury Bonds 3.12% 0.21 17,561,956 17,784,961 2044-08-15................................................................................................................................................................................................................................................................................................United States Treasury Bonds 3% 0.20 17,255,245 17,876,026 2044-11-15United States Treasury Bonds 3% 0.20 17,212,860 17,838,602 2045-05-15United States Treasury Bonds 3% 0.20 17,203,798 17,838,602 2045-11-15United States Treasury Bonds 3% 0.20 17,167,567 17,838,602 2048-02-15United States Treasury Notes 2.38% 0.20 17,126,907 17,235,300 2020-04-30................................................................................................................................................................................................................................................................................................United States Treasury Bonds 2.88% 0.20 16,691,840 17,726,331 2045-08-15United States Treasury Bonds 2.88% 0.20 16,674,581 17,637,762 2043-05-15United States Treasury Notes 3.62% 0.20 16,521,988 16,332,498 2020-02-15United States Treasury Notes 1.88% 0.19 16,511,839 17,161,434 2022-07-31United States Treasury Notes 2.62% 0.19 16,360,715 16,414,571 2020-07-31................................................................................................................................................................................................................................................................................................United States Treasury Notes 2.62% 0.19 16,301,081 16,414,571 2021-07-15United States Treasury Notes 2.75% 0.19 16,279,282 16,414,571 2023-05-31United States Treasury Notes 1.25% 0.19 16,257,504 16,578,717 2020-01-31United States Treasury Notes 1.75% 0.19 16,235,685 16,414,571 2019-11-30United States Treasury Notes 2.88% 0.19 16,161,934 16,414,571 2028-08-15United States Treasury Notes 1.38% 0.19 16,112,576 16,414,571 2020-02-15United States Treasury Notes 2.12% 0.19 16,102,392 16,444,117 2021-08-15United States Treasury Notes 2.38% 0.19 16,037,545 16,414,571 2023-01-31United States Treasury Notes 1.75% 0.19 16,004,944 16,578,717 2021-11-30United States Treasury Notes 1.88% 0.19 15,996,522 16,578,717 2022-04-30................................................................................................................................................................................................................................................................................................
©2018 Morningstar, Inc., Morningstar Investment Profiles™ 312-696-6000. All rights reserved. The information contained herein: (1) is proprietary to Morningstar and/or its content providers; (2) maynot be copied or distributed and (3) is not warranted to be accurate, complete or timely. Neither Morningstar nor its content providers are responsible for any damages or losses arising from any use ofinformation. Past performance is no guarantee of future performance. Visit our investment website at www.morningstar.com ß
®

Page 3 of 162
Broad Market Bond Index Fund.......................................................................................................................................................................................................................................................................................................................................
Total Stocks Total Bonds Total Cash0 9083 28
Bond Portfolio Analysis as of 09-30-18Security Name Net Assets % Market Value $ Amount $ Maturity Date
United States Treasury Notes 2.62% 0.19 15,947,312 16,004,207 2020-08-15United States Treasury Bonds 3% 0.19 15,919,276 16,528,775 2047-05-15United States Treasury Notes 1.38% 0.19 15,867,638 16,414,571 2021-01-31United States Treasury Notes 2% 0.19 15,827,241 16,414,571 2022-10-31United States Treasury Bonds 3% 0.19 15,820,765 16,416,504 2047-02-15................................................................................................................................................................................................................................................................................................United States Treasury Notes 1.88% 0.19 15,798,507 16,332,498 2022-01-31United States Treasury Notes 2% 0.19 15,708,327 16,250,425 2022-07-31United States Treasury Notes 1.5% 0.18 15,622,878 15,840,061 2019-11-30United States Treasury Bonds 3.62% 0.18 15,608,381 14,545,322 2043-08-15United States Treasury Bonds 2.5% 0.18 15,590,628 17,801,178 2045-02-15................................................................................................................................................................................................................................................................................................United States Treasury Notes 1.62% 0.18 15,582,943 16,414,571 2022-11-15United States Treasury Bonds 2.88% 0.18 15,579,996 16,566,198 2046-11-15United States Treasury Notes 1.62% 0.18 15,466,501 15,675,915 2019-12-31United States Treasury Notes 1.88% 0.18 15,447,863 16,086,280 2022-09-30United States Treasury Notes 2.75% 0.18 15,427,550 15,593,842 2024-02-15................................................................................................................................................................................................................................................................................................United States Treasury Notes 1.88% 0.18 15,390,366 15,922,134 2022-02-28United States Treasury Bonds 2.75% 0.18 15,188,034 16,591,147 2047-11-15United States Treasury Notes 1.38% 0.18 15,175,974 15,593,842 2020-08-31United States Treasury Bonds 2.75% 0.18 15,148,807 16,541,249 2047-08-15United States Treasury Notes 3.12% 0.18 15,031,783 14,937,260 2021-05-15................................................................................................................................................................................................................................................................................................United States Treasury Notes 1.12% 0.18 14,965,172 15,757,988 2021-09-30United States Treasury Notes 1.38% 0.18 14,939,773 15,511,770 2021-04-30United States Treasury Notes 1.12% 0.17 14,729,529 15,347,624 2021-02-28United States Treasury Notes 2.5% 0.17 14,702,705 14,773,114 2020-05-31United States Treasury Notes 2.62% 0.17 14,676,128 14,769,010 2021-05-15................................................................................................................................................................................................................................................................................................United States Treasury Notes 2.62% 0.17 14,563,055 14,773,114 2023-06-30United States Treasury Notes 2.75% 0.17 14,559,022 14,773,114 2025-02-28United States Treasury Notes 1.5% 0.17 14,544,164 14,855,187 2020-05-31United States Treasury Notes 1.38% 0.17 14,533,347 14,834,669 2020-03-31United States Treasury Notes 2.75% 0.17 14,530,170 14,773,114 2025-08-31................................................................................................................................................................................................................................................................................................United States Treasury Bonds 2.5% 0.17 14,522,386 16,653,520 2046-05-15United States Treasury Notes 1.62% 0.17 14,476,261 14,855,187 2020-11-30United States Treasury Notes 3.38% 0.17 14,384,440 14,280,677 2019-11-15United States Treasury Bonds 2.5% 0.17 14,327,241 16,416,504 2046-02-15United States Treasury Notes 2.12% 0.17 14,289,397 14,608,968 2021-09-30................................................................................................................................................................................................................................................................................................United States Treasury Notes 2.75% 0.16 13,900,608 13,952,385 2021-08-15United States Treasury Notes 1.12% 0.16 13,897,574 14,567,932 2021-06-30United States Treasury Notes 2.88% 0.16 13,833,567 13,952,385 2025-07-31United States Treasury Notes 1.38% 0.16 13,810,485 14,116,531 2020-04-30United States Treasury Notes 1.25% 0.16 13,808,994 14,362,750 2021-03-31................................................................................................................................................................................................................................................................................................United States Treasury Notes 2.62% 0.16 13,773,627 13,952,385 2023-02-28United States Treasury Bonds 2.25% 0.16 13,731,558 16,628,571 2046-08-15United States Treasury Notes 1.88% 0.16 13,592,747 14,075,495 2022-03-31United States Treasury Notes 2% 0.16 13,563,784 13,952,385 2021-12-31United States Treasury Notes 2.25% 0.16 13,362,130 13,952,385 2024-12-31................................................................................................................................................................................................................................................................................................United States Treasury Notes 1.25% 0.16 13,202,263 13,870,313 2021-10-31United States Treasury Notes 2.5% 0.15 13,063,950 13,131,657 2020-06-30United States Treasury Notes 1.12% 0.15 13,054,589 13,706,167 2021-07-31United States Treasury Notes 1.88% 0.15 12,810,605 13,213,730 2021-11-30United States Treasury Notes 1.38% 0.15 12,745,402 13,131,657 2020-10-31United States Treasury Notes 2% 0.15 12,708,559 13,049,584 2021-10-31United States Treasury Notes 2.25% 0.15 12,592,025 13,131,657 2024-10-31United States Treasury Notes 1.75% 0.15 12,590,488 13,131,657 2022-06-30United States Treasury Notes 1.62% 0.15 12,579,880 13,213,730 2022-08-31United States Treasury Notes 1.62% 0.15 12,546,299 12,803,365 2020-06-30................................................................................................................................................................................................................................................................................................United States Treasury Notes 1.88% 0.15 12,421,356 12,885,438 2022-05-31United States Treasury Notes 2% 0.15 12,387,422 13,049,584 2024-05-31United States Treasury Notes 3.5% 0.15 12,364,045 12,228,855 2020-05-15United States Treasury Notes 2.25% 0.15 12,341,327 12,557,147 2021-07-31United States Treasury Bonds 3.12% 0.14 12,274,199 12,424,649 2043-02-15................................................................................................................................................................................................................................................................................................
©2018 Morningstar, Inc., Morningstar Investment Profiles™ 312-696-6000. All rights reserved. The information contained herein: (1) is proprietary to Morningstar and/or its content providers; (2) maynot be copied or distributed and (3) is not warranted to be accurate, complete or timely. Neither Morningstar nor its content providers are responsible for any damages or losses arising from any use ofinformation. Past performance is no guarantee of future performance. Visit our investment website at www.morningstar.com ß
®

Page 4 of 162
Broad Market Bond Index Fund.......................................................................................................................................................................................................................................................................................................................................
Total Stocks Total Bonds Total Cash0 9083 28
Bond Portfolio Analysis as of 09-30-18Security Name Net Assets % Market Value $ Amount $ Maturity Date
United States Treasury Notes 2.62% 0.14 12,229,171 12,310,928 2021-06-15United States Treasury Notes 2.25% 0.14 12,218,116 12,310,928 2020-03-31United States Treasury Notes 2.12% 0.14 12,216,944 12,762,329 2024-03-31United States Treasury Notes 2.88% 0.14 12,213,783 12,310,928 2025-04-30United States Treasury Notes 2.88% 0.14 12,208,981 12,310,928 2025-05-31................................................................................................................................................................................................................................................................................................United States Treasury Notes 2% 0.14 12,193,593 12,310,928 2020-01-31United States Treasury Notes 2.38% 0.14 12,170,990 12,310,928 2021-03-15United States Treasury Notes 2.38% 0.14 12,162,816 12,310,928 2021-04-15United States Treasury Notes 2% 0.14 12,142,187 12,803,365 2024-06-30United States Treasury Notes 2.75% 0.14 12,113,276 12,310,928 2025-06-30................................................................................................................................................................................................................................................................................................United States Treasury Notes 2.25% 0.14 12,112,247 12,557,147 2024-01-31United States Treasury Notes 1.75% 0.14 12,106,600 12,721,293 2023-01-31United States Treasury Notes 2.12% 0.14 12,097,217 12,393,001 2021-12-31United States Treasury Notes 2.5% 0.14 12,082,499 12,310,928 2023-03-31United States Treasury Notes 1.75% 0.14 12,035,373 12,310,928 2020-11-15................................................................................................................................................................................................................................................................................................United States Treasury Notes 1.62% 0.14 12,017,103 12,310,928 2020-10-15United States Treasury Notes 1.75% 0.14 11,892,435 12,393,001 2022-05-31United States Treasury Notes 1.75% 0.14 11,736,104 11,999,051 2020-10-31United States Treasury Notes 1.62% 0.14 11,728,940 11,982,637 2020-07-31United States Treasury Notes 1.75% 0.14 11,721,015 12,265,788 2022-09-30................................................................................................................................................................................................................................................................................................United States Treasury Bonds 4.62% 0.14 11,684,983 9,530,554 2040-02-15United States Treasury Notes 1.88% 0.14 11,654,741 12,146,783 2022-10-31United States Treasury Notes 2.12% 0.14 11,648,555 11,802,077 2020-08-31United States Treasury Notes 1.62% 0.14 11,616,989 12,393,001 2023-10-31United States Treasury Notes 1.5% 0.14 11,579,007 12,310,928 2023-02-28................................................................................................................................................................................................................................................................................................United States Treasury Notes 2.12% 0.14 11,526,625 12,081,124 2024-07-31United States Treasury Notes 1.38% 0.14 11,503,704 12,393,001 2023-08-31United States Treasury Notes 1% 0.14 11,477,462 11,695,382 2019-11-15United States Treasury Notes 2% 0.14 11,462,415 12,064,710 2024-04-30United States Treasury Notes 2.25% 0.13 11,410,308 11,490,200 2020-02-29................................................................................................................................................................................................................................................................................................United States Treasury Notes 1.75% 0.13 11,386,972 11,490,200 2019-09-30United States Treasury Notes 1.88% 0.13 11,371,713 11,490,200 2019-12-31United States Treasury Notes 1.38% 0.13 11,345,228 11,490,200 2019-09-30United States Treasury Bonds 2.75% 0.13 11,221,552 12,125,260 2042-11-15United States Treasury Notes 1.62% 0.13 11,178,481 11,736,418 2022-08-15................................................................................................................................................................................................................................................................................................United States Treasury Notes 1.5% 0.13 11,176,850 11,408,127 2020-05-15United States Treasury Notes 2.25% 0.13 11,171,768 11,572,273 2023-12-31United States Treasury Notes 1.5% 0.13 11,104,761 11,818,491 2023-03-31United States Treasury Notes 1.88% 0.13 10,880,193 11,572,273 2024-08-31United States Treasury Notes 2% 0.13 10,808,900 11,079,835 2021-08-31................................................................................................................................................................................................................................................................................................United States Treasury Notes 2% 0.13 10,759,130 11,079,835 2022-02-15United States Treasury Notes 1.38% 0.13 10,695,308 11,490,200 2023-06-30United States Treasury Notes 1.75% 0.13 10,665,206 11,079,835 2022-02-28United States Treasury Notes 2% 0.12 10,480,675 10,669,471 2020-11-30United States Treasury Notes 2.12% 0.12 10,458,162 10,669,471 2021-06-30United States Treasury Notes 1.88% 0.12 10,449,413 10,669,471 2020-12-15United States Treasury Notes 2.62% 0.12 10,428,992 10,669,471 2025-03-31United States Treasury Notes 2.12% 0.12 10,401,962 10,833,617 2023-11-30Government National Mortgage Association 3% 0.12 10,359,502 10,675,112 2046-07-20United States Treasury Notes 1.88% 0.12 10,254,781 10,669,471 2022-08-31................................................................................................................................................................................................................................................................................................United States Treasury Notes 1.75% 0.12 10,243,525 10,669,471 2022-05-15United States Treasury Notes 2.12% 0.12 10,220,607 10,669,471 2024-02-29United States Treasury Notes 1.75% 0.12 10,180,450 10,587,398 2022-03-31United States Treasury Notes 2.12% 0.12 10,170,716 10,341,180 2021-01-31United States Treasury Notes 1.75% 0.12 10,170,107 10,587,398 2022-04-30................................................................................................................................................................................................................................................................................................United States Treasury Notes 2.12% 0.12 10,148,502 10,669,471 2024-11-30United States Treasury Notes 2.12% 0.12 10,130,099 10,423,253 2022-06-30United States Treasury Notes 2% 0.12 10,031,136 10,177,034 2020-07-31United States Treasury Notes 2.25% 0.12 10,027,157 10,177,034 2021-03-31United States Treasury Bonds 4.75% 0.12 9,973,697 7,971,235 2041-02-15................................................................................................................................................................................................................................................................................................
©2018 Morningstar, Inc., Morningstar Investment Profiles™ 312-696-6000. All rights reserved. The information contained herein: (1) is proprietary to Morningstar and/or its content providers; (2) maynot be copied or distributed and (3) is not warranted to be accurate, complete or timely. Neither Morningstar nor its content providers are responsible for any damages or losses arising from any use ofinformation. Past performance is no guarantee of future performance. Visit our investment website at www.morningstar.com ß
®
Page 5 of 162
Broad Market Bond Index Fund.......................................................................................................................................................................................................................................................................................................................................
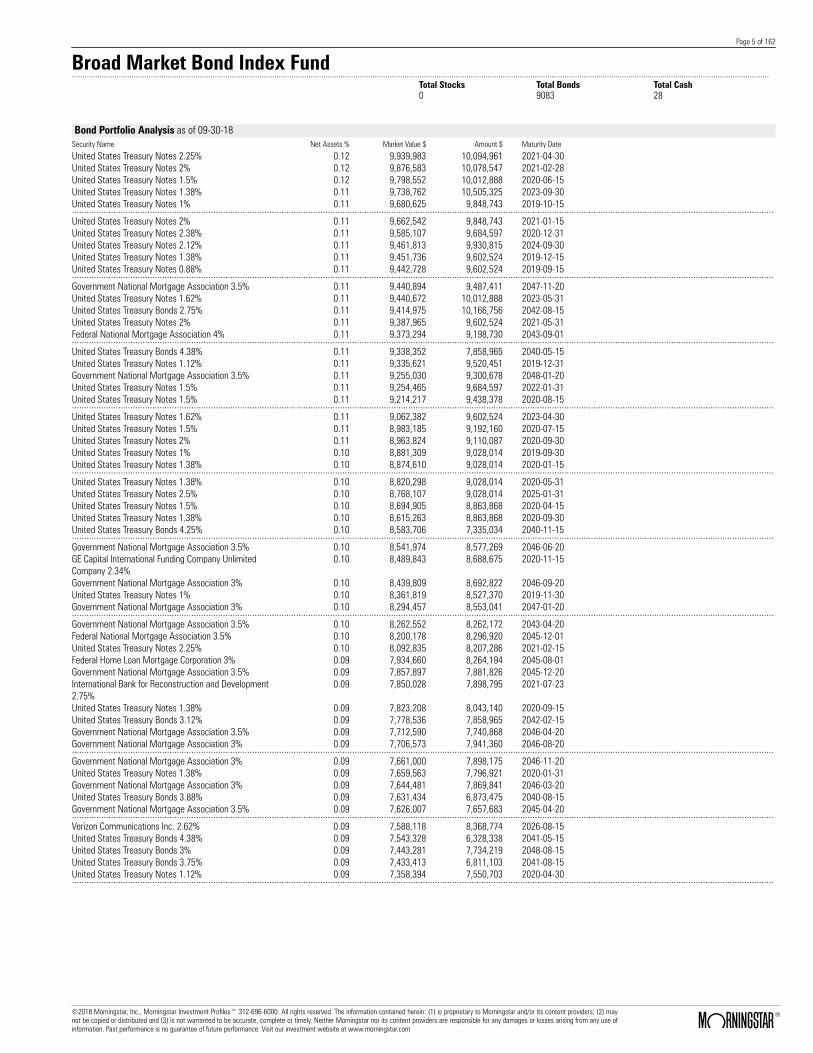
Total Stocks Total Bonds Total Cash0 9083 28
Bond Portfolio Analysis as of 09-30-18Security Name Net Assets % Market Value $ Amount $ Maturity Date
United States Treasury Notes 2.25% 0.12 9,939,983 10,094,961 2021-04-30United States Treasury Notes 2% 0.12 9,876,583 10,078,547 2021-02-28United States Treasury Notes 1.5% 0.12 9,798,552 10,012,888 2020-06-15United States Treasury Notes 1.38% 0.11 9,738,762 10,505,325 2023-09-30United States Treasury Notes 1% 0.11 9,680,625 9,848,743 2019-10-15................................................................................................................................................................................................................................................................................................United States Treasury Notes 2% 0.11 9,662,542 9,848,743 2021-01-15United States Treasury Notes 2.38% 0.11 9,585,107 9,684,597 2020-12-31United States Treasury Notes 2.12% 0.11 9,461,813 9,930,815 2024-09-30United States Treasury Notes 1.38% 0.11 9,451,736 9,602,524 2019-12-15United States Treasury Notes 0.88% 0.11 9,442,728 9,602,524 2019-09-15................................................................................................................................................................................................................................................................................................Government National Mortgage Association 3.5% 0.11 9,440,894 9,487,411 2047-11-20United States Treasury Notes 1.62% 0.11 9,440,672 10,012,888 2023-05-31United States Treasury Bonds 2.75% 0.11 9,414,975 10,166,756 2042-08-15United States Treasury Notes 2% 0.11 9,387,965 9,602,524 2021-05-31Federal National Mortgage Association 4% 0.11 9,373,294 9,198,730 2043-09-01................................................................................................................................................................................................................................................................................................United States Treasury Bonds 4.38% 0.11 9,338,352 7,858,965 2040-05-15United States Treasury Notes 1.12% 0.11 9,335,621 9,520,451 2019-12-31Government National Mortgage Association 3.5% 0.11 9,255,030 9,300,678 2048-01-20United States Treasury Notes 1.5% 0.11 9,254,465 9,684,597 2022-01-31United States Treasury Notes 1.5% 0.11 9,214,217 9,438,378 2020-08-15................................................................................................................................................................................................................................................................................................United States Treasury Notes 1.62% 0.11 9,062,382 9,602,524 2023-04-30United States Treasury Notes 1.5% 0.11 8,983,185 9,192,160 2020-07-15United States Treasury Notes 2% 0.11 8,963,824 9,110,087 2020-09-30United States Treasury Notes 1% 0.10 8,881,309 9,028,014 2019-09-30United States Treasury Notes 1.38% 0.10 8,874,610 9,028,014 2020-01-15................................................................................................................................................................................................................................................................................................United States Treasury Notes 1.38% 0.10 8,820,298 9,028,014 2020-05-31United States Treasury Notes 2.5% 0.10 8,768,107 9,028,014 2025-01-31United States Treasury Notes 1.5% 0.10 8,694,905 8,863,868 2020-04-15United States Treasury Notes 1.38% 0.10 8,615,263 8,863,868 2020-09-30United States Treasury Bonds 4.25% 0.10 8,583,706 7,335,034 2040-11-15................................................................................................................................................................................................................................................................................................Government National Mortgage Association 3.5% 0.10 8,541,974 8,577,269 2046-06-20GE Capital International Funding Company UnlimitedCompany 2.34%
0.10 8,489,843 8,688,675 2020-11-15
Government National Mortgage Association 3% 0.10 8,439,809 8,692,822 2046-09-20United States Treasury Notes 1% 0.10 8,361,819 8,527,370 2019-11-30Government National Mortgage Association 3% 0.10 8,294,457 8,553,041 2047-01-20................................................................................................................................................................................................................................................................................................Government National Mortgage Association 3.5% 0.10 8,262,552 8,262,172 2043-04-20Federal National Mortgage Association 3.5% 0.10 8,200,178 8,296,920 2045-12-01United States Treasury Notes 2.25% 0.10 8,092,835 8,207,286 2021-02-15Federal Home Loan Mortgage Corporation 3% 0.09 7,934,660 8,264,194 2045-08-01Government National Mortgage Association 3.5% 0.09 7,857,897 7,881,826 2045-12-20International Bank for Reconstruction and Development2.75%
0.09 7,850,028 7,898,795 2021-07-23
United States Treasury Notes 1.38% 0.09 7,823,208 8,043,140 2020-09-15United States Treasury Bonds 3.12% 0.09 7,778,536 7,858,965 2042-02-15Government National Mortgage Association 3.5% 0.09 7,712,590 7,740,868 2046-04-20Government National Mortgage Association 3% 0.09 7,706,573 7,941,360 2046-08-20................................................................................................................................................................................................................................................................................................Government National Mortgage Association 3% 0.09 7,661,000 7,898,175 2046-11-20United States Treasury Notes 1.38% 0.09 7,659,563 7,796,921 2020-01-31Government National Mortgage Association 3% 0.09 7,644,481 7,869,841 2046-03-20United States Treasury Bonds 3.88% 0.09 7,631,434 6,873,475 2040-08-15Government National Mortgage Association 3.5% 0.09 7,626,007 7,657,683 2045-04-20................................................................................................................................................................................................................................................................................................Verizon Communications Inc. 2.62% 0.09 7,588,118 8,368,774 2026-08-15United States Treasury Bonds 4.38% 0.09 7,543,328 6,328,338 2041-05-15United States Treasury Bonds 3% 0.09 7,443,281 7,734,219 2048-08-15United States Treasury Bonds 3.75% 0.09 7,433,413 6,811,103 2041-08-15United States Treasury Notes 1.12% 0.09 7,358,394 7,550,703 2020-04-30................................................................................................................................................................................................................................................................................................
©2018 Morningstar, Inc., Morningstar Investment Profiles™ 312-696-6000. All rights reserved. The information contained herein: (1) is proprietary to Morningstar and/or its content providers; (2) maynot be copied or distributed and (3) is not warranted to be accurate, complete or timely. Neither Morningstar nor its content providers are responsible for any damages or losses arising from any use ofinformation. Past performance is no guarantee of future performance. Visit our investment website at www.morningstar.com ß
®

Page 6 of 162
Broad Market Bond Index Fund.......................................................................................................................................................................................................................................................................................................................................
Total Stocks Total Bonds Total Cash0 9083 28
Bond Portfolio Analysis as of 09-30-18Security Name Net Assets % Market Value $ Amount $ Maturity Date
United States Treasury Bonds 4.5% 0.09 7,341,251 6,187,400 2036-02-15United States Treasury Notes 1.88% 0.09 7,269,990 7,386,557 2020-06-30Government National Mortgage Association 3% 0.09 7,248,618 7,456,382 2046-05-20Government National Mortgage Association 3.5% 0.08 7,139,699 7,139,370 2043-03-20Government National Mortgage Association 3% 0.08 7,082,971 7,303,418 2046-12-20................................................................................................................................................................................................................................................................................................Federal National Mortgage Association 2.5% 0.08 7,061,642 7,258,843 2028-06-01Government National Mortgage Association 3.5% 0.08 7,030,049 7,062,380 2046-10-20Federal National Mortgage Association 3% 0.08 6,967,537 7,217,613 2043-03-01Government National Mortgage Association 3.5% 0.08 6,942,699 6,976,893 2047-09-20Federal National Mortgage Association 3% 0.08 6,925,017 7,230,816 2047-01-01................................................................................................................................................................................................................................................................................................Federal National Mortgage Association 3% 0.08 6,813,735 7,112,703 2046-08-01Federal National Mortgage Association 3.5% 0.08 6,808,523 6,864,046 2042-12-01International Bank for Reconstruction and Development1.38%
0.08 6,782,858 7,108,916 2021-09-20
United States Treasury Bonds 4.38% 0.08 6,749,859 5,688,393 2039-11-15Verizon Communications Inc. 5.01% 0.08 6,722,829 6,582,968 2049-04-15................................................................................................................................................................................................................................................................................................Federal National Mortgage Association 3% 0.08 6,696,573 6,990,021 2046-07-01Federal National Mortgage Association 3.5% 0.08 6,585,551 6,688,371 2047-12-01United States Treasury Bonds 5.38% 0.08 6,536,096 5,289,208 2031-02-15Government National Mortgage Association 3.5% 0.08 6,528,130 6,557,138 2046-09-20Federal National Mortgage Association 3% 0.08 6,484,312 6,716,209 2043-01-01................................................................................................................................................................................................................................................................................................Federal Home Loan Mortgage Corporation 3% 0.08 6,462,011 6,688,524 2042-10-01Federal National Mortgage Association 3% 0.08 6,443,027 6,721,014 2046-08-01United States Treasury Notes 1.12% 0.08 6,408,610 6,565,828 2020-03-31Goldman Sachs Group, Inc. 5.25% 0.08 6,372,046 6,086,022 2021-07-27United States Treasury Bonds 3% 0.08 6,360,115 6,566,601 2042-05-15................................................................................................................................................................................................................................................................................................Federal National Mortgage Association 4% 0.07 6,273,091 6,147,986 2044-09-01Government National Mortgage Association 3.5% 0.07 6,272,690 6,299,590 2046-07-20Government National Mortgage Association 4% 0.07 6,270,521 6,117,725 2045-10-20Government National Mortgage Association 3% 0.07 6,207,700 6,401,228 2047-02-20Government National Mortgage Association 4.5% 0.07 6,184,550 5,978,483 2048-08-20................................................................................................................................................................................................................................................................................................Federal National Mortgage Association 3% 0.07 6,170,003 6,393,839 2044-10-01Federal National Mortgage Association 3.5% 0.07 6,168,000 6,251,235 2047-01-01JPMorgan Chase & Co. 2.3% 0.07 6,143,936 6,319,036 2021-08-15Kreditanstalt Fur Wiederaufbau 1.5% 0.07 6,073,731 6,319,036 2021-06-15GNMA PASS-THRU M SINGLE FAMILY 4% 0.07 6,063,947 5,916,173 2044-10-20................................................................................................................................................................................................................................................................................................United States Treasury Bonds 3.12% 0.07 6,051,879 6,112,528 2041-11-15United States Treasury Bonds 4.5% 0.07 6,041,817 5,014,768 2039-08-15Federal National Mortgage Association 3.5% 0.07 6,034,147 6,114,280 2046-12-01United States Treasury Notes 1.25% 0.07 5,990,634 6,483,756 2023-07-31Federal National Mortgage Association 3% 0.07 5,971,933 6,180,807 2043-04-01Federal Home Loan Mortgage Corporation 3% 0.07 5,960,505 6,176,267 2043-07-01Federal National Mortgage Association 3% 0.07 5,949,659 6,164,952 2043-07-01Government National Mortgage Association 3.5% 0.07 5,944,367 5,973,704 2048-04-20Government National Mortgage Association 4% 0.07 5,943,243 5,838,931 2048-06-20Federal National Mortgage Association 3.5% 0.07 5,881,495 5,955,866 2046-07-01................................................................................................................................................................................................................................................................................................Federal Home Loan Mortgage Corporation 3% 0.07 5,877,593 6,132,100 2046-08-01United States Treasury Bonds 4.25% 0.07 5,848,082 5,014,768 2039-05-15Government National Mortgage Association 3.5% 0.07 5,843,342 5,872,144 2047-12-20Government National Mortgage Association 3% 0.07 5,838,508 6,010,629 2046-02-20Government National Mortgage Association 3.5% 0.07 5,834,534 5,854,116 2046-03-20................................................................................................................................................................................................................................................................................................United States Treasury Bonds 3.5% 0.07 5,815,179 5,519,987 2039-02-15Government National Mortgage Association 3.5% 0.07 5,813,533 5,842,130 2047-06-20Government National Mortgage Association 3% 0.07 5,785,175 5,919,851 2042-09-20Government National Mortgage Association 4% 0.07 5,780,860 5,679,398 2048-04-20Federal National Mortgage Association 4% 0.07 5,761,172 5,701,421 2047-04-01................................................................................................................................................................................................................................................................................................
©2018 Morningstar, Inc., Morningstar Investment Profiles™ 312-696-6000. All rights reserved. The information contained herein: (1) is proprietary to Morningstar and/or its content providers; (2) maynot be copied or distributed and (3) is not warranted to be accurate, complete or timely. Neither Morningstar nor its content providers are responsible for any damages or losses arising from any use ofinformation. Past performance is no guarantee of future performance. Visit our investment website at www.morningstar.com ß
®
Page 7 of 162
Broad Market Bond Index Fund.......................................................................................................................................................................................................................................................................................................................................
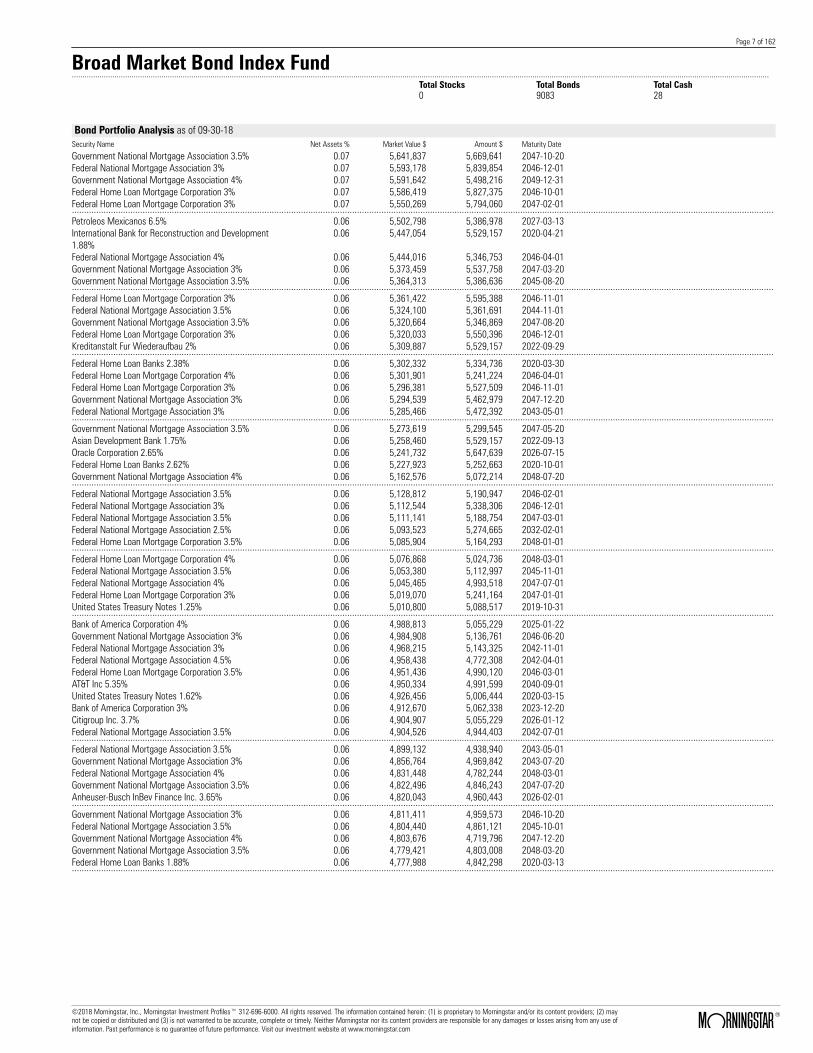
Total Stocks Total Bonds Total Cash0 9083 28
Bond Portfolio Analysis as of 09-30-18Security Name Net Assets % Market Value $ Amount $ Maturity Date
Government National Mortgage Association 3.5% 0.07 5,641,837 5,669,641 2047-10-20Federal National Mortgage Association 3% 0.07 5,593,178 5,839,854 2046-12-01Government National Mortgage Association 4% 0.07 5,591,642 5,498,216 2049-12-31Federal Home Loan Mortgage Corporation 3% 0.07 5,586,419 5,827,375 2046-10-01Federal Home Loan Mortgage Corporation 3% 0.07 5,550,269 5,794,060 2047-02-01................................................................................................................................................................................................................................................................................................Petroleos Mexicanos 6.5% 0.06 5,502,798 5,386,978 2027-03-13International Bank for Reconstruction and Development1.88%
0.06 5,447,054 5,529,157 2020-04-21
Federal National Mortgage Association 4% 0.06 5,444,016 5,346,753 2046-04-01Government National Mortgage Association 3% 0.06 5,373,459 5,537,758 2047-03-20Government National Mortgage Association 3.5% 0.06 5,364,313 5,386,636 2045-08-20................................................................................................................................................................................................................................................................................................Federal Home Loan Mortgage Corporation 3% 0.06 5,361,422 5,595,388 2046-11-01Federal National Mortgage Association 3.5% 0.06 5,324,100 5,361,691 2044-11-01Government National Mortgage Association 3.5% 0.06 5,320,664 5,346,869 2047-08-20Federal Home Loan Mortgage Corporation 3% 0.06 5,320,033 5,550,396 2046-12-01Kreditanstalt Fur Wiederaufbau 2% 0.06 5,309,887 5,529,157 2022-09-29................................................................................................................................................................................................................................................................................................Federal Home Loan Banks 2.38% 0.06 5,302,332 5,334,736 2020-03-30Federal Home Loan Mortgage Corporation 4% 0.06 5,301,901 5,241,224 2046-04-01Federal Home Loan Mortgage Corporation 3% 0.06 5,296,381 5,527,509 2046-11-01Government National Mortgage Association 3% 0.06 5,294,539 5,462,979 2047-12-20Federal National Mortgage Association 3% 0.06 5,285,466 5,472,392 2043-05-01................................................................................................................................................................................................................................................................................................Government National Mortgage Association 3.5% 0.06 5,273,619 5,299,545 2047-05-20Asian Development Bank 1.75% 0.06 5,258,460 5,529,157 2022-09-13Oracle Corporation 2.65% 0.06 5,241,732 5,647,639 2026-07-15Federal Home Loan Banks 2.62% 0.06 5,227,923 5,252,663 2020-10-01Government National Mortgage Association 4% 0.06 5,162,576 5,072,214 2048-07-20................................................................................................................................................................................................................................................................................................Federal National Mortgage Association 3.5% 0.06 5,128,812 5,190,947 2046-02-01Federal National Mortgage Association 3% 0.06 5,112,544 5,338,306 2046-12-01Federal National Mortgage Association 3.5% 0.06 5,111,141 5,188,754 2047-03-01Federal National Mortgage Association 2.5% 0.06 5,093,523 5,274,665 2032-02-01Federal Home Loan Mortgage Corporation 3.5% 0.06 5,085,904 5,164,293 2048-01-01................................................................................................................................................................................................................................................................................................Federal Home Loan Mortgage Corporation 4% 0.06 5,076,868 5,024,736 2048-03-01Federal National Mortgage Association 3.5% 0.06 5,053,380 5,112,997 2045-11-01Federal National Mortgage Association 4% 0.06 5,045,465 4,993,518 2047-07-01Federal Home Loan Mortgage Corporation 3% 0.06 5,019,070 5,241,164 2047-01-01United States Treasury Notes 1.25% 0.06 5,010,800 5,088,517 2019-10-31................................................................................................................................................................................................................................................................................................Bank of America Corporation 4% 0.06 4,988,813 5,055,229 2025-01-22Government National Mortgage Association 3% 0.06 4,984,908 5,136,761 2046-06-20Federal National Mortgage Association 3% 0.06 4,968,215 5,143,325 2042-11-01Federal National Mortgage Association 4.5% 0.06 4,958,438 4,772,308 2042-04-01Federal Home Loan Mortgage Corporation 3.5% 0.06 4,951,436 4,990,120 2046-03-01AT&T Inc 5.35% 0.06 4,950,334 4,991,599 2040-09-01United States Treasury Notes 1.62% 0.06 4,926,456 5,006,444 2020-03-15Bank of America Corporation 3% 0.06 4,912,670 5,062,338 2023-12-20Citigroup Inc. 3.7% 0.06 4,904,907 5,055,229 2026-01-12Federal National Mortgage Association 3.5% 0.06 4,904,526 4,944,403 2042-07-01................................................................................................................................................................................................................................................................................................Federal National Mortgage Association 3.5% 0.06 4,899,132 4,938,940 2043-05-01Government National Mortgage Association 3% 0.06 4,856,764 4,969,842 2043-07-20Federal National Mortgage Association 4% 0.06 4,831,448 4,782,244 2048-03-01Government National Mortgage Association 3.5% 0.06 4,822,496 4,846,243 2047-07-20Anheuser-Busch InBev Finance Inc. 3.65% 0.06 4,820,043 4,960,443 2026-02-01................................................................................................................................................................................................................................................................................................Government National Mortgage Association 3% 0.06 4,811,411 4,959,573 2046-10-20Federal National Mortgage Association 3.5% 0.06 4,804,440 4,861,121 2045-10-01Government National Mortgage Association 4% 0.06 4,803,676 4,719,796 2047-12-20Government National Mortgage Association 3.5% 0.06 4,779,421 4,803,008 2048-03-20Federal Home Loan Banks 1.88% 0.06 4,777,988 4,842,298 2020-03-13................................................................................................................................................................................................................................................................................................
©2018 Morningstar, Inc., Morningstar Investment Profiles™ 312-696-6000. All rights reserved. The information contained herein: (1) is proprietary to Morningstar and/or its content providers; (2) maynot be copied or distributed and (3) is not warranted to be accurate, complete or timely. Neither Morningstar nor its content providers are responsible for any damages or losses arising from any use ofinformation. Past performance is no guarantee of future performance. Visit our investment website at www.morningstar.com ß
®
Page 8 of 162
Broad Market Bond Index Fund.......................................................................................................................................................................................................................................................................................................................................
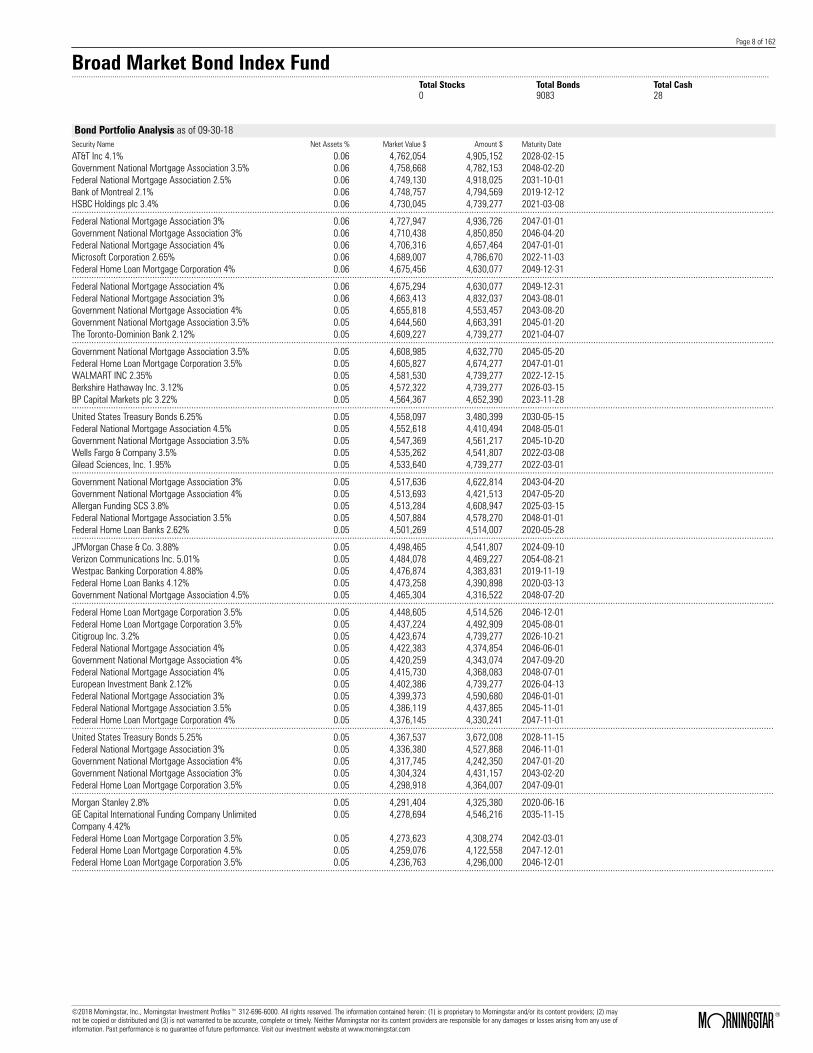
Total Stocks Total Bonds Total Cash0 9083 28
Bond Portfolio Analysis as of 09-30-18Security Name Net Assets % Market Value $ Amount $ Maturity Date
AT&T Inc 4.1% 0.06 4,762,054 4,905,152 2028-02-15Government National Mortgage Association 3.5% 0.06 4,758,668 4,782,153 2048-02-20Federal National Mortgage Association 2.5% 0.06 4,749,130 4,918,025 2031-10-01Bank of Montreal 2.1% 0.06 4,748,757 4,794,569 2019-12-12HSBC Holdings plc 3.4% 0.06 4,730,045 4,739,277 2021-03-08................................................................................................................................................................................................................................................................................................Federal National Mortgage Association 3% 0.06 4,727,947 4,936,726 2047-01-01Government National Mortgage Association 3% 0.06 4,710,438 4,850,850 2046-04-20Federal National Mortgage Association 4% 0.06 4,706,316 4,657,464 2047-01-01Microsoft Corporation 2.65% 0.06 4,689,007 4,786,670 2022-11-03Federal Home Loan Mortgage Corporation 4% 0.06 4,675,456 4,630,077 2049-12-31................................................................................................................................................................................................................................................................................................Federal National Mortgage Association 4% 0.06 4,675,294 4,630,077 2049-12-31Federal National Mortgage Association 3% 0.06 4,663,413 4,832,037 2043-08-01Government National Mortgage Association 4% 0.05 4,655,818 4,553,457 2043-08-20Government National Mortgage Association 3.5% 0.05 4,644,560 4,663,391 2045-01-20The Toronto-Dominion Bank 2.12% 0.05 4,609,227 4,739,277 2021-04-07................................................................................................................................................................................................................................................................................................Government National Mortgage Association 3.5% 0.05 4,608,985 4,632,770 2045-05-20Federal Home Loan Mortgage Corporation 3.5% 0.05 4,605,827 4,674,277 2047-01-01WALMART INC 2.35% 0.05 4,581,530 4,739,277 2022-12-15Berkshire Hathaway Inc. 3.12% 0.05 4,572,322 4,739,277 2026-03-15BP Capital Markets plc 3.22% 0.05 4,564,367 4,652,390 2023-11-28................................................................................................................................................................................................................................................................................................United States Treasury Bonds 6.25% 0.05 4,558,097 3,480,399 2030-05-15Federal National Mortgage Association 4.5% 0.05 4,552,618 4,410,494 2048-05-01Government National Mortgage Association 3.5% 0.05 4,547,369 4,561,217 2045-10-20Wells Fargo & Company 3.5% 0.05 4,535,262 4,541,807 2022-03-08Gilead Sciences, Inc. 1.95% 0.05 4,533,640 4,739,277 2022-03-01................................................................................................................................................................................................................................................................................................Government National Mortgage Association 3% 0.05 4,517,636 4,622,814 2043-04-20Government National Mortgage Association 4% 0.05 4,513,693 4,421,513 2047-05-20Allergan Funding SCS 3.8% 0.05 4,513,284 4,608,947 2025-03-15Federal National Mortgage Association 3.5% 0.05 4,507,884 4,578,270 2048-01-01Federal Home Loan Banks 2.62% 0.05 4,501,269 4,514,007 2020-05-28................................................................................................................................................................................................................................................................................................JPMorgan Chase & Co. 3.88% 0.05 4,498,465 4,541,807 2024-09-10Verizon Communications Inc. 5.01% 0.05 4,484,078 4,469,227 2054-08-21Westpac Banking Corporation 4.88% 0.05 4,476,874 4,383,831 2019-11-19Federal Home Loan Banks 4.12% 0.05 4,473,258 4,390,898 2020-03-13Government National Mortgage Association 4.5% 0.05 4,465,304 4,316,522 2048-07-20................................................................................................................................................................................................................................................................................................Federal Home Loan Mortgage Corporation 3.5% 0.05 4,448,605 4,514,526 2046-12-01Federal Home Loan Mortgage Corporation 3.5% 0.05 4,437,224 4,492,909 2045-08-01Citigroup Inc. 3.2% 0.05 4,423,674 4,739,277 2026-10-21Federal National Mortgage Association 4% 0.05 4,422,383 4,374,854 2046-06-01Government National Mortgage Association 4% 0.05 4,420,259 4,343,074 2047-09-20Federal National Mortgage Association 4% 0.05 4,415,730 4,368,083 2048-07-01European Investment Bank 2.12% 0.05 4,402,386 4,739,277 2026-04-13Federal National Mortgage Association 3% 0.05 4,399,373 4,590,680 2046-01-01Federal National Mortgage Association 3.5% 0.05 4,386,119 4,437,865 2045-11-01Federal Home Loan Mortgage Corporation 4% 0.05 4,376,145 4,330,241 2047-11-01................................................................................................................................................................................................................................................................................................United States Treasury Bonds 5.25% 0.05 4,367,537 3,672,008 2028-11-15Federal National Mortgage Association 3% 0.05 4,336,380 4,527,868 2046-11-01Government National Mortgage Association 4% 0.05 4,317,745 4,242,350 2047-01-20Government National Mortgage Association 3% 0.05 4,304,324 4,431,157 2043-02-20Federal Home Loan Mortgage Corporation 3.5% 0.05 4,298,918 4,364,007 2047-09-01................................................................................................................................................................................................................................................................................................Morgan Stanley 2.8% 0.05 4,291,404 4,325,380 2020-06-16GE Capital International Funding Company UnlimitedCompany 4.42%
0.05 4,278,694 4,546,216 2035-11-15
Federal Home Loan Mortgage Corporation 3.5% 0.05 4,273,623 4,308,274 2042-03-01Federal Home Loan Mortgage Corporation 4.5% 0.05 4,259,076 4,122,558 2047-12-01Federal Home Loan Mortgage Corporation 3.5% 0.05 4,236,763 4,296,000 2046-12-01................................................................................................................................................................................................................................................................................................
©2018 Morningstar, Inc., Morningstar Investment Profiles™ 312-696-6000. All rights reserved. The information contained herein: (1) is proprietary to Morningstar and/or its content providers; (2) maynot be copied or distributed and (3) is not warranted to be accurate, complete or timely. Neither Morningstar nor its content providers are responsible for any damages or losses arising from any use ofinformation. Past performance is no guarantee of future performance. Visit our investment website at www.morningstar.com ß
®

Page 9 of 162
Broad Market Bond Index Fund.......................................................................................................................................................................................................................................................................................................................................
Total Stocks Total Bonds Total Cash0 9083 28
Bond Portfolio Analysis as of 09-30-18Security Name Net Assets % Market Value $ Amount $ Maturity Date
Allergan Funding SCS 3% 0.05 4,232,449 4,237,704 2020-03-12Federal Home Loan Mortgage Corporation 3.5% 0.05 4,221,535 4,277,194 2045-07-01International Business Machines Corporation 3.62% 0.05 4,214,024 4,194,260 2024-02-12Government National Mortgage Association 4% 0.05 4,174,375 4,072,589 2045-11-20Federal National Mortgage Association 4% 0.05 4,145,971 4,100,983 2047-07-01................................................................................................................................................................................................................................................................................................Federal Home Loan Mortgage Corporation 2.5% 0.05 4,132,270 4,253,525 2028-11-01Federal National Mortgage Association 3.5% 0.05 4,131,650 4,180,829 2046-02-01Burlington Northern Santa Fe LLC 3.4% 0.05 4,111,490 4,138,969 2024-09-01HSBC Holdings plc 2.95% 0.05 4,090,802 4,146,867 2021-05-25Federal National Mortgage Association 4% 0.05 4,089,799 4,047,979 2047-07-01................................................................................................................................................................................................................................................................................................Goldman Sachs Group, Inc. 3.75% 0.05 4,087,565 4,170,564 2025-05-22JPMorgan Chase & Co. 2.25% 0.05 4,065,343 4,107,374 2020-01-23NBCUniversal Media LLC 4.38% 0.05 4,046,249 3,949,398 2021-04-01Simon Property Group, L.P. 4.12% 0.05 4,029,602 3,949,398 2021-12-01General Motors Financial Company Inc 4.38% 0.05 4,019,389 3,949,398 2021-09-25................................................................................................................................................................................................................................................................................................American International Group, Inc. 3.75% 0.05 4,013,468 4,127,120 2025-07-10Apple Inc. 3.45% 0.05 3,982,912 3,980,993 2024-05-06European Investment Bank 3.25% 0.05 3,971,842 3,949,398 2024-01-29Government National Mortgage Association 3.5% 0.05 3,958,761 3,973,890 2046-05-20Federal National Mortgage Association 3.5% 0.05 3,957,273 4,003,955 2045-02-01................................................................................................................................................................................................................................................................................................United States Treasury Bonds 4.5% 0.05 3,951,423 3,293,280 2038-05-15Bank of America Corporation 3.09% 0.05 3,950,385 4,146,867 2025-10-01Federal Home Loan Mortgage Corporation 3.5% 0.05 3,935,658 3,987,548 2045-03-01U.S. Bancorp 2.38% 0.05 3,935,109 4,344,337 2026-07-22European Investment Bank 2.88% 0.05 3,929,587 3,949,398 2021-12-15................................................................................................................................................................................................................................................................................................Medtronic, Inc. 3.15% 0.05 3,922,585 3,949,398 2022-03-15Federal National Mortgage Association 3% 0.05 3,916,991 4,057,452 2043-05-01Microsoft Corporation 3.62% 0.05 3,914,667 3,854,612 2023-12-15Inter-American Development Bank 2.62% 0.05 3,913,517 3,949,398 2021-04-19BRANCH BANKING & TRUST CO 2.1% 0.05 3,902,325 3,949,398 2020-01-15................................................................................................................................................................................................................................................................................................Federal National Mortgage Association 3% 0.05 3,899,475 4,040,383 2046-11-01FMS Wertmanagement 2.75% 0.05 3,895,583 3,949,398 2023-03-06Federal National Mortgage Association 3.5% 0.05 3,889,201 3,935,085 2045-06-01Asian Development Bank 2.25% 0.05 3,886,962 3,949,398 2021-01-20Visa Inc 2.2% 0.05 3,881,057 3,949,398 2020-12-14................................................................................................................................................................................................................................................................................................European Investment Bank 1.25% 0.05 3,876,981 3,949,398 2019-12-16Inter-American Development Bank 1.62% 0.05 3,872,120 3,949,398 2020-05-12Swedish Export Credit Corporation 2.38% 0.05 3,851,859 3,949,398 2022-03-09United States Treasury Bonds 5% 0.05 3,851,821 3,043,789 2037-05-15Government National Mortgage Association 3.5% 0.05 3,850,725 3,869,033 2046-11-20JPMorgan Chase & Co. 2.97% 0.05 3,846,575 3,949,398 2023-01-15Kreditanstalt Fur Wiederaufbau 2.38% 0.05 3,838,558 3,949,398 2022-12-29PNC Bank, National Association 2.15% 0.05 3,837,752 3,949,398 2021-04-29Morgan Stanley 4% 0.05 3,826,016 3,838,814 2025-07-23Sabine Pass Liquefaction, LLC 5.62% 0.05 3,824,691 3,586,053 2025-03-01................................................................................................................................................................................................................................................................................................Government National Mortgage Association 3.5% 0.05 3,821,433 3,817,337 2041-11-20Kreditanstalt Fur Wiederaufbau 2.12% 0.05 3,820,383 3,949,398 2022-06-15Japan Bank for International Cooperation 2.38% 0.04 3,809,715 3,949,398 2022-11-16Province of Alberta 2.2% 0.04 3,800,738 3,949,398 2022-07-26Japan Bank for International Cooperation 1.5% 0.04 3,767,054 3,949,398 2021-07-21................................................................................................................................................................................................................................................................................................CVS Health Corp 3.35% 0.04 3,763,924 3,771,675 2021-03-09Government National Mortgage Association 4.5% 0.04 3,760,863 3,577,771 2039-07-15Federal National Mortgage Association 2.5% 0.04 3,760,101 3,893,823 2031-10-01Federal National Mortgage Association 3.5% 0.04 3,741,960 3,772,506 2043-03-01Goldman Sachs Group, Inc. 6.75% 0.04 3,741,168 3,109,982 2037-10-01................................................................................................................................................................................................................................................................................................Federal National Mortgage Association 4% 0.04 3,727,053 3,686,779 2048-01-01Comcast Corporation 4.05% 0.04 3,725,970 4,201,689 2052-11-01Federal National Mortgage Association 3% 0.04 3,724,966 3,859,453 2043-09-01Capital One, National Association 2.35% 0.04 3,710,218 3,751,928 2020-01-31Federal National Mortgage Association 3.5% 0.04 3,701,856 3,761,938 2049-12-31................................................................................................................................................................................................................................................................................................
©2018 Morningstar, Inc., Morningstar Investment Profiles™ 312-696-6000. All rights reserved. The information contained herein: (1) is proprietary to Morningstar and/or its content providers; (2) maynot be copied or distributed and (3) is not warranted to be accurate, complete or timely. Neither Morningstar nor its content providers are responsible for any damages or losses arising from any use ofinformation. Past performance is no guarantee of future performance. Visit our investment website at www.morningstar.com ß
®

Page 10 of 162
Broad Market Bond Index Fund.......................................................................................................................................................................................................................................................................................................................................
Total Stocks Total Bonds Total Cash0 9083 28
Bond Portfolio Analysis as of 09-30-18Security Name Net Assets % Market Value $ Amount $ Maturity Date
Federal National Mortgage Association 3.5% 0.04 3,701,814 3,744,588 2045-01-01Government National Mortgage Association 3.5% 0.04 3,699,566 3,717,750 2047-03-20Government National Mortgage Association 4% 0.04 3,673,485 3,609,187 2048-08-20Federal Home Loan Mortgage Corporation 3% 0.04 3,661,535 3,821,316 2046-11-01Bank of Nova Scotia 2.45% 0.04 3,646,921 3,724,282 2021-03-22................................................................................................................................................................................................................................................................................................Federal National Mortgage Association 3% 0.04 3,645,088 3,805,434 2046-10-01Federal National Mortgage Association 3.5% 0.04 3,643,520 3,686,501 2046-11-01Federal National Mortgage Association 4% 0.04 3,634,779 3,585,843 2048-03-01Sunoco Logistics Partners Operations L.P. 3.9% 0.04 3,626,793 3,823,017 2026-07-15Federal National Mortgage Association 3.5% 0.04 3,626,112 3,655,682 2045-02-01................................................................................................................................................................................................................................................................................................Morgan Stanley 3.88% 0.04 3,616,935 3,633,446 2024-04-29Federal Home Loan Mortgage Corporation 3% 0.04 3,615,068 3,744,772 2043-04-01Barclays PLC 2.75% 0.04 3,612,005 3,633,446 2019-11-08Government National Mortgage Association 3.5% 0.04 3,605,216 3,620,676 2046-08-20Government National Mortgage Association 5% 0.04 3,604,311 3,441,662 2048-06-20................................................................................................................................................................................................................................................................................................Federal National Mortgage Association 3% 0.04 3,599,401 3,729,041 2043-01-01Broadcom Corporation/Broadcom Cayman Finance Ltd3.5%
0.04 3,588,620 3,949,398 2028-01-15
Cooperatieve Rabobank U.A. 3.88% 0.04 3,581,262 3,554,458 2022-02-08Federal National Mortgage Association 3% 0.04 3,566,026 3,719,950 2046-10-01Federal National Mortgage Association 3% 0.04 3,565,574 3,721,824 2046-06-01................................................................................................................................................................................................................................................................................................Federal Home Loan Mortgage Corporation 2.5% 0.04 3,562,858 3,693,612 2031-11-01JPMorgan Chase & Co. 3.2% 0.04 3,556,389 3,751,928 2026-06-15Federal National Mortgage Association 3.5% 0.04 3,554,298 3,604,718 2047-11-01Federal National Mortgage Association 3.5% 0.04 3,554,283 3,609,772 2047-11-01Federal Home Loan Mortgage Corporation 3.5% 0.04 3,549,135 3,595,932 2045-12-01................................................................................................................................................................................................................................................................................................Government National Mortgage Association 3% 0.04 3,547,504 3,653,665 2043-03-20Federal Home Loan Mortgage Corporation 3% 0.04 3,532,508 3,685,466 2046-06-0121st Century Fox America, Inc. 3.7% 0.04 3,530,146 3,518,913 2024-09-15Federal National Mortgage Association 3.5% 0.04 3,508,853 3,559,137 2047-04-01Government National Mortgage Association 3.5% 0.04 3,500,254 3,500,093 2042-05-20................................................................................................................................................................................................................................................................................................GlaxoSmithKline Capital plc 2.85% 0.04 3,494,672 3,554,458 2022-05-08B.A.T. Capital Corporation 3.56% 0.04 3,493,975 3,751,928 2027-08-15Federal Home Loan Mortgage Corporation 3.5% 0.04 3,488,928 3,526,075 2045-03-01JPMorgan Chase & Co. 8% 0.04 3,477,896 2,776,427 2027-04-29AT&T Inc 6% 0.04 3,474,370 3,245,098 2040-08-15Federal Home Loan Mortgage Corporation 2.5% 0.04 3,470,940 3,572,926 2028-08-01WALMART INC 3.62% 0.04 3,444,491 3,680,472 2047-12-15Government National Mortgage Association 3.5% 0.04 3,437,656 3,451,929 2047-09-20Federal Home Loan Mortgage Corporation 3% 0.04 3,437,261 3,586,099 2046-09-01Federal Home Loan Mortgage Corporation 3% 0.04 3,425,124 3,469,446 2030-11-01................................................................................................................................................................................................................................................................................................Federal Home Loan Mortgage Corporation 3.5% 0.04 3,417,877 3,468,947 2047-04-01Kreditanstalt Fur Wiederaufbau 4% 0.04 3,407,074 3,356,988 2020-01-27Wells Fargo & Company 3% 0.04 3,399,731 3,653,193 2026-04-22Federal Home Loan Mortgage Corporation 3.5% 0.04 3,399,567 3,433,393 2046-08-01Federal Home Loan Mortgage Corporation 3% 0.04 3,396,534 3,429,793 2029-05-01................................................................................................................................................................................................................................................................................................Federal National Mortgage Association 3.5% 0.04 3,393,307 3,442,706 2047-07-01Federal National Mortgage Association 3% 0.04 3,392,852 3,541,914 2046-08-01Apple Inc. 3% 0.04 3,382,468 3,554,458 2027-06-20Federal National Mortgage Association 3.5% 0.04 3,381,682 3,409,287 2042-05-01Government National Mortgage Association 3.5% 0.04 3,381,542 3,389,878 2043-03-20................................................................................................................................................................................................................................................................................................Federal National Mortgage Association 3% 0.04 3,375,160 3,516,227 2046-05-01Federal National Mortgage Association 3.5% 0.04 3,364,472 3,404,161 2045-07-01Federal National Mortgage Association 3% 0.04 3,364,169 3,512,546 2046-11-01United States Treasury Bonds 4.38% 0.04 3,356,374 2,844,197 2038-02-15Federal National Mortgage Association 4% 0.04 3,343,529 3,309,272 2047-09-01................................................................................................................................................................................................................................................................................................
©2018 Morningstar, Inc., Morningstar Investment Profiles™ 312-696-6000. All rights reserved. The information contained herein: (1) is proprietary to Morningstar and/or its content providers; (2) maynot be copied or distributed and (3) is not warranted to be accurate, complete or timely. Neither Morningstar nor its content providers are responsible for any damages or losses arising from any use ofinformation. Past performance is no guarantee of future performance. Visit our investment website at www.morningstar.com ß
®
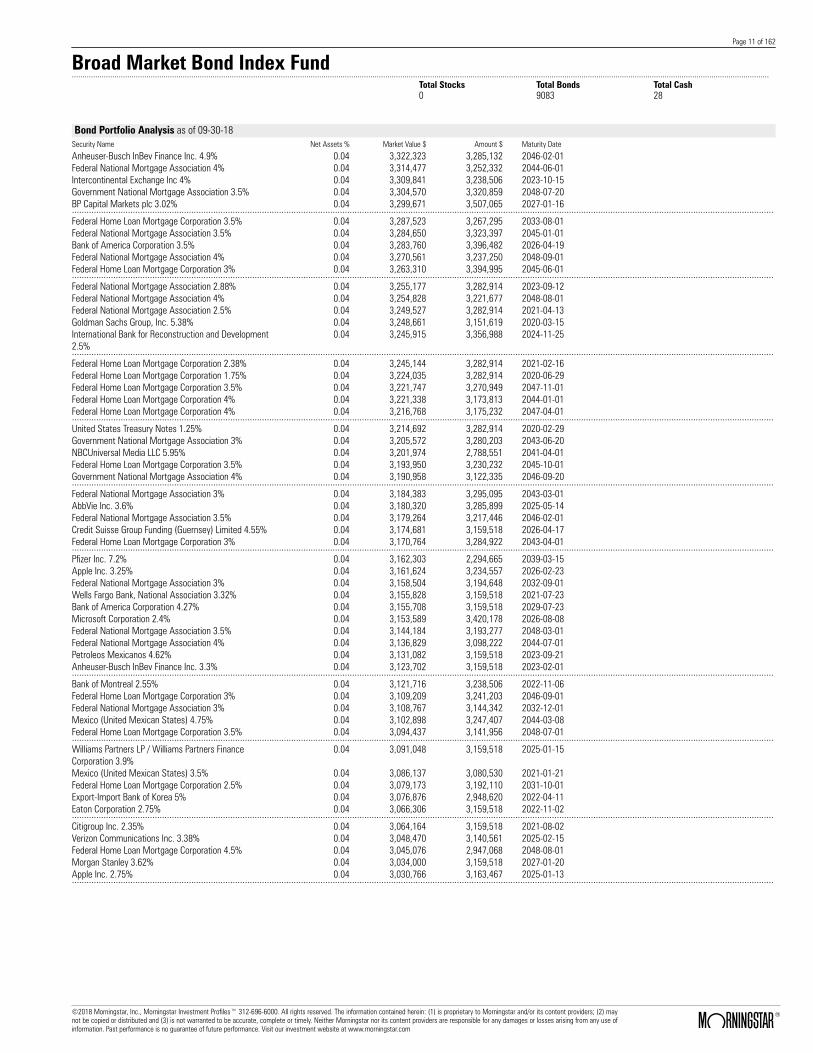
Page 11 of 162
Broad Market Bond Index Fund.......................................................................................................................................................................................................................................................................................................................................
Total Stocks Total Bonds Total Cash0 9083 28
Bond Portfolio Analysis as of 09-30-18Security Name Net Assets % Market Value $ Amount $ Maturity Date
Anheuser-Busch InBev Finance Inc. 4.9% 0.04 3,322,323 3,285,132 2046-02-01Federal National Mortgage Association 4% 0.04 3,314,477 3,252,332 2044-06-01Intercontinental Exchange Inc 4% 0.04 3,309,841 3,238,506 2023-10-15Government National Mortgage Association 3.5% 0.04 3,304,570 3,320,859 2048-07-20BP Capital Markets plc 3.02% 0.04 3,299,671 3,507,065 2027-01-16................................................................................................................................................................................................................................................................................................Federal Home Loan Mortgage Corporation 3.5% 0.04 3,287,523 3,267,295 2033-08-01Federal National Mortgage Association 3.5% 0.04 3,284,650 3,323,397 2045-01-01Bank of America Corporation 3.5% 0.04 3,283,760 3,396,482 2026-04-19Federal National Mortgage Association 4% 0.04 3,270,561 3,237,250 2048-09-01Federal Home Loan Mortgage Corporation 3% 0.04 3,263,310 3,394,995 2045-06-01................................................................................................................................................................................................................................................................................................Federal National Mortgage Association 2.88% 0.04 3,255,177 3,282,914 2023-09-12Federal National Mortgage Association 4% 0.04 3,254,828 3,221,677 2048-08-01Federal National Mortgage Association 2.5% 0.04 3,249,527 3,282,914 2021-04-13Goldman Sachs Group, Inc. 5.38% 0.04 3,248,661 3,151,619 2020-03-15International Bank for Reconstruction and Development2.5%
0.04 3,245,915 3,356,988 2024-11-25
................................................................................................................................................................................................................................................................................................Federal Home Loan Mortgage Corporation 2.38% 0.04 3,245,144 3,282,914 2021-02-16Federal Home Loan Mortgage Corporation 1.75% 0.04 3,224,035 3,282,914 2020-06-29Federal Home Loan Mortgage Corporation 3.5% 0.04 3,221,747 3,270,949 2047-11-01Federal Home Loan Mortgage Corporation 4% 0.04 3,221,338 3,173,813 2044-01-01Federal Home Loan Mortgage Corporation 4% 0.04 3,216,768 3,175,232 2047-04-01................................................................................................................................................................................................................................................................................................United States Treasury Notes 1.25% 0.04 3,214,692 3,282,914 2020-02-29Government National Mortgage Association 3% 0.04 3,205,572 3,280,203 2043-06-20NBCUniversal Media LLC 5.95% 0.04 3,201,974 2,788,551 2041-04-01Federal Home Loan Mortgage Corporation 3.5% 0.04 3,193,950 3,230,232 2045-10-01Government National Mortgage Association 4% 0.04 3,190,958 3,122,335 2046-09-20................................................................................................................................................................................................................................................................................................Federal National Mortgage Association 3% 0.04 3,184,383 3,295,095 2043-03-01AbbVie Inc. 3.6% 0.04 3,180,320 3,285,899 2025-05-14Federal National Mortgage Association 3.5% 0.04 3,179,264 3,217,446 2046-02-01Credit Suisse Group Funding (Guernsey) Limited 4.55% 0.04 3,174,681 3,159,518 2026-04-17Federal Home Loan Mortgage Corporation 3% 0.04 3,170,764 3,284,922 2043-04-01................................................................................................................................................................................................................................................................................................Pfizer Inc. 7.2% 0.04 3,162,303 2,294,665 2039-03-15Apple Inc. 3.25% 0.04 3,161,624 3,234,557 2026-02-23Federal National Mortgage Association 3% 0.04 3,158,504 3,194,648 2032-09-01Wells Fargo Bank, National Association 3.32% 0.04 3,155,828 3,159,518 2021-07-23Bank of America Corporation 4.27% 0.04 3,155,708 3,159,518 2029-07-23Microsoft Corporation 2.4% 0.04 3,153,589 3,420,178 2026-08-08Federal National Mortgage Association 3.5% 0.04 3,144,184 3,193,277 2048-03-01Federal National Mortgage Association 4% 0.04 3,136,829 3,098,222 2044-07-01Petroleos Mexicanos 4.62% 0.04 3,131,082 3,159,518 2023-09-21Anheuser-Busch InBev Finance Inc. 3.3% 0.04 3,123,702 3,159,518 2023-02-01................................................................................................................................................................................................................................................................................................Bank of Montreal 2.55% 0.04 3,121,716 3,238,506 2022-11-06Federal Home Loan Mortgage Corporation 3% 0.04 3,109,209 3,241,203 2046-09-01Federal National Mortgage Association 3% 0.04 3,108,767 3,144,342 2032-12-01Mexico (United Mexican States) 4.75% 0.04 3,102,898 3,247,407 2044-03-08Federal Home Loan Mortgage Corporation 3.5% 0.04 3,094,437 3,141,956 2048-07-01................................................................................................................................................................................................................................................................................................Williams Partners LP / Williams Partners FinanceCorporation 3.9%
0.04 3,091,048 3,159,518 2025-01-15
Mexico (United Mexican States) 3.5% 0.04 3,086,137 3,080,530 2021-01-21Federal Home Loan Mortgage Corporation 2.5% 0.04 3,079,173 3,192,110 2031-10-01Export-Import Bank of Korea 5% 0.04 3,076,876 2,948,620 2022-04-11Eaton Corporation 2.75% 0.04 3,066,306 3,159,518 2022-11-02................................................................................................................................................................................................................................................................................................Citigroup Inc. 2.35% 0.04 3,064,164 3,159,518 2021-08-02Verizon Communications Inc. 3.38% 0.04 3,048,470 3,140,561 2025-02-15Federal Home Loan Mortgage Corporation 4.5% 0.04 3,045,076 2,947,068 2048-08-01Morgan Stanley 3.62% 0.04 3,034,000 3,159,518 2027-01-20Apple Inc. 2.75% 0.04 3,030,766 3,163,467 2025-01-13................................................................................................................................................................................................................................................................................................
©2018 Morningstar, Inc., Morningstar Investment Profiles™ 312-696-6000. All rights reserved. The information contained herein: (1) is proprietary to Morningstar and/or its content providers; (2) maynot be copied or distributed and (3) is not warranted to be accurate, complete or timely. Neither Morningstar nor its content providers are responsible for any damages or losses arising from any use ofinformation. Past performance is no guarantee of future performance. Visit our investment website at www.morningstar.com ß
®

Page 12 of 162
Broad Market Bond Index Fund.......................................................................................................................................................................................................................................................................................................................................
Total Stocks Total Bonds Total Cash0 9083 28
Bond Portfolio Analysis as of 09-30-18Security Name Net Assets % Market Value $ Amount $ Maturity Date
Becton, Dickinson and Company 3.7% 0.04 3,021,248 3,159,518 2027-06-06Goldman Sachs Group, Inc. 3.27% 0.04 3,015,149 3,155,569 2025-09-29Goldman Sachs Group, Inc. 3.81% 0.04 3,013,896 3,159,518 2029-04-23Newell Brands Inc. 3.15% 0.04 3,011,707 3,060,783 2021-04-01United States Treasury Bonds 5.25% 0.04 3,008,081 2,519,858 2029-02-15................................................................................................................................................................................................................................................................................................Federal National Mortgage Association 4% 0.04 3,007,130 2,953,898 2041-02-01ILLINOIS ST 5.1% 0.04 3,001,800 3,127,689 2033-06-01Federal National Mortgage Association 4.5% 0.04 3,000,015 2,878,469 2043-11-01The Mosaic Company 3.75% 0.04 2,999,645 3,001,542 2021-11-15Government National Mortgage Association 3% 0.04 2,996,958 3,079,096 2045-08-20................................................................................................................................................................................................................................................................................................Federal Home Loan Mortgage Corporation 4% 0.04 2,995,911 2,958,760 2048-01-01Citigroup Inc. 3.4% 0.04 2,995,381 3,151,619 2026-05-01Asian Development Bank 2.5% 0.04 2,986,361 3,159,518 2027-11-02Ontario (Province Of) 4% 0.04 2,982,856 2,950,200 2019-10-07Japan Bank for International Cooperation 2.75% 0.04 2,982,636 3,159,518 2027-11-16................................................................................................................................................................................................................................................................................................Federal National Mortgage Association 3% 0.04 2,974,973 3,106,412 2047-02-01Mitsubishi UFJ Financial Group, Inc. 3.29% 0.04 2,968,955 3,159,518 2027-07-25Government National Mortgage Association 4% 0.04 2,967,777 2,915,954 2047-10-20Federal Home Loan Mortgage Corporation 4% 0.04 2,964,957 2,933,034 2047-08-01Federal National Mortgage Association 3.5% 0.03 2,961,341 3,007,100 2048-01-01................................................................................................................................................................................................................................................................................................Federal National Mortgage Association 4% 0.03 2,959,448 2,907,714 2043-12-01Federal Home Loan Mortgage Corporation 3.5% 0.03 2,943,272 2,987,487 2047-06-01Government National Mortgage Association 4.5% 0.03 2,942,070 2,808,024 2046-02-20Federal National Mortgage Association 3% 0.03 2,938,823 2,964,810 2029-08-01Oracle Corporation 5.38% 0.03 2,935,374 2,578,756 2040-07-15................................................................................................................................................................................................................................................................................................Goldman Sachs Group, Inc. 4.25% 0.03 2,935,055 2,962,048 2025-10-21Federal Home Loan Mortgage Corporation 4% 0.03 2,934,752 2,904,617 2048-08-01Federal Home Loan Mortgage Corporation 3.5% 0.03 2,928,448 2,961,717 2045-10-01Federal Home Loan Mortgage Corporation 4% 0.03 2,925,253 2,895,216 2048-09-01Kreditanstalt Fur Wiederaufbau 2.12% 0.03 2,923,868 3,041,036 2023-01-17................................................................................................................................................................................................................................................................................................Kreditanstalt Fur Wiederaufbau 2.62% 0.03 2,923,687 2,962,048 2022-01-25Council of Europe Development Bank 1.88% 0.03 2,923,574 2,962,048 2020-01-27Federal National Mortgage Association 4% 0.03 2,919,753 2,890,014 2048-08-01Federal Home Loan Mortgage Corporation 3.5% 0.03 2,917,824 2,950,970 2046-03-01Shire Acquisitions Investments Ireland DAC 3.2% 0.03 2,911,862 3,159,518 2026-09-23Sysco Corporation 2.6% 0.03 2,905,646 2,942,301 2020-10-01The Republic of Peru 7.35% 0.03 2,905,201 2,369,639 2025-07-21Federal Home Loan Mortgage Corporation 3.5% 0.03 2,902,996 2,947,330 2047-11-01Federal National Mortgage Association 4% 0.03 2,900,666 2,865,786 2046-07-01Federal National Mortgage Association 4.5% 0.03 2,899,368 2,808,744 2047-11-01................................................................................................................................................................................................................................................................................................Federal Home Loan Mortgage Corporation 1.76% 0.03 2,895,820 2,954,623 2020-06-26GNMA PASS-THRU M SINGLE FAMILY 3.5% 0.03 2,891,875 2,899,934 2044-12-20Petroleos Mexicanos 6.5% 0.03 2,887,098 3,079,571 2041-06-02Government National Mortgage Association 4.5% 0.03 2,875,160 2,749,415 2040-05-15Federal National Mortgage Association 3% 0.03 2,874,141 2,907,031 2030-10-01................................................................................................................................................................................................................................................................................................Federal Home Loan Mortgage Corporation 3.5% 0.03 2,869,892 2,898,029 2045-01-01Federal National Mortgage Association 4% 0.03 2,859,397 2,802,385 2043-05-01Anheuser-Busch InBev Worldwide Inc. 4.44% 0.03 2,859,217 3,046,465 2048-10-06Federal National Mortgage Association 3% 0.03 2,855,271 2,980,873 2046-09-01Federal Home Loan Mortgage Corporation 3.5% 0.03 2,845,832 2,889,663 2047-11-01................................................................................................................................................................................................................................................................................................Federal National Mortgage Association 3.5% 0.03 2,845,044 2,888,945 2048-09-01Reynolds American Inc. 4.45% 0.03 2,844,631 2,823,819 2025-06-12Federal Home Loan Mortgage Corporation 3.5% 0.03 2,841,822 2,879,294 2045-09-01Federal Home Loan Mortgage Corporation 3.5% 0.03 2,836,431 2,879,380 2047-08-01Government National Mortgage Association 4% 0.03 2,824,558 2,752,227 2040-12-20................................................................................................................................................................................................................................................................................................Federal National Mortgage Association 4% 0.03 2,822,468 2,793,403 2047-04-01Exxon Mobil Corporation 2.73% 0.03 2,807,129 2,871,212 2023-03-01Abbott Laboratories 3.75% 0.03 2,793,841 2,801,703 2026-11-30Morgan Stanley 2.5% 0.03 2,793,759 2,859,364 2021-04-21Bank of New York Mellon Corporation 3.55% 0.03 2,789,589 2,764,578 2021-09-23................................................................................................................................................................................................................................................................................................
©2018 Morningstar, Inc., Morningstar Investment Profiles™ 312-696-6000. All rights reserved. The information contained herein: (1) is proprietary to Morningstar and/or its content providers; (2) maynot be copied or distributed and (3) is not warranted to be accurate, complete or timely. Neither Morningstar nor its content providers are responsible for any damages or losses arising from any use ofinformation. Past performance is no guarantee of future performance. Visit our investment website at www.morningstar.com ß
®
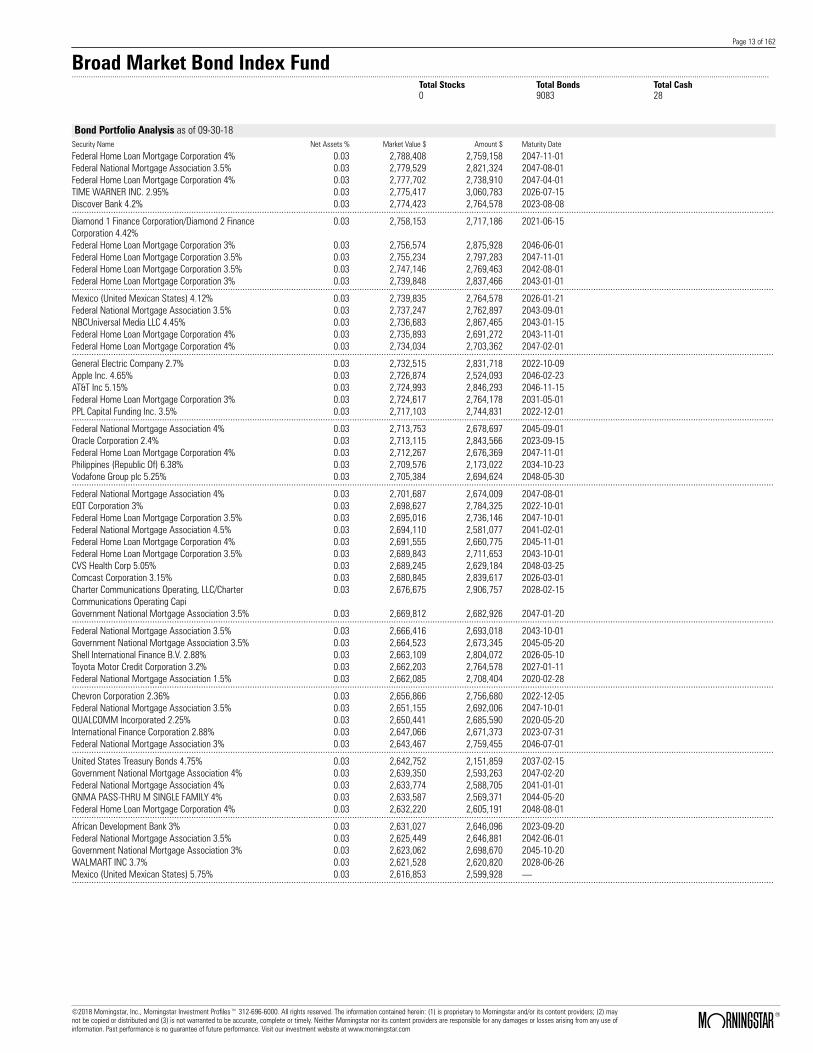
Page 13 of 162
Broad Market Bond Index Fund.......................................................................................................................................................................................................................................................................................................................................
Total Stocks Total Bonds Total Cash0 9083 28
Bond Portfolio Analysis as of 09-30-18Security Name Net Assets % Market Value $ Amount $ Maturity Date
Federal Home Loan Mortgage Corporation 4% 0.03 2,788,408 2,759,158 2047-11-01Federal National Mortgage Association 3.5% 0.03 2,779,529 2,821,324 2047-08-01Federal Home Loan Mortgage Corporation 4% 0.03 2,777,702 2,738,910 2047-04-01TIME WARNER INC. 2.95% 0.03 2,775,417 3,060,783 2026-07-15Discover Bank 4.2% 0.03 2,774,423 2,764,578 2023-08-08................................................................................................................................................................................................................................................................................................Diamond 1 Finance Corporation/Diamond 2 FinanceCorporation 4.42%
0.03 2,758,153 2,717,186 2021-06-15
Federal Home Loan Mortgage Corporation 3% 0.03 2,756,574 2,875,928 2046-06-01Federal Home Loan Mortgage Corporation 3.5% 0.03 2,755,234 2,797,283 2047-11-01Federal Home Loan Mortgage Corporation 3.5% 0.03 2,747,146 2,769,463 2042-08-01Federal Home Loan Mortgage Corporation 3% 0.03 2,739,848 2,837,466 2043-01-01................................................................................................................................................................................................................................................................................................Mexico (United Mexican States) 4.12% 0.03 2,739,835 2,764,578 2026-01-21Federal National Mortgage Association 3.5% 0.03 2,737,247 2,762,897 2043-09-01NBCUniversal Media LLC 4.45% 0.03 2,736,683 2,867,465 2043-01-15Federal Home Loan Mortgage Corporation 4% 0.03 2,735,893 2,691,272 2043-11-01Federal Home Loan Mortgage Corporation 4% 0.03 2,734,034 2,703,362 2047-02-01................................................................................................................................................................................................................................................................................................General Electric Company 2.7% 0.03 2,732,515 2,831,718 2022-10-09Apple Inc. 4.65% 0.03 2,726,874 2,524,093 2046-02-23AT&T Inc 5.15% 0.03 2,724,993 2,846,293 2046-11-15Federal Home Loan Mortgage Corporation 3% 0.03 2,724,617 2,764,178 2031-05-01PPL Capital Funding Inc. 3.5% 0.03 2,717,103 2,744,831 2022-12-01................................................................................................................................................................................................................................................................................................Federal National Mortgage Association 4% 0.03 2,713,753 2,678,697 2045-09-01Oracle Corporation 2.4% 0.03 2,713,115 2,843,566 2023-09-15Federal Home Loan Mortgage Corporation 4% 0.03 2,712,267 2,676,369 2047-11-01Philippines (Republic Of) 6.38% 0.03 2,709,576 2,173,022 2034-10-23Vodafone Group plc 5.25% 0.03 2,705,384 2,694,624 2048-05-30................................................................................................................................................................................................................................................................................................Federal National Mortgage Association 4% 0.03 2,701,687 2,674,009 2047-08-01EQT Corporation 3% 0.03 2,698,627 2,784,325 2022-10-01Federal Home Loan Mortgage Corporation 3.5% 0.03 2,695,016 2,736,146 2047-10-01Federal National Mortgage Association 4.5% 0.03 2,694,110 2,581,077 2041-02-01Federal Home Loan Mortgage Corporation 4% 0.03 2,691,555 2,660,775 2045-11-01Federal Home Loan Mortgage Corporation 3.5% 0.03 2,689,843 2,711,653 2043-10-01CVS Health Corp 5.05% 0.03 2,689,245 2,629,184 2048-03-25Comcast Corporation 3.15% 0.03 2,680,845 2,839,617 2026-03-01Charter Communications Operating, LLC/CharterCommunications Operating Capi
0.03 2,676,675 2,906,757 2028-02-15
Government National Mortgage Association 3.5% 0.03 2,669,812 2,682,926 2047-01-20................................................................................................................................................................................................................................................................................................Federal National Mortgage Association 3.5% 0.03 2,666,416 2,693,018 2043-10-01Government National Mortgage Association 3.5% 0.03 2,664,523 2,673,345 2045-05-20Shell International Finance B.V. 2.88% 0.03 2,663,109 2,804,072 2026-05-10Toyota Motor Credit Corporation 3.2% 0.03 2,662,203 2,764,578 2027-01-11Federal National Mortgage Association 1.5% 0.03 2,662,085 2,708,404 2020-02-28................................................................................................................................................................................................................................................................................................Chevron Corporation 2.36% 0.03 2,656,866 2,756,680 2022-12-05Federal National Mortgage Association 3.5% 0.03 2,651,155 2,692,006 2047-10-01QUALCOMM Incorporated 2.25% 0.03 2,650,441 2,685,590 2020-05-20International Finance Corporation 2.88% 0.03 2,647,066 2,671,373 2023-07-31Federal National Mortgage Association 3% 0.03 2,643,467 2,759,455 2046-07-01................................................................................................................................................................................................................................................................................................United States Treasury Bonds 4.75% 0.03 2,642,752 2,151,859 2037-02-15Government National Mortgage Association 4% 0.03 2,639,350 2,593,263 2047-02-20Federal National Mortgage Association 4% 0.03 2,633,774 2,588,705 2041-01-01GNMA PASS-THRU M SINGLE FAMILY 4% 0.03 2,633,587 2,569,371 2044-05-20Federal Home Loan Mortgage Corporation 4% 0.03 2,632,220 2,605,191 2048-08-01................................................................................................................................................................................................................................................................................................African Development Bank 3% 0.03 2,631,027 2,646,096 2023-09-20Federal National Mortgage Association 3.5% 0.03 2,625,449 2,646,881 2042-06-01Government National Mortgage Association 3% 0.03 2,623,062 2,698,670 2045-10-20WALMART INC 3.7% 0.03 2,621,528 2,620,820 2028-06-26Mexico (United Mexican States) 5.75% 0.03 2,616,853 2,599,928 .................................................................................................................................................................................................................................................................................................
©2018 Morningstar, Inc., Morningstar Investment Profiles™ 312-696-6000. All rights reserved. The information contained herein: (1) is proprietary to Morningstar and/or its content providers; (2) maynot be copied or distributed and (3) is not warranted to be accurate, complete or timely. Neither Morningstar nor its content providers are responsible for any damages or losses arising from any use ofinformation. Past performance is no guarantee of future performance. Visit our investment website at www.morningstar.com ß
®
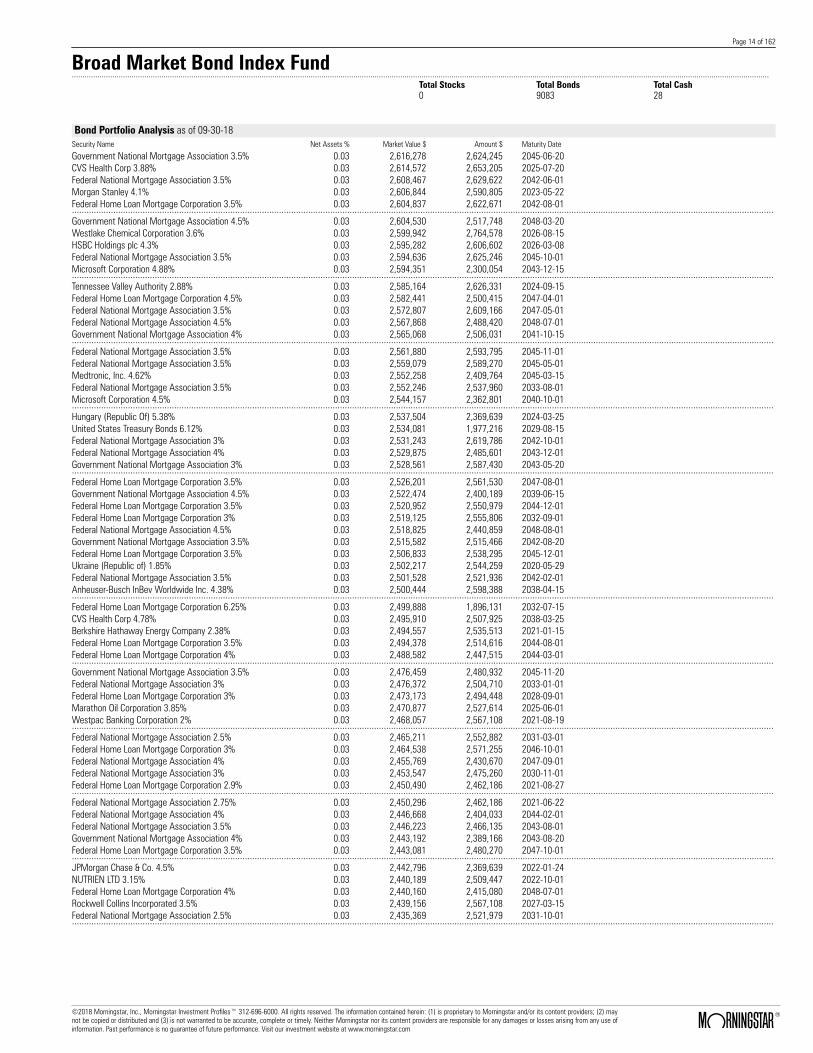
Page 14 of 162
Broad Market Bond Index Fund.......................................................................................................................................................................................................................................................................................................................................
Total Stocks Total Bonds Total Cash0 9083 28
Bond Portfolio Analysis as of 09-30-18Security Name Net Assets % Market Value $ Amount $ Maturity Date
Government National Mortgage Association 3.5% 0.03 2,616,278 2,624,245 2045-06-20CVS Health Corp 3.88% 0.03 2,614,572 2,653,205 2025-07-20Federal National Mortgage Association 3.5% 0.03 2,608,467 2,629,622 2042-06-01Morgan Stanley 4.1% 0.03 2,606,844 2,590,805 2023-05-22Federal Home Loan Mortgage Corporation 3.5% 0.03 2,604,837 2,622,671 2042-08-01................................................................................................................................................................................................................................................................................................Government National Mortgage Association 4.5% 0.03 2,604,530 2,517,748 2048-03-20Westlake Chemical Corporation 3.6% 0.03 2,599,942 2,764,578 2026-08-15HSBC Holdings plc 4.3% 0.03 2,595,282 2,606,602 2026-03-08Federal National Mortgage Association 3.5% 0.03 2,594,636 2,625,246 2045-10-01Microsoft Corporation 4.88% 0.03 2,594,351 2,300,054 2043-12-15................................................................................................................................................................................................................................................................................................Tennessee Valley Authority 2.88% 0.03 2,585,164 2,626,331 2024-09-15Federal Home Loan Mortgage Corporation 4.5% 0.03 2,582,441 2,500,415 2047-04-01Federal National Mortgage Association 3.5% 0.03 2,572,807 2,609,166 2047-05-01Federal National Mortgage Association 4.5% 0.03 2,567,868 2,488,420 2048-07-01Government National Mortgage Association 4% 0.03 2,565,068 2,506,031 2041-10-15................................................................................................................................................................................................................................................................................................Federal National Mortgage Association 3.5% 0.03 2,561,880 2,593,795 2045-11-01Federal National Mortgage Association 3.5% 0.03 2,559,079 2,589,270 2045-05-01Medtronic, Inc. 4.62% 0.03 2,552,258 2,409,764 2045-03-15Federal National Mortgage Association 3.5% 0.03 2,552,246 2,537,960 2033-08-01Microsoft Corporation 4.5% 0.03 2,544,157 2,362,801 2040-10-01................................................................................................................................................................................................................................................................................................Hungary (Republic Of) 5.38% 0.03 2,537,504 2,369,639 2024-03-25United States Treasury Bonds 6.12% 0.03 2,534,081 1,977,216 2029-08-15Federal National Mortgage Association 3% 0.03 2,531,243 2,619,786 2042-10-01Federal National Mortgage Association 4% 0.03 2,529,875 2,485,601 2043-12-01Government National Mortgage Association 3% 0.03 2,528,561 2,587,430 2043-05-20................................................................................................................................................................................................................................................................................................Federal Home Loan Mortgage Corporation 3.5% 0.03 2,526,201 2,561,530 2047-08-01Government National Mortgage Association 4.5% 0.03 2,522,474 2,400,189 2039-06-15Federal Home Loan Mortgage Corporation 3.5% 0.03 2,520,952 2,550,979 2044-12-01Federal Home Loan Mortgage Corporation 3% 0.03 2,519,125 2,555,806 2032-09-01Federal National Mortgage Association 4.5% 0.03 2,518,825 2,440,859 2048-08-01Government National Mortgage Association 3.5% 0.03 2,515,582 2,515,466 2042-08-20Federal Home Loan Mortgage Corporation 3.5% 0.03 2,506,833 2,538,295 2045-12-01Ukraine (Republic of) 1.85% 0.03 2,502,217 2,544,259 2020-05-29Federal National Mortgage Association 3.5% 0.03 2,501,528 2,521,936 2042-02-01Anheuser-Busch InBev Worldwide Inc. 4.38% 0.03 2,500,444 2,598,388 2038-04-15................................................................................................................................................................................................................................................................................................Federal Home Loan Mortgage Corporation 6.25% 0.03 2,499,888 1,896,131 2032-07-15CVS Health Corp 4.78% 0.03 2,495,910 2,507,925 2038-03-25Berkshire Hathaway Energy Company 2.38% 0.03 2,494,557 2,535,513 2021-01-15Federal Home Loan Mortgage Corporation 3.5% 0.03 2,494,378 2,514,616 2044-08-01Federal Home Loan Mortgage Corporation 4% 0.03 2,488,582 2,447,515 2044-03-01................................................................................................................................................................................................................................................................................................Government National Mortgage Association 3.5% 0.03 2,476,459 2,480,932 2045-11-20Federal National Mortgage Association 3% 0.03 2,476,372 2,504,710 2033-01-01Federal Home Loan Mortgage Corporation 3% 0.03 2,473,173 2,494,448 2028-09-01Marathon Oil Corporation 3.85% 0.03 2,470,877 2,527,614 2025-06-01Westpac Banking Corporation 2% 0.03 2,468,057 2,567,108 2021-08-19................................................................................................................................................................................................................................................................................................Federal National Mortgage Association 2.5% 0.03 2,465,211 2,552,882 2031-03-01Federal Home Loan Mortgage Corporation 3% 0.03 2,464,538 2,571,255 2046-10-01Federal National Mortgage Association 4% 0.03 2,455,769 2,430,670 2047-09-01Federal National Mortgage Association 3% 0.03 2,453,547 2,475,260 2030-11-01Federal Home Loan Mortgage Corporation 2.9% 0.03 2,450,490 2,462,186 2021-08-27................................................................................................................................................................................................................................................................................................Federal National Mortgage Association 2.75% 0.03 2,450,296 2,462,186 2021-06-22Federal National Mortgage Association 4% 0.03 2,446,668 2,404,033 2044-02-01Federal National Mortgage Association 3.5% 0.03 2,446,223 2,466,135 2043-08-01Government National Mortgage Association 4% 0.03 2,443,192 2,389,166 2043-08-20Federal Home Loan Mortgage Corporation 3.5% 0.03 2,443,081 2,480,270 2047-10-01................................................................................................................................................................................................................................................................................................JPMorgan Chase & Co. 4.5% 0.03 2,442,796 2,369,639 2022-01-24NUTRIEN LTD 3.15% 0.03 2,440,189 2,509,447 2022-10-01Federal Home Loan Mortgage Corporation 4% 0.03 2,440,160 2,415,080 2048-07-01Rockwell Collins Incorporated 3.5% 0.03 2,439,156 2,567,108 2027-03-15Federal National Mortgage Association 2.5% 0.03 2,435,369 2,521,979 2031-10-01................................................................................................................................................................................................................................................................................................
©2018 Morningstar, Inc., Morningstar Investment Profiles™ 312-696-6000. All rights reserved. The information contained herein: (1) is proprietary to Morningstar and/or its content providers; (2) maynot be copied or distributed and (3) is not warranted to be accurate, complete or timely. Neither Morningstar nor its content providers are responsible for any damages or losses arising from any use ofinformation. Past performance is no guarantee of future performance. Visit our investment website at www.morningstar.com ß
®

Page 15 of 162
Broad Market Bond Index Fund.......................................................................................................................................................................................................................................................................................................................................
Total Stocks Total Bonds Total Cash0 9083 28
Bond Portfolio Analysis as of 09-30-18Security Name Net Assets % Market Value $ Amount $ Maturity Date
Goldman Sachs Group, Inc. 3.85% 0.03 2,429,276 2,503,918 2027-01-26Federal National Mortgage Association 4% 0.03 2,428,278 2,402,076 2048-08-01General Electric Company 4.38% 0.03 2,420,903 2,369,639 2020-09-16Honeywell International Inc. 2.5% 0.03 2,419,805 2,614,501 2026-11-01Charter Communications Operating, LLC/CharterCommunications Operating Capi
0.03 2,418,724 2,250,011 2045-10-23
................................................................................................................................................................................................................................................................................................Shell International Finance B.V. 2.5% 0.03 2,412,162 2,614,501 2026-09-12Federal National Mortgage Association 3.5% 0.03 2,409,942 2,429,617 2042-01-01Federal National Mortgage Association 4.5% 0.03 2,408,261 2,333,756 2048-06-01Federal Home Loan Mortgage Corporation 3.5% 0.03 2,407,851 2,444,408 2047-09-01Bank of America Corporation 4.12% 0.03 2,407,479 2,369,639 2024-01-22................................................................................................................................................................................................................................................................................................Federal National Mortgage Association 2.5% 0.03 2,394,506 2,470,203 2030-12-01Morgan Stanley 2.62% 0.03 2,393,112 2,461,265 2021-11-17Government National Mortgage Association 4% 0.03 2,392,137 2,337,919 2046-05-20Uruguay (Republic of) 7.62% 0.03 2,391,662 1,772,678 2036-03-21Verizon Communications Inc. 4.67% 0.03 2,386,682 2,538,721 2055-03-15................................................................................................................................................................................................................................................................................................Federal National Mortgage Association 3% 0.03 2,385,010 2,445,898 2036-11-01State Street Corporation 3.7% 0.03 2,384,859 2,369,639 2023-11-20TCI Communications, Inc. 7.88% 0.03 2,382,265 1,958,901 2026-02-15Charter Communications Operating, LLC/CharterCommunications Operating Capi
0.03 2,379,780 2,156,084 2055-10-23
Rio Tinto Finance (USA) Limited 3.75% 0.03 2,379,475 2,369,639 2025-06-15................................................................................................................................................................................................................................................................................................Federal National Mortgage Association 3% 0.03 2,377,443 2,392,487 2027-11-01Federal National Mortgage Association 3% 0.03 2,374,451 2,389,490 2028-01-01Federal Home Loan Mortgage Corporation 4.5% 0.03 2,372,957 2,277,428 2040-04-01Federal Home Loan Mortgage Corporation 3% 0.03 2,370,220 2,404,691 2032-11-01Federal National Mortgage Association 3% 0.03 2,365,670 2,386,605 2030-11-01Federal Home Loan Mortgage Corporation 4% 0.03 2,364,541 2,321,279 2042-06-01Kreditanstalt Fur Wiederaufbau 2.75% 0.03 2,363,186 2,369,639 2020-07-15Aercap Ireland Capital DAC 3.95% 0.03 2,363,070 2,369,639 2022-02-01Federal National Mortgage Association 4.5% 0.03 2,359,021 2,285,105 2047-07-01Republic of Panama 3.75% 0.03 2,358,999 2,369,639 2025-03-16................................................................................................................................................................................................................................................................................................Federal Home Loan Mortgage Corporation 4.5% 0.03 2,358,463 2,266,774 2039-09-01Government National Mortgage Association 3% 0.03 2,354,429 2,420,571 2043-01-20Federal National Mortgage Association 3% 0.03 2,352,348 2,373,141 2029-05-01Raytheon Company 4.4% 0.03 2,350,047 2,306,448 2020-02-15Federal Home Loan Mortgage Corporation 1.25% 0.03 2,347,317 2,380,113 2019-10-02................................................................................................................................................................................................................................................................................................BP Capital Markets plc 3.51% 0.03 2,343,525 2,369,639 2025-03-17Federal Home Loan Mortgage Corporation 3% 0.03 2,343,210 2,442,696 2046-10-01Federal Home Loan Mortgage Corporation 4% 0.03 2,340,685 2,297,440 2043-10-01Federal Home Loan Mortgage Corporation 4.5% 0.03 2,339,291 2,265,012 2048-06-01Citigroup Inc. 2.65% 0.03 2,338,833 2,369,639 2020-10-26................................................................................................................................................................................................................................................................................................Equinor ASA 3.7% 0.03 2,337,752 2,318,296 2024-03-01Barclays PLC 3.25% 0.03 2,337,698 2,369,639 2021-01-12John Deere Capital Corporation 2.55% 0.03 2,337,352 2,369,639 2021-01-08Mizuho Financial Group Inc. 2.6% 0.03 2,336,538 2,448,627 2022-09-11Asian Development Bank 2.75% 0.03 2,335,743 2,369,639 2023-03-17................................................................................................................................................................................................................................................................................................International Bank for Reconstruction and Development2.12%
0.03 2,332,556 2,369,639 2020-11-01
General Motors Financial Company Inc 4.2% 0.03 2,331,179 2,302,499 2021-03-01Intel Corporation 3.73% 0.03 2,328,845 2,499,072 2047-12-08Federal National Mortgage Association 2% 0.03 2,326,219 2,428,277 2030-03-01Kreditanstalt Fur Wiederaufbau 1.5% 0.03 2,319,950 2,369,639 2020-04-20................................................................................................................................................................................................................................................................................................Government National Mortgage Association 4% 0.03 2,317,687 2,272,264 2047-03-20European Investment Bank 2% 0.03 2,315,649 2,369,639 2021-03-15Federal Home Loan Mortgage Corporation 2.5% 0.03 2,311,583 2,396,311 2031-10-01Federal Home Loan Mortgage Corporation 2% 0.03 2,308,288 2,399,488 2028-05-01Government National Mortgage Association 3% 0.03 2,302,702 2,366,056 2043-03-15................................................................................................................................................................................................................................................................................................
©2018 Morningstar, Inc., Morningstar Investment Profiles™ 312-696-6000. All rights reserved. The information contained herein: (1) is proprietary to Morningstar and/or its content providers; (2) maynot be copied or distributed and (3) is not warranted to be accurate, complete or timely. Neither Morningstar nor its content providers are responsible for any damages or losses arising from any use ofinformation. Past performance is no guarantee of future performance. Visit our investment website at www.morningstar.com ß
®

Page 16 of 162
Broad Market Bond Index Fund.......................................................................................................................................................................................................................................................................................................................................
Total Stocks Total Bonds Total Cash0 9083 28
Bond Portfolio Analysis as of 09-30-18Security Name Net Assets % Market Value $ Amount $ Maturity Date
Wec Energy Group Incorporation 2.45% 0.03 2,301,458 2,330,145 2020-06-15Federal National Mortgage Association 3% 0.03 2,299,945 2,314,505 2027-06-01Republic of Colombia 3.88% 0.03 2,298,549 2,369,639 2027-04-25Sumitomo Mitsui Financial Group Inc 2.44% 0.03 2,292,957 2,369,639 2021-10-19Federal National Mortgage Association 3.5% 0.03 2,290,978 2,326,749 2048-01-01................................................................................................................................................................................................................................................................................................Federal National Mortgage Association 4.5% 0.03 2,285,594 2,214,883 2048-04-01United Technologies Corporation 4.5% 0.03 2,283,382 2,309,678 2042-06-01Federal National Mortgage Association 1.5% 0.03 2,277,819 2,330,869 2020-07-30Federal Home Loan Mortgage Corporation 4% 0.03 2,275,726 2,246,949 2044-12-01Federal National Mortgage Association 3.5% 0.03 2,275,486 2,306,188 2047-01-01................................................................................................................................................................................................................................................................................................Apple Inc. 2.1% 0.03 2,269,820 2,369,639 2022-09-12European Investment Bank 2% 0.03 2,268,936 2,369,639 2022-12-15Hewlett Packard Enterprise Company 4.9% 0.03 2,265,344 2,203,764 2025-10-15Bank of America Corporation 2.62% 0.03 2,262,980 2,290,651 2020-10-19United Health Group Incorporated 3.75% 0.03 2,261,861 2,251,157 2025-07-15................................................................................................................................................................................................................................................................................................Federal National Mortgage Association 4.5% 0.03 2,259,068 2,188,458 2047-10-01Kellogg Company 4% 0.03 2,259,027 2,224,301 2020-12-15Federal National Mortgage Association 3.5% 0.03 2,259,023 2,291,070 2047-12-01United States Treasury Bonds 6% 0.03 2,258,944 1,887,676 2026-02-15Landwirtschaftliche Rentenbank 2.38% 0.03 2,258,171 2,369,639 2025-06-10................................................................................................................................................................................................................................................................................................United Parcel Service, Inc. 2.05% 0.03 2,257,483 2,318,296 2021-04-01Southern Company 2.95% 0.03 2,257,336 2,349,892 2023-07-01Vodafone Group plc 3.75% 0.03 2,256,884 2,282,752 2024-01-16Cisco Systems, Inc. 2.2% 0.03 2,255,417 2,369,639 2023-09-20Microsoft Corporation 4.45% 0.03 2,254,878 2,105,657 2045-11-03Federal National Mortgage Association 6.62% 0.03 2,254,204 1,710,759 2030-11-15Federal National Mortgage Association 4.5% 0.03 2,253,838 2,183,040 2047-05-01Government National Mortgage Association 3% 0.03 2,249,794 2,313,413 2045-04-20American Express Company 2.5% 0.03 2,248,855 2,345,942 2022-08-01Federal National Mortgage Association 4% 0.03 2,246,136 2,209,376 2043-08-01................................................................................................................................................................................................................................................................................................Crown Castle International Corp. 3.2% 0.03 2,244,288 2,361,740 2024-09-01U.S. Bancorp 3.1% 0.03 2,240,609 2,369,639 2026-04-27Bank of America Corporation 7.75% 0.03 2,239,429 1,659,119 2038-05-14Government National Mortgage Association 3.5% 0.03 2,238,148 2,247,446 2045-08-20Government National Mortgage Association 4.5% 0.03 2,236,280 2,161,768 2047-11-20................................................................................................................................................................................................................................................................................................Government National Mortgage Association 4% 0.03 2,235,966 2,194,389 2047-04-20Continental Resources, Inc. 4.38% 0.03 2,234,329 2,251,157 2028-01-15Federal Home Loan Mortgage Corporation 3% 0.03 2,230,937 2,311,560 2043-01-01GNMA PASS-THRU M SINGLE FAMILY 3.5% 0.03 2,228,208 2,232,693 2044-09-20Government National Mortgage Association 4% 0.03 2,224,195 2,185,357 2047-11-20................................................................................................................................................................................................................................................................................................Federal Home Loan Mortgage Corporation 3.5% 0.03 2,218,261 2,236,274 2042-04-01Kreditanstalt Fur Wiederaufbau 1.75% 0.03 2,208,402 2,231,410 2019-10-15Government National Mortgage Association 4.5% 0.03 2,207,737 2,134,176 2048-09-20Federal Farm Credit Banks 2.55% 0.03 2,207,057 2,215,967 2020-05-15Federal Home Loan Mortgage Corporation 4.5% 0.03 2,202,471 2,110,967 2041-08-01................................................................................................................................................................................................................................................................................................PNC Financial Services Group Inc 3.9% 0.03 2,200,620 2,211,663 2024-04-29Philippines (Republic Of) 7.75% 0.03 2,192,901 1,624,474 2031-01-14AbbVie Inc. 4.4% 0.03 2,191,274 2,366,650 2042-11-06TransCanada Pipelines Limited 4.88% 0.03 2,189,503 2,093,181 2026-01-15Federal National Mortgage Association 7.25% 0.03 2,183,949 1,596,742 2030-05-15................................................................................................................................................................................................................................................................................................Federal Home Loan Mortgage Corporation 4% 0.03 2,181,993 2,150,298 2044-11-01Federal National Mortgage Association 3% 0.03 2,181,266 2,269,379 2045-07-01Federal National Mortgage Association 1% 0.03 2,177,168 2,215,967 2019-10-24Cenovus Energy Inc 6.75% 0.03 2,170,578 1,924,732 2039-11-15Federal National Mortgage Association 2.5% 0.03 2,165,340 2,233,746 2030-06-01................................................................................................................................................................................................................................................................................................Government National Mortgage Association 3% 0.03 2,164,912 2,226,840 2045-07-20Federal National Mortgage Association 4% 0.03 2,158,723 2,133,611 2047-01-01Federal Home Loan Mortgage Corporation 3.5% 0.03 2,152,561 2,170,045 2043-05-01Federal National Mortgage Association 4% 0.03 2,151,450 2,125,693 2044-04-01Government National Mortgage Association 3% 0.03 2,151,123 2,218,409 2047-04-20................................................................................................................................................................................................................................................................................................
©2018 Morningstar, Inc., Morningstar Investment Profiles™ 312-696-6000. All rights reserved. The information contained herein: (1) is proprietary to Morningstar and/or its content providers; (2) maynot be copied or distributed and (3) is not warranted to be accurate, complete or timely. Neither Morningstar nor its content providers are responsible for any damages or losses arising from any use ofinformation. Past performance is no guarantee of future performance. Visit our investment website at www.morningstar.com ß
®

Page 17 of 162
Broad Market Bond Index Fund.......................................................................................................................................................................................................................................................................................................................................
Total Stocks Total Bonds Total Cash0 9083 28
Bond Portfolio Analysis as of 09-30-18Security Name Net Assets % Market Value $ Amount $ Maturity Date
Federal National Mortgage Association 3% 0.03 2,148,221 2,236,978 2046-08-01Australia and New Zealand Banking Group Limited 2.7% 0.03 2,146,337 2,172,169 2020-11-16Constellation Brands, Inc. 3.6% 0.03 2,143,382 2,290,651 2028-02-15Federal National Mortgage Association 4% 0.03 2,142,973 2,113,133 2047-03-01Federal Home Loan Mortgage Corporation 4% 0.03 2,141,023 2,101,742 2042-06-01................................................................................................................................................................................................................................................................................................Synchrony Financial 3.7% 0.03 2,140,267 2,369,639 2026-08-04National Australia Bank Limited New York Branch 2.5% 0.03 2,140,205 2,369,639 2026-07-12Federal Home Loan Mortgage Corporation 3.5% 0.03 2,139,618 2,172,364 2048-03-01Federal National Mortgage Association 3.5% 0.03 2,138,786 2,164,244 2046-02-01Federal Home Loan Mortgage Corporation 3.5% 0.03 2,136,098 2,170,349 2049-12-31................................................................................................................................................................................................................................................................................................Oneok Inc. 4.55% 0.03 2,135,376 2,124,776 2028-07-15Federal Home Loan Mortgage Corporation 3% 0.03 2,134,381 2,228,993 2048-02-01Federal Home Loan Mortgage Corporation 4% 0.03 2,130,888 2,107,622 2047-06-01Federal Home Loan Mortgage Corporation 4.5% 0.03 2,130,073 2,041,768 2039-10-01Federal National Mortgage Association 4.5% 0.03 2,119,769 2,053,061 2047-04-01................................................................................................................................................................................................................................................................................................Federal National Mortgage Association 3% 0.03 2,118,678 2,142,923 2032-02-01Government National Mortgage Association 5% 0.03 2,117,862 1,994,029 2039-02-15The Kroger Co. 2.65% 0.02 2,114,312 2,369,639 2026-10-15Government National Mortgage Association 3.5% 0.02 2,113,233 2,113,136 2043-09-20Federal National Mortgage Association 3.5% 0.02 2,111,859 2,136,765 2044-11-01Federal National Mortgage Association 4% 0.02 2,111,338 2,088,114 2046-02-01Federal Home Loan Mortgage Corporation 3.5% 0.02 2,110,127 2,129,920 2044-09-01Federal Home Loan Mortgage Corporation 2.5% 0.02 2,107,655 2,184,864 2031-05-01Federal National Mortgage Association 3.5% 0.02 2,107,089 2,139,984 2048-02-01Government National Mortgage Association 5% 0.02 2,103,964 2,009,336 2048-07-20................................................................................................................................................................................................................................................................................................Federal Home Loan Mortgage Corporation 3.5% 0.02 2,103,522 2,133,205 2046-06-01Government National Mortgage Association 4% 0.02 2,099,769 2,060,991 2045-08-20Westpac Banking Corporation 2.15% 0.02 2,097,560 2,124,776 2020-03-06Amazon.com, Inc. 2.6% 0.02 2,083,122 2,089,231 2019-12-05Government National Mortgage Association 4% 0.02 2,075,276 2,031,967 2047-06-20................................................................................................................................................................................................................................................................................................Federal Home Loan Banks 1.38% 0.02 2,073,814 2,133,894 2020-09-28Federal National Mortgage Association 3.5% 0.02 2,066,529 2,081,120 2044-09-01Government National Mortgage Association 4% 0.02 2,065,421 2,020,958 2042-05-20Intel Corporation 3.7% 0.02 2,059,499 2,045,788 2025-07-29Government National Mortgage Association 3% 0.02 2,057,740 2,105,646 2043-01-20................................................................................................................................................................................................................................................................................................BlackRock, Inc. 3.2% 0.02 2,055,327 2,132,675 2027-03-15Altera Corporation 4.1% 0.02 2,054,615 1,988,917 2023-11-15Federal National Mortgage Association 3.5% 0.02 2,047,998 2,063,682 2045-12-01Government National Mortgage Association 2.5% 0.02 2,046,645 2,180,664 2046-11-20Federal Home Loan Mortgage Corporation 3% 0.02 2,043,198 2,131,669 2046-12-01................................................................................................................................................................................................................................................................................................B.A.T. Capital Corporation 4.54% 0.02 2,038,982 2,213,442 2047-08-15Government National Mortgage Association 5% 0.02 2,036,067 1,912,457 2041-06-20AbbVie Inc. 2.9% 0.02 2,033,538 2,093,181 2022-11-06Petroleos Mexicanos 6.38% 0.02 2,032,893 2,195,349 2045-01-23Chevron Corporation 2.95% 0.02 2,032,837 2,128,725 2026-05-16................................................................................................................................................................................................................................................................................................Federal National Mortgage Association 2% 0.02 2,032,441 2,092,858 2022-01-05Federal National Mortgage Association 3.5% 0.02 2,031,754 2,055,716 2045-01-01AT&T Inc 3.4% 0.02 2,026,693 2,128,725 2025-05-15Barclays Bank plc 5.14% 0.02 2,023,482 1,974,699 2020-10-14Anheuser-Busch InBev Finance Inc. 4.7% 0.02 2,021,753 2,019,044 2036-02-01................................................................................................................................................................................................................................................................................................Ford Motor Credit Company LLC 3.16% 0.02 2,017,932 2,037,889 2020-08-04Federal National Mortgage Association 4.5% 0.02 2,016,773 1,938,051 2042-01-01Federal National Mortgage Association 4% 0.02 2,016,748 1,994,476 2046-01-01Federal National Mortgage Association 4% 0.02 2,007,834 1,987,000 2047-03-01Federal National Mortgage Association 4% 0.02 2,004,750 1,970,442 2042-02-01................................................................................................................................................................................................................................................................................................Government National Mortgage Association 4% 0.02 2,003,879 1,955,046 2044-03-20The Dow Chemical Company 3% 0.02 2,001,815 2,053,687 2022-11-15ConocoPhillips 6.5% 0.02 1,998,909 1,539,785 2039-02-01AT&T Inc 6.38% 0.02 1,998,646 1,813,867 2041-03-01Oracle Corporation 3.25% 0.02 1,995,083 2,073,434 2027-11-15................................................................................................................................................................................................................................................................................................
©2018 Morningstar, Inc., Morningstar Investment Profiles™ 312-696-6000. All rights reserved. The information contained herein: (1) is proprietary to Morningstar and/or its content providers; (2) maynot be copied or distributed and (3) is not warranted to be accurate, complete or timely. Neither Morningstar nor its content providers are responsible for any damages or losses arising from any use ofinformation. Past performance is no guarantee of future performance. Visit our investment website at www.morningstar.com ß
®

Page 18 of 162
Broad Market Bond Index Fund.......................................................................................................................................................................................................................................................................................................................................
Total Stocks Total Bonds Total Cash0 9083 28
Bond Portfolio Analysis as of 09-30-18Security Name Net Assets % Market Value $ Amount $ Maturity Date
Kraft Heinz Foods Company 3% 0.02 1,993,582 2,184,017 2026-06-01Federal Home Loan Mortgage Corporation 3.5% 0.02 1,985,644 2,012,825 2046-07-01Government National Mortgage Association 5% 0.02 1,981,456 1,863,670 2041-09-20Telefonica Emisiones S.A.U. 7.04% 0.02 1,978,338 1,639,871 2036-06-20JPMorgan Chase & Co. 3.9% 0.02 1,977,948 1,978,648 2025-07-15................................................................................................................................................................................................................................................................................................Citigroup Inc. 4.4% 0.02 1,975,029 1,974,699 2025-06-10Federal National Mortgage Association 3.5% 0.02 1,970,138 1,986,220 2042-01-01Federal National Mortgage Association 3% 0.02 1,970,033 2,056,584 2046-09-01The Republic of Peru 5.62% 0.02 1,969,374 1,659,119 2050-11-18The TJX Companies Inc. 2.25% 0.02 1,967,101 2,172,169 2026-09-15................................................................................................................................................................................................................................................................................................Federal National Mortgage Association 3.5% 0.02 1,964,822 1,980,764 2043-07-01Lockheed Martin Corporation 3.55% 0.02 1,963,257 1,986,547 2026-01-15Inter-American Development Bank 3% 0.02 1,962,078 1,974,699 2024-02-21KeyCorp 2.9% 0.02 1,961,237 1,974,699 2020-09-15GE Capital International Funding Company UnlimitedCompany 3.37%
0.02 1,955,050 2,053,687 2025-11-15
Federal Home Loan Mortgage Corporation 4% 0.02 1,954,076 1,909,053 2026-09-01Motorola Solutions Inc 4% 0.02 1,951,150 1,990,496 2024-09-01Canadian National Railway Company 2.75% 0.02 1,950,622 2,073,434 2026-03-01General Electric Company 6.88% 0.02 1,950,142 1,561,342 2039-01-10Government National Mortgage Association 4.5% 0.02 1,945,233 1,880,419 2047-08-20................................................................................................................................................................................................................................................................................................European Investment Bank 2.38% 0.02 1,944,835 1,974,699 2021-05-13Royal Bank of Canada 2.5% 0.02 1,942,470 1,974,699 2021-01-19United Health Group Incorporated 3.45% 0.02 1,933,007 1,974,699 2027-01-15Federal Home Loan Mortgage Corporation 4.5% 0.02 1,931,104 1,869,833 2048-07-01Thermo Fisher Scientific Inc 4.15% 0.02 1,930,988 1,895,711 2024-02-01................................................................................................................................................................................................................................................................................................Federal Home Loan Mortgage Corporation 6.75% 0.02 1,929,802 1,440,810 2031-03-15Ford Motor Credit Company LLC 3.66% 0.02 1,928,639 2,062,375 2024-09-08Federal National Mortgage Association 3% 0.02 1,927,416 1,949,473 2032-04-01Federal National Mortgage Association 4% 0.02 1,925,606 1,899,681 2048-05-01Federal Home Loan Mortgage Corporation 3% 0.02 1,924,167 1,993,807 2043-07-01................................................................................................................................................................................................................................................................................................Government National Mortgage Association 3.5% 0.02 1,922,396 1,932,284 2045-05-20Government National Mortgage Association 3.5% 0.02 1,922,246 1,925,838 2047-07-20The Home Depot, Inc. 5.95% 0.02 1,921,740 1,543,635 2041-04-01Federal Home Loan Mortgage Corporation 3.5% 0.02 1,921,259 1,936,860 2044-02-01Orange S.A. 9% 0.02 1,920,394 1,353,086 2031-03-01................................................................................................................................................................................................................................................................................................Federal National Mortgage Association 3% 0.02 1,920,363 2,004,730 2046-08-01Federal National Mortgage Association 4% 0.02 1,919,900 1,899,019 2047-06-01Federal National Mortgage Association 3.5% 0.02 1,916,118 1,931,758 2042-07-01Federal Home Loan Mortgage Corporation 4% 0.02 1,910,390 1,875,338 2042-06-01Federal Home Loan Mortgage Corporation 3% 0.02 1,909,110 1,991,777 2046-09-01................................................................................................................................................................................................................................................................................................Express Scripts Holding Co 4.5% 0.02 1,908,708 1,891,761 2026-02-25Federal National Mortgage Association 4% 0.02 1,898,970 1,879,275 2047-04-01CALIFORNIA ST 2.19% 0.02 1,898,305 1,924,732 2047-04-01Federal National Mortgage Association 3.5% 0.02 1,896,149 1,924,559 2047-08-01Federal National Mortgage Association 3.5% 0.02 1,896,134 1,922,528 2047-04-01................................................................................................................................................................................................................................................................................................Federal National Mortgage Association 3.5% 0.02 1,894,757 1,913,660 2043-08-01Sumitomo Mitsui Financial Group Inc 3.54% 0.02 1,889,951 1,974,699 2028-01-17Federal National Mortgage Association 3.5% 0.02 1,889,634 1,911,927 2045-12-01Aetna, Inc. 2.8% 0.02 1,888,289 1,970,749 2023-06-15Federal National Mortgage Association 3% 0.02 1,887,310 1,908,907 2031-04-01................................................................................................................................................................................................................................................................................................Federal Home Loan Mortgage Corporation 3.5% 0.02 1,885,109 1,900,386 2042-04-01Westpac Banking Corporation 3.35% 0.02 1,882,115 1,974,699 2027-03-08Government National Mortgage Association 2.5% 0.02 1,881,176 2,004,356 2046-12-20PNC Funding Corp. 3.3% 0.02 1,880,066 1,887,812 2022-03-08Federal Home Loan Mortgage Corporation 2.5% 0.02 1,880,064 1,948,958 2031-05-01................................................................................................................................................................................................................................................................................................
©2018 Morningstar, Inc., Morningstar Investment Profiles™ 312-696-6000. All rights reserved. The information contained herein: (1) is proprietary to Morningstar and/or its content providers; (2) maynot be copied or distributed and (3) is not warranted to be accurate, complete or timely. Neither Morningstar nor its content providers are responsible for any damages or losses arising from any use ofinformation. Past performance is no guarantee of future performance. Visit our investment website at www.morningstar.com ß
®
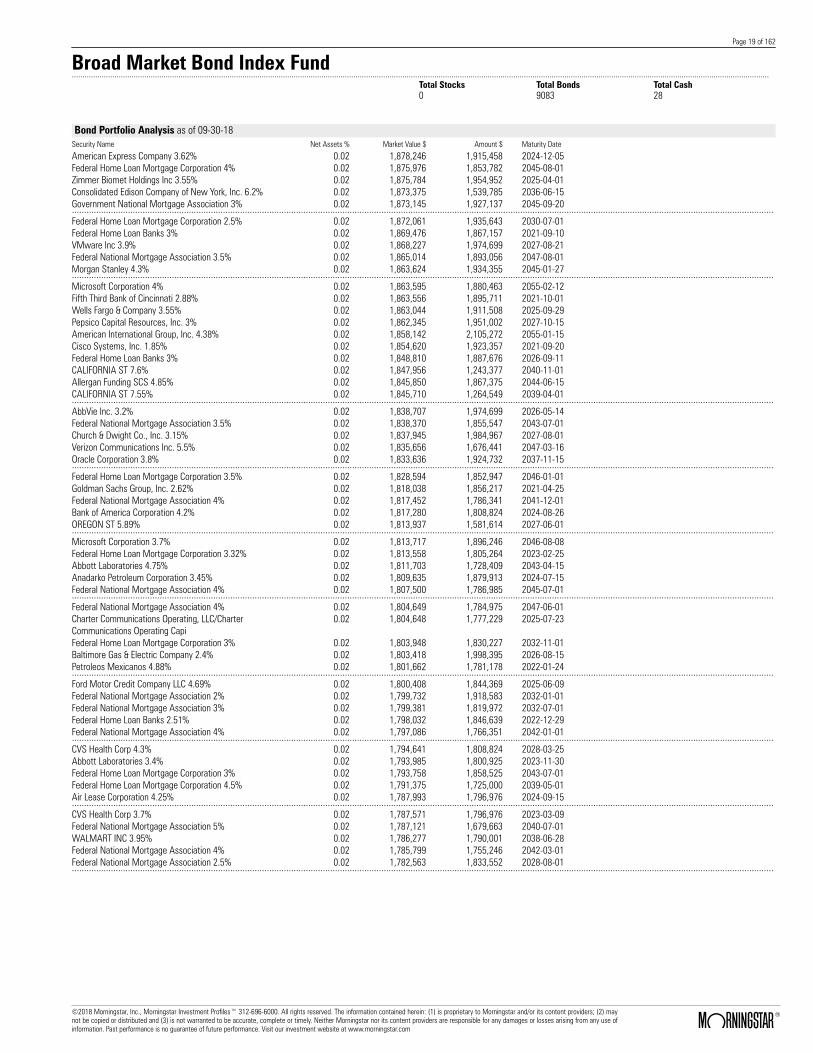
Page 19 of 162
Broad Market Bond Index Fund.......................................................................................................................................................................................................................................................................................................................................
Total Stocks Total Bonds Total Cash0 9083 28
Bond Portfolio Analysis as of 09-30-18Security Name Net Assets % Market Value $ Amount $ Maturity Date
American Express Company 3.62% 0.02 1,878,246 1,915,458 2024-12-05Federal Home Loan Mortgage Corporation 4% 0.02 1,875,976 1,853,782 2045-08-01Zimmer Biomet Holdings Inc 3.55% 0.02 1,875,784 1,954,952 2025-04-01Consolidated Edison Company of New York, Inc. 6.2% 0.02 1,873,375 1,539,785 2036-06-15Government National Mortgage Association 3% 0.02 1,873,145 1,927,137 2045-09-20................................................................................................................................................................................................................................................................................................Federal Home Loan Mortgage Corporation 2.5% 0.02 1,872,061 1,935,643 2030-07-01Federal Home Loan Banks 3% 0.02 1,869,476 1,867,157 2021-09-10VMware Inc 3.9% 0.02 1,868,227 1,974,699 2027-08-21Federal National Mortgage Association 3.5% 0.02 1,865,014 1,893,056 2047-08-01Morgan Stanley 4.3% 0.02 1,863,624 1,934,355 2045-01-27................................................................................................................................................................................................................................................................................................Microsoft Corporation 4% 0.02 1,863,595 1,880,463 2055-02-12Fifth Third Bank of Cincinnati 2.88% 0.02 1,863,556 1,895,711 2021-10-01Wells Fargo & Company 3.55% 0.02 1,863,044 1,911,508 2025-09-29Pepsico Capital Resources, Inc. 3% 0.02 1,862,345 1,951,002 2027-10-15American International Group, Inc. 4.38% 0.02 1,858,142 2,105,272 2055-01-15Cisco Systems, Inc. 1.85% 0.02 1,854,620 1,923,357 2021-09-20Federal Home Loan Banks 3% 0.02 1,848,810 1,887,676 2026-09-11CALIFORNIA ST 7.6% 0.02 1,847,956 1,243,377 2040-11-01Allergan Funding SCS 4.85% 0.02 1,845,850 1,867,375 2044-06-15CALIFORNIA ST 7.55% 0.02 1,845,710 1,264,549 2039-04-01................................................................................................................................................................................................................................................................................................AbbVie Inc. 3.2% 0.02 1,838,707 1,974,699 2026-05-14Federal National Mortgage Association 3.5% 0.02 1,838,370 1,855,547 2043-07-01Church & Dwight Co., Inc. 3.15% 0.02 1,837,945 1,984,967 2027-08-01Verizon Communications Inc. 5.5% 0.02 1,835,656 1,676,441 2047-03-16Oracle Corporation 3.8% 0.02 1,833,636 1,924,732 2037-11-15................................................................................................................................................................................................................................................................................................Federal Home Loan Mortgage Corporation 3.5% 0.02 1,828,594 1,852,947 2046-01-01Goldman Sachs Group, Inc. 2.62% 0.02 1,818,038 1,856,217 2021-04-25Federal National Mortgage Association 4% 0.02 1,817,452 1,786,341 2041-12-01Bank of America Corporation 4.2% 0.02 1,817,280 1,808,824 2024-08-26OREGON ST 5.89% 0.02 1,813,937 1,581,614 2027-06-01................................................................................................................................................................................................................................................................................................Microsoft Corporation 3.7% 0.02 1,813,717 1,896,246 2046-08-08Federal Home Loan Mortgage Corporation 3.32% 0.02 1,813,558 1,805,264 2023-02-25Abbott Laboratories 4.75% 0.02 1,811,703 1,728,409 2043-04-15Anadarko Petroleum Corporation 3.45% 0.02 1,809,635 1,879,913 2024-07-15Federal National Mortgage Association 4% 0.02 1,807,500 1,786,985 2045-07-01................................................................................................................................................................................................................................................................................................Federal National Mortgage Association 4% 0.02 1,804,649 1,784,975 2047-06-01Charter Communications Operating, LLC/CharterCommunications Operating Capi
0.02 1,804,648 1,777,229 2025-07-23
Federal Home Loan Mortgage Corporation 3% 0.02 1,803,948 1,830,227 2032-11-01Baltimore Gas & Electric Company 2.4% 0.02 1,803,418 1,998,395 2026-08-15Petroleos Mexicanos 4.88% 0.02 1,801,662 1,781,178 2022-01-24................................................................................................................................................................................................................................................................................................Ford Motor Credit Company LLC 4.69% 0.02 1,800,408 1,844,369 2025-06-09Federal National Mortgage Association 2% 0.02 1,799,732 1,918,583 2032-01-01Federal National Mortgage Association 3% 0.02 1,799,381 1,819,972 2032-07-01Federal Home Loan Banks 2.51% 0.02 1,798,032 1,846,639 2022-12-29Federal National Mortgage Association 4% 0.02 1,797,086 1,766,351 2042-01-01................................................................................................................................................................................................................................................................................................CVS Health Corp 4.3% 0.02 1,794,641 1,808,824 2028-03-25Abbott Laboratories 3.4% 0.02 1,793,985 1,800,925 2023-11-30Federal Home Loan Mortgage Corporation 3% 0.02 1,793,758 1,858,525 2043-07-01Federal Home Loan Mortgage Corporation 4.5% 0.02 1,791,375 1,725,000 2039-05-01Air Lease Corporation 4.25% 0.02 1,787,993 1,796,976 2024-09-15................................................................................................................................................................................................................................................................................................CVS Health Corp 3.7% 0.02 1,787,571 1,796,976 2023-03-09Federal National Mortgage Association 5% 0.02 1,787,121 1,679,663 2040-07-01WALMART INC 3.95% 0.02 1,786,277 1,790,001 2038-06-28Federal National Mortgage Association 4% 0.02 1,785,799 1,755,246 2042-03-01Federal National Mortgage Association 2.5% 0.02 1,782,563 1,833,552 2028-08-01................................................................................................................................................................................................................................................................................................
©2018 Morningstar, Inc., Morningstar Investment Profiles™ 312-696-6000. All rights reserved. The information contained herein: (1) is proprietary to Morningstar and/or its content providers; (2) maynot be copied or distributed and (3) is not warranted to be accurate, complete or timely. Neither Morningstar nor its content providers are responsible for any damages or losses arising from any use ofinformation. Past performance is no guarantee of future performance. Visit our investment website at www.morningstar.com ß
®
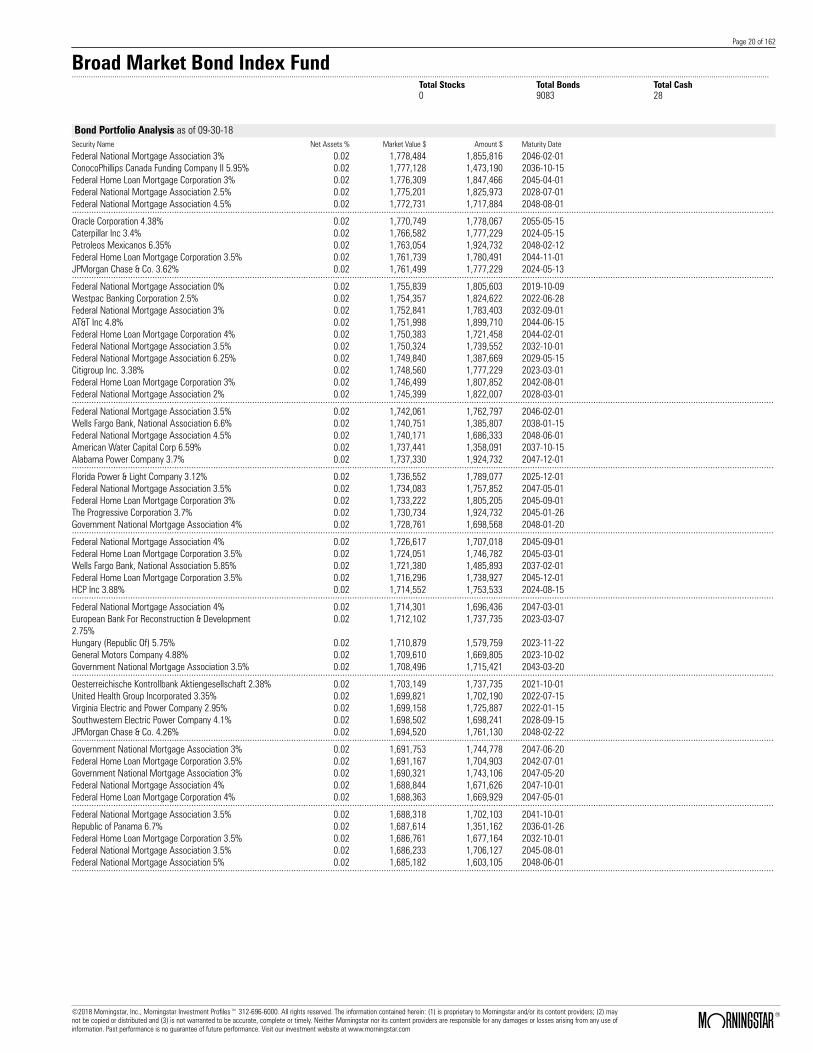
Page 20 of 162
Broad Market Bond Index Fund.......................................................................................................................................................................................................................................................................................................................................
Total Stocks Total Bonds Total Cash0 9083 28
Bond Portfolio Analysis as of 09-30-18Security Name Net Assets % Market Value $ Amount $ Maturity Date
Federal National Mortgage Association 3% 0.02 1,778,484 1,855,816 2046-02-01ConocoPhillips Canada Funding Company II 5.95% 0.02 1,777,128 1,473,190 2036-10-15Federal Home Loan Mortgage Corporation 3% 0.02 1,776,309 1,847,466 2045-04-01Federal National Mortgage Association 2.5% 0.02 1,775,201 1,825,973 2028-07-01Federal National Mortgage Association 4.5% 0.02 1,772,731 1,717,884 2048-08-01................................................................................................................................................................................................................................................................................................Oracle Corporation 4.38% 0.02 1,770,749 1,778,067 2055-05-15Caterpillar Inc 3.4% 0.02 1,766,582 1,777,229 2024-05-15Petroleos Mexicanos 6.35% 0.02 1,763,054 1,924,732 2048-02-12Federal Home Loan Mortgage Corporation 3.5% 0.02 1,761,739 1,780,491 2044-11-01JPMorgan Chase & Co. 3.62% 0.02 1,761,499 1,777,229 2024-05-13................................................................................................................................................................................................................................................................................................Federal National Mortgage Association 0% 0.02 1,755,839 1,805,603 2019-10-09Westpac Banking Corporation 2.5% 0.02 1,754,357 1,824,622 2022-06-28Federal National Mortgage Association 3% 0.02 1,752,841 1,783,403 2032-09-01AT&T Inc 4.8% 0.02 1,751,998 1,899,710 2044-06-15Federal Home Loan Mortgage Corporation 4% 0.02 1,750,383 1,721,458 2044-02-01Federal National Mortgage Association 3.5% 0.02 1,750,324 1,739,552 2032-10-01Federal National Mortgage Association 6.25% 0.02 1,749,840 1,387,669 2029-05-15Citigroup Inc. 3.38% 0.02 1,748,560 1,777,229 2023-03-01Federal Home Loan Mortgage Corporation 3% 0.02 1,746,499 1,807,852 2042-08-01Federal National Mortgage Association 2% 0.02 1,745,399 1,822,007 2028-03-01................................................................................................................................................................................................................................................................................................Federal National Mortgage Association 3.5% 0.02 1,742,061 1,762,797 2046-02-01Wells Fargo Bank, National Association 6.6% 0.02 1,740,751 1,385,807 2038-01-15Federal National Mortgage Association 4.5% 0.02 1,740,171 1,686,333 2048-06-01American Water Capital Corp 6.59% 0.02 1,737,441 1,358,091 2037-10-15Alabama Power Company 3.7% 0.02 1,737,330 1,924,732 2047-12-01................................................................................................................................................................................................................................................................................................Florida Power & Light Company 3.12% 0.02 1,736,552 1,789,077 2025-12-01Federal National Mortgage Association 3.5% 0.02 1,734,083 1,757,852 2047-05-01Federal Home Loan Mortgage Corporation 3% 0.02 1,733,222 1,805,205 2045-09-01The Progressive Corporation 3.7% 0.02 1,730,734 1,924,732 2045-01-26Government National Mortgage Association 4% 0.02 1,728,761 1,698,568 2048-01-20................................................................................................................................................................................................................................................................................................Federal National Mortgage Association 4% 0.02 1,726,617 1,707,018 2045-09-01Federal Home Loan Mortgage Corporation 3.5% 0.02 1,724,051 1,746,782 2045-03-01Wells Fargo Bank, National Association 5.85% 0.02 1,721,380 1,485,893 2037-02-01Federal Home Loan Mortgage Corporation 3.5% 0.02 1,716,296 1,738,927 2045-12-01HCP Inc 3.88% 0.02 1,714,552 1,753,533 2024-08-15................................................................................................................................................................................................................................................................................................Federal National Mortgage Association 4% 0.02 1,714,301 1,696,436 2047-03-01European Bank For Reconstruction & Development2.75%
0.02 1,712,102 1,737,735 2023-03-07
Hungary (Republic Of) 5.75% 0.02 1,710,879 1,579,759 2023-11-22General Motors Company 4.88% 0.02 1,709,610 1,669,805 2023-10-02Government National Mortgage Association 3.5% 0.02 1,708,496 1,715,421 2043-03-20................................................................................................................................................................................................................................................................................................Oesterreichische Kontrollbank Aktiengesellschaft 2.38% 0.02 1,703,149 1,737,735 2021-10-01United Health Group Incorporated 3.35% 0.02 1,699,821 1,702,190 2022-07-15Virginia Electric and Power Company 2.95% 0.02 1,699,158 1,725,887 2022-01-15Southwestern Electric Power Company 4.1% 0.02 1,698,502 1,698,241 2028-09-15JPMorgan Chase & Co. 4.26% 0.02 1,694,520 1,761,130 2048-02-22................................................................................................................................................................................................................................................................................................Government National Mortgage Association 3% 0.02 1,691,753 1,744,778 2047-06-20Federal Home Loan Mortgage Corporation 3.5% 0.02 1,691,167 1,704,903 2042-07-01Government National Mortgage Association 3% 0.02 1,690,321 1,743,106 2047-05-20Federal National Mortgage Association 4% 0.02 1,688,844 1,671,626 2047-10-01Federal Home Loan Mortgage Corporation 4% 0.02 1,688,363 1,669,929 2047-05-01................................................................................................................................................................................................................................................................................................Federal National Mortgage Association 3.5% 0.02 1,688,318 1,702,103 2041-10-01Republic of Panama 6.7% 0.02 1,687,614 1,351,162 2036-01-26Federal Home Loan Mortgage Corporation 3.5% 0.02 1,686,761 1,677,164 2032-10-01Federal National Mortgage Association 3.5% 0.02 1,686,233 1,706,127 2045-08-01Federal National Mortgage Association 5% 0.02 1,685,182 1,603,105 2048-06-01................................................................................................................................................................................................................................................................................................
©2018 Morningstar, Inc., Morningstar Investment Profiles™ 312-696-6000. All rights reserved. The information contained herein: (1) is proprietary to Morningstar and/or its content providers; (2) maynot be copied or distributed and (3) is not warranted to be accurate, complete or timely. Neither Morningstar nor its content providers are responsible for any damages or losses arising from any use ofinformation. Past performance is no guarantee of future performance. Visit our investment website at www.morningstar.com ß
®

Page 21 of 162
Broad Market Bond Index Fund.......................................................................................................................................................................................................................................................................................................................................
Total Stocks Total Bonds Total Cash0 9083 28
Bond Portfolio Analysis as of 09-30-18Security Name Net Assets % Market Value $ Amount $ Maturity Date
Federal National Mortgage Association 4% 0.02 1,684,853 1,666,157 2047-12-01Federal National Mortgage Association 4% 0.02 1,682,482 1,653,719 2040-12-01Telefonica Emisiones S.A.U. 4.1% 0.02 1,681,859 1,749,583 2027-03-08Federal National Mortgage Association 3.5% 0.02 1,677,731 1,666,225 2027-01-01Boardwalk Pipelines LP 5.95% 0.02 1,671,832 1,579,759 2026-06-01................................................................................................................................................................................................................................................................................................Government National Mortgage Association 3.5% 0.02 1,670,762 1,677,820 2045-04-20Federal Home Loan Mortgage Corporation 4% 0.02 1,666,527 1,635,950 2042-06-01Federal Home Loan Mortgage Corporation 4% 0.02 1,665,537 1,646,318 2045-11-01Pepsico Capital Resources, Inc. 2.15% 0.02 1,663,244 1,690,342 2020-10-14Poland (Republic of) 5% 0.02 1,660,911 1,579,759 2022-03-23................................................................................................................................................................................................................................................................................................Federal Home Loan Mortgage Corporation 3.5% 0.02 1,658,292 1,671,706 2043-05-01Nasdaq Inc 3.85% 0.02 1,657,513 1,717,988 2026-06-30Federal National Mortgage Association 3.5% 0.02 1,656,362 1,669,883 2042-07-01Federal National Mortgage Association 2.5% 0.02 1,655,092 1,707,433 2030-07-01GNMA PASS-THRU M SINGLE FAMILY 3.5% 0.02 1,654,650 1,659,983 2044-11-20Shell International Finance B.V. 6.38% 0.02 1,652,545 1,279,177 2038-12-15Federal Home Loan Mortgage Corporation 2.5% 0.02 1,652,361 1,700,854 2027-11-01Federal National Mortgage Association 3.5% 0.02 1,647,357 1,635,238 2028-12-01AbbVie Inc. 4.7% 0.02 1,645,832 1,713,011 2045-05-14Verizon Communications Inc. 4.5% 0.02 1,641,646 1,655,269 2033-08-10................................................................................................................................................................................................................................................................................................AT&T Inc 3.95% 0.02 1,640,969 1,666,646 2025-01-15ArcelorMittal S.A. 5.5% 0.02 1,639,324 1,579,759 2021-03-01Ford Motor Credit Company LLC 3.34% 0.02 1,635,136 1,658,747 2021-03-18Federal National Mortgage Association 7.12% 0.02 1,634,480 1,212,027 2030-01-15Federal Home Loan Mortgage Corporation 3% 0.02 1,634,047 1,657,804 2032-03-01................................................................................................................................................................................................................................................................................................Federal National Mortgage Association 3.5% 0.02 1,633,762 1,653,034 2045-04-01McDonald's Corporation 2.2% 0.02 1,631,493 1,654,798 2020-05-26MPLX LP 4.88% 0.02 1,631,477 1,579,759 2025-06-01Federal National Mortgage Association 3.5% 0.02 1,631,276 1,656,065 2047-09-01Federal National Mortgage Association 3% 0.02 1,630,240 1,688,711 2043-02-01................................................................................................................................................................................................................................................................................................General Electric Company 4.62% 0.02 1,627,656 1,579,759 2021-01-07Federal Home Loan Mortgage Corporation 2.5% 0.02 1,627,125 1,680,965 2030-04-01Republic of Colombia 5.62% 0.02 1,624,233 1,510,914 2044-02-26Federal Home Loan Mortgage Corporation 4% 0.02 1,623,158 1,602,926 2046-06-01Flex Limited 5% 0.02 1,622,332 1,579,759 2023-02-15................................................................................................................................................................................................................................................................................................Gilead Sciences, Inc. 4.75% 0.02 1,622,059 1,573,661 2046-03-01Republic of Colombia 6.12% 0.02 1,619,561 1,430,076 2041-01-18AbbVie Inc. 3.38% 0.02 1,617,036 1,619,253 2021-11-14Federal National Mortgage Association 3% 0.02 1,615,996 1,681,274 2045-05-01Government National Mortgage Association 4% 0.02 1,615,674 1,577,305 2046-02-20................................................................................................................................................................................................................................................................................................Federal Home Loan Mortgage Corporation 2% 0.02 1,612,781 1,641,457 2020-11-20America Movil S.A.B. de C.V. 3.12% 0.02 1,612,628 1,646,899 2022-07-163M Company 3.25% 0.02 1,610,541 1,616,094 2024-02-14Federal National Mortgage Association 3% 0.02 1,610,491 1,678,529 2045-10-01Wells Fargo & Company 3.58% 0.02 1,610,478 1,678,494 2028-05-22................................................................................................................................................................................................................................................................................................Discovery Communications, LLC 4.38% 0.02 1,609,855 1,579,759 2021-06-15Federal National Mortgage Association 4% 0.02 1,609,391 1,576,922 2033-06-01CVS Health Corp 5.3% 0.02 1,609,171 1,539,785 2043-12-05Uruguay (Republic of) 4.38% 0.02 1,609,000 1,579,759 2027-10-27Williams Partners LP / Williams Partners FinanceCorporation 4.5%
0.02 1,608,920 1,579,759 2023-11-15
................................................................................................................................................................................................................................................................................................Republic of Colombia 4.38% 0.02 1,608,195 1,579,759 2021-07-12Philippines (Republic Of) 4% 0.02 1,606,275 1,579,759 2021-01-15Cooperatieve Rabobank U.A. 4.62% 0.02 1,603,842 1,579,759 2023-12-01Federal Home Loan Mortgage Corporation 5% 0.02 1,603,558 1,526,836 2048-06-01Lockheed Martin Corporation 4.25% 0.02 1,601,433 1,579,759 2019-11-15................................................................................................................................................................................................................................................................................................
©2018 Morningstar, Inc., Morningstar Investment Profiles™ 312-696-6000. All rights reserved. The information contained herein: (1) is proprietary to Morningstar and/or its content providers; (2) maynot be copied or distributed and (3) is not warranted to be accurate, complete or timely. Neither Morningstar nor its content providers are responsible for any damages or losses arising from any use ofinformation. Past performance is no guarantee of future performance. Visit our investment website at www.morningstar.com ß
®

Page 22 of 162
Broad Market Bond Index Fund.......................................................................................................................................................................................................................................................................................................................................
Total Stocks Total Bonds Total Cash0 9083 28
Bond Portfolio Analysis as of 09-30-18Security Name Net Assets % Market Value $ Amount $ Maturity Date
B.A.T. Capital Corporation 2.76% 0.02 1,598,269 1,658,747 2022-08-15Johnson & Johnson 3.38% 0.02 1,597,125 1,579,759 2023-12-05Aon plc 4% 0.02 1,596,538 1,579,759 2023-11-27CNOOC Finance (2015) USA LLC 4.38% 0.02 1,589,516 1,579,759 2028-05-02Federal National Mortgage Association 4% 0.02 1,588,732 1,572,295 2047-05-01................................................................................................................................................................................................................................................................................................Federal Home Loan Mortgage Corporation 0% 0.02 1,588,262 1,641,457 2019-11-29Federal Home Loan Mortgage Corporation 3.5% 0.02 1,588,097 1,608,024 2045-04-01Intel Corporation 3.3% 0.02 1,588,097 1,579,759 2021-10-01Maple Escrow Subsidiary Inc 4.42% 0.02 1,586,418 1,579,759 2025-05-25Federal National Mortgage Association 2.5% 0.02 1,585,660 1,711,928 2046-10-01................................................................................................................................................................................................................................................................................................Federal National Mortgage Association 4.5% 0.02 1,583,320 1,533,407 2046-09-01Mexico (United Mexican States) 3.62% 0.02 1,582,634 1,579,759 2022-03-15Honeywell International Inc. 3.35% 0.02 1,581,849 1,583,708 2023-12-01Government National Mortgage Association 3.5% 0.02 1,581,609 1,581,536 2042-09-20Pfizer Inc. 3.4% 0.02 1,579,732 1,579,759 2024-05-15Citibank, N.A. 3.4% 0.02 1,579,502 1,579,759 2021-07-23MasterCard Incorporated 3.38% 0.02 1,579,487 1,579,759 2024-04-01Federal Home Loan Mortgage Corporation 4% 0.02 1,577,504 1,548,622 2041-02-01Federal National Mortgage Association 4.5% 0.02 1,576,233 1,515,689 2045-03-01Virginia Electric and Power Company 3.45% 0.02 1,575,355 1,579,759 2022-09-01................................................................................................................................................................................................................................................................................................Host Hotels & Resorts, L.P. 4.5% 0.02 1,573,669 1,579,759 2026-02-01American Express Company 3.7% 0.02 1,571,781 1,579,759 2023-08-03Federal Home Loan Mortgage Corporation 4% 0.02 1,570,941 1,544,981 2044-03-01HSBC Holdings plc 6.5% 0.02 1,570,867 1,324,600 2037-09-15Altria Group, Inc. 2.62% 0.02 1,570,723 1,579,759 2020-01-14................................................................................................................................................................................................................................................................................................Laboratory Corp of America Holdings 2.62% 0.02 1,569,826 1,579,759 2020-02-01Ryder System, Inc. 2.88% 0.02 1,568,517 1,579,759 2020-09-01Federal National Mortgage Association 4% 0.02 1,568,105 1,550,464 2045-09-01Federal National Mortgage Association 3% 0.02 1,566,794 1,584,724 2031-08-01State Street Corporation 3.55% 0.02 1,566,292 1,579,759 2025-08-18................................................................................................................................................................................................................................................................................................Total System Services, Inc. 3.75% 0.02 1,565,851 1,579,759 2023-06-01Ontario (Province Of) 3.2% 0.02 1,565,789 1,579,759 2024-05-16BB&T Corporation 2.62% 0.02 1,565,707 1,579,759 2020-06-29Government National Mortgage Association 3.5% 0.02 1,565,609 1,565,537 2043-08-20AT&T Inc 4.12% 0.02 1,564,842 1,583,708 2026-02-17................................................................................................................................................................................................................................................................................................Cooperatieve Centrale Raiffeisen-Boerenleenbank B.A.,New York Branch 2.25%
0.02 1,564,113 1,579,759 2020-01-14
HSBC Holdings plc 3.6% 0.02 1,564,047 1,579,759 2023-05-25GNMA PASS-THRU M SINGLE FAMILY 4% 0.02 1,563,267 1,525,177 2044-09-20Pfizer Inc. 3% 0.02 1,561,876 1,579,759 2023-06-15International Paper Company 3.65% 0.02 1,561,355 1,579,759 2024-06-15................................................................................................................................................................................................................................................................................................UBS AG Stamford Branch 2.35% 0.02 1,560,834 1,579,759 2020-03-26Apple Inc. 2.9% 0.02 1,559,541 1,654,798 2027-09-12CME Group Inc. 3% 0.02 1,557,642 1,579,759 2022-09-15Lloyds Banking Group plc 3.1% 0.02 1,556,916 1,579,759 2021-07-06Bank of New York Mellon Corporation 2.45% 0.02 1,556,388 1,579,759 2020-11-27................................................................................................................................................................................................................................................................................................Federal National Mortgage Association 3.5% 0.02 1,555,488 1,568,187 2042-12-01EPR Properties 4.95% 0.02 1,552,355 1,579,759 2028-04-15Federal Home Loan Mortgage Corporation 3% 0.02 1,551,893 1,608,070 2043-08-01JPMorgan Chase & Co. 2.4% 0.02 1,551,817 1,591,607 2021-06-07Allergan Finance, LLC 3.25% 0.02 1,551,050 1,579,759 2022-10-01................................................................................................................................................................................................................................................................................................Ventas Realty L.P./Ventas Capital Corp. 3.75% 0.02 1,550,230 1,579,759 2024-05-01International Bank for Reconstruction and Development2.25%
0.02 1,549,947 1,579,759 2021-06-24
European Bank For Reconstruction & Development1.62%
0.02 1,548,846 1,579,759 2020-05-05
International Business Machines Corporation 1.62% 0.02 1,546,892 1,579,759 2020-05-15Bank of America Corporation 3.95% 0.02 1,546,742 1,579,759 2025-04-21................................................................................................................................................................................................................................................................................................
©2018 Morningstar, Inc., Morningstar Investment Profiles™ 312-696-6000. All rights reserved. The information contained herein: (1) is proprietary to Morningstar and/or its content providers; (2) maynot be copied or distributed and (3) is not warranted to be accurate, complete or timely. Neither Morningstar nor its content providers are responsible for any damages or losses arising from any use ofinformation. Past performance is no guarantee of future performance. Visit our investment website at www.morningstar.com ß
®

Page 23 of 162
Broad Market Bond Index Fund.......................................................................................................................................................................................................................................................................................................................................
Total Stocks Total Bonds Total Cash0 9083 28
Bond Portfolio Analysis as of 09-30-18Security Name Net Assets % Market Value $ Amount $ Maturity Date
Alibaba Group Holding Ltd 3.4% 0.02 1,546,110 1,658,747 2027-12-06Federal Home Loan Mortgage Corporation 2.5% 0.02 1,544,537 1,601,173 2031-10-01Inter-American Development Bank 2.5% 0.02 1,543,666 1,579,759 2023-01-18Sempra Energy 3.55% 0.02 1,543,632 1,579,759 2024-06-15Kreditanstalt Fur Wiederaufbau 1.88% 0.02 1,543,169 1,579,759 2020-12-15................................................................................................................................................................................................................................................................................................Dollar General Corporation 3.25% 0.02 1,542,350 1,579,759 2023-04-15Wells Fargo & Company 3.07% 0.02 1,541,880 1,579,759 2023-01-24eBay Inc. 3.45% 0.02 1,541,104 1,579,759 2024-08-01European Investment Bank 2.12% 0.02 1,539,015 1,579,759 2021-10-15Hospitality Properties Trust 4.5% 0.02 1,538,354 1,579,759 2025-03-15................................................................................................................................................................................................................................................................................................Republic of Colombia 5% 0.02 1,538,246 1,539,785 2045-06-15Export-Import Bank of Korea 3% 0.02 1,538,080 1,579,759 2022-11-01Bank of America Corporation 3.82% 0.02 1,537,297 1,579,759 2028-01-20Japan Bank for International Cooperation 2.5% 0.02 1,536,016 1,579,759 2022-06-01Federal National Mortgage Association 4% 0.02 1,534,726 1,518,992 2047-06-01Total Capital International S.A. 2.7% 0.02 1,534,482 1,579,759 2023-01-25Barclays PLC 4.38% 0.02 1,532,423 1,579,759 2026-01-12HSBC Holdings plc 3.9% 0.02 1,532,000 1,579,759 2026-05-25Anthem Inc 3.35% 0.02 1,531,910 1,579,759 2024-12-01Visa Inc 3.15% 0.02 1,531,769 1,579,759 2025-12-14................................................................................................................................................................................................................................................................................................NEXTERA ENERGY CAPITAL HLDGS INC 4.46% 0.02 1,531,527 1,599,506 2067-06-15National Rural Utilities Cooperative Finance Corporation2.7%
0.02 1,531,267 1,579,759 2023-02-15
Capital One Financial Corporation 3.2% 0.02 1,530,954 1,579,759 2023-01-30Kreditanstalt Fur Wiederaufbau 1.62% 0.02 1,529,706 1,579,759 2021-03-15Sumitomo Mitsui Financial Group Inc 2.78% 0.02 1,529,238 1,579,759 2022-07-12................................................................................................................................................................................................................................................................................................Northrop Grumman Corporation 2.93% 0.02 1,529,220 1,609,774 2025-01-15AXA Equitable Holdings Inc 4.35% 0.02 1,528,311 1,579,759 2028-04-20Japan Bank for International Cooperation 1.88% 0.02 1,527,896 1,579,759 2021-04-20Apple Inc. 3.85% 0.02 1,526,932 1,586,364 2043-05-04Xcel Energy Inc 3.3% 0.02 1,526,896 1,579,759 2025-06-01................................................................................................................................................................................................................................................................................................Federal Home Loan Mortgage Corporation 2.5% 0.02 1,526,547 1,571,359 2027-08-01Government National Mortgage Association 3% 0.02 1,526,183 1,574,399 2045-01-20Federal National Mortgage Association 3.5% 0.02 1,525,985 1,538,409 2042-08-01United Health Group Incorporated 6.88% 0.02 1,524,419 1,143,291 2038-02-15Goldman Sachs Group, Inc. 2.35% 0.02 1,524,172 1,579,759 2021-11-15................................................................................................................................................................................................................................................................................................Kreditanstalt Fur Wiederaufbau 2.5% 0.02 1,523,407 1,579,759 2024-11-20Shell International Finance B.V. 5.5% 0.02 1,520,766 1,291,880 2040-03-25Federal Home Loan Mortgage Corporation 3% 0.02 1,520,440 1,574,800 2043-05-01Baidu, Inc. 2.88% 0.02 1,519,772 1,579,759 2022-07-06Bank of America Corporation 4% 0.02 1,519,766 1,504,720 2024-04-01................................................................................................................................................................................................................................................................................................Export Development Canada 1.5% 0.02 1,518,897 1,579,759 2021-05-26The Toronto-Dominion Bank 1.8% 0.02 1,518,834 1,579,759 2021-07-13Virginia Electric and Power Company 3.15% 0.02 1,518,314 1,579,759 2026-01-15The Walt Disney Company 2.35% 0.02 1,517,924 1,579,759 2022-12-01Philip Morris International Inc. 2.5% 0.02 1,517,851 1,579,759 2022-11-02................................................................................................................................................................................................................................................................................................Bank of Montreal 1.9% 0.02 1,517,316 1,579,759 2021-08-27Ontario (Province Of) 2.2% 0.02 1,515,578 1,579,759 2022-10-03Pepsico Capital Resources, Inc. 4.5% 0.02 1,515,420 1,484,974 2020-01-15National Australia Bank Limited New York Branch 1.88% 0.02 1,514,008 1,579,759 2021-07-12Microsoft Corporation 2.88% 0.02 1,513,491 1,548,164 2024-02-06................................................................................................................................................................................................................................................................................................Cenovus Energy Inc 3% 0.02 1,513,314 1,579,759 2022-08-15Pacific Gas and Electric Company 6.05% 0.02 1,511,723 1,329,990 2034-03-01Cardinal Health, Inc. 2.62% 0.02 1,511,446 1,579,759 2022-06-15Laboratory Corp of America Holdings 3.6% 0.02 1,510,994 1,579,759 2027-09-01Pacific Gas and Electric Company 3.4% 0.02 1,507,537 1,579,759 2024-08-15................................................................................................................................................................................................................................................................................................
©2018 Morningstar, Inc., Morningstar Investment Profiles™ 312-696-6000. All rights reserved. The information contained herein: (1) is proprietary to Morningstar and/or its content providers; (2) maynot be copied or distributed and (3) is not warranted to be accurate, complete or timely. Neither Morningstar nor its content providers are responsible for any damages or losses arising from any use ofinformation. Past performance is no guarantee of future performance. Visit our investment website at www.morningstar.com ß
®

Page 24 of 162
Broad Market Bond Index Fund.......................................................................................................................................................................................................................................................................................................................................
Total Stocks Total Bonds Total Cash0 9083 28
Bond Portfolio Analysis as of 09-30-18Security Name Net Assets % Market Value $ Amount $ Maturity Date
Amazon.com, Inc. 3.88% 0.02 1,507,527 1,539,785 2037-08-22Kimberly-Clark Corporation 2.4% 0.02 1,506,973 1,579,759 2023-06-01Ford Motor Credit Company LLC 3.81% 0.02 1,506,112 1,579,759 2024-01-09Federal National Mortgage Association 2.5% 0.02 1,505,979 1,548,079 2027-06-01Federal Home Loan Mortgage Corporation 2.36% 0.02 1,505,952 1,548,851 2022-07-25................................................................................................................................................................................................................................................................................................United Health Group Incorporated 4.75% 0.02 1,504,507 1,405,824 2045-07-15GNMA PASS-THRU M SINGLE FAMILY 4% 0.02 1,504,413 1,467,684 2044-04-20Federal National Mortgage Association 3% 0.02 1,504,171 1,570,338 2046-09-01Quebec (Province Of) 2.75% 0.02 1,503,728 1,579,759 2027-04-12The Sherwin-Williams Company 3.45% 0.02 1,503,352 1,579,759 2027-06-01................................................................................................................................................................................................................................................................................................RPM International Inc. 3.75% 0.02 1,501,212 1,579,759 2027-03-1521st Century Fox America, Inc. 6.9% 0.02 1,501,200 1,102,871 2039-08-15Brixmor Operating Partnership LP 3.9% 0.02 1,500,798 1,579,759 2027-03-15Federal National Mortgage Association 3.5% 0.02 1,499,950 1,517,646 2045-08-01Morgan Stanley 3.59% 0.02 1,498,860 1,579,759 2028-07-22Crown Castle International Corp. 3.8% 0.02 1,498,187 1,579,759 2028-02-15Phillips 66 5.88% 0.02 1,496,262 1,300,349 2042-05-01British Telecommunications plc 9.62% 0.02 1,494,863 1,052,443 2030-12-15Federal National Mortgage Association 2.5% 0.02 1,494,634 1,547,788 2032-02-01Federal National Mortgage Association 2.5% 0.02 1,493,790 1,536,402 2028-04-01................................................................................................................................................................................................................................................................................................Federal National Mortgage Association 3% 0.02 1,493,587 1,484,817 2033-05-01International Bank for Reconstruction and Development2.5%
0.02 1,492,669 1,579,759 2027-11-22
Government National Mortgage Association 3.5% 0.02 1,492,161 1,498,211 2044-10-20Federal National Mortgage Association 2.5% 0.02 1,487,894 1,537,932 2027-11-01Federal National Mortgage Association 3.5% 0.02 1,487,300 1,504,388 2044-05-01................................................................................................................................................................................................................................................................................................Devon Energy Corporation 3.25% 0.02 1,486,041 1,512,619 2022-05-15eBay Inc. 2.6% 0.02 1,485,983 1,540,265 2022-07-15VEREIT Operating Partnership LP 3.95% 0.02 1,485,828 1,579,759 2027-08-15Comcast Corporation 3.3% 0.02 1,485,810 1,571,860 2027-02-01Lloyds Banking Group plc 3.75% 0.02 1,484,782 1,579,759 2027-01-11................................................................................................................................................................................................................................................................................................Constellation Brands, Inc. 2.65% 0.02 1,483,483 1,552,113 2022-11-07Bank of New York Mellon Corporation 2.8% 0.02 1,481,858 1,579,759 2026-05-04Federal National Mortgage Association 3% 0.02 1,481,482 1,507,303 2033-09-01Bank of America Corporation 3.37% 0.02 1,481,264 1,540,265 2026-01-23American Water Capital Corp 2.95% 0.02 1,478,168 1,579,759 2027-09-01................................................................................................................................................................................................................................................................................................Thermo Fisher Scientific Inc 3.2% 0.02 1,477,313 1,579,759 2027-08-15Federal Home Loan Mortgage Corporation 4.5% 0.02 1,477,181 1,419,522 2044-09-01GlaxoSmithKline Capital Inc. 6.38% 0.02 1,476,855 1,149,065 2038-05-15Autodesk Inc 3.5% 0.02 1,471,435 1,579,759 2027-06-15Government National Mortgage Association 4.5% 0.02 1,470,430 1,403,563 2044-02-20................................................................................................................................................................................................................................................................................................GNMA PASS-THRU M SINGLE FAMILY 3% 0.02 1,470,124 1,511,534 2045-03-20Ingredion Incorporated 3.2% 0.02 1,465,380 1,579,759 2026-10-01European Investment Bank 1.88% 0.02 1,464,113 1,579,759 2025-02-10Bank of America, N.A. 6% 0.02 1,462,011 1,229,904 2036-10-15Federal Home Loan Mortgage Corporation 3.5% 0.02 1,460,671 1,472,486 2042-09-01................................................................................................................................................................................................................................................................................................Federal National Mortgage Association 2.5% 0.02 1,456,384 1,508,178 2031-08-01Federal National Mortgage Association 4% 0.02 1,454,499 1,437,145 2044-11-01Government National Mortgage Association 4.5% 0.02 1,453,580 1,393,452 2040-08-15Bunge Limited Finance Corp. 3.75% 0.02 1,452,634 1,579,759 2027-09-25Government National Mortgage Association 4.5% 0.02 1,449,164 1,400,878 2047-10-20................................................................................................................................................................................................................................................................................................The Boeing Company 7.95% 0.02 1,449,098 1,184,819 2024-08-15Anadarko Petroleum Corporation 7.95% 0.02 1,446,040 1,116,344 2039-06-15Northrop Grumman Corporation 4.03% 0.02 1,443,988 1,539,785 2047-10-15Federal National Mortgage Association 3.5% 0.02 1,442,904 1,459,926 2045-01-01Government National Mortgage Association 5% 0.02 1,442,302 1,379,597 2048-03-20................................................................................................................................................................................................................................................................................................
©2018 Morningstar, Inc., Morningstar Investment Profiles™ 312-696-6000. All rights reserved. The information contained herein: (1) is proprietary to Morningstar and/or its content providers; (2) maynot be copied or distributed and (3) is not warranted to be accurate, complete or timely. Neither Morningstar nor its content providers are responsible for any damages or losses arising from any use ofinformation. Past performance is no guarantee of future performance. Visit our investment website at www.morningstar.com ß
®
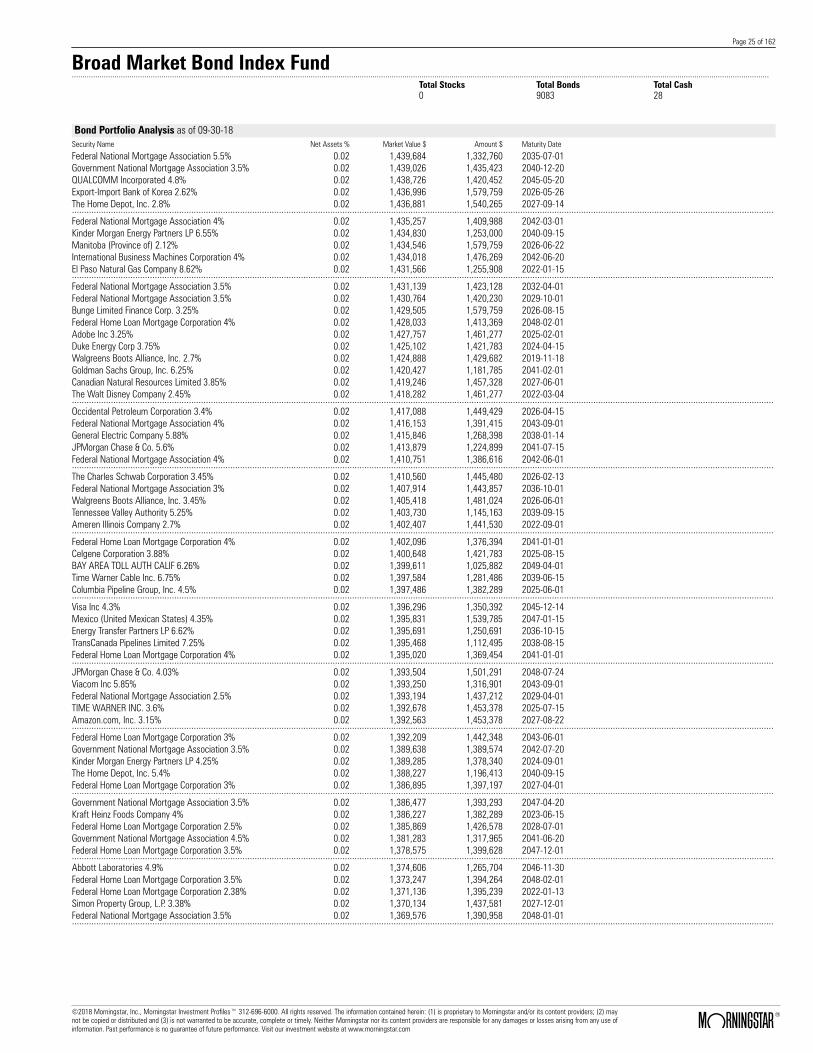
Page 25 of 162
Broad Market Bond Index Fund.......................................................................................................................................................................................................................................................................................................................................
Total Stocks Total Bonds Total Cash0 9083 28
Bond Portfolio Analysis as of 09-30-18Security Name Net Assets % Market Value $ Amount $ Maturity Date
Federal National Mortgage Association 5.5% 0.02 1,439,684 1,332,760 2035-07-01Government National Mortgage Association 3.5% 0.02 1,439,026 1,435,423 2040-12-20QUALCOMM Incorporated 4.8% 0.02 1,438,726 1,420,452 2045-05-20Export-Import Bank of Korea 2.62% 0.02 1,436,996 1,579,759 2026-05-26The Home Depot, Inc. 2.8% 0.02 1,436,881 1,540,265 2027-09-14................................................................................................................................................................................................................................................................................................Federal National Mortgage Association 4% 0.02 1,435,257 1,409,988 2042-03-01Kinder Morgan Energy Partners LP 6.55% 0.02 1,434,830 1,253,000 2040-09-15Manitoba (Province of) 2.12% 0.02 1,434,546 1,579,759 2026-06-22International Business Machines Corporation 4% 0.02 1,434,018 1,476,269 2042-06-20El Paso Natural Gas Company 8.62% 0.02 1,431,566 1,255,908 2022-01-15................................................................................................................................................................................................................................................................................................Federal National Mortgage Association 3.5% 0.02 1,431,139 1,423,128 2032-04-01Federal National Mortgage Association 3.5% 0.02 1,430,764 1,420,230 2029-10-01Bunge Limited Finance Corp. 3.25% 0.02 1,429,505 1,579,759 2026-08-15Federal Home Loan Mortgage Corporation 4% 0.02 1,428,033 1,413,369 2048-02-01Adobe Inc 3.25% 0.02 1,427,757 1,461,277 2025-02-01Duke Energy Corp 3.75% 0.02 1,425,102 1,421,783 2024-04-15Walgreens Boots Alliance, Inc. 2.7% 0.02 1,424,888 1,429,682 2019-11-18Goldman Sachs Group, Inc. 6.25% 0.02 1,420,427 1,181,785 2041-02-01Canadian Natural Resources Limited 3.85% 0.02 1,419,246 1,457,328 2027-06-01The Walt Disney Company 2.45% 0.02 1,418,282 1,461,277 2022-03-04................................................................................................................................................................................................................................................................................................Occidental Petroleum Corporation 3.4% 0.02 1,417,088 1,449,429 2026-04-15Federal National Mortgage Association 4% 0.02 1,416,153 1,391,415 2043-09-01General Electric Company 5.88% 0.02 1,415,846 1,268,398 2038-01-14JPMorgan Chase & Co. 5.6% 0.02 1,413,879 1,224,899 2041-07-15Federal National Mortgage Association 4% 0.02 1,410,751 1,386,616 2042-06-01................................................................................................................................................................................................................................................................................................The Charles Schwab Corporation 3.45% 0.02 1,410,560 1,445,480 2026-02-13Federal National Mortgage Association 3% 0.02 1,407,914 1,443,857 2036-10-01Walgreens Boots Alliance, Inc. 3.45% 0.02 1,405,418 1,481,024 2026-06-01Tennessee Valley Authority 5.25% 0.02 1,403,730 1,145,163 2039-09-15Ameren Illinois Company 2.7% 0.02 1,402,407 1,441,530 2022-09-01................................................................................................................................................................................................................................................................................................Federal Home Loan Mortgage Corporation 4% 0.02 1,402,096 1,376,394 2041-01-01Celgene Corporation 3.88% 0.02 1,400,648 1,421,783 2025-08-15BAY AREA TOLL AUTH CALIF 6.26% 0.02 1,399,611 1,025,882 2049-04-01Time Warner Cable Inc. 6.75% 0.02 1,397,584 1,281,486 2039-06-15Columbia Pipeline Group, Inc. 4.5% 0.02 1,397,486 1,382,289 2025-06-01................................................................................................................................................................................................................................................................................................Visa Inc 4.3% 0.02 1,396,296 1,350,392 2045-12-14Mexico (United Mexican States) 4.35% 0.02 1,395,831 1,539,785 2047-01-15Energy Transfer Partners LP 6.62% 0.02 1,395,691 1,250,691 2036-10-15TransCanada Pipelines Limited 7.25% 0.02 1,395,468 1,112,495 2038-08-15Federal Home Loan Mortgage Corporation 4% 0.02 1,395,020 1,369,454 2041-01-01................................................................................................................................................................................................................................................................................................JPMorgan Chase & Co. 4.03% 0.02 1,393,504 1,501,291 2048-07-24Viacom Inc 5.85% 0.02 1,393,250 1,316,901 2043-09-01Federal National Mortgage Association 2.5% 0.02 1,393,194 1,437,212 2029-04-01TIME WARNER INC. 3.6% 0.02 1,392,678 1,453,378 2025-07-15Amazon.com, Inc. 3.15% 0.02 1,392,563 1,453,378 2027-08-22................................................................................................................................................................................................................................................................................................Federal Home Loan Mortgage Corporation 3% 0.02 1,392,209 1,442,348 2043-06-01Government National Mortgage Association 3.5% 0.02 1,389,638 1,389,574 2042-07-20Kinder Morgan Energy Partners LP 4.25% 0.02 1,389,285 1,378,340 2024-09-01The Home Depot, Inc. 5.4% 0.02 1,388,227 1,196,413 2040-09-15Federal Home Loan Mortgage Corporation 3% 0.02 1,386,895 1,397,197 2027-04-01................................................................................................................................................................................................................................................................................................Government National Mortgage Association 3.5% 0.02 1,386,477 1,393,293 2047-04-20Kraft Heinz Foods Company 4% 0.02 1,386,227 1,382,289 2023-06-15Federal Home Loan Mortgage Corporation 2.5% 0.02 1,385,869 1,426,578 2028-07-01Government National Mortgage Association 4.5% 0.02 1,381,283 1,317,965 2041-06-20Federal Home Loan Mortgage Corporation 3.5% 0.02 1,378,575 1,399,628 2047-12-01................................................................................................................................................................................................................................................................................................Abbott Laboratories 4.9% 0.02 1,374,606 1,265,704 2046-11-30Federal Home Loan Mortgage Corporation 3.5% 0.02 1,373,247 1,394,264 2048-02-01Federal Home Loan Mortgage Corporation 2.38% 0.02 1,371,136 1,395,239 2022-01-13Simon Property Group, L.P. 3.38% 0.02 1,370,134 1,437,581 2027-12-01Federal National Mortgage Association 3.5% 0.02 1,369,576 1,390,958 2048-01-01................................................................................................................................................................................................................................................................................................
©2018 Morningstar, Inc., Morningstar Investment Profiles™ 312-696-6000. All rights reserved. The information contained herein: (1) is proprietary to Morningstar and/or its content providers; (2) maynot be copied or distributed and (3) is not warranted to be accurate, complete or timely. Neither Morningstar nor its content providers are responsible for any damages or losses arising from any use ofinformation. Past performance is no guarantee of future performance. Visit our investment website at www.morningstar.com ß
®

Page 26 of 162
Broad Market Bond Index Fund.......................................................................................................................................................................................................................................................................................................................................
Total Stocks Total Bonds Total Cash0 9083 28
Bond Portfolio Analysis as of 09-30-18Security Name Net Assets % Market Value $ Amount $ Maturity Date
Federal National Mortgage Association 3.5% 0.02 1,367,983 1,384,122 2045-12-01Honeywell International Inc. 3.81% 0.02 1,366,980 1,437,775 2047-11-21GNMA PASS-THRU M SINGLE FAMILY 3.5% 0.02 1,364,966 1,367,362 2044-08-20Federal National Mortgage Association 3.5% 0.02 1,364,724 1,386,039 2047-11-01Federal Home Loan Mortgage Corporation 3.5% 0.02 1,363,553 1,384,376 2047-11-01................................................................................................................................................................................................................................................................................................CBS Corporation 3.7% 0.02 1,363,110 1,402,036 2024-08-15International Business Machines Corporation 7% 0.02 1,360,121 1,137,427 2025-10-30Federal National Mortgage Association 3.5% 0.02 1,359,328 1,375,365 2045-12-01Baker Hughes a GE company LLC and Baker Hughes Co-Obligor Inc 4.08%
0.02 1,358,935 1,497,441 2047-12-15
Amgen Inc. 4.4% 0.02 1,358,276 1,403,129 2045-05-01Burlington Northern Santa Fe LLC 5.05% 0.02 1,356,001 1,227,979 2041-03-01AstraZeneca Plc 6.45% 0.02 1,353,118 1,077,850 2037-09-15Enterprise Products Operating LP 6.45% 0.02 1,353,020 1,108,645 2040-09-01Government National Mortgage Association 3.5% 0.02 1,352,675 1,356,794 2045-04-20Federal National Mortgage Association 3.5% 0.02 1,352,300 1,363,294 2042-02-01................................................................................................................................................................................................................................................................................................QUALCOMM Incorporated 3.25% 0.02 1,349,228 1,433,631 2027-05-20Israel (State Of) 5.5% 0.02 1,345,641 1,210,575 2023-12-04TIME WARNER INC. 3.8% 0.02 1,344,910 1,405,986 2027-02-15Plains All American Pipeline L.P./PAA Finance Corp.4.65%
0.02 1,344,841 1,330,947 2025-10-15
Citigroup Inc. 5.88% 0.02 1,342,127 1,154,839 2042-01-30................................................................................................................................................................................................................................................................................................Bank of America Corporation 5.7% 0.02 1,341,196 1,251,959 2022-01-24Government National Mortgage Association 3.5% 0.02 1,340,306 1,340,245 2043-04-20Oracle Corporation 3.4% 0.02 1,339,037 1,350,694 2024-07-08Total Capital International S.A. 3.75% 0.02 1,337,780 1,323,048 2024-04-10Costco Wholesale Corporation 2.75% 0.02 1,337,478 1,382,289 2024-05-18................................................................................................................................................................................................................................................................................................Puget Energy Inc 3.65% 0.02 1,333,555 1,382,289 2025-05-15Diamond 1 Finance Corporation/Diamond 2 FinanceCorporation 5.45%
0.02 1,333,217 1,267,757 2023-06-15
SunTrust Bank 2.75% 0.02 1,331,693 1,382,289 2023-05-01JPMorgan Chase & Co. 3.25% 0.02 1,330,922 1,342,795 2022-09-23Federal Home Loan Mortgage Corporation 3.5% 0.02 1,329,777 1,348,017 2046-04-01................................................................................................................................................................................................................................................................................................Government National Mortgage Association 3% 0.02 1,329,584 1,360,541 2043-10-20Apple Inc. 2.85% 0.02 1,328,233 1,334,896 2021-05-06NUTRIEN LTD 3.38% 0.02 1,325,607 1,398,087 2025-03-15Norfolk Southern Corporation 2.9% 0.02 1,324,894 1,358,593 2023-02-15Federal Home Loan Banks 2.25% 0.02 1,323,561 1,354,202 2022-03-11................................................................................................................................................................................................................................................................................................Wells Fargo & Company 3% 0.02 1,323,418 1,398,087 2025-02-19ERP Operating Limited Partnership 4.75% 0.02 1,323,181 1,295,402 2020-07-15Government National Mortgage Association 4% 0.02 1,318,032 1,288,677 2044-10-20Federal National Mortgage Association 3.5% 0.02 1,317,260 1,328,001 2042-03-01Federal Home Loan Mortgage Corporation 4% 0.02 1,316,599 1,298,396 2043-12-01................................................................................................................................................................................................................................................................................................Capital One Financial Corporation 3.3% 0.02 1,315,948 1,382,289 2024-10-30Cigna Corporation 3.88% 0.02 1,313,337 1,539,785 2047-10-15Federal National Mortgage Association 4% 0.02 1,312,410 1,289,951 2042-04-01Nucor Corporation 4% 0.02 1,308,784 1,283,554 2023-08-01Pacific Gas and Electric Company 3.95% 0.02 1,305,014 1,501,291 2047-12-01................................................................................................................................................................................................................................................................................................Federal Home Loan Mortgage Corporation 3.5% 0.02 1,303,128 1,296,329 2027-08-01Federal National Mortgage Association 5% 0.02 1,301,963 1,221,961 2045-06-01Bank of America Corporation 4.44% 0.02 1,301,230 1,308,818 2048-01-20Federal Home Loan Mortgage Corporation 3.3% 0.02 1,298,685 1,294,540 2023-04-25Federal Home Loan Mortgage Corporation 3% 0.02 1,297,558 1,353,771 2047-01-01................................................................................................................................................................................................................................................................................................Enterprise Products Operating LP 6.12% 0.02 1,295,771 1,107,491 2039-10-15Goldman Sachs Group, Inc. 4.02% 0.02 1,293,457 1,395,431 2038-10-31Government National Mortgage Association 4.5% 0.02 1,289,961 1,227,534 2039-05-15AstraZeneca Plc 3.12% 0.02 1,289,091 1,382,289 2027-06-12Federal National Mortgage Association 3% 0.02 1,289,072 1,300,472 2029-10-01................................................................................................................................................................................................................................................................................................
©2018 Morningstar, Inc., Morningstar Investment Profiles™ 312-696-6000. All rights reserved. The information contained herein: (1) is proprietary to Morningstar and/or its content providers; (2) maynot be copied or distributed and (3) is not warranted to be accurate, complete or timely. Neither Morningstar nor its content providers are responsible for any damages or losses arising from any use ofinformation. Past performance is no guarantee of future performance. Visit our investment website at www.morningstar.com ß
®

Page 27 of 162
Broad Market Bond Index Fund.......................................................................................................................................................................................................................................................................................................................................
Total Stocks Total Bonds Total Cash0 9083 28
Bond Portfolio Analysis as of 09-30-18Security Name Net Assets % Market Value $ Amount $ Maturity Date
AT&T Inc 6.35% 0.02 1,288,997 1,172,162 2040-03-15Entergy Louisiana, LLC 5.4% 0.02 1,288,949 1,184,819 2024-11-01Pemex Project Funding Master Trust 6.62% 0.02 1,288,837 1,297,269 2035-06-15Morgan Stanley 3.12% 0.02 1,287,822 1,382,289 2026-07-27XLIT Ltd. 4.45% 0.02 1,287,247 1,299,352 2025-03-31................................................................................................................................................................................................................................................................................................Morgan Stanley 6.38% 0.02 1,286,240 1,031,656 2042-07-24Federal Home Loan Mortgage Corporation 3.5% 0.02 1,285,141 1,295,576 2044-01-01Nexen Energy ULC 7.88% 0.02 1,284,398 966,215 2032-03-15NetApp Inc. 3.3% 0.02 1,282,263 1,342,795 2024-09-29Federal National Mortgage Association 3% 0.02 1,281,201 1,326,529 2042-12-01CVS Health Corp 5.12% 0.02 1,280,213 1,245,301 2045-07-20Diamond 1 Finance Corporation/Diamond 2 FinanceCorporation 8.35%
0.02 1,279,847 1,028,192 2046-07-15
Federal Home Loan Mortgage Corporation 4% 0.02 1,279,323 1,263,138 2044-09-01CSX Corporation 6.22% 0.02 1,278,435 1,045,129 2040-04-30Hess Corporation 7.12% 0.02 1,275,667 1,112,110 2033-03-15................................................................................................................................................................................................................................................................................................Johnson & Johnson 3.5% 0.02 1,275,375 1,391,966 2048-01-15MPLX LP 4.9% 0.02 1,275,185 1,408,904 2058-04-15Aercap Ireland Capital DAC 3.5% 0.02 1,273,553 1,351,484 2025-01-15Jefferies Group LLC 6.88% 0.02 1,270,766 1,184,819 2021-04-15Government National Mortgage Association 3% 0.01 1,268,551 1,307,309 2045-06-20................................................................................................................................................................................................................................................................................................MetLife Inc. 3.6% 0.01 1,268,275 1,263,807 2024-04-10Deutsche Telekom International Finance B.V. 8.75% 0.01 1,265,017 941,964 2030-06-15Government National Mortgage Association 4.5% 0.01 1,263,596 1,205,732 2041-09-20Conagra Brands Inc 3.2% 0.01 1,263,155 1,302,511 2023-01-25United Parcel Service, Inc. 6.2% 0.01 1,263,067 1,002,785 2038-01-15................................................................................................................................................................................................................................................................................................Federal Home Loan Mortgage Corporation 4.5% 0.01 1,262,704 1,219,109 2044-07-01Philippines (Republic Of) 5% 0.01 1,262,388 1,154,839 2037-01-13Government National Mortgage Association 5% 0.01 1,261,567 1,178,516 2040-07-20Federal National Mortgage Association 3% 0.01 1,261,452 1,272,598 2030-09-01Federal National Mortgage Association 3.5% 0.01 1,260,161 1,270,446 2043-04-01................................................................................................................................................................................................................................................................................................Federal National Mortgage Association 3.5% 0.01 1,259,549 1,269,831 2041-03-01Mylan NV 3.15% 0.01 1,257,382 1,276,445 2021-06-15Analog Devices Inc. 3.12% 0.01 1,257,182 1,300,142 2023-12-05Verizon Communications Inc. 4.12% 0.01 1,253,595 1,397,355 2046-08-15Barclays PLC 4.95% 0.01 1,251,677 1,347,312 2047-01-10................................................................................................................................................................................................................................................................................................Federal National Mortgage Association 4.5% 0.01 1,250,765 1,205,594 2044-10-01Shell International Finance B.V. 2.25% 0.01 1,250,518 1,308,830 2023-01-06Morgan Stanley 5.5% 0.01 1,247,206 1,184,819 2021-07-28Government National Mortgage Association 3.5% 0.01 1,245,682 1,247,055 2042-02-15Apple Inc. 2.4% 0.01 1,245,422 1,295,402 2023-05-03................................................................................................................................................................................................................................................................................................Federal National Mortgage Association 3.5% 0.01 1,243,639 1,234,490 2031-04-01Federal National Mortgage Association 4% 0.01 1,242,934 1,228,887 2045-08-01Enterprise Products Operating LP 3.75% 0.01 1,241,958 1,244,060 2025-02-15Williams Partners LP / Williams Partners FinanceCorporation 6.3%
0.01 1,241,574 1,098,252 2040-04-15
Goldman Sachs Group, Inc. 4.75% 0.01 1,240,078 1,219,125 2045-10-21................................................................................................................................................................................................................................................................................................HCP Inc 3.4% 0.01 1,239,237 1,307,251 2025-02-01Ford Motor Credit Company LLC 5.88% 0.01 1,239,123 1,184,819 2021-08-02Government National Mortgage Association 3.5% 0.01 1,238,668 1,243,712 2044-08-20Government National Mortgage Association 4% 0.01 1,237,404 1,205,736 2042-01-20BlackRock, Inc. 4.25% 0.01 1,237,375 1,204,566 2021-05-24................................................................................................................................................................................................................................................................................................Nomura Holdings, Inc. 6.7% 0.01 1,237,095 1,184,819 2020-03-04Federal Home Loan Mortgage Corporation 3.5% 0.01 1,232,217 1,233,790 2042-04-01Federal Home Loan Mortgage Corporation 4% 0.01 1,231,516 1,213,406 2043-08-01Federal Home Loan Banks 2.88% 0.01 1,231,460 1,231,093 2020-09-11Federal Home Loan Mortgage Corporation 3% 0.01 1,231,363 1,243,405 2030-01-01................................................................................................................................................................................................................................................................................................
©2018 Morningstar, Inc., Morningstar Investment Profiles™ 312-696-6000. All rights reserved. The information contained herein: (1) is proprietary to Morningstar and/or its content providers; (2) maynot be copied or distributed and (3) is not warranted to be accurate, complete or timely. Neither Morningstar nor its content providers are responsible for any damages or losses arising from any use ofinformation. Past performance is no guarantee of future performance. Visit our investment website at www.morningstar.com ß
®
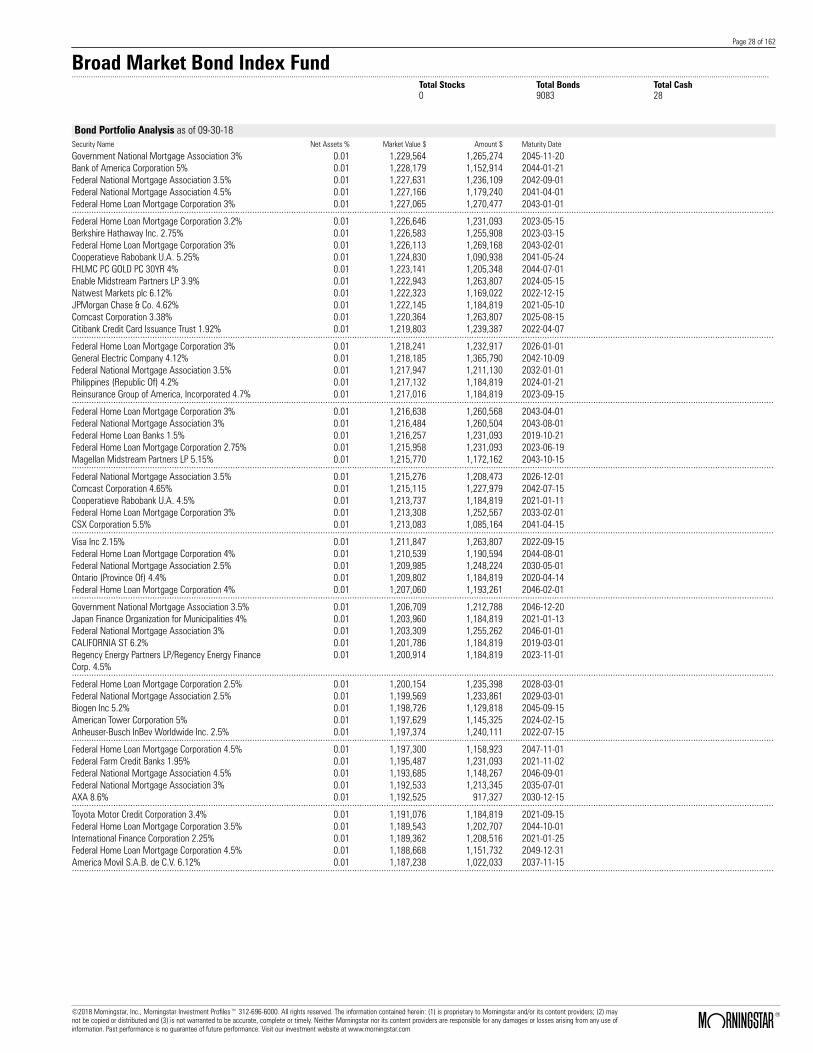
Page 28 of 162
Broad Market Bond Index Fund.......................................................................................................................................................................................................................................................................................................................................
Total Stocks Total Bonds Total Cash0 9083 28
Bond Portfolio Analysis as of 09-30-18Security Name Net Assets % Market Value $ Amount $ Maturity Date
Government National Mortgage Association 3% 0.01 1,229,564 1,265,274 2045-11-20Bank of America Corporation 5% 0.01 1,228,179 1,152,914 2044-01-21Federal National Mortgage Association 3.5% 0.01 1,227,631 1,236,109 2042-09-01Federal National Mortgage Association 4.5% 0.01 1,227,166 1,179,240 2041-04-01Federal Home Loan Mortgage Corporation 3% 0.01 1,227,065 1,270,477 2043-01-01................................................................................................................................................................................................................................................................................................Federal Home Loan Mortgage Corporation 3.2% 0.01 1,226,646 1,231,093 2023-05-15Berkshire Hathaway Inc. 2.75% 0.01 1,226,583 1,255,908 2023-03-15Federal Home Loan Mortgage Corporation 3% 0.01 1,226,113 1,269,168 2043-02-01Cooperatieve Rabobank U.A. 5.25% 0.01 1,224,830 1,090,938 2041-05-24FHLMC PC GOLD PC 30YR 4% 0.01 1,223,141 1,205,348 2044-07-01Enable Midstream Partners LP 3.9% 0.01 1,222,943 1,263,807 2024-05-15Natwest Markets plc 6.12% 0.01 1,222,323 1,169,022 2022-12-15JPMorgan Chase & Co. 4.62% 0.01 1,222,145 1,184,819 2021-05-10Comcast Corporation 3.38% 0.01 1,220,364 1,263,807 2025-08-15Citibank Credit Card Issuance Trust 1.92% 0.01 1,219,803 1,239,387 2022-04-07................................................................................................................................................................................................................................................................................................Federal Home Loan Mortgage Corporation 3% 0.01 1,218,241 1,232,917 2026-01-01General Electric Company 4.12% 0.01 1,218,185 1,365,790 2042-10-09Federal National Mortgage Association 3.5% 0.01 1,217,947 1,211,130 2032-01-01Philippines (Republic Of) 4.2% 0.01 1,217,132 1,184,819 2024-01-21Reinsurance Group of America, Incorporated 4.7% 0.01 1,217,016 1,184,819 2023-09-15................................................................................................................................................................................................................................................................................................Federal Home Loan Mortgage Corporation 3% 0.01 1,216,638 1,260,568 2043-04-01Federal National Mortgage Association 3% 0.01 1,216,484 1,260,504 2043-08-01Federal Home Loan Banks 1.5% 0.01 1,216,257 1,231,093 2019-10-21Federal Home Loan Mortgage Corporation 2.75% 0.01 1,215,958 1,231,093 2023-06-19Magellan Midstream Partners LP 5.15% 0.01 1,215,770 1,172,162 2043-10-15................................................................................................................................................................................................................................................................................................Federal National Mortgage Association 3.5% 0.01 1,215,276 1,208,473 2026-12-01Comcast Corporation 4.65% 0.01 1,215,115 1,227,979 2042-07-15Cooperatieve Rabobank U.A. 4.5% 0.01 1,213,737 1,184,819 2021-01-11Federal Home Loan Mortgage Corporation 3% 0.01 1,213,308 1,252,567 2033-02-01CSX Corporation 5.5% 0.01 1,213,083 1,085,164 2041-04-15................................................................................................................................................................................................................................................................................................Visa Inc 2.15% 0.01 1,211,847 1,263,807 2022-09-15Federal Home Loan Mortgage Corporation 4% 0.01 1,210,539 1,190,594 2044-08-01Federal National Mortgage Association 2.5% 0.01 1,209,985 1,248,224 2030-05-01Ontario (Province Of) 4.4% 0.01 1,209,802 1,184,819 2020-04-14Federal Home Loan Mortgage Corporation 4% 0.01 1,207,060 1,193,261 2046-02-01................................................................................................................................................................................................................................................................................................Government National Mortgage Association 3.5% 0.01 1,206,709 1,212,788 2046-12-20Japan Finance Organization for Municipalities 4% 0.01 1,203,960 1,184,819 2021-01-13Federal National Mortgage Association 3% 0.01 1,203,309 1,255,262 2046-01-01CALIFORNIA ST 6.2% 0.01 1,201,786 1,184,819 2019-03-01Regency Energy Partners LP/Regency Energy FinanceCorp. 4.5%
0.01 1,200,914 1,184,819 2023-11-01
................................................................................................................................................................................................................................................................................................Federal Home Loan Mortgage Corporation 2.5% 0.01 1,200,154 1,235,398 2028-03-01Federal National Mortgage Association 2.5% 0.01 1,199,569 1,233,861 2029-03-01Biogen Inc 5.2% 0.01 1,198,726 1,129,818 2045-09-15American Tower Corporation 5% 0.01 1,197,629 1,145,325 2024-02-15Anheuser-Busch InBev Worldwide Inc. 2.5% 0.01 1,197,374 1,240,111 2022-07-15................................................................................................................................................................................................................................................................................................Federal Home Loan Mortgage Corporation 4.5% 0.01 1,197,300 1,158,923 2047-11-01Federal Farm Credit Banks 1.95% 0.01 1,195,487 1,231,093 2021-11-02Federal National Mortgage Association 4.5% 0.01 1,193,685 1,148,267 2046-09-01Federal National Mortgage Association 3% 0.01 1,192,533 1,213,345 2035-07-01AXA 8.6% 0.01 1,192,525 917,327 2030-12-15................................................................................................................................................................................................................................................................................................Toyota Motor Credit Corporation 3.4% 0.01 1,191,076 1,184,819 2021-09-15Federal Home Loan Mortgage Corporation 3.5% 0.01 1,189,543 1,202,707 2044-10-01International Finance Corporation 2.25% 0.01 1,189,362 1,208,516 2021-01-25Federal Home Loan Mortgage Corporation 4.5% 0.01 1,188,668 1,151,732 2049-12-31America Movil S.A.B. de C.V. 6.12% 0.01 1,187,238 1,022,033 2037-11-15................................................................................................................................................................................................................................................................................................
©2018 Morningstar, Inc., Morningstar Investment Profiles™ 312-696-6000. All rights reserved. The information contained herein: (1) is proprietary to Morningstar and/or its content providers; (2) maynot be copied or distributed and (3) is not warranted to be accurate, complete or timely. Neither Morningstar nor its content providers are responsible for any damages or losses arising from any use ofinformation. Past performance is no guarantee of future performance. Visit our investment website at www.morningstar.com ß
®
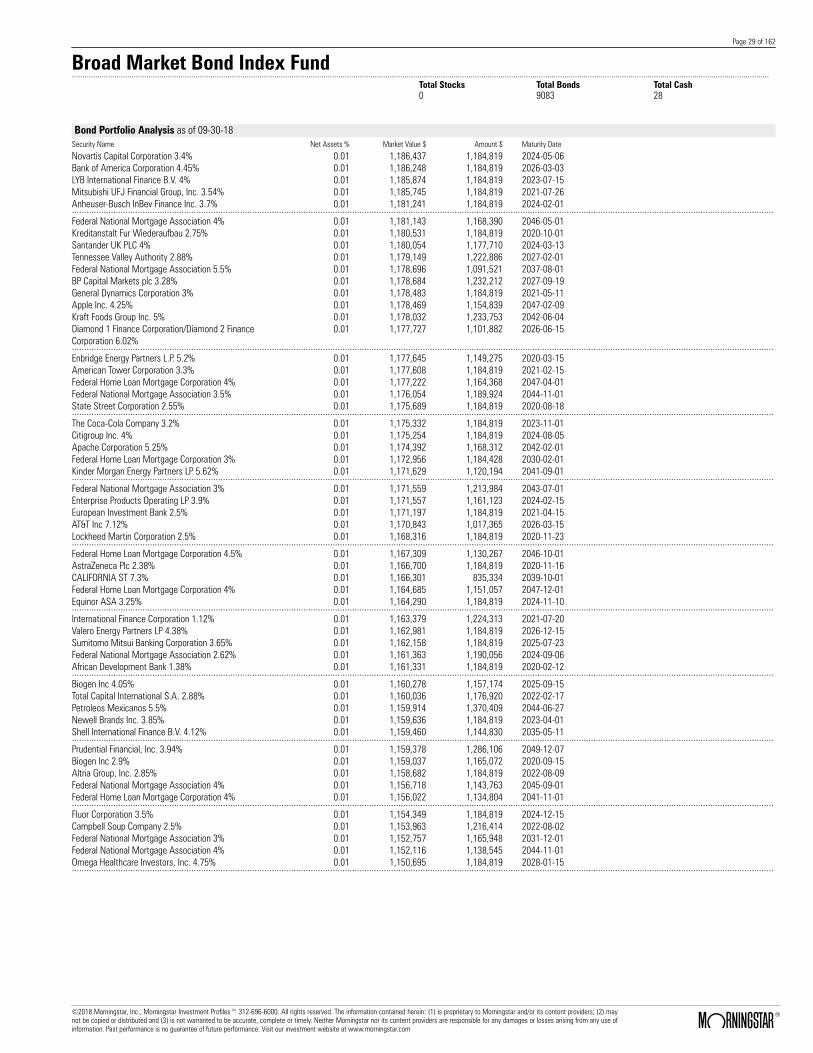
Page 29 of 162
Broad Market Bond Index Fund.......................................................................................................................................................................................................................................................................................................................................
Total Stocks Total Bonds Total Cash0 9083 28
Bond Portfolio Analysis as of 09-30-18Security Name Net Assets % Market Value $ Amount $ Maturity Date
Novartis Capital Corporation 3.4% 0.01 1,186,437 1,184,819 2024-05-06Bank of America Corporation 4.45% 0.01 1,186,248 1,184,819 2026-03-03LYB International Finance B.V. 4% 0.01 1,185,874 1,184,819 2023-07-15Mitsubishi UFJ Financial Group, Inc. 3.54% 0.01 1,185,745 1,184,819 2021-07-26Anheuser-Busch InBev Finance Inc. 3.7% 0.01 1,181,241 1,184,819 2024-02-01................................................................................................................................................................................................................................................................................................Federal National Mortgage Association 4% 0.01 1,181,143 1,168,390 2046-05-01Kreditanstalt Fur Wiederaufbau 2.75% 0.01 1,180,531 1,184,819 2020-10-01Santander UK PLC 4% 0.01 1,180,054 1,177,710 2024-03-13Tennessee Valley Authority 2.88% 0.01 1,179,149 1,222,886 2027-02-01Federal National Mortgage Association 5.5% 0.01 1,178,696 1,091,521 2037-08-01BP Capital Markets plc 3.28% 0.01 1,178,684 1,232,212 2027-09-19General Dynamics Corporation 3% 0.01 1,178,483 1,184,819 2021-05-11Apple Inc. 4.25% 0.01 1,178,469 1,154,839 2047-02-09Kraft Foods Group Inc. 5% 0.01 1,178,032 1,233,753 2042-06-04Diamond 1 Finance Corporation/Diamond 2 FinanceCorporation 6.02%
0.01 1,177,727 1,101,882 2026-06-15
................................................................................................................................................................................................................................................................................................Enbridge Energy Partners L.P. 5.2% 0.01 1,177,645 1,149,275 2020-03-15American Tower Corporation 3.3% 0.01 1,177,608 1,184,819 2021-02-15Federal Home Loan Mortgage Corporation 4% 0.01 1,177,222 1,164,368 2047-04-01Federal National Mortgage Association 3.5% 0.01 1,176,054 1,189,924 2044-11-01State Street Corporation 2.55% 0.01 1,175,689 1,184,819 2020-08-18................................................................................................................................................................................................................................................................................................The Coca-Cola Company 3.2% 0.01 1,175,332 1,184,819 2023-11-01Citigroup Inc. 4% 0.01 1,175,254 1,184,819 2024-08-05Apache Corporation 5.25% 0.01 1,174,392 1,168,312 2042-02-01Federal Home Loan Mortgage Corporation 3% 0.01 1,172,956 1,184,428 2030-02-01Kinder Morgan Energy Partners LP 5.62% 0.01 1,171,629 1,120,194 2041-09-01................................................................................................................................................................................................................................................................................................Federal National Mortgage Association 3% 0.01 1,171,559 1,213,984 2043-07-01Enterprise Products Operating LP 3.9% 0.01 1,171,557 1,161,123 2024-02-15European Investment Bank 2.5% 0.01 1,171,197 1,184,819 2021-04-15AT&T Inc 7.12% 0.01 1,170,843 1,017,365 2026-03-15Lockheed Martin Corporation 2.5% 0.01 1,168,316 1,184,819 2020-11-23................................................................................................................................................................................................................................................................................................Federal Home Loan Mortgage Corporation 4.5% 0.01 1,167,309 1,130,267 2046-10-01AstraZeneca Plc 2.38% 0.01 1,166,700 1,184,819 2020-11-16CALIFORNIA ST 7.3% 0.01 1,166,301 835,334 2039-10-01Federal Home Loan Mortgage Corporation 4% 0.01 1,164,685 1,151,057 2047-12-01Equinor ASA 3.25% 0.01 1,164,290 1,184,819 2024-11-10................................................................................................................................................................................................................................................................................................International Finance Corporation 1.12% 0.01 1,163,379 1,224,313 2021-07-20Valero Energy Partners LP 4.38% 0.01 1,162,981 1,184,819 2026-12-15Sumitomo Mitsui Banking Corporation 3.65% 0.01 1,162,158 1,184,819 2025-07-23Federal National Mortgage Association 2.62% 0.01 1,161,363 1,190,056 2024-09-06African Development Bank 1.38% 0.01 1,161,331 1,184,819 2020-02-12................................................................................................................................................................................................................................................................................................Biogen Inc 4.05% 0.01 1,160,278 1,157,174 2025-09-15Total Capital International S.A. 2.88% 0.01 1,160,036 1,176,920 2022-02-17Petroleos Mexicanos 5.5% 0.01 1,159,914 1,370,409 2044-06-27Newell Brands Inc. 3.85% 0.01 1,159,636 1,184,819 2023-04-01Shell International Finance B.V. 4.12% 0.01 1,159,460 1,144,830 2035-05-11................................................................................................................................................................................................................................................................................................Prudential Financial, Inc. 3.94% 0.01 1,159,378 1,286,106 2049-12-07Biogen Inc 2.9% 0.01 1,159,037 1,165,072 2020-09-15Altria Group, Inc. 2.85% 0.01 1,158,682 1,184,819 2022-08-09Federal National Mortgage Association 4% 0.01 1,156,718 1,143,763 2045-09-01Federal Home Loan Mortgage Corporation 4% 0.01 1,156,022 1,134,804 2041-11-01................................................................................................................................................................................................................................................................................................Fluor Corporation 3.5% 0.01 1,154,349 1,184,819 2024-12-15Campbell Soup Company 2.5% 0.01 1,153,963 1,216,414 2022-08-02Federal National Mortgage Association 3% 0.01 1,152,757 1,165,948 2031-12-01Federal National Mortgage Association 4% 0.01 1,152,116 1,138,545 2044-11-01Omega Healthcare Investors, Inc. 4.75% 0.01 1,150,695 1,184,819 2028-01-15................................................................................................................................................................................................................................................................................................
©2018 Morningstar, Inc., Morningstar Investment Profiles™ 312-696-6000. All rights reserved. The information contained herein: (1) is proprietary to Morningstar and/or its content providers; (2) maynot be copied or distributed and (3) is not warranted to be accurate, complete or timely. Neither Morningstar nor its content providers are responsible for any damages or losses arising from any use ofinformation. Past performance is no guarantee of future performance. Visit our investment website at www.morningstar.com ß
®
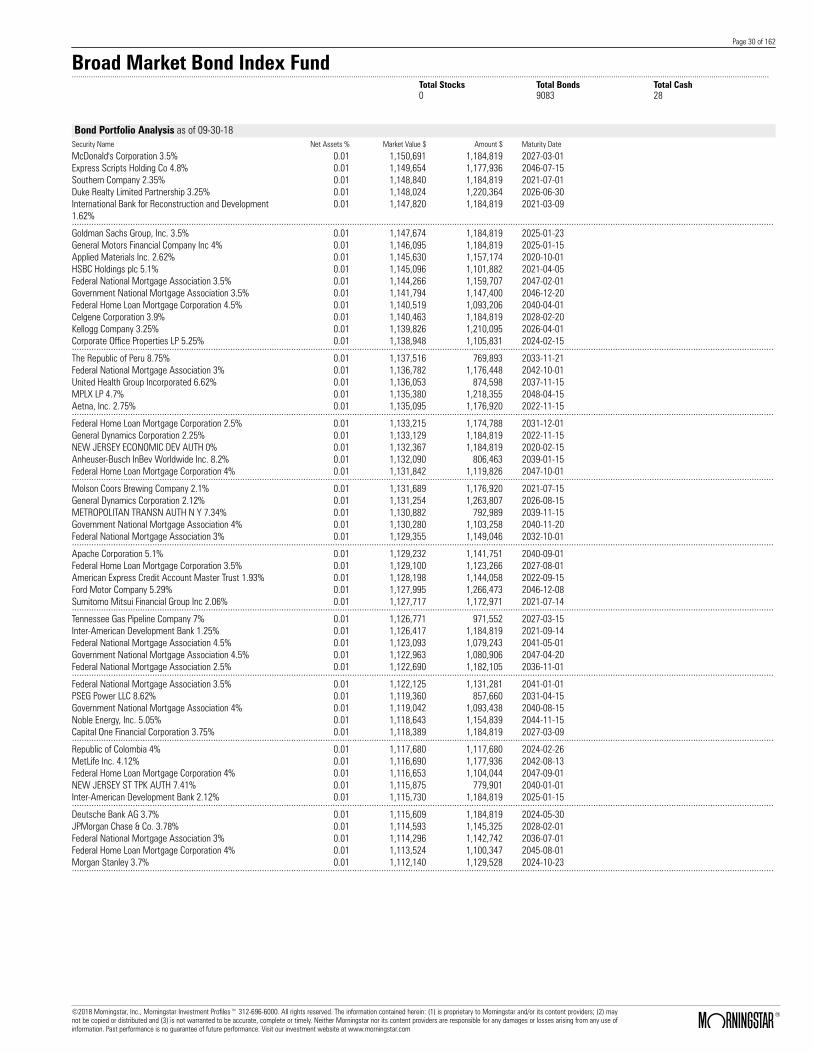
Page 30 of 162
Broad Market Bond Index Fund.......................................................................................................................................................................................................................................................................................................................................
Total Stocks Total Bonds Total Cash0 9083 28
Bond Portfolio Analysis as of 09-30-18Security Name Net Assets % Market Value $ Amount $ Maturity Date
McDonald's Corporation 3.5% 0.01 1,150,691 1,184,819 2027-03-01Express Scripts Holding Co 4.8% 0.01 1,149,654 1,177,936 2046-07-15Southern Company 2.35% 0.01 1,148,840 1,184,819 2021-07-01Duke Realty Limited Partnership 3.25% 0.01 1,148,024 1,220,364 2026-06-30International Bank for Reconstruction and Development1.62%
0.01 1,147,820 1,184,819 2021-03-09
................................................................................................................................................................................................................................................................................................Goldman Sachs Group, Inc. 3.5% 0.01 1,147,674 1,184,819 2025-01-23General Motors Financial Company Inc 4% 0.01 1,146,095 1,184,819 2025-01-15Applied Materials Inc. 2.62% 0.01 1,145,630 1,157,174 2020-10-01HSBC Holdings plc 5.1% 0.01 1,145,096 1,101,882 2021-04-05Federal National Mortgage Association 3.5% 0.01 1,144,266 1,159,707 2047-02-01Government National Mortgage Association 3.5% 0.01 1,141,794 1,147,400 2046-12-20Federal Home Loan Mortgage Corporation 4.5% 0.01 1,140,519 1,093,206 2040-04-01Celgene Corporation 3.9% 0.01 1,140,463 1,184,819 2028-02-20Kellogg Company 3.25% 0.01 1,139,826 1,210,095 2026-04-01Corporate Office Properties LP 5.25% 0.01 1,138,948 1,105,831 2024-02-15................................................................................................................................................................................................................................................................................................The Republic of Peru 8.75% 0.01 1,137,516 769,893 2033-11-21Federal National Mortgage Association 3% 0.01 1,136,782 1,176,448 2042-10-01United Health Group Incorporated 6.62% 0.01 1,136,053 874,598 2037-11-15MPLX LP 4.7% 0.01 1,135,380 1,218,355 2048-04-15Aetna, Inc. 2.75% 0.01 1,135,095 1,176,920 2022-11-15................................................................................................................................................................................................................................................................................................Federal Home Loan Mortgage Corporation 2.5% 0.01 1,133,215 1,174,788 2031-12-01General Dynamics Corporation 2.25% 0.01 1,133,129 1,184,819 2022-11-15NEW JERSEY ECONOMIC DEV AUTH 0% 0.01 1,132,367 1,184,819 2020-02-15Anheuser-Busch InBev Worldwide Inc. 8.2% 0.01 1,132,090 806,463 2039-01-15Federal Home Loan Mortgage Corporation 4% 0.01 1,131,842 1,119,826 2047-10-01................................................................................................................................................................................................................................................................................................Molson Coors Brewing Company 2.1% 0.01 1,131,689 1,176,920 2021-07-15General Dynamics Corporation 2.12% 0.01 1,131,254 1,263,807 2026-08-15METROPOLITAN TRANSN AUTH N Y 7.34% 0.01 1,130,882 792,989 2039-11-15Government National Mortgage Association 4% 0.01 1,130,280 1,103,258 2040-11-20Federal National Mortgage Association 3% 0.01 1,129,355 1,149,046 2032-10-01................................................................................................................................................................................................................................................................................................Apache Corporation 5.1% 0.01 1,129,232 1,141,751 2040-09-01Federal Home Loan Mortgage Corporation 3.5% 0.01 1,129,100 1,123,266 2027-08-01American Express Credit Account Master Trust 1.93% 0.01 1,128,198 1,144,058 2022-09-15Ford Motor Company 5.29% 0.01 1,127,995 1,266,473 2046-12-08Sumitomo Mitsui Financial Group Inc 2.06% 0.01 1,127,717 1,172,971 2021-07-14................................................................................................................................................................................................................................................................................................Tennessee Gas Pipeline Company 7% 0.01 1,126,771 971,552 2027-03-15Inter-American Development Bank 1.25% 0.01 1,126,417 1,184,819 2021-09-14Federal National Mortgage Association 4.5% 0.01 1,123,093 1,079,243 2041-05-01Government National Mortgage Association 4.5% 0.01 1,122,963 1,080,906 2047-04-20Federal National Mortgage Association 2.5% 0.01 1,122,690 1,182,105 2036-11-01................................................................................................................................................................................................................................................................................................Federal National Mortgage Association 3.5% 0.01 1,122,125 1,131,281 2041-01-01PSEG Power LLC 8.62% 0.01 1,119,360 857,660 2031-04-15Government National Mortgage Association 4% 0.01 1,119,042 1,093,438 2040-08-15Noble Energy, Inc. 5.05% 0.01 1,118,643 1,154,839 2044-11-15Capital One Financial Corporation 3.75% 0.01 1,118,389 1,184,819 2027-03-09................................................................................................................................................................................................................................................................................................Republic of Colombia 4% 0.01 1,117,680 1,117,680 2024-02-26MetLife Inc. 4.12% 0.01 1,116,690 1,177,936 2042-08-13Federal Home Loan Mortgage Corporation 4% 0.01 1,116,653 1,104,044 2047-09-01NEW JERSEY ST TPK AUTH 7.41% 0.01 1,115,875 779,901 2040-01-01Inter-American Development Bank 2.12% 0.01 1,115,730 1,184,819 2025-01-15................................................................................................................................................................................................................................................................................................Deutsche Bank AG 3.7% 0.01 1,115,609 1,184,819 2024-05-30JPMorgan Chase & Co. 3.78% 0.01 1,114,593 1,145,325 2028-02-01Federal National Mortgage Association 3% 0.01 1,114,296 1,142,742 2036-07-01Federal Home Loan Mortgage Corporation 4% 0.01 1,113,524 1,100,347 2045-08-01Morgan Stanley 3.7% 0.01 1,112,140 1,129,528 2024-10-23................................................................................................................................................................................................................................................................................................
©2018 Morningstar, Inc., Morningstar Investment Profiles™ 312-696-6000. All rights reserved. The information contained herein: (1) is proprietary to Morningstar and/or its content providers; (2) maynot be copied or distributed and (3) is not warranted to be accurate, complete or timely. Neither Morningstar nor its content providers are responsible for any damages or losses arising from any use ofinformation. Past performance is no guarantee of future performance. Visit our investment website at www.morningstar.com ß
®

Page 31 of 162
Broad Market Bond Index Fund.......................................................................................................................................................................................................................................................................................................................................
Total Stocks Total Bonds Total Cash0 9083 28
Bond Portfolio Analysis as of 09-30-18Security Name Net Assets % Market Value $ Amount $ Maturity Date
Federal Home Loan Mortgage Corporation 3.5% 0.01 1,111,440 1,126,095 2045-10-01Federal National Mortgage Association 3% 0.01 1,109,393 1,148,367 2042-11-01Viacom Inc 3.88% 0.01 1,108,963 1,128,738 2024-04-01Skandinaviska Enskilda Banken AB (publ) 1.88% 0.01 1,108,784 1,161,123 2021-09-13General Motors Financial Company Inc 3.7% 0.01 1,107,492 1,133,477 2023-05-09................................................................................................................................................................................................................................................................................................Keurig Dr Pepper Inc 2% 0.01 1,107,140 1,125,578 2020-01-15Federal National Mortgage Association 3% 0.01 1,106,536 1,125,837 2033-08-01Federal National Mortgage Association 4% 0.01 1,105,983 1,087,218 2039-04-01Government National Mortgage Association 3.5% 0.01 1,105,434 1,105,285 2042-03-15Federal National Mortgage Association 3.5% 0.01 1,104,537 1,117,568 2045-11-01Cigna Corporation 3.25% 0.01 1,102,975 1,165,072 2025-04-15Government National Mortgage Association 3.5% 0.01 1,102,466 1,101,962 2042-03-20Apple Inc. 1.55% 0.01 1,102,448 1,149,275 2021-08-04Government National Mortgage Association 3.5% 0.01 1,101,146 1,099,303 2043-04-20Federal Home Loan Mortgage Corporation 4% 0.01 1,100,939 1,081,807 2031-01-01................................................................................................................................................................................................................................................................................................Masco Corporation 4.38% 0.01 1,100,820 1,105,831 2026-04-01Boardwalk Pipelines LP 4.45% 0.01 1,100,149 1,145,325 2027-07-15Federal Home Loan Mortgage Corporation 4% 0.01 1,099,155 1,087,868 2047-11-01Federal Home Loan Mortgage Corporation 3% 0.01 1,097,771 1,146,445 2047-12-01Federal National Mortgage Association 1.25% 0.01 1,097,584 1,149,020 2021-08-17................................................................................................................................................................................................................................................................................................Ecopetrol S.A. 5.88% 0.01 1,096,450 1,108,645 2045-05-28Federal Home Loan Mortgage Corporation 4% 0.01 1,095,776 1,081,912 2044-12-01Thermo Fisher Scientific Inc 3.3% 0.01 1,095,661 1,105,831 2022-02-15National Rural Utilities Cooperative Finance Corporation8%
0.01 1,093,870 797,994 2032-03-01
GRUPO TELEVISA S A B 6.62% 0.01 1,090,169 962,366 2040-01-15................................................................................................................................................................................................................................................................................................Government National Mortgage Association 4% 0.01 1,089,657 1,065,633 2046-03-20Kerr-Mcgee Corporation 7.88% 0.01 1,088,347 873,828 2031-09-15Wells Fargo & Company 4.65% 0.01 1,088,104 1,117,884 2044-11-04Federal Home Loan Mortgage Corporation 5% 0.01 1,087,428 1,024,604 2039-04-01General Mills, Inc. 3.2% 0.01 1,086,452 1,184,819 2027-02-10................................................................................................................................................................................................................................................................................................Federal Home Loan Mortgage Corporation 3.5% 0.01 1,084,436 1,093,244 2043-04-01WACHOVIA CORPORATION 5.5% 0.01 1,084,315 1,002,785 2035-08-01Apple Inc. 3.75% 0.01 1,083,873 1,152,914 2047-09-12Eversource Energy 2.8% 0.01 1,083,473 1,125,578 2023-05-01John Deere Capital Corporation 3.12% 0.01 1,082,607 1,086,084 2021-09-10................................................................................................................................................................................................................................................................................................Citigroup Inc. 4.5% 0.01 1,080,247 1,050,540 2022-01-14Telefonos de Mexico, S.A. de C.V. 5.5% 0.01 1,079,999 1,054,489 2019-11-15E.I. Du Pont de Nemours and Company 2.8% 0.01 1,079,236 1,109,781 2023-02-15U.S. Bancorp 4.12% 0.01 1,077,417 1,054,489 2021-05-24AT&T Inc 5.15% 0.01 1,077,009 1,135,592 2050-02-15................................................................................................................................................................................................................................................................................................Barclays PLC 3.68% 0.01 1,076,972 1,105,831 2023-01-10Willis Towers Watson Public Limited Company 5.75% 0.01 1,076,410 1,026,843 2021-03-15Federal Home Loan Mortgage Corporation 5% 0.01 1,075,261 1,012,407 2044-03-01Nike, Inc. 2.38% 0.01 1,074,849 1,184,819 2026-11-01HSBC Holdings plc 6.5% 0.01 1,074,650 912,323 2036-05-02................................................................................................................................................................................................................................................................................................Federal Home Loan Mortgage Corporation 3.5% 0.01 1,074,340 1,088,050 2045-01-01Federal National Mortgage Association 3% 0.01 1,073,920 1,121,367 2047-03-01JPMorgan Chase & Co. 5.4% 0.01 1,073,714 955,052 2042-01-06Federal National Mortgage Association 3.5% 0.01 1,073,681 1,085,044 2044-01-01Leggett & Platt Inc. 3.5% 0.01 1,073,604 1,149,275 2027-11-15................................................................................................................................................................................................................................................................................................Amgen Inc. 2.6% 0.01 1,072,572 1,184,819 2026-08-19WELLTOWER INC 3.75% 0.01 1,070,569 1,078,186 2023-03-15Halliburton Company 7.45% 0.01 1,069,278 797,224 2039-09-15Federal National Mortgage Association 4.5% 0.01 1,069,129 1,026,872 2040-03-01American Express Company 2.65% 0.01 1,067,151 1,108,201 2022-12-02................................................................................................................................................................................................................................................................................................
©2018 Morningstar, Inc., Morningstar Investment Profiles™ 312-696-6000. All rights reserved. The information contained herein: (1) is proprietary to Morningstar and/or its content providers; (2) maynot be copied or distributed and (3) is not warranted to be accurate, complete or timely. Neither Morningstar nor its content providers are responsible for any damages or losses arising from any use ofinformation. Past performance is no guarantee of future performance. Visit our investment website at www.morningstar.com ß
®

Page 32 of 162
Broad Market Bond Index Fund.......................................................................................................................................................................................................................................................................................................................................
Total Stocks Total Bonds Total Cash0 9083 28
Bond Portfolio Analysis as of 09-30-18Security Name Net Assets % Market Value $ Amount $ Maturity Date
Federal National Mortgage Association 3.5% 0.01 1,066,857 1,073,189 2037-11-01The Boeing Company 2.5% 0.01 1,066,542 1,137,427 2025-03-01Federal National Mortgage Association 4.5% 0.01 1,066,528 1,022,027 2039-09-01Florida Power & Light Company 5.95% 0.01 1,066,271 872,288 2038-02-01Caterpillar Inc 3.8% 0.01 1,066,270 1,114,035 2042-08-15................................................................................................................................................................................................................................................................................................Federal National Mortgage Association 3.5% 0.01 1,066,244 1,079,387 2046-05-01Morgan Stanley 4.38% 0.01 1,066,149 1,097,097 2047-01-22Government National Mortgage Association 3.5% 0.01 1,065,817 1,066,990 2042-08-15Precision Castparts Corp. 2.5% 0.01 1,064,689 1,105,831 2023-01-15Government National Mortgage Association 3% 0.01 1,064,222 1,094,185 2042-09-15Wells Fargo & Company 2.5% 0.01 1,063,702 1,086,084 2021-03-04Federal National Mortgage Association 5% 0.01 1,062,858 998,909 2041-08-01Petro-Canada 6.8% 0.01 1,061,998 836,103 2038-05-15Federal National Mortgage Association 3% 0.01 1,061,900 1,089,009 2036-09-01Government National Mortgage Association 4% 0.01 1,059,973 1,032,891 2041-10-20................................................................................................................................................................................................................................................................................................Southwestern Public Service Company 3.7% 0.01 1,057,390 1,154,839 2047-08-15Duke Energy Indiana, LLC. 3.75% 0.01 1,056,045 1,154,839 2046-05-15Phillips 66 4.3% 0.01 1,055,873 1,026,843 2022-04-01AEP Transmission Company, LLC 3.75% 0.01 1,055,489 1,154,839 2047-12-01Energy Transfer Partners LP 7.5% 0.01 1,055,232 883,837 2038-07-01................................................................................................................................................................................................................................................................................................United Technologies Corporation 3.1% 0.01 1,054,551 1,070,287 2022-06-01Southern Copper Corporation 5.88% 0.01 1,054,420 965,830 2045-04-23National Oilwell Varco Incorporation 2.6% 0.01 1,053,570 1,105,831 2022-12-01Kreditanstalt Fur Wiederaufbau 0% 0.01 1,053,499 1,886,622 2036-04-18Nordic Investment Bank 2.25% 0.01 1,053,435 1,071,077 2021-02-01................................................................................................................................................................................................................................................................................................Federal National Mortgage Association 4% 0.01 1,052,883 1,033,629 2038-01-01Federal National Mortgage Association 3% 0.01 1,052,701 1,090,352 2043-03-01NEW JERSEY ST TRANSN TR FD AUTH 6.56% 0.01 1,051,390 873,828 2040-12-15Federal National Mortgage Association 4% 0.01 1,051,123 1,033,132 2041-01-01Federal National Mortgage Association 3.5% 0.01 1,050,804 1,046,823 2032-05-01................................................................................................................................................................................................................................................................................................Federal Home Loan Mortgage Corporation 1.5% 0.01 1,050,302 1,066,947 2020-01-17Visa Inc 4.15% 0.01 1,049,253 1,016,258 2035-12-14Federal National Mortgage Association 4% 0.01 1,047,404 1,028,947 2041-02-01American Express Credit Corporation 2.25% 0.01 1,047,111 1,074,236 2021-05-05Praxair, Inc. 2.45% 0.01 1,046,595 1,075,816 2022-02-15................................................................................................................................................................................................................................................................................................Federal Home Loan Mortgage Corporation 2.5% 0.01 1,046,426 1,084,859 2032-10-01Federal National Mortgage Association 3% 0.01 1,042,000 1,053,924 2030-12-01Federal National Mortgage Association 3.5% 0.01 1,041,897 1,041,141 2035-12-01Government National Mortgage Association 5% 0.01 1,041,638 980,814 2041-01-15Energy Transfer Partners LP 4.2% 0.01 1,041,424 1,078,186 2027-04-15................................................................................................................................................................................................................................................................................................Deutsche Telekom International Finance B.V. 9.25% 0.01 1,040,796 719,080 2032-06-01Lockheed Martin Corporation 4.07% 0.01 1,039,110 1,068,996 2042-12-15Waste Management, Inc. 4.1% 0.01 1,039,002 1,057,448 2045-03-01Federal Home Loan Mortgage Corporation 2.5% 0.01 1,038,322 1,076,365 2031-06-01Marathon Oil Corporation 6.8% 0.01 1,037,840 881,527 2032-03-15................................................................................................................................................................................................................................................................................................Federal Home Loan Mortgage Corporation 3% 0.01 1,037,561 1,064,034 2037-01-01International Paper Company 5% 0.01 1,037,331 1,020,108 2035-09-15JPMorgan Chase & Co. 5.62% 0.01 1,036,670 912,323 2043-08-16Government National Mortgage Association 4.5% 0.01 1,036,180 989,305 2046-10-20Government National Mortgage Association 3.5% 0.01 1,034,366 1,036,712 2043-02-20................................................................................................................................................................................................................................................................................................Government National Mortgage Association 4% 0.01 1,033,695 1,004,048 2041-01-15Government National Mortgage Association 2.5% 0.01 1,033,646 1,065,277 2031-10-20Federal Home Loan Mortgage Corporation 3.5% 0.01 1,033,289 1,046,256 2045-07-01Federal National Mortgage Association 3.5% 0.01 1,032,900 1,033,262 2037-05-01Federal Home Loan Mortgage Corporation 3.5% 0.01 1,032,778 1,041,160 2042-06-01................................................................................................................................................................................................................................................................................................Federal National Mortgage Association 4% 0.01 1,031,229 1,013,581 2042-05-01Federal Home Loan Mortgage Corporation 4.5% 0.01 1,028,682 985,949 2041-02-01Federal National Mortgage Association 3.5% 0.01 1,027,115 1,039,231 2045-05-01Baker Hughes A Ge 3.2% 0.01 1,021,519 1,026,843 2021-08-15BNP Paribas 5% 0.01 1,021,447 987,349 2021-01-15................................................................................................................................................................................................................................................................................................
©2018 Morningstar, Inc., Morningstar Investment Profiles™ 312-696-6000. All rights reserved. The information contained herein: (1) is proprietary to Morningstar and/or its content providers; (2) maynot be copied or distributed and (3) is not warranted to be accurate, complete or timely. Neither Morningstar nor its content providers are responsible for any damages or losses arising from any use ofinformation. Past performance is no guarantee of future performance. Visit our investment website at www.morningstar.com ß
®

Page 33 of 162
Broad Market Bond Index Fund.......................................................................................................................................................................................................................................................................................................................................
Total Stocks Total Bonds Total Cash0 9083 28
Bond Portfolio Analysis as of 09-30-18Security Name Net Assets % Market Value $ Amount $ Maturity Date
Federal National Mortgage Association 4% 0.01 1,018,865 1,000,821 2040-11-01Government National Mortgage Association 3.5% 0.01 1,018,541 1,018,494 2043-07-20Philippines (Republic Of) 6.38% 0.01 1,016,829 831,484 2032-01-15Federal National Mortgage Association 4.5% 0.01 1,016,825 974,332 2039-04-01Government National Mortgage Association 3% 0.01 1,016,262 1,021,088 2028-09-20MetLife Inc. 5.88% 0.01 1,015,360 866,129 2041-02-06Federal Home Loan Mortgage Corporation 3% 0.01 1,015,022 1,051,396 2043-02-01Council of Europe Development Bank 1.75% 0.01 1,014,932 1,026,843 2019-11-14Amazon.com, Inc. 4.05% 0.01 1,014,356 1,029,731 2047-08-22Hewlett Packard Enterprise Company 4.4% 0.01 1,014,149 987,349 2022-10-15................................................................................................................................................................................................................................................................................................Federal National Mortgage Association 5.5% 0.01 1,014,038 934,991 2039-12-01Citigroup Inc. 4.3% 0.01 1,012,321 1,026,843 2026-11-20Federal National Mortgage Association 3.5% 0.01 1,011,328 1,007,483 2034-01-01Federal Home Loan Mortgage Corporation 3% 0.01 1,010,053 1,051,109 2045-06-01General Motors Company 6.25% 0.01 1,008,547 983,538 2043-10-02................................................................................................................................................................................................................................................................................................Air Lease Corporation 3.5% 0.01 1,008,407 1,015,785 2022-01-15Shell International Finance B.V. 4.38% 0.01 1,007,377 970,065 2045-05-11Israel (State Of) 4% 0.01 1,007,132 987,349 2022-06-30GNMA PASS-THRU M SINGLE FAMILY 3.5% 0.01 1,007,069 1,009,355 2044-10-20Federal National Mortgage Association 2.5% 0.01 1,006,708 1,035,486 2031-03-01................................................................................................................................................................................................................................................................................................Private Export Funding Corp. 3.55% 0.01 1,003,216 984,874 2024-01-15Federal Farm Credit Banks 1.68% 0.01 1,002,427 1,025,911 2020-10-13Amgen Inc. 3.88% 0.01 1,001,541 987,349 2021-11-15Pepsico Capital Resources, Inc. 1.7% 0.01 1,001,260 1,042,641 2021-10-06Federal National Mortgage Association 3% 0.01 1,001,215 1,031,704 2037-09-01................................................................................................................................................................................................................................................................................................Anthem Inc 4.62% 0.01 1,000,588 1,023,957 2042-05-15Vodafone Group plc 2.95% 0.01 999,509 1,036,322 2023-02-19Lincoln National Corporation 4% 0.01 998,499 987,349 2023-09-01Federal Home Loan Mortgage Corporation 3.25% 0.01 997,551 995,291 2023-04-25Federal Home Loan Mortgage Corporation 4% 0.01 996,499 985,920 2047-08-01................................................................................................................................................................................................................................................................................................Federal Home Loan Mortgage Corporation 3% 0.01 995,807 1,021,213 2036-06-01Federal Home Loan Mortgage Corporation 3% 0.01 995,478 1,025,786 2037-10-01Union Pacific Corporation 4.75% 0.01 995,009 962,366 2043-12-15APTIV PLC 3.15% 0.01 994,058 1,003,147 2020-11-19Petro-Canada 5.95% 0.01 993,146 862,280 2035-05-15................................................................................................................................................................................................................................................................................................General Motors Financial Company Inc 3.7% 0.01 992,033 987,349 2020-11-24Federal Home Loan Mortgage Corporation 2.5% 0.01 991,237 1,021,791 2029-10-01Verizon Communications Inc. 4.27% 0.01 990,496 1,039,355 2036-01-15Federal Home Loan Mortgage Corporation 2.79% 0.01 987,863 997,874 2022-01-25Federal Home Loan Mortgage Corporation 3% 0.01 986,347 1,021,718 2043-04-01................................................................................................................................................................................................................................................................................................Federal Home Loan Mortgage Corporation 2.5% 0.01 986,096 1,064,880 2043-07-01Federal Home Loan Mortgage Corporation 3.5% 0.01 984,119 998,784 2047-03-01Digital Realty Trust, L.P. 5.25% 0.01 981,407 947,855 2021-03-15Amazon.com, Inc. 4.8% 0.01 980,143 898,465 2034-12-05Federal National Mortgage Association 3% 0.01 978,491 1,013,857 2043-04-01................................................................................................................................................................................................................................................................................................Government National Mortgage Association 4% 0.01 977,034 954,786 2040-12-20Federal Home Loan Mortgage Corporation 2.5% 0.01 975,786 1,004,405 2027-03-01Enbridge Energy Partners L.P. 7.5% 0.01 975,744 756,805 2038-04-15Federal Home Loan Banks 2.12% 0.01 975,678 984,874 2020-03-13Government National Mortgage Association 3% 0.01 975,038 980,017 2032-04-20................................................................................................................................................................................................................................................................................................Government National Mortgage Association 4% 0.01 974,763 954,095 2047-07-20Diamond 1 Finance Corporation/Diamond 2 FinanceCorporation 8.1%
0.01 973,832 811,467 2036-07-15
Kraft Foods Group Inc. 3.5% 0.01 973,359 979,451 2022-06-06Credit Suisse AG New York Branch 3.62% 0.01 973,112 987,349 2024-09-09HALFMOON PARENT INC 4.9% 0.01 972,612 979,688 2048-12-15................................................................................................................................................................................................................................................................................................Cisco Systems, Inc. 5.5% 0.01 972,231 815,316 2040-01-15Federal Home Loan Banks 2.88% 0.01 971,352 984,874 2024-09-13Federal Home Loan Banks 2.25% 0.01 970,680 984,874 2021-01-29Citibank, N.A. 2.1% 0.01 969,693 987,349 2020-06-12Federal National Mortgage Association 2.5% 0.01 967,809 998,373 2030-01-01
©2018 Morningstar, Inc., Morningstar Investment Profiles™ 312-696-6000. All rights reserved. The information contained herein: (1) is proprietary to Morningstar and/or its content providers; (2) maynot be copied or distributed and (3) is not warranted to be accurate, complete or timely. Neither Morningstar nor its content providers are responsible for any damages or losses arising from any use ofinformation. Past performance is no guarantee of future performance. Visit our investment website at www.morningstar.com ß
®
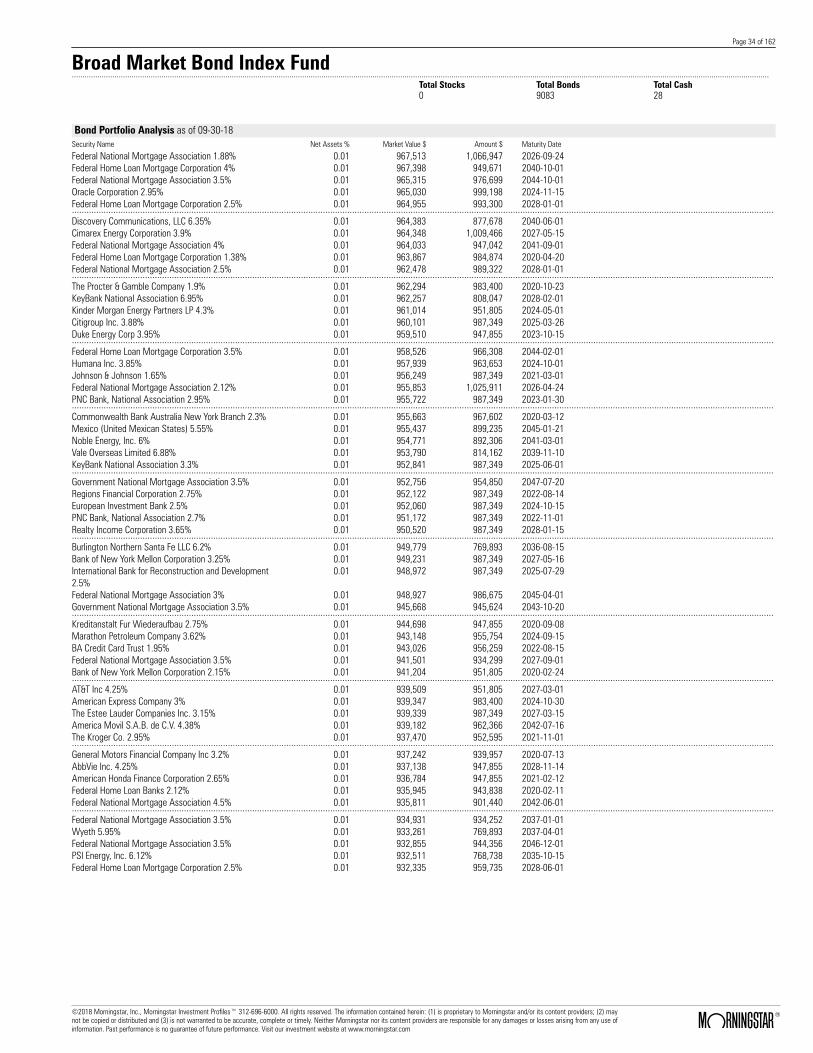
Page 34 of 162
Broad Market Bond Index Fund.......................................................................................................................................................................................................................................................................................................................................
Total Stocks Total Bonds Total Cash0 9083 28
Bond Portfolio Analysis as of 09-30-18Security Name Net Assets % Market Value $ Amount $ Maturity Date
Federal National Mortgage Association 1.88% 0.01 967,513 1,066,947 2026-09-24Federal Home Loan Mortgage Corporation 4% 0.01 967,398 949,671 2040-10-01Federal National Mortgage Association 3.5% 0.01 965,315 976,699 2044-10-01Oracle Corporation 2.95% 0.01 965,030 999,198 2024-11-15Federal Home Loan Mortgage Corporation 2.5% 0.01 964,955 993,300 2028-01-01................................................................................................................................................................................................................................................................................................Discovery Communications, LLC 6.35% 0.01 964,383 877,678 2040-06-01Cimarex Energy Corporation 3.9% 0.01 964,348 1,009,466 2027-05-15Federal National Mortgage Association 4% 0.01 964,033 947,042 2041-09-01Federal Home Loan Mortgage Corporation 1.38% 0.01 963,867 984,874 2020-04-20Federal National Mortgage Association 2.5% 0.01 962,478 989,322 2028-01-01................................................................................................................................................................................................................................................................................................The Procter & Gamble Company 1.9% 0.01 962,294 983,400 2020-10-23KeyBank National Association 6.95% 0.01 962,257 808,047 2028-02-01Kinder Morgan Energy Partners LP 4.3% 0.01 961,014 951,805 2024-05-01Citigroup Inc. 3.88% 0.01 960,101 987,349 2025-03-26Duke Energy Corp 3.95% 0.01 959,510 947,855 2023-10-15................................................................................................................................................................................................................................................................................................Federal Home Loan Mortgage Corporation 3.5% 0.01 958,526 966,308 2044-02-01Humana Inc. 3.85% 0.01 957,939 963,653 2024-10-01Johnson & Johnson 1.65% 0.01 956,249 987,349 2021-03-01Federal National Mortgage Association 2.12% 0.01 955,853 1,025,911 2026-04-24PNC Bank, National Association 2.95% 0.01 955,722 987,349 2023-01-30................................................................................................................................................................................................................................................................................................Commonwealth Bank Australia New York Branch 2.3% 0.01 955,663 967,602 2020-03-12Mexico (United Mexican States) 5.55% 0.01 955,437 899,235 2045-01-21Noble Energy, Inc. 6% 0.01 954,771 892,306 2041-03-01Vale Overseas Limited 6.88% 0.01 953,790 814,162 2039-11-10KeyBank National Association 3.3% 0.01 952,841 987,349 2025-06-01................................................................................................................................................................................................................................................................................................Government National Mortgage Association 3.5% 0.01 952,756 954,850 2047-07-20Regions Financial Corporation 2.75% 0.01 952,122 987,349 2022-08-14European Investment Bank 2.5% 0.01 952,060 987,349 2024-10-15PNC Bank, National Association 2.7% 0.01 951,172 987,349 2022-11-01Realty Income Corporation 3.65% 0.01 950,520 987,349 2028-01-15................................................................................................................................................................................................................................................................................................Burlington Northern Santa Fe LLC 6.2% 0.01 949,779 769,893 2036-08-15Bank of New York Mellon Corporation 3.25% 0.01 949,231 987,349 2027-05-16International Bank for Reconstruction and Development2.5%
0.01 948,972 987,349 2025-07-29
Federal National Mortgage Association 3% 0.01 948,927 986,675 2045-04-01Government National Mortgage Association 3.5% 0.01 945,668 945,624 2043-10-20................................................................................................................................................................................................................................................................................................Kreditanstalt Fur Wiederaufbau 2.75% 0.01 944,698 947,855 2020-09-08Marathon Petroleum Company 3.62% 0.01 943,148 955,754 2024-09-15BA Credit Card Trust 1.95% 0.01 943,026 956,259 2022-08-15Federal National Mortgage Association 3.5% 0.01 941,501 934,299 2027-09-01Bank of New York Mellon Corporation 2.15% 0.01 941,204 951,805 2020-02-24................................................................................................................................................................................................................................................................................................AT&T Inc 4.25% 0.01 939,509 951,805 2027-03-01American Express Company 3% 0.01 939,347 983,400 2024-10-30The Estee Lauder Companies Inc. 3.15% 0.01 939,339 987,349 2027-03-15America Movil S.A.B. de C.V. 4.38% 0.01 939,182 962,366 2042-07-16The Kroger Co. 2.95% 0.01 937,470 952,595 2021-11-01................................................................................................................................................................................................................................................................................................General Motors Financial Company Inc 3.2% 0.01 937,242 939,957 2020-07-13AbbVie Inc. 4.25% 0.01 937,138 947,855 2028-11-14American Honda Finance Corporation 2.65% 0.01 936,784 947,855 2021-02-12Federal Home Loan Banks 2.12% 0.01 935,945 943,838 2020-02-11Federal National Mortgage Association 4.5% 0.01 935,811 901,440 2042-06-01................................................................................................................................................................................................................................................................................................Federal National Mortgage Association 3.5% 0.01 934,931 934,252 2037-01-01Wyeth 5.95% 0.01 933,261 769,893 2037-04-01Federal National Mortgage Association 3.5% 0.01 932,855 944,356 2046-12-01PSI Energy, Inc. 6.12% 0.01 932,511 768,738 2035-10-15Federal Home Loan Mortgage Corporation 2.5% 0.01 932,335 959,735 2028-06-01
©2018 Morningstar, Inc., Morningstar Investment Profiles™ 312-696-6000. All rights reserved. The information contained herein: (1) is proprietary to Morningstar and/or its content providers; (2) maynot be copied or distributed and (3) is not warranted to be accurate, complete or timely. Neither Morningstar nor its content providers are responsible for any damages or losses arising from any use ofinformation. Past performance is no guarantee of future performance. Visit our investment website at www.morningstar.com ß
®

Page 35 of 162
Broad Market Bond Index Fund.......................................................................................................................................................................................................................................................................................................................................
Total Stocks Total Bonds Total Cash0 9083 28
Bond Portfolio Analysis as of 09-30-18Security Name Net Assets % Market Value $ Amount $ Maturity Date
TransCanada Pipelines Limited 6.2% 0.01 931,766 797,994 2037-10-15Federal Home Loan Mortgage Corporation 3.5% 0.01 931,656 939,212 2044-04-01BHP Billiton Finance (USA) Limited 5% 0.01 931,575 839,183 2043-09-30The Charles Schwab Corporation 4.45% 0.01 930,964 908,361 2020-07-22Waste Management, Inc. 3.12% 0.01 930,530 959,704 2025-03-01................................................................................................................................................................................................................................................................................................Federal Home Loan Mortgage Corporation 3.5% 0.01 930,147 942,712 2047-06-01Federal National Mortgage Association 3.5% 0.01 930,118 943,707 2047-06-01CHICAGO ILL MET WTR RECLAMATION DIST 5.72% 0.01 929,430 769,893 2038-12-0121st Century Fox America, Inc. 5.4% 0.01 927,985 792,989 2043-10-01Federal National Mortgage Association 3% 0.01 927,159 935,359 2029-01-01................................................................................................................................................................................................................................................................................................Federal Home Loan Mortgage Corporation 3% 0.01 927,030 950,683 2036-09-01Federal National Mortgage Association 3% 0.01 926,362 950,009 2035-12-01GNMA PASS-THRU M SINGLE FAMILY 3% 0.01 925,718 950,081 2044-11-20Federal National Mortgage Association 3% 0.01 924,999 933,166 2028-12-01Federal National Mortgage Association 3% 0.01 923,949 932,120 2029-11-01................................................................................................................................................................................................................................................................................................E.I. Du Pont de Nemours and Company 6.5% 0.01 923,684 789,880 2028-01-15Government National Mortgage Association 4% 0.01 923,234 905,020 2042-11-20Federal Home Loan Mortgage Corporation 3.5% 0.01 922,340 918,657 2032-02-01CALIFORNIA ST 7.62% 0.01 922,088 633,237 2040-03-01NiSource Inc. 5.25% 0.01 922,018 871,903 2043-02-15................................................................................................................................................................................................................................................................................................McDonald's Corporation 4.88% 0.01 921,888 881,527 2045-12-09Amgen Inc. 6.4% 0.01 920,647 769,893 2039-02-01Discovery Communications, LLC 4.9% 0.01 920,128 896,513 2026-03-11Federal Home Loan Mortgage Corporation 3.5% 0.01 919,537 927,005 2043-04-01Federal Home Loan Mortgage Corporation 3.5% 0.01 919,226 926,691 2043-05-01................................................................................................................................................................................................................................................................................................AbbVie Inc. 2.5% 0.01 917,707 928,108 2020-05-14Cisco Systems, Inc. 5.9% 0.01 917,454 737,172 2039-02-15Federal Home Loan Mortgage Corporation 3% 0.01 917,111 950,642 2044-09-01Southern Company Gas Capital Corporation 4.4% 0.01 916,602 962,366 2047-05-30American Tower Corporation 3.12% 0.01 916,325 1,007,096 2027-01-15................................................................................................................................................................................................................................................................................................Federal Home Loan Mortgage Corporation 2.31% 0.01 915,556 943,935 2022-08-25General Electric Company 3.45% 0.01 914,651 928,898 2024-05-15Federal National Mortgage Association 4.5% 0.01 914,620 878,612 2039-11-01Government National Mortgage Association 3.5% 0.01 912,736 917,003 2042-12-20Archer-Daniels-Midland Company 4.02% 0.01 912,611 951,972 2043-04-16................................................................................................................................................................................................................................................................................................Federal Home Loan Mortgage Corporation 3% 0.01 912,400 935,680 2036-09-01International Flavors & Fragrances Inc. 3.4% 0.01 910,042 909,151 2020-09-25Mylan NV 5.25% 0.01 909,872 972,759 2046-06-15Federal National Mortgage Association 4% 0.01 908,304 892,765 2040-10-01Federal Home Loan Mortgage Corporation 3% 0.01 908,187 921,692 2033-04-01................................................................................................................................................................................................................................................................................................Government National Mortgage Association 4% 0.01 907,673 884,474 2042-04-20Federal National Mortgage Association 4% 0.01 907,642 892,224 2039-02-01Federal Home Loan Mortgage Corporation 4% 0.01 906,076 889,455 2042-04-01Bank of America Corporation 6.11% 0.01 905,337 787,215 2037-01-29Amgen Inc. 6.38% 0.01 905,252 766,043 2037-06-01................................................................................................................................................................................................................................................................................................Ford Motor Company 7.45% 0.01 904,318 814,162 2031-07-16Government National Mortgage Association 4% 0.01 903,349 881,307 2043-08-20Federal National Mortgage Association 4.5% 0.01 902,425 866,629 2040-04-01Telefonica Emisiones S.A.U. 5.21% 0.01 901,997 921,947 2047-03-08Federal National Mortgage Association 4% 0.01 900,632 890,782 2046-03-01................................................................................................................................................................................................................................................................................................QVC, Inc. 4.45% 0.01 900,455 947,855 2025-02-15The Walt Disney Company 2.55% 0.01 900,228 924,159 2022-02-15Kinder Morgan Energy Partners LP 7.5% 0.01 898,998 724,084 2040-11-15NEW YORK ST DORM AUTH 5.63% 0.01 898,524 773,742 2039-03-15Government National Mortgage Association 4% 0.01 898,206 877,149 2040-10-15EnCana Corporation 6.5% 0.01 897,788 769,893 2034-08-15United Parcel Service, Inc. 2.35% 0.01 896,806 928,108 2022-05-16Canadian Natural Resources Limited 6.45% 0.01 896,685 769,893 2033-06-30Federal Home Loan Mortgage Corporation 3.5% 0.01 895,455 905,743 2044-11-01Time Warner Cable Inc. 5.88% 0.01 895,053 886,531 2040-11-15................................................................................................................................................................................................................................................................................................
©2018 Morningstar, Inc., Morningstar Investment Profiles™ 312-696-6000. All rights reserved. The information contained herein: (1) is proprietary to Morningstar and/or its content providers; (2) maynot be copied or distributed and (3) is not warranted to be accurate, complete or timely. Neither Morningstar nor its content providers are responsible for any damages or losses arising from any use ofinformation. Past performance is no guarantee of future performance. Visit our investment website at www.morningstar.com ß
®

Page 36 of 162
Broad Market Bond Index Fund.......................................................................................................................................................................................................................................................................................................................................
Total Stocks Total Bonds Total Cash0 9083 28
Bond Portfolio Analysis as of 09-30-18Security Name Net Assets % Market Value $ Amount $ Maturity Date
Federal National Mortgage Association 4.5% 0.01 894,927 863,337 2043-09-01MetLife Inc. 6.4% 0.01 894,431 843,802 2066-12-15Caterpillar Inc 5.2% 0.01 894,366 781,441 2041-05-27Federal National Mortgage Association 4% 0.01 893,184 878,029 2046-02-01Government National Mortgage Association 4.5% 0.01 893,158 859,750 2047-05-20................................................................................................................................................................................................................................................................................................Federal Home Loan Mortgage Corporation 3.5% 0.01 891,241 900,727 2044-10-01General Motors Company 6.6% 0.01 890,565 835,334 2036-04-01FedEx Corporation 4.75% 0.01 890,406 889,226 2045-11-15Federal National Mortgage Association 2.5% 0.01 890,352 915,164 2027-06-01Federal Home Loan Mortgage Corporation 3% 0.01 888,905 901,830 2031-12-01................................................................................................................................................................................................................................................................................................Consolidated Edison Company of New York, Inc. 6.75% 0.01 888,567 679,815 2038-04-01Citigroup Inc. 6.62% 0.01 888,012 752,570 2032-06-15eBay Inc. 2.75% 0.01 887,563 924,159 2023-01-30Federal National Mortgage Association 4.5% 0.01 886,870 852,234 2041-04-01Federal Home Loan Mortgage Corporation 3% 0.01 885,996 926,015 2044-09-15................................................................................................................................................................................................................................................................................................Federal Home Loan Banks 1.75% 0.01 885,977 902,801 2020-07-13Federal National Mortgage Association 4% 0.01 885,760 873,629 2043-12-01AvalonBay Communities, Inc. 4.2% 0.01 885,732 864,918 2023-12-15Citigroup Inc. 8.12% 0.01 885,161 613,220 2039-07-15Federal National Mortgage Association 4.5% 0.01 884,310 849,776 2040-09-01................................................................................................................................................................................................................................................................................................Sumitomo Mitsui Financial Group Inc 3.1% 0.01 883,210 907,572 2023-01-17Pepsico Capital Resources, Inc. 4.88% 0.01 882,630 802,613 2040-11-01Federal National Mortgage Association 2.5% 0.01 882,007 909,865 2030-02-01The Mosaic Company 3.25% 0.01 881,725 902,832 2022-11-15Government National Mortgage Association 3% 0.01 881,657 885,876 2031-07-20................................................................................................................................................................................................................................................................................................Federal National Mortgage Association 4% 0.01 880,752 870,045 2044-09-01Government National Mortgage Association 3% 0.01 880,081 900,570 2043-03-20GEORGIA MUN ELEC AUTH 6.64% 0.01 879,543 745,641 2057-04-01Weyerhaeuser Company 4.62% 0.01 879,385 857,019 2023-09-15Discovery Communications, LLC 4.95% 0.01 878,395 933,110 2042-05-15................................................................................................................................................................................................................................................................................................Starbucks Corporation 3.85% 0.01 878,289 868,867 2023-10-01Kinder Morgan Energy Partners LP 6.5% 0.01 877,941 777,592 2039-09-01Federal National Mortgage Association 4% 0.01 877,260 862,244 2041-09-01HSBC Holdings plc 6.8% 0.01 876,536 714,075 2038-06-01Government National Mortgage Association 3% 0.01 875,551 899,632 2043-02-15................................................................................................................................................................................................................................................................................................Caterpillar Financial Services Corporation 3.75% 0.01 875,357 868,867 2023-11-24Ecopetrol S.A. 7.38% 0.01 874,791 769,893 2043-09-18Molson Coors Brewing Company 5% 0.01 872,146 879,602 2042-05-01Target Corporation 4% 0.01 871,094 906,549 2042-07-01Tennessee Valley Authority 3.5% 0.01 871,089 898,167 2042-12-15................................................................................................................................................................................................................................................................................................V.F. Corporation 3.5% 0.01 870,451 868,867 2021-09-01Tyson Foods, Inc. 4.5% 0.01 870,360 845,171 2022-06-15Federal Home Loan Mortgage Corporation 2.87% 0.01 870,166 876,511 2021-12-25Federal Home Loan Mortgage Corporation 3.5% 0.01 869,758 880,741 2044-05-01Berkshire Hathaway Energy Company 3.8% 0.01 869,319 962,366 2048-07-15................................................................................................................................................................................................................................................................................................Federal National Mortgage Association 3% 0.01 869,271 906,264 2045-11-01Pepsico Capital Resources, Inc. 2.75% 0.01 868,510 908,361 2025-04-30S&P GLOBAL INC 4.4% 0.01 867,832 845,961 2026-02-15Exxon Mobil Corporation 4.11% 0.01 867,091 855,351 2046-03-01Northrop Grumman Corporation 3.25% 0.01 865,293 920,210 2028-01-15Federal Home Loan Mortgage Corporation 3% 0.01 865,057 881,805 2035-06-01Microsoft Corporation 3.3% 0.01 863,829 880,716 2027-02-06Federal National Mortgage Association 3% 0.01 863,165 897,224 2045-04-01International Lease Finance Corporation 8.25% 0.01 863,158 789,880 2020-12-15Federal National Mortgage Association 3.35% 0.01 862,101 863,106 2024-03-25................................................................................................................................................................................................................................................................................................Federal Home Loan Mortgage Corporation 3.31% 0.01 861,681 859,219 2023-05-25Citigroup Inc. 6% 0.01 861,222 769,893 2033-10-31European Investment Bank 1.75% 0.01 860,943 876,766 2020-05-15GNMA PASS-THRU M SINGLE FAMILY 4% 0.01 860,808 839,815 2044-12-20Federal National Mortgage Association 3% 0.01 860,725 882,699 2036-12-01................................................................................................................................................................................................................................................................................................
©2018 Morningstar, Inc., Morningstar Investment Profiles™ 312-696-6000. All rights reserved. The information contained herein: (1) is proprietary to Morningstar and/or its content providers; (2) maynot be copied or distributed and (3) is not warranted to be accurate, complete or timely. Neither Morningstar nor its content providers are responsible for any damages or losses arising from any use ofinformation. Past performance is no guarantee of future performance. Visit our investment website at www.morningstar.com ß
®

Page 37 of 162
Broad Market Bond Index Fund.......................................................................................................................................................................................................................................................................................................................................
Total Stocks Total Bonds Total Cash0 9083 28
Bond Portfolio Analysis as of 09-30-18Security Name Net Assets % Market Value $ Amount $ Maturity Date
Federal National Mortgage Association 4.5% 0.01 860,339 826,737 2041-07-01NUTRIEN LTD 6.12% 0.01 860,002 769,893 2041-01-15Southwest Airlines Co. 6.15% 0.01 859,179 815,500 2024-02-01Government National Mortgage Association 4.5% 0.01 859,094 819,014 2040-10-15Italy (Republic Of) 6.88% 0.01 857,910 789,880 2023-09-27................................................................................................................................................................................................................................................................................................Citibank Credit Card Issuance Trust 1.75% 0.01 857,572 868,662 2021-11-19Kimco Realty Corporation 3.2% 0.01 856,262 864,918 2021-05-01Prudential Financial, Inc. 4.5% 0.01 855,669 834,903 2020-11-15CSX Corporation 4.25% 0.01 855,042 837,272 2021-06-01Government National Mortgage Association 3% 0.01 854,566 878,626 2043-03-15................................................................................................................................................................................................................................................................................................Federal National Mortgage Association 2.5% 0.01 854,490 884,879 2031-12-01Hungary (Republic Of) 7.62% 0.01 853,830 612,065 2041-03-29Federal Home Loan Mortgage Corporation 3.5% 0.01 853,603 860,538 2042-10-01Federal National Mortgage Association 4% 0.01 852,943 843,877 2046-07-01European Bank For Reconstruction & Development 1.5% 0.01 851,749 868,867 2020-03-16................................................................................................................................................................................................................................................................................................Federal National Mortgage Association 3.5% 0.01 851,279 858,222 2042-12-01Federal Home Loan Mortgage Corporation 6% 0.01 851,054 769,067 2034-10-01Southern California Edison Company 5.95% 0.01 850,909 721,774 2038-02-01QUALCOMM Incorporated 3.45% 0.01 850,568 876,766 2025-05-20Microsoft Corporation 3.12% 0.01 850,500 868,867 2025-11-03................................................................................................................................................................................................................................................................................................Federal Home Loan Mortgage Corporation 4.5% 0.01 850,173 822,438 2045-12-01Federal Home Loan Mortgage Corporation 4.5% 0.01 849,965 814,800 2040-10-01Government National Mortgage Association 3% 0.01 849,843 853,902 2029-02-20Federal Home Loan Mortgage Corporation 3% 0.01 849,077 861,449 2033-07-01Sabine Pass Liquefaction, LLC 6.25% 0.01 849,008 789,880 2022-03-15................................................................................................................................................................................................................................................................................................Kansas City Power & Light Company 3.15% 0.01 848,389 868,867 2023-03-15Mylan NV 3.95% 0.01 848,038 896,513 2026-06-15DaimlerChrysler North America Holding Corporation8.5%
0.01 846,712 608,215 2031-01-18
Johnson & Johnson 4.38% 0.01 843,934 792,989 2033-12-05Marriott International, Inc. 3.12% 0.01 843,816 904,412 2026-06-15................................................................................................................................................................................................................................................................................................Ecopetrol S.A. 5.88% 0.01 841,617 789,880 2023-09-18Government National Mortgage Association 4.5% 0.01 840,613 801,970 2042-08-20Federal National Mortgage Association 3% 0.01 839,038 853,681 2035-05-01LyondellBasell Industries NV 6% 0.01 838,702 789,880 2021-11-15Koninklijke Philips NV 5% 0.01 838,435 769,893 2042-03-15................................................................................................................................................................................................................................................................................................Kraft Heinz Foods Company 2.8% 0.01 837,960 845,171 2020-07-02Federal National Mortgage Association 4.5% 0.01 837,709 804,994 2040-10-01Goldman Sachs Group, Inc. 4.8% 0.01 836,795 819,936 2044-07-08Federal National Mortgage Association 4.5% 0.01 836,234 805,480 2042-03-01American Airlines, Inc. 4.95% 0.01 835,984 815,881 2024-07-15................................................................................................................................................................................................................................................................................................Citibank Credit Card Issuance Trust 2.49% 0.01 835,660 847,372 2023-01-20International Lease Finance Corporation 5.88% 0.01 835,562 789,880 2022-08-15GNMA PASS-THRU M SINGLE FAMILY 4.5% 0.01 835,518 797,630 2044-12-20The Clorox Company 3.1% 0.01 834,774 888,614 2027-10-01Kreditanstalt Fur Wiederaufbau 2% 0.01 834,008 868,867 2022-10-04Vodafone Group plc 6.25% 0.01 833,614 744,101 2032-11-30NiSource Inc. 4.8% 0.01 831,876 821,860 2044-02-15Federal Home Loan Mortgage Corporation 3.43% 0.01 831,395 836,692 2027-01-25Government National Mortgage Association 3% 0.01 831,255 857,330 2045-07-15American Express Credit Account Master Trust 2.04% 0.01 830,605 847,372 2023-05-15................................................................................................................................................................................................................................................................................................Morgan Stanley 5.75% 0.01 830,255 789,880 2021-01-25Government National Mortgage Association 4% 0.01 829,017 809,871 2040-11-15Pacific Gas and Electric Company 5.12% 0.01 828,964 808,387 2043-11-15Mitsubishi UFJ Financial Group, Inc. 2.19% 0.01 828,700 860,969 2021-09-13Federal Home Loan Mortgage Corporation 3.5% 0.01 828,399 826,228 2035-02-01................................................................................................................................................................................................................................................................................................
©2018 Morningstar, Inc., Morningstar Investment Profiles™ 312-696-6000. All rights reserved. The information contained herein: (1) is proprietary to Morningstar and/or its content providers; (2) maynot be copied or distributed and (3) is not warranted to be accurate, complete or timely. Neither Morningstar nor its content providers are responsible for any damages or losses arising from any use ofinformation. Past performance is no guarantee of future performance. Visit our investment website at www.morningstar.com ß
®

Page 38 of 162
Broad Market Bond Index Fund.......................................................................................................................................................................................................................................................................................................................................
Total Stocks Total Bonds Total Cash0 9083 28
Bond Portfolio Analysis as of 09-30-18Security Name Net Assets % Market Value $ Amount $ Maturity Date
Federal National Mortgage Association 2.5% 0.01 828,104 851,777 2028-04-01AGL Capital Corporation 3.5% 0.01 827,186 829,374 2021-09-15Celgene Corporation 4.35% 0.01 827,039 923,871 2047-11-15Andeavor 5.12% 0.01 826,317 789,880 2026-12-15Goldman Sachs Group, Inc. 2.3% 0.01 826,010 833,323 2019-12-13................................................................................................................................................................................................................................................................................................Pacific Gas and Electric Company 2.45% 0.01 825,910 868,867 2022-08-15Celgene Corporation 5% 0.01 824,385 829,559 2045-08-15The Cleveland Clinic Foundation 4.86% 0.01 824,273 787,215 .Enterprise Products Operating LP 5.1% 0.01 823,176 781,441 2045-02-15Southern Copper Corporation 5.25% 0.01 823,075 814,162 2042-11-08................................................................................................................................................................................................................................................................................................Synchrony Bank 3% 0.01 821,532 857,019 2022-06-15Energy Transfer Partners LP 6.12% 0.01 821,207 769,893 2045-12-15Federal Home Loan Mortgage Corporation 3% 0.01 820,877 828,906 2029-09-01Bank of America Corporation 5% 0.01 820,819 789,880 2021-05-13CMS Energy Corporation 6.25% 0.01 820,707 789,880 2020-02-01................................................................................................................................................................................................................................................................................................Commonwealth Edison Company 4% 0.01 820,146 809,627 2020-08-01Valero Energy Corporation 4.9% 0.01 819,934 804,538 2045-03-15HSBC Holdings plc 4.88% 0.01 819,096 789,880 2022-01-14Morgan Stanley 4.88% 0.01 818,385 789,880 2022-11-01The Hartford Financial Services Group, Inc. 5.5% 0.01 817,752 793,829 2020-03-30................................................................................................................................................................................................................................................................................................Federal Home Loan Mortgage Corporation 3% 0.01 817,481 846,810 2043-03-01Boston Scientific Corporation 6% 0.01 817,449 789,880 2020-01-15Burlington Northern Santa Fe LLC 4.38% 0.01 817,169 798,764 2042-09-01International Paper Company 5.15% 0.01 817,125 792,989 2046-05-15Altria Group, Inc. 4.75% 0.01 816,544 789,880 2021-05-05................................................................................................................................................................................................................................................................................................Duke Energy Ohio 3.8% 0.01 815,447 805,677 2023-09-01Federal Home Loan Mortgage Corporation 4% 0.01 815,332 800,373 2042-02-01Genzyme Corporation 5% 0.01 813,995 789,880 2020-06-15Spectra Energy Partners, LP 5.95% 0.01 813,731 721,774 2043-09-25UBS AG Stamford Branch 4.88% 0.01 812,949 789,880 2020-08-04................................................................................................................................................................................................................................................................................................Government National Mortgage Association 4% 0.01 812,773 792,982 2045-09-20Gilead Sciences, Inc. 4.5% 0.01 812,768 789,880 2021-04-01Export-Import Bank of Korea 5.12% 0.01 812,619 789,880 2020-06-29Moodys Corp 4.5% 0.01 812,484 789,880 2022-09-01Wells Fargo & Company 4.6% 0.01 812,284 789,880 2021-04-01................................................................................................................................................................................................................................................................................................Aflac Incorporated 3.62% 0.01 811,366 809,627 2023-06-15Thermo Fisher Scientific Inc 4.5% 0.01 810,932 789,880 2021-03-01Corporacion Andina de Fomento 4.38% 0.01 810,448 789,880 2022-06-15Republic of Panama 5.2% 0.01 810,424 789,880 2020-01-30HSBC Bank USA, N.A. 4.88% 0.01 810,136 789,880 2020-08-24................................................................................................................................................................................................................................................................................................WELLTOWER INC 4.95% 0.01 810,079 789,880 2021-01-15JPMorgan Chase & Co. 4.35% 0.01 809,972 789,880 2021-08-15Kinder Morgan, Inc. 6.5% 0.01 809,830 766,183 2020-09-15Republic Services, Inc. 5% 0.01 809,788 789,880 2020-03-01MetLife Inc. 4.88% 0.01 809,586 769,893 2043-11-13GNMA PASS-THRU M SINGLE FAMILY 4% 0.01 809,537 789,782 2044-08-20America Movil S.A.B. de C.V. 5% 0.01 808,995 789,880 2020-03-30WPP Finance 2010 4.75% 0.01 808,945 789,880 2021-11-21The Dow Chemical Company 4.12% 0.01 808,657 789,880 2021-11-15Federal Home Loan Mortgage Corporation 3.5% 0.01 808,241 805,013 2034-01-01................................................................................................................................................................................................................................................................................................European Investment Bank 4% 0.01 808,202 789,880 2021-02-16American Express Credit Corporation 2.7% 0.01 808,083 829,374 2022-03-03Southern Natural Gas Company 4.4% 0.01 807,829 789,880 2021-06-15Lowes Companies, Inc. 4.65% 0.01 806,921 775,667 2042-04-15EOG Resources, Inc. 2.62% 0.01 806,825 837,272 2023-03-15................................................................................................................................................................................................................................................................................................Goldman Sachs Group, Inc. 5.75% 0.01 806,748 758,284 2022-01-24JPMorgan Chase & Co. 4.4% 0.01 806,530 789,880 2020-07-22Cardinal Health, Inc. 4.62% 0.01 806,526 789,880 2020-12-15Exelon Generation Company, LLC 5.2% 0.01 806,439 789,880 2019-10-01Medtronic, Inc. 4.12% 0.01 806,431 789,880 2021-03-15................................................................................................................................................................................................................................................................................................
©2018 Morningstar, Inc., Morningstar Investment Profiles™ 312-696-6000. All rights reserved. The information contained herein: (1) is proprietary to Morningstar and/or its content providers; (2) maynot be copied or distributed and (3) is not warranted to be accurate, complete or timely. Neither Morningstar nor its content providers are responsible for any damages or losses arising from any use ofinformation. Past performance is no guarantee of future performance. Visit our investment website at www.morningstar.com ß
®
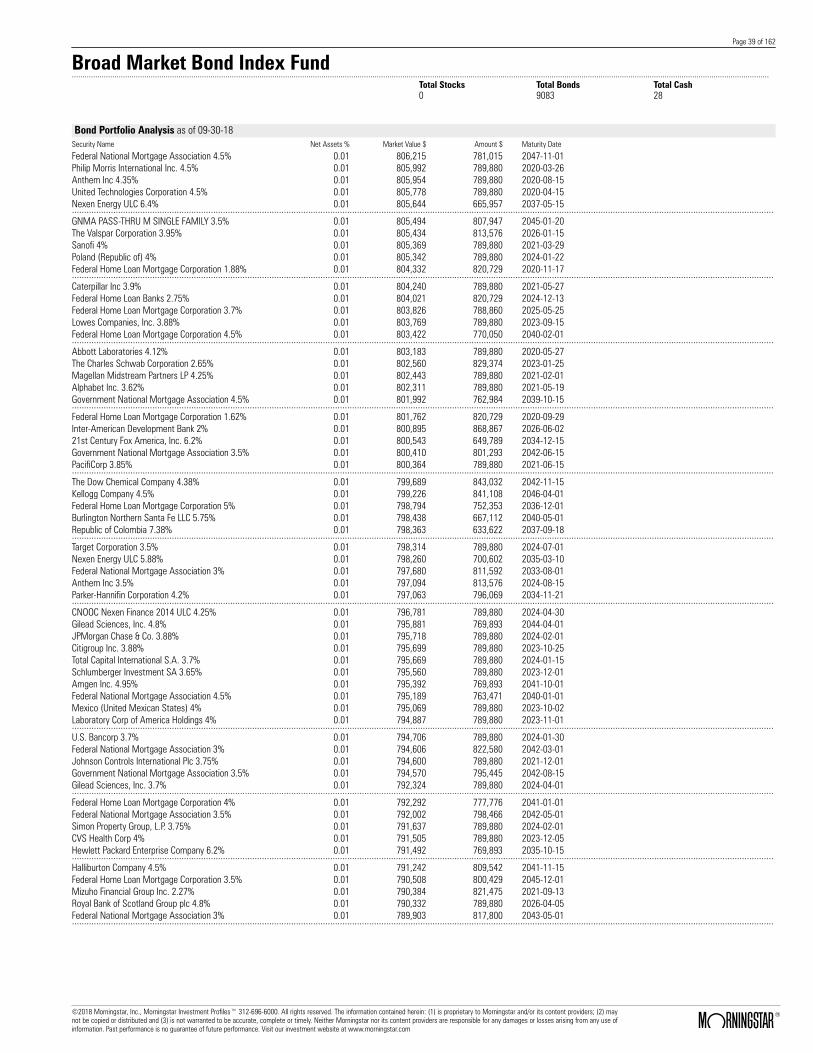
Page 39 of 162
Broad Market Bond Index Fund.......................................................................................................................................................................................................................................................................................................................................
Total Stocks Total Bonds Total Cash0 9083 28
Bond Portfolio Analysis as of 09-30-18Security Name Net Assets % Market Value $ Amount $ Maturity Date
Federal National Mortgage Association 4.5% 0.01 806,215 781,015 2047-11-01Philip Morris International Inc. 4.5% 0.01 805,992 789,880 2020-03-26Anthem Inc 4.35% 0.01 805,954 789,880 2020-08-15United Technologies Corporation 4.5% 0.01 805,778 789,880 2020-04-15Nexen Energy ULC 6.4% 0.01 805,644 665,957 2037-05-15................................................................................................................................................................................................................................................................................................GNMA PASS-THRU M SINGLE FAMILY 3.5% 0.01 805,494 807,947 2045-01-20The Valspar Corporation 3.95% 0.01 805,434 813,576 2026-01-15Sanofi 4% 0.01 805,369 789,880 2021-03-29Poland (Republic of) 4% 0.01 805,342 789,880 2024-01-22Federal Home Loan Mortgage Corporation 1.88% 0.01 804,332 820,729 2020-11-17................................................................................................................................................................................................................................................................................................Caterpillar Inc 3.9% 0.01 804,240 789,880 2021-05-27Federal Home Loan Banks 2.75% 0.01 804,021 820,729 2024-12-13Federal Home Loan Mortgage Corporation 3.7% 0.01 803,826 788,860 2025-05-25Lowes Companies, Inc. 3.88% 0.01 803,769 789,880 2023-09-15Federal Home Loan Mortgage Corporation 4.5% 0.01 803,422 770,050 2040-02-01................................................................................................................................................................................................................................................................................................Abbott Laboratories 4.12% 0.01 803,183 789,880 2020-05-27The Charles Schwab Corporation 2.65% 0.01 802,560 829,374 2023-01-25Magellan Midstream Partners LP 4.25% 0.01 802,443 789,880 2021-02-01Alphabet Inc. 3.62% 0.01 802,311 789,880 2021-05-19Government National Mortgage Association 4.5% 0.01 801,992 762,984 2039-10-15................................................................................................................................................................................................................................................................................................Federal Home Loan Mortgage Corporation 1.62% 0.01 801,762 820,729 2020-09-29Inter-American Development Bank 2% 0.01 800,895 868,867 2026-06-0221st Century Fox America, Inc. 6.2% 0.01 800,543 649,789 2034-12-15Government National Mortgage Association 3.5% 0.01 800,410 801,293 2042-06-15PacifiCorp 3.85% 0.01 800,364 789,880 2021-06-15................................................................................................................................................................................................................................................................................................The Dow Chemical Company 4.38% 0.01 799,689 843,032 2042-11-15Kellogg Company 4.5% 0.01 799,226 841,108 2046-04-01Federal Home Loan Mortgage Corporation 5% 0.01 798,794 752,353 2036-12-01Burlington Northern Santa Fe LLC 5.75% 0.01 798,438 667,112 2040-05-01Republic of Colombia 7.38% 0.01 798,363 633,622 2037-09-18................................................................................................................................................................................................................................................................................................Target Corporation 3.5% 0.01 798,314 789,880 2024-07-01Nexen Energy ULC 5.88% 0.01 798,260 700,602 2035-03-10Federal National Mortgage Association 3% 0.01 797,680 811,592 2033-08-01Anthem Inc 3.5% 0.01 797,094 813,576 2024-08-15Parker-Hannifin Corporation 4.2% 0.01 797,063 796,069 2034-11-21................................................................................................................................................................................................................................................................................................CNOOC Nexen Finance 2014 ULC 4.25% 0.01 796,781 789,880 2024-04-30Gilead Sciences, Inc. 4.8% 0.01 795,881 769,893 2044-04-01JPMorgan Chase & Co. 3.88% 0.01 795,718 789,880 2024-02-01Citigroup Inc. 3.88% 0.01 795,699 789,880 2023-10-25Total Capital International S.A. 3.7% 0.01 795,669 789,880 2024-01-15Schlumberger Investment SA 3.65% 0.01 795,560 789,880 2023-12-01Amgen Inc. 4.95% 0.01 795,392 769,893 2041-10-01Federal National Mortgage Association 4.5% 0.01 795,189 763,471 2040-01-01Mexico (United Mexican States) 4% 0.01 795,069 789,880 2023-10-02Laboratory Corp of America Holdings 4% 0.01 794,887 789,880 2023-11-01................................................................................................................................................................................................................................................................................................U.S. Bancorp 3.7% 0.01 794,706 789,880 2024-01-30Federal National Mortgage Association 3% 0.01 794,606 822,580 2042-03-01Johnson Controls International Plc 3.75% 0.01 794,600 789,880 2021-12-01Government National Mortgage Association 3.5% 0.01 794,570 795,445 2042-08-15Gilead Sciences, Inc. 3.7% 0.01 792,324 789,880 2024-04-01................................................................................................................................................................................................................................................................................................Federal Home Loan Mortgage Corporation 4% 0.01 792,292 777,776 2041-01-01Federal National Mortgage Association 3.5% 0.01 792,002 798,466 2042-05-01Simon Property Group, L.P. 3.75% 0.01 791,637 789,880 2024-02-01CVS Health Corp 4% 0.01 791,505 789,880 2023-12-05Hewlett Packard Enterprise Company 6.2% 0.01 791,492 769,893 2035-10-15................................................................................................................................................................................................................................................................................................Halliburton Company 4.5% 0.01 791,242 809,542 2041-11-15Federal Home Loan Mortgage Corporation 3.5% 0.01 790,508 800,429 2045-12-01Mizuho Financial Group Inc. 2.27% 0.01 790,384 821,475 2021-09-13Royal Bank of Scotland Group plc 4.8% 0.01 790,332 789,880 2026-04-05Federal National Mortgage Association 3% 0.01 789,903 817,800 2043-05-01................................................................................................................................................................................................................................................................................................
©2018 Morningstar, Inc., Morningstar Investment Profiles™ 312-696-6000. All rights reserved. The information contained herein: (1) is proprietary to Morningstar and/or its content providers; (2) maynot be copied or distributed and (3) is not warranted to be accurate, complete or timely. Neither Morningstar nor its content providers are responsible for any damages or losses arising from any use ofinformation. Past performance is no guarantee of future performance. Visit our investment website at www.morningstar.com ß
®

Page 40 of 162
Broad Market Bond Index Fund.......................................................................................................................................................................................................................................................................................................................................
Total Stocks Total Bonds Total Cash0 9083 28
Bond Portfolio Analysis as of 09-30-18Security Name Net Assets % Market Value $ Amount $ Maturity Date
Midamerican Energy Company 3.5% 0.01 788,703 789,880 2024-10-15WALMART INC 3.3% 0.01 788,692 789,880 2024-04-22Federal National Mortgage Association 2.5% 0.01 788,431 810,961 2028-07-01Pepsico Capital Resources, Inc. 3% 0.01 788,162 789,880 2021-08-25Federal National Mortgage Association 3% 0.01 788,114 816,655 2043-08-01................................................................................................................................................................................................................................................................................................Johnson & Johnson 5.95% 0.01 788,074 627,463 2037-08-15Federal Home Loan Mortgage Corporation 4% 0.01 788,036 773,600 2041-01-01Agilent Technologies Inc. 3.88% 0.01 787,830 789,880 2023-07-15Mead Johnson Nutrition Company 3% 0.01 787,114 789,880 2020-11-15Federal Home Loan Mortgage Corporation 4% 0.01 786,910 767,740 2034-01-01................................................................................................................................................................................................................................................................................................Government National Mortgage Association 3.5% 0.01 785,840 789,882 2044-10-20Boston Scientific Corporation 3.85% 0.01 785,766 789,880 2025-05-15HSBC Holdings plc 4.25% 0.01 785,687 789,880 2024-03-14Citibank Credit Card Issuance Trust 2.88% 0.01 785,115 789,221 2023-01-23Boston Properties, Inc. 3.8% 0.01 785,015 789,880 2024-02-01................................................................................................................................................................................................................................................................................................APTIV PLC 4.25% 0.01 784,940 789,880 2026-01-15Medtronic, Inc. 2.5% 0.01 784,619 789,880 2020-03-15Federal Home Loan Mortgage Corporation 3.5% 0.01 784,586 790,959 2042-06-01United Technologies Corporation 4.12% 0.01 784,485 789,880 2028-11-16Medtronic, Inc. 3.12% 0.01 784,474 789,880 2022-03-15................................................................................................................................................................................................................................................................................................Citizens Bank, National Association 2.45% 0.01 784,473 789,880 2019-12-04PPL Electric Utilities Corporation 3% 0.01 784,447 789,880 2021-09-15Government National Mortgage Association 4% 0.01 784,201 764,126 2040-10-20BB&T Corporation 2.45% 0.01 783,916 789,880 2020-01-15Automatic Data Processing, Inc. 3.38% 0.01 783,697 789,880 2025-09-15................................................................................................................................................................................................................................................................................................Government National Mortgage Association 4% 0.01 783,652 765,846 2044-08-15Loews Corporation 3.75% 0.01 783,341 789,880 2026-04-01HSBC USA, Inc. 2.75% 0.01 783,334 789,880 2020-08-07The Kroger Co. 3.4% 0.01 783,233 789,880 2022-04-15Lloyds Bank plc 2.7% 0.01 782,551 789,880 2020-08-17................................................................................................................................................................................................................................................................................................Ingersoll-Rand Luxembourg Finance S.A. 2.62% 0.01 782,283 789,880 2020-05-01Federal National Mortgage Association 6% 0.01 782,231 710,589 2039-02-01FLORIDA ST BRD ADMIN FIN CORP 2.64% 0.01 782,012 789,880 2021-07-01Gilead Sciences, Inc. 2.55% 0.01 781,940 789,880 2020-09-01Royal Bank of Canada 2.12% 0.01 781,603 789,880 2020-03-02Lockheed Martin Corporation 3.1% 0.01 781,480 789,880 2023-01-15Uruguay (Republic of) 4.12% 0.01 781,398 841,108 2045-11-20Israel (State Of) 4.5% 0.01 781,226 769,893 2043-01-30HSBC USA, Inc. 2.35% 0.01 781,222 789,880 2020-03-05Devon Energy Corporation 5% 0.01 781,131 792,989 2045-06-15................................................................................................................................................................................................................................................................................................Ford Motor Credit Company LLC 4.38% 0.01 780,917 789,880 2023-08-06Bank of America Corporation 3.55% 0.01 780,811 789,880 2024-03-05European Bank For Reconstruction & Development1.75%
0.01 780,444 789,880 2019-11-26
Royal Bank of Canada 2.15% 0.01 780,395 789,880 2020-03-06Federal National Mortgage Association 4.5% 0.01 780,257 749,785 2040-09-01................................................................................................................................................................................................................................................................................................Plains All American Pipeline L.P./PAA Finance Corp.3.65%
0.01 780,219 789,880 2022-06-01
QVC, Inc. 4.38% 0.01 780,188 789,880 2023-03-15BRANCH BANKING & TRUST CO 3.8% 0.01 780,094 789,880 2026-10-30Santander UK PLC 2.38% 0.01 779,998 789,880 2020-03-16GNMA PASS-THRU M SINGLE FAMILY 4% 0.01 779,959 760,914 2045-02-20................................................................................................................................................................................................................................................................................................BNP Paribas 2.38% 0.01 779,833 789,880 2020-05-21KeyBank National Association 2.25% 0.01 779,713 789,880 2020-03-16BPCE SA 2.25% 0.01 779,538 789,880 2020-01-27Johnson Controls International Plc 3.62% 0.01 779,480 789,880 2024-07-02Goldman Sachs Group, Inc. 2.88% 0.01 779,338 789,880 2021-02-25................................................................................................................................................................................................................................................................................................
©2018 Morningstar, Inc., Morningstar Investment Profiles™ 312-696-6000. All rights reserved. The information contained herein: (1) is proprietary to Morningstar and/or its content providers; (2) maynot be copied or distributed and (3) is not warranted to be accurate, complete or timely. Neither Morningstar nor its content providers are responsible for any damages or losses arising from any use ofinformation. Past performance is no guarantee of future performance. Visit our investment website at www.morningstar.com ß
®
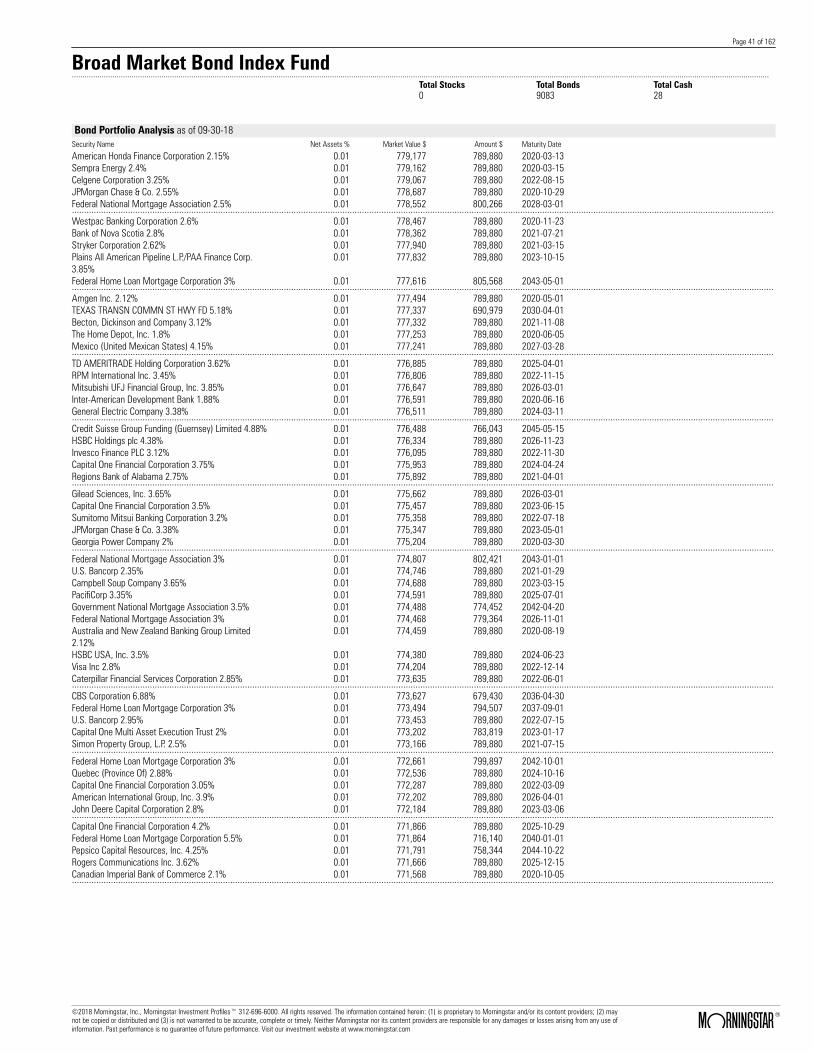
Page 41 of 162
Broad Market Bond Index Fund.......................................................................................................................................................................................................................................................................................................................................
Total Stocks Total Bonds Total Cash0 9083 28
Bond Portfolio Analysis as of 09-30-18Security Name Net Assets % Market Value $ Amount $ Maturity Date
American Honda Finance Corporation 2.15% 0.01 779,177 789,880 2020-03-13Sempra Energy 2.4% 0.01 779,162 789,880 2020-03-15Celgene Corporation 3.25% 0.01 779,067 789,880 2022-08-15JPMorgan Chase & Co. 2.55% 0.01 778,687 789,880 2020-10-29Federal National Mortgage Association 2.5% 0.01 778,552 800,266 2028-03-01................................................................................................................................................................................................................................................................................................Westpac Banking Corporation 2.6% 0.01 778,467 789,880 2020-11-23Bank of Nova Scotia 2.8% 0.01 778,362 789,880 2021-07-21Stryker Corporation 2.62% 0.01 777,940 789,880 2021-03-15Plains All American Pipeline L.P./PAA Finance Corp.3.85%
0.01 777,832 789,880 2023-10-15
Federal Home Loan Mortgage Corporation 3% 0.01 777,616 805,568 2043-05-01................................................................................................................................................................................................................................................................................................Amgen Inc. 2.12% 0.01 777,494 789,880 2020-05-01TEXAS TRANSN COMMN ST HWY FD 5.18% 0.01 777,337 690,979 2030-04-01Becton, Dickinson and Company 3.12% 0.01 777,332 789,880 2021-11-08The Home Depot, Inc. 1.8% 0.01 777,253 789,880 2020-06-05Mexico (United Mexican States) 4.15% 0.01 777,241 789,880 2027-03-28................................................................................................................................................................................................................................................................................................TD AMERITRADE Holding Corporation 3.62% 0.01 776,885 789,880 2025-04-01RPM International Inc. 3.45% 0.01 776,806 789,880 2022-11-15Mitsubishi UFJ Financial Group, Inc. 3.85% 0.01 776,647 789,880 2026-03-01Inter-American Development Bank 1.88% 0.01 776,591 789,880 2020-06-16General Electric Company 3.38% 0.01 776,511 789,880 2024-03-11................................................................................................................................................................................................................................................................................................Credit Suisse Group Funding (Guernsey) Limited 4.88% 0.01 776,488 766,043 2045-05-15HSBC Holdings plc 4.38% 0.01 776,334 789,880 2026-11-23Invesco Finance PLC 3.12% 0.01 776,095 789,880 2022-11-30Capital One Financial Corporation 3.75% 0.01 775,953 789,880 2024-04-24Regions Bank of Alabama 2.75% 0.01 775,892 789,880 2021-04-01................................................................................................................................................................................................................................................................................................Gilead Sciences, Inc. 3.65% 0.01 775,662 789,880 2026-03-01Capital One Financial Corporation 3.5% 0.01 775,457 789,880 2023-06-15Sumitomo Mitsui Banking Corporation 3.2% 0.01 775,358 789,880 2022-07-18JPMorgan Chase & Co. 3.38% 0.01 775,347 789,880 2023-05-01Georgia Power Company 2% 0.01 775,204 789,880 2020-03-30................................................................................................................................................................................................................................................................................................Federal National Mortgage Association 3% 0.01 774,807 802,421 2043-01-01U.S. Bancorp 2.35% 0.01 774,746 789,880 2021-01-29Campbell Soup Company 3.65% 0.01 774,688 789,880 2023-03-15PacifiCorp 3.35% 0.01 774,591 789,880 2025-07-01Government National Mortgage Association 3.5% 0.01 774,488 774,452 2042-04-20Federal National Mortgage Association 3% 0.01 774,468 779,364 2026-11-01Australia and New Zealand Banking Group Limited2.12%
0.01 774,459 789,880 2020-08-19
HSBC USA, Inc. 3.5% 0.01 774,380 789,880 2024-06-23Visa Inc 2.8% 0.01 774,204 789,880 2022-12-14Caterpillar Financial Services Corporation 2.85% 0.01 773,635 789,880 2022-06-01................................................................................................................................................................................................................................................................................................CBS Corporation 6.88% 0.01 773,627 679,430 2036-04-30Federal Home Loan Mortgage Corporation 3% 0.01 773,494 794,507 2037-09-01U.S. Bancorp 2.95% 0.01 773,453 789,880 2022-07-15Capital One Multi Asset Execution Trust 2% 0.01 773,202 783,819 2023-01-17Simon Property Group, L.P. 2.5% 0.01 773,166 789,880 2021-07-15................................................................................................................................................................................................................................................................................................Federal Home Loan Mortgage Corporation 3% 0.01 772,661 799,897 2042-10-01Quebec (Province Of) 2.88% 0.01 772,536 789,880 2024-10-16Capital One Financial Corporation 3.05% 0.01 772,287 789,880 2022-03-09American International Group, Inc. 3.9% 0.01 772,202 789,880 2026-04-01John Deere Capital Corporation 2.8% 0.01 772,184 789,880 2023-03-06................................................................................................................................................................................................................................................................................................Capital One Financial Corporation 4.2% 0.01 771,866 789,880 2025-10-29Federal Home Loan Mortgage Corporation 5.5% 0.01 771,864 716,140 2040-01-01Pepsico Capital Resources, Inc. 4.25% 0.01 771,791 758,344 2044-10-22Rogers Communications Inc. 3.62% 0.01 771,666 789,880 2025-12-15Canadian Imperial Bank of Commerce 2.1% 0.01 771,568 789,880 2020-10-05................................................................................................................................................................................................................................................................................................
©2018 Morningstar, Inc., Morningstar Investment Profiles™ 312-696-6000. All rights reserved. The information contained herein: (1) is proprietary to Morningstar and/or its content providers; (2) maynot be copied or distributed and (3) is not warranted to be accurate, complete or timely. Neither Morningstar nor its content providers are responsible for any damages or losses arising from any use ofinformation. Past performance is no guarantee of future performance. Visit our investment website at www.morningstar.com ß
®
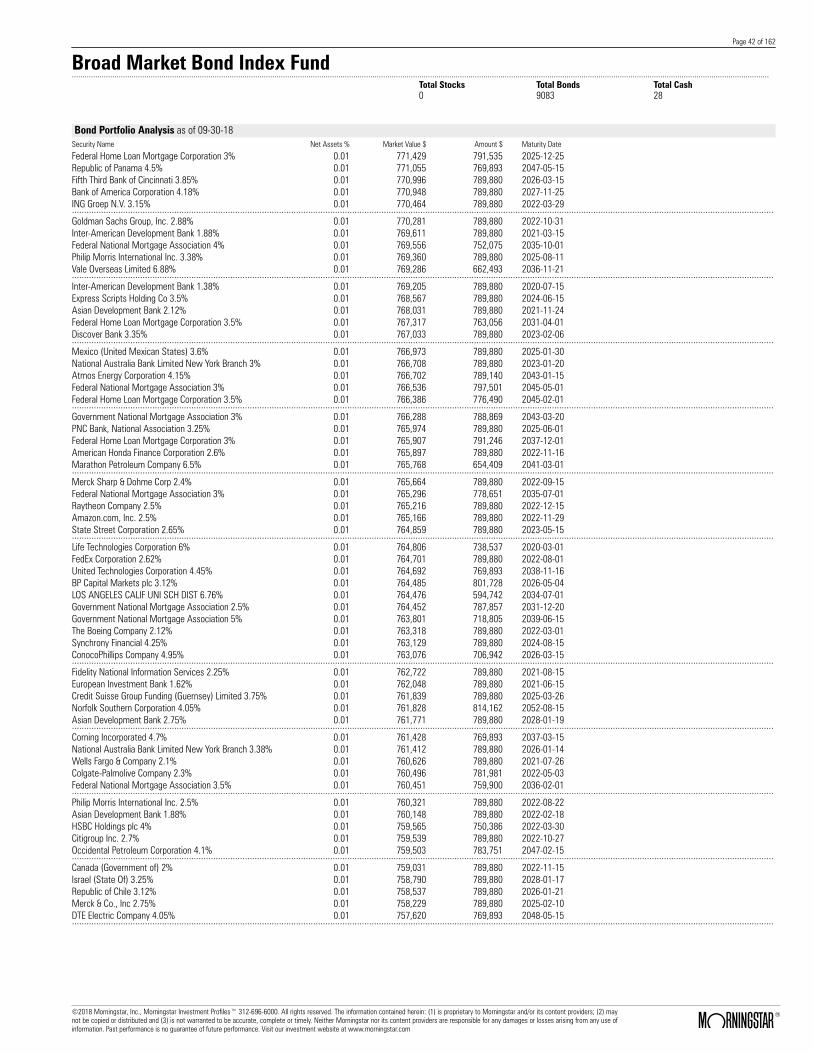
Page 42 of 162
Broad Market Bond Index Fund.......................................................................................................................................................................................................................................................................................................................................
Total Stocks Total Bonds Total Cash0 9083 28
Bond Portfolio Analysis as of 09-30-18Security Name Net Assets % Market Value $ Amount $ Maturity Date
Federal Home Loan Mortgage Corporation 3% 0.01 771,429 791,535 2025-12-25Republic of Panama 4.5% 0.01 771,055 769,893 2047-05-15Fifth Third Bank of Cincinnati 3.85% 0.01 770,996 789,880 2026-03-15Bank of America Corporation 4.18% 0.01 770,948 789,880 2027-11-25ING Groep N.V. 3.15% 0.01 770,464 789,880 2022-03-29................................................................................................................................................................................................................................................................................................Goldman Sachs Group, Inc. 2.88% 0.01 770,281 789,880 2022-10-31Inter-American Development Bank 1.88% 0.01 769,611 789,880 2021-03-15Federal National Mortgage Association 4% 0.01 769,556 752,075 2035-10-01Philip Morris International Inc. 3.38% 0.01 769,360 789,880 2025-08-11Vale Overseas Limited 6.88% 0.01 769,286 662,493 2036-11-21................................................................................................................................................................................................................................................................................................Inter-American Development Bank 1.38% 0.01 769,205 789,880 2020-07-15Express Scripts Holding Co 3.5% 0.01 768,567 789,880 2024-06-15Asian Development Bank 2.12% 0.01 768,031 789,880 2021-11-24Federal Home Loan Mortgage Corporation 3.5% 0.01 767,317 763,056 2031-04-01Discover Bank 3.35% 0.01 767,033 789,880 2023-02-06................................................................................................................................................................................................................................................................................................Mexico (United Mexican States) 3.6% 0.01 766,973 789,880 2025-01-30National Australia Bank Limited New York Branch 3% 0.01 766,708 789,880 2023-01-20Atmos Energy Corporation 4.15% 0.01 766,702 789,140 2043-01-15Federal National Mortgage Association 3% 0.01 766,536 797,501 2045-05-01Federal Home Loan Mortgage Corporation 3.5% 0.01 766,386 776,490 2045-02-01................................................................................................................................................................................................................................................................................................Government National Mortgage Association 3% 0.01 766,288 788,869 2043-03-20PNC Bank, National Association 3.25% 0.01 765,974 789,880 2025-06-01Federal Home Loan Mortgage Corporation 3% 0.01 765,907 791,246 2037-12-01American Honda Finance Corporation 2.6% 0.01 765,897 789,880 2022-11-16Marathon Petroleum Company 6.5% 0.01 765,768 654,409 2041-03-01................................................................................................................................................................................................................................................................................................Merck Sharp & Dohme Corp 2.4% 0.01 765,664 789,880 2022-09-15Federal National Mortgage Association 3% 0.01 765,296 778,651 2035-07-01Raytheon Company 2.5% 0.01 765,216 789,880 2022-12-15Amazon.com, Inc. 2.5% 0.01 765,166 789,880 2022-11-29State Street Corporation 2.65% 0.01 764,859 789,880 2023-05-15................................................................................................................................................................................................................................................................................................Life Technologies Corporation 6% 0.01 764,806 738,537 2020-03-01FedEx Corporation 2.62% 0.01 764,701 789,880 2022-08-01United Technologies Corporation 4.45% 0.01 764,692 769,893 2038-11-16BP Capital Markets plc 3.12% 0.01 764,485 801,728 2026-05-04LOS ANGELES CALIF UNI SCH DIST 6.76% 0.01 764,476 594,742 2034-07-01Government National Mortgage Association 2.5% 0.01 764,452 787,857 2031-12-20Government National Mortgage Association 5% 0.01 763,801 718,805 2039-06-15The Boeing Company 2.12% 0.01 763,318 789,880 2022-03-01Synchrony Financial 4.25% 0.01 763,129 789,880 2024-08-15ConocoPhillips Company 4.95% 0.01 763,076 706,942 2026-03-15................................................................................................................................................................................................................................................................................................Fidelity National Information Services 2.25% 0.01 762,722 789,880 2021-08-15European Investment Bank 1.62% 0.01 762,048 789,880 2021-06-15Credit Suisse Group Funding (Guernsey) Limited 3.75% 0.01 761,839 789,880 2025-03-26Norfolk Southern Corporation 4.05% 0.01 761,828 814,162 2052-08-15Asian Development Bank 2.75% 0.01 761,771 789,880 2028-01-19................................................................................................................................................................................................................................................................................................Corning Incorporated 4.7% 0.01 761,428 769,893 2037-03-15National Australia Bank Limited New York Branch 3.38% 0.01 761,412 789,880 2026-01-14Wells Fargo & Company 2.1% 0.01 760,626 789,880 2021-07-26Colgate-Palmolive Company 2.3% 0.01 760,496 781,981 2022-05-03Federal National Mortgage Association 3.5% 0.01 760,451 759,900 2036-02-01................................................................................................................................................................................................................................................................................................Philip Morris International Inc. 2.5% 0.01 760,321 789,880 2022-08-22Asian Development Bank 1.88% 0.01 760,148 789,880 2022-02-18HSBC Holdings plc 4% 0.01 759,565 750,386 2022-03-30Citigroup Inc. 2.7% 0.01 759,539 789,880 2022-10-27Occidental Petroleum Corporation 4.1% 0.01 759,503 783,751 2047-02-15................................................................................................................................................................................................................................................................................................Canada (Government of) 2% 0.01 759,031 789,880 2022-11-15Israel (State Of) 3.25% 0.01 758,790 789,880 2028-01-17Republic of Chile 3.12% 0.01 758,537 789,880 2026-01-21Merck & Co., Inc 2.75% 0.01 758,229 789,880 2025-02-10DTE Electric Company 4.05% 0.01 757,620 769,893 2048-05-15................................................................................................................................................................................................................................................................................................
©2018 Morningstar, Inc., Morningstar Investment Profiles™ 312-696-6000. All rights reserved. The information contained herein: (1) is proprietary to Morningstar and/or its content providers; (2) maynot be copied or distributed and (3) is not warranted to be accurate, complete or timely. Neither Morningstar nor its content providers are responsible for any damages or losses arising from any use ofinformation. Past performance is no guarantee of future performance. Visit our investment website at www.morningstar.com ß
®

Page 43 of 162
Broad Market Bond Index Fund.......................................................................................................................................................................................................................................................................................................................................
Total Stocks Total Bonds Total Cash0 9083 28
Bond Portfolio Analysis as of 09-30-18Security Name Net Assets % Market Value $ Amount $ Maturity Date
Simon Property Group, L.P. 6.75% 0.01 757,396 584,349 2040-02-01Baylor Scott & White Holdings 4.18% 0.01 757,361 769,893 2045-11-15Mexico (United Mexican States) 8.3% 0.01 757,323 547,009 2031-08-15Government National Mortgage Association 4% 0.01 756,906 743,901 2045-07-15JPMorgan Chase & Co. 3.3% 0.01 756,894 789,880 2026-04-01................................................................................................................................................................................................................................................................................................Bank of New York Mellon Corporation 3% 0.01 756,603 789,880 2025-02-24Chevron Corporation 2.57% 0.01 756,057 781,981 2023-05-16Kellogg Company 2.75% 0.01 755,278 789,880 2023-03-01FEDERAL HOME LN MTG CORP MULTICLASS MTGPARTN CTFS GTD 3.01%
0.01 755,177 771,770 2025-07-25
Discover Financial Services 4.1% 0.01 755,040 789,880 2027-02-09................................................................................................................................................................................................................................................................................................Georgia Power Company 4.3% 0.01 754,894 794,914 2042-03-15Bristol-Myers Squibb Company 2% 0.01 754,814 789,880 2022-08-01General Motors Financial Company Inc 4.35% 0.01 754,630 789,880 2027-01-17Province of British Columbia 2% 0.01 754,630 789,880 2022-10-23Credit Suisse (USA), Inc. 7.12% 0.01 754,184 596,667 2032-07-15................................................................................................................................................................................................................................................................................................American Tower Corporation 2.25% 0.01 753,996 789,880 2022-01-15Northern States Power Company 2.15% 0.01 753,697 789,880 2022-08-15Shire Acquisitions Investments Ireland DAC 2.88% 0.01 752,231 789,880 2023-09-23Ford Motor Credit Company LLC 4.39% 0.01 752,223 789,880 2026-01-08Inter-American Development Bank 1.75% 0.01 751,837 789,880 2022-09-14................................................................................................................................................................................................................................................................................................McCormick & Company, Incorporated 3.4% 0.01 751,747 789,880 2027-08-15Federal Home Loan Banks 4.5% 0.01 751,146 738,656 2019-09-13Andeavor 3.8% 0.01 751,115 789,880 2028-04-01LOS ANGELES CALIF DEPT WTR & PWR 5.72% 0.01 750,960 615,914 2039-07-01Federal Home Loan Mortgage Corporation 3.41% 0.01 750,488 755,664 2026-12-25................................................................................................................................................................................................................................................................................................Wisconsin Power and Light Company 2.25% 0.01 750,077 789,880 2022-11-15Xerox Corporation 3.8% 0.01 749,346 797,778 2024-05-15LOS ANGELES CALIF UNI SCH DIST 5.75% 0.01 749,018 633,237 2034-07-01Colgate-Palmolive Company 2.1% 0.01 748,978 789,880 2023-05-01Federal National Mortgage Association 3% 0.01 747,876 774,981 2043-04-01PNC Financial Services Group Inc 3.15% 0.01 747,402 789,880 2027-05-19Federal Home Loan Mortgage Corporation 3.5% 0.01 747,361 753,431 2042-02-01Dominion Energy Inc 4.05% 0.01 746,871 812,237 2042-09-15Centerpoint Energy Houston Electric LLC 3% 0.01 746,511 789,880 2027-02-01Cooperatieve Rabobank U.A. 3.75% 0.01 746,048 789,880 2026-07-21................................................................................................................................................................................................................................................................................................Digital Realty Trust, L.P. 3.62% 0.01 745,042 750,386 2022-10-01Federal Home Loan Mortgage Corporation 3% 0.01 744,679 750,202 2026-11-01Enbridge Energy Partners L.P. 5.5% 0.01 744,562 689,054 2040-09-15Quebec (Province Of) 2.5% 0.01 744,296 789,880 2026-04-20Capital One Financial Corporation 3.2% 0.01 743,253 789,880 2025-02-05................................................................................................................................................................................................................................................................................................Citigroup Inc. 3.52% 0.01 742,685 789,880 2028-10-27Discovery Communications, LLC 3.9% 0.01 742,590 758,284 2024-11-15Lockheed Martin Corporation 3.8% 0.01 742,042 792,989 2045-03-01Asian Development Bank 2.12% 0.01 742,012 789,880 2025-03-19Federal Home Loan Mortgage Corporation 3% 0.01 741,960 772,556 2045-07-01................................................................................................................................................................................................................................................................................................Ontario (Province Of) 2.5% 0.01 741,715 789,880 2026-04-27Amgen Inc. 3.2% 0.01 741,082 789,880 2027-11-02Federal Home Loan Mortgage Corporation 4.5% 0.01 741,075 711,496 2041-07-01Federal Home Loan Mortgage Corporation 3.5% 0.01 740,612 746,623 2043-07-01Abbott Laboratories 3.25% 0.01 740,513 746,436 2023-04-15................................................................................................................................................................................................................................................................................................Italy (Republic Of) 5.38% 0.01 740,109 710,226 2033-06-15Broadcom Corporation/Broadcom Cayman Finance Ltd3.88%
0.01 739,908 785,930 2027-01-15
Federal National Mortgage Association 5% 0.01 739,579 696,615 2035-07-01AvalonBay Communities, Inc. 4.15% 0.01 739,418 769,893 2047-07-01Tennessee Valley Authority 5.88% 0.01 739,156 575,825 2036-04-01................................................................................................................................................................................................................................................................................................
©2018 Morningstar, Inc., Morningstar Investment Profiles™ 312-696-6000. All rights reserved. The information contained herein: (1) is proprietary to Morningstar and/or its content providers; (2) maynot be copied or distributed and (3) is not warranted to be accurate, complete or timely. Neither Morningstar nor its content providers are responsible for any damages or losses arising from any use ofinformation. Past performance is no guarantee of future performance. Visit our investment website at www.morningstar.com ß
®
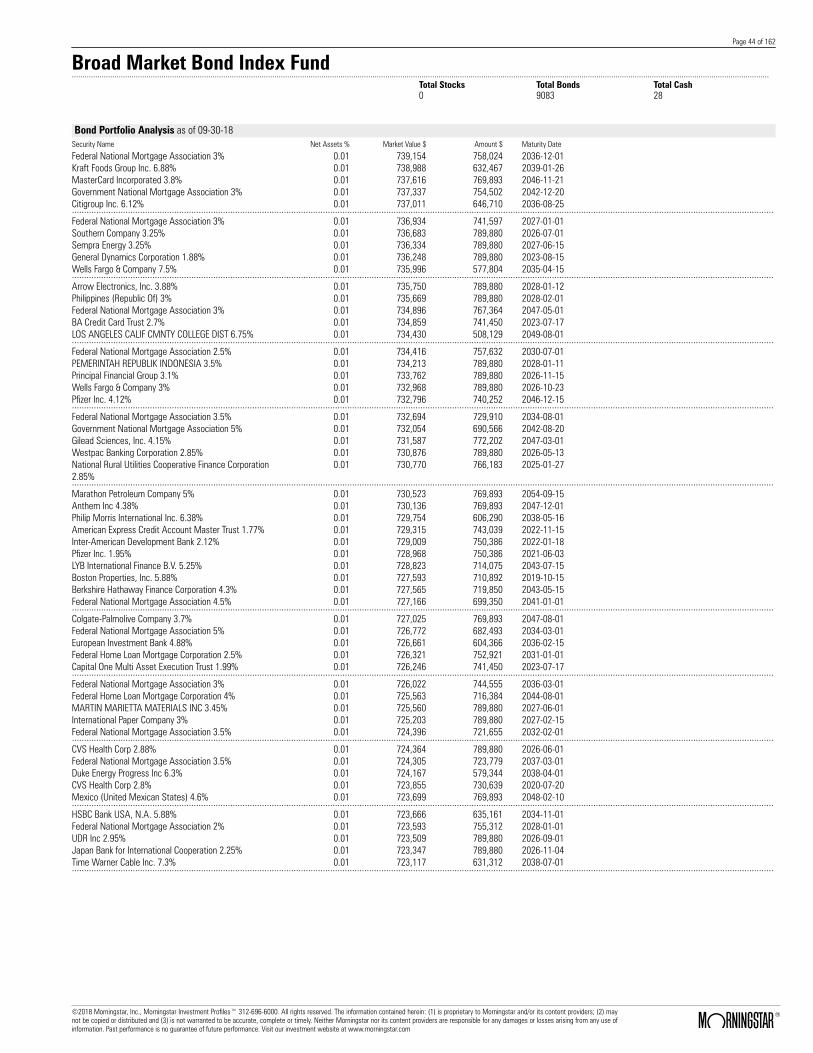
Page 44 of 162
Broad Market Bond Index Fund.......................................................................................................................................................................................................................................................................................................................................
Total Stocks Total Bonds Total Cash0 9083 28
Bond Portfolio Analysis as of 09-30-18Security Name Net Assets % Market Value $ Amount $ Maturity Date
Federal National Mortgage Association 3% 0.01 739,154 758,024 2036-12-01Kraft Foods Group Inc. 6.88% 0.01 738,988 632,467 2039-01-26MasterCard Incorporated 3.8% 0.01 737,616 769,893 2046-11-21Government National Mortgage Association 3% 0.01 737,337 754,502 2042-12-20Citigroup Inc. 6.12% 0.01 737,011 646,710 2036-08-25................................................................................................................................................................................................................................................................................................Federal National Mortgage Association 3% 0.01 736,934 741,597 2027-01-01Southern Company 3.25% 0.01 736,683 789,880 2026-07-01Sempra Energy 3.25% 0.01 736,334 789,880 2027-06-15General Dynamics Corporation 1.88% 0.01 736,248 789,880 2023-08-15Wells Fargo & Company 7.5% 0.01 735,996 577,804 2035-04-15................................................................................................................................................................................................................................................................................................Arrow Electronics, Inc. 3.88% 0.01 735,750 789,880 2028-01-12Philippines (Republic Of) 3% 0.01 735,669 789,880 2028-02-01Federal National Mortgage Association 3% 0.01 734,896 767,364 2047-05-01BA Credit Card Trust 2.7% 0.01 734,859 741,450 2023-07-17LOS ANGELES CALIF CMNTY COLLEGE DIST 6.75% 0.01 734,430 508,129 2049-08-01................................................................................................................................................................................................................................................................................................Federal National Mortgage Association 2.5% 0.01 734,416 757,632 2030-07-01PEMERINTAH REPUBLIK INDONESIA 3.5% 0.01 734,213 789,880 2028-01-11Principal Financial Group 3.1% 0.01 733,762 789,880 2026-11-15Wells Fargo & Company 3% 0.01 732,968 789,880 2026-10-23Pfizer Inc. 4.12% 0.01 732,796 740,252 2046-12-15................................................................................................................................................................................................................................................................................................Federal National Mortgage Association 3.5% 0.01 732,694 729,910 2034-08-01Government National Mortgage Association 5% 0.01 732,054 690,566 2042-08-20Gilead Sciences, Inc. 4.15% 0.01 731,587 772,202 2047-03-01Westpac Banking Corporation 2.85% 0.01 730,876 789,880 2026-05-13National Rural Utilities Cooperative Finance Corporation2.85%
0.01 730,770 766,183 2025-01-27
................................................................................................................................................................................................................................................................................................Marathon Petroleum Company 5% 0.01 730,523 769,893 2054-09-15Anthem Inc 4.38% 0.01 730,136 769,893 2047-12-01Philip Morris International Inc. 6.38% 0.01 729,754 606,290 2038-05-16American Express Credit Account Master Trust 1.77% 0.01 729,315 743,039 2022-11-15Inter-American Development Bank 2.12% 0.01 729,009 750,386 2022-01-18Pfizer Inc. 1.95% 0.01 728,968 750,386 2021-06-03LYB International Finance B.V. 5.25% 0.01 728,823 714,075 2043-07-15Boston Properties, Inc. 5.88% 0.01 727,593 710,892 2019-10-15Berkshire Hathaway Finance Corporation 4.3% 0.01 727,565 719,850 2043-05-15Federal National Mortgage Association 4.5% 0.01 727,166 699,350 2041-01-01................................................................................................................................................................................................................................................................................................Colgate-Palmolive Company 3.7% 0.01 727,025 769,893 2047-08-01Federal National Mortgage Association 5% 0.01 726,772 682,493 2034-03-01European Investment Bank 4.88% 0.01 726,661 604,366 2036-02-15Federal Home Loan Mortgage Corporation 2.5% 0.01 726,321 752,921 2031-01-01Capital One Multi Asset Execution Trust 1.99% 0.01 726,246 741,450 2023-07-17................................................................................................................................................................................................................................................................................................Federal National Mortgage Association 3% 0.01 726,022 744,555 2036-03-01Federal Home Loan Mortgage Corporation 4% 0.01 725,563 716,384 2044-08-01MARTIN MARIETTA MATERIALS INC 3.45% 0.01 725,560 789,880 2027-06-01International Paper Company 3% 0.01 725,203 789,880 2027-02-15Federal National Mortgage Association 3.5% 0.01 724,396 721,655 2032-02-01................................................................................................................................................................................................................................................................................................CVS Health Corp 2.88% 0.01 724,364 789,880 2026-06-01Federal National Mortgage Association 3.5% 0.01 724,305 723,779 2037-03-01Duke Energy Progress Inc 6.3% 0.01 724,167 579,344 2038-04-01CVS Health Corp 2.8% 0.01 723,855 730,639 2020-07-20Mexico (United Mexican States) 4.6% 0.01 723,699 769,893 2048-02-10................................................................................................................................................................................................................................................................................................HSBC Bank USA, N.A. 5.88% 0.01 723,666 635,161 2034-11-01Federal National Mortgage Association 2% 0.01 723,593 755,312 2028-01-01UDR Inc 2.95% 0.01 723,509 789,880 2026-09-01Japan Bank for International Cooperation 2.25% 0.01 723,347 789,880 2026-11-04Time Warner Cable Inc. 7.3% 0.01 723,117 631,312 2038-07-01................................................................................................................................................................................................................................................................................................
©2018 Morningstar, Inc., Morningstar Investment Profiles™ 312-696-6000. All rights reserved. The information contained herein: (1) is proprietary to Morningstar and/or its content providers; (2) maynot be copied or distributed and (3) is not warranted to be accurate, complete or timely. Neither Morningstar nor its content providers are responsible for any damages or losses arising from any use ofinformation. Past performance is no guarantee of future performance. Visit our investment website at www.morningstar.com ß
®

Page 45 of 162
Broad Market Bond Index Fund.......................................................................................................................................................................................................................................................................................................................................
Total Stocks Total Bonds Total Cash0 9083 28
Bond Portfolio Analysis as of 09-30-18Security Name Net Assets % Market Value $ Amount $ Maturity Date
Lowes Companies, Inc. 4.62% 0.01 722,843 710,892 2020-04-15Federal National Mortgage Association 4.5% 0.01 722,590 693,907 2039-04-01Government National Mortgage Association 3% 0.01 721,191 724,640 2030-07-20Westpac Banking Corporation 2.7% 0.01 721,106 789,880 2026-08-19General Motors Company 6.75% 0.01 720,835 665,957 2046-04-01................................................................................................................................................................................................................................................................................................Diageo Capital plc 2.62% 0.01 720,574 743,277 2023-04-29Mizuho Financial Group Inc. 2.84% 0.01 719,921 789,880 2026-09-13AXA Equitable Holdings Inc 5% 0.01 719,172 769,893 2048-04-20Federal National Mortgage Association 4.5% 0.01 719,136 690,473 2039-08-01Target Corporation 3.62% 0.01 719,135 792,989 2046-04-15................................................................................................................................................................................................................................................................................................Bank of New York Mellon Corporation 2.45% 0.01 718,942 789,880 2026-08-17Oracle Corporation 3.9% 0.01 718,632 742,562 2035-05-15Commonwealth Edison Company 3.65% 0.01 718,402 792,989 2046-06-15Federal National Mortgage Association 3% 0.01 717,018 742,117 2042-09-01Federal Home Loan Mortgage Corporation 4% 0.01 716,788 700,889 2037-04-01................................................................................................................................................................................................................................................................................................Centerpoint Energy Houston Electric LLC 2.4% 0.01 716,713 789,880 2026-09-01Molson Coors Brewing Company 3% 0.01 716,619 789,880 2026-07-15Southwestern Electric Power Company 6.2% 0.01 716,499 601,286 2040-03-15General Motors Company 5.15% 0.01 716,062 769,893 2038-04-01Weyerhaeuser Company 6.88% 0.01 715,906 587,043 2033-12-15................................................................................................................................................................................................................................................................................................Tyson Foods, Inc. 4.55% 0.01 715,346 769,893 2047-06-02Entergy Louisiana, LLC 3.05% 0.01 715,130 787,985 2031-06-01United Parcel Service, Inc. 3.75% 0.01 714,852 769,893 2047-11-15Duke Energy Corp 2.65% 0.01 714,169 789,880 2026-09-01Microsoft Corporation 3.95% 0.01 713,651 729,473 2056-08-08................................................................................................................................................................................................................................................................................................Deere & Company 2.6% 0.01 712,784 730,639 2022-06-08Federal National Mortgage Association 4.5% 0.01 712,713 684,880 2041-02-01Oracle Corporation 6.12% 0.01 712,562 578,574 2039-07-08Ventas Realty L.P./Ventas Capital Corp. 4.25% 0.01 712,373 699,043 2022-03-01Federal National Mortgage Association 4.5% 0.01 712,307 684,490 2041-09-01Federal Home Loan Mortgage Corporation 2.57% 0.01 712,131 728,179 2022-09-25Progress Energy, Inc. 7.75% 0.01 711,967 543,929 2031-03-01International Bank for Reconstruction and Development2%
0.01 710,649 734,588 2022-01-26
Federal National Mortgage Association 4% 0.01 710,332 698,011 2031-02-01Federal National Mortgage Association 5.5% 0.01 708,968 659,483 2039-09-01................................................................................................................................................................................................................................................................................................Public Service Electric and Gas Company 2.25% 0.01 708,563 789,880 2026-09-15Federal National Mortgage Association 3.5% 0.01 708,158 703,491 2026-01-01Oneok Partners Lp 6.85% 0.01 706,969 592,817 2037-10-15Essex Portfolio Lp 3.88% 0.01 706,893 710,892 2024-05-01Union Pacific Corporation 4.75% 0.01 706,682 673,656 2041-09-15................................................................................................................................................................................................................................................................................................Kimco Realty Corporation 4.45% 0.01 706,560 769,893 2047-09-01Baltimore Gas & Electric Company 3.75% 0.01 706,374 769,893 2047-08-15Federal National Mortgage Association 3% 0.01 706,145 731,668 2043-05-01Government National Mortgage Association 4.5% 0.01 705,938 681,164 2047-08-15GATX Corporation 2.6% 0.01 705,796 714,841 2020-03-30................................................................................................................................................................................................................................................................................................General Mills, Inc. 2.2% 0.01 705,684 710,892 2019-10-21Federal Home Loan Mortgage Corporation 5.5% 0.01 705,440 651,067 2041-06-01PEMERINTAH REPUBLIK INDONESIA 4.35% 0.01 705,100 769,893 2048-01-11Federal National Mortgage Association 3.5% 0.01 704,424 699,240 2029-09-01Federal National Mortgage Association 2.5% 0.01 704,404 735,478 2033-07-01................................................................................................................................................................................................................................................................................................Buckeye Partners LP 4.35% 0.01 704,290 718,790 2024-10-15Ecolab Inc. 5.5% 0.01 704,138 604,366 2041-12-08Alibaba Group Holding Ltd 4.2% 0.01 704,056 771,817 2047-12-06Federal National Mortgage Association 4.5% 0.01 703,868 678,395 2044-08-01JPMorgan Chase & Co. 3.96% 0.01 703,228 769,893 2048-11-15................................................................................................................................................................................................................................................................................................
©2018 Morningstar, Inc., Morningstar Investment Profiles™ 312-696-6000. All rights reserved. The information contained herein: (1) is proprietary to Morningstar and/or its content providers; (2) maynot be copied or distributed and (3) is not warranted to be accurate, complete or timely. Neither Morningstar nor its content providers are responsible for any damages or losses arising from any use ofinformation. Past performance is no guarantee of future performance. Visit our investment website at www.morningstar.com ß
®

Page 46 of 162
Broad Market Bond Index Fund.......................................................................................................................................................................................................................................................................................................................................
Total Stocks Total Bonds Total Cash0 9083 28
Bond Portfolio Analysis as of 09-30-18Security Name Net Assets % Market Value $ Amount $ Maturity Date
Toyota Motor Credit Corporation 2.75% 0.01 702,733 710,892 2021-05-17Credit Suisse AG New York Branch 3% 0.01 700,918 710,892 2021-10-29GNMA PASS-THRU M SINGLE FAMILY 3% 0.01 700,747 718,496 2044-12-20DTE Energy Company 3.5% 0.01 699,910 710,892 2024-06-01Federal Home Loan Mortgage Corporation 3% 0.01 698,416 704,559 2028-10-01................................................................................................................................................................................................................................................................................................Federal Home Loan Mortgage Corporation 2.5% 0.01 697,976 722,599 2030-10-01GS Mortgage Securities Trust 4.24% 0.01 697,607 675,395 2046-08-10AmerisourceBergen Corporation 4.3% 0.01 697,394 769,893 2047-12-15HALFMOON PARENT INC 4.38% 0.01 697,007 699,043 2028-10-15BB&T Corporation 2.75% 0.01 696,260 710,892 2022-04-01................................................................................................................................................................................................................................................................................................The Walt Disney Company 1.85% 0.01 696,144 789,880 2026-07-30Federal Home Loan Mortgage Corporation 3% 0.01 695,184 700,342 2027-01-01Federal Home Loan Mortgage Corporation 3.5% 0.01 694,475 689,706 2031-05-01AT&T Inc 5.45% 0.01 694,195 694,828 2047-03-01Celgene Corporation 5.25% 0.01 693,725 685,204 2043-08-15................................................................................................................................................................................................................................................................................................Federal Home Loan Mortgage Corporation 3.13% 0.01 693,374 694,467 2021-06-25Kraft Foods Group Inc. 6.5% 0.01 692,153 617,839 2040-02-09PacifiCorp 5.75% 0.01 691,085 581,269 2037-04-01Federal Home Loan Mortgage Corporation 3.5% 0.01 690,555 689,919 2036-08-01Novartis Capital Corporation 4.4% 0.01 690,074 675,347 2020-04-24................................................................................................................................................................................................................................................................................................Marathon Oil Corporation 2.7% 0.01 689,995 699,043 2020-06-01Huntington Bancshares Incorporated 3.15% 0.01 689,856 695,884 2021-03-14Southwestern Electric Power Company 3.85% 0.01 689,608 769,893 2048-02-01Novartis Capital Corporation 3.7% 0.01 688,930 721,774 2042-09-21MASSACHUSETTS ST SCH BLDG AUTH 5.72% 0.01 688,885 577,420 2039-08-15................................................................................................................................................................................................................................................................................................Goldman Sachs Group, Inc. 2.55% 0.01 688,023 691,145 2019-10-23Federal National Mortgage Association 3% 0.01 687,867 714,788 2045-05-01Federal Home Loan Banks 2.5% 0.01 687,507 697,619 2022-03-11Canadian Pacific Railway Company 5.95% 0.01 686,335 578,189 2037-05-15Entergy Arkansas Inc. 3.05% 0.01 685,443 702,993 2023-06-01Federal Home Loan Mortgage Corporation 5% 0.01 684,424 645,285 2034-02-01Walgreen Co. 4.4% 0.01 683,580 747,181 2042-09-15Western Gas Partners, L.P. 5.38% 0.01 681,700 659,549 2021-06-01Federal National Mortgage Association 3% 0.01 681,298 688,642 2028-09-01Federal National Mortgage Association 4% 0.01 680,179 668,536 2041-08-01................................................................................................................................................................................................................................................................................................Government National Mortgage Association 3.5% 0.01 679,877 680,626 2042-01-15Federal Home Loan Mortgage Corporation 3% 0.01 679,802 695,815 2035-05-01Phillips 66 4.65% 0.01 679,691 670,192 2034-11-15Federal Home Loan Banks 5.5% 0.01 679,246 533,911 2036-07-15Federal National Mortgage Association 4% 0.01 678,993 664,366 2037-01-01................................................................................................................................................................................................................................................................................................Abbott Laboratories 2.95% 0.01 678,694 710,892 2025-03-15Government National Mortgage Association 4% 0.01 676,804 659,472 2041-11-20Federal Home Loan Mortgage Corporation 3% 0.01 676,324 682,940 2029-11-01Novartis Capital Corporation 4.4% 0.01 675,509 633,237 2044-05-06Federal National Mortgage Association 3% 0.01 675,395 687,154 2032-11-01................................................................................................................................................................................................................................................................................................International Paper Company 4.75% 0.01 675,044 651,651 2022-02-15Federal National Mortgage Association 5.5% 0.01 674,961 624,882 2037-08-01Federal Home Loan Mortgage Corporation 5% 0.01 674,662 636,201 2037-03-01Federal Home Loan Mortgage Corporation 3% 0.01 674,460 684,491 2033-07-01Amazon.com, Inc. 2.8% 0.01 674,452 699,043 2024-08-22................................................................................................................................................................................................................................................................................................Federal National Mortgage Association 3% 0.01 673,792 694,314 2037-11-01Federal National Mortgage Association 4.5% 0.01 672,654 646,089 2040-05-01PORT AUTH N Y & N J 5.65% 0.01 672,570 558,172 2040-11-01Becton, Dickinson and Company 4.68% 0.01 671,818 681,355 2044-12-15Morgan Stanley 3.88% 0.01 671,606 683,246 2026-01-27................................................................................................................................................................................................................................................................................................Federal National Mortgage Association 3% 0.01 671,105 694,762 2042-04-01Federal Home Loan Mortgage Corporation 4% 0.01 670,526 662,249 2045-04-01Federal National Mortgage Association 2.5% 0.01 670,508 689,678 2028-08-01Federal National Mortgage Association 4% 0.01 670,383 660,150 2043-11-01Government National Mortgage Association 4% 0.01 670,100 655,172 2045-02-20................................................................................................................................................................................................................................................................................................
©2018 Morningstar, Inc., Morningstar Investment Profiles™ 312-696-6000. All rights reserved. The information contained herein: (1) is proprietary to Morningstar and/or its content providers; (2) maynot be copied or distributed and (3) is not warranted to be accurate, complete or timely. Neither Morningstar nor its content providers are responsible for any damages or losses arising from any use ofinformation. Past performance is no guarantee of future performance. Visit our investment website at www.morningstar.com ß
®
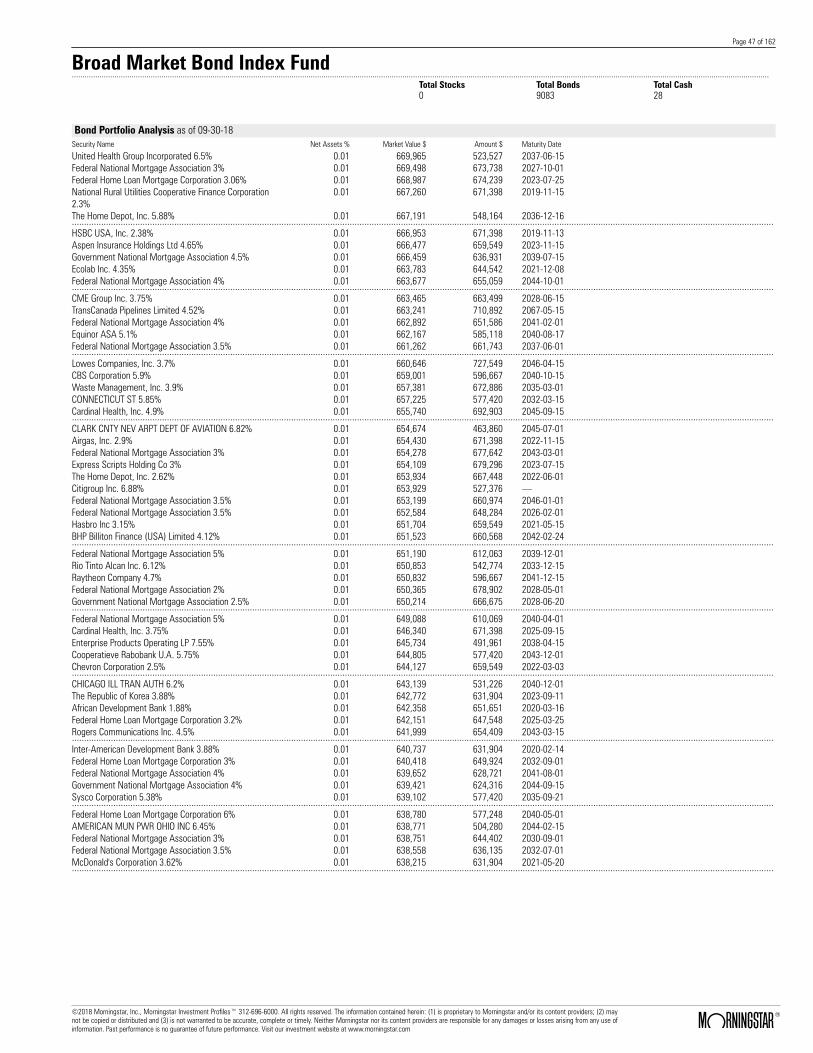
Page 47 of 162
Broad Market Bond Index Fund.......................................................................................................................................................................................................................................................................................................................................
Total Stocks Total Bonds Total Cash0 9083 28
Bond Portfolio Analysis as of 09-30-18Security Name Net Assets % Market Value $ Amount $ Maturity Date
United Health Group Incorporated 6.5% 0.01 669,965 523,527 2037-06-15Federal National Mortgage Association 3% 0.01 669,498 673,738 2027-10-01Federal Home Loan Mortgage Corporation 3.06% 0.01 668,987 674,239 2023-07-25National Rural Utilities Cooperative Finance Corporation2.3%
0.01 667,260 671,398 2019-11-15
The Home Depot, Inc. 5.88% 0.01 667,191 548,164 2036-12-16................................................................................................................................................................................................................................................................................................HSBC USA, Inc. 2.38% 0.01 666,953 671,398 2019-11-13Aspen Insurance Holdings Ltd 4.65% 0.01 666,477 659,549 2023-11-15Government National Mortgage Association 4.5% 0.01 666,459 636,931 2039-07-15Ecolab Inc. 4.35% 0.01 663,783 644,542 2021-12-08Federal National Mortgage Association 4% 0.01 663,677 655,059 2044-10-01................................................................................................................................................................................................................................................................................................CME Group Inc. 3.75% 0.01 663,465 663,499 2028-06-15TransCanada Pipelines Limited 4.52% 0.01 663,241 710,892 2067-05-15Federal National Mortgage Association 4% 0.01 662,892 651,586 2041-02-01Equinor ASA 5.1% 0.01 662,167 585,118 2040-08-17Federal National Mortgage Association 3.5% 0.01 661,262 661,743 2037-06-01................................................................................................................................................................................................................................................................................................Lowes Companies, Inc. 3.7% 0.01 660,646 727,549 2046-04-15CBS Corporation 5.9% 0.01 659,001 596,667 2040-10-15Waste Management, Inc. 3.9% 0.01 657,381 672,886 2035-03-01CONNECTICUT ST 5.85% 0.01 657,225 577,420 2032-03-15Cardinal Health, Inc. 4.9% 0.01 655,740 692,903 2045-09-15................................................................................................................................................................................................................................................................................................CLARK CNTY NEV ARPT DEPT OF AVIATION 6.82% 0.01 654,674 463,860 2045-07-01Airgas, Inc. 2.9% 0.01 654,430 671,398 2022-11-15Federal National Mortgage Association 3% 0.01 654,278 677,642 2043-03-01Express Scripts Holding Co 3% 0.01 654,109 679,296 2023-07-15The Home Depot, Inc. 2.62% 0.01 653,934 667,448 2022-06-01Citigroup Inc. 6.88% 0.01 653,929 527,376 .Federal National Mortgage Association 3.5% 0.01 653,199 660,974 2046-01-01Federal National Mortgage Association 3.5% 0.01 652,584 648,284 2026-02-01Hasbro Inc 3.15% 0.01 651,704 659,549 2021-05-15BHP Billiton Finance (USA) Limited 4.12% 0.01 651,523 660,568 2042-02-24................................................................................................................................................................................................................................................................................................Federal National Mortgage Association 5% 0.01 651,190 612,063 2039-12-01Rio Tinto Alcan Inc. 6.12% 0.01 650,853 542,774 2033-12-15Raytheon Company 4.7% 0.01 650,832 596,667 2041-12-15Federal National Mortgage Association 2% 0.01 650,365 678,902 2028-05-01Government National Mortgage Association 2.5% 0.01 650,214 666,675 2028-06-20................................................................................................................................................................................................................................................................................................Federal National Mortgage Association 5% 0.01 649,088 610,069 2040-04-01Cardinal Health, Inc. 3.75% 0.01 646,340 671,398 2025-09-15Enterprise Products Operating LP 7.55% 0.01 645,734 491,961 2038-04-15Cooperatieve Rabobank U.A. 5.75% 0.01 644,805 577,420 2043-12-01Chevron Corporation 2.5% 0.01 644,127 659,549 2022-03-03................................................................................................................................................................................................................................................................................................CHICAGO ILL TRAN AUTH 6.2% 0.01 643,139 531,226 2040-12-01The Republic of Korea 3.88% 0.01 642,772 631,904 2023-09-11African Development Bank 1.88% 0.01 642,358 651,651 2020-03-16Federal Home Loan Mortgage Corporation 3.2% 0.01 642,151 647,548 2025-03-25Rogers Communications Inc. 4.5% 0.01 641,999 654,409 2043-03-15................................................................................................................................................................................................................................................................................................Inter-American Development Bank 3.88% 0.01 640,737 631,904 2020-02-14Federal Home Loan Mortgage Corporation 3% 0.01 640,418 649,924 2032-09-01Federal National Mortgage Association 4% 0.01 639,652 628,721 2041-08-01Government National Mortgage Association 4% 0.01 639,421 624,316 2044-09-15Sysco Corporation 5.38% 0.01 639,102 577,420 2035-09-21................................................................................................................................................................................................................................................................................................Federal Home Loan Mortgage Corporation 6% 0.01 638,780 577,248 2040-05-01AMERICAN MUN PWR OHIO INC 6.45% 0.01 638,771 504,280 2044-02-15Federal National Mortgage Association 3% 0.01 638,751 644,402 2030-09-01Federal National Mortgage Association 3.5% 0.01 638,558 636,135 2032-07-01McDonald's Corporation 3.62% 0.01 638,215 631,904 2021-05-20................................................................................................................................................................................................................................................................................................
©2018 Morningstar, Inc., Morningstar Investment Profiles™ 312-696-6000. All rights reserved. The information contained herein: (1) is proprietary to Morningstar and/or its content providers; (2) maynot be copied or distributed and (3) is not warranted to be accurate, complete or timely. Neither Morningstar nor its content providers are responsible for any damages or losses arising from any use ofinformation. Past performance is no guarantee of future performance. Visit our investment website at www.morningstar.com ß
®

Page 48 of 162
Broad Market Bond Index Fund.......................................................................................................................................................................................................................................................................................................................................
Total Stocks Total Bonds Total Cash0 9083 28
Bond Portfolio Analysis as of 09-30-18Security Name Net Assets % Market Value $ Amount $ Maturity Date
Federal National Mortgage Association 2.5% 0.01 638,186 656,441 2028-08-01Federal Home Loan Mortgage Corporation 3% 0.01 638,002 654,289 2037-02-01Wells Fargo & Company 5.61% 0.01 637,834 577,420 2044-01-15United Technologies Corporation 5.4% 0.01 636,904 583,194 2035-05-01CALIFORNIA ST 7.7% 0.01 636,843 585,118 2030-11-01................................................................................................................................................................................................................................................................................................The Chubb Corporation 6.5% 0.01 636,604 498,506 2038-05-15Federal National Mortgage Association 3.5% 0.01 636,516 644,228 2046-02-01American Tower Corporation 3.38% 0.01 636,347 683,246 2026-10-15Keurig Dr Pepper Inc 3.13% 0.01 636,164 667,448 2023-12-15Southwest Gas Holdings Inc 3.8% 0.01 636,052 709,071 2046-09-29................................................................................................................................................................................................................................................................................................NORTH TEX TWY AUTH 6.72% 0.01 635,706 452,312 2049-01-01EnCana Corporation 6.62% 0.01 634,656 537,000 2037-08-15UNIVERSITY CALIF 5.77% 0.01 634,290 523,527 2043-05-15Federal Home Loan Mortgage Corporation 3% 0.01 633,790 649,959 2035-12-01PSEG Power LLC 3% 0.01 633,774 643,752 2021-06-15................................................................................................................................................................................................................................................................................................Federal Home Loan Mortgage Corporation 3% 0.01 633,734 656,552 2043-09-01Chubb INA Holdings Inc 3.15% 0.01 633,624 655,600 2025-03-15McDonald's Corporation 6.3% 0.01 633,615 525,067 2037-10-15Federal Home Loan Mortgage Corporation 2.5% 0.01 630,854 664,426 2036-11-01Federal National Mortgage Association 3.5% 0.01 628,955 634,071 2041-12-01................................................................................................................................................................................................................................................................................................Morgan Stanley 2.65% 0.01 627,854 631,904 2020-01-27Wells Fargo Bank, National Association 5.95% 0.01 627,676 538,925 2036-08-26McDonald's Corporation 3.7% 0.01 627,220 717,155 2042-02-15United Health Group Incorporated 4.7% 0.01 626,635 608,207 2021-02-15Federal Home Loan Mortgage Corporation 3% 0.01 626,563 648,416 2042-08-01Arch Capital Group Inc. 5.14% 0.01 626,540 591,278 2043-11-01The Chubb Corporation 6% 0.01 626,534 517,753 2037-05-11Retail Opportunity Investments Partnership LP 4% 0.01 626,486 667,448 2024-12-15America Movil S.A.B. de C.V. 6.38% 0.01 625,556 527,376 2035-03-01Juniper Networks 4.6% 0.01 625,237 612,157 2021-03-15................................................................................................................................................................................................................................................................................................Exelon Generation Company, LLC 5.75% 0.01 625,104 613,989 2041-10-01Fifth Third Bancorp 8.25% 0.01 624,719 458,086 2038-03-01Federal National Mortgage Association 4% 0.01 624,657 613,236 2037-06-01Barrick North America Finance LLC 5.7% 0.01 623,647 576,650 2041-05-30Commonwealth Edison Company 5.9% 0.01 623,505 523,527 2036-03-15................................................................................................................................................................................................................................................................................................The Dow Chemical Company 4.25% 0.01 623,354 612,157 2020-11-15Duke Energy Corp 1.8% 0.01 623,256 651,651 2021-09-01Province of British Columbia 2.65% 0.01 623,238 631,904 2021-09-22Federal Home Loan Mortgage Corporation 3% 0.01 623,086 645,441 2043-02-01Autozone, Inc. 3.7% 0.01 622,538 620,055 2022-04-15................................................................................................................................................................................................................................................................................................Care Capital Properties, LP 5.12% 0.01 622,476 635,853 2026-08-15Federal Home Loan Mortgage Corporation 4.5% 0.01 620,532 600,821 2047-04-01Federal Home Loan Mortgage Corporation 2.74% 0.01 620,324 647,667 2026-01-25Waste Management, Inc. 3.15% 0.01 620,253 651,651 2027-11-15Baidu, Inc. 3.5% 0.01 620,107 631,904 2022-11-28................................................................................................................................................................................................................................................................................................Government National Mortgage Association 4.5% 0.01 619,381 593,606 2039-05-15Government National Mortgage Association 4.5% 0.01 618,029 588,163 2040-05-15Colgate-Palmolive Company 2.25% 0.01 617,830 639,802 2022-11-15Federal Home Loan Mortgage Corporation 2.37% 0.01 617,802 633,785 2022-05-25Federal National Mortgage Association 4% 0.01 617,355 604,328 2029-07-01................................................................................................................................................................................................................................................................................................Federal National Mortgage Association 4% 0.01 617,201 609,562 2046-02-01Norfolk Southern Corporation 4.84% 0.01 616,973 586,273 2041-10-01Praxair, Inc. 3.55% 0.01 616,136 668,267 2042-11-07Federal National Mortgage Association 4.5% 0.01 616,031 592,274 2044-03-01Federal Home Loan Mortgage Corporation 3% 0.01 615,736 620,289 2027-12-01................................................................................................................................................................................................................................................................................................FedEx Corporation 4.1% 0.01 615,699 673,656 2043-04-15Sunoco Logistics Partners Operations L.P. 5.35% 0.01 615,553 631,312 2045-05-15Petroleos Mexicanos 5.5% 0.01 615,389 596,359 2021-01-21Federal National Mortgage Association 4% 0.01 615,215 606,629 2043-10-01Federal National Mortgage Association 4.5% 0.01 613,808 589,323 2039-07-01................................................................................................................................................................................................................................................................................................
©2018 Morningstar, Inc., Morningstar Investment Profiles™ 312-696-6000. All rights reserved. The information contained herein: (1) is proprietary to Morningstar and/or its content providers; (2) maynot be copied or distributed and (3) is not warranted to be accurate, complete or timely. Neither Morningstar nor its content providers are responsible for any damages or losses arising from any use ofinformation. Past performance is no guarantee of future performance. Visit our investment website at www.morningstar.com ß
®
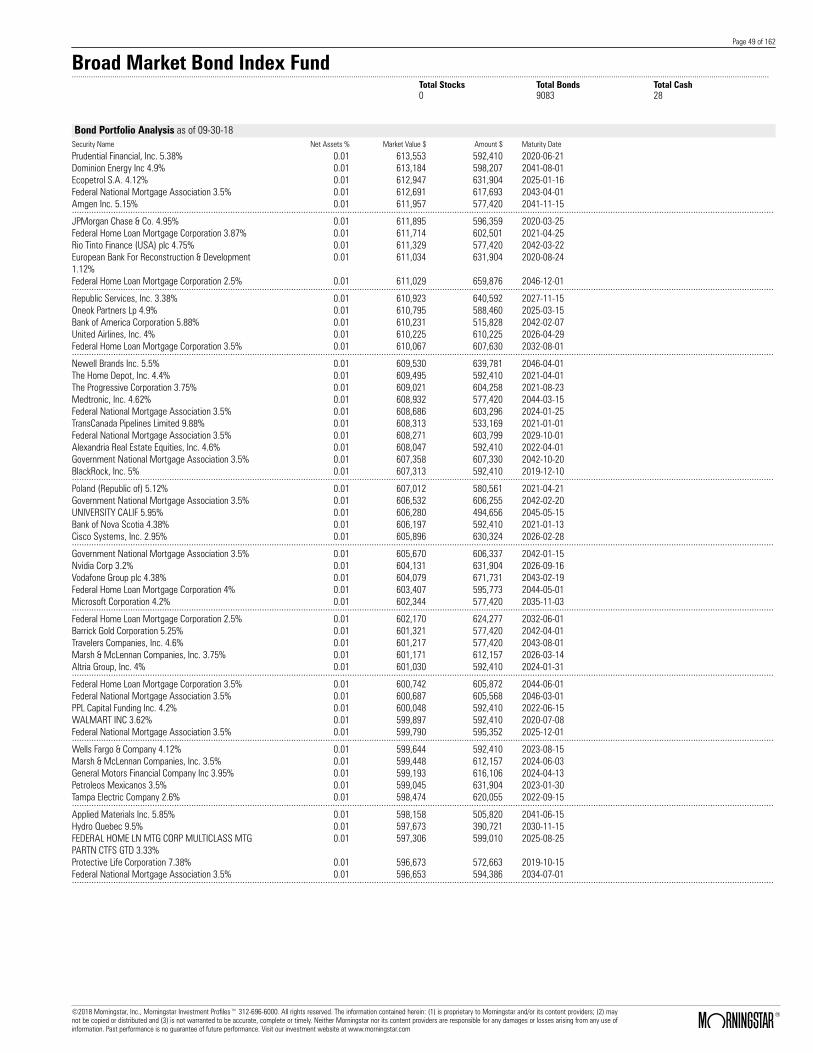
Page 49 of 162
Broad Market Bond Index Fund.......................................................................................................................................................................................................................................................................................................................................
Total Stocks Total Bonds Total Cash0 9083 28
Bond Portfolio Analysis as of 09-30-18Security Name Net Assets % Market Value $ Amount $ Maturity Date
Prudential Financial, Inc. 5.38% 0.01 613,553 592,410 2020-06-21Dominion Energy Inc 4.9% 0.01 613,184 598,207 2041-08-01Ecopetrol S.A. 4.12% 0.01 612,947 631,904 2025-01-16Federal National Mortgage Association 3.5% 0.01 612,691 617,693 2043-04-01Amgen Inc. 5.15% 0.01 611,957 577,420 2041-11-15................................................................................................................................................................................................................................................................................................JPMorgan Chase & Co. 4.95% 0.01 611,895 596,359 2020-03-25Federal Home Loan Mortgage Corporation 3.87% 0.01 611,714 602,501 2021-04-25Rio Tinto Finance (USA) plc 4.75% 0.01 611,329 577,420 2042-03-22European Bank For Reconstruction & Development1.12%
0.01 611,034 631,904 2020-08-24
Federal Home Loan Mortgage Corporation 2.5% 0.01 611,029 659,876 2046-12-01................................................................................................................................................................................................................................................................................................Republic Services, Inc. 3.38% 0.01 610,923 640,592 2027-11-15Oneok Partners Lp 4.9% 0.01 610,795 588,460 2025-03-15Bank of America Corporation 5.88% 0.01 610,231 515,828 2042-02-07United Airlines, Inc. 4% 0.01 610,225 610,225 2026-04-29Federal Home Loan Mortgage Corporation 3.5% 0.01 610,067 607,630 2032-08-01................................................................................................................................................................................................................................................................................................Newell Brands Inc. 5.5% 0.01 609,530 639,781 2046-04-01The Home Depot, Inc. 4.4% 0.01 609,495 592,410 2021-04-01The Progressive Corporation 3.75% 0.01 609,021 604,258 2021-08-23Medtronic, Inc. 4.62% 0.01 608,932 577,420 2044-03-15Federal National Mortgage Association 3.5% 0.01 608,686 603,296 2024-01-25TransCanada Pipelines Limited 9.88% 0.01 608,313 533,169 2021-01-01Federal National Mortgage Association 3.5% 0.01 608,271 603,799 2029-10-01Alexandria Real Estate Equities, Inc. 4.6% 0.01 608,047 592,410 2022-04-01Government National Mortgage Association 3.5% 0.01 607,358 607,330 2042-10-20BlackRock, Inc. 5% 0.01 607,313 592,410 2019-12-10................................................................................................................................................................................................................................................................................................Poland (Republic of) 5.12% 0.01 607,012 580,561 2021-04-21Government National Mortgage Association 3.5% 0.01 606,532 606,255 2042-02-20UNIVERSITY CALIF 5.95% 0.01 606,280 494,656 2045-05-15Bank of Nova Scotia 4.38% 0.01 606,197 592,410 2021-01-13Cisco Systems, Inc. 2.95% 0.01 605,896 630,324 2026-02-28................................................................................................................................................................................................................................................................................................Government National Mortgage Association 3.5% 0.01 605,670 606,337 2042-01-15Nvidia Corp 3.2% 0.01 604,131 631,904 2026-09-16Vodafone Group plc 4.38% 0.01 604,079 671,731 2043-02-19Federal Home Loan Mortgage Corporation 4% 0.01 603,407 595,773 2044-05-01Microsoft Corporation 4.2% 0.01 602,344 577,420 2035-11-03................................................................................................................................................................................................................................................................................................Federal Home Loan Mortgage Corporation 2.5% 0.01 602,170 624,277 2032-06-01Barrick Gold Corporation 5.25% 0.01 601,321 577,420 2042-04-01Travelers Companies, Inc. 4.6% 0.01 601,217 577,420 2043-08-01Marsh & McLennan Companies, Inc. 3.75% 0.01 601,171 612,157 2026-03-14Altria Group, Inc. 4% 0.01 601,030 592,410 2024-01-31................................................................................................................................................................................................................................................................................................Federal Home Loan Mortgage Corporation 3.5% 0.01 600,742 605,872 2044-06-01Federal National Mortgage Association 3.5% 0.01 600,687 605,568 2046-03-01PPL Capital Funding Inc. 4.2% 0.01 600,048 592,410 2022-06-15WALMART INC 3.62% 0.01 599,897 592,410 2020-07-08Federal National Mortgage Association 3.5% 0.01 599,790 595,352 2025-12-01................................................................................................................................................................................................................................................................................................Wells Fargo & Company 4.12% 0.01 599,644 592,410 2023-08-15Marsh & McLennan Companies, Inc. 3.5% 0.01 599,448 612,157 2024-06-03General Motors Financial Company Inc 3.95% 0.01 599,193 616,106 2024-04-13Petroleos Mexicanos 3.5% 0.01 599,045 631,904 2023-01-30Tampa Electric Company 2.6% 0.01 598,474 620,055 2022-09-15................................................................................................................................................................................................................................................................................................Applied Materials Inc. 5.85% 0.01 598,158 505,820 2041-06-15Hydro Quebec 9.5% 0.01 597,673 390,721 2030-11-15FEDERAL HOME LN MTG CORP MULTICLASS MTGPARTN CTFS GTD 3.33%
0.01 597,306 599,010 2025-08-25
Protective Life Corporation 7.38% 0.01 596,673 572,663 2019-10-15Federal National Mortgage Association 3.5% 0.01 596,653 594,386 2034-07-01................................................................................................................................................................................................................................................................................................
©2018 Morningstar, Inc., Morningstar Investment Profiles™ 312-696-6000. All rights reserved. The information contained herein: (1) is proprietary to Morningstar and/or its content providers; (2) maynot be copied or distributed and (3) is not warranted to be accurate, complete or timely. Neither Morningstar nor its content providers are responsible for any damages or losses arising from any use ofinformation. Past performance is no guarantee of future performance. Visit our investment website at www.morningstar.com ß
®

Page 50 of 162
Broad Market Bond Index Fund.......................................................................................................................................................................................................................................................................................................................................
Total Stocks Total Bonds Total Cash0 9083 28
Bond Portfolio Analysis as of 09-30-18Security Name Net Assets % Market Value $ Amount $ Maturity Date
Reynolds American Inc. 7.25% 0.01 595,942 482,723 2037-06-15Midamerican Energy Company 4.4% 0.01 595,461 581,269 2044-10-15San Diego Gas & Electric Company 3.6% 0.01 594,983 592,410 2023-09-01Ford Motor Company 4.35% 0.01 594,712 631,904 2026-12-08Commercial Mortgage Trust 3.76% 0.01 594,364 593,807 2049-02-10................................................................................................................................................................................................................................................................................................Equinor ASA 4.25% 0.01 594,344 587,428 2041-11-23ACTIVISION BLIZZARD INC 2.3% 0.01 594,167 612,157 2021-09-15Oglethorpe Power Corporation 5.38% 0.01 594,023 533,921 2040-11-01Federal Home Loan Mortgage Corporation 3.5% 0.01 593,836 598,659 2042-07-01Government National Mortgage Association 3% 0.01 593,320 611,248 2043-03-20................................................................................................................................................................................................................................................................................................Piedmont Operating Partnership, L.P. 4.45% 0.01 592,762 592,410 2024-03-15The Republic of Korea 4.12% 0.01 592,433 577,420 2044-06-10Marriott International, Inc. 3.38% 0.01 591,951 592,410 2020-10-15TIME WARNER INC. 5.38% 0.01 591,418 594,742 2041-10-15Autozone, Inc. 3.75% 0.01 591,195 612,157 2027-06-01................................................................................................................................................................................................................................................................................................Kinder Morgan, Inc. 5.2% 0.01 591,054 577,420 2048-03-01Cisco Systems, Inc. 2.9% 0.01 590,301 592,410 2021-03-04Microsoft Corporation 2% 0.01 589,789 624,005 2023-08-08Omnicom Group Inc. / Omnicom Capital Inc. 3.6% 0.01 588,907 620,055 2026-04-15Avnet, Inc. 4.62% 0.01 588,509 592,410 2026-04-15Shell International Finance B.V. 2.12% 0.01 588,481 596,359 2020-05-11Government National Mortgage Association 4.5% 0.01 588,268 559,891 2040-01-15Occidental Petroleum Corporation 3.5% 0.01 587,827 592,410 2025-06-15Federal Home Loan Mortgage Corporation 6% 0.01 587,526 532,015 2040-05-01HP Inc 6% 0.01 587,154 577,420 2041-09-15................................................................................................................................................................................................................................................................................................Memorial Sloan-Kettering Cancer Center 4.12% 0.01 586,718 594,742 2052-07-01JPMBB Commercial Mortgage Securities Trust 2016-C13.58%
0.01 586,674 593,807 2049-03-15
Johnson & Johnson 1.88% 0.01 586,516 592,410 2019-12-05HALFMOON PARENT INC 3.4% 0.01 586,115 588,460 2021-09-17The Coca-Cola Company 2.45% 0.01 585,971 592,410 2020-11-01................................................................................................................................................................................................................................................................................................Federal National Mortgage Association 3.5% 0.01 585,905 591,371 2043-07-01Discover Card Execution Note Trust 1.88% 0.01 585,463 598,456 2023-02-15Federal National Mortgage Association 3.5% 0.01 585,462 590,239 2041-01-01JPMorgan Chase & Co. 4.95% 0.01 585,327 558,172 2045-06-01Becton, Dickinson and Company 5% 0.01 585,162 577,035 2040-11-12................................................................................................................................................................................................................................................................................................Federal National Mortgage Association 3% 0.01 584,749 594,944 2032-08-01Dollar Tree Inc 3.7% 0.01 584,748 592,410 2023-05-15Marriott International, Inc. 3.12% 0.01 584,688 592,410 2021-10-15Federal Home Loan Mortgage Corporation 3.5% 0.01 584,132 592,884 2047-05-01John Deere Capital Corporation 1.7% 0.01 583,986 592,410 2020-01-15................................................................................................................................................................................................................................................................................................Federal National Mortgage Association 3.33% 0.01 583,939 581,243 2023-10-25Federal Home Loan Mortgage Corporation 3.5% 0.01 583,675 583,407 2037-06-01TransCanada Pipelines Limited 4.62% 0.01 583,378 581,269 2034-03-01Packaging Corporation of America 3.65% 0.01 583,070 592,410 2024-09-15Zoetis Inc. 4.7% 0.01 583,034 569,721 2043-02-01................................................................................................................................................................................................................................................................................................Union Pacific Corporation 4.8% 0.01 582,961 563,946 2058-09-10Barrick (PD) Australia Finance Pty Ltd 5.95% 0.01 582,900 531,611 2039-10-15Federal National Mortgage Association 3% 0.01 582,889 586,578 2027-04-01Laboratory Corp of America Holdings 4.7% 0.01 582,881 600,516 2045-02-01Tennessee Valley Authority 4.62% 0.01 582,758 498,982 2060-09-15................................................................................................................................................................................................................................................................................................Kreditanstalt Fur Wiederaufbau 2.38% 0.01 582,012 592,410 2021-08-25Owens Corning 4.2% 0.01 581,860 580,561 2022-12-15Federal National Mortgage Association 4.5% 0.01 581,702 558,983 2041-06-01Altria Group, Inc. 3.88% 0.01 580,819 664,032 2046-09-16General Electric Company 3.1% 0.01 580,159 592,410 2023-01-09................................................................................................................................................................................................................................................................................................
©2018 Morningstar, Inc., Morningstar Investment Profiles™ 312-696-6000. All rights reserved. The information contained herein: (1) is proprietary to Morningstar and/or its content providers; (2) maynot be copied or distributed and (3) is not warranted to be accurate, complete or timely. Neither Morningstar nor its content providers are responsible for any damages or losses arising from any use ofinformation. Past performance is no guarantee of future performance. Visit our investment website at www.morningstar.com ß
®

Page 51 of 162
Broad Market Bond Index Fund.......................................................................................................................................................................................................................................................................................................................................
Total Stocks Total Bonds Total Cash0 9083 28
Bond Portfolio Analysis as of 09-30-18Security Name Net Assets % Market Value $ Amount $ Maturity Date
Federal Home Loan Mortgage Corporation 3.5% 0.01 580,093 584,792 2042-11-01Texas Instruments Incorporated 4.15% 0.01 579,786 577,420 2048-05-15Discover Card Execution Note Trust 3.03% 0.01 578,797 585,216 2025-08-15Travelers Companies, Inc. 5.35% 0.01 578,353 506,589 2040-11-01Keurig Dr Pepper Inc 4.42% 0.01 578,138 633,622 2046-12-15................................................................................................................................................................................................................................................................................................Southern California Gas Company 3.15% 0.01 578,131 592,410 2024-09-15Apple Inc. 4.45% 0.01 577,755 552,398 2044-05-06Amazon.com, Inc. 4.25% 0.01 577,149 577,420 2057-08-22United Parcel Service, Inc. 3.62% 0.01 576,969 637,086 2042-10-01Marsh & McLennan Companies, Inc. 3.5% 0.01 576,371 592,410 2025-03-10................................................................................................................................................................................................................................................................................................Ameren Corporation 3.65% 0.01 575,785 592,410 2026-02-15Great Plains Energy Inc. 5.29% 0.01 574,469 552,916 2022-06-15Federal National Mortgage Association 3% 0.01 574,242 591,733 2037-12-01PORT AUTH N Y & N J 4.96% 0.01 573,794 513,903 2046-08-01Federal National Mortgage Association 4% 0.01 573,292 563,342 2031-03-01................................................................................................................................................................................................................................................................................................Quebec (Province Of) 2.62% 0.01 573,263 588,460 2023-02-13Simon Property Group, L.P. 2.75% 0.01 572,502 592,410 2023-02-01CVS Health Corp 2.75% 0.01 571,361 592,410 2022-12-01United Technologies Corporation 6.12% 0.01 571,271 484,263 2038-07-15Valero Energy Corporation 7.5% 0.01 571,120 448,462 2032-04-15Altria Group, Inc. 4.25% 0.01 570,732 615,144 2042-08-09Government National Mortgage Association 5% 0.01 570,688 538,560 2040-08-20Eastman Chemical Company 4.8% 0.01 570,653 577,420 2042-09-01Hess Corporation 6% 0.01 570,570 549,703 2040-01-15Federal Home Loan Mortgage Corporation 2.5% 0.01 569,671 590,580 2032-05-01................................................................................................................................................................................................................................................................................................WPP Finance 2010 3.75% 0.01 569,367 590,040 2024-09-19Republic of Chile 2.25% 0.01 568,589 592,410 2022-10-30Travelers Companies, Inc. 6.25% 0.01 568,116 456,546 2037-06-15Government National Mortgage Association 4.5% 0.01 567,980 542,284 2045-11-20Public Service Electric and Gas Company 3% 0.01 567,570 592,410 2025-05-15................................................................................................................................................................................................................................................................................................Tennessee Valley Authority 5.38% 0.01 566,895 436,609 2056-04-01Enterprise Products Operating LP 5.95% 0.01 566,495 489,267 2041-02-01Federal Home Loan Mortgage Corporation 3.97% 0.01 566,259 556,922 2021-01-25Federal National Mortgage Association 5% 0.01 565,800 531,754 2041-05-01National Fuel Gas Company 4.9% 0.01 565,230 552,916 2021-12-01................................................................................................................................................................................................................................................................................................Consumers Energy Company 2.85% 0.01 564,396 572,663 2022-05-15The Boeing Company 2.85% 0.01 563,428 584,511 2024-10-30Koninklijke KPN N.V. 8.38% 0.01 563,258 436,914 2030-10-01MetLife Inc. 3% 0.01 563,069 588,460 2025-03-01Barclays PLC 3.2% 0.01 562,163 572,663 2021-08-10................................................................................................................................................................................................................................................................................................TIME WARNER INC. 4.9% 0.01 562,133 601,286 2042-06-15Westpac Banking Corporation 2.1% 0.01 561,758 580,561 2021-05-13GlaxoSmithKline Capital Inc. 4.2% 0.01 561,321 562,022 2043-03-18The Coca-Cola Company 2.55% 0.01 561,077 608,207 2026-06-01Federal Home Loan Mortgage Corporation 3.5% 0.01 561,071 558,830 2033-09-01................................................................................................................................................................................................................................................................................................Federal Home Loan Mortgage Corporation 4.5% 0.01 560,526 537,239 2040-04-01Republic of Panama 4% 0.01 560,386 552,916 2024-09-22Eli Lilly and Company 3.7% 0.01 560,228 593,587 2045-03-01Sunoco Logistics Partners Operations L.P. 4.95% 0.01 560,031 613,220 2043-01-15John Deere Capital Corporation 3.05% 0.01 559,819 592,410 2028-01-06................................................................................................................................................................................................................................................................................................Georgia-Pacific LLC 8.88% 0.01 559,647 384,946 2031-05-15Federal Home Loan Mortgage Corporation 4.5% 0.01 559,451 541,680 2047-07-01Centerpoint Energy Houston Electric LLC 3.95% 0.01 559,080 577,420 2048-03-01Wells Fargo & Company 3.3% 0.01 558,957 576,612 2024-09-09Altria Group, Inc. 4.5% 0.01 557,747 577,420 2043-05-02................................................................................................................................................................................................................................................................................................Transatlantic Holdings Inc. 8% 0.01 557,431 408,043 2039-11-30Federal National Mortgage Association 4% 0.01 557,242 547,063 2038-02-01Government National Mortgage Association 2.5% 0.01 556,950 574,015 2032-07-20Federal National Mortgage Association 3.5% 0.01 556,491 561,033 2043-01-01Apple Inc. 4.38% 0.01 556,343 535,075 2045-05-13................................................................................................................................................................................................................................................................................................
©2018 Morningstar, Inc., Morningstar Investment Profiles™ 312-696-6000. All rights reserved. The information contained herein: (1) is proprietary to Morningstar and/or its content providers; (2) maynot be copied or distributed and (3) is not warranted to be accurate, complete or timely. Neither Morningstar nor its content providers are responsible for any damages or losses arising from any use ofinformation. Past performance is no guarantee of future performance. Visit our investment website at www.morningstar.com ß
®

Page 52 of 162
Broad Market Bond Index Fund.......................................................................................................................................................................................................................................................................................................................................
Total Stocks Total Bonds Total Cash0 9083 28
Bond Portfolio Analysis as of 09-30-18Security Name Net Assets % Market Value $ Amount $ Maturity Date
Federal Home Loan Mortgage Corporation 5% 0.01 555,541 525,116 2035-07-01MetLife Inc. 3.05% 0.01 555,484 564,764 2022-12-15American Tower Corporation 3.5% 0.01 555,461 564,764 2023-01-31AGL Capital Corporation 4.4% 0.01 554,822 577,420 2043-06-01CATHOLIC HEALTH INITIATIVES 4.35% 0.01 554,263 615,144 2042-11-01................................................................................................................................................................................................................................................................................................Rock-Tenn Company 3.5% 0.01 552,933 552,916 2020-03-01Arizona Public Service Company 4.5% 0.01 552,919 536,615 2042-04-01Johnson & Johnson 3.7% 0.01 552,728 580,884 2046-03-01Federal Home Loan Mortgage Corporation 4% 0.01 552,541 542,742 2038-01-01Telefonica Emisiones S.A.U. 4.57% 0.01 552,338 537,118 2023-04-27................................................................................................................................................................................................................................................................................................Federal Home Loan Mortgage Corporation 2.51% 0.01 552,293 566,797 2022-11-25Tennessee Gas Pipeline Company 7.62% 0.01 551,269 444,613 2037-04-01Equifax Inc. 3.3% 0.01 550,912 564,764 2022-12-15Federal National Mortgage Association 2.5% 0.01 550,673 566,041 2027-03-01Federal National Mortgage Association 3.5% 0.01 550,611 547,529 2026-12-01Oklahoma Gas and Electric Company 4.15% 0.01 550,377 577,420 2047-04-01Government National Mortgage Association 3% 0.01 550,071 552,694 2027-03-20PepsiAmericas, Inc. 5.5% 0.01 549,565 477,333 2035-05-15Boston Properties, Inc. 3.12% 0.01 549,118 564,764 2023-09-01METROPOLITAN WASH D C ARPTS AUTH 7.46% 0.01 548,510 384,946 2046-10-01................................................................................................................................................................................................................................................................................................Microsoft Corporation 3.75% 0.01 548,424 565,871 2045-02-12Illinois Tool Works Inc. 2.65% 0.01 547,854 592,410 2026-11-15Southern Company 2.75% 0.01 547,524 552,916 2020-06-15Anheuser-Busch InBev Worldwide Inc. 8% 0.01 547,346 394,570 2039-11-15Citigroup Commercial Mortgage Trust 3.86% 0.01 547,342 539,391 2047-05-10................................................................................................................................................................................................................................................................................................Norfolk Southern Corporation 3.94% 0.01 546,978 588,968 2047-11-01Eaton Corporation 4.15% 0.01 546,967 577,420 2042-11-02Federal National Mortgage Association 4% 0.01 546,697 540,174 2044-10-01Massachusetts Institute of Technology 5.6% 0.01 546,092 429,600 .Chevron Corporation 3.33% 0.01 545,469 552,916 2025-11-17................................................................................................................................................................................................................................................................................................AT&T Inc 4.5% 0.01 545,164 624,768 2048-03-09Lowes Companies, Inc. 2.5% 0.01 544,644 592,410 2026-04-15Hyatt Hotels Corporation 3.38% 0.01 543,616 556,865 2023-07-15Johnson Controls International Plc 5.7% 0.01 542,467 505,050 2041-03-01Federal Home Loan Mortgage Corporation 3% 0.01 542,441 561,627 2043-02-01................................................................................................................................................................................................................................................................................................Federal Home Loan Mortgage Corporation 5% 0.01 542,387 515,243 2048-07-01BP Capital Markets plc 2.52% 0.01 541,897 545,017 2020-01-15Xerox Corporation 5.62% 0.01 541,894 529,219 2019-12-15UDR Inc 4.62% 0.01 541,742 529,219 2022-01-1021st Century Fox America, Inc. 6.15% 0.01 540,729 434,989 2037-03-01................................................................................................................................................................................................................................................................................................Harley-Davidson, Inc. 4.62% 0.01 539,544 577,420 2045-07-28Southern California Edison Company 4.05% 0.01 539,519 571,645 2042-03-15Federal Home Loan Mortgage Corporation 4.5% 0.01 538,592 519,354 2039-02-01Amgen Inc. 4.1% 0.01 538,318 529,219 2021-06-15Federal Home Loan Mortgage Corporation 3.11% 0.01 537,632 539,391 2023-02-25................................................................................................................................................................................................................................................................................................Federal National Mortgage Association 3.5% 0.01 536,895 534,856 2032-09-01Tennessee Valley Authority 6.15% 0.01 536,536 399,186 2038-01-15Grand Metropolitan Investment Corp. 7.45% 0.01 536,452 392,645 2035-04-15Boston Scientific Corporation 7.38% 0.01 536,356 408,043 2040-01-15Halliburton Company 4.75% 0.01 535,669 523,527 2043-08-01................................................................................................................................................................................................................................................................................................Federal Home Loan Mortgage Corporation 3.17% 0.01 535,366 539,391 2024-10-25Federal Home Loan Mortgage Corporation 4% 0.01 535,304 525,479 2041-09-01The Home Depot, Inc. 4.88% 0.01 535,162 483,493 2044-02-15Virginia Electric and Power Company 6% 0.01 534,856 450,387 2036-01-15Canadian National Railway Company 3.65% 0.01 534,708 577,420 2048-02-03................................................................................................................................................................................................................................................................................................Puget Sound Energy Inc. 5.64% 0.01 534,003 446,538 2041-04-15Merck Sharp & Dohme Corp 3.6% 0.01 533,885 565,871 2042-09-15Federal Home Loan Mortgage Corporation 5.5% 0.01 533,787 493,079 2035-09-01Ameriprise Financial, Inc. 5.3% 0.01 533,441 517,371 2020-03-15Government National Mortgage Association 4% 0.01 531,842 519,709 2042-02-15................................................................................................................................................................................................................................................................................................
©2018 Morningstar, Inc., Morningstar Investment Profiles™ 312-696-6000. All rights reserved. The information contained herein: (1) is proprietary to Morningstar and/or its content providers; (2) maynot be copied or distributed and (3) is not warranted to be accurate, complete or timely. Neither Morningstar nor its content providers are responsible for any damages or losses arising from any use ofinformation. Past performance is no guarantee of future performance. Visit our investment website at www.morningstar.com ß
®
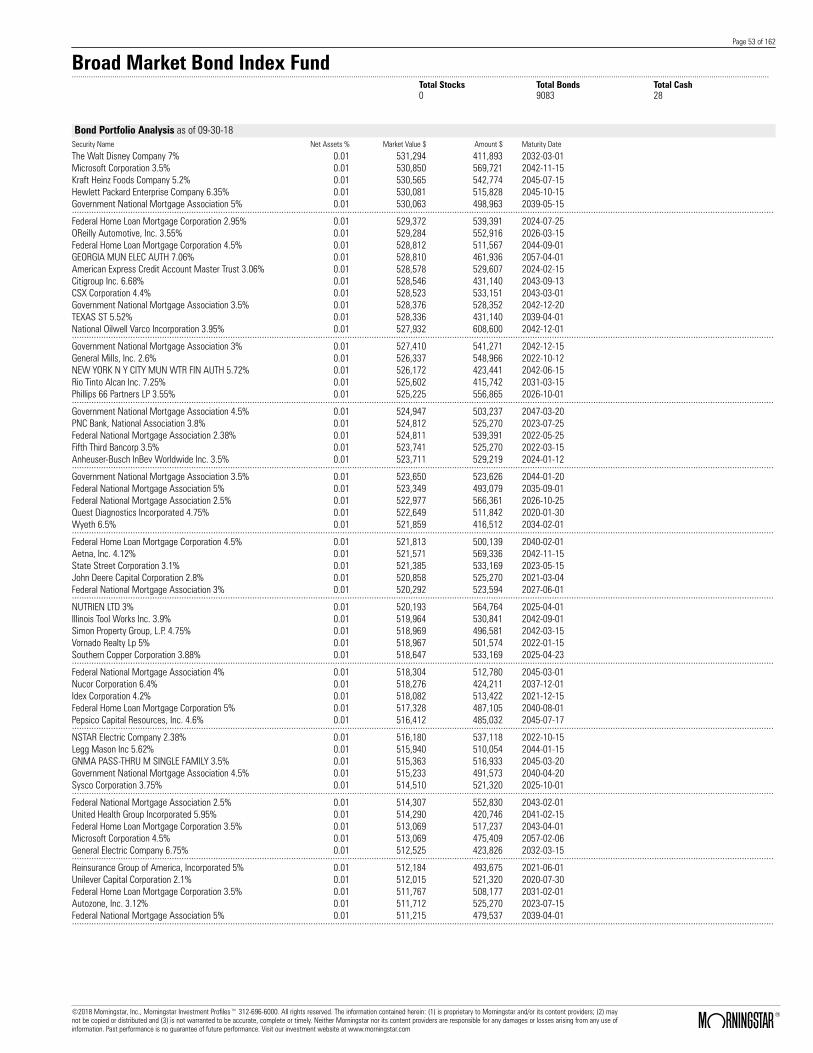
Page 53 of 162
Broad Market Bond Index Fund.......................................................................................................................................................................................................................................................................................................................................
Total Stocks Total Bonds Total Cash0 9083 28
Bond Portfolio Analysis as of 09-30-18Security Name Net Assets % Market Value $ Amount $ Maturity Date
The Walt Disney Company 7% 0.01 531,294 411,893 2032-03-01Microsoft Corporation 3.5% 0.01 530,850 569,721 2042-11-15Kraft Heinz Foods Company 5.2% 0.01 530,565 542,774 2045-07-15Hewlett Packard Enterprise Company 6.35% 0.01 530,081 515,828 2045-10-15Government National Mortgage Association 5% 0.01 530,063 498,963 2039-05-15................................................................................................................................................................................................................................................................................................Federal Home Loan Mortgage Corporation 2.95% 0.01 529,372 539,391 2024-07-25OReilly Automotive, Inc. 3.55% 0.01 529,284 552,916 2026-03-15Federal Home Loan Mortgage Corporation 4.5% 0.01 528,812 511,567 2044-09-01GEORGIA MUN ELEC AUTH 7.06% 0.01 528,810 461,936 2057-04-01American Express Credit Account Master Trust 3.06% 0.01 528,578 529,607 2024-02-15Citigroup Inc. 6.68% 0.01 528,546 431,140 2043-09-13CSX Corporation 4.4% 0.01 528,523 533,151 2043-03-01Government National Mortgage Association 3.5% 0.01 528,376 528,352 2042-12-20TEXAS ST 5.52% 0.01 528,336 431,140 2039-04-01National Oilwell Varco Incorporation 3.95% 0.01 527,932 608,600 2042-12-01................................................................................................................................................................................................................................................................................................Government National Mortgage Association 3% 0.01 527,410 541,271 2042-12-15General Mills, Inc. 2.6% 0.01 526,337 548,966 2022-10-12NEW YORK N Y CITY MUN WTR FIN AUTH 5.72% 0.01 526,172 423,441 2042-06-15Rio Tinto Alcan Inc. 7.25% 0.01 525,602 415,742 2031-03-15Phillips 66 Partners LP 3.55% 0.01 525,225 556,865 2026-10-01................................................................................................................................................................................................................................................................................................Government National Mortgage Association 4.5% 0.01 524,947 503,237 2047-03-20PNC Bank, National Association 3.8% 0.01 524,812 525,270 2023-07-25Federal National Mortgage Association 2.38% 0.01 524,811 539,391 2022-05-25Fifth Third Bancorp 3.5% 0.01 523,741 525,270 2022-03-15Anheuser-Busch InBev Worldwide Inc. 3.5% 0.01 523,711 529,219 2024-01-12................................................................................................................................................................................................................................................................................................Government National Mortgage Association 3.5% 0.01 523,650 523,626 2044-01-20Federal National Mortgage Association 5% 0.01 523,349 493,079 2035-09-01Federal National Mortgage Association 2.5% 0.01 522,977 566,361 2026-10-25Quest Diagnostics Incorporated 4.75% 0.01 522,649 511,842 2020-01-30Wyeth 6.5% 0.01 521,859 416,512 2034-02-01................................................................................................................................................................................................................................................................................................Federal Home Loan Mortgage Corporation 4.5% 0.01 521,813 500,139 2040-02-01Aetna, Inc. 4.12% 0.01 521,571 569,336 2042-11-15State Street Corporation 3.1% 0.01 521,385 533,169 2023-05-15John Deere Capital Corporation 2.8% 0.01 520,858 525,270 2021-03-04Federal National Mortgage Association 3% 0.01 520,292 523,594 2027-06-01................................................................................................................................................................................................................................................................................................NUTRIEN LTD 3% 0.01 520,193 564,764 2025-04-01Illinois Tool Works Inc. 3.9% 0.01 519,964 530,841 2042-09-01Simon Property Group, L.P. 4.75% 0.01 518,969 496,581 2042-03-15Vornado Realty Lp 5% 0.01 518,967 501,574 2022-01-15Southern Copper Corporation 3.88% 0.01 518,647 533,169 2025-04-23................................................................................................................................................................................................................................................................................................Federal National Mortgage Association 4% 0.01 518,304 512,780 2045-03-01Nucor Corporation 6.4% 0.01 518,276 424,211 2037-12-01Idex Corporation 4.2% 0.01 518,082 513,422 2021-12-15Federal Home Loan Mortgage Corporation 5% 0.01 517,328 487,105 2040-08-01Pepsico Capital Resources, Inc. 4.6% 0.01 516,412 485,032 2045-07-17................................................................................................................................................................................................................................................................................................NSTAR Electric Company 2.38% 0.01 516,180 537,118 2022-10-15Legg Mason Inc 5.62% 0.01 515,940 510,054 2044-01-15GNMA PASS-THRU M SINGLE FAMILY 3.5% 0.01 515,363 516,933 2045-03-20Government National Mortgage Association 4.5% 0.01 515,233 491,573 2040-04-20Sysco Corporation 3.75% 0.01 514,510 521,320 2025-10-01................................................................................................................................................................................................................................................................................................Federal National Mortgage Association 2.5% 0.01 514,307 552,830 2043-02-01United Health Group Incorporated 5.95% 0.01 514,290 420,746 2041-02-15Federal Home Loan Mortgage Corporation 3.5% 0.01 513,069 517,237 2043-04-01Microsoft Corporation 4.5% 0.01 513,069 475,409 2057-02-06General Electric Company 6.75% 0.01 512,525 423,826 2032-03-15................................................................................................................................................................................................................................................................................................Reinsurance Group of America, Incorporated 5% 0.01 512,184 493,675 2021-06-01Unilever Capital Corporation 2.1% 0.01 512,015 521,320 2020-07-30Federal Home Loan Mortgage Corporation 3.5% 0.01 511,767 508,177 2031-02-01Autozone, Inc. 3.12% 0.01 511,712 525,270 2023-07-15Federal National Mortgage Association 5% 0.01 511,215 479,537 2039-04-01................................................................................................................................................................................................................................................................................................
©2018 Morningstar, Inc., Morningstar Investment Profiles™ 312-696-6000. All rights reserved. The information contained herein: (1) is proprietary to Morningstar and/or its content providers; (2) maynot be copied or distributed and (3) is not warranted to be accurate, complete or timely. Neither Morningstar nor its content providers are responsible for any damages or losses arising from any use ofinformation. Past performance is no guarantee of future performance. Visit our investment website at www.morningstar.com ß
®

Page 54 of 162
Broad Market Bond Index Fund.......................................................................................................................................................................................................................................................................................................................................
Total Stocks Total Bonds Total Cash0 9083 28
Bond Portfolio Analysis as of 09-30-18Security Name Net Assets % Market Value $ Amount $ Maturity Date
Centerpoint Energy Houston Electric LLC 3.55% 0.01 511,185 560,482 2042-08-01Apple Inc. 3% 0.01 511,068 521,320 2024-02-09Comm 2014-Ccre17 Mortgage Trust 3.98% 0.01 510,707 500,286 2047-05-10Rogers Communications Inc. 4.1% 0.01 509,803 501,574 2023-10-01Rogers Communications Inc. 3% 0.01 509,628 525,270 2023-03-15Lincoln National Corporation 7% 0.01 509,621 406,118 2040-06-15Federal National Mortgage Association 3.5% 0.01 508,981 513,289 2043-05-01General Electric Company 4.5% 0.01 508,323 538,925 2044-03-11METROPOLITAN GOVT NASHVILLE & DAVIDSON CNTYTENN 6.73%
0.01 505,997 384,946 2043-07-01
Federal National Mortgage Association 3% 0.01 505,802 510,277 2030-04-01................................................................................................................................................................................................................................................................................................McKesson Corporation 3.8% 0.01 505,682 509,472 2024-03-15Federal Home Loan Mortgage Corporation 3.06% 0.01 505,280 512,561 2024-12-25Ford Motor Credit Company LLC 2.46% 0.01 504,798 513,422 2020-03-27Government National Mortgage Association 4% 0.01 504,734 491,435 2041-01-15Wf-Rbs Com Mg Tst 3.07% 0.01 504,650 512,422 2045-03-15................................................................................................................................................................................................................................................................................................Federal Home Loan Mortgage Corporation 3% 0.01 504,523 509,457 2029-07-01Oracle Corporation 4% 0.01 504,427 529,301 2046-07-15Government National Mortgage Association 4.5% 0.01 504,134 481,251 2045-04-20Federal National Mortgage Association 3.5% 0.01 504,034 506,643 2038-01-01International Business Machines Corporation 3.45% 0.01 503,502 509,472 2026-02-19................................................................................................................................................................................................................................................................................................Federal Home Loan Mortgage Corporation 3.02% 0.01 503,443 512,580 2025-01-25Broadcom Corporation/Broadcom Cayman Finance Ltd3.12%
0.01 502,686 541,067 2025-01-15
Buckeye Partners LP 4.88% 0.01 502,586 493,675 2021-02-01Federal Home Loan Mortgage Corporation 3% 0.01 502,300 520,032 2043-01-01Anheuser-Busch InBev Finance Inc. 4.62% 0.01 501,710 521,602 2044-02-01................................................................................................................................................................................................................................................................................................Federal Home Loan Mortgage Corporation 2.64% 0.01 501,442 512,422 2023-01-25AbbVie Inc. 4.45% 0.01 500,721 544,699 2046-05-14Government National Mortgage Association 3% 0.01 500,557 512,859 2043-05-15Medtronic, Inc. 6.5% 0.01 500,545 394,185 2039-03-15Federal National Mortgage Association 3.5% 0.01 500,430 498,530 2033-08-01................................................................................................................................................................................................................................................................................................Federal National Mortgage Association 5% 0.01 500,404 469,461 2039-08-01Federal Home Loan Mortgage Corporation 2.5% 0.01 500,204 514,895 2028-03-01United Airlines, Inc. 7.25% 0.01 500,088 481,294 2021-05-10Government National Mortgage Association 5% 0.01 499,632 470,526 2039-09-15Federal Home Loan Mortgage Corporation 2.4% 0.01 499,557 512,422 2022-06-25................................................................................................................................................................................................................................................................................................Federal National Mortgage Association 4% 0.01 499,505 490,123 2040-12-01Government National Mortgage Association 3% 0.01 499,042 511,305 2043-05-15Federal National Mortgage Association 3.5% 0.01 498,951 503,022 2043-11-01TransCanada Pipelines Limited 5.85% 0.01 498,886 441,149 2036-03-15PPL Electric Utilities Corporation 4.15% 0.01 498,022 500,430 2048-06-15................................................................................................................................................................................................................................................................................................Federal Home Loan Mortgage Corporation 2.81% 0.01 497,580 512,422 2025-01-25Federal Home Loan Mortgage Corporation 3.24% 0.01 497,392 498,937 2024-09-25Trustees of Princeton University 5.7% 0.01 497,372 399,959 2039-03-01CME Group Inc. 4.15% 0.01 497,198 500,430 2048-06-15Westvaco Corporation 7.95% 0.01 497,037 384,946 2031-02-15................................................................................................................................................................................................................................................................................................L3 Technologies Inc 4.95% 0.01 495,563 481,827 2021-02-15The Dow Chemical Company 9.4% 0.01 495,453 325,280 2039-05-15Federal National Mortgage Association 4% 0.01 495,088 486,616 2040-11-01Eastman Chemical Company 2.7% 0.01 495,002 497,624 2020-01-15Duke Energy Indiana Inc. 6.35% 0.01 494,586 384,946 2038-08-15................................................................................................................................................................................................................................................................................................Johnson & Johnson 5.85% 0.01 494,470 394,570 2038-07-15American Express Company 4.05% 0.01 493,921 513,903 2042-12-03Wells Fargo & Company 2.55% 0.01 493,678 501,574 2020-12-07Federal Home Loan Mortgage Corporation 3% 0.01 493,453 511,035 2043-01-01Progress Energy, Inc. 3.15% 0.01 493,078 501,574 2022-04-01................................................................................................................................................................................................................................................................................................
©2018 Morningstar, Inc., Morningstar Investment Profiles™ 312-696-6000. All rights reserved. The information contained herein: (1) is proprietary to Morningstar and/or its content providers; (2) maynot be copied or distributed and (3) is not warranted to be accurate, complete or timely. Neither Morningstar nor its content providers are responsible for any damages or losses arising from any use ofinformation. Past performance is no guarantee of future performance. Visit our investment website at www.morningstar.com ß
®

Page 55 of 162
Broad Market Bond Index Fund.......................................................................................................................................................................................................................................................................................................................................
Total Stocks Total Bonds Total Cash0 9083 28
Bond Portfolio Analysis as of 09-30-18Security Name Net Assets % Market Value $ Amount $ Maturity Date
AvalonBay Communities, Inc. 6.1% 0.01 492,822 473,928 2020-03-15Federal National Mortgage Association 4% 0.01 492,549 484,188 2040-02-01Federal Home Loan Mortgage Corporation 2% 0.01 492,497 525,496 2032-01-01Federal Home Loan Mortgage Corporation 2% 0.01 492,062 525,022 2032-02-01Federal National Mortgage Association 2% 0.01 491,973 513,547 2027-10-01Federal Home Loan Mortgage Corporation 3.59% 0.01 491,665 485,452 2025-01-25Exxon Mobil Corporation 3.57% 0.01 491,496 525,452 2045-03-06Federal Home Loan Mortgage Corporation 3.5% 0.01 490,986 487,541 2029-12-01Federal National Mortgage Association 3.76% 0.01 490,969 483,716 2021-04-25Tennessee Valley Authority 4.25% 0.01 490,681 449,084 2065-09-15................................................................................................................................................................................................................................................................................................21st Century Fox America, Inc. 6.4% 0.01 490,597 384,946 2035-12-15JPMBB Commercial Mortgage Securities Trust 3.8% 0.01 490,333 485,770 2047-09-15Federal Home Loan Mortgage Corporation 5% 0.01 490,279 462,025 2033-08-01Federal Home Loan Mortgage Corporation 3.5% 0.01 490,067 494,048 2041-11-01Potomac Electric Power Company 6.5% 0.01 490,063 381,482 2037-11-15................................................................................................................................................................................................................................................................................................Burlington Resources Finance Company 7.2% 0.01 489,971 384,946 2031-08-15Medtronic, Inc. 4.38% 0.01 489,665 473,484 2035-03-15Prudential Financial, Inc. 3.5% 0.01 489,646 489,725 2024-05-15Exelon Corporation 5.62% 0.01 489,515 437,684 2035-06-15Macy's Retail Holdings, Inc. 3.88% 0.01 488,333 489,725 2022-01-15................................................................................................................................................................................................................................................................................................Federal National Mortgage Association 2.53% 0.01 488,182 512,422 2024-09-25Husky Energy Inc. 6.8% 0.01 488,182 396,495 2037-09-15SAN ANTONIO TEX 5.81% 0.01 487,359 392,645 2041-02-01Weyerhaeuser Company 7.38% 0.01 486,868 384,946 2032-03-15Prudential Financial, Inc. 6.62% 0.01 486,669 388,796 2040-06-21................................................................................................................................................................................................................................................................................................FedEx Corporation 3.88% 0.01 486,352 548,164 2042-08-01PacifiCorp 6.35% 0.01 486,315 384,946 2038-07-15Federal National Mortgage Association 2% 0.01 486,224 518,324 2031-11-01UNIVERSITY CALIF 4.86% 0.01 486,009 480,028 .The Republic of Peru 6.55% 0.01 485,995 384,946 2037-03-14................................................................................................................................................................................................................................................................................................Citigroup Inc. 5.3% 0.01 485,842 464,630 2044-05-06Federal Home Loan Mortgage Corporation 3.3% 0.01 485,784 485,452 2024-07-25Abbott Laboratories 6% 0.01 485,697 408,043 2039-04-01NYU Hospitals Center 4.37% 0.01 485,642 481,183 2047-07-01American Express Credit Account Master Trust 2.67% 0.01 485,303 487,239 2022-10-17................................................................................................................................................................................................................................................................................................Federal National Mortgage Association 3% 0.01 484,897 502,462 2043-03-01Sysco Corporation 2.6% 0.01 484,749 501,574 2022-06-12COOK CNTY ILL 6.23% 0.01 484,609 402,269 2034-11-15Federal National Mortgage Association 4.5% 0.01 484,135 468,786 2046-12-01Federal National Mortgage Association 3.5% 0.01 483,842 490,680 2047-05-01................................................................................................................................................................................................................................................................................................Mead Johnson Nutrition Company 4.9% 0.01 483,155 473,928 2019-11-01Sabine Pass Liquefaction, LLC 5% 0.01 482,757 469,978 2027-03-15GNMA PASS-THRU M SINGLE FAMILY 3% 0.01 482,215 495,693 2045-01-20The Boeing Company 6.62% 0.01 481,853 365,699 2038-02-15The Walt Disney Company 4.12% 0.01 481,354 488,882 2041-12-01................................................................................................................................................................................................................................................................................................Federal Home Loan Mortgage Corporation 3% 0.01 480,958 486,799 2030-06-01Federal Home Loan Mortgage Corporation 5.5% 0.01 480,850 449,096 2040-08-01Unilever Capital Corporation 5.9% 0.01 480,584 392,645 2032-11-15Burlington Northern Santa Fe LLC 4.4% 0.01 480,504 470,404 2042-03-15Canadian Natural Resources Limited 5.85% 0.01 480,436 433,065 2035-02-01................................................................................................................................................................................................................................................................................................MORGAN STANLEY BANK OF AMERICA MERRILLLYNCH TRUST 3.31%
0.01 480,338 491,172 2048-04-15
S&P GLOBAL INC 6.55% 0.01 480,270 384,946 2037-11-15Federal Home Loan Mortgage Corporation 4% 0.01 479,954 471,156 2040-12-01Ameren Illinois Company 3.7% 0.01 479,570 516,213 2047-12-01Federal National Mortgage Association 2.5% 0.01 479,350 515,256 2043-03-01................................................................................................................................................................................................................................................................................................American International Group, Inc. 4.5% 0.01 479,200 507,744 2044-07-16Eaton Corporation 3.1% 0.01 479,043 513,422 2027-09-15Intel Corporation 4.8% 0.01 478,766 440,764 2041-10-01Federal Home Loan Mortgage Corporation 3% 0.01 478,088 490,287 2036-11-01Time Warner Entertainment Co., L.P. 8.38% 0.01 478,084 384,946 2033-07-15
©2018 Morningstar, Inc., Morningstar Investment Profiles™ 312-696-6000. All rights reserved. The information contained herein: (1) is proprietary to Morningstar and/or its content providers; (2) maynot be copied or distributed and (3) is not warranted to be accurate, complete or timely. Neither Morningstar nor its content providers are responsible for any damages or losses arising from any use ofinformation. Past performance is no guarantee of future performance. Visit our investment website at www.morningstar.com ß
®

Page 56 of 162
Broad Market Bond Index Fund.......................................................................................................................................................................................................................................................................................................................................
Total Stocks Total Bonds Total Cash0 9083 28
Bond Portfolio Analysis as of 09-30-18Security Name Net Assets % Market Value $ Amount $ Maturity Date
Federal National Mortgage Association 4% 0.01 478,031 472,112 2044-07-01Federal Home Loan Mortgage Corporation 5% 0.01 477,704 447,722 2041-05-01Citibank Credit Card Issuance Trust 1.86% 0.01 477,590 487,768 2022-08-07UBS Commercial Mor 3.4% 0.01 477,437 478,337 2045-05-10NEW YORK N Y CITY MUN WTR FIN AUTH 5.75% 0.01 477,260 384,946 2041-06-15................................................................................................................................................................................................................................................................................................Federal Home Loan Mortgage Corporation 3% 0.01 476,745 480,281 2027-02-01PacifiCorp 6% 0.01 476,706 384,946 2039-01-15CA, Inc. 4.5% 0.01 476,326 473,928 2023-08-15Mexico (United Mexican States) 6.05% 0.01 476,220 428,830 2040-01-11Southwestern Electric Power Company 3.55% 0.01 475,051 473,928 2022-02-15................................................................................................................................................................................................................................................................................................American Express Credit Account Master Trust 2.99% 0.01 475,045 476,647 2023-12-15Federal National Mortgage Association 5% 0.01 474,781 447,185 2033-10-01XLIT Ltd. 5.25% 0.01 474,730 440,764 2043-12-15FEDERAL HOME LN MTG CORP MULTICLASS MTGPARTN CTFS GTD 3.29%
0.01 474,587 485,452 2027-11-25
OHIO ST UNIV 4.91% 0.01 474,345 421,516 2040-06-01................................................................................................................................................................................................................................................................................................Federal National Mortgage Association 4% 0.01 474,344 469,104 2045-12-01Federal National Mortgage Association 3% 0.01 473,790 476,789 2027-04-01Virginia Electric and Power Company 8.88% 0.01 472,967 304,493 2038-11-15JPMorgan Chase & Co. 6.4% 0.01 472,958 379,172 2038-05-15Aercap Ireland Capital DAC 3.5% 0.01 472,736 481,827 2022-05-26................................................................................................................................................................................................................................................................................................BENCHMARK MORTGAGE TRUST 4.21% 0.01 472,614 458,483 2051-07-15Pfizer Inc. 2.2% 0.01 472,463 485,776 2021-12-15Pacific Gas and Electric Company 6.25% 0.01 472,105 409,583 2039-03-01Georgia-Pacific LLC 8% 0.01 471,832 394,940 2024-01-15Federal Home Loan Mortgage Corporation 3.19% 0.01 471,121 485,452 2027-09-25................................................................................................................................................................................................................................................................................................Canadian National Railway Company 6.2% 0.01 471,119 384,946 2036-06-01Amgen Inc. 3.62% 0.01 471,079 471,558 2024-05-22The Toronto-Dominion Bank 2.25% 0.01 470,701 473,928 2019-11-05Government National Mortgage Association 4% 0.01 470,659 458,648 2041-07-20Federal Home Loan Mortgage Corporation 3% 0.01 470,597 474,090 2027-05-01................................................................................................................................................................................................................................................................................................Kreditanstalt Fur Wiederaufbau 2.88% 0.01 470,420 481,827 2028-04-03NEW YORK N Y CITY TRANSITIONAL FIN AUTH 5.77% 0.01 470,007 402,269 2036-08-01Federal Home Loan Mortgage Corporation 3.93% 0.01 469,942 458,483 2028-07-25Novartis Capital Corporation 4% 0.01 469,437 467,325 2045-11-20Government National Mortgage Association 3% 0.01 469,229 471,468 2028-01-20................................................................................................................................................................................................................................................................................................Federal Home Loan Mortgage Corporation 3.9% 0.01 469,079 458,483 2051-06-25NYU Hospitals Center 5.75% 0.01 468,524 384,946 2043-07-01Lockheed Martin Corporation 6.15% 0.01 468,106 384,946 2036-09-01Federal National Mortgage Association 4.5% 0.01 468,105 449,839 2040-10-01South Carolina Electric & Gas Company 5.45% 0.01 468,005 435,759 2041-02-01................................................................................................................................................................................................................................................................................................Federal National Mortgage Association 3.5% 0.01 467,925 474,040 2046-12-01CME Group Inc. 5.3% 0.01 467,831 406,118 2043-09-15Australia and New Zealand Banking Group Limited2.55%
0.01 467,666 481,827 2021-11-23
Citigroup Commercial Mortgage Trust 3.64% 0.01 467,346 466,752 2047-10-10Duke Energy Carolinas LLC 5.3% 0.01 467,118 410,738 2040-02-15................................................................................................................................................................................................................................................................................................Federal Home Loan Mortgage Corporation 3.85% 0.01 466,840 458,483 2028-06-25Midamerican Energy Company 4.8% 0.01 466,737 431,140 2043-09-15Government National Mortgage Association 4% 0.01 466,424 456,400 2042-03-20Bank of Montreal 2.1% 0.01 466,215 473,928 2020-06-15BA Credit Card Trust 1.84% 0.01 465,950 476,647 2023-01-17................................................................................................................................................................................................................................................................................................Government National Mortgage Association 3.5% 0.01 465,609 466,122 2043-08-15BNP Paribas 3.25% 0.01 465,568 473,928 2023-03-03Government National Mortgage Association 5% 0.01 465,419 438,388 2033-09-15GS MORTGAGE SECURITIES TRUST 3.93% 0.01 465,071 457,134 2047-09-10Federal Home Loan Mortgage Corporation 3.6% 0.01 464,937 465,225 2028-01-25
©2018 Morningstar, Inc., Morningstar Investment Profiles™ 312-696-6000. All rights reserved. The information contained herein: (1) is proprietary to Morningstar and/or its content providers; (2) maynot be copied or distributed and (3) is not warranted to be accurate, complete or timely. Neither Morningstar nor its content providers are responsible for any damages or losses arising from any use ofinformation. Past performance is no guarantee of future performance. Visit our investment website at www.morningstar.com ß
®

Page 57 of 162
Broad Market Bond Index Fund.......................................................................................................................................................................................................................................................................................................................................
Total Stocks Total Bonds Total Cash0 9083 28
Bond Portfolio Analysis as of 09-30-18Security Name Net Assets % Market Value $ Amount $ Maturity Date
The Progressive Corporation 4.35% 0.01 464,199 463,860 2044-04-25Government National Mortgage Association 4.5% 0.01 464,010 442,504 2041-01-20Federal Home Loan Mortgage Corporation 3.53% 0.01 463,982 458,483 2023-10-25The Dow Chemical Company 3.5% 0.01 463,838 473,928 2024-10-01Virginia Electric and Power Company 6% 0.01 463,796 384,946 2037-05-15................................................................................................................................................................................................................................................................................................BP Capital Markets plc 3.22% 0.01 463,308 473,928 2024-04-14Government National Mortgage Association 3% 0.01 463,218 463,685 2027-09-15Federal Home Loan Mortgage Corporation 5.5% 0.01 462,824 429,341 2039-12-01CSX Corporation 6.15% 0.01 462,520 384,946 2037-05-01Federal National Mortgage Association 2.5% 0.01 462,121 496,725 2043-05-01................................................................................................................................................................................................................................................................................................Federal National Mortgage Association 3% 0.01 462,072 473,868 2036-10-01Commonwealth Edison Company 6.45% 0.01 461,634 365,699 2038-01-15WELLS FARGO COMMERCIAL MORTGAGE TRUST3.81%
0.01 460,866 458,483 2048-12-15
Bank of America Corporation 2.88% 0.01 460,833 473,928 2023-04-24WASHINGTON ST 5.14% 0.01 460,522 394,570 2040-08-01................................................................................................................................................................................................................................................................................................LOS ANGELES CNTY CALIF MET TRANSN AUTH 5.74% 0.01 459,356 384,946 2039-06-01Government National Mortgage Association 3% 0.01 459,300 472,834 2043-02-20Marathon Oil Corporation 2.8% 0.01 459,299 477,877 2022-11-01Capital One Multi Asset Execution Trust 2.43% 0.01 459,102 471,457 2025-01-15Kaiser Foundation Hospitals/Health Plan, Inc. 4.88% 0.01 458,662 415,357 2042-04-01................................................................................................................................................................................................................................................................................................GS Mortgage Securities Trust 2014-G 4.07% 0.01 458,441 447,117 2047-01-10AstraZeneca Plc 3.38% 0.01 458,403 473,928 2025-11-16Federal National Mortgage Association 4% 0.01 458,398 450,612 2039-04-01Federal National Mortgage Association 2.92% 0.01 458,196 471,968 2025-10-25Rogers Communications Inc. 5.45% 0.01 457,667 421,131 2043-10-01................................................................................................................................................................................................................................................................................................NSTAR Electric Company 5.5% 0.01 457,159 396,880 2040-03-15Federal Home Loan Mortgage Corporation 4% 0.01 457,155 449,008 2043-12-01The University of Southern California 5.25% 0.01 457,141 394,570 .R. J. Reynolds Tobacco Company 7% 0.01 457,076 384,946 2041-08-04International Bank for Reconstruction and Development4.75%
0.01 457,049 384,946 2035-02-15
................................................................................................................................................................................................................................................................................................Oncor Electric Delivery Company LLC 7% 0.01 456,931 354,536 2032-05-01Federal Home Loan Mortgage Corporation 4.5% 0.01 456,732 437,767 2040-09-01FEDERAL HOME LN MTG CORP MULTICLASS MTGPARTN CTFS GTD 3.28%
0.01 456,421 458,483 2025-06-25
Federal National Mortgage Association 4% 0.01 455,907 450,824 2045-12-01Southern Copper Corporation 6.75% 0.01 455,679 384,946 2040-04-16................................................................................................................................................................................................................................................................................................Brixmor Operating Partnership LP 3.65% 0.01 455,538 473,928 2024-06-15Praxair, Inc. 2.2% 0.01 455,332 473,928 2022-08-15Government National Mortgage Association 5% 0.01 455,085 421,913 2033-09-20Wyeth 7.25% 0.01 454,834 394,940 2023-03-01Southern California Edison Company 6.05% 0.01 454,575 384,946 2039-03-15................................................................................................................................................................................................................................................................................................Duke Energy Florida, Inc 3.1% 0.01 454,278 454,181 2021-08-15Consolidated Edison Company of New York, Inc. 5.85% 0.01 453,654 384,946 2036-03-15FEDERAL HOME LN MTG CORP MULTICLASS MTGPARTN CTFS GTD 3.14%
0.01 453,516 458,483 2024-10-25
Government National Mortgage Association 3.5% 0.01 453,392 453,891 2040-11-15Wells Fargo & Company 4.4% 0.01 453,266 481,183 2046-06-14................................................................................................................................................................................................................................................................................................Alexandria Real Estate Equities, Inc. 3.45% 0.01 453,187 473,928 2025-04-30Federal National Mortgage Association 5% 0.01 452,887 426,540 2035-05-01Southwest Airlines Co. 3% 0.01 452,472 489,725 2026-11-15Government National Mortgage Association 3.5% 0.01 452,313 452,292 2043-05-20Federal Home Loan Mortgage Corporation 4% 0.01 451,962 443,679 2041-04-01................................................................................................................................................................................................................................................................................................Plains All American Pipeline L.P./PAA Finance Corp.6.65%
0.01 451,269 408,043 2037-01-15
GS Mortgage Securities Trust 2015-G 3.38% 0.01 451,147 458,641 2050-05-10Shell International Finance B.V. 3.62% 0.01 450,737 485,802 2042-08-21Federal Home Loan Mortgage Corporation 2.86% 0.01 450,666 453,089 2021-01-25Federal National Mortgage Association 3% 0.01 450,123 466,588 2044-09-01
©2018 Morningstar, Inc., Morningstar Investment Profiles™ 312-696-6000. All rights reserved. The information contained herein: (1) is proprietary to Morningstar and/or its content providers; (2) maynot be copied or distributed and (3) is not warranted to be accurate, complete or timely. Neither Morningstar nor its content providers are responsible for any damages or losses arising from any use ofinformation. Past performance is no guarantee of future performance. Visit our investment website at www.morningstar.com ß
®

Page 58 of 162
Broad Market Bond Index Fund.......................................................................................................................................................................................................................................................................................................................................
Total Stocks Total Bonds Total Cash0 9083 28
Bond Portfolio Analysis as of 09-30-18Security Name Net Assets % Market Value $ Amount $ Maturity Date
Federal Home Loan Mortgage Corporation 3% 0.01 450,062 466,153 2043-03-01Campbell Soup Company 3.8% 0.01 449,795 577,420 2042-08-02Federal National Mortgage Association 3% 0.01 449,582 469,448 2047-09-01Federal National Mortgage Association 3.5% 0.01 449,490 451,114 2033-11-01Federal National Mortgage Association 3.5% 0.01 449,396 454,888 2046-06-01................................................................................................................................................................................................................................................................................................Delhaize Group SA 5.7% 0.01 449,160 413,047 2040-10-01Northern States Power Company 3.6% 0.01 448,985 494,656 2047-09-15BA Credit Card Trust 3% 0.01 448,980 450,166 2023-09-15Government National Mortgage Association 4.5% 0.01 448,921 430,483 2040-07-15Federal National Mortgage Association 3.76% 0.01 448,805 442,869 2021-06-25................................................................................................................................................................................................................................................................................................JPMorgan Chase & Co. 5.5% 0.01 448,642 392,645 2040-10-15Anadarko Petroleum Corporation 6.2% 0.01 448,628 404,579 2040-03-15Marsh & McLennan Companies, Inc. 5.88% 0.01 448,610 388,026 2033-08-01Federal National Mortgage Association 2.5% 0.01 448,461 464,410 2031-10-01President & Fellows of Harvard College 4.88% 0.01 448,124 390,336 2040-10-15................................................................................................................................................................................................................................................................................................Federal National Mortgage Association 4.5% 0.01 447,561 432,214 2031-04-01Williams Partners LP / Williams Partners FinanceCorporation 5.8%
0.01 446,813 413,817 2043-11-15
President & Fellows of Harvard College 3.15% 0.01 446,686 504,280 2046-07-15United Technologies Corporation 6.05% 0.01 446,428 384,946 2036-06-01Government National Mortgage Association 3.5% 0.01 446,416 449,125 2045-05-15................................................................................................................................................................................................................................................................................................HSBC Holdings plc 6.1% 0.01 446,389 373,398 2042-01-14Kentucky Utilities Company 5.12% 0.01 446,371 392,645 2040-11-01Harris Corporation 6.15% 0.01 446,136 384,946 2040-12-15Federal National Mortgage Association 5% 0.01 445,713 419,602 2035-11-01Federal National Mortgage Association 4.5% 0.01 445,273 429,479 2033-10-01................................................................................................................................................................................................................................................................................................Government National Mortgage Association 2.5% 0.01 445,210 474,357 2046-09-20FHLMC PC GOLD PC 30YR 4.5% 0.01 445,147 431,024 2048-05-01Federal National Mortgage Association 5% 0.01 445,112 418,569 2040-04-01HSBC Bank USA, N.A. 7% 0.01 445,062 346,452 2039-01-15Goldman Sachs Group, Inc. 5.15% 0.01 444,334 435,374 2045-05-22................................................................................................................................................................................................................................................................................................Corning Incorporated 5.75% 0.01 443,945 395,725 2040-08-15LYB International Finance B.V. 4.88% 0.01 443,615 454,237 2044-03-15Citibank Credit Card Issuance Trust 3.21% 0.01 443,469 444,870 2024-12-07Northrop Grumman Corporation 4.75% 0.01 443,418 427,290 2043-06-01GNMA PASS-THRU M SINGLE FAMILY 4% 0.01 443,323 432,520 2045-01-20................................................................................................................................................................................................................................................................................................MISSISSIPPI ST 5.24% 0.01 443,153 388,796 2034-11-01NEW YORK ST URBAN DEV CORP 5.77% 0.01 443,139 384,946 2039-03-15Sonoco Products Company 5.75% 0.01 442,463 400,344 2040-11-01Gilead Sciences, Inc. 5.65% 0.01 442,454 384,946 2041-12-01Federal Home Loan Mortgage Corporation 2.67% 0.01 442,430 458,483 2024-12-25................................................................................................................................................................................................................................................................................................Ingersoll-Rand Global Holdings Company Limited 5.75% 0.01 442,358 384,946 2043-06-15Philip Morris International Inc. 3.88% 0.01 442,295 492,731 2042-08-21Loews Corporation 6% 0.01 441,513 384,946 2035-02-01Federal National Mortgage Association 3% 0.01 441,439 458,008 2045-05-01Orange S.A. 5.38% 0.01 441,394 403,039 2042-01-13................................................................................................................................................................................................................................................................................................Federal Home Loan Mortgage Corporation 2% 0.01 441,041 470,580 2031-11-01General Electric Company 6.15% 0.01 440,905 384,946 2037-08-07Public Service Electric and Gas Company 5.8% 0.01 440,872 367,239 2037-05-01Morgan Stanley BAML Trust 4.26% 0.01 439,534 426,890 2046-10-15Government National Mortgage Association 2.5% 0.01 439,339 468,045 2043-01-15................................................................................................................................................................................................................................................................................................The Boeing Company 8.75% 0.01 438,803 306,032 2031-09-15Kansas City Power & Light Company 5.3% 0.01 438,596 398,419 2041-10-01Atmos Energy Corporation 5.5% 0.01 438,564 384,946 2041-06-15FEDERAL HOME LN MTG CORP MULTICLASS MTGPARTN CTFS GTD 2.72%
0.01 438,334 444,998 2022-06-25
Federal Home Loan Mortgage Corporation 5% 0.01 438,004 414,766 2033-10-01
©2018 Morningstar, Inc., Morningstar Investment Profiles™ 312-696-6000. All rights reserved. The information contained herein: (1) is proprietary to Morningstar and/or its content providers; (2) maynot be copied or distributed and (3) is not warranted to be accurate, complete or timely. Neither Morningstar nor its content providers are responsible for any damages or losses arising from any use ofinformation. Past performance is no guarantee of future performance. Visit our investment website at www.morningstar.com ß
®

Page 59 of 162
Broad Market Bond Index Fund.......................................................................................................................................................................................................................................................................................................................................
Total Stocks Total Bonds Total Cash0 9083 28
Bond Portfolio Analysis as of 09-30-18Security Name Net Assets % Market Value $ Amount $ Maturity Date
United Technologies Corporation 1.95% 0.01 437,975 458,130 2021-11-01Federal Home Loan Mortgage Corporation 5% 0.01 437,785 412,301 2033-11-01Philip Morris International Inc. 4.38% 0.01 437,694 455,007 2041-11-15Consolidated Edison Company of New York, Inc. 4.45% 0.01 437,398 427,290 2044-03-15The Estee Lauder Companies Inc. 4.38% 0.01 437,160 423,441 2045-06-15................................................................................................................................................................................................................................................................................................Government National Mortgage Association 4.5% 0.01 436,926 417,049 2041-05-15Federal Home Loan Mortgage Corporation 3.6% 0.01 436,787 431,513 2025-02-25Newmont Mining Corporation 6.25% 0.01 436,358 384,946 2039-10-01Federal Home Loan Mortgage Corporation 5.5% 0.01 436,280 404,658 2037-04-01Landwirtschaftliche Rentenbank 1.38% 0.01 436,124 442,333 2019-10-23................................................................................................................................................................................................................................................................................................Alabama Power Company 6% 0.01 436,119 361,850 2039-03-01Federal Home Loan Mortgage Corporation 5% 0.01 435,527 410,062 2041-10-01Federal Home Loan Mortgage Corporation 3.5% 0.01 435,516 433,776 2033-06-01Federal Home Loan Mortgage Corporation 6.5% 0.01 435,386 393,561 2036-09-01Jefferies Group LLC 6.25% 0.01 435,310 430,370 2036-01-15................................................................................................................................................................................................................................................................................................Dover Corporation 4.3% 0.01 435,076 426,535 2021-03-01Gilead Sciences, Inc. 4.6% 0.01 435,011 421,901 2035-09-01Amazon.com, Inc. 4.95% 0.01 434,813 388,796 2044-12-05Lincoln National Corporation 3.62% 0.01 434,649 454,181 2026-12-12Federal National Mortgage Association 3% 0.01 434,517 445,615 2037-02-01................................................................................................................................................................................................................................................................................................JPMorgan Chase & Co. 3.9% 0.01 434,419 481,183 2049-01-23Walgreens Boots Alliance, Inc. 4.8% 0.01 434,239 447,308 2044-11-18Discover Card Execution Note Trust 3.11% 0.01 434,015 434,278 2024-01-16Husky Energy Inc. 4% 0.01 433,637 434,434 2024-04-15Federal Home Loan Mortgage Corporation 3.39% 0.01 433,587 431,513 2024-03-25................................................................................................................................................................................................................................................................................................Federal Home Loan Mortgage Corporation 3.5% 0.01 433,062 432,664 2035-12-01Ford Motor Company 4.75% 0.01 433,044 520,063 2043-01-15Chase Issuance Trust 1.49% 0.01 432,806 444,870 2022-07-15Ventas Realty L.P./Ventas Capital Corp. 5.7% 0.01 432,632 396,495 2043-09-30The Dow Chemical Company 5.25% 0.01 432,569 408,043 2041-11-15................................................................................................................................................................................................................................................................................................Southern California Edison Company 3.9% 0.01 432,247 466,555 2043-03-15Johnson & Johnson 4.85% 0.01 432,209 384,946 2041-05-15Chubb INA Holdings Inc 4.15% 0.01 432,095 438,069 2043-03-13The Walt Disney Company 3.7% 0.01 431,789 467,710 2042-12-01The Procter & Gamble Company 3.1% 0.01 431,758 434,434 2023-08-15................................................................................................................................................................................................................................................................................................Federal Home Loan Mortgage Corporation 5% 0.01 431,757 406,681 2035-12-01Commercial Mortgage Trust 3.61% 0.01 430,648 432,862 2048-10-10Emerson Electric Co. 2.62% 0.01 430,102 446,282 2023-02-15Oneok Partners Lp 6.12% 0.01 429,943 390,721 2041-02-01CENTRAL PUGET SOUND WASH REGL TRAN AUTH5.49%
0.01 429,637 356,075 2039-11-01
................................................................................................................................................................................................................................................................................................Quebec (Province Of) 2.75% 0.01 429,528 434,434 2021-08-25Consolidated Edison Company of New York, Inc. 5.5% 0.01 429,398 371,473 2039-12-01Republic of Chile 3.62% 0.01 429,360 461,936 2042-10-30PORT AUTH N Y & N J 4.93% 0.01 429,030 384,946 2051-10-01OREGON SCH BRDS ASSN 5.55% 0.01 428,988 384,946 2028-06-30................................................................................................................................................................................................................................................................................................Citibank Credit Card Issuance Trust 2.68% 0.01 428,959 434,384 2023-06-07Massachusetts Institute of Technology 3.88% 0.01 428,709 475,409 .Precision Castparts Corp. 2.25% 0.01 428,599 434,434 2020-06-15The Home Depot, Inc. 4.2% 0.01 428,510 425,366 2043-04-01Pepsico Capital Resources, Inc. 2.75% 0.01 428,206 434,434 2022-03-05................................................................................................................................................................................................................................................................................................Florida Power & Light Company 3.25% 0.01 428,070 434,434 2024-06-01Newmont Mining Corporation 4.88% 0.01 427,926 439,609 2042-03-15Federal National Mortgage Association 4% 0.01 427,363 420,051 2040-01-01Abbott Laboratories 5.3% 0.01 427,200 384,946 2040-05-27Citigroup Inc. 2.7% 0.01 427,101 434,434 2021-03-30
©2018 Morningstar, Inc., Morningstar Investment Profiles™ 312-696-6000. All rights reserved. The information contained herein: (1) is proprietary to Morningstar and/or its content providers; (2) maynot be copied or distributed and (3) is not warranted to be accurate, complete or timely. Neither Morningstar nor its content providers are responsible for any damages or losses arising from any use ofinformation. Past performance is no guarantee of future performance. Visit our investment website at www.morningstar.com ß
®
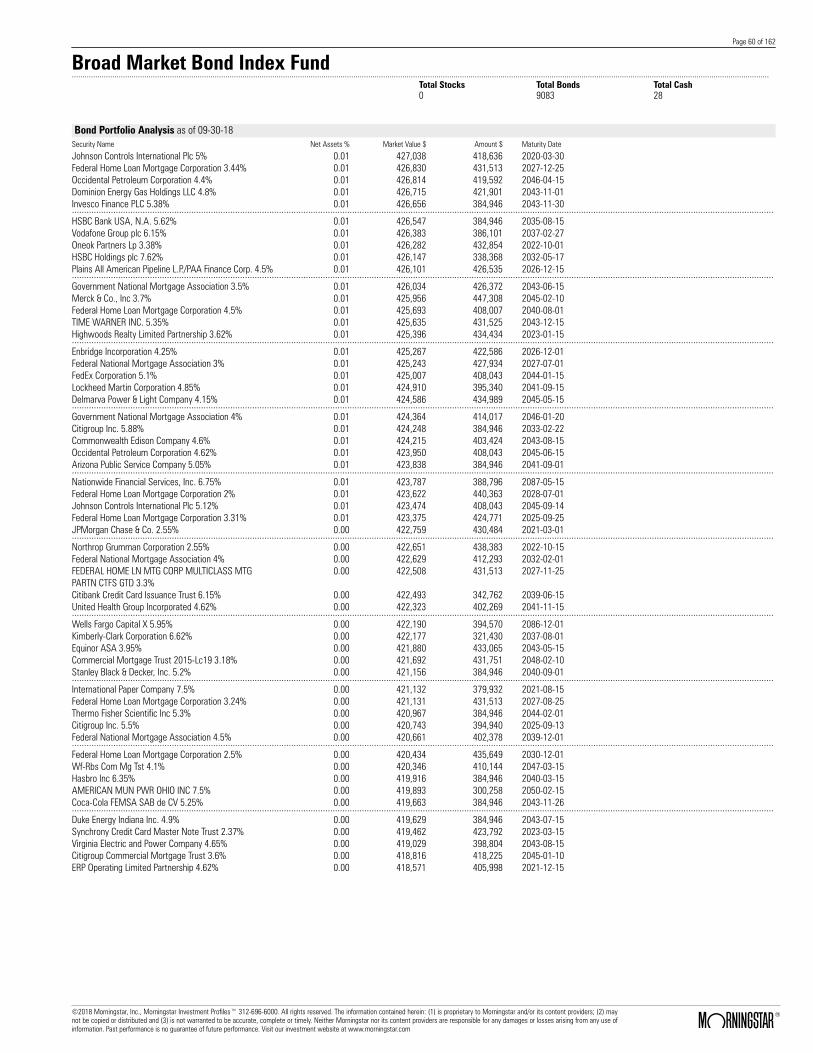
Page 60 of 162
Broad Market Bond Index Fund.......................................................................................................................................................................................................................................................................................................................................
Total Stocks Total Bonds Total Cash0 9083 28
Bond Portfolio Analysis as of 09-30-18Security Name Net Assets % Market Value $ Amount $ Maturity Date
Johnson Controls International Plc 5% 0.01 427,038 418,636 2020-03-30Federal Home Loan Mortgage Corporation 3.44% 0.01 426,830 431,513 2027-12-25Occidental Petroleum Corporation 4.4% 0.01 426,814 419,592 2046-04-15Dominion Energy Gas Holdings LLC 4.8% 0.01 426,715 421,901 2043-11-01Invesco Finance PLC 5.38% 0.01 426,656 384,946 2043-11-30................................................................................................................................................................................................................................................................................................HSBC Bank USA, N.A. 5.62% 0.01 426,547 384,946 2035-08-15Vodafone Group plc 6.15% 0.01 426,383 386,101 2037-02-27Oneok Partners Lp 3.38% 0.01 426,282 432,854 2022-10-01HSBC Holdings plc 7.62% 0.01 426,147 338,368 2032-05-17Plains All American Pipeline L.P./PAA Finance Corp. 4.5% 0.01 426,101 426,535 2026-12-15................................................................................................................................................................................................................................................................................................Government National Mortgage Association 3.5% 0.01 426,034 426,372 2043-06-15Merck & Co., Inc 3.7% 0.01 425,956 447,308 2045-02-10Federal Home Loan Mortgage Corporation 4.5% 0.01 425,693 408,007 2040-08-01TIME WARNER INC. 5.35% 0.01 425,635 431,525 2043-12-15Highwoods Realty Limited Partnership 3.62% 0.01 425,396 434,434 2023-01-15................................................................................................................................................................................................................................................................................................Enbridge Incorporation 4.25% 0.01 425,267 422,586 2026-12-01Federal National Mortgage Association 3% 0.01 425,243 427,934 2027-07-01FedEx Corporation 5.1% 0.01 425,007 408,043 2044-01-15Lockheed Martin Corporation 4.85% 0.01 424,910 395,340 2041-09-15Delmarva Power & Light Company 4.15% 0.01 424,586 434,989 2045-05-15................................................................................................................................................................................................................................................................................................Government National Mortgage Association 4% 0.01 424,364 414,017 2046-01-20Citigroup Inc. 5.88% 0.01 424,248 384,946 2033-02-22Commonwealth Edison Company 4.6% 0.01 424,215 403,424 2043-08-15Occidental Petroleum Corporation 4.62% 0.01 423,950 408,043 2045-06-15Arizona Public Service Company 5.05% 0.01 423,838 384,946 2041-09-01................................................................................................................................................................................................................................................................................................Nationwide Financial Services, Inc. 6.75% 0.01 423,787 388,796 2087-05-15Federal Home Loan Mortgage Corporation 2% 0.01 423,622 440,363 2028-07-01Johnson Controls International Plc 5.12% 0.01 423,474 408,043 2045-09-14Federal Home Loan Mortgage Corporation 3.31% 0.01 423,375 424,771 2025-09-25JPMorgan Chase & Co. 2.55% 0.00 422,759 430,484 2021-03-01................................................................................................................................................................................................................................................................................................Northrop Grumman Corporation 2.55% 0.00 422,651 438,383 2022-10-15Federal National Mortgage Association 4% 0.00 422,629 412,293 2032-02-01FEDERAL HOME LN MTG CORP MULTICLASS MTGPARTN CTFS GTD 3.3%
0.00 422,508 431,513 2027-11-25
Citibank Credit Card Issuance Trust 6.15% 0.00 422,493 342,762 2039-06-15United Health Group Incorporated 4.62% 0.00 422,323 402,269 2041-11-15................................................................................................................................................................................................................................................................................................Wells Fargo Capital X 5.95% 0.00 422,190 394,570 2086-12-01Kimberly-Clark Corporation 6.62% 0.00 422,177 321,430 2037-08-01Equinor ASA 3.95% 0.00 421,880 433,065 2043-05-15Commercial Mortgage Trust 2015-Lc19 3.18% 0.00 421,692 431,751 2048-02-10Stanley Black & Decker, Inc. 5.2% 0.00 421,156 384,946 2040-09-01................................................................................................................................................................................................................................................................................................International Paper Company 7.5% 0.00 421,132 379,932 2021-08-15Federal Home Loan Mortgage Corporation 3.24% 0.00 421,131 431,513 2027-08-25Thermo Fisher Scientific Inc 5.3% 0.00 420,967 384,946 2044-02-01Citigroup Inc. 5.5% 0.00 420,743 394,940 2025-09-13Federal National Mortgage Association 4.5% 0.00 420,661 402,378 2039-12-01................................................................................................................................................................................................................................................................................................Federal Home Loan Mortgage Corporation 2.5% 0.00 420,434 435,649 2030-12-01Wf-Rbs Com Mg Tst 4.1% 0.00 420,346 410,144 2047-03-15Hasbro Inc 6.35% 0.00 419,916 384,946 2040-03-15AMERICAN MUN PWR OHIO INC 7.5% 0.00 419,893 300,258 2050-02-15Coca-Cola FEMSA SAB de CV 5.25% 0.00 419,663 384,946 2043-11-26................................................................................................................................................................................................................................................................................................Duke Energy Indiana Inc. 4.9% 0.00 419,629 384,946 2043-07-15Synchrony Credit Card Master Note Trust 2.37% 0.00 419,462 423,792 2023-03-15Virginia Electric and Power Company 4.65% 0.00 419,029 398,804 2043-08-15Citigroup Commercial Mortgage Trust 3.6% 0.00 418,816 418,225 2045-01-10ERP Operating Limited Partnership 4.62% 0.00 418,571 405,998 2021-12-15
©2018 Morningstar, Inc., Morningstar Investment Profiles™ 312-696-6000. All rights reserved. The information contained herein: (1) is proprietary to Morningstar and/or its content providers; (2) maynot be copied or distributed and (3) is not warranted to be accurate, complete or timely. Neither Morningstar nor its content providers are responsible for any damages or losses arising from any use ofinformation. Past performance is no guarantee of future performance. Visit our investment website at www.morningstar.com ß
®
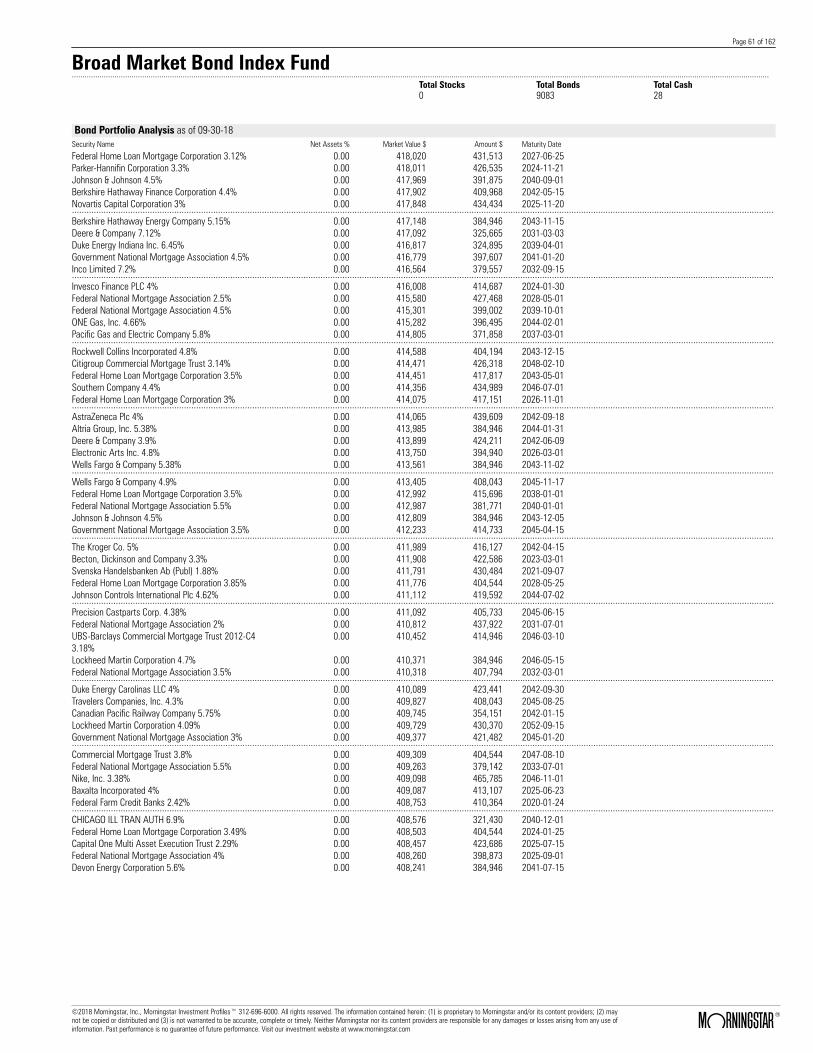
Page 61 of 162
Broad Market Bond Index Fund.......................................................................................................................................................................................................................................................................................................................................
Total Stocks Total Bonds Total Cash0 9083 28
Bond Portfolio Analysis as of 09-30-18Security Name Net Assets % Market Value $ Amount $ Maturity Date
Federal Home Loan Mortgage Corporation 3.12% 0.00 418,020 431,513 2027-06-25Parker-Hannifin Corporation 3.3% 0.00 418,011 426,535 2024-11-21Johnson & Johnson 4.5% 0.00 417,969 391,875 2040-09-01Berkshire Hathaway Finance Corporation 4.4% 0.00 417,902 409,968 2042-05-15Novartis Capital Corporation 3% 0.00 417,848 434,434 2025-11-20................................................................................................................................................................................................................................................................................................Berkshire Hathaway Energy Company 5.15% 0.00 417,148 384,946 2043-11-15Deere & Company 7.12% 0.00 417,092 325,665 2031-03-03Duke Energy Indiana Inc. 6.45% 0.00 416,817 324,895 2039-04-01Government National Mortgage Association 4.5% 0.00 416,779 397,607 2041-01-20Inco Limited 7.2% 0.00 416,564 379,557 2032-09-15................................................................................................................................................................................................................................................................................................Invesco Finance PLC 4% 0.00 416,008 414,687 2024-01-30Federal National Mortgage Association 2.5% 0.00 415,580 427,468 2028-05-01Federal National Mortgage Association 4.5% 0.00 415,301 399,002 2039-10-01ONE Gas, Inc. 4.66% 0.00 415,282 396,495 2044-02-01Pacific Gas and Electric Company 5.8% 0.00 414,805 371,858 2037-03-01................................................................................................................................................................................................................................................................................................Rockwell Collins Incorporated 4.8% 0.00 414,588 404,194 2043-12-15Citigroup Commercial Mortgage Trust 3.14% 0.00 414,471 426,318 2048-02-10Federal Home Loan Mortgage Corporation 3.5% 0.00 414,451 417,817 2043-05-01Southern Company 4.4% 0.00 414,356 434,989 2046-07-01Federal Home Loan Mortgage Corporation 3% 0.00 414,075 417,151 2026-11-01................................................................................................................................................................................................................................................................................................AstraZeneca Plc 4% 0.00 414,065 439,609 2042-09-18Altria Group, Inc. 5.38% 0.00 413,985 384,946 2044-01-31Deere & Company 3.9% 0.00 413,899 424,211 2042-06-09Electronic Arts Inc. 4.8% 0.00 413,750 394,940 2026-03-01Wells Fargo & Company 5.38% 0.00 413,561 384,946 2043-11-02................................................................................................................................................................................................................................................................................................Wells Fargo & Company 4.9% 0.00 413,405 408,043 2045-11-17Federal Home Loan Mortgage Corporation 3.5% 0.00 412,992 415,696 2038-01-01Federal National Mortgage Association 5.5% 0.00 412,987 381,771 2040-01-01Johnson & Johnson 4.5% 0.00 412,809 384,946 2043-12-05Government National Mortgage Association 3.5% 0.00 412,233 414,733 2045-04-15................................................................................................................................................................................................................................................................................................The Kroger Co. 5% 0.00 411,989 416,127 2042-04-15Becton, Dickinson and Company 3.3% 0.00 411,908 422,586 2023-03-01Svenska Handelsbanken Ab (Publ) 1.88% 0.00 411,791 430,484 2021-09-07Federal Home Loan Mortgage Corporation 3.85% 0.00 411,776 404,544 2028-05-25Johnson Controls International Plc 4.62% 0.00 411,112 419,592 2044-07-02................................................................................................................................................................................................................................................................................................Precision Castparts Corp. 4.38% 0.00 411,092 405,733 2045-06-15Federal National Mortgage Association 2% 0.00 410,812 437,922 2031-07-01UBS-Barclays Commercial Mortgage Trust 2012-C43.18%
0.00 410,452 414,946 2046-03-10
Lockheed Martin Corporation 4.7% 0.00 410,371 384,946 2046-05-15Federal National Mortgage Association 3.5% 0.00 410,318 407,794 2032-03-01................................................................................................................................................................................................................................................................................................Duke Energy Carolinas LLC 4% 0.00 410,089 423,441 2042-09-30Travelers Companies, Inc. 4.3% 0.00 409,827 408,043 2045-08-25Canadian Pacific Railway Company 5.75% 0.00 409,745 354,151 2042-01-15Lockheed Martin Corporation 4.09% 0.00 409,729 430,370 2052-09-15Government National Mortgage Association 3% 0.00 409,377 421,482 2045-01-20................................................................................................................................................................................................................................................................................................Commercial Mortgage Trust 3.8% 0.00 409,309 404,544 2047-08-10Federal National Mortgage Association 5.5% 0.00 409,263 379,142 2033-07-01Nike, Inc. 3.38% 0.00 409,098 465,785 2046-11-01Baxalta Incorporated 4% 0.00 409,087 413,107 2025-06-23Federal Farm Credit Banks 2.42% 0.00 408,753 410,364 2020-01-24................................................................................................................................................................................................................................................................................................CHICAGO ILL TRAN AUTH 6.9% 0.00 408,576 321,430 2040-12-01Federal Home Loan Mortgage Corporation 3.49% 0.00 408,503 404,544 2024-01-25Capital One Multi Asset Execution Trust 2.29% 0.00 408,457 423,686 2025-07-15Federal National Mortgage Association 4% 0.00 408,260 398,873 2025-09-01Devon Energy Corporation 5.6% 0.00 408,241 384,946 2041-07-15
©2018 Morningstar, Inc., Morningstar Investment Profiles™ 312-696-6000. All rights reserved. The information contained herein: (1) is proprietary to Morningstar and/or its content providers; (2) maynot be copied or distributed and (3) is not warranted to be accurate, complete or timely. Neither Morningstar nor its content providers are responsible for any damages or losses arising from any use ofinformation. Past performance is no guarantee of future performance. Visit our investment website at www.morningstar.com ß
®

Page 62 of 162
Broad Market Bond Index Fund.......................................................................................................................................................................................................................................................................................................................................
Total Stocks Total Bonds Total Cash0 9083 28
Bond Portfolio Analysis as of 09-30-18Security Name Net Assets % Market Value $ Amount $ Maturity Date
Federal National Mortgage Association 3.51% 0.00 407,977 404,544 2023-12-25General Mills, Inc. 3.65% 0.00 407,959 414,687 2024-02-15Southern Power Company 5.15% 0.00 407,684 404,194 2041-09-15Federal Home Loan Mortgage Corporation 2.65% 0.00 407,535 431,513 2026-08-25Whirlpool Corporation 4.7% 0.00 407,514 394,940 2022-06-01................................................................................................................................................................................................................................................................................................Advance Auto Parts 5.75% 0.00 407,145 394,940 2020-05-01Georgia Power Company 4.75% 0.00 406,878 404,194 2040-09-01Government National Mortgage Association 3.5% 0.00 406,829 407,277 2040-12-15Whirlpool Corporation 4.85% 0.00 406,735 394,940 2021-06-15WFRBS COML MTG TR 3.75% 0.00 406,711 404,544 2057-09-15................................................................................................................................................................................................................................................................................................The Kroger Co. 5.4% 0.00 406,433 396,880 2040-07-15Westar Energy Inc. 4.12% 0.00 406,200 412,662 2042-03-01Federal National Mortgage Association 5% 0.00 406,173 381,731 2041-03-01Government National Mortgage Association 3% 0.00 405,953 415,930 2043-04-15Allergan Funding SCS 4.55% 0.00 405,894 417,282 2035-03-15................................................................................................................................................................................................................................................................................................Florida Power & Light Company 4.12% 0.00 405,833 404,194 2042-02-01State Street Corporation 4.38% 0.00 405,814 394,940 2021-03-07Uruguay (Republic of) 4.5% 0.00 405,801 394,940 2024-08-14San Diego Gas & Electric Company 4.5% 0.00 405,773 398,035 2040-08-15United Health Group Incorporated 3.95% 0.00 405,678 425,366 2042-10-15................................................................................................................................................................................................................................................................................................Toyota Motor Credit Corporation 2.25% 0.00 405,662 430,484 2023-10-18Federal Home Loan Mortgage Corporation 3.65% 0.00 405,657 404,544 2028-02-25Realty Income Corporation 3.25% 0.00 405,474 410,737 2022-10-15Federal Home Loan Mortgage Corporation 2.52% 0.00 405,463 431,513 2026-05-25Cooperatieve Centrale Raiffeisen-Boerenleenbank B.A.,New York Branch 3.38%
0.00 405,411 414,687 2025-05-21
................................................................................................................................................................................................................................................................................................Medtronic, Inc. 4.5% 0.00 405,394 392,645 2042-03-15Tennessee Valley Authority 4.65% 0.00 405,367 360,514 2035-06-15Credit Suisse AG New York Branch 5.4% 0.00 405,334 394,940 2020-01-14RPM International Inc. 4.25% 0.00 405,045 461,936 2048-01-15The Allstate Corporation 5.2% 0.00 404,481 384,946 2042-01-15................................................................................................................................................................................................................................................................................................DXC Technology Company 4.75% 0.00 404,264 394,940 2027-04-15Wells Fargo & Company 4.48% 0.00 404,192 394,940 2024-01-16Philip Morris International Inc. 2.75% 0.00 403,679 434,434 2026-02-25Federal Home Loan Mortgage Corporation 4% 0.00 403,646 398,557 2044-05-01Federal Home Loan Mortgage Corporation 2.99% 0.00 402,941 404,544 2021-09-25................................................................................................................................................................................................................................................................................................NUTRIEN LTD 4.88% 0.00 402,911 394,940 2020-03-30Amgen Inc. 4.5% 0.00 402,870 394,940 2020-03-15Dignity Health 5.27% 0.00 402,639 408,043 2064-11-01Duke Energy Carolinas LLC 3.9% 0.00 402,312 394,940 2021-06-15Republic of Chile 3.86% 0.00 402,269 423,441 2047-06-21................................................................................................................................................................................................................................................................................................Ameren Illinois Company 4.15% 0.00 402,211 408,043 2046-03-15CenterPoint Energy Resources Corp. 4.5% 0.00 402,001 394,940 2021-01-15Comcast Corporation 4.5% 0.00 401,940 418,052 2043-01-15Xcel Energy Inc 4.7% 0.00 401,869 394,940 2020-05-15Halliburton Company 6.7% 0.00 401,775 324,895 2038-09-15................................................................................................................................................................................................................................................................................................Federal National Mortgage Association 5% 0.00 401,743 377,651 2039-10-01Federal National Mortgage Association 5% 0.00 401,522 377,381 2040-09-01Campbell Soup Company 4.25% 0.00 401,353 394,940 2021-04-15CVS Health Corp 4.12% 0.00 401,265 394,940 2021-05-15Aetna, Inc. 4.12% 0.00 401,230 394,940 2021-06-01................................................................................................................................................................................................................................................................................................DXC Technology Company 4.45% 0.00 401,215 394,940 2022-09-18Rio Tinto Finance (USA) Limited 5.2% 0.00 401,148 360,310 2040-11-02Reynolds American Inc. 6.15% 0.00 401,147 359,925 2043-09-15Federal National Mortgage Association 4% 0.00 401,014 394,195 2039-09-01Nordstrom, Inc. 4% 0.00 400,975 394,940 2021-10-15
©2018 Morningstar, Inc., Morningstar Investment Profiles™ 312-696-6000. All rights reserved. The information contained herein: (1) is proprietary to Morningstar and/or its content providers; (2) maynot be copied or distributed and (3) is not warranted to be accurate, complete or timely. Neither Morningstar nor its content providers are responsible for any damages or losses arising from any use ofinformation. Past performance is no guarantee of future performance. Visit our investment website at www.morningstar.com ß
®

Page 63 of 162
Broad Market Bond Index Fund.......................................................................................................................................................................................................................................................................................................................................
Total Stocks Total Bonds Total Cash0 9083 28
Bond Portfolio Analysis as of 09-30-18Security Name Net Assets % Market Value $ Amount $ Maturity Date
Federal Home Loan Mortgage Corporation 3.06% 0.00 400,909 404,544 2023-11-25Ameriprise Financial, Inc. 4% 0.00 400,824 394,940 2023-10-15Georgia Power Company 4.25% 0.00 400,675 394,940 2019-12-01Carnival Corporation 3.95% 0.00 400,593 394,940 2020-10-15Comm 2015-Lc21 Mortagage Trust 3.71% 0.00 400,130 399,340 2048-07-10................................................................................................................................................................................................................................................................................................Federal National Mortgage Association 5.5% 0.00 400,125 368,630 2034-04-01Federal National Mortgage Association 2.38% 0.00 400,051 410,364 2023-01-19Federal Home Loan Mortgage Corporation 2.79% 0.00 399,989 404,544 2022-01-25Fifth Third Bancorp 4.3% 0.00 399,946 394,940 2024-01-16Federal Home Loan Mortgage Corporation 3.37% 0.00 399,768 404,544 2025-07-25................................................................................................................................................................................................................................................................................................Camden Property Trust 4.25% 0.00 399,453 394,940 2024-01-15Federal Home Loan Mortgage Corporation 3.15% 0.00 399,280 404,544 2025-11-25Federal Home Loan Mortgage Corporation 3.3% 0.00 399,217 404,544 2026-10-25Federal Home Loan Mortgage Corporation 3.06% 0.00 399,194 404,544 2024-08-25Thomson Reuters Corp. 3.95% 0.00 399,136 394,940 2021-09-30................................................................................................................................................................................................................................................................................................Keysight Technologies, Inc. 4.55% 0.00 399,103 394,940 2024-10-30PORT AUTH N Y & N J 4.46% 0.00 398,908 384,946 2062-10-01Federal National Mortgage Association 1.5% 0.00 398,833 410,364 2020-11-30Southern California Edison Company 3.88% 0.00 398,719 394,940 2021-06-01Medtronic, Inc. 5.55% 0.00 398,552 342,987 2040-03-15................................................................................................................................................................................................................................................................................................Virginia Electric and Power Company 6.35% 0.00 398,520 317,581 2037-11-30Federal Home Loan Banks 2.12% 0.00 398,391 410,364 2022-06-10Inter-American Development Bank 3.2% 0.00 397,969 412,278 2042-08-07The Coca-Cola Company 3.3% 0.00 397,933 394,940 2021-09-01Federal National Mortgage Association 3% 0.00 397,558 414,957 2046-05-01................................................................................................................................................................................................................................................................................................Federal National Mortgage Association 3.5% 0.00 397,204 396,916 2034-10-01Amgen Inc. 3.62% 0.00 396,994 394,940 2022-05-15Diageo Investment Corporation 4.25% 0.00 396,946 392,645 2042-05-11MORGAN STANLEY BANK OF AMERICA MERRILLLYNCH TRUST 3.18%
0.00 396,697 400,421 2045-08-15
Entergy Arkansas Inc. 3.7% 0.00 396,653 394,940 2024-06-01................................................................................................................................................................................................................................................................................................GS MORTGAGE SECURITIES TRUST 2016-G 2.64% 0.00 396,642 404,544 2049-05-10DTE Electric Company 4% 0.00 396,377 408,813 2043-04-01BPCE SA 4% 0.00 396,323 394,940 2024-04-15PORT AUTH N Y & N J 6.04% 0.00 396,221 332,979 2029-12-01Kentucky Utilities Company 3.25% 0.00 395,967 394,940 2020-11-01................................................................................................................................................................................................................................................................................................Federal Home Loan Mortgage Corporation 3.22% 0.00 395,958 404,544 2027-03-25BlackRock, Inc. 3.5% 0.00 395,846 394,940 2024-03-18Pfizer Inc. 4.4% 0.00 395,769 384,946 2044-05-15Federal National Mortgage Association 3% 0.00 395,361 409,487 2043-03-01DTE Energy Company 3.85% 0.00 395,326 394,940 2023-12-01................................................................................................................................................................................................................................................................................................Republic of Chile 3.25% 0.00 395,224 394,940 2021-09-14Pepsico Capital Resources, Inc. 3.5% 0.00 395,061 394,940 2025-07-17Southwestern Public Service Company 4.5% 0.00 394,984 384,946 2041-08-15African Development Bank 1.25% 0.00 394,980 414,687 2021-07-26Duke Energy Progress Inc 4.1% 0.00 394,913 404,194 2042-05-15................................................................................................................................................................................................................................................................................................Federal National Mortgage Association 2% 0.00 394,747 410,364 2022-10-05Union Pacific Corporation 4.82% 0.00 394,739 371,473 2044-02-01Novartis Capital Corporation 2.4% 0.00 394,677 406,788 2022-05-17Canadian National Railway Company 3.5% 0.00 394,301 441,918 2042-11-15Federal National Mortgage Association 3% 0.00 394,125 401,002 2034-09-01................................................................................................................................................................................................................................................................................................Federal Farm Credit Banks 1.92% 0.00 394,060 410,364 2022-04-19Federal National Mortgage Association 3.5% 0.00 393,971 397,113 2031-12-01Discovery Communications, LLC 4.88% 0.00 393,891 420,361 2043-04-01Federal Home Loan Mortgage Corporation 3.93% 0.00 393,811 384,316 2028-06-25Merck & Co., Inc 4.15% 0.00 393,734 384,946 2043-05-18
©2018 Morningstar, Inc., Morningstar Investment Profiles™ 312-696-6000. All rights reserved. The information contained herein: (1) is proprietary to Morningstar and/or its content providers; (2) maynot be copied or distributed and (3) is not warranted to be accurate, complete or timely. Neither Morningstar nor its content providers are responsible for any damages or losses arising from any use ofinformation. Past performance is no guarantee of future performance. Visit our investment website at www.morningstar.com ß
®
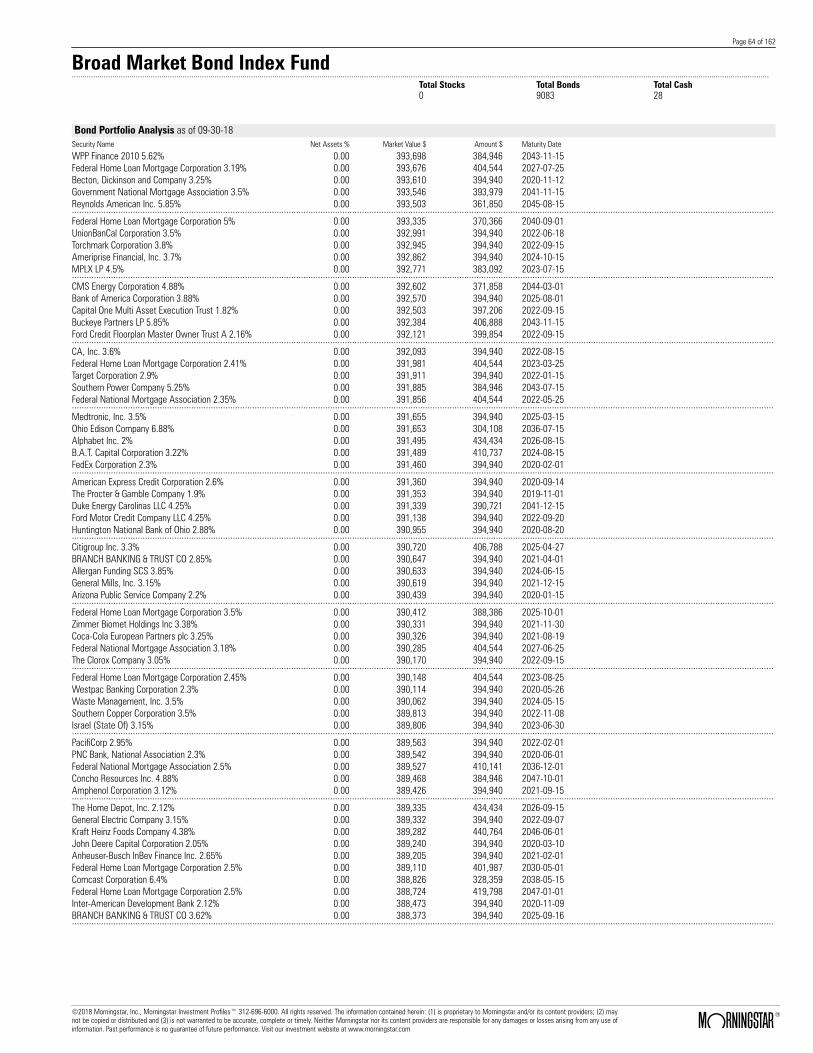
Page 64 of 162
Broad Market Bond Index Fund.......................................................................................................................................................................................................................................................................................................................................
Total Stocks Total Bonds Total Cash0 9083 28
Bond Portfolio Analysis as of 09-30-18Security Name Net Assets % Market Value $ Amount $ Maturity Date
WPP Finance 2010 5.62% 0.00 393,698 384,946 2043-11-15Federal Home Loan Mortgage Corporation 3.19% 0.00 393,676 404,544 2027-07-25Becton, Dickinson and Company 3.25% 0.00 393,610 394,940 2020-11-12Government National Mortgage Association 3.5% 0.00 393,546 393,979 2041-11-15Reynolds American Inc. 5.85% 0.00 393,503 361,850 2045-08-15................................................................................................................................................................................................................................................................................................Federal Home Loan Mortgage Corporation 5% 0.00 393,335 370,366 2040-09-01UnionBanCal Corporation 3.5% 0.00 392,991 394,940 2022-06-18Torchmark Corporation 3.8% 0.00 392,945 394,940 2022-09-15Ameriprise Financial, Inc. 3.7% 0.00 392,862 394,940 2024-10-15MPLX LP 4.5% 0.00 392,771 383,092 2023-07-15................................................................................................................................................................................................................................................................................................CMS Energy Corporation 4.88% 0.00 392,602 371,858 2044-03-01Bank of America Corporation 3.88% 0.00 392,570 394,940 2025-08-01Capital One Multi Asset Execution Trust 1.82% 0.00 392,503 397,206 2022-09-15Buckeye Partners LP 5.85% 0.00 392,384 406,888 2043-11-15Ford Credit Floorplan Master Owner Trust A 2.16% 0.00 392,121 399,854 2022-09-15................................................................................................................................................................................................................................................................................................CA, Inc. 3.6% 0.00 392,093 394,940 2022-08-15Federal Home Loan Mortgage Corporation 2.41% 0.00 391,981 404,544 2023-03-25Target Corporation 2.9% 0.00 391,911 394,940 2022-01-15Southern Power Company 5.25% 0.00 391,885 384,946 2043-07-15Federal National Mortgage Association 2.35% 0.00 391,856 404,544 2022-05-25................................................................................................................................................................................................................................................................................................Medtronic, Inc. 3.5% 0.00 391,655 394,940 2025-03-15Ohio Edison Company 6.88% 0.00 391,653 304,108 2036-07-15Alphabet Inc. 2% 0.00 391,495 434,434 2026-08-15B.A.T. Capital Corporation 3.22% 0.00 391,489 410,737 2024-08-15FedEx Corporation 2.3% 0.00 391,460 394,940 2020-02-01................................................................................................................................................................................................................................................................................................American Express Credit Corporation 2.6% 0.00 391,360 394,940 2020-09-14The Procter & Gamble Company 1.9% 0.00 391,353 394,940 2019-11-01Duke Energy Carolinas LLC 4.25% 0.00 391,339 390,721 2041-12-15Ford Motor Credit Company LLC 4.25% 0.00 391,138 394,940 2022-09-20Huntington National Bank of Ohio 2.88% 0.00 390,955 394,940 2020-08-20................................................................................................................................................................................................................................................................................................Citigroup Inc. 3.3% 0.00 390,720 406,788 2025-04-27BRANCH BANKING & TRUST CO 2.85% 0.00 390,647 394,940 2021-04-01Allergan Funding SCS 3.85% 0.00 390,633 394,940 2024-06-15General Mills, Inc. 3.15% 0.00 390,619 394,940 2021-12-15Arizona Public Service Company 2.2% 0.00 390,439 394,940 2020-01-15................................................................................................................................................................................................................................................................................................Federal Home Loan Mortgage Corporation 3.5% 0.00 390,412 388,386 2025-10-01Zimmer Biomet Holdings Inc 3.38% 0.00 390,331 394,940 2021-11-30Coca-Cola European Partners plc 3.25% 0.00 390,326 394,940 2021-08-19Federal National Mortgage Association 3.18% 0.00 390,285 404,544 2027-06-25The Clorox Company 3.05% 0.00 390,170 394,940 2022-09-15................................................................................................................................................................................................................................................................................................Federal Home Loan Mortgage Corporation 2.45% 0.00 390,148 404,544 2023-08-25Westpac Banking Corporation 2.3% 0.00 390,114 394,940 2020-05-26Waste Management, Inc. 3.5% 0.00 390,062 394,940 2024-05-15Southern Copper Corporation 3.5% 0.00 389,813 394,940 2022-11-08Israel (State Of) 3.15% 0.00 389,806 394,940 2023-06-30................................................................................................................................................................................................................................................................................................PacifiCorp 2.95% 0.00 389,563 394,940 2022-02-01PNC Bank, National Association 2.3% 0.00 389,542 394,940 2020-06-01Federal National Mortgage Association 2.5% 0.00 389,527 410,141 2036-12-01Concho Resources Inc. 4.88% 0.00 389,468 384,946 2047-10-01Amphenol Corporation 3.12% 0.00 389,426 394,940 2021-09-15................................................................................................................................................................................................................................................................................................The Home Depot, Inc. 2.12% 0.00 389,335 434,434 2026-09-15General Electric Company 3.15% 0.00 389,332 394,940 2022-09-07Kraft Heinz Foods Company 4.38% 0.00 389,282 440,764 2046-06-01John Deere Capital Corporation 2.05% 0.00 389,240 394,940 2020-03-10Anheuser-Busch InBev Finance Inc. 2.65% 0.00 389,205 394,940 2021-02-01Federal Home Loan Mortgage Corporation 2.5% 0.00 389,110 401,987 2030-05-01Comcast Corporation 6.4% 0.00 388,826 328,359 2038-05-15Federal Home Loan Mortgage Corporation 2.5% 0.00 388,724 419,798 2047-01-01Inter-American Development Bank 2.12% 0.00 388,473 394,940 2020-11-09BRANCH BANKING & TRUST CO 3.62% 0.00 388,373 394,940 2025-09-16................................................................................................................................................................................................................................................................................................
©2018 Morningstar, Inc., Morningstar Investment Profiles™ 312-696-6000. All rights reserved. The information contained herein: (1) is proprietary to Morningstar and/or its content providers; (2) maynot be copied or distributed and (3) is not warranted to be accurate, complete or timely. Neither Morningstar nor its content providers are responsible for any damages or losses arising from any use ofinformation. Past performance is no guarantee of future performance. Visit our investment website at www.morningstar.com ß
®

Page 65 of 162
Broad Market Bond Index Fund.......................................................................................................................................................................................................................................................................................................................................
Total Stocks Total Bonds Total Cash0 9083 28
Bond Portfolio Analysis as of 09-30-18Security Name Net Assets % Market Value $ Amount $ Maturity Date
Florida Power & Light Company 3.8% 0.00 388,358 408,043 2042-12-15Stryker Corporation 4.62% 0.00 388,278 384,946 2046-03-15Federal National Mortgage Association 3% 0.00 388,276 395,047 2033-04-01Zoetis Inc. 3.25% 0.00 388,121 394,940 2023-02-01Lloyds Banking Group plc 4.65% 0.00 388,046 394,940 2026-03-24................................................................................................................................................................................................................................................................................................Federal Home Loan Mortgage Corporation 4.5% 0.00 387,791 371,682 2041-09-01Sumitomo Mitsui Banking Corporation 2.45% 0.00 387,751 394,940 2020-10-20CBS Corporation 4.85% 0.00 387,714 400,344 2042-07-01General Electric Capital Services, Inc. 7.5% 0.00 387,668 306,032 2035-08-21ABB Finance (USA) Inc. 2.88% 0.00 387,611 394,940 2022-05-08................................................................................................................................................................................................................................................................................................McDonald's Corporation 3.25% 0.00 387,437 394,940 2024-06-10Duke Energy Progress Inc 2.8% 0.00 387,374 394,940 2022-05-15Federal National Mortgage Association 4.5% 0.00 387,045 371,930 2041-06-01Government National Mortgage Association 4.5% 0.00 387,027 369,473 2043-11-20Mid-America Apartments, L.P. 3.75% 0.00 387,013 394,940 2024-06-15................................................................................................................................................................................................................................................................................................Stryker Corporation 3.38% 0.00 386,935 394,940 2024-05-15Morgan Stanley Bank of America Merrill Lynch Trust2013-C10 4.22%
0.00 386,864 377,733 2046-07-15
Zimmer Biomet Holdings Inc 3.15% 0.00 386,849 394,940 2022-04-01International Paper Company 4.4% 0.00 386,809 419,592 2047-08-15Federal National Mortgage Association 3% 0.00 386,657 400,629 2044-01-01................................................................................................................................................................................................................................................................................................ERP Operating Limited Partnership 4.5% 0.00 386,551 384,946 2044-07-01American Electric Power, Inc. 2.15% 0.00 386,520 394,940 2020-11-13eBay Inc. 3.6% 0.00 386,403 406,788 2027-06-05Stanley Black & Decker, Inc. 2.9% 0.00 386,295 394,940 2022-11-01Federal Home Loan Mortgage Corporation 3.5% 0.00 386,194 389,327 2041-01-01................................................................................................................................................................................................................................................................................................Voya Financial Inc 4.8% 0.00 386,132 391,490 2046-06-15Federal Home Loan Mortgage Corporation 3% 0.00 385,986 388,852 2027-11-01PPL Capital Funding Inc. 3.95% 0.00 385,941 387,041 2024-03-15Time Warner Cable Inc. 6.55% 0.00 385,842 355,690 2037-05-01Federal National Mortgage Association 3.5% 0.00 385,476 386,304 2037-02-01................................................................................................................................................................................................................................................................................................Bank of Nova Scotia 2.7% 0.00 385,328 394,940 2022-03-07Korea Development Bank 3% 0.00 384,811 394,940 2022-09-14Georgia Power Company 2.85% 0.00 384,746 394,940 2022-05-15Capital One Multi Asset Execution Trust 1.66% 0.00 384,506 401,019 2024-06-17John Deere Capital Corporation 2.8% 0.00 384,483 394,940 2023-01-27................................................................................................................................................................................................................................................................................................Georgia Power Company 2.4% 0.00 384,434 394,940 2021-04-01Federal Home Loan Mortgage Corporation 2.5% 0.00 384,243 404,692 2037-02-01Tyco Electronics Group SA 3.45% 0.00 384,200 394,940 2024-08-01General Motors Financial Company Inc 4.3% 0.00 384,142 394,940 2025-07-13Government National Mortgage Association 5% 0.00 383,905 366,017 2040-06-15................................................................................................................................................................................................................................................................................................UBS Cml Mtg Tr 4.12% 0.00 383,897 377,574 2051-03-15Praxair, Inc. 2.7% 0.00 383,800 394,940 2023-02-21PPL Capital Funding Inc. 4.7% 0.00 383,773 384,946 2043-06-01Halliburton Company 3.8% 0.00 383,726 387,041 2025-11-15Federal Home Loan Mortgage Corporation 3% 0.00 383,725 391,154 2035-01-01................................................................................................................................................................................................................................................................................................Marriott International, Inc. 3.12% 0.00 383,701 394,940 2023-02-15AXIS Specialty Finance PLC 5.15% 0.00 383,303 396,495 2045-04-01Republic of Chile 3.12% 0.00 383,084 394,940 2025-03-27Kansas City Southern 4.7% 0.00 382,978 384,946 2048-05-01Hess Corporation 4.3% 0.00 382,965 394,940 2027-04-01European Bank For Reconstruction & Development2.12%
0.00 382,880 394,940 2022-03-07
Gilead Sciences, Inc. 4.5% 0.00 382,439 384,946 2045-02-01South Carolina Electric & Gas Company 4.6% 0.00 382,098 384,946 2043-06-15Federal Home Loan Mortgage Corporation 3.5% 0.00 382,001 385,103 2043-04-01Wf-Rbs Commercial Mtg Tst 2012-C7 3.43% 0.00 381,955 382,324 2045-06-15................................................................................................................................................................................................................................................................................................
©2018 Morningstar, Inc., Morningstar Investment Profiles™ 312-696-6000. All rights reserved. The information contained herein: (1) is proprietary to Morningstar and/or its content providers; (2) maynot be copied or distributed and (3) is not warranted to be accurate, complete or timely. Neither Morningstar nor its content providers are responsible for any damages or losses arising from any use ofinformation. Past performance is no guarantee of future performance. Visit our investment website at www.morningstar.com ß
®

Page 66 of 162
Broad Market Bond Index Fund.......................................................................................................................................................................................................................................................................................................................................
Total Stocks Total Bonds Total Cash0 9083 28
Bond Portfolio Analysis as of 09-30-18Security Name Net Assets % Market Value $ Amount $ Maturity Date
Nike, Inc. 3.62% 0.00 381,746 412,278 2043-05-01Humana Inc. 4.62% 0.00 381,155 384,946 2042-12-01Synchrony Financial 4.5% 0.00 381,027 394,940 2025-07-23The Western Union Company 6.2% 0.00 380,809 384,946 2040-06-21Becton, Dickinson and Company 4.67% 0.00 380,738 384,946 2047-06-06................................................................................................................................................................................................................................................................................................MORGAN STANLEY BANK OF AMERICA MERRILLLYNCH TRUST 3.79%
0.00 380,706 377,733 2047-02-15
Public Service Electric and Gas Company 3.95% 0.00 380,681 393,030 2042-05-01Federal National Mortgage Association 5% 0.00 380,455 357,572 2044-11-01Kraft Heinz Foods Company 5% 0.00 380,255 384,946 2035-07-15Lowes Companies, Inc. 4.25% 0.00 380,174 384,946 2044-09-15................................................................................................................................................................................................................................................................................................Federal Home Loan Mortgage Corporation 3% 0.00 380,113 382,938 2027-03-01J.M. Smucker Company 3.5% 0.00 380,062 394,940 2025-03-15Stryker Corporation 3.38% 0.00 379,680 394,940 2025-11-01GS MORTGAGE SECURITIES TRUST 4.27% 0.00 379,516 366,786 2046-11-10Loews Corporation 2.62% 0.00 379,489 394,940 2023-05-15................................................................................................................................................................................................................................................................................................WALMART INC 4% 0.00 379,440 384,946 2043-04-11Public Service Company of Colorado 2.5% 0.00 379,417 394,940 2023-03-15Macy's Retail Holdings, Inc. 4.38% 0.00 379,394 379,142 2023-09-01Federal National Mortgage Association 4% 0.00 379,346 374,477 2041-03-01Pepsico Capital Resources, Inc. 4% 0.00 379,088 384,946 2042-03-05................................................................................................................................................................................................................................................................................................Duke Energy Carolinas LLC 3.88% 0.00 378,954 408,043 2046-03-15JPMorgan Chase & Co. 3.12% 0.00 378,853 394,940 2025-01-23Select Income REIT 4.5% 0.00 378,725 394,940 2025-02-01CMS Energy Corporation 3.45% 0.00 378,602 394,940 2027-08-15Bell Canada 4.46% 0.00 378,556 384,946 2048-04-01................................................................................................................................................................................................................................................................................................Republic of Chile 3.24% 0.00 378,352 394,940 2028-02-06American Honda Finance Corporation 1.7% 0.00 378,207 394,940 2021-09-09Chase Issuance Trust 2.16% 0.00 378,206 394,134 2024-09-15Federal National Mortgage Association 5% 0.00 378,003 355,680 2041-07-01McDonald's Corporation 4.45% 0.00 378,002 384,946 2047-03-01................................................................................................................................................................................................................................................................................................The Cleveland Electric Illuminating Company 5.95% 0.00 377,878 327,204 2036-12-15Csail Commercial Mortgage Trust 3.72% 0.00 377,622 377,733 2048-08-15Amgen Inc. 4.56% 0.00 377,511 384,946 2048-06-15The Home Depot, Inc. 4.25% 0.00 377,432 369,548 2046-04-01Union Pacific Corporation 2.95% 0.00 377,403 387,041 2023-01-15................................................................................................................................................................................................................................................................................................Assurant Inc. 6.75% 0.00 377,328 329,129 2034-02-15Prudential Financial, Inc. 5.2% 0.00 377,246 379,142 2044-03-15Federal Home Loan Mortgage Corporation 3.03% 0.00 376,982 377,137 2020-10-25Lowes Companies, Inc. 3.1% 0.00 376,905 394,940 2027-05-03NUTRIEN LTD 7.12% 0.00 376,866 312,961 2036-05-23................................................................................................................................................................................................................................................................................................Manufacturers and Traders Trust Company 2.9% 0.00 376,575 394,940 2025-02-06Morgan Stanley BAML Trust 3.64% 0.00 376,003 377,574 2048-10-15MetLife Inc. 6.38% 0.00 375,833 311,807 2034-06-15Norsk Hydro A/S 7.75% 0.00 375,783 319,901 2023-06-15Discover Card Execution Note Trust 1.9% 0.00 375,192 381,317 2022-10-17................................................................................................................................................................................................................................................................................................COMM MORTGAGE TRUST 3.96% 0.00 375,161 367,056 2047-02-10MUFG Americas Holdings Corp 3% 0.00 375,069 394,940 2025-02-10Government National Mortgage Association 4.5% 0.00 375,040 358,314 2040-11-20AT&T Inc 4.35% 0.00 374,731 434,989 2045-06-15Entergy Louisiana, LLC 4% 0.00 374,687 373,783 2033-03-15Federal National Mortgage Association 3.5% 0.00 374,666 372,569 2027-01-01WFRBS Commercial Mtg Tst 2011-C2 2.87% 0.00 374,346 382,321 2045-11-15Fomento Econ Mexic 4.38% 0.00 374,044 384,946 2043-05-10Macy's Retail Holdings, Inc. 2.88% 0.00 374,018 394,940 2023-02-15Federal Home Loan Mortgage Corporation 3.5% 0.00 373,718 376,753 2042-04-01................................................................................................................................................................................................................................................................................................
©2018 Morningstar, Inc., Morningstar Investment Profiles™ 312-696-6000. All rights reserved. The information contained herein: (1) is proprietary to Morningstar and/or its content providers; (2) maynot be copied or distributed and (3) is not warranted to be accurate, complete or timely. Neither Morningstar nor its content providers are responsible for any damages or losses arising from any use ofinformation. Past performance is no guarantee of future performance. Visit our investment website at www.morningstar.com ß
®

Page 67 of 162
Broad Market Bond Index Fund.......................................................................................................................................................................................................................................................................................................................................
Total Stocks Total Bonds Total Cash0 9083 28
Bond Portfolio Analysis as of 09-30-18Security Name Net Assets % Market Value $ Amount $ Maturity Date
Union Electric Company 4% 0.00 373,209 384,946 2048-04-01Goldman Sachs Group, Inc. 4.41% 0.00 373,132 384,946 2039-04-23Barclays PLC 5.25% 0.00 373,098 384,946 2045-08-17Federal Home Loan Mortgage Corporation 3.5% 0.00 373,087 371,597 2032-04-01Anheuser-Busch InBev Worldwide Inc. 4.6% 0.00 372,891 384,946 2048-04-15................................................................................................................................................................................................................................................................................................Colgate-Palmolive Company 1.95% 0.00 372,823 394,940 2023-02-01Csail Commercial Mortgage Trust 3.5% 0.00 372,804 377,733 2057-06-15Chase Issuance Trust 1.84% 0.00 372,613 378,669 2022-04-15Anheuser-Busch InBev Worldwide Inc. 3.75% 0.00 372,466 429,985 2042-07-15MStanley Cap I Tr 3.24% 0.00 372,362 374,992 2045-03-15................................................................................................................................................................................................................................................................................................International Bank for Reconstruction and Development2.12%
0.00 372,328 394,940 2025-03-03
COMM 2012 Commercial Mortage Trust 2.82% 0.00 372,241 379,803 2045-10-15Time Warner Cable Inc. 5.5% 0.00 371,882 386,101 2041-09-01ITC Holdings Corporation 3.35% 0.00 371,755 394,940 2027-11-15Federal Home Loan Mortgage Corporation 1.88% 0.00 371,679 380,038 2022-04-25................................................................................................................................................................................................................................................................................................Anthem Inc 4.85% 0.00 371,583 384,946 2054-08-15WELLS FARGO COML MTG TR 2015-C27 3.45% 0.00 371,504 377,035 2048-02-15Commonwealth Edison Company 3.8% 0.00 371,471 396,495 2042-10-01E.I. Du Pont de Nemours and Company 4.15% 0.00 371,265 401,499 2043-02-15AvalonBay Communities, Inc. 2.95% 0.00 371,146 394,940 2026-05-11................................................................................................................................................................................................................................................................................................Federal National Mortgage Association 2.68% 0.00 371,135 397,801 2026-12-25Crown Castle International Corp. 3.65% 0.00 371,062 394,940 2027-09-01Newell Brands Inc. 5.38% 0.00 371,018 384,946 2036-04-01Barclays PLC 3.65% 0.00 370,879 394,940 2025-03-16Morgan Stanley Bank of America Merrill Lynch Trust2012-C6 2.86%
0.00 370,619 377,574 2045-11-15
................................................................................................................................................................................................................................................................................................Republic of Panama 4.3% 0.00 370,511 384,946 2053-04-29Federal Home Loan Mortgage Corporation 3.35% 0.00 370,304 377,574 2028-01-25Federal Home Loan Mortgage Corporation 3% 0.00 370,217 375,723 2033-09-01FedEx Corporation 3.9% 0.00 370,047 393,030 2035-02-01Tennessee Valley Authority 7.12% 0.00 369,704 274,440 2030-05-01................................................................................................................................................................................................................................................................................................Federal National Mortgage Association 3% 0.00 369,660 373,037 2027-03-01JP Morgan Chase Commercial Mortgage SecuritiesCorp 3.14%
0.00 369,617 374,492 2047-12-15
JP Morgan Commercial Mortgage Finance Corp 2.96% 0.00 369,482 377,574 2046-04-15JPMBB COMMERCIAL MORTGAGE SECURITIES TRUST3.49%
0.00 369,467 372,252 2048-01-15
HCP Inc 6.75% 0.00 369,418 299,103 2041-02-01................................................................................................................................................................................................................................................................................................Federal Home Loan Mortgage Corporation 3.5% 0.00 369,187 366,853 2025-11-01Air Lease Corporation 3.25% 0.00 369,169 394,940 2025-03-01Consolidated Edison Company of New York, Inc. 4.2% 0.00 369,094 376,862 2042-03-15Principal Financial Group 4.35% 0.00 368,812 384,946 2043-05-15Federal National Mortgage Association 2.68% 0.00 368,692 373,011 2021-05-25................................................................................................................................................................................................................................................................................................GS Mortgage Securities Corp II 2.77% 0.00 368,484 377,398 2045-11-10Government National Mortgage Association 4.5% 0.00 368,447 353,152 2039-11-15Pacific Gas and Electric Company 4.6% 0.00 368,224 384,946 2043-06-15Wells Fargo Coml Tr 2016-C36 3.06% 0.00 367,945 388,362 2059-11-15Government National Mortgage Association 2.5% 0.00 367,941 392,043 2047-01-20................................................................................................................................................................................................................................................................................................Israel (State Of) 4.12% 0.00 367,685 384,946 2048-01-17Mylan Inc 5.4% 0.00 367,551 384,946 2043-11-29Devon Energy Corporation 4.75% 0.00 367,444 384,946 2042-05-15Rockwell Collins Incorporated 4.35% 0.00 367,366 384,946 2047-04-15Federal Home Loan Mortgage Corporation 3% 0.00 366,277 368,999 2027-06-01State Street Corporation 2.65% 0.00 365,832 394,940 2026-05-19Florida Power & Light Company 5.96% 0.00 365,778 297,179 2039-04-01Keyspan Corp 5.8% 0.00 365,395 320,275 2035-04-01Government National Mortgage Association 5.5% 0.00 365,281 339,898 2038-08-15Seagate HDD Cayman 5.75% 0.00 365,253 403,424 2034-12-01................................................................................................................................................................................................................................................................................................
©2018 Morningstar, Inc., Morningstar Investment Profiles™ 312-696-6000. All rights reserved. The information contained herein: (1) is proprietary to Morningstar and/or its content providers; (2) maynot be copied or distributed and (3) is not warranted to be accurate, complete or timely. Neither Morningstar nor its content providers are responsible for any damages or losses arising from any use ofinformation. Past performance is no guarantee of future performance. Visit our investment website at www.morningstar.com ß
®
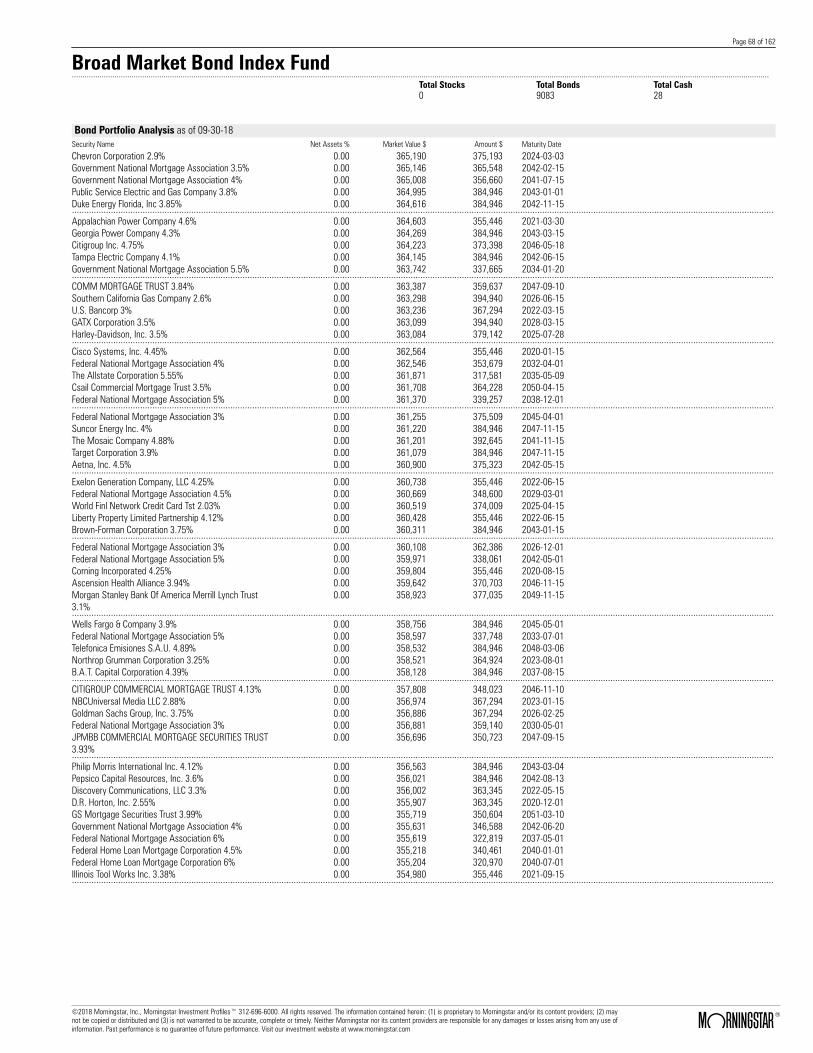
Page 68 of 162
Broad Market Bond Index Fund.......................................................................................................................................................................................................................................................................................................................................
Total Stocks Total Bonds Total Cash0 9083 28
Bond Portfolio Analysis as of 09-30-18Security Name Net Assets % Market Value $ Amount $ Maturity Date
Chevron Corporation 2.9% 0.00 365,190 375,193 2024-03-03Government National Mortgage Association 3.5% 0.00 365,146 365,548 2042-02-15Government National Mortgage Association 4% 0.00 365,008 356,660 2041-07-15Public Service Electric and Gas Company 3.8% 0.00 364,995 384,946 2043-01-01Duke Energy Florida, Inc 3.85% 0.00 364,616 384,946 2042-11-15................................................................................................................................................................................................................................................................................................Appalachian Power Company 4.6% 0.00 364,603 355,446 2021-03-30Georgia Power Company 4.3% 0.00 364,269 384,946 2043-03-15Citigroup Inc. 4.75% 0.00 364,223 373,398 2046-05-18Tampa Electric Company 4.1% 0.00 364,145 384,946 2042-06-15Government National Mortgage Association 5.5% 0.00 363,742 337,665 2034-01-20................................................................................................................................................................................................................................................................................................COMM MORTGAGE TRUST 3.84% 0.00 363,387 359,637 2047-09-10Southern California Gas Company 2.6% 0.00 363,298 394,940 2026-06-15U.S. Bancorp 3% 0.00 363,236 367,294 2022-03-15GATX Corporation 3.5% 0.00 363,099 394,940 2028-03-15Harley-Davidson, Inc. 3.5% 0.00 363,084 379,142 2025-07-28................................................................................................................................................................................................................................................................................................Cisco Systems, Inc. 4.45% 0.00 362,564 355,446 2020-01-15Federal National Mortgage Association 4% 0.00 362,546 353,679 2032-04-01The Allstate Corporation 5.55% 0.00 361,871 317,581 2035-05-09Csail Commercial Mortgage Trust 3.5% 0.00 361,708 364,228 2050-04-15Federal National Mortgage Association 5% 0.00 361,370 339,257 2038-12-01................................................................................................................................................................................................................................................................................................Federal National Mortgage Association 3% 0.00 361,255 375,509 2045-04-01Suncor Energy Inc. 4% 0.00 361,220 384,946 2047-11-15The Mosaic Company 4.88% 0.00 361,201 392,645 2041-11-15Target Corporation 3.9% 0.00 361,079 384,946 2047-11-15Aetna, Inc. 4.5% 0.00 360,900 375,323 2042-05-15................................................................................................................................................................................................................................................................................................Exelon Generation Company, LLC 4.25% 0.00 360,738 355,446 2022-06-15Federal National Mortgage Association 4.5% 0.00 360,669 348,600 2029-03-01World Finl Network Credit Card Tst 2.03% 0.00 360,519 374,009 2025-04-15Liberty Property Limited Partnership 4.12% 0.00 360,428 355,446 2022-06-15Brown-Forman Corporation 3.75% 0.00 360,311 384,946 2043-01-15................................................................................................................................................................................................................................................................................................Federal National Mortgage Association 3% 0.00 360,108 362,386 2026-12-01Federal National Mortgage Association 5% 0.00 359,971 338,061 2042-05-01Corning Incorporated 4.25% 0.00 359,804 355,446 2020-08-15Ascension Health Alliance 3.94% 0.00 359,642 370,703 2046-11-15Morgan Stanley Bank Of America Merrill Lynch Trust3.1%
0.00 358,923 377,035 2049-11-15
................................................................................................................................................................................................................................................................................................Wells Fargo & Company 3.9% 0.00 358,756 384,946 2045-05-01Federal National Mortgage Association 5% 0.00 358,597 337,748 2033-07-01Telefonica Emisiones S.A.U. 4.89% 0.00 358,532 384,946 2048-03-06Northrop Grumman Corporation 3.25% 0.00 358,521 364,924 2023-08-01B.A.T. Capital Corporation 4.39% 0.00 358,128 384,946 2037-08-15................................................................................................................................................................................................................................................................................................CITIGROUP COMMERCIAL MORTGAGE TRUST 4.13% 0.00 357,808 348,023 2046-11-10NBCUniversal Media LLC 2.88% 0.00 356,974 367,294 2023-01-15Goldman Sachs Group, Inc. 3.75% 0.00 356,886 367,294 2026-02-25Federal National Mortgage Association 3% 0.00 356,881 359,140 2030-05-01JPMBB COMMERCIAL MORTGAGE SECURITIES TRUST3.93%
0.00 356,696 350,723 2047-09-15
................................................................................................................................................................................................................................................................................................Philip Morris International Inc. 4.12% 0.00 356,563 384,946 2043-03-04Pepsico Capital Resources, Inc. 3.6% 0.00 356,021 384,946 2042-08-13Discovery Communications, LLC 3.3% 0.00 356,002 363,345 2022-05-15D.R. Horton, Inc. 2.55% 0.00 355,907 363,345 2020-12-01GS Mortgage Securities Trust 3.99% 0.00 355,719 350,604 2051-03-10Government National Mortgage Association 4% 0.00 355,631 346,588 2042-06-20Federal National Mortgage Association 6% 0.00 355,619 322,819 2037-05-01Federal Home Loan Mortgage Corporation 4.5% 0.00 355,218 340,461 2040-01-01Federal Home Loan Mortgage Corporation 6% 0.00 355,204 320,970 2040-07-01Illinois Tool Works Inc. 3.38% 0.00 354,980 355,446 2021-09-15................................................................................................................................................................................................................................................................................................
©2018 Morningstar, Inc., Morningstar Investment Profiles™ 312-696-6000. All rights reserved. The information contained herein: (1) is proprietary to Morningstar and/or its content providers; (2) maynot be copied or distributed and (3) is not warranted to be accurate, complete or timely. Neither Morningstar nor its content providers are responsible for any damages or losses arising from any use ofinformation. Past performance is no guarantee of future performance. Visit our investment website at www.morningstar.com ß
®

Page 69 of 162
Broad Market Bond Index Fund.......................................................................................................................................................................................................................................................................................................................................
Total Stocks Total Bonds Total Cash0 9083 28
Bond Portfolio Analysis as of 09-30-18Security Name Net Assets % Market Value $ Amount $ Maturity Date
American International Group, Inc. 6.25% 0.00 354,094 307,957 2036-05-01Keurig Dr Pepper Inc 4.5% 0.00 353,904 384,946 2045-11-15Comm Mortgage Trust 2014-UBS2 3.96% 0.00 353,749 348,023 2047-03-1021st Century Fox America, Inc. 6.65% 0.00 353,699 267,538 2037-11-15Public Service Company of Colorado 3.6% 0.00 353,681 384,946 2042-09-15................................................................................................................................................................................................................................................................................................Baxalta Incorporated 2.88% 0.00 353,282 356,236 2020-06-23Oneok Partners Lp 6.65% 0.00 352,904 301,413 2036-10-01Quest Diagnostics Incorporated 3.45% 0.00 352,662 371,243 2026-06-01Alibaba Group Holding Ltd 4.4% 0.00 352,484 384,946 2057-12-06Burlington Northern Santa Fe LLC 5.15% 0.00 352,213 314,116 2043-09-01................................................................................................................................................................................................................................................................................................Government National Mortgage Association 3% 0.00 351,952 360,145 2042-11-20Federal Home Loan Mortgage Corporation 6% 0.00 351,892 317,465 2037-05-01Government National Mortgage Association 4.5% 0.00 351,830 334,779 2039-12-15Citigroup Commercial Mortgage Trust 3.72% 0.00 351,708 350,803 2048-09-15Federal Home Loan Mortgage Corporation 3% 0.00 351,542 356,768 2032-04-01................................................................................................................................................................................................................................................................................................Campbell Soup Company 4.8% 0.00 351,086 384,946 2048-03-15American Express Credit Corporation 2.38% 0.00 351,043 355,446 2020-05-26The Boeing Company 1.88% 0.00 350,952 375,193 2023-06-15COMM MORTGAGE TRUST 3.64% 0.00 350,770 350,723 2047-12-10Discover Bank 3.2% 0.00 350,765 355,446 2021-08-09................................................................................................................................................................................................................................................................................................Northern States Power Company 3.4% 0.00 350,427 393,030 2042-08-15PacifiCorp 6.1% 0.00 349,410 284,860 2036-08-01Synchrony Credit Card Master Note Trust 2.62% 0.00 349,044 360,133 2025-10-15JPMDB COMMERCIAL MORTGAGE SECURITIES TRUST3.69%
0.00 348,621 350,604 2050-03-15
South Carolina Electric & Gas Company 6.05% 0.00 348,151 307,957 2038-01-15................................................................................................................................................................................................................................................................................................McCormick & Company, Incorporated 2.7% 0.00 348,136 359,395 2022-08-15WFRBS COMMERCIAL MORTGAGE TRUST 3.92% 0.00 347,999 343,323 2057-10-15Federal National Mortgage Association 3.5% 0.00 347,881 347,629 2036-07-01Federal Realty Investment Trust 3% 0.00 347,693 355,446 2022-08-01Cd Mtg Tr 2017-Cd3 3.63% 0.00 347,268 350,604 2050-02-10................................................................................................................................................................................................................................................................................................Johnson & Johnson 2.25% 0.00 347,040 355,446 2022-03-03Church & Dwight Co., Inc. 3.95% 0.00 346,840 384,946 2047-08-01Government National Mortgage Association 4.5% 0.00 346,536 330,618 2041-02-20Equinor ASA 2.45% 0.00 346,204 359,395 2023-01-17V.F. Corporation 6.45% 0.00 346,182 274,467 2037-11-01................................................................................................................................................................................................................................................................................................Verizon Communications Inc. 4.15% 0.00 346,045 339,648 2024-03-15AbbVie Inc. 2.3% 0.00 345,955 355,446 2021-05-14The Kroger Co. 6.9% 0.00 345,945 290,634 2038-04-15Federal National Mortgage Association 3% 0.00 345,852 364,089 2028-01-25Anheuser-Busch InBev Finance Inc. 4% 0.00 345,614 384,946 2043-01-17................................................................................................................................................................................................................................................................................................Santander UK Group Holdings plc 3.57% 0.00 345,336 355,446 2023-01-10Air Products & Chemicals, Inc. 2.75% 0.00 344,687 355,446 2023-02-03Wf-Rbs Com Mg Tst 3.63% 0.00 344,507 346,942 2047-11-15QVC, Inc. 5.45% 0.00 344,124 384,946 2034-08-15Wells Fargo Commercial Mortgage Trust 2.93% 0.00 344,008 364,089 2048-07-15................................................................................................................................................................................................................................................................................................Jpmbb Commercial Mortgage Securities Trust 2014-C24 3.64%
0.00 344,007 343,862 2047-11-15
Federal Home Loan Mortgage Corporation 4.18% 0.00 343,897 336,580 2020-12-25Roper Technologies Inc 2.8% 0.00 343,484 351,496 2021-12-15FEDERAL HOME LN MTG CORP MULTICLASS MTGPARTN CTFS GTD 3.24%
0.00 342,995 350,604 2027-04-25
Thomson Reuters Corp. 5.5% 0.00 342,903 331,439 2035-08-15Federal National Mortgage Association 5% 0.00 342,684 324,402 2033-11-01Synchrony Credit Card Master Note Trust 1.93% 0.00 342,640 349,541 2023-06-15Federal Home Loan Mortgage Corporation 4% 0.00 342,514 338,597 2045-12-01Bayer US Finance II LLC 4.4% 0.00 342,457 384,946 2044-07-15Eaton Corporation 3.92% 0.00 342,391 384,946 2047-09-15................................................................................................................................................................................................................................................................................................
©2018 Morningstar, Inc., Morningstar Investment Profiles™ 312-696-6000. All rights reserved. The information contained herein: (1) is proprietary to Morningstar and/or its content providers; (2) maynot be copied or distributed and (3) is not warranted to be accurate, complete or timely. Neither Morningstar nor its content providers are responsible for any damages or losses arising from any use ofinformation. Past performance is no guarantee of future performance. Visit our investment website at www.morningstar.com ß
®
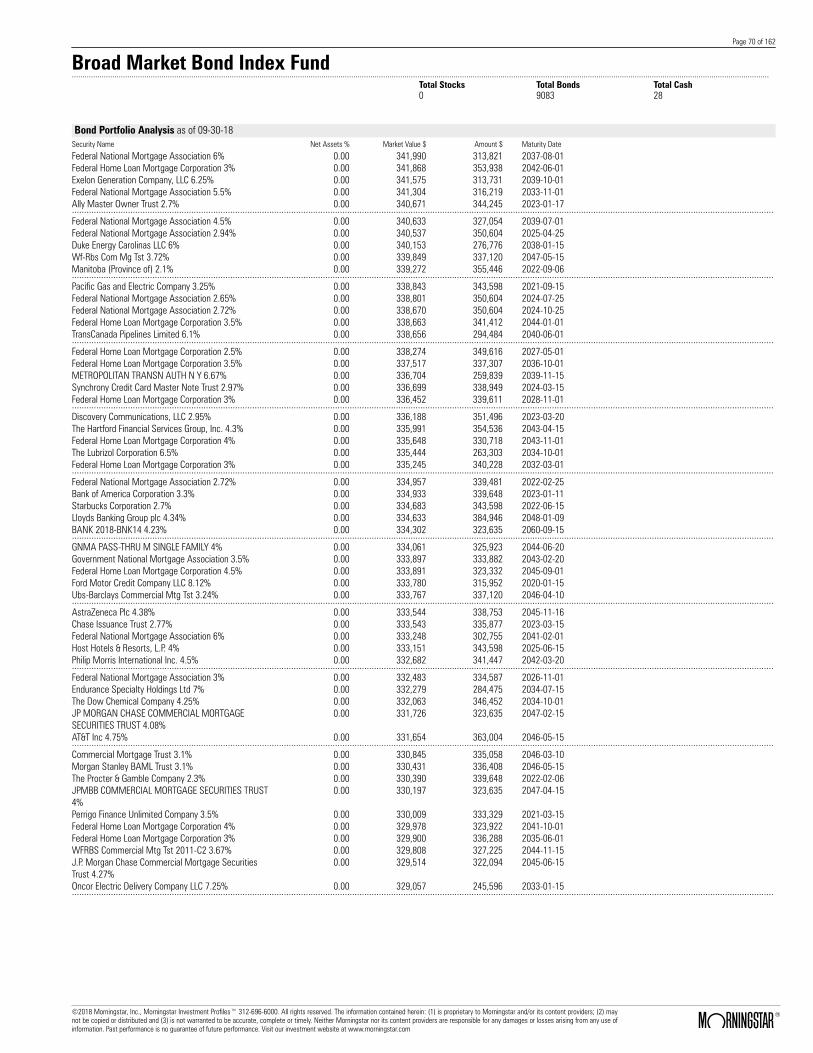
Page 70 of 162
Broad Market Bond Index Fund.......................................................................................................................................................................................................................................................................................................................................
Total Stocks Total Bonds Total Cash0 9083 28
Bond Portfolio Analysis as of 09-30-18Security Name Net Assets % Market Value $ Amount $ Maturity Date
Federal National Mortgage Association 6% 0.00 341,990 313,821 2037-08-01Federal Home Loan Mortgage Corporation 3% 0.00 341,868 353,938 2042-06-01Exelon Generation Company, LLC 6.25% 0.00 341,575 313,731 2039-10-01Federal National Mortgage Association 5.5% 0.00 341,304 316,219 2033-11-01Ally Master Owner Trust 2.7% 0.00 340,671 344,245 2023-01-17................................................................................................................................................................................................................................................................................................Federal National Mortgage Association 4.5% 0.00 340,633 327,054 2039-07-01Federal National Mortgage Association 2.94% 0.00 340,537 350,604 2025-04-25Duke Energy Carolinas LLC 6% 0.00 340,153 276,776 2038-01-15Wf-Rbs Com Mg Tst 3.72% 0.00 339,849 337,120 2047-05-15Manitoba (Province of) 2.1% 0.00 339,272 355,446 2022-09-06................................................................................................................................................................................................................................................................................................Pacific Gas and Electric Company 3.25% 0.00 338,843 343,598 2021-09-15Federal National Mortgage Association 2.65% 0.00 338,801 350,604 2024-07-25Federal National Mortgage Association 2.72% 0.00 338,670 350,604 2024-10-25Federal Home Loan Mortgage Corporation 3.5% 0.00 338,663 341,412 2044-01-01TransCanada Pipelines Limited 6.1% 0.00 338,656 294,484 2040-06-01................................................................................................................................................................................................................................................................................................Federal Home Loan Mortgage Corporation 2.5% 0.00 338,274 349,616 2027-05-01Federal Home Loan Mortgage Corporation 3.5% 0.00 337,517 337,307 2036-10-01METROPOLITAN TRANSN AUTH N Y 6.67% 0.00 336,704 259,839 2039-11-15Synchrony Credit Card Master Note Trust 2.97% 0.00 336,699 338,949 2024-03-15Federal Home Loan Mortgage Corporation 3% 0.00 336,452 339,611 2028-11-01................................................................................................................................................................................................................................................................................................Discovery Communications, LLC 2.95% 0.00 336,188 351,496 2023-03-20The Hartford Financial Services Group, Inc. 4.3% 0.00 335,991 354,536 2043-04-15Federal Home Loan Mortgage Corporation 4% 0.00 335,648 330,718 2043-11-01The Lubrizol Corporation 6.5% 0.00 335,444 263,303 2034-10-01Federal Home Loan Mortgage Corporation 3% 0.00 335,245 340,228 2032-03-01................................................................................................................................................................................................................................................................................................Federal National Mortgage Association 2.72% 0.00 334,957 339,481 2022-02-25Bank of America Corporation 3.3% 0.00 334,933 339,648 2023-01-11Starbucks Corporation 2.7% 0.00 334,683 343,598 2022-06-15Lloyds Banking Group plc 4.34% 0.00 334,633 384,946 2048-01-09BANK 2018-BNK14 4.23% 0.00 334,302 323,635 2060-09-15................................................................................................................................................................................................................................................................................................GNMA PASS-THRU M SINGLE FAMILY 4% 0.00 334,061 325,923 2044-06-20Government National Mortgage Association 3.5% 0.00 333,897 333,882 2043-02-20Federal Home Loan Mortgage Corporation 4.5% 0.00 333,891 323,332 2045-09-01Ford Motor Credit Company LLC 8.12% 0.00 333,780 315,952 2020-01-15Ubs-Barclays Commercial Mtg Tst 3.24% 0.00 333,767 337,120 2046-04-10................................................................................................................................................................................................................................................................................................AstraZeneca Plc 4.38% 0.00 333,544 338,753 2045-11-16Chase Issuance Trust 2.77% 0.00 333,543 335,877 2023-03-15Federal National Mortgage Association 6% 0.00 333,248 302,755 2041-02-01Host Hotels & Resorts, L.P. 4% 0.00 333,151 343,598 2025-06-15Philip Morris International Inc. 4.5% 0.00 332,682 341,447 2042-03-20................................................................................................................................................................................................................................................................................................Federal National Mortgage Association 3% 0.00 332,483 334,587 2026-11-01Endurance Specialty Holdings Ltd 7% 0.00 332,279 284,475 2034-07-15The Dow Chemical Company 4.25% 0.00 332,063 346,452 2034-10-01JP MORGAN CHASE COMMERCIAL MORTGAGESECURITIES TRUST 4.08%
0.00 331,726 323,635 2047-02-15
AT&T Inc 4.75% 0.00 331,654 363,004 2046-05-15................................................................................................................................................................................................................................................................................................Commercial Mortgage Trust 3.1% 0.00 330,845 335,058 2046-03-10Morgan Stanley BAML Trust 3.1% 0.00 330,431 336,408 2046-05-15The Procter & Gamble Company 2.3% 0.00 330,390 339,648 2022-02-06JPMBB COMMERCIAL MORTGAGE SECURITIES TRUST4%
0.00 330,197 323,635 2047-04-15
Perrigo Finance Unlimited Company 3.5% 0.00 330,009 333,329 2021-03-15Federal Home Loan Mortgage Corporation 4% 0.00 329,978 323,922 2041-10-01Federal Home Loan Mortgage Corporation 3% 0.00 329,900 336,288 2035-06-01WFRBS Commercial Mtg Tst 2011-C2 3.67% 0.00 329,808 327,225 2044-11-15J.P. Morgan Chase Commercial Mortgage SecuritiesTrust 4.27%
0.00 329,514 322,094 2045-06-15
Oncor Electric Delivery Company LLC 7.25% 0.00 329,057 245,596 2033-01-15................................................................................................................................................................................................................................................................................................
©2018 Morningstar, Inc., Morningstar Investment Profiles™ 312-696-6000. All rights reserved. The information contained herein: (1) is proprietary to Morningstar and/or its content providers; (2) maynot be copied or distributed and (3) is not warranted to be accurate, complete or timely. Neither Morningstar nor its content providers are responsible for any damages or losses arising from any use ofinformation. Past performance is no guarantee of future performance. Visit our investment website at www.morningstar.com ß
®

Page 71 of 162
Broad Market Bond Index Fund.......................................................................................................................................................................................................................................................................................................................................
Total Stocks Total Bonds Total Cash0 9083 28
Bond Portfolio Analysis as of 09-30-18Security Name Net Assets % Market Value $ Amount $ Maturity Date
Oracle Corporation 4.12% 0.00 328,759 339,138 2045-05-15MARTIN MARIETTA MATERIALS INC 4.25% 0.00 328,750 384,946 2047-12-15Federal National Mortgage Association 3.5% 0.00 328,559 331,190 2042-10-01Morgan Stanley 2.92% 0.00 328,444 335,598 2046-02-15Impac CMB Trust 4.17% 0.00 327,926 321,712 2046-08-15................................................................................................................................................................................................................................................................................................The Johns Hopkins University 4.08% 0.00 327,776 335,673 2053-07-01COMM 2012-CCRE1 Mortgage Trust 3.39% 0.00 327,439 328,665 2045-05-15Federal National Mortgage Association 2.5% 0.00 327,411 351,920 2043-04-01Government National Mortgage Association 3% 0.00 327,199 335,264 2042-12-15Broadcom Corporation/Broadcom Cayman Finance Ltd3%
0.00 327,058 335,699 2022-01-15
................................................................................................................................................................................................................................................................................................Citigroup Commercial Mortgage Trust 3.78% 0.00 326,868 323,793 2058-09-10Florida Power & Light Company 5.62% 0.00 326,518 279,086 2034-04-01Northern States Power Company 4.12% 0.00 326,135 327,974 2044-05-15Citigroup Inc. 4.6% 0.00 325,993 323,851 2026-03-09Federal National Mortgage Association 3% 0.00 325,138 336,925 2043-05-01................................................................................................................................................................................................................................................................................................Commercial Mortgage Trust 3.21% 0.00 324,179 327,426 2046-03-10Government National Mortgage Association 2.5% 0.00 324,143 332,335 2027-12-20Phillips 66 Partners LP 4.9% 0.00 323,832 329,899 2046-10-01Duke Realty Limited Partnership 4.38% 0.00 323,744 315,952 2022-06-15Liberty Property Limited Partnership 4.4% 0.00 323,722 319,901 2024-02-15................................................................................................................................................................................................................................................................................................Federal National Mortgage Association 4.5% 0.00 323,610 311,924 2024-05-01NSTAR Electric Company 4.4% 0.00 323,359 315,656 2044-03-01Federal National Mortgage Association 5.5% 0.00 323,250 298,686 2034-07-01Federal Home Loan Mortgage Corporation 3% 0.00 323,067 327,767 2032-07-01Newell Brands Inc. 4.2% 0.00 323,042 339,648 2026-04-01................................................................................................................................................................................................................................................................................................Federal National Mortgage Association 4.5% 0.00 323,033 309,473 2040-01-01E.I. Du Pont de Nemours and Company 5.6% 0.00 322,745 292,559 2036-12-15Federal National Mortgage Association 3% 0.00 322,693 335,827 2045-07-01NiSource Inc. 5.65% 0.00 322,461 288,710 2045-02-01Intercontinental Exchange Inc 2.35% 0.00 322,417 335,699 2022-09-15................................................................................................................................................................................................................................................................................................Federal Home Loan Mortgage Corporation 5% 0.00 322,412 304,707 2035-08-01Bank of America Corporation 4.1% 0.00 322,246 315,952 2023-07-24Walgreens Boots Alliance, Inc. 4.5% 0.00 322,140 327,204 2034-11-18LOS ANGELES CALIF DEPT WTR & PWR 6.17% 0.00 322,126 307,957 2040-07-01CBS Corporation 3.38% 0.00 322,088 351,496 2028-02-15................................................................................................................................................................................................................................................................................................Federal National Mortgage Association 3.5% 0.00 322,063 320,260 2026-02-01Abbott Laboratories 4.75% 0.00 322,005 302,568 2036-11-30Wells Fargo & Company 5.38% 0.00 321,451 287,555 2035-02-07Federal National Mortgage Association 3.09% 0.00 321,253 337,120 2027-12-25CITIGROUP COMMERCIAL MORTGAGE TRUST 3.15% 0.00 321,096 336,580 2049-11-15................................................................................................................................................................................................................................................................................................Federal National Mortgage Association 3.3% 0.00 320,955 337,120 2029-04-25Benchmark Mortgage Trust 3.67% 0.00 320,759 323,635 2051-01-15Federal Home Loan Mortgage Corporation 2.67% 0.00 320,737 337,120 2026-03-25Federal Home Loan Mortgage Corporation 3.35% 0.00 320,194 323,635 2026-11-25University of Pennsylvania 4.67% 0.00 320,134 316,811 .................................................................................................................................................................................................................................................................................................Oncor Electric Delivery Company LLC 5.3% 0.00 320,084 277,546 2042-06-01JPMBB Commercial Mortgage Securities Trust 4.13% 0.00 319,926 311,499 2046-08-15Federal Home Loan Mortgage Corporation 3% 0.00 319,825 323,635 2024-01-25Humana Inc. 4.95% 0.00 319,794 307,957 2044-10-01Province of Nova Scotia 8.25% 0.00 319,609 276,458 2022-07-30Federal National Mortgage Association 4% 0.00 319,365 311,620 2033-10-01Federal National Mortgage Association 3.5% 0.00 319,362 321,969 2042-12-01Government National Mortgage Association 4.5% 0.00 319,035 306,696 2040-06-15International Paper Company 6% 0.00 318,942 287,170 2041-11-15Ameriprise Financial, Inc. 2.88% 0.00 318,796 343,598 2026-09-15................................................................................................................................................................................................................................................................................................
©2018 Morningstar, Inc., Morningstar Investment Profiles™ 312-696-6000. All rights reserved. The information contained herein: (1) is proprietary to Morningstar and/or its content providers; (2) maynot be copied or distributed and (3) is not warranted to be accurate, complete or timely. Neither Morningstar nor its content providers are responsible for any damages or losses arising from any use ofinformation. Past performance is no guarantee of future performance. Visit our investment website at www.morningstar.com ß
®
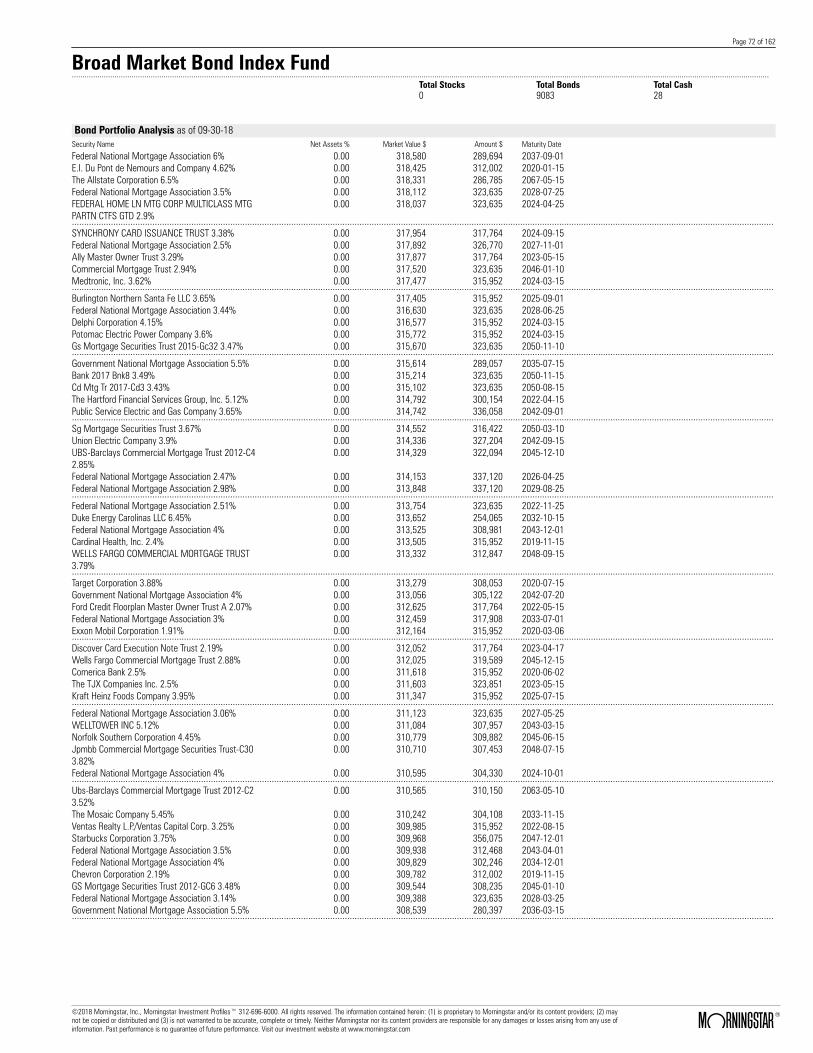
Page 72 of 162
Broad Market Bond Index Fund.......................................................................................................................................................................................................................................................................................................................................
Total Stocks Total Bonds Total Cash0 9083 28
Bond Portfolio Analysis as of 09-30-18Security Name Net Assets % Market Value $ Amount $ Maturity Date
Federal National Mortgage Association 6% 0.00 318,580 289,694 2037-09-01E.I. Du Pont de Nemours and Company 4.62% 0.00 318,425 312,002 2020-01-15The Allstate Corporation 6.5% 0.00 318,331 286,785 2067-05-15Federal National Mortgage Association 3.5% 0.00 318,112 323,635 2028-07-25FEDERAL HOME LN MTG CORP MULTICLASS MTGPARTN CTFS GTD 2.9%
0.00 318,037 323,635 2024-04-25
................................................................................................................................................................................................................................................................................................SYNCHRONY CARD ISSUANCE TRUST 3.38% 0.00 317,954 317,764 2024-09-15Federal National Mortgage Association 2.5% 0.00 317,892 326,770 2027-11-01Ally Master Owner Trust 3.29% 0.00 317,877 317,764 2023-05-15Commercial Mortgage Trust 2.94% 0.00 317,520 323,635 2046-01-10Medtronic, Inc. 3.62% 0.00 317,477 315,952 2024-03-15................................................................................................................................................................................................................................................................................................Burlington Northern Santa Fe LLC 3.65% 0.00 317,405 315,952 2025-09-01Federal National Mortgage Association 3.44% 0.00 316,630 323,635 2028-06-25Delphi Corporation 4.15% 0.00 316,577 315,952 2024-03-15Potomac Electric Power Company 3.6% 0.00 315,772 315,952 2024-03-15Gs Mortgage Securities Trust 2015-Gc32 3.47% 0.00 315,670 323,635 2050-11-10................................................................................................................................................................................................................................................................................................Government National Mortgage Association 5.5% 0.00 315,614 289,057 2035-07-15Bank 2017 Bnk8 3.49% 0.00 315,214 323,635 2050-11-15Cd Mtg Tr 2017-Cd3 3.43% 0.00 315,102 323,635 2050-08-15The Hartford Financial Services Group, Inc. 5.12% 0.00 314,792 300,154 2022-04-15Public Service Electric and Gas Company 3.65% 0.00 314,742 336,058 2042-09-01................................................................................................................................................................................................................................................................................................Sg Mortgage Securities Trust 3.67% 0.00 314,552 316,422 2050-03-10Union Electric Company 3.9% 0.00 314,336 327,204 2042-09-15UBS-Barclays Commercial Mortgage Trust 2012-C42.85%
0.00 314,329 322,094 2045-12-10
Federal National Mortgage Association 2.47% 0.00 314,153 337,120 2026-04-25Federal National Mortgage Association 2.98% 0.00 313,848 337,120 2029-08-25................................................................................................................................................................................................................................................................................................Federal National Mortgage Association 2.51% 0.00 313,754 323,635 2022-11-25Duke Energy Carolinas LLC 6.45% 0.00 313,652 254,065 2032-10-15Federal National Mortgage Association 4% 0.00 313,525 308,981 2043-12-01Cardinal Health, Inc. 2.4% 0.00 313,505 315,952 2019-11-15WELLS FARGO COMMERCIAL MORTGAGE TRUST3.79%
0.00 313,332 312,847 2048-09-15
................................................................................................................................................................................................................................................................................................Target Corporation 3.88% 0.00 313,279 308,053 2020-07-15Government National Mortgage Association 4% 0.00 313,056 305,122 2042-07-20Ford Credit Floorplan Master Owner Trust A 2.07% 0.00 312,625 317,764 2022-05-15Federal National Mortgage Association 3% 0.00 312,459 317,908 2033-07-01Exxon Mobil Corporation 1.91% 0.00 312,164 315,952 2020-03-06................................................................................................................................................................................................................................................................................................Discover Card Execution Note Trust 2.19% 0.00 312,052 317,764 2023-04-17Wells Fargo Commercial Mortgage Trust 2.88% 0.00 312,025 319,589 2045-12-15Comerica Bank 2.5% 0.00 311,618 315,952 2020-06-02The TJX Companies Inc. 2.5% 0.00 311,603 323,851 2023-05-15Kraft Heinz Foods Company 3.95% 0.00 311,347 315,952 2025-07-15................................................................................................................................................................................................................................................................................................Federal National Mortgage Association 3.06% 0.00 311,123 323,635 2027-05-25WELLTOWER INC 5.12% 0.00 311,084 307,957 2043-03-15Norfolk Southern Corporation 4.45% 0.00 310,779 309,882 2045-06-15Jpmbb Commercial Mortgage Securities Trust-C303.82%
0.00 310,710 307,453 2048-07-15
Federal National Mortgage Association 4% 0.00 310,595 304,330 2024-10-01................................................................................................................................................................................................................................................................................................Ubs-Barclays Commercial Mortgage Trust 2012-C23.52%
0.00 310,565 310,150 2063-05-10
The Mosaic Company 5.45% 0.00 310,242 304,108 2033-11-15Ventas Realty L.P./Ventas Capital Corp. 3.25% 0.00 309,985 315,952 2022-08-15Starbucks Corporation 3.75% 0.00 309,968 356,075 2047-12-01Federal National Mortgage Association 3.5% 0.00 309,938 312,468 2043-04-01Federal National Mortgage Association 4% 0.00 309,829 302,246 2034-12-01Chevron Corporation 2.19% 0.00 309,782 312,002 2019-11-15GS Mortgage Securities Trust 2012-GC6 3.48% 0.00 309,544 308,235 2045-01-10Federal National Mortgage Association 3.14% 0.00 309,388 323,635 2028-03-25Government National Mortgage Association 5.5% 0.00 308,539 280,397 2036-03-15................................................................................................................................................................................................................................................................................................
©2018 Morningstar, Inc., Morningstar Investment Profiles™ 312-696-6000. All rights reserved. The information contained herein: (1) is proprietary to Morningstar and/or its content providers; (2) maynot be copied or distributed and (3) is not warranted to be accurate, complete or timely. Neither Morningstar nor its content providers are responsible for any damages or losses arising from any use ofinformation. Past performance is no guarantee of future performance. Visit our investment website at www.morningstar.com ß
®
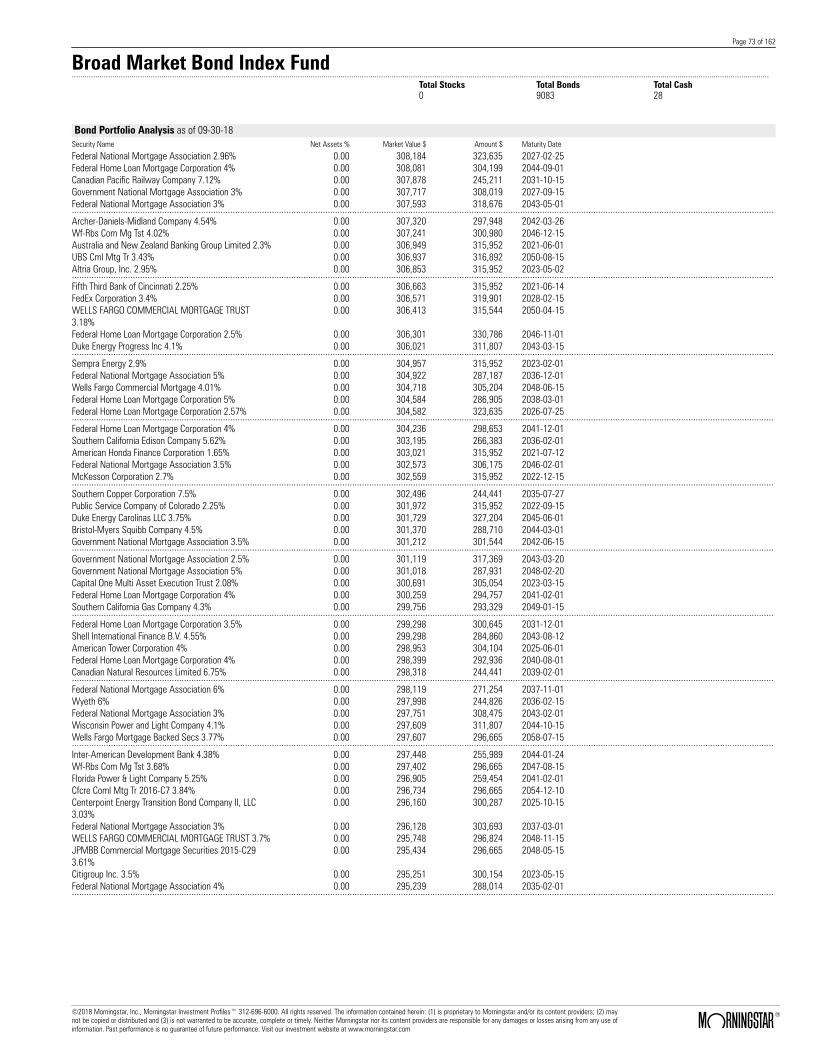
Page 73 of 162
Broad Market Bond Index Fund.......................................................................................................................................................................................................................................................................................................................................
Total Stocks Total Bonds Total Cash0 9083 28
Bond Portfolio Analysis as of 09-30-18Security Name Net Assets % Market Value $ Amount $ Maturity Date
Federal National Mortgage Association 2.96% 0.00 308,184 323,635 2027-02-25Federal Home Loan Mortgage Corporation 4% 0.00 308,081 304,199 2044-09-01Canadian Pacific Railway Company 7.12% 0.00 307,878 245,211 2031-10-15Government National Mortgage Association 3% 0.00 307,717 308,019 2027-09-15Federal National Mortgage Association 3% 0.00 307,593 318,676 2043-05-01................................................................................................................................................................................................................................................................................................Archer-Daniels-Midland Company 4.54% 0.00 307,320 297,948 2042-03-26Wf-Rbs Com Mg Tst 4.02% 0.00 307,241 300,980 2046-12-15Australia and New Zealand Banking Group Limited 2.3% 0.00 306,949 315,952 2021-06-01UBS Cml Mtg Tr 3.43% 0.00 306,937 316,892 2050-08-15Altria Group, Inc. 2.95% 0.00 306,853 315,952 2023-05-02................................................................................................................................................................................................................................................................................................Fifth Third Bank of Cincinnati 2.25% 0.00 306,663 315,952 2021-06-14FedEx Corporation 3.4% 0.00 306,571 319,901 2028-02-15WELLS FARGO COMMERCIAL MORTGAGE TRUST3.18%
0.00 306,413 315,544 2050-04-15
Federal Home Loan Mortgage Corporation 2.5% 0.00 306,301 330,786 2046-11-01Duke Energy Progress Inc 4.1% 0.00 306,021 311,807 2043-03-15................................................................................................................................................................................................................................................................................................Sempra Energy 2.9% 0.00 304,957 315,952 2023-02-01Federal National Mortgage Association 5% 0.00 304,922 287,187 2036-12-01Wells Fargo Commercial Mortgage 4.01% 0.00 304,718 305,204 2048-06-15Federal Home Loan Mortgage Corporation 5% 0.00 304,584 286,905 2038-03-01Federal Home Loan Mortgage Corporation 2.57% 0.00 304,582 323,635 2026-07-25................................................................................................................................................................................................................................................................................................Federal Home Loan Mortgage Corporation 4% 0.00 304,236 298,653 2041-12-01Southern California Edison Company 5.62% 0.00 303,195 266,383 2036-02-01American Honda Finance Corporation 1.65% 0.00 303,021 315,952 2021-07-12Federal National Mortgage Association 3.5% 0.00 302,573 306,175 2046-02-01McKesson Corporation 2.7% 0.00 302,559 315,952 2022-12-15................................................................................................................................................................................................................................................................................................Southern Copper Corporation 7.5% 0.00 302,496 244,441 2035-07-27Public Service Company of Colorado 2.25% 0.00 301,972 315,952 2022-09-15Duke Energy Carolinas LLC 3.75% 0.00 301,729 327,204 2045-06-01Bristol-Myers Squibb Company 4.5% 0.00 301,370 288,710 2044-03-01Government National Mortgage Association 3.5% 0.00 301,212 301,544 2042-06-15................................................................................................................................................................................................................................................................................................Government National Mortgage Association 2.5% 0.00 301,119 317,369 2043-03-20Government National Mortgage Association 5% 0.00 301,018 287,931 2048-02-20Capital One Multi Asset Execution Trust 2.08% 0.00 300,691 305,054 2023-03-15Federal Home Loan Mortgage Corporation 4% 0.00 300,259 294,757 2041-02-01Southern California Gas Company 4.3% 0.00 299,756 293,329 2049-01-15................................................................................................................................................................................................................................................................................................Federal Home Loan Mortgage Corporation 3.5% 0.00 299,298 300,645 2031-12-01Shell International Finance B.V. 4.55% 0.00 299,298 284,860 2043-08-12American Tower Corporation 4% 0.00 298,953 304,104 2025-06-01Federal Home Loan Mortgage Corporation 4% 0.00 298,399 292,936 2040-08-01Canadian Natural Resources Limited 6.75% 0.00 298,318 244,441 2039-02-01................................................................................................................................................................................................................................................................................................Federal National Mortgage Association 6% 0.00 298,119 271,254 2037-11-01Wyeth 6% 0.00 297,998 244,826 2036-02-15Federal National Mortgage Association 3% 0.00 297,751 308,475 2043-02-01Wisconsin Power and Light Company 4.1% 0.00 297,609 311,807 2044-10-15Wells Fargo Mortgage Backed Secs 3.77% 0.00 297,607 296,665 2058-07-15................................................................................................................................................................................................................................................................................................Inter-American Development Bank 4.38% 0.00 297,448 255,989 2044-01-24Wf-Rbs Com Mg Tst 3.68% 0.00 297,402 296,665 2047-08-15Florida Power & Light Company 5.25% 0.00 296,905 259,454 2041-02-01Cfcre Coml Mtg Tr 2016-C7 3.84% 0.00 296,734 296,665 2054-12-10Centerpoint Energy Transition Bond Company II, LLC3.03%
0.00 296,160 300,287 2025-10-15
Federal National Mortgage Association 3% 0.00 296,128 303,693 2037-03-01WELLS FARGO COMMERCIAL MORTGAGE TRUST 3.7% 0.00 295,748 296,824 2048-11-15JPMBB Commercial Mortgage Securities 2015-C293.61%
0.00 295,434 296,665 2048-05-15
Citigroup Inc. 3.5% 0.00 295,251 300,154 2023-05-15Federal National Mortgage Association 4% 0.00 295,239 288,014 2035-02-01................................................................................................................................................................................................................................................................................................
©2018 Morningstar, Inc., Morningstar Investment Profiles™ 312-696-6000. All rights reserved. The information contained herein: (1) is proprietary to Morningstar and/or its content providers; (2) maynot be copied or distributed and (3) is not warranted to be accurate, complete or timely. Neither Morningstar nor its content providers are responsible for any damages or losses arising from any use ofinformation. Past performance is no guarantee of future performance. Visit our investment website at www.morningstar.com ß
®

Page 74 of 162
Broad Market Bond Index Fund.......................................................................................................................................................................................................................................................................................................................................
Total Stocks Total Bonds Total Cash0 9083 28
Bond Portfolio Analysis as of 09-30-18Security Name Net Assets % Market Value $ Amount $ Maturity Date
Morgan Stanley Capital I Inc 3.6% 0.00 294,645 299,362 2049-12-15Union Pacific Corporation 2.75% 0.00 294,478 304,104 2023-04-15Protective Life Corporation 8.45% 0.00 294,428 211,720 2039-10-15PPG Industries, Inc. 2.3% 0.00 294,056 296,205 2019-11-15Wisconsin Electric Power Company 5.7% 0.00 293,653 248,675 2036-12-01................................................................................................................................................................................................................................................................................................Federal Home Loan Mortgage Corporation 6% 0.00 293,495 265,182 2037-08-01National Rural Utilities Cooperative Finance Corporation3.05%
0.00 293,359 296,205 2022-02-15
Virginia Electric and Power Company 3.45% 0.00 292,986 296,205 2024-02-15Federal National Mortgage Association 4% 0.00 292,919 287,911 2040-11-01Government National Mortgage Association 4.5% 0.00 292,791 278,539 2039-11-15................................................................................................................................................................................................................................................................................................JPMBB Commercial Mortgage Securities Trust 2015-C33 3.77%
0.00 291,688 291,422 2048-12-15
Federal Home Loan Mortgage Corporation 3.5% 0.00 291,532 291,264 2036-09-01Arizona Public Service Company 3.35% 0.00 290,836 296,205 2024-06-15Cooperatieve Rabobank U.A. 3.95% 0.00 290,594 292,255 2022-11-09Bank 2017-Bnk4 3.62% 0.00 289,877 293,873 2050-05-15................................................................................................................................................................................................................................................................................................Federal National Mortgage Association 4% 0.00 289,658 284,629 2031-07-01Federal National Mortgage Association 3.5% 0.00 289,613 288,513 2032-08-01Federal National Mortgage Association 5.5% 0.00 289,193 267,718 2033-10-01Government National Mortgage Association 3.5% 0.00 289,189 289,824 2043-03-20Moodys Corp 4.88% 0.00 288,957 276,458 2024-02-15................................................................................................................................................................................................................................................................................................Kinder Morgan Energy Partners LP 6.5% 0.00 288,858 276,458 2020-04-01Synchrony Credit Card Master Note Trust 2.21% 0.00 288,662 296,580 2024-05-15The Procter & Gamble Company 1.85% 0.00 288,477 296,205 2021-02-02Federal Home Loan Mortgage Corporation 4.5% 0.00 288,001 276,072 2039-12-01Federal Home Loan Mortgage Corporation 3.5% 0.00 287,783 290,120 2043-07-01................................................................................................................................................................................................................................................................................................Federal National Mortgage Association 4.5% 0.00 287,737 276,240 2038-06-01Citibank Credit Card Issuance Trust 2.19% 0.00 287,537 296,580 2023-11-20Federal National Mortgage Association 5.5% 0.00 287,458 266,718 2035-09-01Federal National Mortgage Association 3.5% 0.00 287,199 287,702 2036-06-01Boston Properties, Inc. 3.65% 0.00 286,959 296,205 2026-02-01................................................................................................................................................................................................................................................................................................Federal National Mortgage Association 3% 0.00 286,871 289,408 2029-08-01Citigroup Inc. 4.05% 0.00 286,762 284,357 2022-07-30Omnicom Capital Inc 3.62% 0.00 286,673 288,306 2022-05-01Novartis Capital Corporation 2.4% 0.00 286,270 296,205 2022-09-21Kohls Corporation 3.25% 0.00 285,668 296,205 2023-02-01................................................................................................................................................................................................................................................................................................SAN DIEGO CNTY CALIF WTR AUTH 6.14% 0.00 285,311 219,419 2049-05-01Federal National Mortgage Association 3.83% 0.00 285,148 296,665 2043-02-25Capital One Multi Asset Execution Trust 3.01% 0.00 285,096 285,988 2024-02-15Assured Guaranty US Holdings Inc. 5% 0.00 285,018 276,458 2024-07-01WFRBS Coml Mtg Tr 2012-C6 3.44% 0.00 283,464 283,181 2045-04-15................................................................................................................................................................................................................................................................................................Federal National Mortgage Association 4.5% 0.00 283,195 272,134 2041-01-01Federal Home Loan Mortgage Corporation 3.5% 0.00 282,810 285,105 2041-10-01General Mills, Inc. 5.4% 0.00 282,726 271,387 2040-06-15American Express Credit Account Master Trust 3.01% 0.00 282,671 285,988 2025-10-15E.I. Du Pont de Nemours and Company 4.25% 0.00 282,659 276,458 2021-04-01................................................................................................................................................................................................................................................................................................Federal National Mortgage Association 4% 0.00 282,277 277,375 2031-10-01Government National Mortgage Association 4.5% 0.00 281,901 268,817 2039-09-15Federal National Mortgage Association 5% 0.00 281,806 264,863 2040-07-01Wells Fargo Commercial Mortgage Trust 2.65% 0.00 281,639 303,408 2049-08-15Consolidated Edison Company of New York, Inc. 4.45% 0.00 281,624 276,458 2020-06-15United Parcel Service, Inc. 2.4% 0.00 281,293 308,053 2026-11-15Government National Mortgage Association 4% 0.00 281,054 276,241 2039-08-15Air Lease Corporation 2.75% 0.00 280,879 296,205 2023-01-15Morgan Stanley Cap I Tst 2018-H3 4.18% 0.00 280,250 269,696 2051-07-15The Boeing Company 2.2% 0.00 280,155 291,466 2022-10-30................................................................................................................................................................................................................................................................................................
©2018 Morningstar, Inc., Morningstar Investment Profiles™ 312-696-6000. All rights reserved. The information contained herein: (1) is proprietary to Morningstar and/or its content providers; (2) maynot be copied or distributed and (3) is not warranted to be accurate, complete or timely. Neither Morningstar nor its content providers are responsible for any damages or losses arising from any use ofinformation. Past performance is no guarantee of future performance. Visit our investment website at www.morningstar.com ß
®

Page 75 of 162
Broad Market Bond Index Fund.......................................................................................................................................................................................................................................................................................................................................
Total Stocks Total Bonds Total Cash0 9083 28
Bond Portfolio Analysis as of 09-30-18Security Name Net Assets % Market Value $ Amount $ Maturity Date
Enterprise Products Operating LP 3.7% 0.00 280,000 284,357 2026-02-15Cd Commercial Mortage Trust 4.28% 0.00 279,573 269,696 2051-08-15Federal National Mortgage Association 5% 0.00 279,138 262,341 2041-03-01COMM 2013-CCRE11 Mortgage Trust 4.26% 0.00 279,122 269,696 2050-08-10Federal National Mortgage Association 2.58% 0.00 279,087 296,864 2026-03-25................................................................................................................................................................................................................................................................................................Federal Home Loan Mortgage Corporation 3.5% 0.00 279,036 277,456 2032-04-01BPCE SA 2.65% 0.00 278,943 284,357 2021-02-03Bank 2018-Bnk10 4.26% 0.00 278,918 269,696 2061-05-15Corporate Office Properties LP 3.6% 0.00 278,696 288,306 2023-05-15UBS Cml Mtg Tr 4.31% 0.00 278,469 269,696 2051-05-15................................................................................................................................................................................................................................................................................................GS Mortgage Securities Trust 4.18% 0.00 278,317 269,696 2046-07-10JPMBB COMMERCIAL MORTGAGE SECURITIES TRUST4.2%
0.00 277,874 269,696 2047-01-15
Jpmdb Commercial Mortgage Secu 4.21% 0.00 277,748 269,696 2051-06-15Citigroup Incorporation New 4.23% 0.00 277,641 269,696 2051-06-10Wells Fargo Commercial Mortgage Trust 4.22% 0.00 277,609 269,696 2046-07-15................................................................................................................................................................................................................................................................................................Bank 2017-Bnk4 4.22% 0.00 277,528 269,696 2061-08-15Intel Corporation 4% 0.00 277,480 273,312 2032-12-15Washington Real Estate Investment Trust 4.95% 0.00 277,360 272,508 2020-10-01Commercial Mortgage Trust 4.23% 0.00 277,165 269,696 2051-05-10Wf-Rbs Com Mg Tst 4.15% 0.00 276,931 269,696 2046-08-15................................................................................................................................................................................................................................................................................................UBS Cml Mtg Tr 4.24% 0.00 276,716 269,696 2051-06-15Morgan Stanley BAML Trust 4.3% 0.00 276,654 269,696 2046-08-15Government National Mortgage Association 4% 0.00 276,648 270,067 2041-01-15Federal National Mortgage Association 5.62% 0.00 276,571 213,315 2037-07-15Federal Home Loan Mortgage Corporation 5.5% 0.00 276,458 255,575 2035-02-01................................................................................................................................................................................................................................................................................................Wells Fargo Commercial Mortgage Trust 4.18% 0.00 276,427 269,696 2051-06-15Federal National Mortgage Association 5.5% 0.00 276,278 254,612 2033-07-01Benchmark Mortgage Trust 4.12% 0.00 276,273 269,696 2051-07-15Nordstrom, Inc. 7% 0.00 276,245 247,136 2038-01-15American Express Credit Account Master Trust 2.35% 0.00 276,241 285,988 2025-05-15................................................................................................................................................................................................................................................................................................National Retail Properties, Inc. 3.8% 0.00 276,160 276,458 2022-10-15Federal National Mortgage Association 5% 0.00 276,035 259,426 2041-07-01Jpmdb Commercial Mortgage Secu 4.03% 0.00 276,002 269,696 2051-06-15Benchmark Mortgage Trust 3.98% 0.00 275,945 269,696 2051-07-15Duke Energy Florida, Inc 6.35% 0.00 275,840 219,034 2037-09-15................................................................................................................................................................................................................................................................................................CITIGROUP COMMERCIAL MORTGAGE TRUST 4.02% 0.00 275,812 269,696 2047-03-10Government National Mortgage Association 5.5% 0.00 275,740 254,991 2042-02-20Government National Mortgage Association 3.5% 0.00 275,690 276,247 2042-11-20GS MORTGAGE SECURITIES TRUST 4% 0.00 275,430 269,696 2047-04-10Zoetis Inc. 3% 0.00 275,355 296,205 2027-09-12................................................................................................................................................................................................................................................................................................Federal National Mortgage Association 5% 0.00 275,106 258,553 2041-02-01Federal Home Loan Mortgage Corporation 5% 0.00 274,887 258,273 2033-08-01NUTRIEN LTD 5.88% 0.00 274,782 254,065 2036-12-01Wf-Rbs Com Mg Tst 4% 0.00 274,743 269,696 2047-05-15JPMorgan Chase & Co. 2.75% 0.00 274,383 276,458 2020-06-23................................................................................................................................................................................................................................................................................................Commonwealth Edison Company 4.7% 0.00 274,314 257,914 2044-01-15Morgan Stanley 4.12% 0.00 274,309 269,696 2049-07-15Benchmark 2018-B3 Commercial M 4.03% 0.00 274,301 269,696 2051-04-10Realty Income Corporation 4.65% 0.00 274,218 264,610 2023-08-01Benchmark 2018-B3 Commercial M 3.85% 0.00 274,147 269,696 2051-04-10GS Mortgage Securities Corp 4.08% 0.00 274,128 269,696 2045-05-10Becton, Dickinson and Company 2.68% 0.00 274,121 275,668 2019-12-15Southern California Edison Company 2.4% 0.00 274,102 284,357 2022-02-01Bank 2018-Bnk10 4.05% 0.00 273,984 269,696 2061-03-15ConocoPhillips 5.9% 0.00 273,730 232,893 2032-10-15................................................................................................................................................................................................................................................................................................
©2018 Morningstar, Inc., Morningstar Investment Profiles™ 312-696-6000. All rights reserved. The information contained herein: (1) is proprietary to Morningstar and/or its content providers; (2) maynot be copied or distributed and (3) is not warranted to be accurate, complete or timely. Neither Morningstar nor its content providers are responsible for any damages or losses arising from any use ofinformation. Past performance is no guarantee of future performance. Visit our investment website at www.morningstar.com ß
®

Page 76 of 162
Broad Market Bond Index Fund.......................................................................................................................................................................................................................................................................................................................................
Total Stocks Total Bonds Total Cash0 9083 28
Bond Portfolio Analysis as of 09-30-18Security Name Net Assets % Market Value $ Amount $ Maturity Date
International Paper Company 8.7% 0.00 273,720 197,862 2038-06-15GS MORTGAGE SECURITIES CORP 3.86% 0.00 273,680 269,696 2047-06-10Csail Commercial Mortagage Trust 4.03% 0.00 273,473 269,696 2051-04-15Morgan Stanley BAML Trust 3.89% 0.00 273,344 269,696 2047-06-15UBS Commercial Mor 4.17% 0.00 273,259 269,696 2045-05-10................................................................................................................................................................................................................................................................................................Citigroup Commercial Mortgage Trust 4.01% 0.00 273,178 269,696 2051-03-10U.S. Bank National Association 2% 0.00 273,022 276,458 2020-01-24Federal National Mortgage Association 4.5% 0.00 273,009 262,168 2039-04-01COMM MORTGAGE TRUST 3.82% 0.00 272,679 269,696 2047-06-10Commercial Mortgage Trust 2015-PC1 3.9% 0.00 272,644 269,696 2050-07-10................................................................................................................................................................................................................................................................................................Federal National Mortgage Association 3.5% 0.00 272,519 274,694 2031-01-01WELLS FARGO COMMERCIAL MORTGAGE TRUST3.82%
0.00 272,241 269,696 2050-08-15
SAN FRANCISCO CALIF CITY & CNTY PUB UTILSCOMMN 6.95%
0.00 272,240 192,473 2050-11-01
JPMBB COMMERCIAL MORTGAGE SECURITIES TRUST3.77%
0.00 272,107 269,696 2047-08-15
Jpmbb Coml Mortgage Secs Trust 2015-C31 3.8% 0.00 271,918 269,696 2048-08-15................................................................................................................................................................................................................................................................................................JPMBB Commercial Mortgage Securities Trust 3.66% 0.00 271,796 269,696 2045-07-15Wells Fargo Commercial Mortgage Trust 4.01% 0.00 271,783 269,696 2051-03-15UBS Cml Mtg Tr 3.98% 0.00 271,592 269,696 2051-02-15Wells Fargo Commercial Mortgage Trust 2015-Lc223.84%
0.00 271,567 269,696 2058-09-15
Benchmark Mortgage Trust 3.88% 0.00 271,561 269,696 2051-02-15................................................................................................................................................................................................................................................................................................Jpmdb Coml Mtg Sec Tr 2016-C4 3.14% 0.00 271,464 283,181 2049-12-15Federal National Mortgage Association 3% 0.00 271,445 276,181 2034-11-01Comm 2015-Ccre25 Mortgage Trust 3.76% 0.00 271,209 269,696 2048-08-10MStanley Cap I Tr 3.77% 0.00 271,031 269,696 2045-03-15CITIGROUP COMMERCIAL MORTGAGE TRUST 3.62% 0.00 270,831 269,696 2047-07-10................................................................................................................................................................................................................................................................................................Morgan Stanley Bank of America Merrill LynchTrust,2015-C23 3.72%
0.00 270,577 269,696 2050-07-15
WFRBS Coml Mtg Tr 2012-C6 3.84% 0.00 270,498 269,696 2045-04-15Kimberly-Clark Corporation 2.75% 0.00 270,484 288,306 2026-02-15Oncor Electric Delivery Company LLC 7.5% 0.00 270,477 192,473 2038-09-01Commercial Mortgage Trust 2014-Ubs4 3.69% 0.00 270,310 269,696 2047-08-10................................................................................................................................................................................................................................................................................................Government National Mortgage Association 5% 0.00 270,215 253,606 2039-11-20Morgan Stanley BAML Trust 3.73% 0.00 270,154 269,696 2048-05-15JPMBB Commercial Mortgage Securities Trust 2014-C25 3.67%
0.00 270,149 269,696 2047-11-15
Wells Fargo Commercial Trust 2015-C30 3.66% 0.00 270,025 271,145 2048-09-15J.P. Morgan Chase Commercial Mortgage SecuritiesTrust 3.48%
0.00 269,983 269,696 2045-06-15
................................................................................................................................................................................................................................................................................................GS MORTGAGE SECURITIES TRUST 3.63% 0.00 269,659 269,696 2047-11-10COMM MORTGAGE TRUST 3.59% 0.00 269,534 269,696 2047-11-10National Retail Properties, Inc. 3.3% 0.00 269,521 276,458 2023-04-15Federal Home Loan Mortgage Corporation 3.09% 0.00 268,804 269,696 2022-08-25Citigroup ComlMtg 3.72% 0.00 268,652 269,696 2049-12-10................................................................................................................................................................................................................................................................................................WFRBS COMMERCIAL MORTGAGE TRUST 3.61% 0.00 268,547 269,894 2047-11-15Commercial Mortgage Trust 2015-Ccre23 3.53% 0.00 268,474 269,696 2047-12-10Commercial Mortgage 2012-Lc4 3.29% 0.00 268,455 269,696 2044-12-10WELLS FARGO COMMERCIAL MORTGAGE TRUST3.54%
0.00 268,400 269,696 2048-05-15
Wells Fargo Commercial Mortgage 3.64% 0.00 268,343 269,696 2048-06-15................................................................................................................................................................................................................................................................................................eBay Inc. 4% 0.00 268,276 326,050 2042-07-15Government National Mortgage Association 3.5% 0.00 268,081 263,597 2026-04-15Jpmcc Commercial Mortgage Securities 3.72% 0.00 267,968 269,696 2050-03-15CCUBS COML MTG TR 2017-C1 3.31% 0.00 267,914 269,696 2050-11-15WFRBS Commercial Mortgage Trust 2013-C14 3.34% 0.00 267,838 269,696 2046-06-15
©2018 Morningstar, Inc., Morningstar Investment Profiles™ 312-696-6000. All rights reserved. The information contained herein: (1) is proprietary to Morningstar and/or its content providers; (2) maynot be copied or distributed and (3) is not warranted to be accurate, complete or timely. Neither Morningstar nor its content providers are responsible for any damages or losses arising from any use ofinformation. Past performance is no guarantee of future performance. Visit our investment website at www.morningstar.com ß
®

Page 77 of 162
Broad Market Bond Index Fund.......................................................................................................................................................................................................................................................................................................................................
Total Stocks Total Bonds Total Cash0 9083 28
Bond Portfolio Analysis as of 09-30-18Security Name Net Assets % Market Value $ Amount $ Maturity Date
Federal Home Loan Mortgage Corporation 5% 0.00 267,823 253,274 2040-03-01Morgan Stanley BAML Trust 3.53% 0.00 267,731 269,696 2047-12-15Commercial Mortgage Trust 2015-Ccre23 3.5% 0.00 267,723 269,696 2048-05-10Carlyle Gl 2017 3.71% 0.00 267,557 269,696 2050-04-14Citigroup Commercial Mortgage Trust 3.62% 0.00 267,452 269,696 2049-02-10................................................................................................................................................................................................................................................................................................Owens Corning 3.4% 0.00 267,292 291,466 2026-08-15Comm 2006-C8 Mtg 3.15% 0.00 267,168 269,696 2045-08-15Morgan Stanley BAML Trust 3.54% 0.00 267,109 269,696 2049-01-15Government National Mortgage Association 4% 0.00 266,634 259,801 2041-06-20WFRBS Commercial Mtg Tst 2011-C2 3.2% 0.00 266,422 269,696 2048-03-15................................................................................................................................................................................................................................................................................................Federal National Mortgage Association 3.5% 0.00 266,347 268,522 2043-01-01WELLS FARGO COMMERCIAL MORTGAGE TRUST 3.4% 0.00 266,323 269,696 2047-12-15CITIGROUP COMMERCIAL MORTGAGE TRUST 3.02% 0.00 266,257 269,696 2045-09-10Wells Fargo Commercial Mortgage Trust 3.56% 0.00 266,215 269,696 2059-01-15Morgan Stanley BAML Trust 3.13% 0.00 266,163 269,696 2048-12-15................................................................................................................................................................................................................................................................................................COMM 2014-LC17 MORTGAGE TRUST 3.92% 0.00 266,049 261,923 2047-10-10GS Mortgage Securities Corp II 3.14% 0.00 265,819 269,696 2046-06-10Bank 2018-Bnk10 3.69% 0.00 265,652 269,696 2061-02-15J.M. Smucker Company 4.38% 0.00 265,632 288,710 2045-03-15Wf-Rbs Com Mg Tst 3% 0.00 265,607 269,696 2045-08-15................................................................................................................................................................................................................................................................................................UBS Cml Mtg Tr 3.68% 0.00 265,505 269,696 2050-12-15Federal National Mortgage Association 3.02% 0.00 265,192 269,696 2024-08-25WELLS FARGO COMMERCIAL MORTGAGE TRUST3.43%
0.00 265,168 270,092 2048-11-15
COMM MTG TR 2014-TWC 3.31% 0.00 265,079 269,696 2048-03-10Federal National Mortgage Association 4.5% 0.00 265,057 255,481 2043-11-01................................................................................................................................................................................................................................................................................................Wells Fargo Commercial Mortgage Trust 3.58% 0.00 264,868 269,696 2050-10-15LOS ANGELES CALIF DEPT WTR & PWR 6.57% 0.00 264,683 192,473 2045-07-01Synchrony Credit Card Master Note Trust 3.47% 0.00 264,605 264,804 2026-05-15Ford Credit Auto Owner Trust 3.03% 0.00 264,589 264,804 2022-11-15Commercial Mortgage Trust 2015-Dc1 3.35% 0.00 264,574 269,696 2048-02-10................................................................................................................................................................................................................................................................................................REGIONAL TRANSN DIST COLO 5.84% 0.00 264,526 205,946 2050-11-01GS Mortgage Securities Trust 2.94% 0.00 264,446 269,696 2046-02-10Archer-Daniels-Midland Company 3.75% 0.00 264,331 288,710 2047-09-15MStanley Cap I Tr 3.59% 0.00 264,187 269,696 2050-12-15Government National Mortgage Association 5.5% 0.00 264,166 246,180 2038-07-20................................................................................................................................................................................................................................................................................................Westlake Chemical Corporation 3.6% 0.00 264,159 268,559 2022-07-15Praxair, Inc. 4.05% 0.00 264,047 259,080 2021-03-15MORGAN STANLEY BANK OF AMERICA MERRILLLYNCH TRUST 4.04%
0.00 264,045 258,908 2046-11-15
Cfcre Commercial Mortgage Trust 2017-C8 3.57% 0.00 263,976 269,696 2050-06-15Ubs Coml Mtg Tr 2017 3.56% 0.00 263,906 269,696 2050-10-15................................................................................................................................................................................................................................................................................................Packaging Corporation of America 4.5% 0.00 263,852 256,711 2023-11-01Hershey Co (The) 2.3% 0.00 263,430 292,255 2026-08-15Commercial Mortgage Trust 2017 3.51% 0.00 263,327 269,696 2050-09-10Federal Home Loan Mortgage Corporation 2.27% 0.00 263,244 270,505 2022-03-25Jp Morgan Chase Coml Mtg Sec Tst 17 3.49% 0.00 263,172 269,696 2050-07-15................................................................................................................................................................................................................................................................................................Csail Commercial Mortagage Trust 3.5% 0.00 263,093 269,696 2049-11-15Government National Mortgage Association 2.5% 0.00 262,989 280,207 2046-10-20Morgan Stanley BAML Trust 3.54% 0.00 262,947 269,696 2052-11-15Citigroup Commercial Mortgage Trust 3.47% 0.00 262,902 269,696 2050-10-12Citigroup Commercial Mortgage Trust 2015 3.19% 0.00 262,878 269,696 2048-04-10................................................................................................................................................................................................................................................................................................Bank 2017-Bnk9 3.54% 0.00 262,831 269,696 2054-11-15Cd Commercial Mortage Trust 3.46% 0.00 262,765 269,696 2050-11-13Federal National Mortgage Association 2.9% 0.00 262,633 269,696 2025-01-25Macy's Retail Holdings, Inc. 4.5% 0.00 262,586 319,505 2034-12-15Puget Sound Energy Inc. 5.8% 0.00 262,525 215,570 2040-03-15
©2018 Morningstar, Inc., Morningstar Investment Profiles™ 312-696-6000. All rights reserved. The information contained herein: (1) is proprietary to Morningstar and/or its content providers; (2) maynot be copied or distributed and (3) is not warranted to be accurate, complete or timely. Neither Morningstar nor its content providers are responsible for any damages or losses arising from any use ofinformation. Past performance is no guarantee of future performance. Visit our investment website at www.morningstar.com ß
®

Page 78 of 162
Broad Market Bond Index Fund.......................................................................................................................................................................................................................................................................................................................................
Total Stocks Total Bonds Total Cash0 9083 28
Bond Portfolio Analysis as of 09-30-18Security Name Net Assets % Market Value $ Amount $ Maturity Date
Wells Fargo Commercial Mortgage Trust 2.92% 0.00 262,519 267,662 2045-10-15Citigroup Commercial Mortgage Trust 3.33% 0.00 262,515 269,696 2049-04-15Senior Housing Properties Trust 4.75% 0.00 262,514 264,610 2024-05-01JPMBB COMMERCIAL MORTGAGE SECURITIES TRUST3.23%
0.00 262,465 269,696 2048-10-15
GS Mortgage Securities Trust 3.43% 0.00 262,329 269,696 2050-08-10................................................................................................................................................................................................................................................................................................MORGAN STANLEY BAML TR 2015-C20 3.25% 0.00 262,283 269,696 2048-02-15Wells Fargo Commercial Mortgage Trust 3.45% 0.00 262,261 269,696 2050-07-15Morgan Stanley BAML Trust 3.32% 0.00 262,254 269,696 2049-05-15Jpmcc Commercial Mortgage Securities 3.45% 0.00 262,252 269,696 2050-09-15JPMDB Commercial Mortgage Securities Trust 2017-C73.41%
0.00 262,210 269,696 2050-10-15
................................................................................................................................................................................................................................................................................................Citigroup ComlMtg 3.46% 0.00 262,167 269,696 2050-09-15Commercial Mortgage Trust 2.85% 0.00 262,162 269,696 2045-10-15Wells Fargo Commercial Mortgage Trust 3.47% 0.00 262,124 269,696 2050-11-15PacifiCorp 6.25% 0.00 262,058 207,871 2037-10-15LB-UBS Commercial Mortgage Trust 3.47% 0.00 262,021 269,696 2050-11-15................................................................................................................................................................................................................................................................................................Bank 2017 - Bnk7 3.44% 0.00 261,930 269,696 2060-09-15Atmos Energy Corporation 4.12% 0.00 261,881 267,538 2044-10-15Federal National Mortgage Association 3% 0.00 261,822 271,087 2042-10-01WELLS FARGO COMMERCIAL MORTGAGE TRUST3.17%
0.00 261,647 269,696 2048-02-15
WFRBS COMMERCIAL MORTGAGE TRUST 4.04% 0.00 261,640 256,211 2047-03-15................................................................................................................................................................................................................................................................................................Csail Commercial Mortgage Trust 3.46% 0.00 261,619 269,696 2050-11-15Goldman Sachs Group, Inc. 4% 0.00 261,520 260,660 2024-03-03GEORGIA MUN ELEC AUTH 6.66% 0.00 261,518 220,959 2057-04-01Federal National Mortgage Association 2.94% 0.00 261,291 269,696 2026-01-25MUFG Americas Holdings Corp 2.25% 0.00 261,180 264,610 2020-02-10................................................................................................................................................................................................................................................................................................Ford Credit Auto Owner Trust 2.01% 0.00 261,076 264,804 2022-03-15Canadian National Railway Company 2.85% 0.00 260,955 264,610 2021-12-15Wells Fargo Commercial Mortgage Trust 3.42% 0.00 260,953 269,696 2050-09-15CFCRE Commercial Mortgage Trust 3.28% 0.00 260,859 269,696 2058-05-10Federal National Mortgage Association 2.89% 0.00 260,843 269,696 2025-05-25................................................................................................................................................................................................................................................................................................Oesterreichische Kontrollbank Aktiengesellschaft 1.75% 0.00 260,780 264,610 2020-01-24Dbjpm Mtg Tr 2017-C6 3.33% 0.00 260,756 269,696 2050-06-10Government National Mortgage Association 4.5% 0.00 260,746 248,910 2044-01-20Federal Home Loan Mortgage Corporation 5% 0.00 260,740 246,210 2041-04-01TIME WARNER INC. 3.88% 0.00 260,593 268,559 2026-01-15................................................................................................................................................................................................................................................................................................Impac CMB Trust 2.84% 0.00 260,500 266,747 2047-12-15United Health Group Incorporated 2.75% 0.00 260,486 268,559 2023-02-15Government National Mortgage Association 4% 0.00 260,457 253,785 2041-12-20Government National Mortgage Association 3.5% 0.00 260,411 260,698 2042-05-15Citygroup Commercial Mortgage 2015-P1 3.21% 0.00 260,309 269,696 2049-05-10................................................................................................................................................................................................................................................................................................Government National Mortgage Association 2.5% 0.00 259,962 266,530 2027-04-20Federal National Mortgage Association 2.18% 0.00 259,812 269,696 2022-11-25Federal Home Loan Mortgage Corporation 4.5% 0.00 259,493 248,852 2041-10-01Federal National Mortgage Association 2.8% 0.00 259,486 269,696 2025-06-25Bank Amer Merrill Lynch Commercial Mortgage Trust2015-Ubs7 3.17%
0.00 259,438 269,696 2049-07-15
................................................................................................................................................................................................................................................................................................Consolidated Edison, Inc. 2% 0.00 259,429 268,559 2021-05-15AGL Capital Corporation 5.88% 0.00 259,044 227,118 2041-03-15Teco Finance Inc 5.15% 0.00 258,591 252,761 2020-03-15Federal Home Loan Mortgage Corporation 2.5% 0.00 258,519 267,514 2030-11-01Federal National Mortgage Association 3.5% 0.00 258,380 260,934 2045-11-01................................................................................................................................................................................................................................................................................................PacifiCorp 4.1% 0.00 258,380 263,688 2042-02-01Federal National Mortgage Association 2.59% 0.00 258,124 269,696 2024-12-25Pepsico Capital Resources, Inc. 5.5% 0.00 257,840 217,880 2040-01-15Federal National Mortgage Association 3.15% 0.00 257,771 269,696 2028-03-25International Flavors & Fragrances Inc. 5% 0.00 257,499 256,759 2048-09-26
©2018 Morningstar, Inc., Morningstar Investment Profiles™ 312-696-6000. All rights reserved. The information contained herein: (1) is proprietary to Morningstar and/or its content providers; (2) maynot be copied or distributed and (3) is not warranted to be accurate, complete or timely. Neither Morningstar nor its content providers are responsible for any damages or losses arising from any use ofinformation. Past performance is no guarantee of future performance. Visit our investment website at www.morningstar.com ß
®
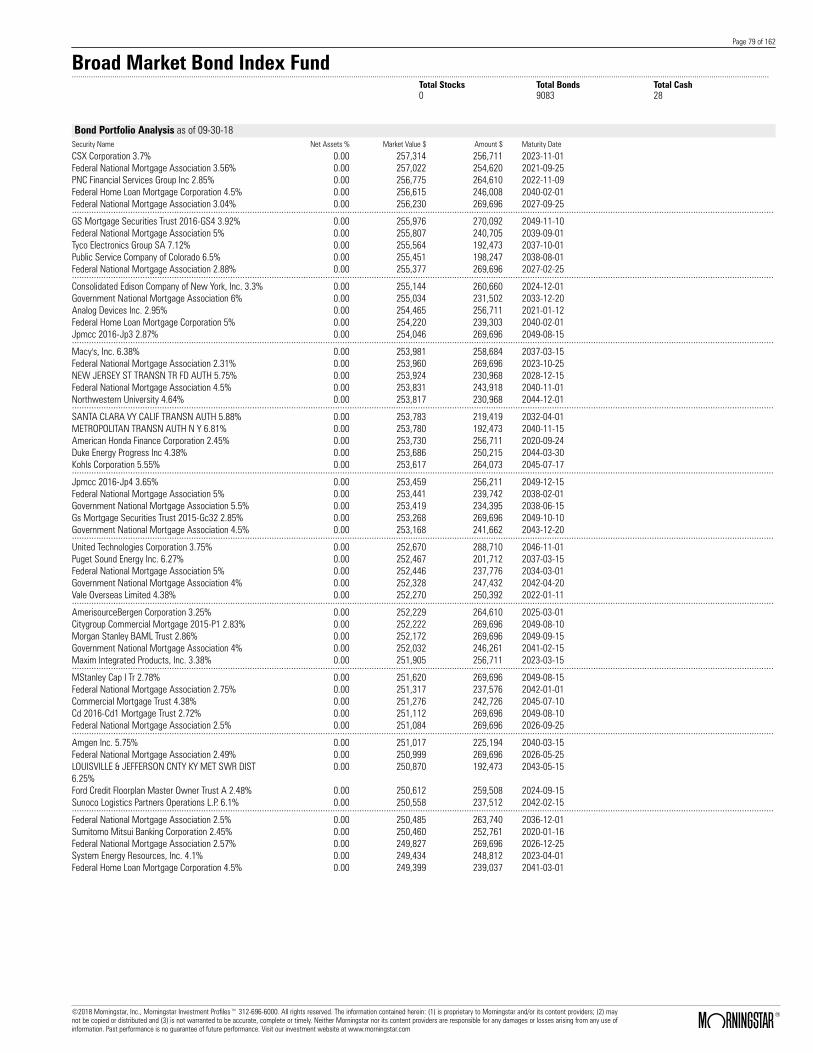
Page 79 of 162
Broad Market Bond Index Fund.......................................................................................................................................................................................................................................................................................................................................
Total Stocks Total Bonds Total Cash0 9083 28
Bond Portfolio Analysis as of 09-30-18Security Name Net Assets % Market Value $ Amount $ Maturity Date
CSX Corporation 3.7% 0.00 257,314 256,711 2023-11-01Federal National Mortgage Association 3.56% 0.00 257,022 254,620 2021-09-25PNC Financial Services Group Inc 2.85% 0.00 256,775 264,610 2022-11-09Federal Home Loan Mortgage Corporation 4.5% 0.00 256,615 246,008 2040-02-01Federal National Mortgage Association 3.04% 0.00 256,230 269,696 2027-09-25................................................................................................................................................................................................................................................................................................GS Mortgage Securities Trust 2016-GS4 3.92% 0.00 255,976 270,092 2049-11-10Federal National Mortgage Association 5% 0.00 255,807 240,705 2039-09-01Tyco Electronics Group SA 7.12% 0.00 255,564 192,473 2037-10-01Public Service Company of Colorado 6.5% 0.00 255,451 198,247 2038-08-01Federal National Mortgage Association 2.88% 0.00 255,377 269,696 2027-02-25................................................................................................................................................................................................................................................................................................Consolidated Edison Company of New York, Inc. 3.3% 0.00 255,144 260,660 2024-12-01Government National Mortgage Association 6% 0.00 255,034 231,502 2033-12-20Analog Devices Inc. 2.95% 0.00 254,465 256,711 2021-01-12Federal Home Loan Mortgage Corporation 5% 0.00 254,220 239,303 2040-02-01Jpmcc 2016-Jp3 2.87% 0.00 254,046 269,696 2049-08-15................................................................................................................................................................................................................................................................................................Macy's, Inc. 6.38% 0.00 253,981 258,684 2037-03-15Federal National Mortgage Association 2.31% 0.00 253,960 269,696 2023-10-25NEW JERSEY ST TRANSN TR FD AUTH 5.75% 0.00 253,924 230,968 2028-12-15Federal National Mortgage Association 4.5% 0.00 253,831 243,918 2040-11-01Northwestern University 4.64% 0.00 253,817 230,968 2044-12-01................................................................................................................................................................................................................................................................................................SANTA CLARA VY CALIF TRANSN AUTH 5.88% 0.00 253,783 219,419 2032-04-01METROPOLITAN TRANSN AUTH N Y 6.81% 0.00 253,780 192,473 2040-11-15American Honda Finance Corporation 2.45% 0.00 253,730 256,711 2020-09-24Duke Energy Progress Inc 4.38% 0.00 253,686 250,215 2044-03-30Kohls Corporation 5.55% 0.00 253,617 264,073 2045-07-17................................................................................................................................................................................................................................................................................................Jpmcc 2016-Jp4 3.65% 0.00 253,459 256,211 2049-12-15Federal National Mortgage Association 5% 0.00 253,441 239,742 2038-02-01Government National Mortgage Association 5.5% 0.00 253,419 234,395 2038-06-15Gs Mortgage Securities Trust 2015-Gc32 2.85% 0.00 253,268 269,696 2049-10-10Government National Mortgage Association 4.5% 0.00 253,168 241,662 2043-12-20................................................................................................................................................................................................................................................................................................United Technologies Corporation 3.75% 0.00 252,670 288,710 2046-11-01Puget Sound Energy Inc. 6.27% 0.00 252,467 201,712 2037-03-15Federal National Mortgage Association 5% 0.00 252,446 237,776 2034-03-01Government National Mortgage Association 4% 0.00 252,328 247,432 2042-04-20Vale Overseas Limited 4.38% 0.00 252,270 250,392 2022-01-11................................................................................................................................................................................................................................................................................................AmerisourceBergen Corporation 3.25% 0.00 252,229 264,610 2025-03-01Citygroup Commercial Mortgage 2015-P1 2.83% 0.00 252,222 269,696 2049-08-10Morgan Stanley BAML Trust 2.86% 0.00 252,172 269,696 2049-09-15Government National Mortgage Association 4% 0.00 252,032 246,261 2041-02-15Maxim Integrated Products, Inc. 3.38% 0.00 251,905 256,711 2023-03-15................................................................................................................................................................................................................................................................................................MStanley Cap I Tr 2.78% 0.00 251,620 269,696 2049-08-15Federal National Mortgage Association 2.75% 0.00 251,317 237,576 2042-01-01Commercial Mortgage Trust 4.38% 0.00 251,276 242,726 2045-07-10Cd 2016-Cd1 Mortgage Trust 2.72% 0.00 251,112 269,696 2049-08-10Federal National Mortgage Association 2.5% 0.00 251,084 269,696 2026-09-25................................................................................................................................................................................................................................................................................................Amgen Inc. 5.75% 0.00 251,017 225,194 2040-03-15Federal National Mortgage Association 2.49% 0.00 250,999 269,696 2026-05-25LOUISVILLE & JEFFERSON CNTY KY MET SWR DIST6.25%
0.00 250,870 192,473 2043-05-15
Ford Credit Floorplan Master Owner Trust A 2.48% 0.00 250,612 259,508 2024-09-15Sunoco Logistics Partners Operations L.P. 6.1% 0.00 250,558 237,512 2042-02-15................................................................................................................................................................................................................................................................................................Federal National Mortgage Association 2.5% 0.00 250,485 263,740 2036-12-01Sumitomo Mitsui Banking Corporation 2.45% 0.00 250,460 252,761 2020-01-16Federal National Mortgage Association 2.57% 0.00 249,827 269,696 2026-12-25System Energy Resources, Inc. 4.1% 0.00 249,434 248,812 2023-04-01Federal Home Loan Mortgage Corporation 4.5% 0.00 249,399 239,037 2041-03-01
©2018 Morningstar, Inc., Morningstar Investment Profiles™ 312-696-6000. All rights reserved. The information contained herein: (1) is proprietary to Morningstar and/or its content providers; (2) maynot be copied or distributed and (3) is not warranted to be accurate, complete or timely. Neither Morningstar nor its content providers are responsible for any damages or losses arising from any use ofinformation. Past performance is no guarantee of future performance. Visit our investment website at www.morningstar.com ß
®
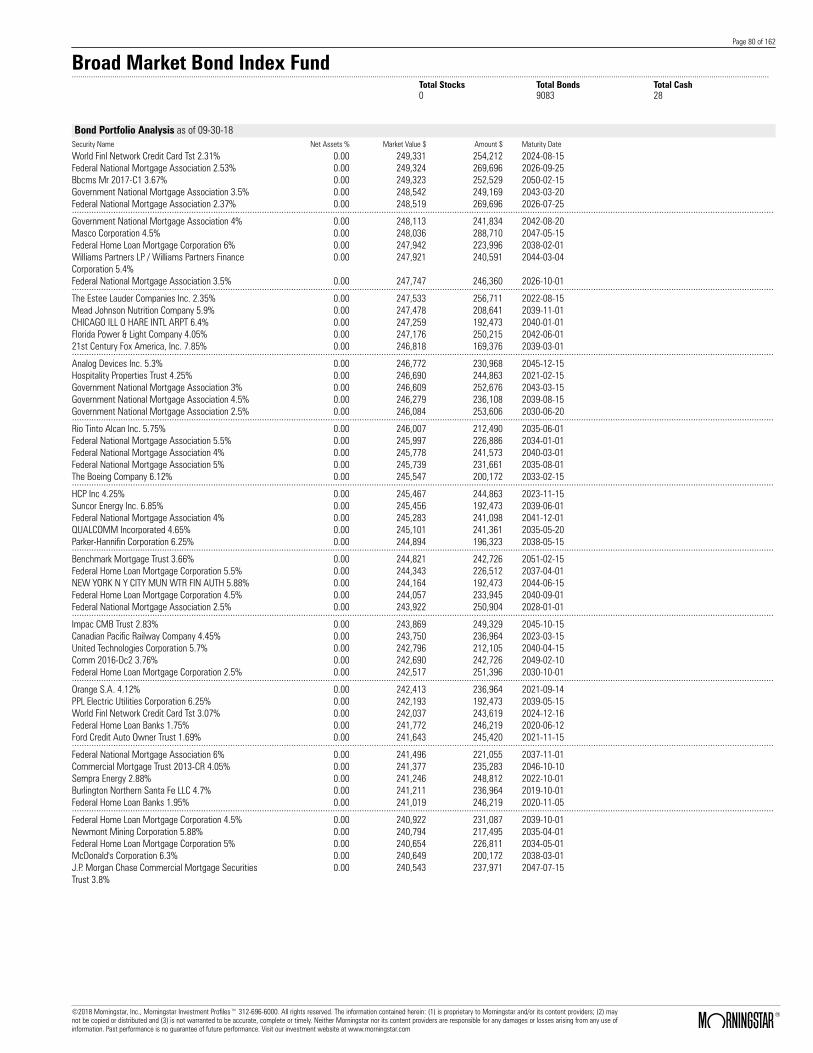
Page 80 of 162
Broad Market Bond Index Fund.......................................................................................................................................................................................................................................................................................................................................
Total Stocks Total Bonds Total Cash0 9083 28
Bond Portfolio Analysis as of 09-30-18Security Name Net Assets % Market Value $ Amount $ Maturity Date
World Finl Network Credit Card Tst 2.31% 0.00 249,331 254,212 2024-08-15Federal National Mortgage Association 2.53% 0.00 249,324 269,696 2026-09-25Bbcms Mr 2017-C1 3.67% 0.00 249,323 252,529 2050-02-15Government National Mortgage Association 3.5% 0.00 248,542 249,169 2043-03-20Federal National Mortgage Association 2.37% 0.00 248,519 269,696 2026-07-25................................................................................................................................................................................................................................................................................................Government National Mortgage Association 4% 0.00 248,113 241,834 2042-08-20Masco Corporation 4.5% 0.00 248,036 288,710 2047-05-15Federal Home Loan Mortgage Corporation 6% 0.00 247,942 223,996 2038-02-01Williams Partners LP / Williams Partners FinanceCorporation 5.4%
0.00 247,921 240,591 2044-03-04
Federal National Mortgage Association 3.5% 0.00 247,747 246,360 2026-10-01................................................................................................................................................................................................................................................................................................The Estee Lauder Companies Inc. 2.35% 0.00 247,533 256,711 2022-08-15Mead Johnson Nutrition Company 5.9% 0.00 247,478 208,641 2039-11-01CHICAGO ILL O HARE INTL ARPT 6.4% 0.00 247,259 192,473 2040-01-01Florida Power & Light Company 4.05% 0.00 247,176 250,215 2042-06-0121st Century Fox America, Inc. 7.85% 0.00 246,818 169,376 2039-03-01................................................................................................................................................................................................................................................................................................Analog Devices Inc. 5.3% 0.00 246,772 230,968 2045-12-15Hospitality Properties Trust 4.25% 0.00 246,690 244,863 2021-02-15Government National Mortgage Association 3% 0.00 246,609 252,676 2043-03-15Government National Mortgage Association 4.5% 0.00 246,279 236,108 2039-08-15Government National Mortgage Association 2.5% 0.00 246,084 253,606 2030-06-20................................................................................................................................................................................................................................................................................................Rio Tinto Alcan Inc. 5.75% 0.00 246,007 212,490 2035-06-01Federal National Mortgage Association 5.5% 0.00 245,997 226,886 2034-01-01Federal National Mortgage Association 4% 0.00 245,778 241,573 2040-03-01Federal National Mortgage Association 5% 0.00 245,739 231,661 2035-08-01The Boeing Company 6.12% 0.00 245,547 200,172 2033-02-15................................................................................................................................................................................................................................................................................................HCP Inc 4.25% 0.00 245,467 244,863 2023-11-15Suncor Energy Inc. 6.85% 0.00 245,456 192,473 2039-06-01Federal National Mortgage Association 4% 0.00 245,283 241,098 2041-12-01QUALCOMM Incorporated 4.65% 0.00 245,101 241,361 2035-05-20Parker-Hannifin Corporation 6.25% 0.00 244,894 196,323 2038-05-15................................................................................................................................................................................................................................................................................................Benchmark Mortgage Trust 3.66% 0.00 244,821 242,726 2051-02-15Federal Home Loan Mortgage Corporation 5.5% 0.00 244,343 226,512 2037-04-01NEW YORK N Y CITY MUN WTR FIN AUTH 5.88% 0.00 244,164 192,473 2044-06-15Federal Home Loan Mortgage Corporation 4.5% 0.00 244,057 233,945 2040-09-01Federal National Mortgage Association 2.5% 0.00 243,922 250,904 2028-01-01................................................................................................................................................................................................................................................................................................Impac CMB Trust 2.83% 0.00 243,869 249,329 2045-10-15Canadian Pacific Railway Company 4.45% 0.00 243,750 236,964 2023-03-15United Technologies Corporation 5.7% 0.00 242,796 212,105 2040-04-15Comm 2016-Dc2 3.76% 0.00 242,690 242,726 2049-02-10Federal Home Loan Mortgage Corporation 2.5% 0.00 242,517 251,396 2030-10-01................................................................................................................................................................................................................................................................................................Orange S.A. 4.12% 0.00 242,413 236,964 2021-09-14PPL Electric Utilities Corporation 6.25% 0.00 242,193 192,473 2039-05-15World Finl Network Credit Card Tst 3.07% 0.00 242,037 243,619 2024-12-16Federal Home Loan Banks 1.75% 0.00 241,772 246,219 2020-06-12Ford Credit Auto Owner Trust 1.69% 0.00 241,643 245,420 2021-11-15................................................................................................................................................................................................................................................................................................Federal National Mortgage Association 6% 0.00 241,496 221,055 2037-11-01Commercial Mortgage Trust 2013-CR 4.05% 0.00 241,377 235,283 2046-10-10Sempra Energy 2.88% 0.00 241,246 248,812 2022-10-01Burlington Northern Santa Fe LLC 4.7% 0.00 241,211 236,964 2019-10-01Federal Home Loan Banks 1.95% 0.00 241,019 246,219 2020-11-05................................................................................................................................................................................................................................................................................................Federal Home Loan Mortgage Corporation 4.5% 0.00 240,922 231,087 2039-10-01Newmont Mining Corporation 5.88% 0.00 240,794 217,495 2035-04-01Federal Home Loan Mortgage Corporation 5% 0.00 240,654 226,811 2034-05-01McDonald's Corporation 6.3% 0.00 240,649 200,172 2038-03-01J.P. Morgan Chase Commercial Mortgage SecuritiesTrust 3.8%
0.00 240,543 237,971 2047-07-15
©2018 Morningstar, Inc., Morningstar Investment Profiles™ 312-696-6000. All rights reserved. The information contained herein: (1) is proprietary to Morningstar and/or its content providers; (2) maynot be copied or distributed and (3) is not warranted to be accurate, complete or timely. Neither Morningstar nor its content providers are responsible for any damages or losses arising from any use ofinformation. Past performance is no guarantee of future performance. Visit our investment website at www.morningstar.com ß
®

Page 81 of 162
Broad Market Bond Index Fund.......................................................................................................................................................................................................................................................................................................................................
Total Stocks Total Bonds Total Cash0 9083 28
Bond Portfolio Analysis as of 09-30-18Security Name Net Assets % Market Value $ Amount $ Maturity Date
Florida Power & Light Company 5.65% 0.00 240,079 205,946 2037-02-01Government National Mortgage Association 3.5% 0.00 239,900 239,594 2041-10-20EAST BAY CALIF MUN UTIL DIST 5.87% 0.00 239,181 192,473 2040-06-01Government National Mortgage Association 4% 0.00 239,101 233,581 2040-09-15BorgWarner Inc. 4.38% 0.00 239,036 253,680 2045-03-15................................................................................................................................................................................................................................................................................................Government National Mortgage Association 6% 0.00 238,990 216,262 2037-07-20Pioneer Natural Resources Company 3.95% 0.00 238,907 236,964 2022-07-15Bank Amer Merrill Lynch Commercial Mortgage Trust2015-Ubs7 2.72%
0.00 238,797 242,726 2049-07-15
Government National Mortgage Association 4.5% 0.00 238,768 227,785 2041-03-20Federal Home Loan Mortgage Corporation 3.5% 0.00 238,738 237,785 2034-02-01................................................................................................................................................................................................................................................................................................Capital One Multi Asset Execution Trust 2.05% 0.00 238,659 243,619 2023-08-15Deutsche Bank Commercial Mortgage Trust 3.28% 0.00 238,626 245,423 2049-05-10Charter Communications Operating, LLC/CharterCommunications Operating Capi
0.00 238,416 236,964 2024-02-01
Federal Home Loan Mortgage Corporation 5% 0.00 238,331 224,351 2039-11-01Wells Fargo Commercial Mortgage Trust 3.24% 0.00 237,968 242,075 2045-12-15................................................................................................................................................................................................................................................................................................Old Republic International Corporation 3.88% 0.00 237,948 248,812 2026-08-26Federal National Mortgage Association 1.38% 0.00 237,700 246,219 2021-02-26Discover Card Execution Note Trust 2.39% 0.00 237,315 243,619 2024-07-15Toyota Auto Receivables 2017-D 1.93% 0.00 236,898 240,971 2022-01-18Southern California Gas Company 3.75% 0.00 236,859 254,065 2042-09-15................................................................................................................................................................................................................................................................................................Ecolab Inc. 3.25% 0.00 236,819 247,232 2027-12-01Federal National Mortgage Association 5% 0.00 236,328 222,213 2040-11-01DALLAS TEX AREA RAPID TRAN 5.02% 0.00 236,314 204,022 2048-12-01California Institute of Technology 4.7% 0.00 236,302 230,968 .Government National Mortgage Association 4% 0.00 236,291 230,247 2040-11-20................................................................................................................................................................................................................................................................................................Federal National Mortgage Association 6% 0.00 236,129 214,371 2040-10-01Illinois Tool Works Inc. 4.88% 0.00 236,078 215,570 2041-09-15Burlington Northern Santa Fe LLC 3.75% 0.00 235,644 233,014 2024-04-01Government National Mortgage Association 4% 0.00 235,209 229,471 2044-01-20American Campus Communities Operating Partnership,L.P. 4.12%
0.00 235,122 236,964 2024-07-01
................................................................................................................................................................................................................................................................................................Berkshire Hathaway Energy Company 5.95% 0.00 234,533 198,247 2037-05-15Public Service Company of Colorado 4.3% 0.00 234,211 231,738 2044-03-15Government National Mortgage Association 5.5% 0.00 234,129 217,309 2034-11-20Molson Coors Brewing Company 4.2% 0.00 233,640 263,688 2046-07-15Oncor Electric Delivery Company LLC 5.25% 0.00 233,556 204,407 2040-09-30................................................................................................................................................................................................................................................................................................Kinder Morgan Energy Partners LP 7.75% 0.00 233,451 188,624 2032-03-15Citibank Credit Card Issuance Trust 3.29% 0.00 232,851 233,027 2025-05-23OREGON ST DEPT TRANSN 5.83% 0.00 232,621 192,473 2034-11-15Stryker Corporation 4.1% 0.00 232,358 250,215 2043-04-01Federal National Mortgage Association 4.5% 0.00 232,224 223,804 2024-09-01................................................................................................................................................................................................................................................................................................World Finl Network Credit Card Tst 2.55% 0.00 232,158 235,146 2024-06-17Starbucks Corporation 4.3% 0.00 232,092 244,826 2045-06-15Anthem Inc 4.65% 0.00 231,924 235,587 2043-01-15Federal Home Loan Mortgage Corporation 5.5% 0.00 231,832 214,187 2033-02-01Federal Home Loan Mortgage Corporation 4% 0.00 231,581 227,340 2041-01-01................................................................................................................................................................................................................................................................................................Federal National Mortgage Association 4.5% 0.00 230,862 221,846 2040-10-01Bristol-Myers Squibb Company 3.25% 0.00 230,823 236,964 2027-02-27Federal National Mortgage Association 5.5% 0.00 230,624 212,778 2037-03-01Federal Home Loan Mortgage Corporation 5.5% 0.00 230,435 212,978 2034-02-01Federal Home Loan Mortgage Corporation 3.5% 0.00 230,408 230,196 2036-06-01................................................................................................................................................................................................................................................................................................Camden Property Trust 2.95% 0.00 230,327 236,964 2022-12-15Federal Home Loan Mortgage Corporation 5% 0.00 230,165 216,834 2041-05-01OHIO ST UNIV 4.8% 0.00 229,695 214,030 .Toyota Motor Credit Corporation 1.9% 0.00 229,559 236,964 2021-04-08Aon plc 6.25% 0.00 229,517 192,473 2040-09-30
©2018 Morningstar, Inc., Morningstar Investment Profiles™ 312-696-6000. All rights reserved. The information contained herein: (1) is proprietary to Morningstar and/or its content providers; (2) maynot be copied or distributed and (3) is not warranted to be accurate, complete or timely. Neither Morningstar nor its content providers are responsible for any damages or losses arising from any use ofinformation. Past performance is no guarantee of future performance. Visit our investment website at www.morningstar.com ß
®

Page 82 of 162
Broad Market Bond Index Fund.......................................................................................................................................................................................................................................................................................................................................
Total Stocks Total Bonds Total Cash0 9083 28
Bond Portfolio Analysis as of 09-30-18Security Name Net Assets % Market Value $ Amount $ Maturity Date
Federal National Mortgage Association 4.5% 0.00 229,475 220,697 2041-03-01Federal National Mortgage Association 3% 0.00 229,363 231,988 2032-08-01Ford Motor Credit Company LLC 3.22% 0.00 229,178 236,964 2022-01-09Kimberly-Clark Corporation 2.15% 0.00 228,970 233,014 2020-08-15Jefferies Group LLC 5.12% 0.00 228,681 221,166 2023-01-20................................................................................................................................................................................................................................................................................................CenterPoint Energy Resources Corp. 5.85% 0.00 228,467 197,862 2041-01-15Canadian Natural Resources Limited 6.5% 0.00 228,423 192,473 2037-02-15Consolidated Edison Company of New York, Inc. 3.95% 0.00 228,407 238,667 2043-03-01Federal Home Loan Mortgage Corporation 6.75% 0.00 228,320 174,644 2029-09-15J.P. Morgan Chase Commercial Mortgage SecuritiesTrust 3.51%
0.00 228,307 227,878 2045-05-15
................................................................................................................................................................................................................................................................................................AmerisourceBergen Corporation 4.25% 0.00 227,984 256,374 2045-03-01Gilead Sciences, Inc. 3.25% 0.00 227,933 229,065 2022-09-01FiServ Inc. 4.62% 0.00 227,441 221,166 2020-10-01Amgen Inc. 1.85% 0.00 227,379 236,964 2021-08-19Parker-Hannifin Corporation 3.25% 0.00 227,294 236,964 2027-03-01................................................................................................................................................................................................................................................................................................Philip Morris International Inc. 2.62% 0.00 227,226 236,964 2023-03-06Kimberly-Clark Corporation 5.3% 0.00 227,159 196,323 2041-03-01Autozone, Inc. 2.5% 0.00 226,973 233,014 2021-04-15AT&T Inc 5.15% 0.00 226,635 234,817 2042-03-15Lockheed Martin Corporation 2.9% 0.00 226,609 236,964 2025-03-01................................................................................................................................................................................................................................................................................................Government National Mortgage Association 2.5% 0.00 226,583 233,586 2027-08-15Mitsubishi UFJ Financial Group, Inc. 2.95% 0.00 225,924 229,065 2021-03-01Federal National Mortgage Association 5.5% 0.00 225,908 209,344 2034-01-01Baxter International, Inc. 1.7% 0.00 225,526 236,964 2021-08-15MetLife Inc. 5.7% 0.00 225,250 196,323 2035-06-15................................................................................................................................................................................................................................................................................................Barclays Dryrock Issuance Trust 2.2% 0.00 225,248 227,731 2022-12-15Province of British Columbia 7.25% 0.00 225,242 152,054 2036-09-01European Investment Bank 1.62% 0.00 225,040 229,065 2020-03-16Federal National Mortgage Association 4% 0.00 224,944 222,650 2047-10-01Federal National Mortgage Association 4% 0.00 224,667 220,802 2029-12-01................................................................................................................................................................................................................................................................................................Morgan Stanley 7.25% 0.00 224,405 175,920 2032-04-01International Business Machines Corporation 2.88% 0.00 224,249 229,065 2022-11-09Republic Services, Inc. 3.2% 0.00 224,192 233,014 2025-03-1521st Century Fox America, Inc. 7.75% 0.00 224,020 146,280 2045-12-01BENCHMARK MORTGAGE TRUST 4.26% 0.00 223,517 215,757 2051-11-10................................................................................................................................................................................................................................................................................................Cincinnati Financial Corporation 6.12% 0.00 223,405 192,473 2034-11-01ABB Finance (USA) Inc. 4.38% 0.00 223,020 219,804 2042-05-08Commercial Mortgage Trust 2017 3.46% 0.00 222,907 229,241 2050-08-15Federal National Mortgage Association 2.29% 0.00 222,562 242,726 2026-06-25Government National Mortgage Association 5% 0.00 222,445 210,173 2043-10-20................................................................................................................................................................................................................................................................................................Government National Mortgage Association 4.5% 0.00 222,309 211,885 2040-11-15Cummins Inc. 4.88% 0.00 221,996 204,022 2043-10-01McDonald's Corporation 3.62% 0.00 221,887 257,914 2043-05-01PPL Electric Utilities Corporation 4.75% 0.00 221,512 207,871 2043-07-15Federal National Mortgage Association 4% 0.00 221,492 217,701 2041-03-01................................................................................................................................................................................................................................................................................................Mercedes-Benz Auto Lease Trust 2011-A 2.41% 0.00 221,182 222,435 2021-02-16Gm Financial Automobile Leasing Trust 2.61% 0.00 221,127 222,435 2021-01-20Georgia Power Company 3.25% 0.00 221,029 236,964 2027-03-30Federal Home Loan Mortgage Corporation 5% 0.00 221,013 208,009 2039-12-01Commercial Mortgage Trust 4.05% 0.00 220,979 215,757 2047-04-10................................................................................................................................................................................................................................................................................................Federal National Mortgage Association 3.2% 0.00 220,691 229,241 2027-11-25Plains All American Pipeline L.P./PAA Finance Corp. 4.7% 0.00 220,506 244,826 2044-06-15Wells Fargo Commercial Mortgage Trust 4.21% 0.00 220,496 215,757 2051-05-15Suncor Energy Inc. 5.95% 0.00 220,425 192,473 2034-12-01Burlington Northern Santa Fe LLC 5.4% 0.00 220,405 192,473 2041-06-01
©2018 Morningstar, Inc., Morningstar Investment Profiles™ 312-696-6000. All rights reserved. The information contained herein: (1) is proprietary to Morningstar and/or its content providers; (2) maynot be copied or distributed and (3) is not warranted to be accurate, complete or timely. Neither Morningstar nor its content providers are responsible for any damages or losses arising from any use ofinformation. Past performance is no guarantee of future performance. Visit our investment website at www.morningstar.com ß
®

Page 83 of 162
Broad Market Bond Index Fund.......................................................................................................................................................................................................................................................................................................................................
Total Stocks Total Bonds Total Cash0 9083 28
Bond Portfolio Analysis as of 09-30-18Security Name Net Assets % Market Value $ Amount $ Maturity Date
Pacific Gas and Electric Company 4.25% 0.00 220,401 217,217 2021-05-15Archer-Daniels-Midland Company 2.5% 0.00 220,265 240,913 2026-08-11JP Morgan Chase Commercial Mortgage SecuritiesTrust 2013-C13 3.99%
0.00 220,222 215,757 2046-01-15
Apple Inc. 3.35% 0.00 220,213 225,116 2027-02-09Government National Mortgage Association 5% 0.00 220,181 207,371 2039-06-15................................................................................................................................................................................................................................................................................................McDonald's Corporation 4.7% 0.00 220,081 211,720 2035-12-09Federal Home Loan Mortgage Corporation 3.99% 0.00 219,888 215,757 2033-05-25MORGAN STANLEY BANK OF AMERICA MERRILLLYNCH TRUST 4.05%
0.00 219,832 215,757 2047-04-15
Enbridge Energy Partners L.P. 4.2% 0.00 219,823 217,217 2021-09-15GRAND PARKWAY TRANSN CORP TEX SYS 5.18% 0.00 219,750 192,473 2042-10-01................................................................................................................................................................................................................................................................................................Realty Income Corporation 5.88% 0.00 219,596 192,473 2035-03-15Dominion Energy Gas Holdings LLC 2.5% 0.00 219,493 221,166 2019-12-15Dover Corporation 6.6% 0.00 219,430 177,075 2038-03-15JPMBB Commercial Mortgage Securities Trust 2013-C15 4.13%
0.00 218,965 213,175 2045-11-15
Jefferies Group LLC 6.5% 0.00 218,819 212,490 2043-01-20................................................................................................................................................................................................................................................................................................Federal Home Loan Mortgage Corporation 3.99% 0.00 218,640 215,757 2033-08-25Federal National Mortgage Association 2.16% 0.00 218,584 229,241 2023-10-25Telefonica Emisiones S.A.U. 5.46% 0.00 218,543 209,318 2021-02-16America Movil S.A.B. de C.V. 6.12% 0.00 218,465 184,774 2040-03-30Principal Financial Group 3.3% 0.00 217,896 221,166 2022-09-15................................................................................................................................................................................................................................................................................................Morgan Stanley Bank of America Merrill Lynch Trust2014-C17 3.74%
0.00 217,647 215,876 2047-08-15
Federal National Mortgage Association 5% 0.00 217,547 204,466 2040-08-01Rio Tinto Finance (USA) plc 4.12% 0.00 217,369 222,114 2042-08-21Gm Finl Auto Lease Tr 2018 3.06% 0.00 217,282 217,139 2021-06-21Federal National Mortgage Association 4% 0.00 217,266 213,418 2041-12-01................................................................................................................................................................................................................................................................................................Conagra Brands Inc 3.25% 0.00 217,212 221,166 2022-09-15Prudential Financial, Inc. 4.6% 0.00 217,021 215,570 2044-05-15Benchmark Mortgage Trust 3.57% 0.00 216,905 215,757 2051-01-15Appalachian Power Company 7% 0.00 216,633 166,297 2038-04-01CSAIL 2015-C4 Commercial Mortgage Trust 3.81% 0.00 216,595 215,757 2048-11-15................................................................................................................................................................................................................................................................................................Government National Mortgage Association 4.5% 0.00 215,921 206,037 2041-08-20Csail Commercial Mortgage Trust 3.76% 0.00 215,781 215,757 2048-11-15Government National Mortgage Association 3% 0.00 215,772 220,796 2043-09-20Government National Mortgage Association 4% 0.00 215,719 210,503 2041-04-15SALT RIV PROJ ARIZ AGRIC IMPT & PWR DIST 4.84% 0.00 215,533 192,473 2041-01-01................................................................................................................................................................................................................................................................................................The Allstate Corporation 4.5% 0.00 215,392 211,720 2043-06-15Jpmcc Commercial Mortgage Securities 2.82% 0.00 215,337 229,241 2049-08-15National Rural Utilities Cooperative Finance Corporation3.25%
0.00 215,275 221,166 2025-11-01
Federal National Mortgage Association 6% 0.00 215,209 195,610 2035-05-01Visa Inc 3.65% 0.00 215,129 230,968 2047-09-15................................................................................................................................................................................................................................................................................................Duke Energy Florida, Inc 6.4% 0.00 215,092 167,837 2038-06-15Comm 2015-Ccre26 Mortgage Trust 3.63% 0.00 215,035 215,757 2048-10-10Southern California Gas Company 5.12% 0.00 214,687 192,473 2040-11-15Government National Mortgage Association 5% 0.00 214,673 202,117 2039-02-15McDonald's Corporation 4.6% 0.00 214,610 213,645 2045-05-26................................................................................................................................................................................................................................................................................................Juniper Networks 5.95% 0.00 214,566 215,955 2041-03-15Public Service Electric and Gas Company 1.9% 0.00 214,515 221,166 2021-03-15Government National Mortgage Association 5.5% 0.00 214,436 199,039 2035-01-20AHS Hospital Corp 5.02% 0.00 214,149 192,473 2045-07-01Government National Mortgage Association 4.5% 0.00 214,100 205,160 2040-02-15................................................................................................................................................................................................................................................................................................Goldcorp Inc 5.45% 0.00 214,090 206,331 2044-06-09Federal Home Loan Mortgage Corporation 2.5% 0.00 214,068 220,360 2028-02-01Cardinal Health, Inc. 4.5% 0.00 213,791 239,822 2044-11-15Morgan Stanley Capital I Trust 2015-Ms1 3.51% 0.00 213,280 216,074 2048-05-15Government National Mortgage Association 4% 0.00 213,198 208,192 2025-09-20
©2018 Morningstar, Inc., Morningstar Investment Profiles™ 312-696-6000. All rights reserved. The information contained herein: (1) is proprietary to Morningstar and/or its content providers; (2) maynot be copied or distributed and (3) is not warranted to be accurate, complete or timely. Neither Morningstar nor its content providers are responsible for any damages or losses arising from any use ofinformation. Past performance is no guarantee of future performance. Visit our investment website at www.morningstar.com ß
®

Page 84 of 162
Broad Market Bond Index Fund.......................................................................................................................................................................................................................................................................................................................................
Total Stocks Total Bonds Total Cash0 9083 28
Bond Portfolio Analysis as of 09-30-18Security Name Net Assets % Market Value $ Amount $ Maturity Date
Federal National Mortgage Association 2.5% 0.00 213,075 219,028 2027-06-01Federal Home Loan Mortgage Corporation 3.5% 0.00 212,824 214,552 2042-06-01Sysco Corporation 4.5% 0.00 212,225 215,570 2046-04-01Federal National Mortgage Association 3.5% 0.00 212,195 211,008 2026-12-01Csail Commercial Mortgage Trust 3.4% 0.00 212,163 215,757 2050-11-15................................................................................................................................................................................................................................................................................................Bristol-Myers Squibb Company 3.25% 0.00 211,890 246,751 2042-08-01NEW YORK N Y 5.85% 0.00 211,737 173,226 2040-06-01Gm Finl Consumer Automobile Receivables Tr 20183.02%
0.00 211,438 211,843 2023-05-16
Wells Fargo Commercial Mortgage Trust 3.59% 0.00 211,410 215,757 2050-12-15Bank of New York Mellon Corporation 2.2% 0.00 211,375 225,116 2023-08-16................................................................................................................................................................................................................................................................................................Devon Energy Corporation 7.95% 0.00 211,208 167,452 2032-04-15Pepsico Capital Resources, Inc. 3.45% 0.00 211,044 234,047 2046-10-06Barrick International (Barbados) Corp 6.35% 0.00 210,995 182,850 2036-10-15Ubs Barclays Commercial Mortgage Trust 3.49% 0.00 210,630 215,757 2050-08-15Gs Mortgage Securities Tr 2017-Gs6 3.43% 0.00 210,508 215,757 2050-05-10................................................................................................................................................................................................................................................................................................Government National Mortgage Association 5.5% 0.00 210,475 195,911 2040-03-15Ecolab Inc. 3.25% 0.00 210,422 213,267 2023-01-14Federal National Mortgage Association 4.5% 0.00 210,006 203,209 2047-05-01Duke Energy Florida Project Finance, LLC 2.54% 0.00 209,863 230,968 2029-09-01Citigroup Commercial Mortgage Trust 3.31% 0.00 209,681 215,757 2049-04-10................................................................................................................................................................................................................................................................................................Kansas City Southern 4.3% 0.00 209,672 223,269 2043-05-15Toyota Auto Receivables Owner Tr 1.76% 0.00 209,488 211,843 2021-07-15Carmax Auto Owner Trust 2.48% 0.00 209,398 211,843 2022-11-15Honda Auto Recv 2017-4 2.05% 0.00 209,379 211,843 2021-11-22Nucor Corporation 5.2% 0.00 209,314 192,473 2043-08-01................................................................................................................................................................................................................................................................................................Baxalta Incorporated 5.25% 0.00 209,209 194,783 2045-06-23Quest Diagnostics Incorporated 4.7% 0.00 209,197 215,570 2045-03-30Honda Auto Recv 2017-2 1.68% 0.00 209,183 211,843 2021-08-16Carmax Auto Owner Trust 1.97% 0.00 208,971 211,843 2022-04-15Commercial Mortgage Trust 3.61% 0.00 208,925 207,666 2046-06-10................................................................................................................................................................................................................................................................................................Nissan Auto Receiv 2.12% 0.00 208,759 211,843 2022-04-18Caterpillar Inc 4.3% 0.00 208,669 201,712 2044-05-15DALLAS CNTY TEX HOSP DIST 5.62% 0.00 208,484 173,226 2044-08-15Philip Morris International Inc. 4.88% 0.00 208,121 204,022 2043-11-15Stryker Corporation 4.38% 0.00 208,044 215,570 2044-05-15................................................................................................................................................................................................................................................................................................Enable Midstream Partners LP 5% 0.00 207,906 230,968 2044-05-15Federal National Mortgage Association 5.5% 0.00 207,785 191,207 2034-02-01Plains All American Pipeline L.P./PAA Finance Corp.5.15%
0.00 206,819 219,419 2042-06-01
Nevada Power Company 6.75% 0.00 206,781 161,677 2037-07-01Ingersoll-Rand Luxembourg Finance S.A. 4.65% 0.00 206,443 204,022 2044-11-01................................................................................................................................................................................................................................................................................................GS MORTGAGE SECURITIES TRUST 2016-G 3.05% 0.00 206,362 215,757 2049-05-10Government National Mortgage Association 3% 0.00 206,306 212,114 2042-09-15Federal Home Loan Mortgage Corporation 4.5% 0.00 206,288 198,940 2035-04-01NUTRIEN LTD 5.62% 0.00 206,026 192,473 2040-12-01SAN ANTONIO TEX 4.43% 0.00 205,696 192,473 2042-02-01................................................................................................................................................................................................................................................................................................Government National Mortgage Association 3.5% 0.00 205,607 205,598 2043-12-20Macy's Retail Holdings, Inc. 5.12% 0.00 205,506 244,441 2042-01-15KeyCorp 5.1% 0.00 205,426 197,470 2021-03-24Federal Home Loan Mortgage Corporation 4.5% 0.00 205,302 196,772 2040-09-01Federal National Mortgage Association 2.72% 0.00 204,906 208,404 2022-02-25................................................................................................................................................................................................................................................................................................COMM MORTGAGE TRUST 3.83% 0.00 204,825 202,272 2047-07-15Government National Mortgage Association 5.5% 0.00 204,764 189,278 2033-04-15Federal Home Loan Mortgage Corporation 6% 0.00 204,600 185,330 2037-08-01Express Scripts Holding Co 4.75% 0.00 203,815 197,470 2021-11-15Primerica, Inc. 4.75% 0.00 203,787 197,470 2022-07-15
©2018 Morningstar, Inc., Morningstar Investment Profiles™ 312-696-6000. All rights reserved. The information contained herein: (1) is proprietary to Morningstar and/or its content providers; (2) maynot be copied or distributed and (3) is not warranted to be accurate, complete or timely. Neither Morningstar nor its content providers are responsible for any damages or losses arising from any use ofinformation. Past performance is no guarantee of future performance. Visit our investment website at www.morningstar.com ß
®

Page 85 of 162
Broad Market Bond Index Fund.......................................................................................................................................................................................................................................................................................................................................
Total Stocks Total Bonds Total Cash0 9083 28
Bond Portfolio Analysis as of 09-30-18Security Name Net Assets % Market Value $ Amount $ Maturity Date
JOBSOHIO BEVERAGE SYS OHIO 4.53% 0.00 203,575 192,473 2035-01-01Commercial Mortgage Trust 2015-LC23 3.77% 0.00 203,484 202,272 2048-10-10Citigroup Commercial Mortgage Trust 2.94% 0.00 203,445 215,757 2049-10-10Federal Home Loan Mortgage Corporation 5% 0.00 203,438 191,623 2035-10-01Quest Diagnostics Incorporated 2.5% 0.00 203,130 205,369 2020-03-30................................................................................................................................................................................................................................................................................................Wfcm 2016-Lc24 2.94% 0.00 203,129 215,757 2049-10-15Tennessee Valley Authority 5.5% 0.00 202,913 162,169 2038-06-15Comm 2015-Ccre24 Mortgage Trust 3.7% 0.00 202,884 202,272 2048-08-10Federal National Mortgage Association 4.5% 0.00 202,833 194,750 2039-06-01Federal National Mortgage Association 4.5% 0.00 202,742 194,506 2029-09-01................................................................................................................................................................................................................................................................................................General Dynamics Corporation 3.6% 0.00 202,551 214,800 2042-11-15Brown-Forman Corporation 4.5% 0.00 202,377 192,473 2045-07-15Pepsico Capital Resources, Inc. 1.85% 0.00 202,105 205,369 2020-04-30Western Massachusetts Electric Company 3.5% 0.00 202,092 201,419 2021-09-15Ingersoll-Rand Global Holdings Company Limited 4.25% 0.00 202,059 197,470 2023-06-15................................................................................................................................................................................................................................................................................................Philip Morris International Inc. 4.12% 0.00 201,902 197,470 2021-05-17Union Pacific Corporation 3.88% 0.00 201,773 229,428 2055-02-01Oncor Electric Delivery Company LLC 4.1% 0.00 201,762 197,470 2022-06-01Federal Home Loan Mortgage Corporation 6% 0.00 201,655 182,298 2035-12-01Baxter International, Inc. 3.5% 0.00 201,546 240,207 2046-08-15................................................................................................................................................................................................................................................................................................Federal Home Loan Mortgage Corporation 5.5% 0.00 201,370 186,328 2038-01-01Federal National Mortgage Association 5% 0.00 200,927 189,207 2033-07-01HSBC Holdings plc 5.25% 0.00 200,672 192,473 2044-03-14Federal Home Loan Mortgage Corporation 6% 0.00 200,397 181,215 2032-02-01Piedmont Natural Gas Company, Inc. 4.65% 0.00 200,318 192,473 2043-08-01................................................................................................................................................................................................................................................................................................Tennessee Valley Authority 6.75% 0.00 200,301 164,146 2025-11-01Honda Auto Recv 2018 2.64% 0.00 199,829 201,251 2022-02-15Federal National Mortgage Association 3% 0.00 199,620 203,102 2033-06-01Wisconsin Public Service Corporation 4.75% 0.00 199,337 184,774 2044-11-01Government National Mortgage Association 5.5% 0.00 199,334 185,012 2034-04-20................................................................................................................................................................................................................................................................................................GS Mortgage Securities Trust 2016-GS4 2.9% 0.00 198,961 202,272 2049-11-10Walgreens Boots Alliance, Inc. 4.65% 0.00 198,820 207,871 2046-06-01Memorial Sloan-Kettering Cancer Center 4.2% 0.00 198,513 198,247 2055-07-01Boston Properties, Inc. 3.85% 0.00 198,281 197,470 2023-02-01CARMAX AUTO OWNER TR 2017-4 2.11% 0.00 198,127 201,251 2022-10-17................................................................................................................................................................................................................................................................................................CLARK CNTY NEV ARPT DEPT OF AVIATION 6.88% 0.00 198,009 192,473 2042-07-01Federal Home Loan Mortgage Corporation 4% 0.00 197,795 194,173 2040-12-01American International Group, Inc. 4.8% 0.00 197,714 199,787 2045-07-10Wf-Rbs Com Mg Tst 2.75% 0.00 197,655 203,711 2045-05-15Government National Mortgage Association 3.5% 0.00 197,552 197,769 2042-04-15................................................................................................................................................................................................................................................................................................PORT AUTH N Y & N J 5.65% 0.00 197,381 163,602 2040-11-01Tyco Electronics Group SA 3.5% 0.00 197,302 197,470 2022-02-03European Investment Bank 2.88% 0.00 197,213 197,470 2020-09-15The Kroger Co. 5.15% 0.00 197,168 198,247 2043-08-01Newell Brands Inc. 2.88% 0.00 197,117 197,470 2019-12-01................................................................................................................................................................................................................................................................................................Duke Energy Ohio 3.7% 0.00 197,013 215,570 2046-06-15United Technologies Corporation 4.15% 0.00 196,875 211,720 2045-05-15Federal National Mortgage Association 5% 0.00 196,827 186,164 2037-03-01Federal National Mortgage Association 4% 0.00 196,717 193,378 2039-12-01Parker-Hannifin Corporation 4.45% 0.00 196,608 192,473 2044-11-21................................................................................................................................................................................................................................................................................................Federal Home Loan Mortgage Corporation 4% 0.00 196,531 193,085 2039-10-01Federal National Mortgage Association 3% 0.00 196,480 198,386 2027-09-01Johnson Controls International Plc 5.25% 0.00 196,454 192,473 2041-12-01KeyBank National Association 2.5% 0.00 196,413 197,470 2019-12-15Bank 2017-Bnk5 206 3.39% 0.00 196,242 202,272 2060-06-15Roper Technologies Inc 3% 0.00 196,189 197,470 2020-12-15Kinder Morgan Energy Partners LP 5.5% 0.00 196,186 188,624 2044-03-01Government National Mortgage Association 5% 0.00 196,172 184,864 2040-08-15Government National Mortgage Association 3% 0.00 195,643 200,971 2042-11-15General Electric Company 2.1% 0.00 195,349 197,470 2019-12-11................................................................................................................................................................................................................................................................................................
©2018 Morningstar, Inc., Morningstar Investment Profiles™ 312-696-6000. All rights reserved. The information contained herein: (1) is proprietary to Morningstar and/or its content providers; (2) maynot be copied or distributed and (3) is not warranted to be accurate, complete or timely. Neither Morningstar nor its content providers are responsible for any damages or losses arising from any use ofinformation. Past performance is no guarantee of future performance. Visit our investment website at www.morningstar.com ß
®

Page 86 of 162
Broad Market Bond Index Fund.......................................................................................................................................................................................................................................................................................................................................
Total Stocks Total Bonds Total Cash0 9083 28
Bond Portfolio Analysis as of 09-30-18Security Name Net Assets % Market Value $ Amount $ Maturity Date
Eastman Chemical Company 4.65% 0.00 195,077 201,712 2044-10-15Consumers Energy Company 3.95% 0.00 194,916 200,172 2043-05-15Federal Home Loan Mortgage Corporation 5% 0.00 194,699 184,386 2039-08-01BANK 2018-BNK14 4.13% 0.00 194,488 188,787 2060-09-15PPG Industries, Inc. 3.2% 0.00 194,341 197,470 2023-03-15................................................................................................................................................................................................................................................................................................Federal Home Loan Mortgage Corporation 3.75% 0.00 194,235 195,529 2033-04-25Duke Energy Florida, LLC 3.4% 0.00 194,023 223,269 2046-10-01Wells Fargo & Company 3.45% 0.00 193,972 197,470 2023-02-13BENCHMARK MORTGAGE TRUST 4.08% 0.00 193,929 188,787 2051-07-15Marriott International, Inc. 3.25% 0.00 193,886 197,470 2022-09-15................................................................................................................................................................................................................................................................................................Tyson Foods, Inc. 4.88% 0.00 193,664 192,473 2034-08-15National Fuel Gas Company 3.75% 0.00 193,616 197,470 2023-03-01Johnson & Johnson 1.95% 0.00 193,479 197,470 2020-11-10Cooperatieve Centrale Raiffeisen-Boerenleenbank B.A.,New York Branch 2.5%
0.00 193,470 197,470 2021-01-19
Goldman Sachs Group, Inc. 3% 0.00 193,468 197,470 2022-04-26................................................................................................................................................................................................................................................................................................Federal National Mortgage Association 2.61% 0.00 193,395 202,272 2024-05-25Federal Home Loan Mortgage Corporation 3.5% 0.00 193,168 192,169 2026-11-01Nordstrom, Inc. 5% 0.00 193,116 209,411 2044-01-15Svenska Handelsbanken Ab (Publ) 2.45% 0.00 193,081 197,470 2021-03-30AvalonBay Communities, Inc. 2.95% 0.00 193,078 197,470 2022-09-15................................................................................................................................................................................................................................................................................................The Home Depot, Inc. 2.7% 0.00 192,882 197,470 2023-04-01Eastman Chemical Company 3.6% 0.00 192,800 192,731 2022-08-15South Carolina Electric & Gas Company 5.1% 0.00 192,779 192,473 2065-06-01WALMART INC 4.05% 0.00 192,757 192,473 2048-06-29Xerox Corporation 6.75% 0.00 192,658 192,473 2039-12-15................................................................................................................................................................................................................................................................................................Government National Mortgage Association 6% 0.00 192,439 175,816 2038-06-20Citizens Bank, National Association 2.55% 0.00 192,377 197,470 2021-05-13Federal Home Loan Banks 5.62% 0.00 191,723 149,695 2036-03-14Aetna, Inc. 6.62% 0.00 191,713 157,443 2036-06-15Zimmer Biomet Holdings Inc 2.7% 0.00 191,639 193,520 2020-04-01................................................................................................................................................................................................................................................................................................Principal Financial Group 4.62% 0.00 191,443 192,473 2042-09-15Kimberly-Clark Corporation 2.4% 0.00 191,414 197,470 2022-03-01Federal National Mortgage Association 5.5% 0.00 191,212 177,202 2033-07-01General Mills, Inc. 4.15% 0.00 190,812 215,955 2043-02-15Philippines (Republic Of) 9.5% 0.00 190,763 128,957 2030-02-02................................................................................................................................................................................................................................................................................................The Connecticut Light and Power Company 2.5% 0.00 190,724 197,470 2023-01-15Government National Mortgage Association 6% 0.00 190,723 174,917 2035-07-15WORLD OMNI AUTOMOBILE LEASE SECURITIZATIONTRUST 3.19%
0.00 190,643 190,659 2021-12-15
Federal National Mortgage Association 5% 0.00 190,522 178,765 2039-04-01Federal National Mortgage Association 3.19% 0.00 190,487 202,272 2030-02-25................................................................................................................................................................................................................................................................................................Honda Auto Recv 2018 3.01% 0.00 190,447 190,659 2022-05-18The Home Depot, Inc. 3.5% 0.00 190,287 220,189 2056-09-15Federal Home Loan Mortgage Corporation 4% 0.00 190,255 185,592 2035-01-01Citigroup Incorporation New 3.82% 0.00 190,202 188,787 2048-11-10HONDA AUTO RECEIVABLES OWNER TRUST 2.95% 0.00 190,032 190,659 2022-08-22................................................................................................................................................................................................................................................................................................Citigroup Commercial Mortgage Trust 3.76% 0.00 189,868 188,787 2048-06-10Eversource Energy 3.15% 0.00 189,850 197,470 2025-01-15Government National Mortgage Association 3.5% 0.00 189,686 186,947 2026-07-20The Sherwin-Williams Company 3.12% 0.00 189,667 197,470 2024-06-01The Connecticut Light and Power Company 4% 0.00 189,666 192,473 2048-04-01TransAlta Corporation 6.5% 0.00 189,581 192,473 2040-03-15NUTRIEN LTD 4.9% 0.00 189,470 192,473 2043-06-01MStanley Cap I Tr 3.81% 0.00 189,418 188,787 2048-12-15Gm Financial Consumer Automobile 2.81% 0.00 189,362 190,659 2022-12-16CNOOC Finance (2013) Limited 3% 0.00 189,235 197,470 2023-05-09................................................................................................................................................................................................................................................................................................
©2018 Morningstar, Inc., Morningstar Investment Profiles™ 312-696-6000. All rights reserved. The information contained herein: (1) is proprietary to Morningstar and/or its content providers; (2) maynot be copied or distributed and (3) is not warranted to be accurate, complete or timely. Neither Morningstar nor its content providers are responsible for any damages or losses arising from any use ofinformation. Past performance is no guarantee of future performance. Visit our investment website at www.morningstar.com ß
®
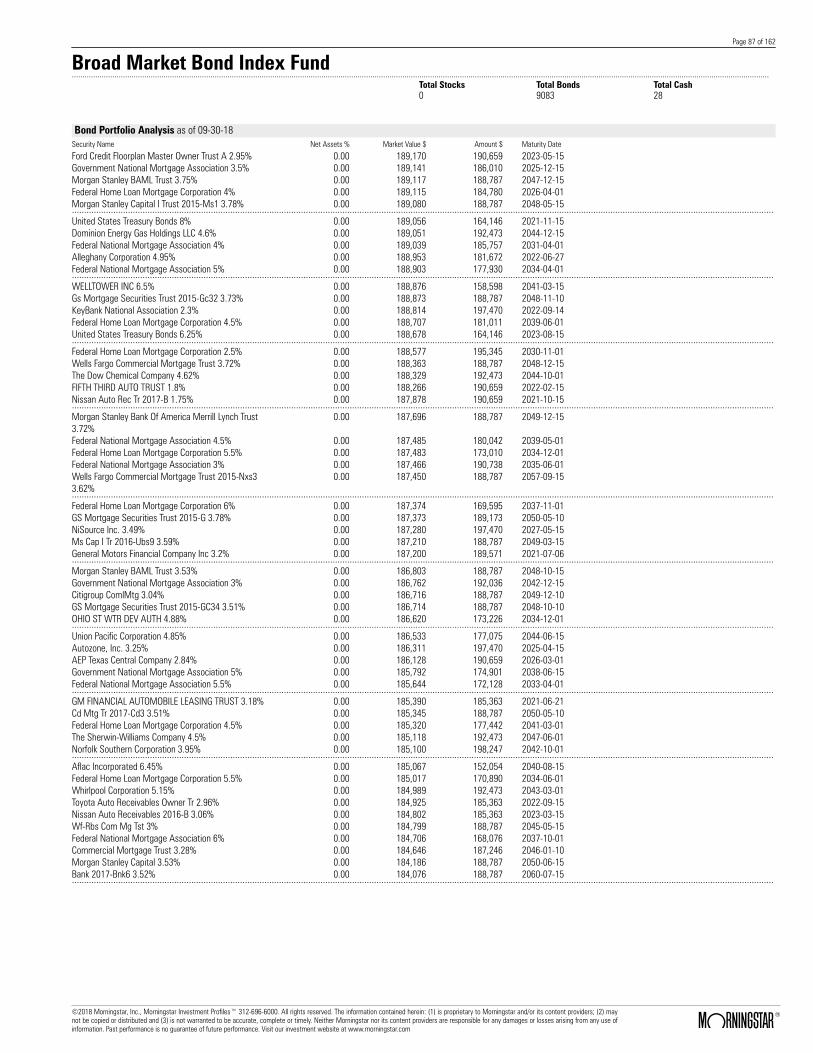
Page 87 of 162
Broad Market Bond Index Fund.......................................................................................................................................................................................................................................................................................................................................
Total Stocks Total Bonds Total Cash0 9083 28
Bond Portfolio Analysis as of 09-30-18Security Name Net Assets % Market Value $ Amount $ Maturity Date
Ford Credit Floorplan Master Owner Trust A 2.95% 0.00 189,170 190,659 2023-05-15Government National Mortgage Association 3.5% 0.00 189,141 186,010 2025-12-15Morgan Stanley BAML Trust 3.75% 0.00 189,117 188,787 2047-12-15Federal Home Loan Mortgage Corporation 4% 0.00 189,115 184,780 2026-04-01Morgan Stanley Capital I Trust 2015-Ms1 3.78% 0.00 189,080 188,787 2048-05-15................................................................................................................................................................................................................................................................................................United States Treasury Bonds 8% 0.00 189,056 164,146 2021-11-15Dominion Energy Gas Holdings LLC 4.6% 0.00 189,051 192,473 2044-12-15Federal National Mortgage Association 4% 0.00 189,039 185,757 2031-04-01Alleghany Corporation 4.95% 0.00 188,953 181,672 2022-06-27Federal National Mortgage Association 5% 0.00 188,903 177,930 2034-04-01................................................................................................................................................................................................................................................................................................WELLTOWER INC 6.5% 0.00 188,876 158,598 2041-03-15Gs Mortgage Securities Trust 2015-Gc32 3.73% 0.00 188,873 188,787 2048-11-10KeyBank National Association 2.3% 0.00 188,814 197,470 2022-09-14Federal Home Loan Mortgage Corporation 4.5% 0.00 188,707 181,011 2039-06-01United States Treasury Bonds 6.25% 0.00 188,678 164,146 2023-08-15................................................................................................................................................................................................................................................................................................Federal Home Loan Mortgage Corporation 2.5% 0.00 188,577 195,345 2030-11-01Wells Fargo Commercial Mortgage Trust 3.72% 0.00 188,363 188,787 2048-12-15The Dow Chemical Company 4.62% 0.00 188,329 192,473 2044-10-01FIFTH THIRD AUTO TRUST 1.8% 0.00 188,266 190,659 2022-02-15Nissan Auto Rec Tr 2017-B 1.75% 0.00 187,878 190,659 2021-10-15................................................................................................................................................................................................................................................................................................Morgan Stanley Bank Of America Merrill Lynch Trust3.72%
0.00 187,696 188,787 2049-12-15
Federal National Mortgage Association 4.5% 0.00 187,485 180,042 2039-05-01Federal Home Loan Mortgage Corporation 5.5% 0.00 187,483 173,010 2034-12-01Federal National Mortgage Association 3% 0.00 187,466 190,738 2035-06-01Wells Fargo Commercial Mortgage Trust 2015-Nxs33.62%
0.00 187,450 188,787 2057-09-15
................................................................................................................................................................................................................................................................................................Federal Home Loan Mortgage Corporation 6% 0.00 187,374 169,595 2037-11-01GS Mortgage Securities Trust 2015-G 3.78% 0.00 187,373 189,173 2050-05-10NiSource Inc. 3.49% 0.00 187,280 197,470 2027-05-15Ms Cap I Tr 2016-Ubs9 3.59% 0.00 187,210 188,787 2049-03-15General Motors Financial Company Inc 3.2% 0.00 187,200 189,571 2021-07-06................................................................................................................................................................................................................................................................................................Morgan Stanley BAML Trust 3.53% 0.00 186,803 188,787 2048-10-15Government National Mortgage Association 3% 0.00 186,762 192,036 2042-12-15Citigroup ComlMtg 3.04% 0.00 186,716 188,787 2049-12-10GS Mortgage Securities Trust 2015-GC34 3.51% 0.00 186,714 188,787 2048-10-10OHIO ST WTR DEV AUTH 4.88% 0.00 186,620 173,226 2034-12-01................................................................................................................................................................................................................................................................................................Union Pacific Corporation 4.85% 0.00 186,533 177,075 2044-06-15Autozone, Inc. 3.25% 0.00 186,311 197,470 2025-04-15AEP Texas Central Company 2.84% 0.00 186,128 190,659 2026-03-01Government National Mortgage Association 5% 0.00 185,792 174,901 2038-06-15Federal National Mortgage Association 5.5% 0.00 185,644 172,128 2033-04-01................................................................................................................................................................................................................................................................................................GM FINANCIAL AUTOMOBILE LEASING TRUST 3.18% 0.00 185,390 185,363 2021-06-21Cd Mtg Tr 2017-Cd3 3.51% 0.00 185,345 188,787 2050-05-10Federal Home Loan Mortgage Corporation 4.5% 0.00 185,320 177,442 2041-03-01The Sherwin-Williams Company 4.5% 0.00 185,118 192,473 2047-06-01Norfolk Southern Corporation 3.95% 0.00 185,100 198,247 2042-10-01................................................................................................................................................................................................................................................................................................Aflac Incorporated 6.45% 0.00 185,067 152,054 2040-08-15Federal Home Loan Mortgage Corporation 5.5% 0.00 185,017 170,890 2034-06-01Whirlpool Corporation 5.15% 0.00 184,989 192,473 2043-03-01Toyota Auto Receivables Owner Tr 2.96% 0.00 184,925 185,363 2022-09-15Nissan Auto Receivables 2016-B 3.06% 0.00 184,802 185,363 2023-03-15Wf-Rbs Com Mg Tst 3% 0.00 184,799 188,787 2045-05-15Federal National Mortgage Association 6% 0.00 184,706 168,076 2037-10-01Commercial Mortgage Trust 3.28% 0.00 184,646 187,246 2046-01-10Morgan Stanley Capital 3.53% 0.00 184,186 188,787 2050-06-15Bank 2017-Bnk6 3.52% 0.00 184,076 188,787 2060-07-15................................................................................................................................................................................................................................................................................................
©2018 Morningstar, Inc., Morningstar Investment Profiles™ 312-696-6000. All rights reserved. The information contained herein: (1) is proprietary to Morningstar and/or its content providers; (2) maynot be copied or distributed and (3) is not warranted to be accurate, complete or timely. Neither Morningstar nor its content providers are responsible for any damages or losses arising from any use ofinformation. Past performance is no guarantee of future performance. Visit our investment website at www.morningstar.com ß
®

Page 88 of 162
Broad Market Bond Index Fund.......................................................................................................................................................................................................................................................................................................................................
Total Stocks Total Bonds Total Cash0 9083 28
Bond Portfolio Analysis as of 09-30-18Security Name Net Assets % Market Value $ Amount $ Maturity Date
Stanford University 3.65% 0.00 183,925 192,473 2048-05-01Express Scripts Holding Co 6.12% 0.00 183,883 163,987 2041-11-15Air Lease Corporation 3% 0.00 183,767 193,520 2023-09-15Ubs Coml Mtg Tr 2017 3.46% 0.00 183,766 188,787 2050-06-15Bmw Ven Lease Tr 2017-2 2.07% 0.00 183,708 185,363 2020-10-20................................................................................................................................................................................................................................................................................................Equinor ASA 2.75% 0.00 183,120 185,622 2021-11-10Tennessee Valley Authority 4.7% 0.00 183,051 162,169 2033-07-15Government National Mortgage Association 5% 0.00 182,558 171,819 2040-01-15Federal Home Loan Mortgage Corporation 5% 0.00 182,385 171,600 2039-09-01Federal Home Loan Mortgage Corporation 3.5% 0.00 182,372 181,430 2025-10-01................................................................................................................................................................................................................................................................................................Federal Home Loan Mortgage Corporation 5% 0.00 182,336 172,898 2035-08-01Federal National Mortgage Association 5% 0.00 182,322 171,352 2041-02-01Federal National Mortgage Association 4% 0.00 182,314 179,197 2042-03-01Government National Mortgage Association 3.5% 0.00 182,226 182,050 2042-06-20Precision Castparts Corp. 3.9% 0.00 182,036 192,473 2043-01-15................................................................................................................................................................................................................................................................................................Johns Hopkins Health System Corporation 3.84% 0.00 181,819 192,473 2046-05-15Federal Home Loan Mortgage Corporation 5.5% 0.00 181,810 167,778 2035-06-01Puget Sound Energy Inc. 5.76% 0.00 181,778 150,899 2039-10-01Federal National Mortgage Association 3.5% 0.00 181,649 180,452 2026-02-01Federal National Mortgage Association 3% 0.00 181,393 187,947 2043-08-01................................................................................................................................................................................................................................................................................................GATX Corporation 5.2% 0.00 181,375 175,151 2044-03-15Federal Home Loan Mortgage Corporation 3.5% 0.00 180,866 182,334 2040-10-01CFCRE Commercial Mortgage Trust 3.22% 0.00 180,781 188,787 2049-11-10Federal National Mortgage Association 5% 0.00 180,657 170,126 2033-11-01Commercial Mortgage Trust 3.33% 0.00 180,654 181,387 2046-06-10................................................................................................................................................................................................................................................................................................Bank Amer Merrill Lynch Commercial Mortgage Trust2015-Ubs7 3.7%
0.00 180,596 180,696 2048-09-15
Csail 2016-C6 Commercial Mortg 3.09% 0.00 180,395 188,787 2049-01-15President & Fellows of Harvard College 3.3% 0.00 179,918 204,022 2056-07-15Comm 2016 Cor1 Mgt 3.09% 0.00 179,726 188,787 2049-10-10Morgan Stanley 3.97% 0.00 179,706 192,473 2038-07-22................................................................................................................................................................................................................................................................................................Mexico (United Mexican States) 4.6% 0.00 179,481 192,473 2046-01-23Federal National Mortgage Association 2.98% 0.00 179,160 180,396 2022-04-25Federal Home Loan Mortgage Corporation 4.5% 0.00 178,850 172,515 2035-12-01Nissan Auto Lease Trust 2.05% 0.00 178,567 180,067 2020-09-15Federal National Mortgage Association 5% 0.00 178,464 168,105 2035-04-01................................................................................................................................................................................................................................................................................................Ally Auto Rcvbls 2.35% 0.00 178,431 180,067 2022-06-15Federal National Mortgage Association 4.5% 0.00 178,358 172,337 2030-01-01Toyota Auto Recv Own Tr 2018-A 2.35% 0.00 178,056 180,067 2022-05-16United Health Group Incorporated 2.38% 0.00 178,015 185,622 2022-10-15Gm Financial Securitized Term 2.32% 0.00 177,538 180,067 2022-07-18................................................................................................................................................................................................................................................................................................Federal National Mortgage Association 5.5% 0.00 177,346 164,442 2033-03-01Wells Fargo Coml T 2.92% 0.00 177,294 188,787 2049-11-15AmeriCredit Automobile Receivables Trust 3.07% 0.00 177,158 177,419 2022-12-19Federal National Mortgage Association 5% 0.00 177,127 166,821 2033-09-01Apple Inc. 3.75% 0.00 177,001 188,624 2047-11-13................................................................................................................................................................................................................................................................................................Federal National Mortgage Association 5.5% 0.00 176,666 162,624 2038-03-01Kimberly-Clark Corporation 3.7% 0.00 176,655 192,473 2043-06-01Wells Fargo Commercial Mortgage Trust 4.42% 0.00 176,469 175,560 2046-07-15Wisconsin Public Service Corporation 3.67% 0.00 176,426 192,473 2042-12-01HP Inc 4.05% 0.00 176,075 173,773 2022-09-15Federal National Mortgage Association 6% 0.00 175,831 159,706 2035-04-01Government National Mortgage Association 4.5% 0.00 175,599 168,346 2040-08-15Federal National Mortgage Association 4% 0.00 175,535 172,442 2044-12-01Federal Home Loan Mortgage Corporation 4.5% 0.00 175,407 168,241 2040-01-01Federal Home Loan Mortgage Corporation 4% 0.00 175,290 171,289 2025-10-01................................................................................................................................................................................................................................................................................................
©2018 Morningstar, Inc., Morningstar Investment Profiles™ 312-696-6000. All rights reserved. The information contained herein: (1) is proprietary to Morningstar and/or its content providers; (2) maynot be copied or distributed and (3) is not warranted to be accurate, complete or timely. Neither Morningstar nor its content providers are responsible for any damages or losses arising from any use ofinformation. Past performance is no guarantee of future performance. Visit our investment website at www.morningstar.com ß
®
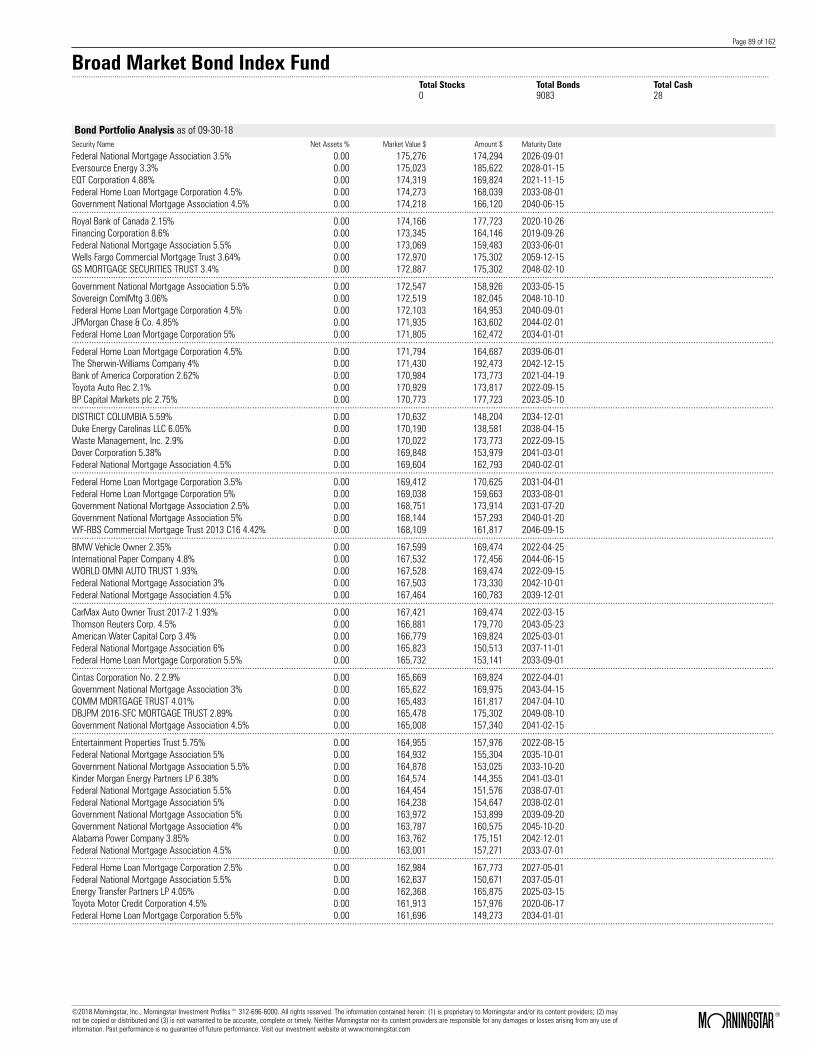
Page 89 of 162
Broad Market Bond Index Fund.......................................................................................................................................................................................................................................................................................................................................
Total Stocks Total Bonds Total Cash0 9083 28
Bond Portfolio Analysis as of 09-30-18Security Name Net Assets % Market Value $ Amount $ Maturity Date
Federal National Mortgage Association 3.5% 0.00 175,276 174,294 2026-09-01Eversource Energy 3.3% 0.00 175,023 185,622 2028-01-15EQT Corporation 4.88% 0.00 174,319 169,824 2021-11-15Federal Home Loan Mortgage Corporation 4.5% 0.00 174,273 168,039 2033-08-01Government National Mortgage Association 4.5% 0.00 174,218 166,120 2040-06-15................................................................................................................................................................................................................................................................................................Royal Bank of Canada 2.15% 0.00 174,166 177,723 2020-10-26Financing Corporation 8.6% 0.00 173,345 164,146 2019-09-26Federal National Mortgage Association 5.5% 0.00 173,069 159,483 2033-06-01Wells Fargo Commercial Mortgage Trust 3.64% 0.00 172,970 175,302 2059-12-15GS MORTGAGE SECURITIES TRUST 3.4% 0.00 172,887 175,302 2048-02-10................................................................................................................................................................................................................................................................................................Government National Mortgage Association 5.5% 0.00 172,547 158,926 2033-05-15Sovereign ComlMtg 3.06% 0.00 172,519 182,045 2048-10-10Federal Home Loan Mortgage Corporation 4.5% 0.00 172,103 164,953 2040-09-01JPMorgan Chase & Co. 4.85% 0.00 171,935 163,602 2044-02-01Federal Home Loan Mortgage Corporation 5% 0.00 171,805 162,472 2034-01-01................................................................................................................................................................................................................................................................................................Federal Home Loan Mortgage Corporation 4.5% 0.00 171,794 164,687 2039-06-01The Sherwin-Williams Company 4% 0.00 171,430 192,473 2042-12-15Bank of America Corporation 2.62% 0.00 170,984 173,773 2021-04-19Toyota Auto Rec 2.1% 0.00 170,929 173,817 2022-09-15BP Capital Markets plc 2.75% 0.00 170,773 177,723 2023-05-10................................................................................................................................................................................................................................................................................................DISTRICT COLUMBIA 5.59% 0.00 170,632 148,204 2034-12-01Duke Energy Carolinas LLC 6.05% 0.00 170,190 138,581 2038-04-15Waste Management, Inc. 2.9% 0.00 170,022 173,773 2022-09-15Dover Corporation 5.38% 0.00 169,848 153,979 2041-03-01Federal National Mortgage Association 4.5% 0.00 169,604 162,793 2040-02-01................................................................................................................................................................................................................................................................................................Federal Home Loan Mortgage Corporation 3.5% 0.00 169,412 170,625 2031-04-01Federal Home Loan Mortgage Corporation 5% 0.00 169,038 159,663 2033-08-01Government National Mortgage Association 2.5% 0.00 168,751 173,914 2031-07-20Government National Mortgage Association 5% 0.00 168,144 157,293 2040-01-20WF-RBS Commercial Mortgage Trust 2013 C16 4.42% 0.00 168,109 161,817 2046-09-15................................................................................................................................................................................................................................................................................................BMW Vehicle Owner 2.35% 0.00 167,599 169,474 2022-04-25International Paper Company 4.8% 0.00 167,532 172,456 2044-06-15WORLD OMNI AUTO TRUST 1.93% 0.00 167,528 169,474 2022-09-15Federal National Mortgage Association 3% 0.00 167,503 173,330 2042-10-01Federal National Mortgage Association 4.5% 0.00 167,464 160,783 2039-12-01................................................................................................................................................................................................................................................................................................CarMax Auto Owner Trust 2017-2 1.93% 0.00 167,421 169,474 2022-03-15Thomson Reuters Corp. 4.5% 0.00 166,881 179,770 2043-05-23American Water Capital Corp 3.4% 0.00 166,779 169,824 2025-03-01Federal National Mortgage Association 6% 0.00 165,823 150,513 2037-11-01Federal Home Loan Mortgage Corporation 5.5% 0.00 165,732 153,141 2033-09-01................................................................................................................................................................................................................................................................................................Cintas Corporation No. 2 2.9% 0.00 165,669 169,824 2022-04-01Government National Mortgage Association 3% 0.00 165,622 169,975 2043-04-15COMM MORTGAGE TRUST 4.01% 0.00 165,483 161,817 2047-04-10DBJPM 2016-SFC MORTGAGE TRUST 2.89% 0.00 165,478 175,302 2049-08-10Government National Mortgage Association 4.5% 0.00 165,008 157,340 2041-02-15................................................................................................................................................................................................................................................................................................Entertainment Properties Trust 5.75% 0.00 164,955 157,976 2022-08-15Federal National Mortgage Association 5% 0.00 164,932 155,304 2035-10-01Government National Mortgage Association 5.5% 0.00 164,878 153,025 2033-10-20Kinder Morgan Energy Partners LP 6.38% 0.00 164,574 144,355 2041-03-01Federal National Mortgage Association 5.5% 0.00 164,454 151,576 2038-07-01Federal National Mortgage Association 5% 0.00 164,238 154,647 2038-02-01Government National Mortgage Association 5% 0.00 163,972 153,899 2039-09-20Government National Mortgage Association 4% 0.00 163,787 160,575 2045-10-20Alabama Power Company 3.85% 0.00 163,762 175,151 2042-12-01Federal National Mortgage Association 4.5% 0.00 163,001 157,271 2033-07-01................................................................................................................................................................................................................................................................................................Federal Home Loan Mortgage Corporation 2.5% 0.00 162,984 167,773 2027-05-01Federal National Mortgage Association 5.5% 0.00 162,637 150,671 2037-05-01Energy Transfer Partners LP 4.05% 0.00 162,368 165,875 2025-03-15Toyota Motor Credit Corporation 4.5% 0.00 161,913 157,976 2020-06-17Federal Home Loan Mortgage Corporation 5.5% 0.00 161,696 149,273 2034-01-01................................................................................................................................................................................................................................................................................................
©2018 Morningstar, Inc., Morningstar Investment Profiles™ 312-696-6000. All rights reserved. The information contained herein: (1) is proprietary to Morningstar and/or its content providers; (2) maynot be copied or distributed and (3) is not warranted to be accurate, complete or timely. Neither Morningstar nor its content providers are responsible for any damages or losses arising from any use ofinformation. Past performance is no guarantee of future performance. Visit our investment website at www.morningstar.com ß
®

Page 90 of 162
Broad Market Bond Index Fund.......................................................................................................................................................................................................................................................................................................................................
Total Stocks Total Bonds Total Cash0 9083 28
Bond Portfolio Analysis as of 09-30-18Security Name Net Assets % Market Value $ Amount $ Maturity Date
Government National Mortgage Association 4.5% 0.00 161,683 154,027 2046-12-20Commercial Mortgage Trust 2015-LC23 3.22% 0.00 161,677 161,817 2053-10-10The Government of Jordan 2.58% 0.00 161,654 164,146 2022-06-30Federal National Mortgage Association 5% 0.00 161,650 151,930 2040-06-01Government National Mortgage Association 5% 0.00 161,533 151,467 2040-10-20................................................................................................................................................................................................................................................................................................Federal National Mortgage Association 5% 0.00 161,363 151,996 2033-12-01Sumitomo Mitsui Banking Corporation 3% 0.00 161,033 165,875 2023-01-18Federal Farm Credit Banks 1.55% 0.00 160,940 164,146 2020-05-08Federal Home Loan Banks 1.8% 0.00 160,915 164,146 2020-08-28Federal National Mortgage Association 4% 0.00 160,670 157,942 2040-07-01................................................................................................................................................................................................................................................................................................Jpmdb Commercial Mortgage Secu 3.99% 0.00 160,626 162,056 2049-06-15Morgan Stanley Bank of America Merrill LynchTrust,2015-C23 3.45%
0.00 160,332 162,056 2050-07-15
Johnson & Johnson 3.55% 0.00 160,238 157,976 2021-05-15SunTrust Bank 2.25% 0.00 160,116 161,925 2020-01-31Jp Morgan Chase Coml Mtg Sec Tst 17 3.05% 0.00 159,811 161,817 2050-07-15................................................................................................................................................................................................................................................................................................Federal National Mortgage Association 3.06% 0.00 159,640 162,056 2024-06-25Federal National Mortgage Association 6% 0.00 159,577 146,381 2033-12-01Wells Fargo Coml T 3.64% 0.00 159,511 161,817 2050-03-15WELLS FARGO COMMERCIAL MORTGAGE TRUST3.63%
0.00 159,491 161,817 2060-01-15
Federal National Mortgage Association 3% 0.00 159,351 164,951 2042-10-01................................................................................................................................................................................................................................................................................................Carmax Auto Owner Trust 3.13% 0.00 158,880 158,882 2023-06-15Bank Of Amer Merrill Lynch Coml Mtg 3.57% 0.00 158,875 161,817 2050-02-15FORD CREDIT AUTO LEASE TRUST 3.19% 0.00 158,873 158,882 2021-12-15Express Scripts Holding Co 3.9% 0.00 158,865 157,976 2022-02-15WORLD OMNI AUTO TRUST 3.13% 0.00 158,811 158,882 2023-11-15................................................................................................................................................................................................................................................................................................Federal National Mortgage Association 4.5% 0.00 158,623 152,299 2039-04-01Ally Auto Rcvbls 3% 0.00 158,591 158,882 2023-01-17Federal Home Loan Mortgage Corporation 4% 0.00 158,545 156,244 2044-11-01Ally Auto Rcvbls 2.92% 0.00 158,519 158,882 2022-11-15UBS Cml Mtg Tr 3.58% 0.00 158,464 161,817 2050-12-15................................................................................................................................................................................................................................................................................................Centerpoint Energy Houston Electric LLC 2.25% 0.00 158,400 165,875 2022-08-01Carmax Auto Owner Trust 2.98% 0.00 158,325 158,882 2023-01-17Federal Home Loan Mortgage Corporation 3.5% 0.00 157,835 157,014 2026-01-01Nissan Auto Rec Tr 2018-A 2.65% 0.00 157,821 158,882 2022-05-16Consolidated Edison Company of New York, Inc. 5.7% 0.00 157,794 134,731 2040-06-15................................................................................................................................................................................................................................................................................................Federal National Mortgage Association 4% 0.00 157,465 154,947 2043-08-01CCUBS COML MTG TR 2017-C1 3.54% 0.00 157,426 161,817 2050-11-15Federal Home Loan Mortgage Corporation 2.5% 0.00 157,164 161,781 2028-10-01ALLY AUTO RECV TR 2017-1 1.75% 0.00 157,041 158,882 2021-12-15Sierra Pacific Power Company 3.38% 0.00 157,037 157,976 2023-08-15................................................................................................................................................................................................................................................................................................Federal National Mortgage Association 4% 0.00 156,962 154,237 2031-08-01Ford Motor Credit Company LLC 2.6% 0.00 156,701 157,976 2019-11-04MetLife Inc. 4.05% 0.00 156,664 167,452 2045-03-01Wells Fargo & Company 3% 0.00 156,655 157,976 2021-01-22Honda Auto Receivables Owner Trust 1.79% 0.00 156,617 158,882 2021-09-20ENTERGY TEXAS RESTORATION FUNDING, LLC 4.38% 0.00 156,411 152,923 2023-11-01Jpmdb Coml Mtg Sec Tr 2016-C4 3.64% 0.00 156,395 162,056 2049-12-15Federal Home Loan Mortgage Corporation 5% 0.00 156,304 147,079 2039-09-01Federal Home Loan Mortgage Corporation 5.5% 0.00 156,097 144,179 2033-11-01Ford Motor Credit Company LLC 3.47% 0.00 156,047 157,976 2021-04-05................................................................................................................................................................................................................................................................................................Government National Mortgage Association 2.5% 0.00 155,329 163,711 2043-11-20Federal Home Loan Mortgage Corporation 5.5% 0.00 155,139 143,234 2033-12-01Swedish Export Credit Corporation 1.88% 0.00 155,064 157,976 2020-06-23Government National Mortgage Association 5% 0.00 154,850 145,581 2033-07-15Ontario (Province Of) 2.5% 0.00 154,833 157,976 2021-09-10................................................................................................................................................................................................................................................................................................
©2018 Morningstar, Inc., Morningstar Investment Profiles™ 312-696-6000. All rights reserved. The information contained herein: (1) is proprietary to Morningstar and/or its content providers; (2) maynot be copied or distributed and (3) is not warranted to be accurate, complete or timely. Neither Morningstar nor its content providers are responsible for any damages or losses arising from any use ofinformation. Past performance is no guarantee of future performance. Visit our investment website at www.morningstar.com ß
®

Page 91 of 162
Broad Market Bond Index Fund.......................................................................................................................................................................................................................................................................................................................................
Total Stocks Total Bonds Total Cash0 9083 28
Bond Portfolio Analysis as of 09-30-18Security Name Net Assets % Market Value $ Amount $ Maturity Date
Federal National Mortgage Association 2.48% 0.00 154,485 158,363 2022-04-25Duke Energy Carolinas LLC 6.1% 0.00 154,463 127,417 2037-06-01Starbucks Corporation 2.1% 0.00 154,192 157,976 2021-02-04Federal Home Loan Mortgage Corporation 5.5% 0.00 154,178 142,317 2033-10-01Massachusetts Institute of Technology 4.68% 0.00 153,794 143,200 .................................................................................................................................................................................................................................................................................................GNMA PASS-THRU M SINGLE FAMILY 4.5% 0.00 153,703 146,720 2044-11-20Government National Mortgage Association 5% 0.00 153,531 142,307 2040-06-20Federal Home Loan Mortgage Corporation 5.5% 0.00 153,515 141,885 2036-04-01Federal National Mortgage Association 5.5% 0.00 153,456 142,215 2033-05-01Government National Mortgage Association 5.5% 0.00 152,684 141,718 2033-12-20................................................................................................................................................................................................................................................................................................Federal National Mortgage Association 3% 0.00 152,586 158,024 2043-09-01Citigroup Commercial Mortgage Trust 2.9% 0.00 152,433 161,817 2049-07-10The Hartford Financial Services Group, Inc. 6.62% 0.00 152,195 123,568 2040-03-30Federal Home Loan Mortgage Corporation 6% 0.00 152,154 137,645 2037-02-01CMS Energy Corporation 3% 0.00 151,516 161,925 2026-05-15................................................................................................................................................................................................................................................................................................Government National Mortgage Association 4% 0.00 151,155 147,668 2041-07-15Westar Energy Inc. 4.1% 0.00 151,075 153,979 2043-04-01AT&T Inc 4.5% 0.00 151,049 161,677 2035-05-15Federal Home Loan Mortgage Corporation 5.5% 0.00 150,992 136,911 2036-01-01Federal National Mortgage Association 5.5% 0.00 150,914 139,582 2038-11-01................................................................................................................................................................................................................................................................................................Thomson Reuters Corp. 5.65% 0.00 150,337 142,430 2043-11-23Citigroup Commercial Mortgage Trust 2.65% 0.00 150,248 162,056 2049-07-10Federal National Mortgage Association 4.5% 0.00 149,827 143,919 2040-07-01Federal National Mortgage Association 6% 0.00 149,672 136,159 2037-12-01Government National Mortgage Association 5.5% 0.00 149,634 139,371 2041-09-20................................................................................................................................................................................................................................................................................................Government National Mortgage Association 4% 0.00 149,438 146,678 2046-07-20Federal National Mortgage Association 3.5% 0.00 149,278 150,470 2043-03-01GNMA PASS-THRU M SINGLE FAMILY 4.5% 0.00 149,151 142,374 2044-04-20Government National Mortgage Association 5.5% 0.00 149,111 138,377 2034-07-20Federal Home Loan Mortgage Corporation 4.5% 0.00 148,955 142,793 2039-10-01................................................................................................................................................................................................................................................................................................Government National Mortgage Association 3% 0.00 148,873 152,531 2043-03-15Sunoco Logistics Partners Operations L.P. 5.95% 0.00 148,647 138,229 2025-12-01Government National Mortgage Association 4% 0.00 148,618 145,724 2026-07-15Rockwell Automation, Inc. 5.2% 0.00 148,552 152,054 .Government National Mortgage Association 4% 0.00 148,309 144,833 2041-09-15................................................................................................................................................................................................................................................................................................Tennessee Valley Authority 4.88% 0.00 148,053 124,745 2048-01-15Philip Morris International Inc. 4.25% 0.00 147,972 157,058 2044-11-10TOYOTA AUTO RECEIVABLES OWNER TRUST 3.02% 0.00 147,950 148,290 2022-12-15LYB International Finance II B.V. 3.5% 0.00 147,835 157,976 2027-03-02Danaher Corporation 2.4% 0.00 147,641 150,077 2020-09-15................................................................................................................................................................................................................................................................................................Government National Mortgage Association 4.5% 0.00 147,414 141,279 2041-04-15Government National Mortgage Association 2.5% 0.00 147,312 151,043 2028-11-20Federal National Mortgage Association 3% 0.00 147,009 147,937 2026-02-01COMM 2013-CCRE11 Mortgage Trust 3.66% 0.00 146,884 145,850 2046-10-10Federal Home Loan Mortgage Corporation 4.5% 0.00 146,761 141,483 2025-03-01Federal Home Loan Mortgage Corporation 6% 0.00 146,753 132,735 2037-09-01American Water Capital Corp 4.3% 0.00 146,010 148,204 2042-12-01Federal National Mortgage Association 4.5% 0.00 145,983 140,497 2038-03-01Federal National Mortgage Association 4.5% 0.00 145,959 140,946 2030-05-01Federal Home Loan Mortgage Corporation 2.73% 0.00 145,864 148,333 2022-06-25................................................................................................................................................................................................................................................................................................Federal National Mortgage Association 6% 0.00 145,773 132,441 2033-03-01Federal Home Loan Mortgage Corporation 6% 0.00 145,633 133,118 2033-07-01Federal National Mortgage Association 5.5% 0.00 145,597 134,915 2034-09-01Federal Home Loan Mortgage Corporation 2.5% 0.00 145,475 149,750 2028-11-01Federal National Mortgage Association 5% 0.00 145,287 138,398 2023-10-01................................................................................................................................................................................................................................................................................................Comcast Corporation 3.38% 0.00 145,274 150,077 2025-02-15Government National Mortgage Association 6% 0.00 144,789 134,011 2038-04-15Commercial Mortgage Trust 2012-CCRE5 2.77% 0.00 144,653 148,333 2045-12-10Goldman Sachs Group, Inc. 2.6% 0.00 144,653 146,128 2020-04-23Federal Home Loan Mortgage Corporation 4.5% 0.00 144,461 139,900 2023-07-01................................................................................................................................................................................................................................................................................................
©2018 Morningstar, Inc., Morningstar Investment Profiles™ 312-696-6000. All rights reserved. The information contained herein: (1) is proprietary to Morningstar and/or its content providers; (2) maynot be copied or distributed and (3) is not warranted to be accurate, complete or timely. Neither Morningstar nor its content providers are responsible for any damages or losses arising from any use ofinformation. Past performance is no guarantee of future performance. Visit our investment website at www.morningstar.com ß
®

Page 92 of 162
Broad Market Bond Index Fund.......................................................................................................................................................................................................................................................................................................................................
Total Stocks Total Bonds Total Cash0 9083 28
Bond Portfolio Analysis as of 09-30-18Security Name Net Assets % Market Value $ Amount $ Maturity Date
Federal National Mortgage Association 3.5% 0.00 144,352 145,531 2043-06-01Ford Credit Floorplan Master Owner Trust A 3.17% 0.00 144,234 145,642 2025-03-15Federal National Mortgage Association 3.5% 0.00 143,887 145,191 2043-07-01Federal National Mortgage Association 6% 0.00 143,754 130,469 2039-01-01Federal National Mortgage Association 5.5% 0.00 143,482 133,000 2033-05-01................................................................................................................................................................................................................................................................................................ERP Operating Limited Partnership 4.5% 0.00 143,019 142,430 2045-06-01The Coca-Cola Company 3.15% 0.00 142,593 142,178 2020-11-15Discovery Communications, LLC 3.95% 0.00 142,588 146,128 2025-06-15Federal National Mortgage Association 3.5% 0.00 142,250 143,452 2043-05-01Federal National Mortgage Association 2.94% 0.00 142,217 143,279 2021-07-25................................................................................................................................................................................................................................................................................................Government National Mortgage Association 4.5% 0.00 142,157 136,242 2039-08-15Government National Mortgage Association 3.5% 0.00 141,889 142,046 2042-03-15Amgen Inc. 5.65% 0.00 141,648 127,032 2042-06-15Commercial Mortgage Trust 2015-Ccre23 3.26% 0.00 141,622 143,149 2048-05-10Whirlpool Corporation 4.5% 0.00 141,580 161,677 2046-06-01................................................................................................................................................................................................................................................................................................Federal National Mortgage Association 3% 0.00 141,561 142,508 2021-12-01Parker-Hannifin Corporation 4.1% 0.00 141,342 144,355 2047-03-01WORLD OMNI AUTO TRUST 2.5% 0.00 141,139 142,994 2023-04-17Federal Home Loan Mortgage Corporation 3.5% 0.00 141,046 142,189 2042-02-01Tennessee Gas Pipeline Company 8.38% 0.00 140,934 111,634 2032-06-15................................................................................................................................................................................................................................................................................................Federal Home Loan Mortgage Corporation 4% 0.00 140,760 138,315 2031-08-01Government National Mortgage Association 5% 0.00 140,390 133,017 2040-08-15Federal Home Loan Mortgage Corporation 5.5% 0.00 140,223 130,112 2037-05-01Federal Home Loan Mortgage Corporation 4.31% 0.00 140,129 134,190 2041-08-01WF-RBS Commercial Mortgage Trust 2013 C16 4.67% 0.00 140,110 134,848 2046-09-15................................................................................................................................................................................................................................................................................................CITIGROUP COMMERCIAL MORTGAGE TRUST 4.37% 0.00 140,103 134,848 2046-09-10Federal National Mortgage Association 2.57% 0.00 139,931 143,754 2023-03-25JP Morgan Chase Commercial Mortgage SecuritiesCorp 3.37%
0.00 139,731 141,590 2047-12-15
Government National Mortgage Association 5% 0.00 139,704 133,088 2033-10-15Government National Mortgage Association 3% 0.00 139,575 140,242 2030-11-20................................................................................................................................................................................................................................................................................................BENCHMARK MORTGAGE TRUST 4.2% 0.00 139,377 134,848 2051-11-10Federal National Mortgage Association 5.5% 0.00 139,314 129,180 2033-04-01Commercial Mortgage Trust 4.19% 0.00 139,276 134,848 2046-10-10UBS COMMERCIAL MORTGAGE TRUST 4.33% 0.00 139,228 134,848 2051-10-15COMM Mortgage Trust 2013-LC13 4.2% 0.00 139,207 134,848 2046-08-10................................................................................................................................................................................................................................................................................................CITIGROUP COMMERCIAL MORTGAGE TRUST 4.65% 0.00 138,973 134,848 2046-09-10J.P. Morgan Chase Commercial Mortgage SecuritiesTrust 4.17%
0.00 138,714 134,848 2046-12-15
Federal National Mortgage Association 5% 0.00 138,628 130,613 2035-09-01WFRBS Commercial Mortgage Trust 2013-C18 4.16% 0.00 138,490 134,848 2046-12-15The Sherwin-Williams Company 4.55% 0.00 138,469 144,355 2045-08-01The Toledo Edison Company 7.25% 0.00 138,260 131,120 2020-05-01Federal National Mortgage Association 6.5% 0.00 138,092 122,749 2036-07-01Government National Mortgage Association 5% 0.00 137,919 129,417 2033-05-20Humana Inc. 2.62% 0.00 137,673 138,229 2019-10-01PSNH Funding LLC 3 3.81% 0.00 137,658 137,698 2035-02-01................................................................................................................................................................................................................................................................................................Volkswagen Auto Loan Enhanced Trust 3.02% 0.00 137,604 137,698 2022-11-21Carmax Auto Owner Trust 3.16% 0.00 137,577 137,698 2023-07-17Merc-Benz Auto Recv Tr 2018-1 3.03% 0.00 137,532 137,698 2023-01-17Federal National Mortgage Association 5.5% 0.00 137,373 127,173 2034-04-01Dominion Energy Inc 2.5% 0.00 137,157 138,229 2019-12-01................................................................................................................................................................................................................................................................................................JPMBB COMMERCIAL MORTGAGE SECURITIES TRUST4.24%
0.00 137,154 134,848 2047-04-15
Altria Group, Inc. 2.62% 0.00 137,021 150,077 2026-09-16WORLD OMNI AUTO TRUST 2.87% 0.00 136,921 137,698 2023-07-17Government National Mortgage Association 2.5% 0.00 136,788 144,171 2043-10-20COMM MORTGAGE TRUST 4.19% 0.00 136,735 134,848 2047-09-10................................................................................................................................................................................................................................................................................................
©2018 Morningstar, Inc., Morningstar Investment Profiles™ 312-696-6000. All rights reserved. The information contained herein: (1) is proprietary to Morningstar and/or its content providers; (2) maynot be copied or distributed and (3) is not warranted to be accurate, complete or timely. Neither Morningstar nor its content providers are responsible for any damages or losses arising from any use ofinformation. Past performance is no guarantee of future performance. Visit our investment website at www.morningstar.com ß
®

Page 93 of 162
Broad Market Bond Index Fund.......................................................................................................................................................................................................................................................................................................................................
Total Stocks Total Bonds Total Cash0 9083 28
Bond Portfolio Analysis as of 09-30-18Security Name Net Assets % Market Value $ Amount $ Maturity Date
Northern States Power Company 5.35% 0.00 136,637 118,179 2039-11-01Federal Home Loan Mortgage Corporation 5% 0.00 136,500 128,524 2040-07-01Jpmcc Commercial Mortgage Securities 3.91% 0.00 136,348 134,848 2049-01-15Federal National Mortgage Association 3.5% 0.00 136,043 134,219 2025-11-01Federal National Mortgage Association 5.5% 0.00 135,857 125,912 2038-06-01................................................................................................................................................................................................................................................................................................AMERICREDIT AUTOMOBILE RECEIVABLES TRUST2.04%
0.00 135,828 137,698 2022-07-18
Federal National Mortgage Association 5.5% 0.00 135,810 126,847 2034-02-01WFRBS COML MTG TR 4.07% 0.00 135,778 134,848 2057-09-15Federal National Mortgage Association 5.5% 0.00 135,730 125,719 2035-11-01Energy Transfer Partners LP 4.75% 0.00 135,668 134,280 2026-01-15................................................................................................................................................................................................................................................................................................Federal Home Loan Mortgage Corporation 4.5% 0.00 135,624 129,989 2041-04-01Federal National Mortgage Association 3% 0.00 135,605 136,464 2027-04-01Federal National Mortgage Association 4.5% 0.00 135,581 130,195 2039-06-01CFCRE Commercial Mortgage Trust 3.86% 0.00 135,090 134,848 2048-01-10Wells Fargo Commercial Mortgage Trust 3.54% 0.00 134,737 134,848 2045-10-15................................................................................................................................................................................................................................................................................................Federal Home Loan Mortgage Corporation 5% 0.00 134,668 127,249 2035-12-01Federal National Mortgage Association 4% 0.00 134,431 132,146 2042-06-01Federal Home Loan Mortgage Corporation 0% 0.00 134,427 199,593 2029-12-17Federal Home Loan Mortgage Corporation 5.5% 0.00 134,386 124,031 2033-04-01Federal Home Loan Mortgage Corporation 2.5% 0.00 134,341 138,288 2028-09-01................................................................................................................................................................................................................................................................................................Federal National Mortgage Association 6% 0.00 134,101 123,036 2033-03-01Diageo Capital plc 3.88% 0.00 134,065 140,505 2043-04-29Federal Home Loan Mortgage Corporation 3% 0.00 133,965 134,959 2026-11-01WFRBS Commercial Mtg Tst 2011-C2 3.56% 0.00 133,919 134,848 2048-03-15Wells Fargo Commercial Mortgage Trust 3.64% 0.00 133,809 134,848 2059-01-15................................................................................................................................................................................................................................................................................................Oneok Partners Lp 6.2% 0.00 133,744 119,333 2043-09-15JPMBB Commercial Mortgage Securities Trust 2015-C32 3.6%
0.00 133,661 134,848 2048-11-15
Government National Mortgage Association 4% 0.00 133,504 131,218 2039-10-15Wells Fargo Commercial Mortgage Trust 3.1% 0.00 133,371 134,848 2049-12-15Wf-Rbs Com Mg Tst 3.31% 0.00 133,363 134,848 2045-03-15................................................................................................................................................................................................................................................................................................Federal National Mortgage Association 4% 0.00 133,211 130,931 2040-11-01Cd 2016-Cd2 Mortga 3.53% 0.00 133,069 134,848 2049-11-10Morgan Stanley BAML Trust 3.83% 0.00 133,055 134,848 2047-12-15Wf-Rbs Com Mg Tst 3.04% 0.00 133,013 134,848 2045-03-15Government National Mortgage Association 6.5% 0.00 132,991 116,642 2037-10-20................................................................................................................................................................................................................................................................................................Citigroup Commercial Mortgage Trust 3.09% 0.00 132,911 134,848 2046-04-10Csail Commercial Mortgage Trust 2.99% 0.00 132,784 134,848 2050-06-15Virginia Electric and Power Company 3.8% 0.00 132,780 144,355 2047-09-15Federal Home Loan Mortgage Corporation 5% 0.00 132,725 125,147 2034-11-01WELLS FARGO COMMERCIAL MORTGAGE TRUST3.29%
0.00 132,719 135,046 2048-05-15
Morgan Stanley BAML Trust 3.38% 0.00 132,504 134,848 2048-12-15Federal Home Loan Mortgage Corporation 2.68% 0.00 132,493 135,046 2022-10-25Morgan Stanley BAML Trust 3.6% 0.00 132,363 134,848 2050-05-15Citigroup ComlMtg 3.79% 0.00 132,347 134,848 2050-09-15GS Mortgage Securities Corp II 3.12% 0.00 132,120 134,848 2045-11-10................................................................................................................................................................................................................................................................................................Federal Home Loan Mortgage Corporation 3% 0.00 132,006 133,968 2032-03-01Government National Mortgage Association 5.5% 0.00 131,873 122,767 2039-10-15Wells Fargo Coml Tr 2016-C33 3.43% 0.00 131,739 134,848 2059-03-15Federal National Mortgage Association 6% 0.00 131,641 120,349 2038-05-01Federal National Mortgage Association 5% 0.00 131,628 123,771 2040-06-01................................................................................................................................................................................................................................................................................................Morgan Stanley 3.21% 0.00 131,491 134,848 2046-02-15Government National Mortgage Association 4.5% 0.00 131,377 125,049 2033-09-15WELLS FARGO COMMERCIAL MORTGAGE TRUST3.15%
0.00 131,310 134,848 2048-05-15
Federal Home Loan Mortgage Corporation 3.5% 0.00 131,185 130,265 2030-04-01Commercial Mortgage Trust 3.25% 0.00 131,020 134,848 2045-10-15................................................................................................................................................................................................................................................................................................
©2018 Morningstar, Inc., Morningstar Investment Profiles™ 312-696-6000. All rights reserved. The information contained herein: (1) is proprietary to Morningstar and/or its content providers; (2) maynot be copied or distributed and (3) is not warranted to be accurate, complete or timely. Neither Morningstar nor its content providers are responsible for any damages or losses arising from any use ofinformation. Past performance is no guarantee of future performance. Visit our investment website at www.morningstar.com ß
®

Page 94 of 162
Broad Market Bond Index Fund.......................................................................................................................................................................................................................................................................................................................................
Total Stocks Total Bonds Total Cash0 9083 28
Bond Portfolio Analysis as of 09-30-18Security Name Net Assets % Market Value $ Amount $ Maturity Date
Federal Home Loan Mortgage Corporation 3.42% 0.00 130,799 134,848 2032-04-25Government National Mortgage Association 3.5% 0.00 130,685 130,829 2042-04-15Government National Mortgage Association 2.5% 0.00 130,522 134,514 2030-12-20GS MORTGAGE SECURITIES TRUST 4.26% 0.00 130,263 130,725 2047-04-10President & Fellows of Harvard College 6.5% 0.00 130,258 96,237 2039-01-15................................................................................................................................................................................................................................................................................................Csail Commercial Mortgage Trust 3.39% 0.00 130,084 134,848 2050-06-15Federal Home Loan Mortgage Corporation 5.5% 0.00 129,911 120,050 2036-03-01Midamerican Energy Company 5.8% 0.00 129,676 108,170 2036-10-15Government National Mortgage Association 5.5% 0.00 129,470 119,305 2033-06-15LyondellBasell Industries NV 4.62% 0.00 129,388 143,970 2055-02-26................................................................................................................................................................................................................................................................................................Citigroup Commercial Mortgage Trust 2015 2.67% 0.00 129,378 130,207 2048-04-10San Diego Gas & Electric Company 3% 0.00 129,252 130,330 2021-08-15Gilead Sciences, Inc. 2.35% 0.00 129,246 130,330 2020-02-01WELLS FARGO COMMERCIAL MORTGAGE TRUST2.86%
0.00 129,160 129,993 2048-05-15
Federal National Mortgage Association 2.15% 0.00 129,085 134,848 2023-01-25................................................................................................................................................................................................................................................................................................Federal National Mortgage Association 6% 0.00 128,988 118,403 2037-08-01Federal Home Loan Mortgage Corporation 5% 0.00 128,943 121,495 2038-09-01Ecolab Inc. 2.25% 0.00 128,939 130,330 2020-01-12The Home Depot, Inc. 3% 0.00 128,924 134,280 2026-04-01Federal National Mortgage Association 2% 0.00 128,866 137,376 2031-09-01................................................................................................................................................................................................................................................................................................Enterprise Products Operating LP 3.35% 0.00 128,849 130,330 2023-03-15J. B. Hunt Transport Services, Inc. 3.85% 0.00 128,831 130,330 2024-03-15Mead Johnson Nutrition Company 4.6% 0.00 128,535 127,032 2044-06-01Federal Home Loan Mortgage Corporation 3% 0.00 128,287 132,867 2043-04-01Federal National Mortgage Association 2.7% 0.00 128,170 134,848 2026-02-25................................................................................................................................................................................................................................................................................................Florida Power & Light Company 3.95% 0.00 128,161 130,882 2048-03-01Agilent Technologies Inc. 3.2% 0.00 128,091 130,330 2022-10-01Federal Home Loan Mortgage Corporation 5.5% 0.00 127,973 118,655 2041-06-01Federal National Mortgage Association 2.26% 0.00 127,927 132,185 2023-02-25TD AMERITRADE Holding Corporation 2.95% 0.00 127,817 130,330 2022-04-01................................................................................................................................................................................................................................................................................................Government National Mortgage Association 5.5% 0.00 127,576 117,464 2033-06-15Morgan Stanley Capital I Trust 2016-BNK2 3.05% 0.00 127,491 134,848 2049-11-15Federal Home Loan Mortgage Corporation 6% 0.00 127,453 115,321 2036-11-01Federal Home Loan Mortgage Corporation 3% 0.00 127,353 131,969 2043-05-01Federal National Mortgage Association 4% 0.00 127,139 124,535 2024-05-01................................................................................................................................................................................................................................................................................................Stanley Black & Decker, Inc. 3.4% 0.00 127,024 126,381 2021-12-01Federal Home Loan Mortgage Corporation 4.5% 0.00 127,023 121,990 2039-11-01Government National Mortgage Association 2.5% 0.00 126,982 130,863 2030-07-20The Procter & Gamble Company 3.5% 0.00 126,941 136,656 2047-10-25Ford Credit Auto Lease Trust 2.93% 0.00 126,864 127,106 2021-06-15Federal Home Loan Mortgage Corporation 3% 0.00 126,726 129,959 2035-11-01Federal National Mortgage Association 4% 0.00 126,231 124,070 2041-11-01Government National Mortgage Association 5% 0.00 125,886 116,972 2035-03-20Federal National Mortgage Association 5% 0.00 125,882 118,307 2041-04-01Seagate HDD Cayman 4.88% 0.00 125,633 134,280 2027-06-01................................................................................................................................................................................................................................................................................................Federal National Mortgage Association 5.5% 0.00 125,557 116,328 2033-05-01Exelon Corporation 5.1% 0.00 125,396 118,948 2045-06-15Koninklijke Philips NV 6.88% 0.00 125,275 96,237 2038-03-11American Express Credit Account Master Trust 3.18% 0.00 124,807 124,987 2024-04-15Federal Home Loan Mortgage Corporation 5.5% 0.00 124,806 115,551 2037-11-01................................................................................................................................................................................................................................................................................................Government National Mortgage Association 5.5% 0.00 124,727 115,824 2035-10-20Federal Home Loan Mortgage Corporation 3% 0.00 124,601 126,450 2033-11-01Federal Home Loan Mortgage Corporation 5.5% 0.00 124,520 115,070 2036-08-01Baker Hughes A Ge 5.12% 0.00 124,412 118,179 2040-09-15Federal Home Loan Mortgage Corporation 5.5% 0.00 124,282 114,806 2033-08-01................................................................................................................................................................................................................................................................................................
©2018 Morningstar, Inc., Morningstar Investment Profiles™ 312-696-6000. All rights reserved. The information contained herein: (1) is proprietary to Morningstar and/or its content providers; (2) maynot be copied or distributed and (3) is not warranted to be accurate, complete or timely. Neither Morningstar nor its content providers are responsible for any damages or losses arising from any use ofinformation. Past performance is no guarantee of future performance. Visit our investment website at www.morningstar.com ß
®

Page 95 of 162
Broad Market Bond Index Fund.......................................................................................................................................................................................................................................................................................................................................
Total Stocks Total Bonds Total Cash0 9083 28
Bond Portfolio Analysis as of 09-30-18Security Name Net Assets % Market Value $ Amount $ Maturity Date
Government National Mortgage Association 5% 0.00 124,281 116,637 2040-02-20Federal Home Loan Mortgage Corporation 3% 0.00 124,191 125,406 2029-01-01PPL Capital Funding Inc. 5% 0.00 124,184 119,333 2044-03-15Federal National Mortgage Association 4% 0.00 124,007 122,391 2046-04-01Federal National Mortgage Association 4% 0.00 123,982 121,452 2025-05-01................................................................................................................................................................................................................................................................................................Government National Mortgage Association 5% 0.00 123,917 116,066 2033-07-15Government National Mortgage Association 4.5% 0.00 123,255 118,111 2039-03-15Government National Mortgage Association 5% 0.00 123,178 116,035 2040-03-15Celgene Corporation 4.62% 0.00 123,166 130,882 2044-05-15Government National Mortgage Association 3.5% 0.00 122,667 123,410 2045-02-15................................................................................................................................................................................................................................................................................................Federal Home Loan Banks 2.38% 0.00 122,617 123,109 2019-12-13Federal National Mortgage Association 4% 0.00 122,607 120,512 2041-10-01Federal National Mortgage Association 3% 0.00 122,578 123,354 2026-12-01Federal National Mortgage Association 5.5% 0.00 122,547 113,622 2040-06-01Government National Mortgage Association 5.5% 0.00 122,127 113,598 2038-11-15................................................................................................................................................................................................................................................................................................Federal Home Loan Mortgage Corporation 3.5% 0.00 122,008 121,378 2025-11-01Pacific Gas and Electric Company 4.3% 0.00 121,908 133,191 2045-03-15Federal Home Loan Mortgage Corporation 4.5% 0.00 121,653 116,613 2040-04-01Comcast Corporation 4% 0.00 121,616 136,656 2049-11-01Federal National Mortgage Association 5.5% 0.00 121,397 111,659 2033-03-01................................................................................................................................................................................................................................................................................................Federal National Mortgage Association 1.62% 0.00 121,357 123,109 2020-01-21Federal Home Loan Mortgage Corporation 4.5% 0.00 120,826 115,927 2041-07-01Gs Mortgage Securities Trust 2015-Gc32 3.76% 0.00 120,792 120,015 2048-07-10Duke Energy Corp 3.75% 0.00 120,425 137,041 2046-09-01Government National Mortgage Association 6% 0.00 119,911 109,838 2034-07-20................................................................................................................................................................................................................................................................................................Government National Mortgage Association 4% 0.00 119,623 117,304 2025-06-15Ally Master Owner Trust 2.04% 0.00 119,321 121,810 2022-06-15Federal Home Loan Mortgage Corporation 3% 0.00 118,880 119,761 2026-10-01Federal Home Loan Mortgage Corporation 2.5% 0.00 118,763 122,253 2028-10-01Government National Mortgage Association 3.5% 0.00 118,763 118,894 2041-10-15................................................................................................................................................................................................................................................................................................Consolidated Edison Company of New York, Inc. 3.85% 0.00 118,431 127,032 2046-06-15Government National Mortgage Association 4.5% 0.00 118,040 113,134 2039-07-15Equity One, Inc. 3.75% 0.00 117,502 118,482 2022-11-15Government National Mortgage Association 6% 0.00 117,403 107,680 2032-05-20Federal National Mortgage Association 6% 0.00 117,368 106,620 2034-08-01................................................................................................................................................................................................................................................................................................Federal National Mortgage Association 4% 0.00 117,257 115,250 2041-11-01Total Capital International S.A. 2.75% 0.00 117,248 118,482 2021-06-19Sysco Corporation 3.3% 0.00 117,011 122,431 2026-07-15PECO Energy Company 3.7% 0.00 116,646 127,032 2047-09-15Federal National Mortgage Association 4% 0.00 116,051 114,039 2031-07-01Federal National Mortgage Association 5% 0.00 116,009 109,607 2040-08-01Government National Mortgage Association 5% 0.00 115,761 108,604 2038-03-20Oracle Corporation 2.5% 0.00 115,319 118,482 2022-05-15Verizon Communications Inc. 4.81% 0.00 115,256 114,329 2039-03-15Federal Home Loan Mortgage Corporation 4.5% 0.00 115,024 110,912 2033-09-01................................................................................................................................................................................................................................................................................................Huntington Auto Trust 1.93% 0.00 114,814 116,514 2022-04-15Federal National Mortgage Association 6% 0.00 114,789 104,180 2038-12-01Federal National Mortgage Association 6% 0.00 114,693 104,175 2033-05-01Hyundai Auto Recv Tr 2017 1.77% 0.00 114,672 116,514 2022-01-18The Estee Lauder Companies Inc. 3.7% 0.00 114,670 125,108 2042-08-15................................................................................................................................................................................................................................................................................................Federal National Mortgage Association 6% 0.00 114,539 105,768 2038-10-01Federal National Mortgage Association 6% 0.00 114,286 103,470 2036-02-01Government National Mortgage Association 3.5% 0.00 114,269 114,264 2043-06-20Federal National Mortgage Association 4% 0.00 114,067 112,058 2041-09-01TEXAS ST 4.68% 0.00 113,664 103,936 2040-04-01................................................................................................................................................................................................................................................................................................JPMBB Commercial Mortgage Securities Trust 3.76% 0.00 113,517 112,243 2046-08-15Federal National Mortgage Association 4.5% 0.00 113,509 109,998 2023-09-01Thermo Fisher Scientific Inc 2.95% 0.00 113,380 122,431 2026-09-19Federal National Mortgage Association 5% 0.00 112,779 106,408 2039-10-01Federal National Mortgage Association 6% 0.00 112,664 103,974 2032-12-01................................................................................................................................................................................................................................................................................................
©2018 Morningstar, Inc., Morningstar Investment Profiles™ 312-696-6000. All rights reserved. The information contained herein: (1) is proprietary to Morningstar and/or its content providers; (2) maynot be copied or distributed and (3) is not warranted to be accurate, complete or timely. Neither Morningstar nor its content providers are responsible for any damages or losses arising from any use ofinformation. Past performance is no guarantee of future performance. Visit our investment website at www.morningstar.com ß
®

Page 96 of 162
Broad Market Bond Index Fund.......................................................................................................................................................................................................................................................................................................................................
Total Stocks Total Bonds Total Cash0 9083 28
Bond Portfolio Analysis as of 09-30-18Security Name Net Assets % Market Value $ Amount $ Maturity Date
Federal National Mortgage Association 5% 0.00 112,365 105,913 2033-03-01Federal National Mortgage Association 5.5% 0.00 112,353 104,029 2034-01-01Intel Corporation 2.7% 0.00 112,053 114,533 2022-12-15COMM MORTGAGE TRUST 4.24% 0.00 111,598 107,878 2047-02-10Commercial Mortgage Trust 4.21% 0.00 111,432 107,878 2046-08-10................................................................................................................................................................................................................................................................................................Government National Mortgage Association 6% 0.00 111,367 102,486 2037-01-15Government National Mortgage Association 5% 0.00 111,316 104,781 2039-10-15LOS ANGELES CNTY CALIF PUB WKS FING AUTH 7.62% 0.00 111,113 76,989 2040-08-01Wells Fargo Commercial Mortgage Trust 4.42% 0.00 110,797 108,037 2046-07-15WFRBS COMMERCIAL MORTGAGE TRUST 4.08% 0.00 110,464 107,878 2046-03-15................................................................................................................................................................................................................................................................................................Apache Corporation 3.25% 0.00 110,410 112,163 2022-04-15Federal Home Loan Mortgage Corporation 4% 0.00 110,232 107,710 2025-02-01Spectra Energy Partners, LP 4.75% 0.00 110,196 106,634 2024-03-15Petroleos Mexicanos 6.75% 0.00 110,194 115,484 2047-09-21Kohls Corporation 4.75% 0.00 110,185 108,213 2023-12-15................................................................................................................................................................................................................................................................................................MORGAN STANLEY BANK OF AMERICA MERRILLLYNCH TRUST 4.06%
0.00 110,043 107,878 2047-02-15
Federal Home Loan Mortgage Corporation 5.5% 0.00 109,952 102,540 2033-03-01Federal National Mortgage Association 4% 0.00 109,911 108,685 2046-04-01RGS (I&M) Funding Corporation 9.81% 0.00 109,877 107,969 2022-12-07Virginia Electric and Power Company 4% 0.00 109,569 114,329 2043-01-15................................................................................................................................................................................................................................................................................................Government National Mortgage Association 5.5% 0.00 109,412 101,780 2039-02-15Suncor Energy Inc. 6.5% 0.00 109,389 88,538 2038-06-15Government National Mortgage Association 6% 0.00 109,142 100,144 2035-08-15Paccar Financial Corp 1.95% 0.00 108,992 110,583 2020-02-27Government National Mortgage Association 5% 0.00 108,767 102,434 2034-02-15................................................................................................................................................................................................................................................................................................Government National Mortgage Association 5% 0.00 108,587 102,269 2039-09-15Boston Properties, Inc. 4.12% 0.00 108,441 106,634 2021-05-15PacifiCorp 5.25% 0.00 108,023 96,237 2035-06-15Federal Home Loan Mortgage Corporation 3% 0.00 107,953 108,754 2026-01-01Federal National Mortgage Association 4.5% 0.00 107,901 103,613 2039-02-01................................................................................................................................................................................................................................................................................................Government National Mortgage Association 6% 0.00 107,830 98,686 2042-05-20Wells Fargo Commercial Mortgage Trust 3.79% 0.00 107,662 107,878 2049-12-15Federal Home Loan Mortgage Corporation 5.5% 0.00 107,560 99,294 2034-12-01Csmc Coml Mtg Tr 2016-Nxsr 3.79% 0.00 107,468 108,037 2049-12-15Keurig Dr Pepper Inc 2.55% 0.00 106,989 122,431 2026-09-15Federal Home Loan Mortgage Corporation 3% 0.00 106,953 110,817 2043-08-01Federal Home Loan Mortgage Corporation 5.5% 0.00 106,937 100,411 2033-09-01JPMBB Commercial Mortgage Securities Trust 2015-C32 2.82%
0.00 106,935 107,878 2048-11-15
Citigroup Commercial Mortgage Trust 3.37% 0.00 106,803 108,037 2047-10-10Federal National Mortgage Association 6% 0.00 106,490 96,754 2040-06-01................................................................................................................................................................................................................................................................................................Santander Drive Auto Receivables Trust 2015-5 3.65% 0.00 106,331 105,922 2021-12-15Federal Home Loan Mortgage Corporation 3.5% 0.00 105,866 106,726 2043-08-01Citigroup Commercial Mortgage Trust 4.68% 0.00 105,672 108,037 2047-10-10Government National Mortgage Association 5% 0.00 105,431 98,989 2040-09-20Hyundai Auto Receivables Trust 2.79% 0.00 105,334 105,922 2022-07-15................................................................................................................................................................................................................................................................................................Santander Drive Auto 2017-1 3.17% 0.00 105,246 105,922 2023-04-17Santander Drive Auto 2017-1 2.58% 0.00 105,222 105,922 2022-05-16Jpmcc 2016-Jp3 2.43% 0.00 105,084 107,878 2049-08-15Federal National Mortgage Association 3% 0.00 105,030 106,862 2033-10-01Federal National Mortgage Association 5.5% 0.00 104,881 96,657 2033-11-01................................................................................................................................................................................................................................................................................................JPMBB COMMERCIAL MORTGAGE SECURITIES TRUST3.18%
0.00 104,861 107,878 2048-02-15
Federal National Mortgage Association 4% 0.00 104,802 103,552 2045-01-01Wells Fargo Coml T 2.4% 0.00 104,708 107,878 2049-11-15Government National Mortgage Association 6% 0.00 104,556 96,866 2042-07-20Federal National Mortgage Association 3% 0.00 104,534 108,194 2042-09-01................................................................................................................................................................................................................................................................................................
©2018 Morningstar, Inc., Morningstar Investment Profiles™ 312-696-6000. All rights reserved. The information contained herein: (1) is proprietary to Morningstar and/or its content providers; (2) maynot be copied or distributed and (3) is not warranted to be accurate, complete or timely. Neither Morningstar nor its content providers are responsible for any damages or losses arising from any use ofinformation. Past performance is no guarantee of future performance. Visit our investment website at www.morningstar.com ß
®
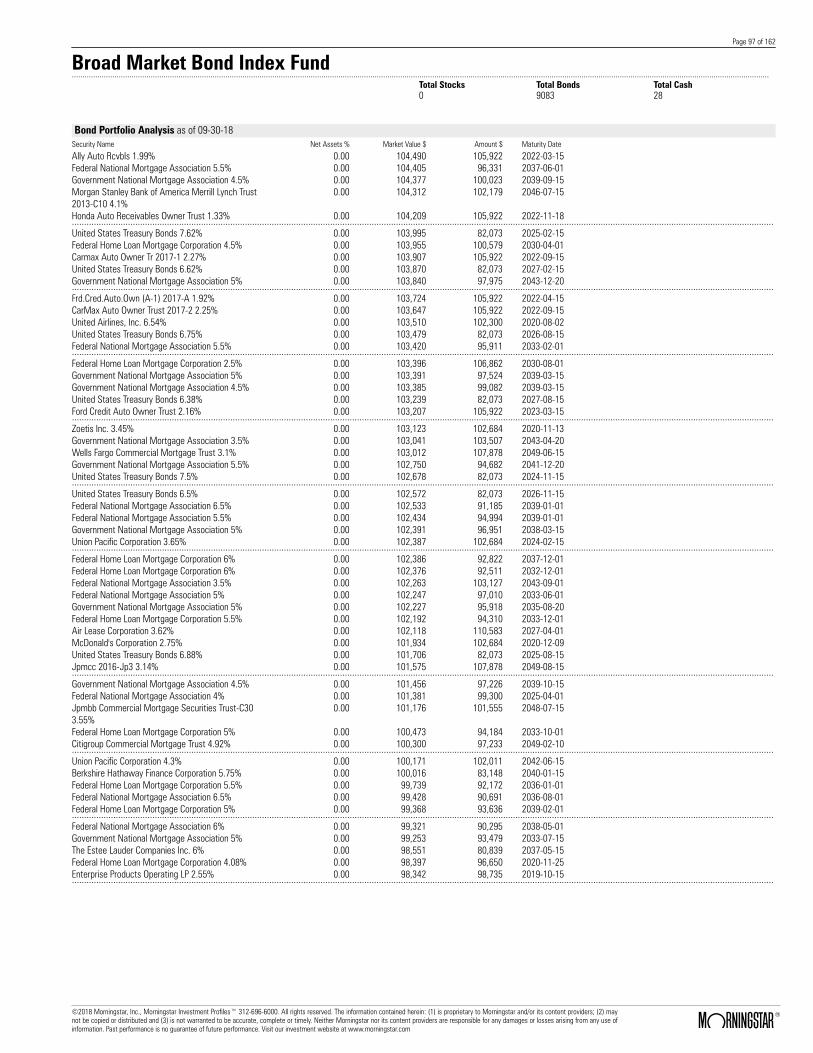
Page 97 of 162
Broad Market Bond Index Fund.......................................................................................................................................................................................................................................................................................................................................
Total Stocks Total Bonds Total Cash0 9083 28
Bond Portfolio Analysis as of 09-30-18Security Name Net Assets % Market Value $ Amount $ Maturity Date
Ally Auto Rcvbls 1.99% 0.00 104,490 105,922 2022-03-15Federal National Mortgage Association 5.5% 0.00 104,405 96,331 2037-06-01Government National Mortgage Association 4.5% 0.00 104,377 100,023 2039-09-15Morgan Stanley Bank of America Merrill Lynch Trust2013-C10 4.1%
0.00 104,312 102,179 2046-07-15
Honda Auto Receivables Owner Trust 1.33% 0.00 104,209 105,922 2022-11-18................................................................................................................................................................................................................................................................................................United States Treasury Bonds 7.62% 0.00 103,995 82,073 2025-02-15Federal Home Loan Mortgage Corporation 4.5% 0.00 103,955 100,579 2030-04-01Carmax Auto Owner Tr 2017-1 2.27% 0.00 103,907 105,922 2022-09-15United States Treasury Bonds 6.62% 0.00 103,870 82,073 2027-02-15Government National Mortgage Association 5% 0.00 103,840 97,975 2043-12-20................................................................................................................................................................................................................................................................................................Frd.Cred.Auto.Own (A-1) 2017-A 1.92% 0.00 103,724 105,922 2022-04-15CarMax Auto Owner Trust 2017-2 2.25% 0.00 103,647 105,922 2022-09-15United Airlines, Inc. 6.54% 0.00 103,510 102,300 2020-08-02United States Treasury Bonds 6.75% 0.00 103,479 82,073 2026-08-15Federal National Mortgage Association 5.5% 0.00 103,420 95,911 2033-02-01................................................................................................................................................................................................................................................................................................Federal Home Loan Mortgage Corporation 2.5% 0.00 103,396 106,862 2030-08-01Government National Mortgage Association 5% 0.00 103,391 97,524 2039-03-15Government National Mortgage Association 4.5% 0.00 103,385 99,082 2039-03-15United States Treasury Bonds 6.38% 0.00 103,239 82,073 2027-08-15Ford Credit Auto Owner Trust 2.16% 0.00 103,207 105,922 2023-03-15................................................................................................................................................................................................................................................................................................Zoetis Inc. 3.45% 0.00 103,123 102,684 2020-11-13Government National Mortgage Association 3.5% 0.00 103,041 103,507 2043-04-20Wells Fargo Commercial Mortgage Trust 3.1% 0.00 103,012 107,878 2049-06-15Government National Mortgage Association 5.5% 0.00 102,750 94,682 2041-12-20United States Treasury Bonds 7.5% 0.00 102,678 82,073 2024-11-15................................................................................................................................................................................................................................................................................................United States Treasury Bonds 6.5% 0.00 102,572 82,073 2026-11-15Federal National Mortgage Association 6.5% 0.00 102,533 91,185 2039-01-01Federal National Mortgage Association 5.5% 0.00 102,434 94,994 2039-01-01Government National Mortgage Association 5% 0.00 102,391 96,951 2038-03-15Union Pacific Corporation 3.65% 0.00 102,387 102,684 2024-02-15................................................................................................................................................................................................................................................................................................Federal Home Loan Mortgage Corporation 6% 0.00 102,386 92,822 2037-12-01Federal Home Loan Mortgage Corporation 6% 0.00 102,376 92,511 2032-12-01Federal National Mortgage Association 3.5% 0.00 102,263 103,127 2043-09-01Federal National Mortgage Association 5% 0.00 102,247 97,010 2033-06-01Government National Mortgage Association 5% 0.00 102,227 95,918 2035-08-20Federal Home Loan Mortgage Corporation 5.5% 0.00 102,192 94,310 2033-12-01Air Lease Corporation 3.62% 0.00 102,118 110,583 2027-04-01McDonald's Corporation 2.75% 0.00 101,934 102,684 2020-12-09United States Treasury Bonds 6.88% 0.00 101,706 82,073 2025-08-15Jpmcc 2016-Jp3 3.14% 0.00 101,575 107,878 2049-08-15................................................................................................................................................................................................................................................................................................Government National Mortgage Association 4.5% 0.00 101,456 97,226 2039-10-15Federal National Mortgage Association 4% 0.00 101,381 99,300 2025-04-01Jpmbb Commercial Mortgage Securities Trust-C303.55%
0.00 101,176 101,555 2048-07-15
Federal Home Loan Mortgage Corporation 5% 0.00 100,473 94,184 2033-10-01Citigroup Commercial Mortgage Trust 4.92% 0.00 100,300 97,233 2049-02-10................................................................................................................................................................................................................................................................................................Union Pacific Corporation 4.3% 0.00 100,171 102,011 2042-06-15Berkshire Hathaway Finance Corporation 5.75% 0.00 100,016 83,148 2040-01-15Federal Home Loan Mortgage Corporation 5.5% 0.00 99,739 92,172 2036-01-01Federal National Mortgage Association 6.5% 0.00 99,428 90,691 2036-08-01Federal Home Loan Mortgage Corporation 5% 0.00 99,368 93,636 2039-02-01................................................................................................................................................................................................................................................................................................Federal National Mortgage Association 6% 0.00 99,321 90,295 2038-05-01Government National Mortgage Association 5% 0.00 99,253 93,479 2033-07-15The Estee Lauder Companies Inc. 6% 0.00 98,551 80,839 2037-05-15Federal Home Loan Mortgage Corporation 4.08% 0.00 98,397 96,650 2020-11-25Enterprise Products Operating LP 2.55% 0.00 98,342 98,735 2019-10-15................................................................................................................................................................................................................................................................................................
©2018 Morningstar, Inc., Morningstar Investment Profiles™ 312-696-6000. All rights reserved. The information contained herein: (1) is proprietary to Morningstar and/or its content providers; (2) maynot be copied or distributed and (3) is not warranted to be accurate, complete or timely. Neither Morningstar nor its content providers are responsible for any damages or losses arising from any use ofinformation. Past performance is no guarantee of future performance. Visit our investment website at www.morningstar.com ß
®

Page 98 of 162
Broad Market Bond Index Fund.......................................................................................................................................................................................................................................................................................................................................
Total Stocks Total Bonds Total Cash0 9083 28
Bond Portfolio Analysis as of 09-30-18Security Name Net Assets % Market Value $ Amount $ Maturity Date
WFRBS COML MTG TR 3.91% 0.00 98,326 104,526 2057-09-15Government National Mortgage Association 6.5% 0.00 97,859 86,646 2032-08-20Federal National Mortgage Association 5% 0.00 97,067 91,434 2035-06-01Federal National Mortgage Association 3% 0.00 97,061 100,576 2044-03-01United States Treasury Bonds 7.62% 0.00 96,961 82,073 2022-11-15................................................................................................................................................................................................................................................................................................Federal National Mortgage Association 4% 0.00 96,758 95,102 2041-08-01Xerox Corporation 2.8% 0.00 96,644 98,735 2020-05-15Government National Mortgage Association 6% 0.00 96,512 88,358 2034-09-15Federal National Mortgage Association 3% 0.00 96,401 97,011 2027-01-01Government National Mortgage Association 5% 0.00 96,131 91,984 2033-12-15................................................................................................................................................................................................................................................................................................Federal Home Loan Mortgage Corporation 3% 0.00 96,103 96,818 2027-04-01United States Treasury Bonds 7.12% 0.00 96,083 82,073 2023-02-15Federal National Mortgage Association 5.5% 0.00 95,950 89,024 2033-03-01Federal National Mortgage Association 3% 0.00 95,842 96,690 2030-11-01Federal Home Loan Mortgage Corporation 4.5% 0.00 95,773 92,657 2030-08-01................................................................................................................................................................................................................................................................................................Federal National Mortgage Association 5.5% 0.00 95,697 88,687 2033-11-01Wells Fargo Commercial Trust 2015-C30 3.41% 0.00 95,575 97,233 2058-09-15Government National Mortgage Association 5.5% 0.00 95,397 88,922 2037-04-20Government National Mortgage Association 2.5% 0.00 95,364 98,281 2030-10-20Federal National Mortgage Association 5% 0.00 95,110 89,643 2035-09-01................................................................................................................................................................................................................................................................................................Federal Home Loan Mortgage Corporation 5.5% 0.00 94,953 88,380 2033-02-01Satander Drive Auto 2018 3.03% 0.00 94,916 95,329 2022-09-15Federal National Mortgage Association 5.5% 0.00 94,700 87,630 2033-09-01Government National Mortgage Association 2.5% 0.00 94,525 99,627 2043-06-20Federal Home Loan Mortgage Corporation 5% 0.00 94,181 88,742 2039-01-01................................................................................................................................................................................................................................................................................................Federal National Mortgage Association 5.5% 0.00 93,976 87,087 2033-06-01Government National Mortgage Association 6% 0.00 93,939 84,341 2034-05-20Federal Home Loan Mortgage Corporation 5.5% 0.00 93,925 86,749 2034-01-01United States Treasury Bonds 8.12% 0.00 93,877 82,073 2021-08-15Sempra Energy 2.85% 0.00 93,645 94,786 2020-11-15................................................................................................................................................................................................................................................................................................Federal Home Loan Mortgage Corporation 3.5% 0.00 93,274 92,620 2029-11-01Government National Mortgage Association 3.5% 0.00 93,141 93,707 2045-01-15Government National Mortgage Association 5.5% 0.00 93,101 86,423 2032-10-20CARMAX AUTO OWNER TR 2017-4 2.33% 0.00 92,968 95,329 2023-05-15Federal Home Loan Mortgage Corporation 4% 0.00 92,920 91,215 2040-02-01United States Treasury Bonds 8.12% 0.00 92,858 82,073 2021-05-15The Estee Lauder Companies Inc. 4.15% 0.00 92,674 92,387 2047-03-15Government National Mortgage Association 6% 0.00 92,396 84,838 2037-08-20Morgan Stanley BAML Trust 3.34% 0.00 92,320 94,394 2048-03-15Government National Mortgage Association 5.5% 0.00 92,286 84,985 2034-06-15................................................................................................................................................................................................................................................................................................Federal National Mortgage Association 5.5% 0.00 92,282 85,557 2038-05-01Federal National Mortgage Association 2.5% 0.00 92,209 94,847 2028-07-01Csail Commercial Mortgage Trust 3.23% 0.00 92,088 94,532 2057-06-15GS MORTGAGE SECURITIES TRUST 3.14% 0.00 91,900 94,394 2048-02-10Archer-Daniels-Midland Company 4.48% 0.00 91,842 89,256 2021-03-01................................................................................................................................................................................................................................................................................................Federal National Mortgage Association 3% 0.00 91,793 92,457 2027-08-01Israel (State Of) 5.5% 0.00 91,772 74,847 2033-09-18Federal Home Loan Mortgage Corporation 4% 0.00 91,665 90,478 2039-06-01Thomson Reuters Corp. 5.85% 0.00 91,656 84,688 2040-04-15Government National Mortgage Association 4% 0.00 91,481 88,880 2041-11-15................................................................................................................................................................................................................................................................................................United States Treasury Bonds 7.88% 0.00 91,466 82,073 2021-02-15Jpmcc Commercial Mortgage Securities 3.24% 0.00 91,325 91,831 2050-03-15Federal National Mortgage Association 5.5% 0.00 91,159 84,561 2032-11-01Federal National Mortgage Association 3.5% 0.00 91,142 90,631 2025-11-01Wells Fargo Commercial Mortgage Trust 2015-Lc223.57%
0.00 91,110 91,831 2058-09-15
................................................................................................................................................................................................................................................................................................
©2018 Morningstar, Inc., Morningstar Investment Profiles™ 312-696-6000. All rights reserved. The information contained herein: (1) is proprietary to Morningstar and/or its content providers; (2) maynot be copied or distributed and (3) is not warranted to be accurate, complete or timely. Neither Morningstar nor its content providers are responsible for any damages or losses arising from any use ofinformation. Past performance is no guarantee of future performance. Visit our investment website at www.morningstar.com ß
®

Page 99 of 162
Broad Market Bond Index Fund.......................................................................................................................................................................................................................................................................................................................................
Total Stocks Total Bonds Total Cash0 9083 28
Bond Portfolio Analysis as of 09-30-18Security Name Net Assets % Market Value $ Amount $ Maturity Date
United States Treasury Bonds 8.75% 0.00 90,876 82,073 2020-08-15Federal Home Loan Mortgage Corporation 2.5% 0.00 90,827 93,495 2028-06-01Phillips 66 Partners LP 3.6% 0.00 90,658 93,996 2025-02-15Kinder Morgan Energy Partners LP 6.95% 0.00 90,058 74,295 2038-01-15Federal National Mortgage Association 3.5% 0.00 89,965 90,781 2043-09-01................................................................................................................................................................................................................................................................................................Morgan Stanley Bank of America Merrill Lynch Trust2013-C10 4.22%
0.00 89,962 89,000 2046-07-15
United States Treasury Bonds 8.75% 0.00 89,860 82,073 2020-05-15Federal National Mortgage Association 4.5% 0.00 89,801 86,602 2033-12-01Government National Mortgage Association 5% 0.00 89,645 84,417 2034-05-15Federal National Mortgage Association 4% 0.00 89,433 87,902 2041-01-01................................................................................................................................................................................................................................................................................................Federal National Mortgage Association 5.5% 0.00 89,431 83,820 2023-10-01General Motors Financial Company Inc 3.45% 0.00 89,338 90,836 2022-04-10World Omni Auto Re 1.48% 0.00 89,026 91,622 2022-11-15Federal National Mortgage Association 6% 0.00 88,976 80,830 2035-04-01Santander Drive Au 2.96% 0.00 88,922 90,033 2024-03-15................................................................................................................................................................................................................................................................................................Ford Credit Auto Owner Trust 1.52% 0.00 88,647 90,033 2021-08-15Wf-Rbs Commercial Mtg Tst 2012-C7 4.09% 0.00 88,383 87,780 2045-06-15United States Treasury Bonds 8.5% 0.00 88,379 82,073 2020-02-15Federal Home Loan Mortgage Corporation 5.5% 0.00 88,307 81,510 2033-03-01Government National Mortgage Association 2.5% 0.00 88,146 90,842 2031-04-20................................................................................................................................................................................................................................................................................................Public Service Electric and Gas Company 3.6% 0.00 87,918 96,237 2047-12-01Shell International Finance B.V. 1.88% 0.00 87,913 90,836 2021-05-10Federal Home Loan Banks 5.62% 0.00 87,851 82,073 2021-06-11Federal National Mortgage Association 5.5% 0.00 87,690 81,333 2037-07-01Government National Mortgage Association 5.5% 0.00 87,324 81,054 2034-05-20................................................................................................................................................................................................................................................................................................Commercial Mortgage Trust 3.04% 0.00 87,192 87,174 2046-10-10Uruguay (Republic of) 5.1% 0.00 87,167 85,458 2050-06-18Federal National Mortgage Association 4.5% 0.00 87,003 84,311 2033-07-01Government National Mortgage Association 5% 0.00 86,935 81,861 2033-11-15Federal National Mortgage Association 3% 0.00 86,899 89,941 2042-05-01................................................................................................................................................................................................................................................................................................Federal Home Loan Mortgage Corporation 6% 0.00 86,898 79,986 2029-05-01Federal National Mortgage Association 4.5% 0.00 86,814 85,719 2020-08-01Federal Home Loan Mortgage Corporation 4.33% 0.00 86,780 84,954 2020-10-25Government National Mortgage Association 4.5% 0.00 86,588 82,685 2040-05-15United Health Group Incorporated 2.7% 0.00 86,341 86,887 2020-07-15LOS ANGELES CALIF DEPT WTR & PWR 6.6% 0.00 86,338 61,591 2050-07-01FiServ Inc. 3.85% 0.00 86,126 86,887 2025-06-01Federal Home Loan Mortgage Corporation 5.5% 0.00 85,960 80,714 2032-12-01Cardinal Health, Inc. 4.37% 0.00 85,629 96,237 2047-06-15COMM 2012-CCRE1 Mortgage Trust 3.91% 0.00 85,628 85,079 2045-05-15................................................................................................................................................................................................................................................................................................Federal National Mortgage Association 4% 0.00 85,519 84,056 2041-11-01Government National Mortgage Association 6% 0.00 85,483 78,978 2039-08-20Morgan Stanley BAML Trust 3.15% 0.00 85,380 86,430 2048-03-15Nevada Power Company 5.45% 0.00 85,328 75,065 2041-05-15Federal National Mortgage Association 4.5% 0.00 85,310 82,647 2048-04-01................................................................................................................................................................................................................................................................................................Federal National Mortgage Association 3.5% 0.00 85,282 85,979 2042-06-01Americredit Automobile Receivables Trust 2015-33.34%
0.00 85,093 84,843 2021-08-08
Federal Home Loan Mortgage Corporation 5.5% 0.00 85,044 78,999 2038-04-01Federal National Mortgage Association 5% 0.00 84,747 79,652 2040-08-01Santander Drive Auto Receivables Trust 2013-5 3.51% 0.00 84,492 84,737 2023-08-15................................................................................................................................................................................................................................................................................................Federal National Mortgage Association 3.5% 0.00 84,411 85,006 2043-07-01Federal National Mortgage Association 4% 0.00 84,309 82,868 2040-11-01Satander Drive Auto 2018 3.35% 0.00 84,263 84,737 2023-07-17Santander Drive Au 2.63% 0.00 84,231 84,737 2022-07-15Federal National Mortgage Association 6% 0.00 84,142 76,570 2032-11-01................................................................................................................................................................................................................................................................................................
©2018 Morningstar, Inc., Morningstar Investment Profiles™ 312-696-6000. All rights reserved. The information contained herein: (1) is proprietary to Morningstar and/or its content providers; (2) maynot be copied or distributed and (3) is not warranted to be accurate, complete or timely. Neither Morningstar nor its content providers are responsible for any damages or losses arising from any use ofinformation. Past performance is no guarantee of future performance. Visit our investment website at www.morningstar.com ß
®

Page 100 of 162
Broad Market Bond Index Fund.......................................................................................................................................................................................................................................................................................................................................
Total Stocks Total Bonds Total Cash0 9083 28
Bond Portfolio Analysis as of 09-30-18Security Name Net Assets % Market Value $ Amount $ Maturity Date
Kellogg Company 4.15% 0.00 83,995 82,937 2019-11-15Gm Financial Automobile Leasing Trust 2.12% 0.00 83,635 84,737 2021-09-20Federal Home Loan Mortgage Corporation 4% 0.00 83,483 81,953 2040-10-01Federal National Mortgage Association 4.5% 0.00 83,422 80,145 2041-03-01Federal National Mortgage Association 4% 0.00 82,872 81,456 2041-10-01................................................................................................................................................................................................................................................................................................Federal National Mortgage Association 3% 0.00 82,707 83,232 2027-03-01Government National Mortgage Association 5.5% 0.00 82,671 76,150 2033-07-15Federal Home Loan Mortgage Corporation 6% 0.00 82,631 76,024 2039-10-01Toyota Auto Receivables 2017-D 2.12% 0.00 82,521 84,737 2023-02-15Federal National Mortgage Association 6.5% 0.00 82,231 75,005 2028-05-01................................................................................................................................................................................................................................................................................................Federal National Mortgage Association 4% 0.00 82,096 80,100 2034-01-01Government National Mortgage Association 3.5% 0.00 82,075 82,166 2042-05-15Federal National Mortgage Association 5.5% 0.00 81,991 75,800 2035-01-01JPMBB Commercial Mortgage Securities Trust 4.17% 0.00 81,974 80,909 2045-07-15Federal Home Loan Mortgage Corporation 3% 0.00 81,709 84,664 2043-10-01................................................................................................................................................................................................................................................................................................Federal Home Loan Mortgage Corporation 5% 0.00 81,704 76,979 2041-11-01Federal Home Loan Mortgage Corporation 3% 0.00 81,600 82,398 2029-02-01Government National Mortgage Association 5.5% 0.00 81,578 75,713 2033-02-20Government National Mortgage Association 4.5% 0.00 81,474 77,538 2039-05-15AMERICAN MUN PWR OHIO INC 8.08% 0.00 81,415 51,968 2050-02-15................................................................................................................................................................................................................................................................................................Federal National Mortgage Association 5% 0.00 81,361 76,675 2035-12-01COMM 2013-CCRE11 Mortgage Trust 5.33% 0.00 81,315 78,327 2050-08-10Federal National Mortgage Association 5% 0.00 81,308 76,609 2034-06-01Private Export Funding Corp. 2.8% 0.00 81,270 82,073 2022-05-15Federal Home Loan Mortgage Corporation 2.5% 0.00 81,175 87,664 2046-08-01................................................................................................................................................................................................................................................................................................Federal Home Loan Mortgage Corporation 2.5% 0.00 81,112 83,904 2030-08-01Government National Mortgage Association 5.5% 0.00 80,822 74,604 2038-02-15Federal National Mortgage Association 3.5% 0.00 80,730 81,389 2041-02-01Public Service Company of Oklahoma 4.4% 0.00 80,721 78,988 2021-02-01Federal National Mortgage Association 3.5% 0.00 80,628 81,286 2043-07-01................................................................................................................................................................................................................................................................................................Federal National Mortgage Association 6.5% 0.00 80,433 72,329 2037-02-01JP MORGAN CHASE COMMERCIAL MORTGAGESECURITIES TRUST 4.44%
0.00 80,367 78,327 2047-02-15
Federal Home Loan Mortgage Corporation 1.38% 0.00 80,285 82,073 2020-05-01Federal National Mortgage Association 5% 0.00 80,117 75,465 2034-03-01Federal National Mortgage Association 3% 0.00 79,916 82,805 2043-05-01Jpmcc 2016-Jp4 2.98% 0.00 79,874 80,909 2049-12-15Bank Of Amer Merrill Lynch Coml Mtg 3.75% 0.00 79,581 81,028 2050-02-15Federal National Mortgage Association 3% 0.00 79,410 79,914 2027-07-01Federal Home Loan Mortgage Corporation 5% 0.00 79,409 75,091 2033-09-01Federal National Mortgage Association 5.5% 0.00 79,339 73,502 2034-04-01................................................................................................................................................................................................................................................................................................Federal Home Loan Mortgage Corporation 4.5% 0.00 79,266 76,764 2023-12-01Santander Drive Auto Receivables Trust 2013-5 4.07% 0.00 79,227 79,441 2024-08-15Airgas, Inc. 3.65% 0.00 79,109 78,988 2024-07-15JPMBB Commercial Mortgage Securities Trust 4.41% 0.00 78,954 76,976 2046-08-15Federal National Mortgage Association 5% 0.00 78,881 74,279 2038-02-01................................................................................................................................................................................................................................................................................................Federal National Mortgage Association 3.5% 0.00 78,851 79,493 2043-08-01Federal Home Loan Mortgage Corporation 4.5% 0.00 78,802 75,538 2041-05-01Federal National Mortgage Association 5.5% 0.00 78,671 72,655 2035-08-01Federal National Mortgage Association 5% 0.00 78,530 76,229 2020-10-01Csail Commercial Mortagage Trust 3.45% 0.00 78,520 80,909 2050-09-15................................................................................................................................................................................................................................................................................................AT&T Inc 3.9% 0.00 78,514 78,988 2024-03-11Federal National Mortgage Association 6.5% 0.00 78,505 69,785 2037-07-01Federal Home Loan Mortgage Corporation 6.5% 0.00 78,369 70,827 2035-07-01Federal Home Loan Mortgage Corporation 5.5% 0.00 77,956 71,960 2034-12-01Government National Mortgage Association 4.5% 0.00 77,928 74,775 2041-06-15................................................................................................................................................................................................................................................................................................
©2018 Morningstar, Inc., Morningstar Investment Profiles™ 312-696-6000. All rights reserved. The information contained herein: (1) is proprietary to Morningstar and/or its content providers; (2) maynot be copied or distributed and (3) is not warranted to be accurate, complete or timely. Neither Morningstar nor its content providers are responsible for any damages or losses arising from any use ofinformation. Past performance is no guarantee of future performance. Visit our investment website at www.morningstar.com ß
®

Page 101 of 162
Broad Market Bond Index Fund.......................................................................................................................................................................................................................................................................................................................................
Total Stocks Total Bonds Total Cash0 9083 28
Bond Portfolio Analysis as of 09-30-18Security Name Net Assets % Market Value $ Amount $ Maturity Date
Federal National Mortgage Association 6% 0.00 77,922 70,830 2029-07-01Pepsico Capital Resources, Inc. 4.45% 0.00 77,907 73,910 2046-04-14Jpmdb Commercial Mortgage Secu 3.14% 0.00 77,761 80,909 2049-06-15Federal Home Loan Mortgage Corporation 5.5% 0.00 77,458 71,525 2037-06-01Federal National Mortgage Association 6% 0.00 77,344 70,352 2034-01-01................................................................................................................................................................................................................................................................................................Federal National Mortgage Association 5.5% 0.00 76,902 71,354 2037-05-01Government National Mortgage Association 3.5% 0.00 76,766 77,041 2043-04-15Federal Home Loan Mortgage Corporation 4.5% 0.00 76,765 73,717 2039-02-01Apple Inc. 3.45% 0.00 76,673 85,458 2045-02-09Federal Home Loan Mortgage Corporation 3.5% 0.00 76,547 76,150 2025-12-01................................................................................................................................................................................................................................................................................................Federal National Mortgage Association 5.5% 0.00 76,483 71,089 2038-02-01The Walt Disney Company 4.38% 0.00 76,481 74,680 2041-08-16Federal Home Loan Mortgage Corporation 6% 0.00 76,376 69,066 2032-12-01Government National Mortgage Association 5.5% 0.00 76,014 70,041 2033-07-15Government National Mortgage Association 6% 0.00 76,013 70,355 2039-12-15................................................................................................................................................................................................................................................................................................Federal Home Loan Mortgage Corporation 6.5% 0.00 75,851 68,565 2034-09-01Federal National Mortgage Association 5.5% 0.00 75,301 69,769 2033-05-01Federal National Mortgage Association 6% 0.00 75,123 68,430 2037-04-01Federal Home Loan Mortgage Corporation 4.5% 0.00 75,013 74,065 2024-03-01Government National Mortgage Association 5% 0.00 74,988 70,611 2033-07-15................................................................................................................................................................................................................................................................................................Spectra Energy Partners, LP 3.38% 0.00 74,375 78,988 2026-10-15Santander Drive Auto Receivables Trust 2015-4 3.53% 0.00 74,371 74,145 2021-08-16CENTERPOINT ENERGY RESTORATION BONDCOMPANY, LLC 4.24%
0.00 74,253 72,668 2023-08-15
Federal National Mortgage Association 3% 0.00 74,101 74,570 2027-07-01Ford Credit Auto Owner Trust 3.16% 0.00 74,098 74,145 2023-10-15................................................................................................................................................................................................................................................................................................Federal National Mortgage Association 6% 0.00 74,065 67,305 2037-01-01Federal National Mortgage Association 4.5% 0.00 74,042 71,495 2041-04-01Santander Drive Auto Receivables Trust 2013-5 3.29% 0.00 74,020 74,145 2022-10-17Federal National Mortgage Association 4% 0.00 73,939 72,481 2030-06-01Morgan Stanley BAML Trust 3.32% 0.00 73,776 74,276 2048-10-15................................................................................................................................................................................................................................................................................................Sdart (A-1) 2017-2 2.79% 0.00 73,732 74,145 2022-08-15Government National Mortgage Association 2.5% 0.00 73,622 77,601 2043-12-20Nissan Auto Rec Tr 2018-A 2.89% 0.00 73,502 74,145 2024-06-17Government National Mortgage Association 6% 0.00 73,279 67,824 2038-11-15Federal Home Loan Mortgage Corporation 5.5% 0.00 73,000 67,524 2034-04-01Federal Home Loan Mortgage Corporation 5.5% 0.00 72,953 67,383 2036-03-01BMW Vehicle Owner 2.51% 0.00 72,898 74,145 2024-06-25Federal Home Loan Mortgage Corporation 4% 0.00 72,805 71,147 2024-11-01Federal National Mortgage Association 5.5% 0.00 72,591 67,206 2035-12-01Federal National Mortgage Association 6% 0.00 72,559 65,947 2032-09-01................................................................................................................................................................................................................................................................................................Nissan Auto Receivables 2016-B 1.54% 0.00 72,500 74,145 2022-10-17CARMAX AUTO OWNER TR 2017-4 2.46% 0.00 72,253 74,145 2023-08-15Federal National Mortgage Association 5% 0.00 71,731 67,420 2040-03-01Federal Home Loan Mortgage Corporation 4.5% 0.00 71,707 68,728 2041-06-01Federal National Mortgage Association 5.5% 0.00 71,310 66,558 2038-04-01................................................................................................................................................................................................................................................................................................Federal National Mortgage Association 4% 0.00 71,285 70,068 2040-08-01Ford Credit Floorplan Master Owner Trust A 1.98% 0.00 71,171 72,133 2022-01-15Government National Mortgage Association 4.5% 0.00 71,141 68,182 2040-01-15Federal National Mortgage Association 5.5% 0.00 70,958 65,799 2033-03-01Federal Home Loan Mortgage Corporation 5.5% 0.00 70,852 65,539 2033-01-01................................................................................................................................................................................................................................................................................................Federal National Mortgage Association 6% 0.00 70,665 64,231 2033-12-01Berkshire Hathaway Energy Company 6.12% 0.00 70,367 58,127 2036-04-01Apple Inc. 4.5% 0.00 70,355 65,441 2036-02-23Ally Auto Rcvbls 2.01% 0.00 70,153 71,497 2022-03-15Federal National Mortgage Association 6% 0.00 70,064 63,667 2036-09-01................................................................................................................................................................................................................................................................................................
©2018 Morningstar, Inc., Morningstar Investment Profiles™ 312-696-6000. All rights reserved. The information contained herein: (1) is proprietary to Morningstar and/or its content providers; (2) maynot be copied or distributed and (3) is not warranted to be accurate, complete or timely. Neither Morningstar nor its content providers are responsible for any damages or losses arising from any use ofinformation. Past performance is no guarantee of future performance. Visit our investment website at www.morningstar.com ß
®

Page 102 of 162
Broad Market Bond Index Fund.......................................................................................................................................................................................................................................................................................................................................
Total Stocks Total Bonds Total Cash0 9083 28
Bond Portfolio Analysis as of 09-30-18Security Name Net Assets % Market Value $ Amount $ Maturity Date
Federal National Mortgage Association 6.5% 0.00 70,042 62,846 2032-07-01Government National Mortgage Association 5.5% 0.00 69,997 65,210 2040-10-20Simon Property Group, L.P. 3.38% 0.00 69,558 71,089 2024-10-01Federal National Mortgage Association 5% 0.00 69,476 65,295 2041-04-01Comm 2014 CCRE15 Mortgage Trust 4.07% 0.00 69,249 67,424 2047-02-10................................................................................................................................................................................................................................................................................................Federal National Mortgage Association 4.5% 0.00 69,129 66,366 2039-04-01Enbridge Incorporation 4.5% 0.00 69,115 71,215 2044-06-10AbbVie Inc. 4.5% 0.00 68,772 71,600 2035-05-14SANTANDER DRIVE AUTO RECEIVABLES TRUST 3.56% 0.00 68,651 68,849 2024-07-15SANTANDER DRIVE AUTO RECEIVABLES TRUST 3.98% 0.00 68,610 68,849 2025-12-15................................................................................................................................................................................................................................................................................................Federal National Mortgage Association 6% 0.00 68,422 62,302 2038-12-01Federal National Mortgage Association 4% 0.00 68,329 66,937 2024-06-01Keurig Dr Pepper Inc 7.45% 0.00 68,302 54,662 2038-05-01Federal Home Loan Mortgage Corporation 3% 0.00 67,773 68,276 2026-11-01Carmax Auto Owner Trust 1.83% 0.00 67,763 68,531 2021-06-15................................................................................................................................................................................................................................................................................................Federal National Mortgage Association 6.5% 0.00 67,734 61,782 2037-10-01JPMBB Commercial Mortgage Securities Trust 4.71% 0.00 67,729 67,523 2047-09-15Government National Mortgage Association 4% 0.00 67,654 65,920 2041-04-20Federal Home Loan Mortgage Corporation 5% 0.00 67,614 63,688 2037-07-01Government National Mortgage Association 4.5% 0.00 67,564 64,819 2025-03-15................................................................................................................................................................................................................................................................................................Federal National Mortgage Association 2.48% 0.00 67,540 70,109 2023-03-25Federal Home Loan Mortgage Corporation 2.5% 0.00 67,079 69,050 2028-09-01Federal National Mortgage Association 5.5% 0.00 66,978 61,774 2034-07-01Government National Mortgage Association 5.5% 0.00 66,657 61,459 2033-05-15Federal Home Loan Mortgage Corporation 2.5% 0.00 66,582 68,536 2028-02-01................................................................................................................................................................................................................................................................................................Government National Mortgage Association 6% 0.00 66,476 61,528 2032-02-15Mayo Clinic 4% 0.00 66,422 68,136 2047-11-15Federal Home Loan Mortgage Corporation 6% 0.00 66,181 59,800 2033-12-01GS Mortgage Securities Trust 2016-GS4 3.44% 0.00 65,970 67,424 2049-11-10Federal Home Loan Mortgage Corporation 5% 0.00 65,946 62,318 2035-08-01................................................................................................................................................................................................................................................................................................Federal National Mortgage Association 5.5% 0.00 65,887 61,073 2038-10-01Federal National Mortgage Association 6% 0.00 65,881 61,030 2038-01-01Government National Mortgage Association 4.5% 0.00 65,775 63,562 2033-10-15NEW YORK N Y 5.52% 0.00 65,667 55,817 2037-10-01Federal Home Loan Mortgage Corporation 6% 0.00 65,622 59,301 2032-01-01Federal Home Loan Mortgage Corporation 2.5% 0.00 65,266 67,183 2028-06-01Comcast Corporation 5.65% 0.00 65,228 58,897 2035-06-15The Coca-Cola Company 2.5% 0.00 64,960 67,140 2023-04-01GNMA PASS-THRU M SINGLE FAMILY 2.5% 0.00 64,940 68,406 2044-11-20Federal Home Loan Mortgage Corporation 6% 0.00 64,648 58,474 2036-02-01................................................................................................................................................................................................................................................................................................Federal National Mortgage Association 6.5% 0.00 64,553 58,880 2032-10-01Federal National Mortgage Association 5% 0.00 64,514 60,774 2035-11-01Government National Mortgage Association 6% 0.00 64,101 59,002 2033-10-15Federal Home Loan Mortgage Corporation 3.5% 0.00 63,947 63,545 2026-02-01Government National Mortgage Association 3% 0.00 63,728 65,736 2047-07-20................................................................................................................................................................................................................................................................................................Government National Mortgage Association 4% 0.00 63,620 62,530 2039-07-15Government National Mortgage Association 6% 0.00 63,533 58,158 2033-09-20Federal National Mortgage Association 5% 0.00 63,416 59,700 2035-08-01Federal National Mortgage Association 3% 0.00 62,969 63,367 2025-11-01General Motors Company 5.2% 0.00 62,947 69,290 2045-04-01................................................................................................................................................................................................................................................................................................Federal National Mortgage Association 2.28% 0.00 62,921 65,104 2022-12-27Federal Home Loan Mortgage Corporation 5% 0.00 62,898 59,264 2038-10-01Government National Mortgage Association 4.5% 0.00 62,773 60,180 2039-09-15Government National Mortgage Association 5.5% 0.00 62,559 58,216 2033-03-15Comcast Corporation 4.4% 0.00 62,323 63,516 2035-08-15................................................................................................................................................................................................................................................................................................Federal National Mortgage Association 6% 0.00 61,933 56,373 2036-09-01Federal National Mortgage Association 5% 0.00 61,606 58,029 2035-07-01Federal National Mortgage Association 5.5% 0.00 61,220 57,318 2037-07-01Federal National Mortgage Association 4% 0.00 61,149 60,111 2039-10-01Federal National Mortgage Association 3.5% 0.00 61,130 61,694 2030-10-01................................................................................................................................................................................................................................................................................................
©2018 Morningstar, Inc., Morningstar Investment Profiles™ 312-696-6000. All rights reserved. The information contained herein: (1) is proprietary to Morningstar and/or its content providers; (2) maynot be copied or distributed and (3) is not warranted to be accurate, complete or timely. Neither Morningstar nor its content providers are responsible for any damages or losses arising from any use ofinformation. Past performance is no guarantee of future performance. Visit our investment website at www.morningstar.com ß
®

Page 103 of 162
Broad Market Bond Index Fund.......................................................................................................................................................................................................................................................................................................................................
Total Stocks Total Bonds Total Cash0 9083 28
Bond Portfolio Analysis as of 09-30-18Security Name Net Assets % Market Value $ Amount $ Maturity Date
Federal National Mortgage Association 4.5% 0.00 61,108 58,703 2039-11-01Federal Home Loan Mortgage Corporation 5% 0.00 60,793 57,895 2023-06-01Federal Home Loan Mortgage Corporation 5.5% 0.00 60,694 56,990 2036-03-01BP Capital Markets plc 3.99% 0.00 60,430 59,241 2023-09-26AmeriCredit Automobile Receivables Trust 2017-22.97%
0.00 60,346 60,905 2023-03-20
................................................................................................................................................................................................................................................................................................Federal Home Loan Mortgage Corporation 3.5% 0.00 60,322 59,980 2026-12-01JPMBB Commercial Mortgage Securities Trust 3.16% 0.00 60,264 60,291 2045-07-15GS Mortgage Securities Trust 3.28% 0.00 60,020 61,311 2046-02-10Government National Mortgage Association 5.5% 0.00 59,962 55,144 2038-06-15Microsoft Corporation 3.45% 0.00 59,825 62,746 2036-08-08................................................................................................................................................................................................................................................................................................Federal National Mortgage Association 2.5% 0.00 59,807 64,282 2042-10-01Federal Home Loan Mortgage Corporation 3.5% 0.00 59,744 59,435 2026-07-01Federal National Mortgage Association 5% 0.00 59,585 56,180 2036-11-01Federal National Mortgage Association 6% 0.00 59,564 54,182 2037-09-01AvalonBay Communities, Inc. 3.62% 0.00 59,521 59,241 2020-10-01................................................................................................................................................................................................................................................................................................Government National Mortgage Association 3.5% 0.00 59,350 59,620 2045-06-20Telefonica Europe B V 8.25% 0.00 59,111 46,194 2030-09-15Quest Diagnostics Incorporated 5.75% 0.00 59,033 56,202 2040-01-30COMM MORTGAGE TRUST 4.72% 0.00 58,864 58,880 2047-02-10Federal Home Loan Mortgage Corporation 3.5% 0.00 58,808 58,503 2026-06-01................................................................................................................................................................................................................................................................................................Federal Home Loan Mortgage Corporation 4.5% 0.00 58,715 56,613 2033-08-01Federal Home Loan Mortgage Corporation 2.5% 0.00 58,687 60,411 2028-10-01Federal Home Loan Mortgage Corporation 6% 0.00 58,649 53,984 2031-12-01Government National Mortgage Association 2.5% 0.00 58,563 60,355 2030-09-20Kreditanstalt Fur Wiederaufbau 0% 0.00 58,471 108,555 2037-06-29................................................................................................................................................................................................................................................................................................21st Century Fox America, Inc. 6.55% 0.00 58,152 46,194 2033-03-15SANTANDER DRIVE AUTO RECEIVABLES TRUST 3.27% 0.00 58,075 58,257 2023-01-17CVS Health Corp 4.88% 0.00 58,023 57,742 2035-07-20Federal National Mortgage Association 6% 0.00 58,014 52,713 2035-10-01Federal National Mortgage Association 4% 0.00 57,968 56,798 2025-09-01Federal Home Loan Mortgage Corporation 4.5% 0.00 57,900 56,099 2024-06-01Government National Mortgage Association 6% 0.00 57,897 52,985 2035-08-20AmeriCredit Automobile Receivables Trust 2017-23.42%
0.00 57,845 58,257 2023-04-18
Federal Home Loan Mortgage Corporation 5.5% 0.00 57,829 53,592 2038-08-01Federal Home Loan Mortgage Corporation 4.5% 0.00 57,790 55,956 2046-05-01................................................................................................................................................................................................................................................................................................Federal National Mortgage Association 3% 0.00 57,691 58,057 2027-10-01Union Pacific Corporation 4.15% 0.00 57,622 60,052 2045-01-15Federal National Mortgage Association 6% 0.00 57,508 52,330 2028-10-01Phillips 66 4.88% 0.00 57,461 55,432 2044-11-15Federal National Mortgage Association 5.5% 0.00 57,281 53,065 2034-02-01................................................................................................................................................................................................................................................................................................GS MORTGAGE SECURITIES TRUST 4.65% 0.00 57,240 55,099 2046-11-10MetLife Inc. 6.5% 0.00 57,133 46,579 2032-12-15NEW YORK ST DORM AUTH 5.6% 0.00 57,121 48,118 2040-03-15Noble Energy, Inc. 5.25% 0.00 56,953 57,742 2043-11-15Government National Mortgage Association 4.5% 0.00 56,812 54,452 2039-07-15................................................................................................................................................................................................................................................................................................Federal Home Loan Mortgage Corporation 3.5% 0.00 56,570 57,030 2043-02-01Federal National Mortgage Association 4.5% 0.00 56,513 54,606 2025-01-01Federal National Mortgage Association 6% 0.00 56,507 52,335 2036-04-01Federal Home Loan Mortgage Corporation 5% 0.00 56,466 53,066 2033-12-01Oracle Corporation 6.5% 0.00 56,344 43,884 2038-04-15................................................................................................................................................................................................................................................................................................Federal Home Loan Mortgage Corporation 5% 0.00 56,307 53,201 2035-09-01WORLD OMNI AUTO TRUST 2.24% 0.00 56,280 57,409 2023-06-15Federal Home Loan Mortgage Corporation 4.5% 0.00 56,230 53,894 2041-02-01Federal National Mortgage Association 5.5% 0.00 56,084 54,863 2022-08-01Federal National Mortgage Association 4.5% 0.00 56,041 53,808 2039-07-01................................................................................................................................................................................................................................................................................................
©2018 Morningstar, Inc., Morningstar Investment Profiles™ 312-696-6000. All rights reserved. The information contained herein: (1) is proprietary to Morningstar and/or its content providers; (2) maynot be copied or distributed and (3) is not warranted to be accurate, complete or timely. Neither Morningstar nor its content providers are responsible for any damages or losses arising from any use ofinformation. Past performance is no guarantee of future performance. Visit our investment website at www.morningstar.com ß
®
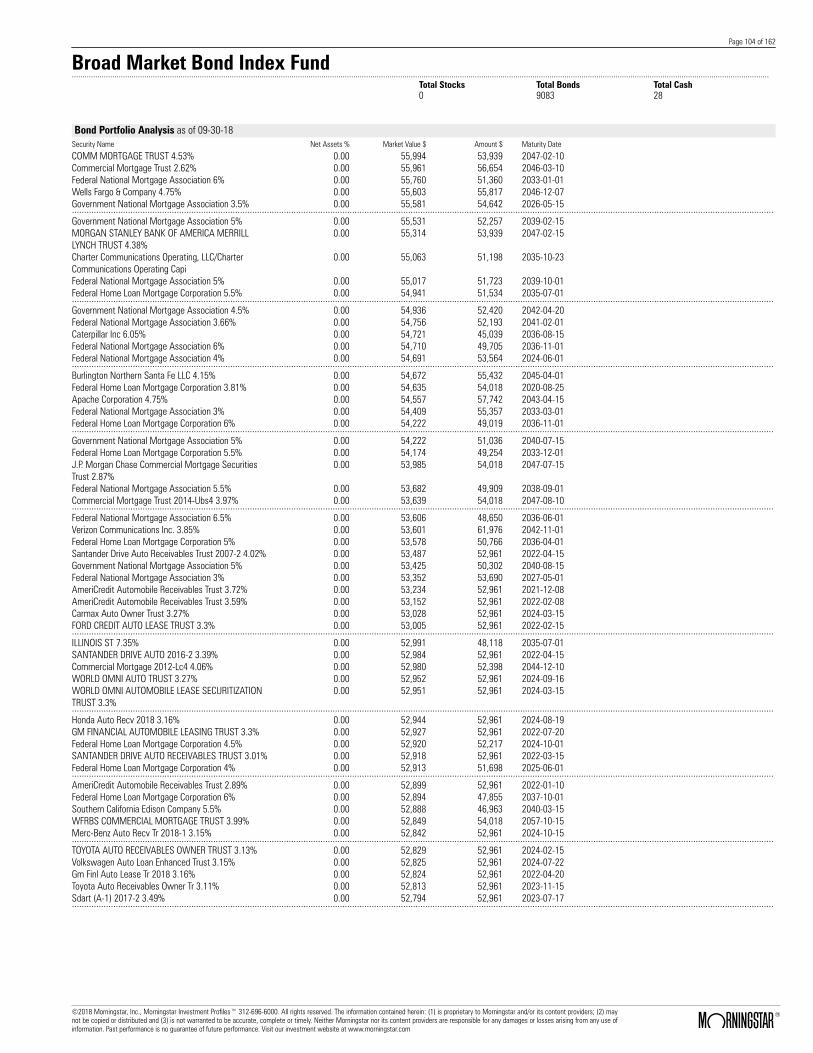
Page 104 of 162
Broad Market Bond Index Fund.......................................................................................................................................................................................................................................................................................................................................
Total Stocks Total Bonds Total Cash0 9083 28
Bond Portfolio Analysis as of 09-30-18Security Name Net Assets % Market Value $ Amount $ Maturity Date
COMM MORTGAGE TRUST 4.53% 0.00 55,994 53,939 2047-02-10Commercial Mortgage Trust 2.62% 0.00 55,961 56,654 2046-03-10Federal National Mortgage Association 6% 0.00 55,760 51,360 2033-01-01Wells Fargo & Company 4.75% 0.00 55,603 55,817 2046-12-07Government National Mortgage Association 3.5% 0.00 55,581 54,642 2026-05-15................................................................................................................................................................................................................................................................................................Government National Mortgage Association 5% 0.00 55,531 52,257 2039-02-15MORGAN STANLEY BANK OF AMERICA MERRILLLYNCH TRUST 4.38%
0.00 55,314 53,939 2047-02-15
Charter Communications Operating, LLC/CharterCommunications Operating Capi
0.00 55,063 51,198 2035-10-23
Federal National Mortgage Association 5% 0.00 55,017 51,723 2039-10-01Federal Home Loan Mortgage Corporation 5.5% 0.00 54,941 51,534 2035-07-01................................................................................................................................................................................................................................................................................................Government National Mortgage Association 4.5% 0.00 54,936 52,420 2042-04-20Federal National Mortgage Association 3.66% 0.00 54,756 52,193 2041-02-01Caterpillar Inc 6.05% 0.00 54,721 45,039 2036-08-15Federal National Mortgage Association 6% 0.00 54,710 49,705 2036-11-01Federal National Mortgage Association 4% 0.00 54,691 53,564 2024-06-01................................................................................................................................................................................................................................................................................................Burlington Northern Santa Fe LLC 4.15% 0.00 54,672 55,432 2045-04-01Federal Home Loan Mortgage Corporation 3.81% 0.00 54,635 54,018 2020-08-25Apache Corporation 4.75% 0.00 54,557 57,742 2043-04-15Federal National Mortgage Association 3% 0.00 54,409 55,357 2033-03-01Federal Home Loan Mortgage Corporation 6% 0.00 54,222 49,019 2036-11-01................................................................................................................................................................................................................................................................................................Government National Mortgage Association 5% 0.00 54,222 51,036 2040-07-15Federal Home Loan Mortgage Corporation 5.5% 0.00 54,174 49,254 2033-12-01J.P. Morgan Chase Commercial Mortgage SecuritiesTrust 2.87%
0.00 53,985 54,018 2047-07-15
Federal National Mortgage Association 5.5% 0.00 53,682 49,909 2038-09-01Commercial Mortgage Trust 2014-Ubs4 3.97% 0.00 53,639 54,018 2047-08-10................................................................................................................................................................................................................................................................................................Federal National Mortgage Association 6.5% 0.00 53,606 48,650 2036-06-01Verizon Communications Inc. 3.85% 0.00 53,601 61,976 2042-11-01Federal Home Loan Mortgage Corporation 5% 0.00 53,578 50,766 2036-04-01Santander Drive Auto Receivables Trust 2007-2 4.02% 0.00 53,487 52,961 2022-04-15Government National Mortgage Association 5% 0.00 53,425 50,302 2040-08-15Federal National Mortgage Association 3% 0.00 53,352 53,690 2027-05-01AmeriCredit Automobile Receivables Trust 3.72% 0.00 53,234 52,961 2021-12-08AmeriCredit Automobile Receivables Trust 3.59% 0.00 53,152 52,961 2022-02-08Carmax Auto Owner Trust 3.27% 0.00 53,028 52,961 2024-03-15FORD CREDIT AUTO LEASE TRUST 3.3% 0.00 53,005 52,961 2022-02-15................................................................................................................................................................................................................................................................................................ILLINOIS ST 7.35% 0.00 52,991 48,118 2035-07-01SANTANDER DRIVE AUTO 2016-2 3.39% 0.00 52,984 52,961 2022-04-15Commercial Mortgage 2012-Lc4 4.06% 0.00 52,980 52,398 2044-12-10WORLD OMNI AUTO TRUST 3.27% 0.00 52,952 52,961 2024-09-16WORLD OMNI AUTOMOBILE LEASE SECURITIZATIONTRUST 3.3%
0.00 52,951 52,961 2024-03-15
................................................................................................................................................................................................................................................................................................Honda Auto Recv 2018 3.16% 0.00 52,944 52,961 2024-08-19GM FINANCIAL AUTOMOBILE LEASING TRUST 3.3% 0.00 52,927 52,961 2022-07-20Federal Home Loan Mortgage Corporation 4.5% 0.00 52,920 52,217 2024-10-01SANTANDER DRIVE AUTO RECEIVABLES TRUST 3.01% 0.00 52,918 52,961 2022-03-15Federal Home Loan Mortgage Corporation 4% 0.00 52,913 51,698 2025-06-01................................................................................................................................................................................................................................................................................................AmeriCredit Automobile Receivables Trust 2.89% 0.00 52,899 52,961 2022-01-10Federal Home Loan Mortgage Corporation 6% 0.00 52,894 47,855 2037-10-01Southern California Edison Company 5.5% 0.00 52,888 46,963 2040-03-15WFRBS COMMERCIAL MORTGAGE TRUST 3.99% 0.00 52,849 54,018 2057-10-15Merc-Benz Auto Recv Tr 2018-1 3.15% 0.00 52,842 52,961 2024-10-15................................................................................................................................................................................................................................................................................................TOYOTA AUTO RECEIVABLES OWNER TRUST 3.13% 0.00 52,829 52,961 2024-02-15Volkswagen Auto Loan Enhanced Trust 3.15% 0.00 52,825 52,961 2024-07-22Gm Finl Auto Lease Tr 2018 3.16% 0.00 52,824 52,961 2022-04-20Toyota Auto Receivables Owner Tr 3.11% 0.00 52,813 52,961 2023-11-15Sdart (A-1) 2017-2 3.49% 0.00 52,794 52,961 2023-07-17................................................................................................................................................................................................................................................................................................
©2018 Morningstar, Inc., Morningstar Investment Profiles™ 312-696-6000. All rights reserved. The information contained herein: (1) is proprietary to Morningstar and/or its content providers; (2) maynot be copied or distributed and (3) is not warranted to be accurate, complete or timely. Neither Morningstar nor its content providers are responsible for any damages or losses arising from any use ofinformation. Past performance is no guarantee of future performance. Visit our investment website at www.morningstar.com ß
®

Page 105 of 162
Broad Market Bond Index Fund.......................................................................................................................................................................................................................................................................................................................................
Total Stocks Total Bonds Total Cash0 9083 28
Bond Portfolio Analysis as of 09-30-18Security Name Net Assets % Market Value $ Amount $ Maturity Date
Ally Auto Rcvbls 3.09% 0.00 52,792 52,961 2023-06-15Gm Finl Consumer Automobile Receivables Tr 20183.16%
0.00 52,787 52,961 2024-01-16
Ford Credit Auto Lease Trust 3.17% 0.00 52,783 52,961 2021-09-15Ford Credit Auto Lease Trust 3.05% 0.00 52,769 52,961 2021-08-15Ally Auto Rcvbls 3.12% 0.00 52,763 52,961 2023-07-17................................................................................................................................................................................................................................................................................................Nissan Auto Receivables 2016-B 3.16% 0.00 52,710 52,961 2024-12-16Carmax Auto Owner Trust 3.37% 0.00 52,691 52,961 2023-10-16Carmax Auto Owner Trust 3.99% 0.00 52,677 52,961 2025-04-15Federal National Mortgage Association 3.55% 0.00 52,673 50,383 2041-11-01GS Mortgage Securities Corp II 2.86% 0.00 52,672 53,939 2046-06-10................................................................................................................................................................................................................................................................................................HONDA AUTO RECEIVABLES OWNER TRUST 3.07% 0.00 52,661 52,961 2024-11-21Carmax Auto Owner Trust 3.57% 0.00 52,650 52,961 2023-12-15Federal National Mortgage Association 4.5% 0.00 52,646 50,836 2039-12-01Hyundai Auto Receivables Trust 2.94% 0.00 52,599 52,961 2024-06-17Satander Drive Auto 2018 3.88% 0.00 52,538 52,961 2024-02-15................................................................................................................................................................................................................................................................................................WORLD OMNI AUTO TRUST 3.03% 0.00 52,532 52,961 2024-06-17Gm Financial Consumer Automobile 3.02% 0.00 52,528 52,961 2023-12-18Gm Financial Automobile Leasing Trust 2.68% 0.00 52,516 52,961 2021-12-20Honda Auto Recv 2018 2.83% 0.00 52,484 52,961 2024-05-15Mercedes-Benz Auto Lease Trust 2011-A 2.51% 0.00 52,456 52,961 2023-10-16................................................................................................................................................................................................................................................................................................Santander Drive Auto 2017-3 3.2% 0.00 52,422 52,961 2023-11-15AmeriCredit Automobile Receivables Trust 2.3% 0.00 52,415 52,961 2022-02-18Nissan Auto Receivables 2015-B Owner Trust 1.67% 0.00 52,363 52,961 2022-02-15JPMBB Commercial Mortgage Securities Trust 4.71% 0.00 52,331 54,018 2047-09-15Santander Drive Auto 2017-3 2.76% 0.00 52,329 52,961 2022-12-15................................................................................................................................................................................................................................................................................................Gm Financial Automobile Leasing Trust 2.73% 0.00 52,323 52,961 2021-09-20AmeriCredit Automobile Receivables Trust 2017-2 2.4% 0.00 52,317 52,961 2022-05-18Bmw Ven Lease Tr 2017-2 2.19% 0.00 52,316 52,961 2021-03-22Hyundai Auto Receivables Trust 1.73% 0.00 52,301 52,961 2022-05-16Nissan Auto Lease Trust 2.17% 0.00 52,295 52,961 2021-12-15Carmax Auto Owner Trust 1.88% 0.00 52,271 52,961 2021-06-15Gm Financial Automobile Leasing Trust 2.4% 0.00 52,263 52,961 2021-09-20Federal National Mortgage Association 4.58% 0.00 52,253 50,083 2041-09-01Canadian Natural Resources Limited 6.25% 0.00 52,248 44,269 2038-03-15AmeriCredit Automobile Receivables Trust 2.71% 0.00 52,247 52,961 2022-08-18................................................................................................................................................................................................................................................................................................AmeriCredit Automobile Receivables Trust 3.13% 0.00 52,212 52,961 2023-01-18AmeriCredit Automobile Receivables Trust 2.24% 0.00 52,203 52,961 2022-04-08ALLY AUTO RECV TR 2017-1 1.99% 0.00 52,185 52,961 2021-11-15Ally Auto Rcvbls 2.53% 0.00 52,120 52,961 2023-02-15AmeriCredit Automobile Receivables Trust 3.18% 0.00 52,116 52,961 2023-07-18................................................................................................................................................................................................................................................................................................Carmax Auto Owner Trust 2.64% 0.00 52,113 52,961 2023-06-15Federal Home Loan Mortgage Corporation 2.5% 0.00 52,096 53,627 2028-10-01AmeriCredit Automobile Receivables Trust 2.71% 0.00 52,054 52,961 2022-09-08Toyota Auto Receivables Owner Tr 2.05% 0.00 52,042 52,961 2022-09-15NISSAN AUTO RECEIVABLES OWNER TRUST 1.59% 0.00 52,040 52,961 2022-07-15................................................................................................................................................................................................................................................................................................Ally Auto Receivables Trust (A-1) 17 2.1% 0.00 52,039 52,961 2022-03-15Honda Auto Receivables Owner Trust (Diff Series)2.05%
0.00 52,036 52,961 2023-06-21
FedEx Corporation 4.55% 0.00 52,027 53,123 2046-04-01AmeriCredit Automobile Receivables Trust 2.24% 0.00 52,009 52,961 2023-06-19Toyota Auto Recv Own Tr 2018-A 2.52% 0.00 52,009 52,961 2023-05-15................................................................................................................................................................................................................................................................................................AmeriCredit Automobile Receivables Trust 2.69% 0.00 52,008 52,961 2023-06-19Bmw Vehicle Owner Trust 2016-A 1.37% 0.00 51,918 52,961 2022-12-27Federal Home Loan Mortgage Corporation 5% 0.00 51,917 48,884 2040-08-01Federal Home Loan Mortgage Corporation 5.5% 0.00 51,906 48,011 2037-02-01Santander Drive Au 3.32% 0.00 51,903 52,961 2024-03-15................................................................................................................................................................................................................................................................................................
©2018 Morningstar, Inc., Morningstar Investment Profiles™ 312-696-6000. All rights reserved. The information contained herein: (1) is proprietary to Morningstar and/or its content providers; (2) maynot be copied or distributed and (3) is not warranted to be accurate, complete or timely. Neither Morningstar nor its content providers are responsible for any damages or losses arising from any use ofinformation. Past performance is no guarantee of future performance. Visit our investment website at www.morningstar.com ß
®

Page 106 of 162
Broad Market Bond Index Fund.......................................................................................................................................................................................................................................................................................................................................
Total Stocks Total Bonds Total Cash0 9083 28
Bond Portfolio Analysis as of 09-30-18Security Name Net Assets % Market Value $ Amount $ Maturity Date
Carmax Auto Owner Trust 1.68% 0.00 51,898 52,961 2021-09-15AMERICREDIT AUTOMOBILE RECEIVABLES TRUST2.36%
0.00 51,886 52,961 2022-12-19
Toyota Auto Receivables Owner Trust 2015-B 1.32% 0.00 51,865 52,961 2021-11-15AMERICREDIT AUTOMOBILE RECEIVABLES TRUST3.08%
0.00 51,861 52,961 2023-12-18
Honda Auto Recv 2017-4 2.21% 0.00 51,851 52,961 2024-03-21................................................................................................................................................................................................................................................................................................Hyundai Auto Receivables Trust 2.09% 0.00 51,845 52,961 2023-04-17Honda Auto Receivables Owner Trust 1.36% 0.00 51,844 52,961 2023-01-18Toyota Auto Receivables Owner Trust 2015-B 1.42% 0.00 51,838 52,961 2022-01-15Federal National Mortgage Association 5% 0.00 51,808 49,014 2035-07-01Nissan Auto Receiv 2.11% 0.00 51,801 52,961 2023-05-15................................................................................................................................................................................................................................................................................................CARMAX AUTO OWNER TR 2017-4 2.7% 0.00 51,793 52,961 2023-10-16AMERICREDIT AUTOMOBILE RECEIVABLES TRUST 2.6% 0.00 51,759 52,961 2023-09-18Ford Credit Auto Owner Trust 2.35% 0.00 51,751 52,961 2023-04-15Ford Credit Auto Owner Trust 2.5% 0.00 51,744 52,961 2024-05-15ALLY AUTO RECV TR 2017-1 1.96% 0.00 51,738 52,961 2022-07-15................................................................................................................................................................................................................................................................................................Federal National Mortgage Association 5.5% 0.00 51,729 48,483 2024-02-01Merc-Benz Auto Recv Tr 2016-1 1.46% 0.00 51,721 52,961 2022-12-15Nissan Auto Receiv 2.28% 0.00 51,701 52,961 2024-02-15FIFTH THIRD AUTO TRUST 2.03% 0.00 51,620 52,961 2024-07-15Honda Auto Recv 2017-2 1.87% 0.00 51,609 52,961 2023-09-15................................................................................................................................................................................................................................................................................................Carmax Auto Owner Trust 1.6% 0.00 51,605 52,961 2022-01-18Ford Credit Auto Trust 1.4% 0.00 51,599 52,961 2022-02-15Nissan Auto Receiv 1.38% 0.00 51,566 52,961 2023-01-17Hyundai Auto Receivables Trust 1.45% 0.00 51,519 52,961 2022-11-15Ford Credit Auto Owner Trust 1.87% 0.00 51,510 52,961 2022-09-15................................................................................................................................................................................................................................................................................................Federal National Mortgage Association 6.5% 0.00 51,400 46,883 2028-12-01CARMAX AUTO OWNER TRUST 1.6% 0.00 51,396 52,961 2022-06-15AT&T Inc 5.65% 0.00 51,322 50,043 2047-02-15J.P. Morgan Chase Commercial Mortgage SecuritiesTrust 5.31%
0.00 51,246 52,398 2045-05-15
Federal Home Loan Mortgage Corporation 3% 0.00 51,107 51,709 2026-04-01Federal Home Loan Mortgage Corporation 5.5% 0.00 50,874 47,026 2037-07-01Government National Mortgage Association 5.5% 0.00 50,849 47,195 2034-03-20Federal Home Loan Mortgage Corporation 6% 0.00 50,843 46,799 2031-03-01Federal Home Loan Mortgage Corporation 5% 0.00 50,612 48,199 2034-01-01Federal Home Loan Mortgage Corporation 3.5% 0.00 50,566 50,977 2042-08-01................................................................................................................................................................................................................................................................................................Federal Home Loan Mortgage Corporation 4.5% 0.00 50,428 48,836 2023-09-01NEW JERSEY ST TPK AUTH 7.1% 0.00 50,397 36,570 2041-01-01Government National Mortgage Association 5.5% 0.00 50,332 45,957 2034-02-15Federal National Mortgage Association 5% 0.00 50,321 47,428 2035-07-01Federal National Mortgage Association 4% 0.00 50,306 49,445 2042-04-01................................................................................................................................................................................................................................................................................................Eaton Corporation 4% 0.00 50,269 50,813 2032-11-02Government National Mortgage Association 6% 0.00 50,269 46,229 2034-01-20Federal National Mortgage Association 6% 0.00 50,264 46,258 2036-09-01Federal Home Loan Mortgage Corporation 5.5% 0.00 50,202 46,603 2040-08-01TransCanada Pipelines Limited 5% 0.00 50,161 48,503 2043-10-16................................................................................................................................................................................................................................................................................................Federal Home Loan Mortgage Corporation 6% 0.00 49,937 45,512 2036-09-01Federal National Mortgage Association 4.5% 0.00 49,929 48,122 2024-08-01Federal National Mortgage Association 5.5% 0.00 49,912 46,250 2038-09-01Federal Home Loan Mortgage Corporation 6.5% 0.00 49,909 44,247 2032-08-01Federal National Mortgage Association 5% 0.00 49,837 46,840 2040-08-01................................................................................................................................................................................................................................................................................................Federal Home Loan Mortgage Corporation 6.5% 0.00 49,799 45,015 2039-04-01Government National Mortgage Association 5% 0.00 49,789 46,807 2033-11-15South Carolina Electric & Gas Company 4.35% 0.00 49,709 51,968 2042-02-01Government National Mortgage Association 5.5% 0.00 49,621 46,239 2038-03-20Chubb INA Holdings Inc 4.35% 0.00 49,534 48,503 2045-11-03................................................................................................................................................................................................................................................................................................
©2018 Morningstar, Inc., Morningstar Investment Profiles™ 312-696-6000. All rights reserved. The information contained herein: (1) is proprietary to Morningstar and/or its content providers; (2) maynot be copied or distributed and (3) is not warranted to be accurate, complete or timely. Neither Morningstar nor its content providers are responsible for any damages or losses arising from any use ofinformation. Past performance is no guarantee of future performance. Visit our investment website at www.morningstar.com ß
®

Page 107 of 162
Broad Market Bond Index Fund.......................................................................................................................................................................................................................................................................................................................................
Total Stocks Total Bonds Total Cash0 9083 28
Bond Portfolio Analysis as of 09-30-18Security Name Net Assets % Market Value $ Amount $ Maturity Date
Federal National Mortgage Association 5.5% 0.00 49,526 45,839 2036-04-01Federal National Mortgage Association 6% 0.00 49,497 44,961 2033-02-01Government National Mortgage Association 5% 0.00 49,433 46,539 2036-09-15Government National Mortgage Association 4.5% 0.00 49,418 47,359 2040-02-15Government National Mortgage Association 6% 0.00 49,407 45,729 2038-05-15................................................................................................................................................................................................................................................................................................Federal National Mortgage Association 6% 0.00 49,262 45,624 2034-02-01Verizon Communications Inc. 5.25% 0.00 49,250 46,194 2037-03-16Prudential Financial, Inc. 3.9% 0.00 49,177 54,662 2047-12-07Canadian Pacific Railway Company 6.12% 0.00 49,105 41,574 .Hess Corporation 5.6% 0.00 48,858 48,118 2041-02-15................................................................................................................................................................................................................................................................................................Apple Inc. 3.85% 0.00 48,728 50,813 2046-08-04Federal Home Loan Mortgage Corporation 6% 0.00 48,688 43,892 2029-01-01Centerpoint Energy Houston Electric LLC 6.95% 0.00 48,644 37,725 2033-03-15Federal National Mortgage Association 2.5% 0.00 48,525 52,155 2043-02-01Government National Mortgage Association 4.5% 0.00 48,509 46,493 2039-04-15................................................................................................................................................................................................................................................................................................Federal Home Loan Mortgage Corporation 5.5% 0.00 48,475 44,792 2033-05-01Federal Home Loan Mortgage Corporation 3% 0.00 48,456 48,816 2026-04-01Federal National Mortgage Association 6% 0.00 48,431 44,839 2032-03-01Government National Mortgage Association 4% 0.00 48,281 47,044 2041-01-20NEW JERSEY ST TRANSN TR FD AUTH 6.1% 0.00 48,274 46,194 2028-12-15................................................................................................................................................................................................................................................................................................Government National Mortgage Association 4.5% 0.00 48,169 46,178 2041-09-15Federal Home Loan Mortgage Corporation 6.5% 0.00 48,015 43,403 2036-01-01CHICAGO ILL O HARE INTL ARPT 6.84% 0.00 48,003 46,194 2038-01-01CSX Corporation 4.1% 0.00 47,970 50,813 2044-03-15Anthem Inc 5.1% 0.00 47,883 46,194 2044-01-15................................................................................................................................................................................................................................................................................................Government National Mortgage Association 4.5% 0.00 47,816 45,626 2041-07-20Government National Mortgage Association 5% 0.00 47,800 45,019 2038-10-15Federal National Mortgage Association 6.5% 0.00 47,682 43,160 2031-06-01Federal National Mortgage Association 5.5% 0.00 47,587 44,116 2033-03-01AmeriCredit Automobile Receivables Trust 3.82% 0.00 47,571 47,665 2024-03-18Government National Mortgage Association 4.5% 0.00 47,555 45,590 2039-11-15Federal Home Loan Mortgage Corporation 6% 0.00 47,491 43,166 2038-01-01AmeriCredit Automobile Receivables Trust 3.5% 0.00 47,474 47,665 2024-01-18Enterprise Products Operating LP 4.85% 0.00 47,471 46,579 2044-03-15Federal National Mortgage Association 5% 0.00 47,467 44,783 2033-06-01................................................................................................................................................................................................................................................................................................NEW YORK N Y CITY TRANSITIONAL FIN AUTH 5.51% 0.00 47,443 40,419 2037-08-01Kinder Morgan Energy Partners LP 5.4% 0.00 47,420 46,194 2044-09-01Federal National Mortgage Association 4.5% 0.00 47,380 45,697 2033-09-01Federal Home Loan Mortgage Corporation 5.5% 0.00 47,356 44,053 2039-10-01Federal National Mortgage Association 4% 0.00 47,332 46,528 2039-07-01................................................................................................................................................................................................................................................................................................Federal Home Loan Mortgage Corporation 5% 0.00 47,185 44,508 2041-06-01Federal Home Loan Mortgage Corporation 4.5% 0.00 47,174 45,636 2044-07-01The Boeing Company 6.88% 0.00 47,103 34,645 2039-03-15Federal National Mortgage Association 4% 0.00 47,056 46,250 2041-01-01AmeriCredit Automobile Receivables Trust 2.41% 0.00 47,044 47,665 2022-07-08................................................................................................................................................................................................................................................................................................Government National Mortgage Association 4% 0.00 46,994 45,920 2040-08-15Government National Mortgage Association 5% 0.00 46,943 44,217 2033-05-15NEW YORK N Y CITY MUN WTR FIN AUTH 6.01% 0.00 46,825 36,570 2042-06-15Federal National Mortgage Association 6% 0.00 46,805 42,259 2038-11-01Pfizer Inc. 4.3% 0.00 46,746 46,194 2043-06-15................................................................................................................................................................................................................................................................................................Federal National Mortgage Association 6.5% 0.00 46,736 42,629 2034-12-01Federal Home Loan Mortgage Corporation 5.5% 0.00 46,681 43,586 2035-03-01Government National Mortgage Association 5.5% 0.00 46,614 43,467 2034-01-15Federal National Mortgage Association 6% 0.00 46,373 42,144 2037-01-01Federal National Mortgage Association 7% 0.00 46,328 42,828 2032-09-01................................................................................................................................................................................................................................................................................................Federal Home Loan Mortgage Corporation 4.5% 0.00 46,322 45,417 2026-07-01Federal National Mortgage Association 5% 0.00 46,182 43,501 2034-04-01United Health Group Incorporated 4.25% 0.00 46,114 46,194 2043-03-15Federal National Mortgage Association 3% 0.00 45,978 46,269 2027-05-01Federal National Mortgage Association 6% 0.00 45,883 42,504 2037-09-01................................................................................................................................................................................................................................................................................................
©2018 Morningstar, Inc., Morningstar Investment Profiles™ 312-696-6000. All rights reserved. The information contained herein: (1) is proprietary to Morningstar and/or its content providers; (2) maynot be copied or distributed and (3) is not warranted to be accurate, complete or timely. Neither Morningstar nor its content providers are responsible for any damages or losses arising from any use ofinformation. Past performance is no guarantee of future performance. Visit our investment website at www.morningstar.com ß
®
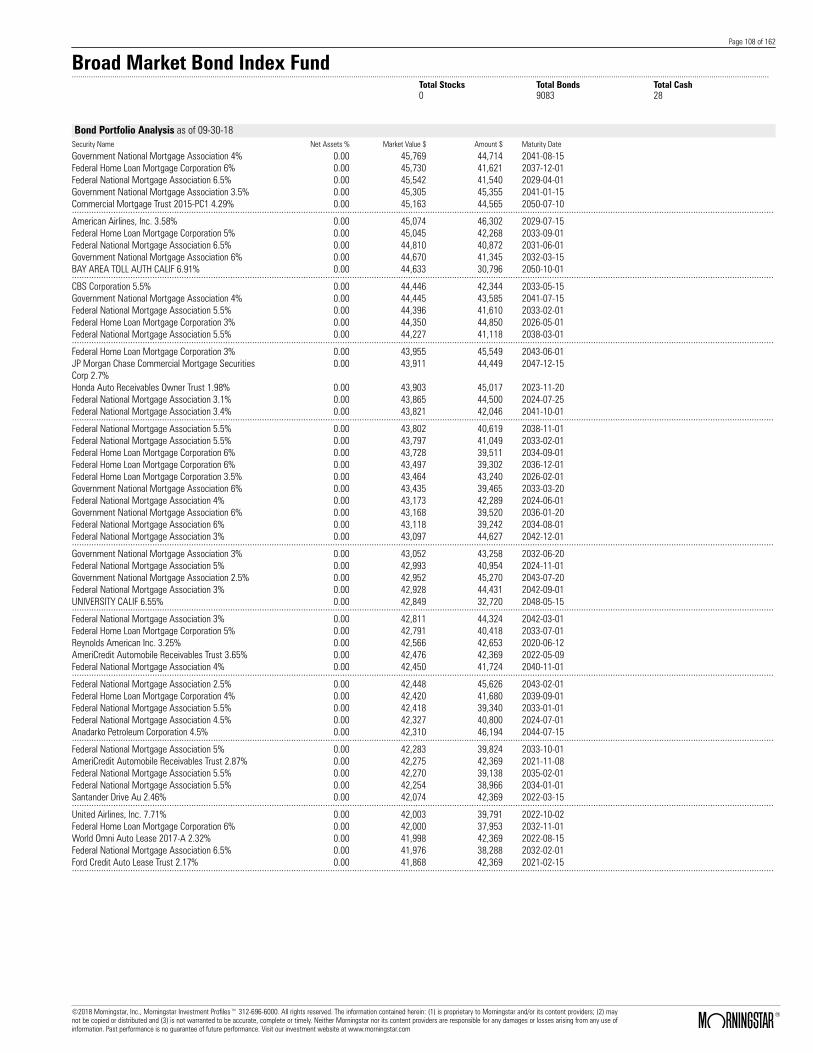
Page 108 of 162
Broad Market Bond Index Fund.......................................................................................................................................................................................................................................................................................................................................
Total Stocks Total Bonds Total Cash0 9083 28
Bond Portfolio Analysis as of 09-30-18Security Name Net Assets % Market Value $ Amount $ Maturity Date
Government National Mortgage Association 4% 0.00 45,769 44,714 2041-08-15Federal Home Loan Mortgage Corporation 6% 0.00 45,730 41,621 2037-12-01Federal National Mortgage Association 6.5% 0.00 45,542 41,540 2029-04-01Government National Mortgage Association 3.5% 0.00 45,305 45,355 2041-01-15Commercial Mortgage Trust 2015-PC1 4.29% 0.00 45,163 44,565 2050-07-10................................................................................................................................................................................................................................................................................................American Airlines, Inc. 3.58% 0.00 45,074 46,302 2029-07-15Federal Home Loan Mortgage Corporation 5% 0.00 45,045 42,268 2033-09-01Federal National Mortgage Association 6.5% 0.00 44,810 40,872 2031-06-01Government National Mortgage Association 6% 0.00 44,670 41,345 2032-03-15BAY AREA TOLL AUTH CALIF 6.91% 0.00 44,633 30,796 2050-10-01................................................................................................................................................................................................................................................................................................CBS Corporation 5.5% 0.00 44,446 42,344 2033-05-15Government National Mortgage Association 4% 0.00 44,445 43,585 2041-07-15Federal National Mortgage Association 5.5% 0.00 44,396 41,610 2033-02-01Federal Home Loan Mortgage Corporation 3% 0.00 44,350 44,850 2026-05-01Federal National Mortgage Association 5.5% 0.00 44,227 41,118 2038-03-01................................................................................................................................................................................................................................................................................................Federal Home Loan Mortgage Corporation 3% 0.00 43,955 45,549 2043-06-01JP Morgan Chase Commercial Mortgage SecuritiesCorp 2.7%
0.00 43,911 44,449 2047-12-15
Honda Auto Receivables Owner Trust 1.98% 0.00 43,903 45,017 2023-11-20Federal National Mortgage Association 3.1% 0.00 43,865 44,500 2024-07-25Federal National Mortgage Association 3.4% 0.00 43,821 42,046 2041-10-01................................................................................................................................................................................................................................................................................................Federal National Mortgage Association 5.5% 0.00 43,802 40,619 2038-11-01Federal National Mortgage Association 5.5% 0.00 43,797 41,049 2033-02-01Federal Home Loan Mortgage Corporation 6% 0.00 43,728 39,511 2034-09-01Federal Home Loan Mortgage Corporation 6% 0.00 43,497 39,302 2036-12-01Federal Home Loan Mortgage Corporation 3.5% 0.00 43,464 43,240 2026-02-01Government National Mortgage Association 6% 0.00 43,435 39,465 2033-03-20Federal National Mortgage Association 4% 0.00 43,173 42,289 2024-06-01Government National Mortgage Association 6% 0.00 43,168 39,520 2036-01-20Federal National Mortgage Association 6% 0.00 43,118 39,242 2034-08-01Federal National Mortgage Association 3% 0.00 43,097 44,627 2042-12-01................................................................................................................................................................................................................................................................................................Government National Mortgage Association 3% 0.00 43,052 43,258 2032-06-20Federal National Mortgage Association 5% 0.00 42,993 40,954 2024-11-01Government National Mortgage Association 2.5% 0.00 42,952 45,270 2043-07-20Federal National Mortgage Association 3% 0.00 42,928 44,431 2042-09-01UNIVERSITY CALIF 6.55% 0.00 42,849 32,720 2048-05-15................................................................................................................................................................................................................................................................................................Federal National Mortgage Association 3% 0.00 42,811 44,324 2042-03-01Federal Home Loan Mortgage Corporation 5% 0.00 42,791 40,418 2033-07-01Reynolds American Inc. 3.25% 0.00 42,566 42,653 2020-06-12AmeriCredit Automobile Receivables Trust 3.65% 0.00 42,476 42,369 2022-05-09Federal National Mortgage Association 4% 0.00 42,450 41,724 2040-11-01................................................................................................................................................................................................................................................................................................Federal National Mortgage Association 2.5% 0.00 42,448 45,626 2043-02-01Federal Home Loan Mortgage Corporation 4% 0.00 42,420 41,680 2039-09-01Federal National Mortgage Association 5.5% 0.00 42,418 39,340 2033-01-01Federal National Mortgage Association 4.5% 0.00 42,327 40,800 2024-07-01Anadarko Petroleum Corporation 4.5% 0.00 42,310 46,194 2044-07-15................................................................................................................................................................................................................................................................................................Federal National Mortgage Association 5% 0.00 42,283 39,824 2033-10-01AmeriCredit Automobile Receivables Trust 2.87% 0.00 42,275 42,369 2021-11-08Federal National Mortgage Association 5.5% 0.00 42,270 39,138 2035-02-01Federal National Mortgage Association 5.5% 0.00 42,254 38,966 2034-01-01Santander Drive Au 2.46% 0.00 42,074 42,369 2022-03-15................................................................................................................................................................................................................................................................................................United Airlines, Inc. 7.71% 0.00 42,003 39,791 2022-10-02Federal Home Loan Mortgage Corporation 6% 0.00 42,000 37,953 2032-11-01World Omni Auto Lease 2017-A 2.32% 0.00 41,998 42,369 2022-08-15Federal National Mortgage Association 6.5% 0.00 41,976 38,288 2032-02-01Ford Credit Auto Lease Trust 2.17% 0.00 41,868 42,369 2021-02-15................................................................................................................................................................................................................................................................................................
©2018 Morningstar, Inc., Morningstar Investment Profiles™ 312-696-6000. All rights reserved. The information contained herein: (1) is proprietary to Morningstar and/or its content providers; (2) maynot be copied or distributed and (3) is not warranted to be accurate, complete or timely. Neither Morningstar nor its content providers are responsible for any damages or losses arising from any use ofinformation. Past performance is no guarantee of future performance. Visit our investment website at www.morningstar.com ß
®

Page 109 of 162
Broad Market Bond Index Fund.......................................................................................................................................................................................................................................................................................................................................
Total Stocks Total Bonds Total Cash0 9083 28
Bond Portfolio Analysis as of 09-30-18Security Name Net Assets % Market Value $ Amount $ Maturity Date
Federal National Mortgage Association 4.5% 0.00 41,720 40,059 2040-01-01World Omni Automobile Trust 2016-A 1.95% 0.00 41,709 42,369 2022-05-16Federal Home Loan Mortgage Corporation 4.5% 0.00 41,704 40,264 2041-04-01Pacific Gas and Electric Company 4.45% 0.00 41,639 44,654 2042-04-15AmeriCredit Automobile Receivables Trust 2.74% 0.00 41,612 42,369 2022-12-08................................................................................................................................................................................................................................................................................................Diageo Capital plc 5.88% 0.00 41,526 34,645 2036-09-30Gm Financial Securitized Term 2.46% 0.00 41,511 42,369 2023-07-17Government National Mortgage Association 4.5% 0.00 41,470 39,750 2040-03-15Government National Mortgage Association 4.5% 0.00 41,348 39,617 2039-02-15Federal Home Loan Mortgage Corporation 6.5% 0.00 41,323 38,781 2026-10-01................................................................................................................................................................................................................................................................................................United Health Group Incorporated 5.8% 0.00 41,271 34,645 2036-03-15Nissan Auto Rec Tr 2017-B 1.95% 0.00 41,247 42,369 2023-10-16Hyundai Auto Recv Tr 2017 1.96% 0.00 41,159 42,369 2023-02-15Midamerican Energy Company 5.75% 0.00 41,059 34,645 2035-11-01Federal National Mortgage Association 8.5% 0.00 40,991 37,780 2027-02-01................................................................................................................................................................................................................................................................................................Zimmer Biomet Holdings Inc 4.25% 0.00 40,990 43,884 2035-08-15METROPOLITAN WTR DIST SOUTHN CALIF CALIF 6.95% 0.00 40,940 38,495 2040-07-01Federal National Mortgage Association 6.5% 0.00 40,833 37,245 2032-10-01Government National Mortgage Association 5% 0.00 40,760 39,053 2039-02-15Government National Mortgage Association 5% 0.00 40,757 38,853 2040-03-15................................................................................................................................................................................................................................................................................................UNIVERSITY TEX 6.28% 0.00 40,721 39,649 2041-08-15Federal National Mortgage Association 3% 0.00 40,677 41,131 2027-10-01Harris Corporation 5.05% 0.00 40,502 38,495 2045-04-27Federal Home Loan Mortgage Corporation 6% 0.00 40,297 37,092 2032-03-01Sonoco Products Company 4.38% 0.00 40,281 39,494 2021-11-01Federal National Mortgage Association 5.5% 0.00 40,217 37,274 2033-12-01Federal Home Loan Mortgage Corporation 5% 0.00 40,184 37,983 2034-01-01Federal Home Loan Mortgage Corporation 5.5% 0.00 40,076 37,384 2033-05-01Government National Mortgage Association 6.5% 0.00 40,067 36,521 2035-11-15Federal Home Loan Mortgage Corporation 6.5% 0.00 40,053 36,205 2031-01-01................................................................................................................................................................................................................................................................................................Federal National Mortgage Association 4% 0.00 40,024 39,347 2039-03-01Eli Lilly and Company 5.55% 0.00 39,993 33,875 2037-03-15Federal National Mortgage Association 2.5% 0.00 39,950 42,943 2043-02-01American International Group, Inc. 3.88% 0.00 39,831 43,884 2035-01-15Government National Mortgage Association 3.5% 0.00 39,686 39,730 2042-02-15................................................................................................................................................................................................................................................................................................Federal Home Loan Mortgage Corporation 5.5% 0.00 39,676 37,186 2036-06-01Government National Mortgage Association 4.5% 0.00 39,661 38,024 2039-02-15Federal National Mortgage Association 5% 0.00 39,605 37,295 2035-10-01Anadarko Petroleum Corporation 6.45% 0.00 39,533 34,645 2036-09-15DALLAS TEX AREA RAPID TRAN 4.92% 0.00 39,411 34,645 2041-12-01................................................................................................................................................................................................................................................................................................Halliburton Company 3.5% 0.00 39,350 39,494 2023-08-01Federal Home Loan Mortgage Corporation 4% 0.00 39,235 38,332 2025-07-01Reynolds American Inc. 5.7% 0.00 39,059 36,570 2035-08-15Federal Home Loan Mortgage Corporation 2.5% 0.00 38,951 40,095 2028-04-01Federal Home Loan Mortgage Corporation 5% 0.00 38,901 36,644 2035-10-01................................................................................................................................................................................................................................................................................................Federal National Mortgage Association 4.5% 0.00 38,810 37,468 2041-10-01Federal Home Loan Mortgage Corporation 6.5% 0.00 38,803 35,076 2029-12-01Federal National Mortgage Association 5% 0.00 38,783 36,585 2036-07-01BAY AREA TOLL AUTH CALIF 6.92% 0.00 38,773 28,871 2040-04-01Federal Home Loan Mortgage Corporation 5.5% 0.00 38,676 36,042 2039-03-01................................................................................................................................................................................................................................................................................................Government National Mortgage Association 5.5% 0.00 38,617 35,612 2033-01-15Federal Home Loan Mortgage Corporation 5.5% 0.00 38,609 35,807 2038-07-01Federal National Mortgage Association 6.5% 0.00 38,541 35,093 2029-03-01Federal National Mortgage Association 6% 0.00 38,484 34,994 2036-04-01Government National Mortgage Association 6% 0.00 38,399 35,198 2033-03-15................................................................................................................................................................................................................................................................................................Government National Mortgage Association 5% 0.00 38,324 36,099 2040-08-15Federal National Mortgage Association 5.5% 0.00 38,322 35,253 2034-01-01Federal Home Loan Mortgage Corporation 5% 0.00 38,309 36,046 2033-12-01The Allstate Corporation 5.35% 0.00 38,292 34,645 2033-06-01Federal Home Loan Mortgage Corporation 3% 0.00 38,230 38,513 2026-03-01................................................................................................................................................................................................................................................................................................
©2018 Morningstar, Inc., Morningstar Investment Profiles™ 312-696-6000. All rights reserved. The information contained herein: (1) is proprietary to Morningstar and/or its content providers; (2) maynot be copied or distributed and (3) is not warranted to be accurate, complete or timely. Neither Morningstar nor its content providers are responsible for any damages or losses arising from any use ofinformation. Past performance is no guarantee of future performance. Visit our investment website at www.morningstar.com ß
®
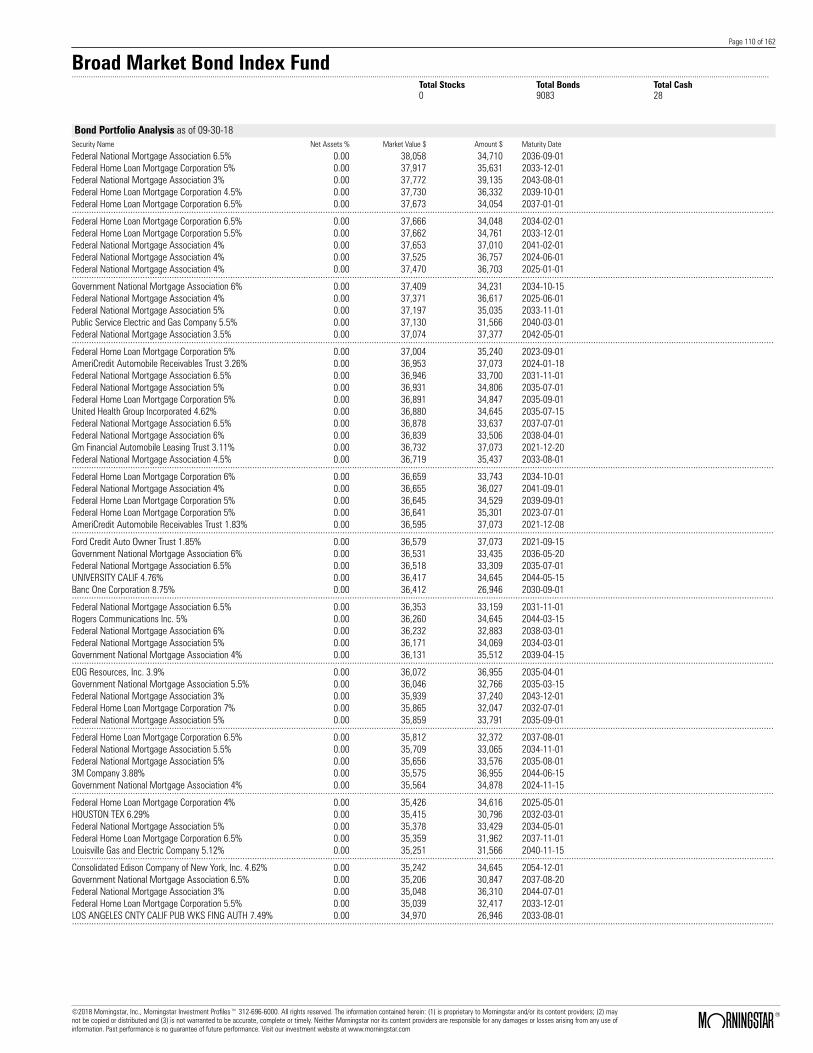
Page 110 of 162
Broad Market Bond Index Fund.......................................................................................................................................................................................................................................................................................................................................
Total Stocks Total Bonds Total Cash0 9083 28
Bond Portfolio Analysis as of 09-30-18Security Name Net Assets % Market Value $ Amount $ Maturity Date
Federal National Mortgage Association 6.5% 0.00 38,058 34,710 2036-09-01Federal Home Loan Mortgage Corporation 5% 0.00 37,917 35,631 2033-12-01Federal National Mortgage Association 3% 0.00 37,772 39,135 2043-08-01Federal Home Loan Mortgage Corporation 4.5% 0.00 37,730 36,332 2039-10-01Federal Home Loan Mortgage Corporation 6.5% 0.00 37,673 34,054 2037-01-01................................................................................................................................................................................................................................................................................................Federal Home Loan Mortgage Corporation 6.5% 0.00 37,666 34,048 2034-02-01Federal Home Loan Mortgage Corporation 5.5% 0.00 37,662 34,761 2033-12-01Federal National Mortgage Association 4% 0.00 37,653 37,010 2041-02-01Federal National Mortgage Association 4% 0.00 37,525 36,757 2024-06-01Federal National Mortgage Association 4% 0.00 37,470 36,703 2025-01-01................................................................................................................................................................................................................................................................................................Government National Mortgage Association 6% 0.00 37,409 34,231 2034-10-15Federal National Mortgage Association 4% 0.00 37,371 36,617 2025-06-01Federal National Mortgage Association 5% 0.00 37,197 35,035 2033-11-01Public Service Electric and Gas Company 5.5% 0.00 37,130 31,566 2040-03-01Federal National Mortgage Association 3.5% 0.00 37,074 37,377 2042-05-01................................................................................................................................................................................................................................................................................................Federal Home Loan Mortgage Corporation 5% 0.00 37,004 35,240 2023-09-01AmeriCredit Automobile Receivables Trust 3.26% 0.00 36,953 37,073 2024-01-18Federal National Mortgage Association 6.5% 0.00 36,946 33,700 2031-11-01Federal National Mortgage Association 5% 0.00 36,931 34,806 2035-07-01Federal Home Loan Mortgage Corporation 5% 0.00 36,891 34,847 2035-09-01United Health Group Incorporated 4.62% 0.00 36,880 34,645 2035-07-15Federal National Mortgage Association 6.5% 0.00 36,878 33,637 2037-07-01Federal National Mortgage Association 6% 0.00 36,839 33,506 2038-04-01Gm Financial Automobile Leasing Trust 3.11% 0.00 36,732 37,073 2021-12-20Federal National Mortgage Association 4.5% 0.00 36,719 35,437 2033-08-01................................................................................................................................................................................................................................................................................................Federal Home Loan Mortgage Corporation 6% 0.00 36,659 33,743 2034-10-01Federal National Mortgage Association 4% 0.00 36,655 36,027 2041-09-01Federal Home Loan Mortgage Corporation 5% 0.00 36,645 34,529 2039-09-01Federal Home Loan Mortgage Corporation 5% 0.00 36,641 35,301 2023-07-01AmeriCredit Automobile Receivables Trust 1.83% 0.00 36,595 37,073 2021-12-08................................................................................................................................................................................................................................................................................................Ford Credit Auto Owner Trust 1.85% 0.00 36,579 37,073 2021-09-15Government National Mortgage Association 6% 0.00 36,531 33,435 2036-05-20Federal National Mortgage Association 6.5% 0.00 36,518 33,309 2035-07-01UNIVERSITY CALIF 4.76% 0.00 36,417 34,645 2044-05-15Banc One Corporation 8.75% 0.00 36,412 26,946 2030-09-01................................................................................................................................................................................................................................................................................................Federal National Mortgage Association 6.5% 0.00 36,353 33,159 2031-11-01Rogers Communications Inc. 5% 0.00 36,260 34,645 2044-03-15Federal National Mortgage Association 6% 0.00 36,232 32,883 2038-03-01Federal National Mortgage Association 5% 0.00 36,171 34,069 2034-03-01Government National Mortgage Association 4% 0.00 36,131 35,512 2039-04-15................................................................................................................................................................................................................................................................................................EOG Resources, Inc. 3.9% 0.00 36,072 36,955 2035-04-01Government National Mortgage Association 5.5% 0.00 36,046 32,766 2035-03-15Federal National Mortgage Association 3% 0.00 35,939 37,240 2043-12-01Federal Home Loan Mortgage Corporation 7% 0.00 35,865 32,047 2032-07-01Federal National Mortgage Association 5% 0.00 35,859 33,791 2035-09-01................................................................................................................................................................................................................................................................................................Federal Home Loan Mortgage Corporation 6.5% 0.00 35,812 32,372 2037-08-01Federal National Mortgage Association 5.5% 0.00 35,709 33,065 2034-11-01Federal National Mortgage Association 5% 0.00 35,656 33,576 2035-08-013M Company 3.88% 0.00 35,575 36,955 2044-06-15Government National Mortgage Association 4% 0.00 35,564 34,878 2024-11-15................................................................................................................................................................................................................................................................................................Federal Home Loan Mortgage Corporation 4% 0.00 35,426 34,616 2025-05-01HOUSTON TEX 6.29% 0.00 35,415 30,796 2032-03-01Federal National Mortgage Association 5% 0.00 35,378 33,429 2034-05-01Federal Home Loan Mortgage Corporation 6.5% 0.00 35,359 31,962 2037-11-01Louisville Gas and Electric Company 5.12% 0.00 35,251 31,566 2040-11-15................................................................................................................................................................................................................................................................................................Consolidated Edison Company of New York, Inc. 4.62% 0.00 35,242 34,645 2054-12-01Government National Mortgage Association 6.5% 0.00 35,206 30,847 2037-08-20Federal National Mortgage Association 3% 0.00 35,048 36,310 2044-07-01Federal Home Loan Mortgage Corporation 5.5% 0.00 35,039 32,417 2033-12-01LOS ANGELES CNTY CALIF PUB WKS FING AUTH 7.49% 0.00 34,970 26,946 2033-08-01................................................................................................................................................................................................................................................................................................
©2018 Morningstar, Inc., Morningstar Investment Profiles™ 312-696-6000. All rights reserved. The information contained herein: (1) is proprietary to Morningstar and/or its content providers; (2) maynot be copied or distributed and (3) is not warranted to be accurate, complete or timely. Neither Morningstar nor its content providers are responsible for any damages or losses arising from any use ofinformation. Past performance is no guarantee of future performance. Visit our investment website at www.morningstar.com ß
®
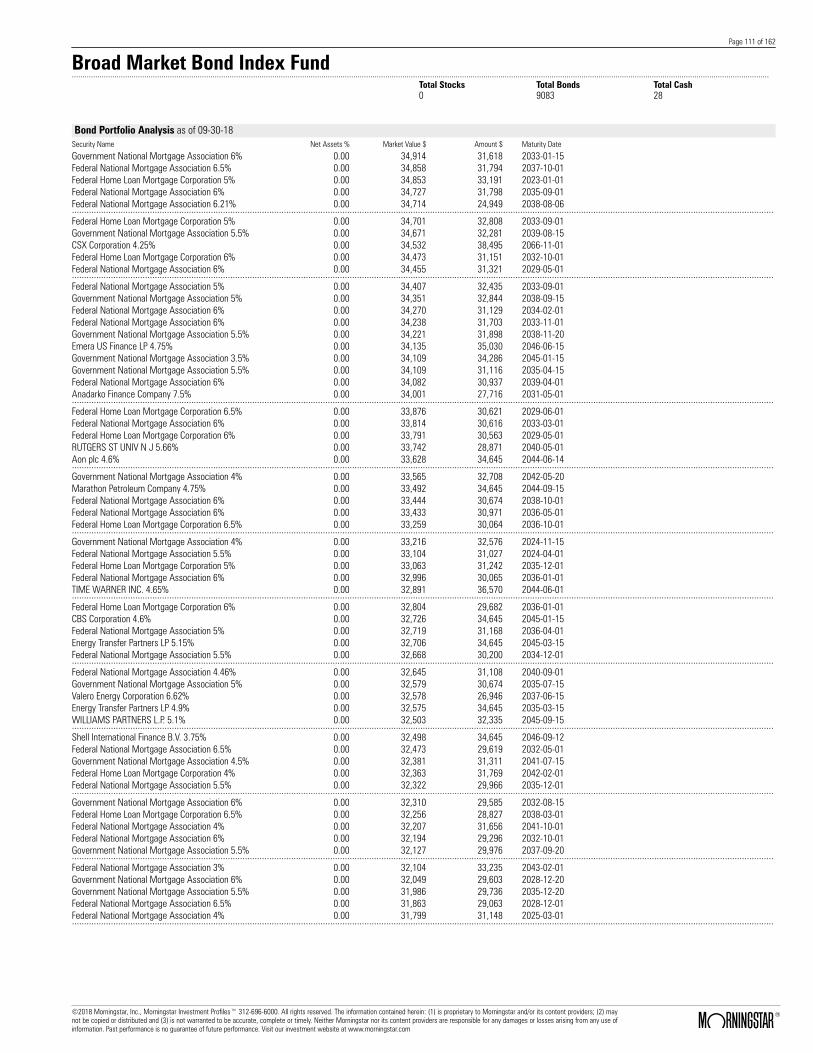
Page 111 of 162
Broad Market Bond Index Fund.......................................................................................................................................................................................................................................................................................................................................
Total Stocks Total Bonds Total Cash0 9083 28
Bond Portfolio Analysis as of 09-30-18Security Name Net Assets % Market Value $ Amount $ Maturity Date
Government National Mortgage Association 6% 0.00 34,914 31,618 2033-01-15Federal National Mortgage Association 6.5% 0.00 34,858 31,794 2037-10-01Federal Home Loan Mortgage Corporation 5% 0.00 34,853 33,191 2023-01-01Federal National Mortgage Association 6% 0.00 34,727 31,798 2035-09-01Federal National Mortgage Association 6.21% 0.00 34,714 24,949 2038-08-06................................................................................................................................................................................................................................................................................................Federal Home Loan Mortgage Corporation 5% 0.00 34,701 32,808 2033-09-01Government National Mortgage Association 5.5% 0.00 34,671 32,281 2039-08-15CSX Corporation 4.25% 0.00 34,532 38,495 2066-11-01Federal Home Loan Mortgage Corporation 6% 0.00 34,473 31,151 2032-10-01Federal National Mortgage Association 6% 0.00 34,455 31,321 2029-05-01................................................................................................................................................................................................................................................................................................Federal National Mortgage Association 5% 0.00 34,407 32,435 2033-09-01Government National Mortgage Association 5% 0.00 34,351 32,844 2038-09-15Federal National Mortgage Association 6% 0.00 34,270 31,129 2034-02-01Federal National Mortgage Association 6% 0.00 34,238 31,703 2033-11-01Government National Mortgage Association 5.5% 0.00 34,221 31,898 2038-11-20Emera US Finance LP 4.75% 0.00 34,135 35,030 2046-06-15Government National Mortgage Association 3.5% 0.00 34,109 34,286 2045-01-15Government National Mortgage Association 5.5% 0.00 34,109 31,116 2035-04-15Federal National Mortgage Association 6% 0.00 34,082 30,937 2039-04-01Anadarko Finance Company 7.5% 0.00 34,001 27,716 2031-05-01................................................................................................................................................................................................................................................................................................Federal Home Loan Mortgage Corporation 6.5% 0.00 33,876 30,621 2029-06-01Federal National Mortgage Association 6% 0.00 33,814 30,616 2033-03-01Federal Home Loan Mortgage Corporation 6% 0.00 33,791 30,563 2029-05-01RUTGERS ST UNIV N J 5.66% 0.00 33,742 28,871 2040-05-01Aon plc 4.6% 0.00 33,628 34,645 2044-06-14................................................................................................................................................................................................................................................................................................Government National Mortgage Association 4% 0.00 33,565 32,708 2042-05-20Marathon Petroleum Company 4.75% 0.00 33,492 34,645 2044-09-15Federal National Mortgage Association 6% 0.00 33,444 30,674 2038-10-01Federal National Mortgage Association 6% 0.00 33,433 30,971 2036-05-01Federal Home Loan Mortgage Corporation 6.5% 0.00 33,259 30,064 2036-10-01................................................................................................................................................................................................................................................................................................Government National Mortgage Association 4% 0.00 33,216 32,576 2024-11-15Federal National Mortgage Association 5.5% 0.00 33,104 31,027 2024-04-01Federal Home Loan Mortgage Corporation 5% 0.00 33,063 31,242 2035-12-01Federal National Mortgage Association 6% 0.00 32,996 30,065 2036-01-01TIME WARNER INC. 4.65% 0.00 32,891 36,570 2044-06-01................................................................................................................................................................................................................................................................................................Federal Home Loan Mortgage Corporation 6% 0.00 32,804 29,682 2036-01-01CBS Corporation 4.6% 0.00 32,726 34,645 2045-01-15Federal National Mortgage Association 5% 0.00 32,719 31,168 2036-04-01Energy Transfer Partners LP 5.15% 0.00 32,706 34,645 2045-03-15Federal National Mortgage Association 5.5% 0.00 32,668 30,200 2034-12-01................................................................................................................................................................................................................................................................................................Federal National Mortgage Association 4.46% 0.00 32,645 31,108 2040-09-01Government National Mortgage Association 5% 0.00 32,579 30,674 2035-07-15Valero Energy Corporation 6.62% 0.00 32,578 26,946 2037-06-15Energy Transfer Partners LP 4.9% 0.00 32,575 34,645 2035-03-15WILLIAMS PARTNERS L.P. 5.1% 0.00 32,503 32,335 2045-09-15................................................................................................................................................................................................................................................................................................Shell International Finance B.V. 3.75% 0.00 32,498 34,645 2046-09-12Federal National Mortgage Association 6.5% 0.00 32,473 29,619 2032-05-01Government National Mortgage Association 4.5% 0.00 32,381 31,311 2041-07-15Federal Home Loan Mortgage Corporation 4% 0.00 32,363 31,769 2042-02-01Federal National Mortgage Association 5.5% 0.00 32,322 29,966 2035-12-01................................................................................................................................................................................................................................................................................................Government National Mortgage Association 6% 0.00 32,310 29,585 2032-08-15Federal Home Loan Mortgage Corporation 6.5% 0.00 32,256 28,827 2038-03-01Federal National Mortgage Association 4% 0.00 32,207 31,656 2041-10-01Federal National Mortgage Association 6% 0.00 32,194 29,296 2032-10-01Government National Mortgage Association 5.5% 0.00 32,127 29,976 2037-09-20................................................................................................................................................................................................................................................................................................Federal National Mortgage Association 3% 0.00 32,104 33,235 2043-02-01Government National Mortgage Association 6% 0.00 32,049 29,603 2028-12-20Government National Mortgage Association 5.5% 0.00 31,986 29,736 2035-12-20Federal National Mortgage Association 6.5% 0.00 31,863 29,063 2028-12-01Federal National Mortgage Association 4% 0.00 31,799 31,148 2025-03-01................................................................................................................................................................................................................................................................................................
©2018 Morningstar, Inc., Morningstar Investment Profiles™ 312-696-6000. All rights reserved. The information contained herein: (1) is proprietary to Morningstar and/or its content providers; (2) maynot be copied or distributed and (3) is not warranted to be accurate, complete or timely. Neither Morningstar nor its content providers are responsible for any damages or losses arising from any use ofinformation. Past performance is no guarantee of future performance. Visit our investment website at www.morningstar.com ß
®

Page 112 of 162
Broad Market Bond Index Fund.......................................................................................................................................................................................................................................................................................................................................
Total Stocks Total Bonds Total Cash0 9083 28
Bond Portfolio Analysis as of 09-30-18Security Name Net Assets % Market Value $ Amount $ Maturity Date
Federal Home Loan Mortgage Corporation 4% 0.00 31,785 31,055 2025-06-01WORLD OMNI AUTOMOBILE LEASE SECURITIZATIONTRUST 3.43%
0.00 31,769 31,776 2024-03-15
Microsoft Corporation 4.75% 0.00 31,768 28,101 2055-11-03FORD CREDIT AUTO LEASE TRUST 3.49% 0.00 31,758 31,776 2022-03-15GM FINANCIAL AUTOMOBILE LEASING TRUST 3.48% 0.00 31,758 31,776 2022-07-20................................................................................................................................................................................................................................................................................................GM FINANCIAL AUTOMOBILE LEASING TRUST 3.7% 0.00 31,756 31,776 2022-07-20Federal Home Loan Mortgage Corporation 4% 0.00 31,744 31,241 2039-04-01Federal National Mortgage Association 5.5% 0.00 31,660 29,347 2033-02-01Federal National Mortgage Association 3% 0.00 31,658 32,802 2043-09-01Federal National Mortgage Association 4% 0.00 31,567 31,033 2039-04-01Hess Corporation 7.3% 0.00 31,567 27,331 2031-08-15Federal National Mortgage Association 5% 0.00 31,543 29,710 2034-04-01Gm Financial Automobile Leasing Trust 2.87% 0.00 31,499 31,776 2021-12-20Federal National Mortgage Association 3% 0.00 31,459 31,658 2027-07-01Santander Drive Au 2.8% 0.00 31,418 31,776 2022-08-15................................................................................................................................................................................................................................................................................................3M Company 3.12% 0.00 31,308 36,955 2046-09-19METROPOLITAN GOVT NASHVILLE & DAVIDSON CNTYTENN 5.71%
0.00 31,307 26,946 2034-07-01
Government National Mortgage Association 5% 0.00 31,290 29,420 2033-11-15Federal National Mortgage Association 3% 0.00 31,275 31,575 2027-12-01Federal Home Loan Mortgage Corporation 3.5% 0.00 31,248 31,085 2026-07-01................................................................................................................................................................................................................................................................................................Grainger W W Inc 4.6% 0.00 31,244 30,026 2045-06-15Federal National Mortgage Association 3% 0.00 31,216 32,344 2043-06-01Progress Energy, Inc. 7% 0.00 31,205 25,022 2031-10-30Federal National Mortgage Association 6% 0.00 31,156 28,518 2034-09-01Federal National Mortgage Association 5.5% 0.00 31,117 28,725 2035-04-01................................................................................................................................................................................................................................................................................................Federal National Mortgage Association 4% 0.00 31,096 30,568 2039-02-01Energy Transfer Partners LP 6.05% 0.00 31,017 29,641 2041-06-01Federal National Mortgage Association 5.5% 0.00 31,010 28,761 2033-07-01Federal National Mortgage Association 5.5% 0.00 30,960 28,663 2035-12-01Federal Home Loan Mortgage Corporation 3.5% 0.00 30,920 30,760 2021-08-01................................................................................................................................................................................................................................................................................................Government National Mortgage Association 4% 0.00 30,828 30,077 2045-04-20Federal National Mortgage Association 5.5% 0.00 30,770 28,379 2033-12-01TransCanada Pipelines Limited 7.62% 0.00 30,753 23,097 2039-01-15Corning Incorporated 4.75% 0.00 30,735 30,796 2042-03-15Government National Mortgage Association 6% 0.00 30,707 28,227 2032-02-15................................................................................................................................................................................................................................................................................................Federal Home Loan Mortgage Corporation 5.5% 0.00 30,608 28,120 2037-06-01John Sevier Combined Cycle Generation LLC - TVA4.63%
0.00 30,579 28,601 2042-01-15
Federal National Mortgage Association 5% 0.00 30,427 28,660 2034-08-01Federal Home Loan Mortgage Corporation 5.5% 0.00 30,399 28,090 2036-04-01Federal Home Loan Mortgage Corporation 3.5% 0.00 30,398 30,185 2029-07-01................................................................................................................................................................................................................................................................................................Federal Home Loan Mortgage Corporation 5.5% 0.00 30,304 27,986 2038-11-01Federal Home Loan Mortgage Corporation 4% 0.00 30,232 29,499 2026-03-01Federal Home Loan Mortgage Corporation 5.5% 0.00 30,226 28,119 2033-01-01Iberdrola International B.V. 6.75% 0.00 30,169 25,022 2036-07-15Federal Home Loan Mortgage Corporation 6.5% 0.00 30,117 27,224 2037-12-01................................................................................................................................................................................................................................................................................................Federal National Mortgage Association 6% 0.00 30,071 27,856 2033-02-01Federal Home Loan Mortgage Corporation 5.5% 0.00 30,060 28,133 2035-09-01Federal National Mortgage Association 5.5% 0.00 30,052 27,855 2035-09-01Government National Mortgage Association 5.5% 0.00 30,037 27,969 2038-10-15Federal National Mortgage Association 5.5% 0.00 30,013 27,591 2034-01-01................................................................................................................................................................................................................................................................................................Government National Mortgage Association 5% 0.00 30,003 28,258 2033-10-15Government National Mortgage Association 6% 0.00 29,941 27,712 2032-05-15Equinor ASA 4.8% 0.00 29,917 27,716 2043-11-08Federal National Mortgage Association 5% 0.00 29,900 28,165 2033-06-01Apple Inc. 2.5% 0.00 29,861 31,595 2025-02-09................................................................................................................................................................................................................................................................................................
©2018 Morningstar, Inc., Morningstar Investment Profiles™ 312-696-6000. All rights reserved. The information contained herein: (1) is proprietary to Morningstar and/or its content providers; (2) maynot be copied or distributed and (3) is not warranted to be accurate, complete or timely. Neither Morningstar nor its content providers are responsible for any damages or losses arising from any use ofinformation. Past performance is no guarantee of future performance. Visit our investment website at www.morningstar.com ß
®

Page 113 of 162
Broad Market Bond Index Fund.......................................................................................................................................................................................................................................................................................................................................
Total Stocks Total Bonds Total Cash0 9083 28
Bond Portfolio Analysis as of 09-30-18Security Name Net Assets % Market Value $ Amount $ Maturity Date
Government National Mortgage Association 4.5% 0.00 29,850 28,478 2040-01-20Enterprise Products Operating LP 4.85% 0.00 29,822 29,256 2042-08-15FirstEnergy Corp. 7.38% 0.00 29,812 23,097 2031-11-15Federal Home Loan Mortgage Corporation 5.5% 0.00 29,792 28,877 2024-12-01Government National Mortgage Association 5.5% 0.00 29,768 27,763 2039-01-15................................................................................................................................................................................................................................................................................................Commonwealth Edison Company 3.7% 0.00 29,717 32,335 2045-03-01Federal National Mortgage Association 6.5% 0.00 29,716 26,689 2036-11-01Regions Financial Corporation 7.38% 0.00 29,711 23,097 2037-12-10Federal Home Loan Mortgage Corporation 3.5% 0.00 29,690 29,537 2026-08-01Federal National Mortgage Association 4.5% 0.00 29,622 28,447 2039-08-01Federal National Mortgage Association 3% 0.00 29,616 30,648 2042-06-01Federal National Mortgage Association 4% 0.00 29,613 29,107 2040-10-01Federal National Mortgage Association 4% 0.00 29,534 29,017 2043-09-01Federal National Mortgage Association 5.5% 0.00 29,516 27,262 2033-06-01Government National Mortgage Association 5.5% 0.00 29,465 27,169 2035-10-15................................................................................................................................................................................................................................................................................................Federal National Mortgage Association 5% 0.00 29,355 28,414 2020-12-01Federal Home Loan Mortgage Corporation 6% 0.00 29,257 26,465 2028-11-01Federal Home Loan Mortgage Corporation 4% 0.00 29,245 28,576 2024-11-01ConocoPhillips Company 5.95% 0.00 29,217 23,097 2046-03-15Government National Mortgage Association 6% 0.00 29,216 27,041 2040-09-15................................................................................................................................................................................................................................................................................................Government National Mortgage Association 5.5% 0.00 29,214 26,952 2035-05-15Federal National Mortgage Association 7.5% 0.00 29,126 26,325 2032-09-01Government National Mortgage Association 5.5% 0.00 29,096 26,807 2034-11-15Kellogg Company 7.45% 0.00 29,092 23,097 2031-04-01Government National Mortgage Association 6% 0.00 29,086 26,651 2037-06-20................................................................................................................................................................................................................................................................................................Federal National Mortgage Association 5.5% 0.00 29,045 26,716 2033-04-01Federal Home Loan Mortgage Corporation 5% 0.00 28,908 27,288 2033-05-01Federal National Mortgage Association 6.5% 0.00 28,891 25,990 2032-07-01GRUPO TELEVISA S A B 8.5% 0.00 28,832 23,097 2032-03-11Federal National Mortgage Association 4.5% 0.00 28,806 27,677 2041-05-01................................................................................................................................................................................................................................................................................................Federal Home Loan Mortgage Corporation 4.5% 0.00 28,771 27,814 2038-04-01Federal National Mortgage Association 6.5% 0.00 28,752 26,043 2036-10-01Federal National Mortgage Association 5.5% 0.00 28,716 26,787 2036-04-01Federal National Mortgage Association 4% 0.00 28,708 28,219 2039-05-01Federal National Mortgage Association 4.58% 0.00 28,642 27,228 2041-08-01................................................................................................................................................................................................................................................................................................Federal National Mortgage Association 5.5% 0.00 28,633 26,836 2032-11-01Federal National Mortgage Association 5.5% 0.00 28,618 26,524 2036-11-01Travelers Property Casualty 6.38% 0.00 28,615 23,097 2033-03-15Government National Mortgage Association 4.5% 0.00 28,581 27,377 2033-10-15Federal National Mortgage Association 6% 0.00 28,533 26,432 2033-02-01................................................................................................................................................................................................................................................................................................Federal National Mortgage Association 5.5% 0.00 28,532 26,273 2035-07-01Federal National Mortgage Association 5.5% 0.00 28,523 26,486 2033-01-01Vale Overseas Limited 8.25% 0.00 28,523 22,327 2034-01-17Federal Home Loan Mortgage Corporation 5% 0.00 28,515 27,008 2035-11-01Government National Mortgage Association 4% 0.00 28,401 27,914 2039-07-15................................................................................................................................................................................................................................................................................................Federal National Mortgage Association 5.5% 0.00 28,363 26,150 2035-11-01Federal National Mortgage Association 5% 0.00 28,345 26,736 2035-11-01Federal National Mortgage Association 6% 0.00 28,324 25,787 2037-11-01Federal Home Loan Mortgage Corporation 5.5% 0.00 28,255 26,408 2039-10-01Government National Mortgage Association 5% 0.00 28,244 26,594 2033-07-15................................................................................................................................................................................................................................................................................................AbbVie Inc. 4.3% 0.00 28,167 30,026 2036-05-14Federal National Mortgage Association 3% 0.00 28,085 29,102 2043-08-01Virginia Electric and Power Company 4.45% 0.00 28,055 27,716 2044-02-15Federal National Mortgage Association 4.5% 0.00 28,031 27,017 2025-04-01Federal Home Loan Mortgage Corporation 5.5% 0.00 27,952 25,794 2034-11-01................................................................................................................................................................................................................................................................................................Federal National Mortgage Association 3% 0.00 27,931 28,920 2042-07-01Government National Mortgage Association 4.5% 0.00 27,930 26,767 2040-03-15Federal National Mortgage Association 4.5% 0.00 27,808 26,822 2035-08-01Federal National Mortgage Association 5.5% 0.00 27,800 25,797 2036-08-01Federal Home Loan Mortgage Corporation 5.5% 0.00 27,763 25,728 2033-04-01................................................................................................................................................................................................................................................................................................
©2018 Morningstar, Inc., Morningstar Investment Profiles™ 312-696-6000. All rights reserved. The information contained herein: (1) is proprietary to Morningstar and/or its content providers; (2) maynot be copied or distributed and (3) is not warranted to be accurate, complete or timely. Neither Morningstar nor its content providers are responsible for any damages or losses arising from any use ofinformation. Past performance is no guarantee of future performance. Visit our investment website at www.morningstar.com ß
®

Page 114 of 162
Broad Market Bond Index Fund.......................................................................................................................................................................................................................................................................................................................................
Total Stocks Total Bonds Total Cash0 9083 28
Bond Portfolio Analysis as of 09-30-18Security Name Net Assets % Market Value $ Amount $ Maturity Date
Florida Power & Light Company 5.69% 0.00 27,750 23,097 2040-03-01Federal National Mortgage Association 6.5% 0.00 27,748 25,310 2032-10-01Federal National Mortgage Association 5.5% 0.00 27,736 25,704 2037-01-01Federal Home Loan Mortgage Corporation 6.5% 0.00 27,718 25,055 2034-09-01Government National Mortgage Association 6% 0.00 27,706 25,411 2036-06-15Federal Home Loan Mortgage Corporation 8% 0.00 27,634 26,076 2024-11-01Federal National Mortgage Association 6.5% 0.00 27,599 25,174 2028-09-01Government National Mortgage Association 6% 0.00 27,550 25,219 2033-12-15Federal Home Loan Mortgage Corporation 3.5% 0.00 27,518 27,375 2025-12-01International Business Machines Corporation 5.88% 0.00 27,427 23,097 2032-11-29................................................................................................................................................................................................................................................................................................Federal National Mortgage Association 6.5% 0.00 27,425 25,015 2031-05-01Eastman Chemical Company 4.5% 0.00 27,353 26,856 2021-01-15Federal National Mortgage Association 5% 0.00 27,350 25,904 2039-06-01Government National Mortgage Association 4% 0.00 27,346 26,870 2041-11-15GSRPM Mortgage Loan Trust 3.71% 0.00 27,331 27,073 2044-08-10................................................................................................................................................................................................................................................................................................Federal National Mortgage Association 5.5% 0.00 27,323 25,296 2034-04-01Federal Home Loan Mortgage Corporation 6.5% 0.00 27,279 24,658 2029-02-01Federal Home Loan Mortgage Corporation 4% 0.00 27,271 26,647 2025-06-01Exelon Corporation 4.45% 0.00 27,242 28,101 2046-04-15Government National Mortgage Association 5% 0.00 27,180 25,736 2038-06-15................................................................................................................................................................................................................................................................................................Anadarko Petroleum Corporation 6.6% 0.00 27,162 23,097 2046-03-15JPMBB COMMERCIAL MORTGAGE SECURITIES TRUST3.67%
0.00 27,151 26,970 2047-04-15
Federal National Mortgage Association 6% 0.00 27,100 25,101 2029-02-01EnCana Corporation 6.5% 0.00 27,070 23,097 2038-02-01Pfizer Inc. 4% 0.00 27,048 27,331 2036-12-15................................................................................................................................................................................................................................................................................................Federal Home Loan Mortgage Corporation 5.5% 0.00 27,007 25,083 2037-04-01Federal Home Loan Mortgage Corporation 5% 0.00 26,998 25,571 2035-11-01Federal National Mortgage Association 5.5% 0.00 26,969 25,208 2036-12-01American Airlines, Inc. 3.38% 0.00 26,875 27,922 2027-05-01Federal Home Loan Mortgage Corporation 4% 0.00 26,816 26,204 2026-12-01................................................................................................................................................................................................................................................................................................Federal National Mortgage Association 6.5% 0.00 26,815 24,458 2031-07-01SOUTH CAROLINA PUB SVC AUTH 5.78% 0.00 26,638 23,097 2041-12-01Exelon Corporation 4.95% 0.00 26,634 25,406 2035-06-15Trinity Health Cr Group 4.12% 0.00 26,597 27,716 2045-12-01Federal Home Loan Mortgage Corporation 7% 0.00 26,569 23,936 2031-06-01................................................................................................................................................................................................................................................................................................Federal Home Loan Mortgage Corporation 5.5% 0.00 26,525 24,478 2035-12-01LOS ANGELES CALIF CMNTY COLLEGE DIST 6.6% 0.00 26,504 19,247 2042-08-01Federal National Mortgage Association 4% 0.00 26,493 25,958 2025-07-01Gm Finl Auto Lease Tr 2018 3.5% 0.00 26,405 26,480 2022-04-20Gm Finl Auto Lease Tr 2018 3.31% 0.00 26,403 26,480 2022-04-20................................................................................................................................................................................................................................................................................................Federal National Mortgage Association 5.5% 0.00 26,391 24,435 2035-02-01Nexen Energy ULC 7.5% 0.00 26,331 19,247 2039-07-30Federal National Mortgage Association 5.5% 0.00 26,329 24,223 2033-07-01Federal National Mortgage Association 6.5% 0.00 26,322 23,615 2036-05-01Gm Financial Automobile Leasing Trust 2.48% 0.00 26,303 26,480 2020-08-20................................................................................................................................................................................................................................................................................................Gm Financial Automobile Leasing Trust 2.74% 0.00 26,265 26,480 2020-08-20Government National Mortgage Association 5.5% 0.00 26,259 24,452 2038-12-15SAN ANTONIO TEX 5.72% 0.00 26,243 21,172 2041-02-01Government National Mortgage Association 5.5% 0.00 26,218 24,140 2034-10-15Comcast Corporation 3.4% 0.00 26,163 32,335 2046-07-15................................................................................................................................................................................................................................................................................................Federal National Mortgage Association 6% 0.00 26,160 23,808 2036-10-01Microsoft Corporation 5.2% 0.00 26,101 22,327 2039-06-01Federal Home Loan Mortgage Corporation 6% 0.00 26,093 23,579 2036-10-01Manulife Financial Corporation 5.38% 0.00 26,050 23,097 2046-03-04Federal Home Loan Mortgage Corporation 5% 0.00 26,005 24,588 2033-09-01................................................................................................................................................................................................................................................................................................Federal National Mortgage Association 6.5% 0.00 25,996 23,712 2034-09-01Government National Mortgage Association 6.5% 0.00 25,941 23,001 2035-05-20Government National Mortgage Association 4% 0.00 25,902 25,458 2039-06-15Hyundai Auto Receivables Trust 2.53% 0.00 25,865 26,480 2023-11-15Government National Mortgage Association 4.5% 0.00 25,827 24,638 2042-01-20
©2018 Morningstar, Inc., Morningstar Investment Profiles™ 312-696-6000. All rights reserved. The information contained herein: (1) is proprietary to Morningstar and/or its content providers; (2) maynot be copied or distributed and (3) is not warranted to be accurate, complete or timely. Neither Morningstar nor its content providers are responsible for any damages or losses arising from any use ofinformation. Past performance is no guarantee of future performance. Visit our investment website at www.morningstar.com ß
®

Page 115 of 162
Broad Market Bond Index Fund.......................................................................................................................................................................................................................................................................................................................................
Total Stocks Total Bonds Total Cash0 9083 28
Bond Portfolio Analysis as of 09-30-18Security Name Net Assets % Market Value $ Amount $ Maturity Date
Ford Credit Auto Trust 1.73% 0.00 25,802 26,480 2022-03-15BED Bath & Beyond 4.92% 0.00 25,800 34,645 2034-08-01Federal National Mortgage Association 7.5% 0.00 25,788 24,376 2026-11-01Federal National Mortgage Association 5.5% 0.00 25,771 23,936 2033-07-01Government National Mortgage Association 6.5% 0.00 25,743 23,465 2033-03-15................................................................................................................................................................................................................................................................................................George Washington University 4.87% 0.00 25,728 23,097 2045-09-15Federal Home Loan Mortgage Corporation 3% 0.00 25,705 25,895 2026-11-01Government National Mortgage Association 4.5% 0.00 25,666 24,604 2040-02-15Government National Mortgage Association 6% 0.00 25,613 23,865 2041-11-20Federal National Mortgage Association 6% 0.00 25,598 23,703 2032-02-01................................................................................................................................................................................................................................................................................................Federal Home Loan Mortgage Corporation 5% 0.00 25,510 24,103 2035-09-01Government National Mortgage Association 4.5% 0.00 25,500 24,468 2024-06-15Federal National Mortgage Association 5.5% 0.00 25,409 23,558 2034-07-01Federal Home Loan Mortgage Corporation 5.5% 0.00 25,396 23,846 2035-04-01Ascension Health Alliance 4.85% 0.00 25,390 23,097 2053-11-15................................................................................................................................................................................................................................................................................................NUTRIEN LTD 4.12% 0.00 25,365 27,716 2035-03-15Government National Mortgage Association 5% 0.00 25,311 24,136 2039-09-15MASSACHUSETTS ST 4.91% 0.00 25,203 23,097 2029-05-01Moodys Corp 5.25% 0.00 25,199 23,097 2044-07-15Federal Home Loan Mortgage Corporation 5.5% 0.00 25,179 23,429 2038-08-01................................................................................................................................................................................................................................................................................................Federal National Mortgage Association 6.5% 0.00 25,161 22,950 2032-09-01Federal Home Loan Mortgage Corporation 6% 0.00 25,149 22,720 2038-01-01Federal Home Loan Mortgage Corporation 5.5% 0.00 25,123 22,758 2037-06-01Federal Home Loan Mortgage Corporation 5% 0.00 25,074 23,716 2034-05-01Federal National Mortgage Association 5% 0.00 25,065 23,877 2025-05-01................................................................................................................................................................................................................................................................................................Government National Mortgage Association 5.5% 0.00 25,055 23,346 2039-04-20Burlington Resources Finance Company 7.4% 0.00 25,014 19,247 2031-12-01Burlington Northern Santa Fe LLC 4.9% 0.00 25,010 23,097 2044-04-01Government National Mortgage Association 5.5% 0.00 24,984 22,713 2037-04-15Federal National Mortgage Association 5.5% 0.00 24,940 23,310 2036-06-01................................................................................................................................................................................................................................................................................................Federal National Mortgage Association 6% 0.00 24,905 22,736 2038-01-01Federal Home Loan Mortgage Corporation 5.5% 0.00 24,856 22,944 2032-11-01Federal Home Loan Mortgage Corporation 3% 0.00 24,848 25,747 2043-07-01Federal National Mortgage Association 4% 0.00 24,809 24,384 2042-07-01Federal National Mortgage Association 4% 0.00 24,806 24,298 2024-04-01................................................................................................................................................................................................................................................................................................Government National Mortgage Association 5.5% 0.00 24,795 22,933 2033-05-15Federal National Mortgage Association 3% 0.00 24,761 25,862 2040-12-01Federal National Mortgage Association 3% 0.00 24,721 25,615 2043-06-01Conoco Funding Company 7.25% 0.00 24,667 19,247 2031-10-15Federal National Mortgage Association 4.5% 0.00 24,655 23,830 2029-06-01................................................................................................................................................................................................................................................................................................Federal Home Loan Mortgage Corporation 7.5% 0.00 24,629 23,255 2031-06-01Federal National Mortgage Association 3% 0.00 24,618 25,507 2043-10-01Government National Mortgage Association 6.5% 0.00 24,406 22,157 2039-01-20Federal National Mortgage Association 6% 0.00 24,375 22,580 2029-05-01Government National Mortgage Association 5% 0.00 24,362 22,936 2034-06-15................................................................................................................................................................................................................................................................................................Hess Corporation 5.8% 0.00 24,325 23,097 2047-04-01Government National Mortgage Association 5% 0.00 24,164 22,792 2040-06-15Federal Home Loan Mortgage Corporation 6.5% 0.00 24,138 21,819 2029-01-01Government National Mortgage Association 5.5% 0.00 24,127 22,633 2047-05-20JP Morgan Chase Commercial Mortgage SecuritiesTrust 2013-C13 2.66%
0.00 24,083 24,136 2046-01-15
................................................................................................................................................................................................................................................................................................Lockheed Martin Corporation 4.5% 0.00 24,075 23,097 2036-05-15Federal National Mortgage Association 3% 0.00 24,045 24,198 2027-05-01Federal National Mortgage Association 4.5% 0.00 24,044 23,191 2033-10-01Federal National Mortgage Association 5.5% 0.00 24,035 22,276 2035-01-01Federal National Mortgage Association 5.5% 0.00 24,033 22,213 2035-02-01
©2018 Morningstar, Inc., Morningstar Investment Profiles™ 312-696-6000. All rights reserved. The information contained herein: (1) is proprietary to Morningstar and/or its content providers; (2) maynot be copied or distributed and (3) is not warranted to be accurate, complete or timely. Neither Morningstar nor its content providers are responsible for any damages or losses arising from any use ofinformation. Past performance is no guarantee of future performance. Visit our investment website at www.morningstar.com ß
®
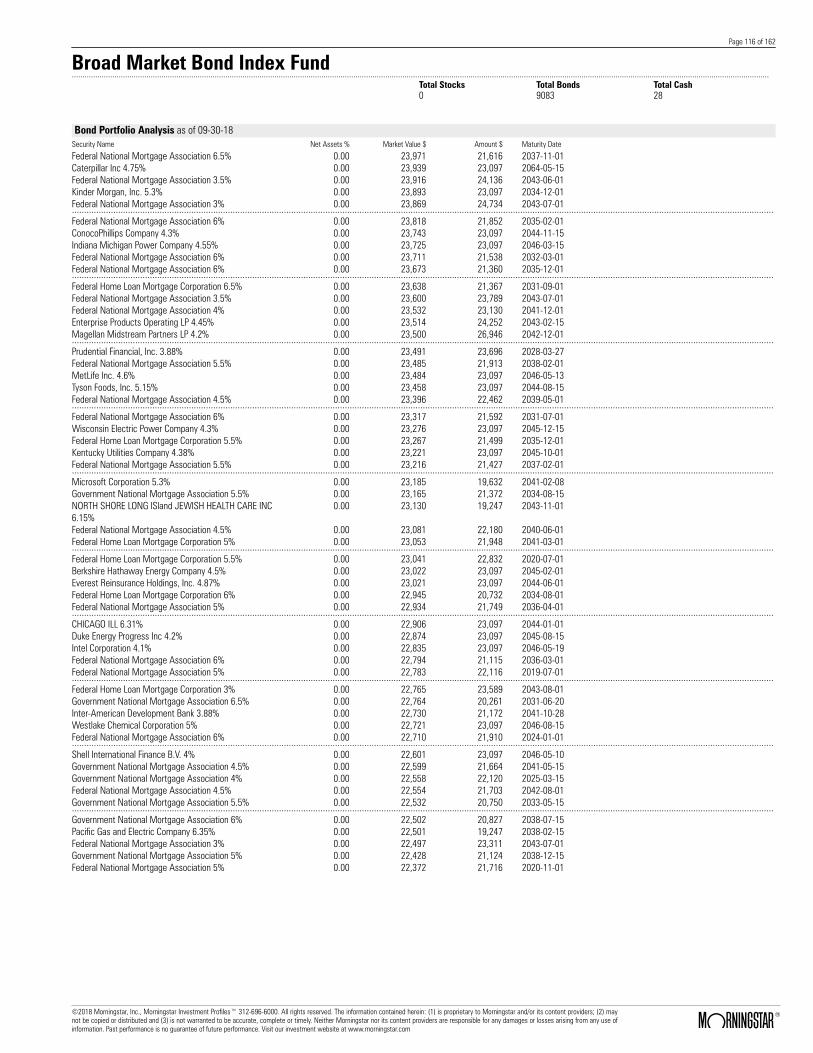
Page 116 of 162
Broad Market Bond Index Fund.......................................................................................................................................................................................................................................................................................................................................
Total Stocks Total Bonds Total Cash0 9083 28
Bond Portfolio Analysis as of 09-30-18Security Name Net Assets % Market Value $ Amount $ Maturity Date
Federal National Mortgage Association 6.5% 0.00 23,971 21,616 2037-11-01Caterpillar Inc 4.75% 0.00 23,939 23,097 2064-05-15Federal National Mortgage Association 3.5% 0.00 23,916 24,136 2043-06-01Kinder Morgan, Inc. 5.3% 0.00 23,893 23,097 2034-12-01Federal National Mortgage Association 3% 0.00 23,869 24,734 2043-07-01................................................................................................................................................................................................................................................................................................Federal National Mortgage Association 6% 0.00 23,818 21,852 2035-02-01ConocoPhillips Company 4.3% 0.00 23,743 23,097 2044-11-15Indiana Michigan Power Company 4.55% 0.00 23,725 23,097 2046-03-15Federal National Mortgage Association 6% 0.00 23,711 21,538 2032-03-01Federal National Mortgage Association 6% 0.00 23,673 21,360 2035-12-01................................................................................................................................................................................................................................................................................................Federal Home Loan Mortgage Corporation 6.5% 0.00 23,638 21,367 2031-09-01Federal National Mortgage Association 3.5% 0.00 23,600 23,789 2043-07-01Federal National Mortgage Association 4% 0.00 23,532 23,130 2041-12-01Enterprise Products Operating LP 4.45% 0.00 23,514 24,252 2043-02-15Magellan Midstream Partners LP 4.2% 0.00 23,500 26,946 2042-12-01................................................................................................................................................................................................................................................................................................Prudential Financial, Inc. 3.88% 0.00 23,491 23,696 2028-03-27Federal National Mortgage Association 5.5% 0.00 23,485 21,913 2038-02-01MetLife Inc. 4.6% 0.00 23,484 23,097 2046-05-13Tyson Foods, Inc. 5.15% 0.00 23,458 23,097 2044-08-15Federal National Mortgage Association 4.5% 0.00 23,396 22,462 2039-05-01................................................................................................................................................................................................................................................................................................Federal National Mortgage Association 6% 0.00 23,317 21,592 2031-07-01Wisconsin Electric Power Company 4.3% 0.00 23,276 23,097 2045-12-15Federal Home Loan Mortgage Corporation 5.5% 0.00 23,267 21,499 2035-12-01Kentucky Utilities Company 4.38% 0.00 23,221 23,097 2045-10-01Federal National Mortgage Association 5.5% 0.00 23,216 21,427 2037-02-01................................................................................................................................................................................................................................................................................................Microsoft Corporation 5.3% 0.00 23,185 19,632 2041-02-08Government National Mortgage Association 5.5% 0.00 23,165 21,372 2034-08-15NORTH SHORE LONG ISland JEWISH HEALTH CARE INC6.15%
0.00 23,130 19,247 2043-11-01
Federal National Mortgage Association 4.5% 0.00 23,081 22,180 2040-06-01Federal Home Loan Mortgage Corporation 5% 0.00 23,053 21,948 2041-03-01................................................................................................................................................................................................................................................................................................Federal Home Loan Mortgage Corporation 5.5% 0.00 23,041 22,832 2020-07-01Berkshire Hathaway Energy Company 4.5% 0.00 23,022 23,097 2045-02-01Everest Reinsurance Holdings, Inc. 4.87% 0.00 23,021 23,097 2044-06-01Federal Home Loan Mortgage Corporation 6% 0.00 22,945 20,732 2034-08-01Federal National Mortgage Association 5% 0.00 22,934 21,749 2036-04-01................................................................................................................................................................................................................................................................................................CHICAGO ILL 6.31% 0.00 22,906 23,097 2044-01-01Duke Energy Progress Inc 4.2% 0.00 22,874 23,097 2045-08-15Intel Corporation 4.1% 0.00 22,835 23,097 2046-05-19Federal National Mortgage Association 6% 0.00 22,794 21,115 2036-03-01Federal National Mortgage Association 5% 0.00 22,783 22,116 2019-07-01................................................................................................................................................................................................................................................................................................Federal Home Loan Mortgage Corporation 3% 0.00 22,765 23,589 2043-08-01Government National Mortgage Association 6.5% 0.00 22,764 20,261 2031-06-20Inter-American Development Bank 3.88% 0.00 22,730 21,172 2041-10-28Westlake Chemical Corporation 5% 0.00 22,721 23,097 2046-08-15Federal National Mortgage Association 6% 0.00 22,710 21,910 2024-01-01................................................................................................................................................................................................................................................................................................Shell International Finance B.V. 4% 0.00 22,601 23,097 2046-05-10Government National Mortgage Association 4.5% 0.00 22,599 21,664 2041-05-15Government National Mortgage Association 4% 0.00 22,558 22,120 2025-03-15Federal National Mortgage Association 4.5% 0.00 22,554 21,703 2042-08-01Government National Mortgage Association 5.5% 0.00 22,532 20,750 2033-05-15................................................................................................................................................................................................................................................................................................Government National Mortgage Association 6% 0.00 22,502 20,827 2038-07-15Pacific Gas and Electric Company 6.35% 0.00 22,501 19,247 2038-02-15Federal National Mortgage Association 3% 0.00 22,497 23,311 2043-07-01Government National Mortgage Association 5% 0.00 22,428 21,124 2038-12-15Federal National Mortgage Association 5% 0.00 22,372 21,716 2020-11-01
©2018 Morningstar, Inc., Morningstar Investment Profiles™ 312-696-6000. All rights reserved. The information contained herein: (1) is proprietary to Morningstar and/or its content providers; (2) maynot be copied or distributed and (3) is not warranted to be accurate, complete or timely. Neither Morningstar nor its content providers are responsible for any damages or losses arising from any use ofinformation. Past performance is no guarantee of future performance. Visit our investment website at www.morningstar.com ß
®
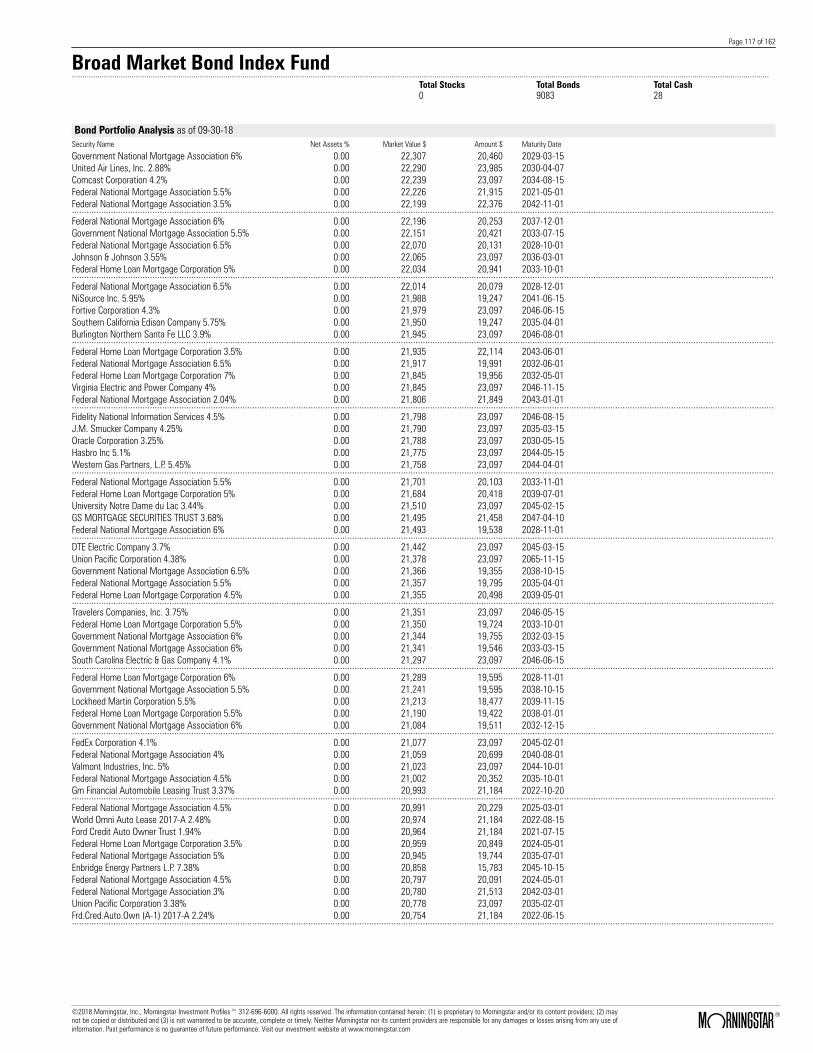
Page 117 of 162
Broad Market Bond Index Fund.......................................................................................................................................................................................................................................................................................................................................
Total Stocks Total Bonds Total Cash0 9083 28
Bond Portfolio Analysis as of 09-30-18Security Name Net Assets % Market Value $ Amount $ Maturity Date
Government National Mortgage Association 6% 0.00 22,307 20,460 2029-03-15United Air Lines, Inc. 2.88% 0.00 22,290 23,985 2030-04-07Comcast Corporation 4.2% 0.00 22,239 23,097 2034-08-15Federal National Mortgage Association 5.5% 0.00 22,226 21,915 2021-05-01Federal National Mortgage Association 3.5% 0.00 22,199 22,376 2042-11-01................................................................................................................................................................................................................................................................................................Federal National Mortgage Association 6% 0.00 22,196 20,253 2037-12-01Government National Mortgage Association 5.5% 0.00 22,151 20,421 2033-07-15Federal National Mortgage Association 6.5% 0.00 22,070 20,131 2028-10-01Johnson & Johnson 3.55% 0.00 22,065 23,097 2036-03-01Federal Home Loan Mortgage Corporation 5% 0.00 22,034 20,941 2033-10-01................................................................................................................................................................................................................................................................................................Federal National Mortgage Association 6.5% 0.00 22,014 20,079 2028-12-01NiSource Inc. 5.95% 0.00 21,988 19,247 2041-06-15Fortive Corporation 4.3% 0.00 21,979 23,097 2046-06-15Southern California Edison Company 5.75% 0.00 21,950 19,247 2035-04-01Burlington Northern Santa Fe LLC 3.9% 0.00 21,945 23,097 2046-08-01................................................................................................................................................................................................................................................................................................Federal Home Loan Mortgage Corporation 3.5% 0.00 21,935 22,114 2043-06-01Federal National Mortgage Association 6.5% 0.00 21,917 19,991 2032-06-01Federal Home Loan Mortgage Corporation 7% 0.00 21,845 19,956 2032-05-01Virginia Electric and Power Company 4% 0.00 21,845 23,097 2046-11-15Federal National Mortgage Association 2.04% 0.00 21,806 21,849 2043-01-01................................................................................................................................................................................................................................................................................................Fidelity National Information Services 4.5% 0.00 21,798 23,097 2046-08-15J.M. Smucker Company 4.25% 0.00 21,790 23,097 2035-03-15Oracle Corporation 3.25% 0.00 21,788 23,097 2030-05-15Hasbro Inc 5.1% 0.00 21,775 23,097 2044-05-15Western Gas Partners, L.P. 5.45% 0.00 21,758 23,097 2044-04-01................................................................................................................................................................................................................................................................................................Federal National Mortgage Association 5.5% 0.00 21,701 20,103 2033-11-01Federal Home Loan Mortgage Corporation 5% 0.00 21,684 20,418 2039-07-01University Notre Dame du Lac 3.44% 0.00 21,510 23,097 2045-02-15GS MORTGAGE SECURITIES TRUST 3.68% 0.00 21,495 21,458 2047-04-10Federal National Mortgage Association 6% 0.00 21,493 19,538 2028-11-01................................................................................................................................................................................................................................................................................................DTE Electric Company 3.7% 0.00 21,442 23,097 2045-03-15Union Pacific Corporation 4.38% 0.00 21,378 23,097 2065-11-15Government National Mortgage Association 6.5% 0.00 21,366 19,355 2038-10-15Federal National Mortgage Association 5.5% 0.00 21,357 19,795 2035-04-01Federal Home Loan Mortgage Corporation 4.5% 0.00 21,355 20,498 2039-05-01................................................................................................................................................................................................................................................................................................Travelers Companies, Inc. 3.75% 0.00 21,351 23,097 2046-05-15Federal Home Loan Mortgage Corporation 5.5% 0.00 21,350 19,724 2033-10-01Government National Mortgage Association 6% 0.00 21,344 19,755 2032-03-15Government National Mortgage Association 6% 0.00 21,341 19,546 2033-03-15South Carolina Electric & Gas Company 4.1% 0.00 21,297 23,097 2046-06-15................................................................................................................................................................................................................................................................................................Federal Home Loan Mortgage Corporation 6% 0.00 21,289 19,595 2028-11-01Government National Mortgage Association 5.5% 0.00 21,241 19,595 2038-10-15Lockheed Martin Corporation 5.5% 0.00 21,213 18,477 2039-11-15Federal Home Loan Mortgage Corporation 5.5% 0.00 21,190 19,422 2038-01-01Government National Mortgage Association 6% 0.00 21,084 19,511 2032-12-15................................................................................................................................................................................................................................................................................................FedEx Corporation 4.1% 0.00 21,077 23,097 2045-02-01Federal National Mortgage Association 4% 0.00 21,059 20,699 2040-08-01Valmont Industries, Inc. 5% 0.00 21,023 23,097 2044-10-01Federal National Mortgage Association 4.5% 0.00 21,002 20,352 2035-10-01Gm Financial Automobile Leasing Trust 3.37% 0.00 20,993 21,184 2022-10-20................................................................................................................................................................................................................................................................................................Federal National Mortgage Association 4.5% 0.00 20,991 20,229 2025-03-01World Omni Auto Lease 2017-A 2.48% 0.00 20,974 21,184 2022-08-15Ford Credit Auto Owner Trust 1.94% 0.00 20,964 21,184 2021-07-15Federal Home Loan Mortgage Corporation 3.5% 0.00 20,959 20,849 2024-05-01Federal National Mortgage Association 5% 0.00 20,945 19,744 2035-07-01Enbridge Energy Partners L.P. 7.38% 0.00 20,858 15,783 2045-10-15Federal National Mortgage Association 4.5% 0.00 20,797 20,091 2024-05-01Federal National Mortgage Association 3% 0.00 20,780 21,513 2042-03-01Union Pacific Corporation 3.38% 0.00 20,778 23,097 2035-02-01Frd.Cred.Auto.Own (A-1) 2017-A 2.24% 0.00 20,754 21,184 2022-06-15................................................................................................................................................................................................................................................................................................
©2018 Morningstar, Inc., Morningstar Investment Profiles™ 312-696-6000. All rights reserved. The information contained herein: (1) is proprietary to Morningstar and/or its content providers; (2) maynot be copied or distributed and (3) is not warranted to be accurate, complete or timely. Neither Morningstar nor its content providers are responsible for any damages or losses arising from any use ofinformation. Past performance is no guarantee of future performance. Visit our investment website at www.morningstar.com ß
®
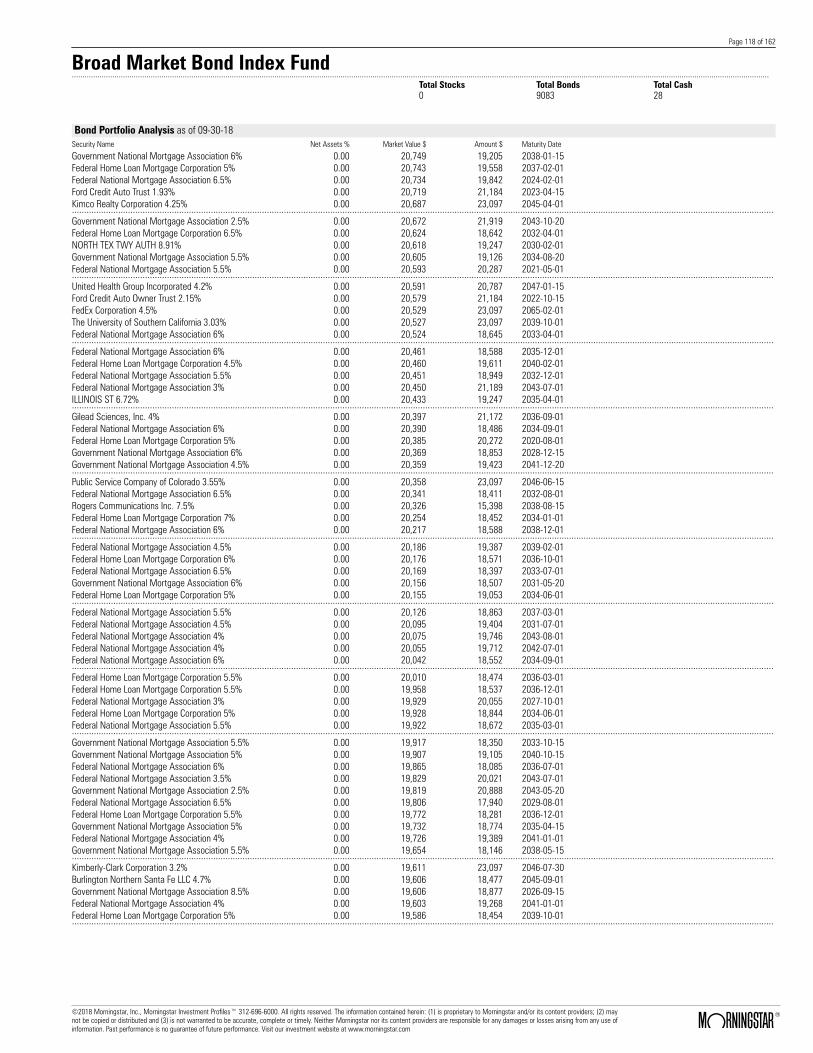
Page 118 of 162
Broad Market Bond Index Fund.......................................................................................................................................................................................................................................................................................................................................
Total Stocks Total Bonds Total Cash0 9083 28
Bond Portfolio Analysis as of 09-30-18Security Name Net Assets % Market Value $ Amount $ Maturity Date
Government National Mortgage Association 6% 0.00 20,749 19,205 2038-01-15Federal Home Loan Mortgage Corporation 5% 0.00 20,743 19,558 2037-02-01Federal National Mortgage Association 6.5% 0.00 20,734 19,842 2024-02-01Ford Credit Auto Trust 1.93% 0.00 20,719 21,184 2023-04-15Kimco Realty Corporation 4.25% 0.00 20,687 23,097 2045-04-01................................................................................................................................................................................................................................................................................................Government National Mortgage Association 2.5% 0.00 20,672 21,919 2043-10-20Federal Home Loan Mortgage Corporation 6.5% 0.00 20,624 18,642 2032-04-01NORTH TEX TWY AUTH 8.91% 0.00 20,618 19,247 2030-02-01Government National Mortgage Association 5.5% 0.00 20,605 19,126 2034-08-20Federal National Mortgage Association 5.5% 0.00 20,593 20,287 2021-05-01................................................................................................................................................................................................................................................................................................United Health Group Incorporated 4.2% 0.00 20,591 20,787 2047-01-15Ford Credit Auto Owner Trust 2.15% 0.00 20,579 21,184 2022-10-15FedEx Corporation 4.5% 0.00 20,529 23,097 2065-02-01The University of Southern California 3.03% 0.00 20,527 23,097 2039-10-01Federal National Mortgage Association 6% 0.00 20,524 18,645 2033-04-01................................................................................................................................................................................................................................................................................................Federal National Mortgage Association 6% 0.00 20,461 18,588 2035-12-01Federal Home Loan Mortgage Corporation 4.5% 0.00 20,460 19,611 2040-02-01Federal National Mortgage Association 5.5% 0.00 20,451 18,949 2032-12-01Federal National Mortgage Association 3% 0.00 20,450 21,189 2043-07-01ILLINOIS ST 6.72% 0.00 20,433 19,247 2035-04-01................................................................................................................................................................................................................................................................................................Gilead Sciences, Inc. 4% 0.00 20,397 21,172 2036-09-01Federal National Mortgage Association 6% 0.00 20,390 18,486 2034-09-01Federal Home Loan Mortgage Corporation 5% 0.00 20,385 20,272 2020-08-01Government National Mortgage Association 6% 0.00 20,369 18,853 2028-12-15Government National Mortgage Association 4.5% 0.00 20,359 19,423 2041-12-20................................................................................................................................................................................................................................................................................................Public Service Company of Colorado 3.55% 0.00 20,358 23,097 2046-06-15Federal National Mortgage Association 6.5% 0.00 20,341 18,411 2032-08-01Rogers Communications Inc. 7.5% 0.00 20,326 15,398 2038-08-15Federal Home Loan Mortgage Corporation 7% 0.00 20,254 18,452 2034-01-01Federal National Mortgage Association 6% 0.00 20,217 18,588 2038-12-01................................................................................................................................................................................................................................................................................................Federal National Mortgage Association 4.5% 0.00 20,186 19,387 2039-02-01Federal Home Loan Mortgage Corporation 6% 0.00 20,176 18,571 2036-10-01Federal National Mortgage Association 6.5% 0.00 20,169 18,397 2033-07-01Government National Mortgage Association 6% 0.00 20,156 18,507 2031-05-20Federal Home Loan Mortgage Corporation 5% 0.00 20,155 19,053 2034-06-01................................................................................................................................................................................................................................................................................................Federal National Mortgage Association 5.5% 0.00 20,126 18,863 2037-03-01Federal National Mortgage Association 4.5% 0.00 20,095 19,404 2031-07-01Federal National Mortgage Association 4% 0.00 20,075 19,746 2043-08-01Federal National Mortgage Association 4% 0.00 20,055 19,712 2042-07-01Federal National Mortgage Association 6% 0.00 20,042 18,552 2034-09-01................................................................................................................................................................................................................................................................................................Federal Home Loan Mortgage Corporation 5.5% 0.00 20,010 18,474 2036-03-01Federal Home Loan Mortgage Corporation 5.5% 0.00 19,958 18,537 2036-12-01Federal National Mortgage Association 3% 0.00 19,929 20,055 2027-10-01Federal Home Loan Mortgage Corporation 5% 0.00 19,928 18,844 2034-06-01Federal National Mortgage Association 5.5% 0.00 19,922 18,672 2035-03-01................................................................................................................................................................................................................................................................................................Government National Mortgage Association 5.5% 0.00 19,917 18,350 2033-10-15Government National Mortgage Association 5% 0.00 19,907 19,105 2040-10-15Federal National Mortgage Association 6% 0.00 19,865 18,085 2036-07-01Federal National Mortgage Association 3.5% 0.00 19,829 20,021 2043-07-01Government National Mortgage Association 2.5% 0.00 19,819 20,888 2043-05-20Federal National Mortgage Association 6.5% 0.00 19,806 17,940 2029-08-01Federal Home Loan Mortgage Corporation 5.5% 0.00 19,772 18,281 2036-12-01Government National Mortgage Association 5% 0.00 19,732 18,774 2035-04-15Federal National Mortgage Association 4% 0.00 19,726 19,389 2041-01-01Government National Mortgage Association 5.5% 0.00 19,654 18,146 2038-05-15................................................................................................................................................................................................................................................................................................Kimberly-Clark Corporation 3.2% 0.00 19,611 23,097 2046-07-30Burlington Northern Santa Fe LLC 4.7% 0.00 19,606 18,477 2045-09-01Government National Mortgage Association 8.5% 0.00 19,606 18,877 2026-09-15Federal National Mortgage Association 4% 0.00 19,603 19,268 2041-01-01Federal Home Loan Mortgage Corporation 5% 0.00 19,586 18,454 2039-10-01................................................................................................................................................................................................................................................................................................
©2018 Morningstar, Inc., Morningstar Investment Profiles™ 312-696-6000. All rights reserved. The information contained herein: (1) is proprietary to Morningstar and/or its content providers; (2) maynot be copied or distributed and (3) is not warranted to be accurate, complete or timely. Neither Morningstar nor its content providers are responsible for any damages or losses arising from any use ofinformation. Past performance is no guarantee of future performance. Visit our investment website at www.morningstar.com ß
®

Page 119 of 162
Broad Market Bond Index Fund.......................................................................................................................................................................................................................................................................................................................................
Total Stocks Total Bonds Total Cash0 9083 28
Bond Portfolio Analysis as of 09-30-18Security Name Net Assets % Market Value $ Amount $ Maturity Date
Government National Mortgage Association 5.5% 0.00 19,566 18,028 2035-05-15Federal National Mortgage Association 6% 0.00 19,559 18,109 2031-06-01Federal Home Loan Mortgage Corporation 3% 0.00 19,518 19,663 2026-10-01Swedish Export Credit Corporation 0% 0.00 19,499 38,495 2037-05-11International Business Machines Corporation 2.9% 0.00 19,456 19,747 2021-11-01................................................................................................................................................................................................................................................................................................Government National Mortgage Association 5.5% 0.00 19,399 18,079 2039-02-20Microsoft Corporation 2% 0.00 19,397 19,747 2020-11-03Federal Home Loan Mortgage Corporation 5% 0.00 19,366 18,345 2039-09-01Federal National Mortgage Association 6% 0.00 19,292 17,521 2034-10-01Federal Home Loan Mortgage Corporation 5% 0.00 19,291 18,235 2034-05-01................................................................................................................................................................................................................................................................................................Federal National Mortgage Association 5% 0.00 19,286 18,159 2033-10-01Federal Home Loan Mortgage Corporation 5.5% 0.00 19,281 17,896 2037-02-01Federal National Mortgage Association 5% 0.00 19,281 18,367 2033-07-01Federal National Mortgage Association 6% 0.00 19,269 17,345 2035-12-01The Kroger Co. 3.88% 0.00 19,262 23,097 2046-10-15................................................................................................................................................................................................................................................................................................Government National Mortgage Association 5% 0.00 19,209 18,106 2034-07-15Government National Mortgage Association 6% 0.00 19,194 17,586 2036-09-20LOS ANGELES CALIF DEPT ARPTS 6.58% 0.00 19,191 15,398 2039-05-15Southern California Edison Company 4.65% 0.00 19,189 18,477 2043-10-01MISSOURI ST HEALTH & EDL FACS AUTH 3.09% 0.00 19,149 23,097 2051-09-15................................................................................................................................................................................................................................................................................................Novant Health, Inc 4.37% 0.00 19,149 19,247 2043-11-01Federal Home Loan Mortgage Corporation 6.5% 0.00 19,118 17,281 2037-07-01Federal National Mortgage Association 7.5% 0.00 19,103 17,514 2032-08-01Norfolk Southern Corporation 4.65% 0.00 19,049 18,477 2046-01-15Government National Mortgage Association 4.5% 0.00 19,034 18,373 2041-09-15................................................................................................................................................................................................................................................................................................Federal Home Loan Mortgage Corporation 7% 0.00 19,029 17,173 2028-12-01Federal National Mortgage Association 6% 0.00 19,018 17,287 2034-09-01Federal National Mortgage Association 4% 0.00 18,997 18,671 2040-11-01Federal National Mortgage Association 3% 0.00 18,865 19,548 2043-05-01Federal Home Loan Mortgage Corporation 4.5% 0.00 18,840 18,175 2035-11-01................................................................................................................................................................................................................................................................................................Federal National Mortgage Association 5.5% 0.00 18,814 17,502 2038-01-01Federal National Mortgage Association 3% 0.00 18,773 19,436 2043-03-01PENNSYLVANIA ST TPK COMMN 5.56% 0.00 18,763 15,398 2049-12-01President & Fellows of Harvard College 3.62% 0.00 18,702 19,247 2037-10-01Government National Mortgage Association 5% 0.00 18,685 17,932 2039-06-15................................................................................................................................................................................................................................................................................................Federal Home Loan Mortgage Corporation 5.5% 0.00 18,671 17,379 2032-11-01Federal National Mortgage Association 4% 0.00 18,621 18,305 2039-08-01Lowes Companies, Inc. 4.38% 0.00 18,613 18,477 2045-09-15Government National Mortgage Association 6.5% 0.00 18,567 16,601 2029-05-20Government National Mortgage Association 6% 0.00 18,564 16,893 2033-01-15................................................................................................................................................................................................................................................................................................Federal Home Loan Mortgage Corporation 5.5% 0.00 18,480 17,059 2033-02-01Federal Realty Investment Trust 4.5% 0.00 18,450 18,477 2044-12-01Federal Home Loan Mortgage Corporation 3.5% 0.00 18,430 18,301 2029-08-01Apache Corporation 4.25% 0.00 18,427 20,787 2044-01-15Federal Home Loan Mortgage Corporation 5% 0.00 18,368 17,333 2034-06-01Federal National Mortgage Association 3% 0.00 18,368 19,031 2043-08-01Federal National Mortgage Association 3% 0.00 18,346 18,984 2042-07-01Federal Home Loan Mortgage Corporation 6% 0.00 18,319 16,677 2037-01-01Federal National Mortgage Association 5.5% 0.00 18,311 16,988 2032-12-01Government National Mortgage Association 6% 0.00 18,310 16,947 2028-12-15................................................................................................................................................................................................................................................................................................Federal National Mortgage Association 3% 0.00 18,243 18,898 2043-03-01Potomac Electric Power Company 4.15% 0.00 18,233 18,477 2043-03-15Government National Mortgage Association 5.5% 0.00 18,206 16,765 2033-06-15Government National Mortgage Association 3.5% 0.00 18,168 18,201 2042-10-15Federal National Mortgage Association 6.5% 0.00 18,165 16,568 2034-09-01................................................................................................................................................................................................................................................................................................Federal National Mortgage Association 5.5% 0.00 18,137 16,735 2033-06-01Kinder Morgan Energy Partners LP 4.7% 0.00 18,103 19,247 2042-11-01Government National Mortgage Association 5% 0.00 18,085 17,028 2039-01-15Government National Mortgage Association 6.5% 0.00 18,083 15,896 2037-12-20Federal National Mortgage Association 4% 0.00 18,077 17,770 2039-06-01................................................................................................................................................................................................................................................................................................
©2018 Morningstar, Inc., Morningstar Investment Profiles™ 312-696-6000. All rights reserved. The information contained herein: (1) is proprietary to Morningstar and/or its content providers; (2) maynot be copied or distributed and (3) is not warranted to be accurate, complete or timely. Neither Morningstar nor its content providers are responsible for any damages or losses arising from any use ofinformation. Past performance is no guarantee of future performance. Visit our investment website at www.morningstar.com ß
®

Page 120 of 162
Broad Market Bond Index Fund.......................................................................................................................................................................................................................................................................................................................................
Total Stocks Total Bonds Total Cash0 9083 28
Bond Portfolio Analysis as of 09-30-18Security Name Net Assets % Market Value $ Amount $ Maturity Date
Federal Home Loan Mortgage Corporation 3% 0.00 18,073 18,207 2026-05-01Duke Energy Progress Inc 4.15% 0.00 18,041 18,477 2044-12-01Government National Mortgage Association 6% 0.00 18,030 16,631 2041-12-20Federal National Mortgage Association 6.5% 0.00 18,000 16,299 2031-09-01Federal National Mortgage Association 4.5% 0.00 17,992 17,341 2043-09-01................................................................................................................................................................................................................................................................................................Federal National Mortgage Association 3% 0.00 17,976 18,627 2043-08-01Federal Home Loan Mortgage Corporation 6.5% 0.00 17,971 16,245 2036-09-01Federal National Mortgage Association 5.5% 0.00 17,939 16,693 2037-08-01Government National Mortgage Association 6% 0.00 17,938 16,602 2038-08-15Federal Home Loan Mortgage Corporation 3.5% 0.00 17,934 17,811 2029-12-01................................................................................................................................................................................................................................................................................................Federal National Mortgage Association 4.5% 0.00 17,821 17,115 2039-12-01Federal National Mortgage Association 5% 0.00 17,794 17,156 2023-12-01Applied Materials Inc. 5.1% 0.00 17,744 16,168 2035-10-01Federal National Mortgage Association 5% 0.00 17,691 16,852 2024-10-01Cleco Power LLC 6% 0.00 17,661 15,398 2040-12-01................................................................................................................................................................................................................................................................................................Federal Home Loan Mortgage Corporation 7% 0.00 17,657 15,479 2037-11-01SAN ANTONIO TEX 5.98% 0.00 17,613 13,858 2039-02-01Government National Mortgage Association 6% 0.00 17,612 16,049 2032-05-15Government National Mortgage Association 5.5% 0.00 17,606 16,244 2035-11-15Government National Mortgage Association 5.5% 0.00 17,589 16,365 2039-01-15................................................................................................................................................................................................................................................................................................Federal National Mortgage Association 5% 0.00 17,574 16,553 2033-04-01Government National Mortgage Association 5% 0.00 17,568 16,533 2039-01-15Federal National Mortgage Association 5.5% 0.00 17,538 16,237 2035-03-01Government National Mortgage Association 6% 0.00 17,523 16,219 2029-05-15Federal National Mortgage Association 7.5% 0.00 17,513 16,904 2030-11-01................................................................................................................................................................................................................................................................................................Federal National Mortgage Association 6% 0.00 17,442 15,850 2036-09-01Government National Mortgage Association 5% 0.00 17,437 16,421 2039-04-15Federal Home Loan Mortgage Corporation 3.5% 0.00 17,413 17,323 2026-06-01Federal National Mortgage Association 5% 0.00 17,396 16,397 2036-03-01Government National Mortgage Association 6% 0.00 17,372 16,071 2038-11-15................................................................................................................................................................................................................................................................................................Federal Home Loan Mortgage Corporation 3.5% 0.00 17,370 17,248 2027-02-01Federal Home Loan Mortgage Corporation 4.5% 0.00 17,326 16,608 2039-12-01Federal National Mortgage Association 6.5% 0.00 17,323 15,801 2026-03-01Federal Home Loan Mortgage Corporation 5.5% 0.00 17,278 16,221 2037-05-01Federal National Mortgage Association 6.5% 0.00 17,278 15,760 2036-10-01................................................................................................................................................................................................................................................................................................Federal National Mortgage Association 3% 0.00 17,261 17,371 2027-11-01Government National Mortgage Association 6% 0.00 17,228 15,878 2034-06-15Federal National Mortgage Association 6.5% 0.00 17,207 15,695 2038-08-01Federal Home Loan Mortgage Corporation 3.5% 0.00 17,178 17,089 2025-11-01Federal National Mortgage Association 3.66% 0.00 17,163 17,049 2020-11-25Government National Mortgage Association 6% 0.00 17,137 15,703 2033-02-15Government National Mortgage Association 5% 0.00 17,126 16,116 2039-02-15Federal National Mortgage Association 3% 0.00 17,121 17,265 2027-09-01Federal National Mortgage Association 5% 0.00 17,119 16,217 2035-12-01Colgate-Palmolive Company 4% 0.00 17,067 17,323 2045-08-15................................................................................................................................................................................................................................................................................................DTE Electric Company 3.7% 0.00 17,057 18,477 2046-06-01GATX Corporation 4.5% 0.00 17,052 18,477 2045-03-30Federal Home Loan Mortgage Corporation 4.5% 0.00 17,046 16,836 2021-02-01XLIT Ltd. 5.5% 0.00 17,015 16,168 2045-03-31Federal National Mortgage Association 5.5% 0.00 17,008 15,941 2033-07-01................................................................................................................................................................................................................................................................................................Federal National Mortgage Association 6.5% 0.00 17,003 15,509 2032-06-01NiSource Inc. 5.8% 0.00 16,994 15,398 2042-02-01Federal Home Loan Mortgage Corporation 5.5% 0.00 16,988 16,560 2024-02-01Federal Home Loan Mortgage Corporation 5% 0.00 16,930 15,945 2035-08-01Federal National Mortgage Association 5.5% 0.00 16,920 15,683 2034-11-01................................................................................................................................................................................................................................................................................................Federal Home Loan Mortgage Corporation 6% 0.00 16,851 16,553 2022-11-01Federal Home Loan Mortgage Corporation 6.5% 0.00 16,846 15,228 2031-12-01Federal National Mortgage Association 5% 0.00 16,772 15,803 2035-07-01Federal National Mortgage Association 3% 0.00 16,746 17,348 2043-04-01Federal National Mortgage Association 6% 0.00 16,716 15,485 2023-12-01................................................................................................................................................................................................................................................................................................
©2018 Morningstar, Inc., Morningstar Investment Profiles™ 312-696-6000. All rights reserved. The information contained herein: (1) is proprietary to Morningstar and/or its content providers; (2) maynot be copied or distributed and (3) is not warranted to be accurate, complete or timely. Neither Morningstar nor its content providers are responsible for any damages or losses arising from any use ofinformation. Past performance is no guarantee of future performance. Visit our investment website at www.morningstar.com ß
®
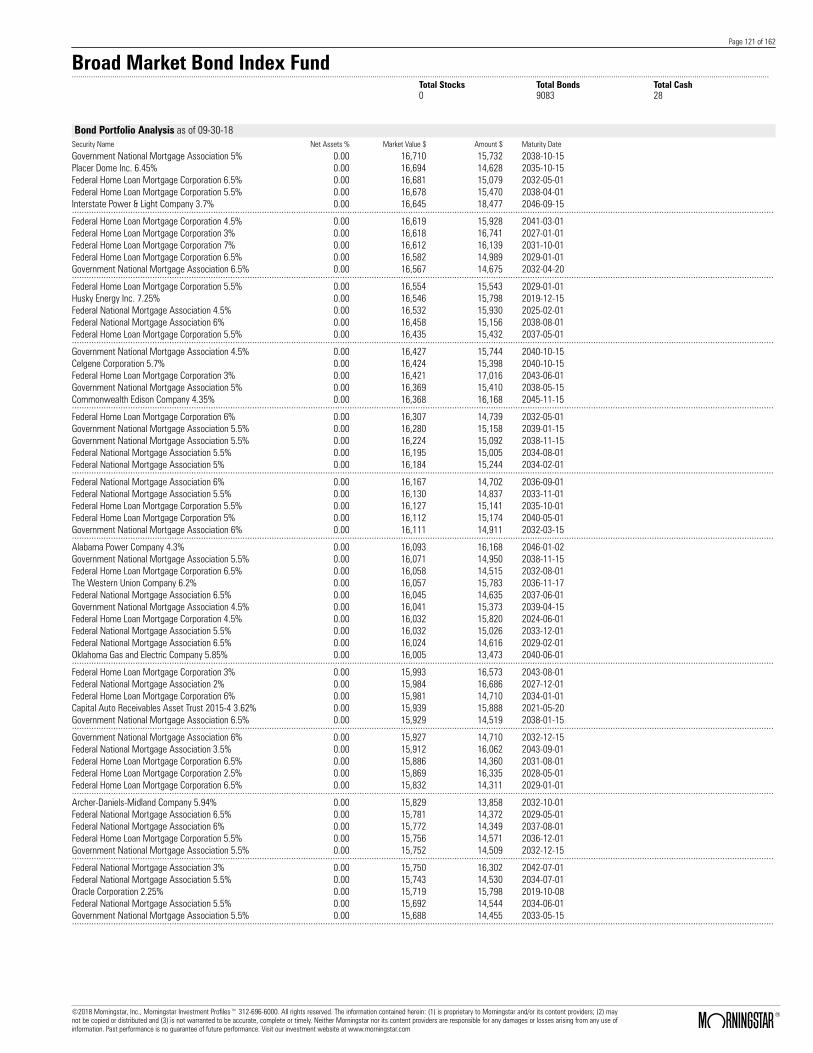
Page 121 of 162
Broad Market Bond Index Fund.......................................................................................................................................................................................................................................................................................................................................
Total Stocks Total Bonds Total Cash0 9083 28
Bond Portfolio Analysis as of 09-30-18Security Name Net Assets % Market Value $ Amount $ Maturity Date
Government National Mortgage Association 5% 0.00 16,710 15,732 2038-10-15Placer Dome Inc. 6.45% 0.00 16,694 14,628 2035-10-15Federal Home Loan Mortgage Corporation 6.5% 0.00 16,681 15,079 2032-05-01Federal Home Loan Mortgage Corporation 5.5% 0.00 16,678 15,470 2038-04-01Interstate Power & Light Company 3.7% 0.00 16,645 18,477 2046-09-15................................................................................................................................................................................................................................................................................................Federal Home Loan Mortgage Corporation 4.5% 0.00 16,619 15,928 2041-03-01Federal Home Loan Mortgage Corporation 3% 0.00 16,618 16,741 2027-01-01Federal Home Loan Mortgage Corporation 7% 0.00 16,612 16,139 2031-10-01Federal Home Loan Mortgage Corporation 6.5% 0.00 16,582 14,989 2029-01-01Government National Mortgage Association 6.5% 0.00 16,567 14,675 2032-04-20................................................................................................................................................................................................................................................................................................Federal Home Loan Mortgage Corporation 5.5% 0.00 16,554 15,543 2029-01-01Husky Energy Inc. 7.25% 0.00 16,546 15,798 2019-12-15Federal National Mortgage Association 4.5% 0.00 16,532 15,930 2025-02-01Federal National Mortgage Association 6% 0.00 16,458 15,156 2038-08-01Federal Home Loan Mortgage Corporation 5.5% 0.00 16,435 15,432 2037-05-01................................................................................................................................................................................................................................................................................................Government National Mortgage Association 4.5% 0.00 16,427 15,744 2040-10-15Celgene Corporation 5.7% 0.00 16,424 15,398 2040-10-15Federal Home Loan Mortgage Corporation 3% 0.00 16,421 17,016 2043-06-01Government National Mortgage Association 5% 0.00 16,369 15,410 2038-05-15Commonwealth Edison Company 4.35% 0.00 16,368 16,168 2045-11-15................................................................................................................................................................................................................................................................................................Federal Home Loan Mortgage Corporation 6% 0.00 16,307 14,739 2032-05-01Government National Mortgage Association 5.5% 0.00 16,280 15,158 2039-01-15Government National Mortgage Association 5.5% 0.00 16,224 15,092 2038-11-15Federal National Mortgage Association 5.5% 0.00 16,195 15,005 2034-08-01Federal National Mortgage Association 5% 0.00 16,184 15,244 2034-02-01................................................................................................................................................................................................................................................................................................Federal National Mortgage Association 6% 0.00 16,167 14,702 2036-09-01Federal National Mortgage Association 5.5% 0.00 16,130 14,837 2033-11-01Federal Home Loan Mortgage Corporation 5.5% 0.00 16,127 15,141 2035-10-01Federal Home Loan Mortgage Corporation 5% 0.00 16,112 15,174 2040-05-01Government National Mortgage Association 6% 0.00 16,111 14,911 2032-03-15................................................................................................................................................................................................................................................................................................Alabama Power Company 4.3% 0.00 16,093 16,168 2046-01-02Government National Mortgage Association 5.5% 0.00 16,071 14,950 2038-11-15Federal Home Loan Mortgage Corporation 6.5% 0.00 16,058 14,515 2032-08-01The Western Union Company 6.2% 0.00 16,057 15,783 2036-11-17Federal National Mortgage Association 6.5% 0.00 16,045 14,635 2037-06-01Government National Mortgage Association 4.5% 0.00 16,041 15,373 2039-04-15Federal Home Loan Mortgage Corporation 4.5% 0.00 16,032 15,820 2024-06-01Federal National Mortgage Association 5.5% 0.00 16,032 15,026 2033-12-01Federal National Mortgage Association 6.5% 0.00 16,024 14,616 2029-02-01Oklahoma Gas and Electric Company 5.85% 0.00 16,005 13,473 2040-06-01................................................................................................................................................................................................................................................................................................Federal Home Loan Mortgage Corporation 3% 0.00 15,993 16,573 2043-08-01Federal National Mortgage Association 2% 0.00 15,984 16,686 2027-12-01Federal Home Loan Mortgage Corporation 6% 0.00 15,981 14,710 2034-01-01Capital Auto Receivables Asset Trust 2015-4 3.62% 0.00 15,939 15,888 2021-05-20Government National Mortgage Association 6.5% 0.00 15,929 14,519 2038-01-15................................................................................................................................................................................................................................................................................................Government National Mortgage Association 6% 0.00 15,927 14,710 2032-12-15Federal National Mortgage Association 3.5% 0.00 15,912 16,062 2043-09-01Federal Home Loan Mortgage Corporation 6.5% 0.00 15,886 14,360 2031-08-01Federal Home Loan Mortgage Corporation 2.5% 0.00 15,869 16,335 2028-05-01Federal Home Loan Mortgage Corporation 6.5% 0.00 15,832 14,311 2029-01-01................................................................................................................................................................................................................................................................................................Archer-Daniels-Midland Company 5.94% 0.00 15,829 13,858 2032-10-01Federal National Mortgage Association 6.5% 0.00 15,781 14,372 2029-05-01Federal National Mortgage Association 6% 0.00 15,772 14,349 2037-08-01Federal Home Loan Mortgage Corporation 5.5% 0.00 15,756 14,571 2036-12-01Government National Mortgage Association 5.5% 0.00 15,752 14,509 2032-12-15................................................................................................................................................................................................................................................................................................Federal National Mortgage Association 3% 0.00 15,750 16,302 2042-07-01Federal National Mortgage Association 5.5% 0.00 15,743 14,530 2034-07-01Oracle Corporation 2.25% 0.00 15,719 15,798 2019-10-08Federal National Mortgage Association 5.5% 0.00 15,692 14,544 2034-06-01Government National Mortgage Association 5.5% 0.00 15,688 14,455 2033-05-15................................................................................................................................................................................................................................................................................................
©2018 Morningstar, Inc., Morningstar Investment Profiles™ 312-696-6000. All rights reserved. The information contained herein: (1) is proprietary to Morningstar and/or its content providers; (2) maynot be copied or distributed and (3) is not warranted to be accurate, complete or timely. Neither Morningstar nor its content providers are responsible for any damages or losses arising from any use ofinformation. Past performance is no guarantee of future performance. Visit our investment website at www.morningstar.com ß
®

Page 122 of 162
Broad Market Bond Index Fund.......................................................................................................................................................................................................................................................................................................................................
Total Stocks Total Bonds Total Cash0 9083 28
Bond Portfolio Analysis as of 09-30-18Security Name Net Assets % Market Value $ Amount $ Maturity Date
Danaher Corporation 4.38% 0.00 15,673 15,398 2045-09-15Federal National Mortgage Association 4.5% 0.00 15,634 15,437 2020-09-01Ace Capital Trust II 9.7% 0.00 15,615 11,163 2030-04-01Frd.Cred.Auto.Own (A-1) 2017-A 2.41% 0.00 15,578 15,888 2023-07-15Carmax Auto Owner Trust 2.95% 0.00 15,570 15,888 2023-11-15................................................................................................................................................................................................................................................................................................Carmax Auto Owner Trust 2.83% 0.00 15,569 15,888 2023-09-15Federal Home Loan Mortgage Corporation 4% 0.00 15,516 15,162 2025-02-01Federal National Mortgage Association 6% 0.00 15,502 14,360 2036-05-01Federal National Mortgage Association 5.5% 0.00 15,496 14,392 2038-06-01Government National Mortgage Association 5.5% 0.00 15,492 14,376 2032-12-20................................................................................................................................................................................................................................................................................................Federal National Mortgage Association 5% 0.00 15,459 14,553 2035-08-01NewYork-Presbyterian Hospital 4.06% 0.00 15,457 16,168 2056-08-01Government National Mortgage Association 5% 0.00 15,443 14,541 2034-05-15Government National Mortgage Association 6% 0.00 15,419 14,000 2029-01-15SOUTH CAROLINA PUB SVC AUTH 6.45% 0.00 15,401 11,933 2050-01-01................................................................................................................................................................................................................................................................................................Government National Mortgage Association 5.5% 0.00 15,398 14,184 2033-05-15Federal Home Loan Mortgage Corporation 6.5% 0.00 15,397 13,918 2028-08-01Federal National Mortgage Association 4.5% 0.00 15,378 14,856 2025-01-01Federal National Mortgage Association 3% 0.00 15,369 15,466 2026-12-01Federal Home Loan Mortgage Corporation 3% 0.00 15,356 15,470 2026-12-01................................................................................................................................................................................................................................................................................................OHIO ST UNIV 4.05% 0.00 15,327 16,168 2056-12-01Government National Mortgage Association 5.5% 0.00 15,326 14,259 2040-12-15Federal National Mortgage Association 6% 0.00 15,271 13,903 2034-09-01Federal National Mortgage Association 5% 0.00 15,245 14,354 2036-03-01Government National Mortgage Association 5.5% 0.00 15,243 14,028 2035-07-15................................................................................................................................................................................................................................................................................................Government National Mortgage Association 6% 0.00 15,225 14,092 2037-08-1521st Century Fox America, Inc. 6.15% 0.00 15,212 11,933 2041-02-15Federal National Mortgage Association 5.5% 0.00 15,208 15,085 2020-06-01Voya Financial Inc 5.7% 0.00 15,205 13,858 2043-07-15OHIO ST UNIV 3.8% 0.00 15,186 16,168 2046-12-01Federal Home Loan Mortgage Corporation 6% 0.00 15,185 13,719 2040-05-01Federal Home Loan Mortgage Corporation 6% 0.00 15,166 13,719 2029-01-01Federal National Mortgage Association 6.5% 0.00 15,157 13,690 2032-08-01Federal National Mortgage Association 5.5% 0.00 15,138 13,969 2035-07-01Federal Home Loan Mortgage Corporation 5.5% 0.00 15,121 13,989 2032-04-01................................................................................................................................................................................................................................................................................................Federal National Mortgage Association 5% 0.00 15,119 14,241 2033-12-01Federal Home Loan Mortgage Corporation 3.5% 0.00 15,110 15,005 2029-12-01DISTRICT COLUMBIA WTR & SWR AUTH 4.81% 0.00 15,080 13,858 .Federal National Mortgage Association 5% 0.00 15,064 14,267 2037-10-01Federal National Mortgage Association 4.5% 0.00 14,996 14,453 2024-07-01................................................................................................................................................................................................................................................................................................Simon Property Group, L.P. 4.25% 0.00 14,975 15,398 2046-11-30Government National Mortgage Association 6% 0.00 14,960 13,847 2028-10-15Federal National Mortgage Association 4.5% 0.00 14,940 14,410 2033-09-01OREGON SCH BRDS ASSN 5.53% 0.00 14,916 13,473 2028-06-30Federal National Mortgage Association 3% 0.00 14,905 15,000 2027-09-01................................................................................................................................................................................................................................................................................................DALLAS TEX AREA RAPID TRAN 6% 0.00 14,902 11,548 2044-12-01Federal National Mortgage Association 4% 0.00 14,889 14,634 2041-03-01Government National Mortgage Association 6% 0.00 14,887 13,661 2031-10-20Federal Home Loan Mortgage Corporation 5.5% 0.00 14,868 13,725 2033-06-01Federal National Mortgage Association 4% 0.00 14,855 14,552 2024-04-01................................................................................................................................................................................................................................................................................................Federal Home Loan Mortgage Corporation 6% 0.00 14,841 13,438 2034-10-01Government National Mortgage Association 5.5% 0.00 14,835 13,836 2033-08-15Federal Home Loan Mortgage Corporation 6% 0.00 14,834 13,654 2033-11-01Federal National Mortgage Association 7% 0.00 14,825 14,467 2027-11-01Federal Home Loan Mortgage Corporation 6.5% 0.00 14,798 13,376 2029-08-01................................................................................................................................................................................................................................................................................................Federal National Mortgage Association 6% 0.00 14,791 13,433 2034-11-01Federal National Mortgage Association 6.5% 0.00 14,776 13,477 2029-06-01Federal National Mortgage Association 8% 0.00 14,754 13,808 2024-08-01Federal National Mortgage Association 7% 0.00 14,739 13,094 2039-02-01Federal National Mortgage Association 4.5% 0.00 14,711 14,176 2025-05-01................................................................................................................................................................................................................................................................................................
©2018 Morningstar, Inc., Morningstar Investment Profiles™ 312-696-6000. All rights reserved. The information contained herein: (1) is proprietary to Morningstar and/or its content providers; (2) maynot be copied or distributed and (3) is not warranted to be accurate, complete or timely. Neither Morningstar nor its content providers are responsible for any damages or losses arising from any use ofinformation. Past performance is no guarantee of future performance. Visit our investment website at www.morningstar.com ß
®
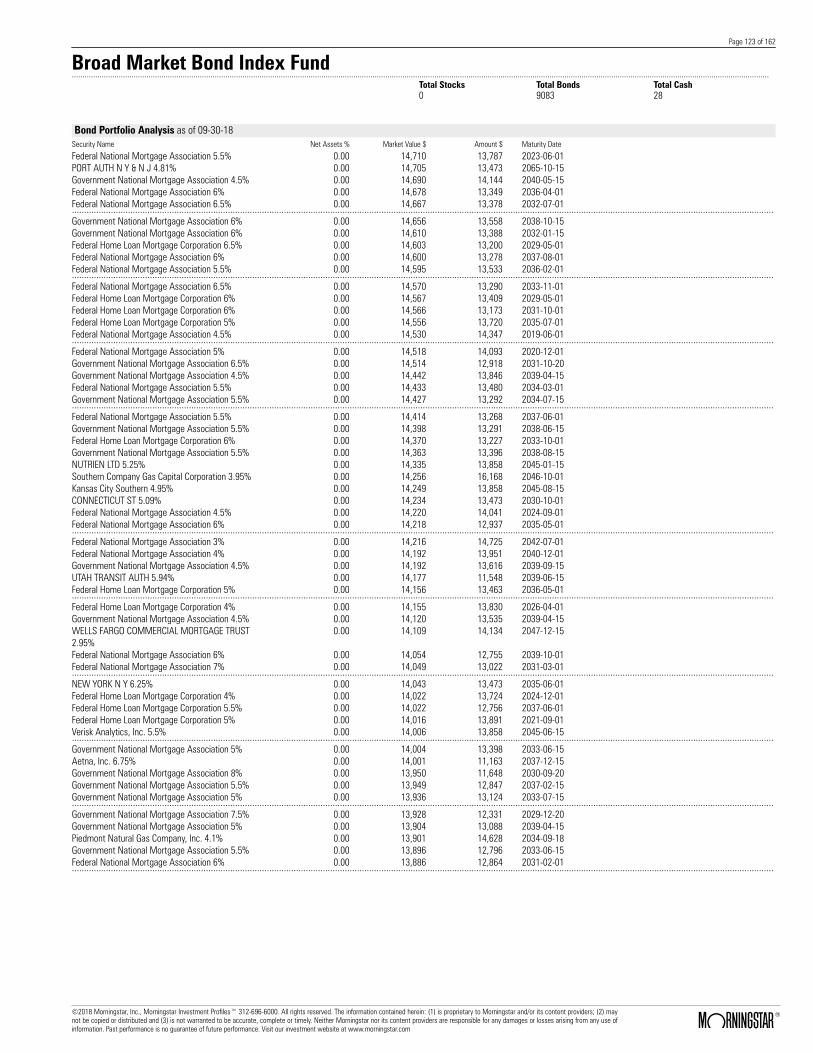
Page 123 of 162
Broad Market Bond Index Fund.......................................................................................................................................................................................................................................................................................................................................
Total Stocks Total Bonds Total Cash0 9083 28
Bond Portfolio Analysis as of 09-30-18Security Name Net Assets % Market Value $ Amount $ Maturity Date
Federal National Mortgage Association 5.5% 0.00 14,710 13,787 2023-06-01PORT AUTH N Y & N J 4.81% 0.00 14,705 13,473 2065-10-15Government National Mortgage Association 4.5% 0.00 14,690 14,144 2040-05-15Federal National Mortgage Association 6% 0.00 14,678 13,349 2036-04-01Federal National Mortgage Association 6.5% 0.00 14,667 13,378 2032-07-01................................................................................................................................................................................................................................................................................................Government National Mortgage Association 6% 0.00 14,656 13,558 2038-10-15Government National Mortgage Association 6% 0.00 14,610 13,388 2032-01-15Federal Home Loan Mortgage Corporation 6.5% 0.00 14,603 13,200 2029-05-01Federal National Mortgage Association 6% 0.00 14,600 13,278 2037-08-01Federal National Mortgage Association 5.5% 0.00 14,595 13,533 2036-02-01................................................................................................................................................................................................................................................................................................Federal National Mortgage Association 6.5% 0.00 14,570 13,290 2033-11-01Federal Home Loan Mortgage Corporation 6% 0.00 14,567 13,409 2029-05-01Federal Home Loan Mortgage Corporation 6% 0.00 14,566 13,173 2031-10-01Federal Home Loan Mortgage Corporation 5% 0.00 14,556 13,720 2035-07-01Federal National Mortgage Association 4.5% 0.00 14,530 14,347 2019-06-01................................................................................................................................................................................................................................................................................................Federal National Mortgage Association 5% 0.00 14,518 14,093 2020-12-01Government National Mortgage Association 6.5% 0.00 14,514 12,918 2031-10-20Government National Mortgage Association 4.5% 0.00 14,442 13,846 2039-04-15Federal National Mortgage Association 5.5% 0.00 14,433 13,480 2034-03-01Government National Mortgage Association 5.5% 0.00 14,427 13,292 2034-07-15................................................................................................................................................................................................................................................................................................Federal National Mortgage Association 5.5% 0.00 14,414 13,268 2037-06-01Government National Mortgage Association 5.5% 0.00 14,398 13,291 2038-06-15Federal Home Loan Mortgage Corporation 6% 0.00 14,370 13,227 2033-10-01Government National Mortgage Association 5.5% 0.00 14,363 13,396 2038-08-15NUTRIEN LTD 5.25% 0.00 14,335 13,858 2045-01-15Southern Company Gas Capital Corporation 3.95% 0.00 14,256 16,168 2046-10-01Kansas City Southern 4.95% 0.00 14,249 13,858 2045-08-15CONNECTICUT ST 5.09% 0.00 14,234 13,473 2030-10-01Federal National Mortgage Association 4.5% 0.00 14,220 14,041 2024-09-01Federal National Mortgage Association 6% 0.00 14,218 12,937 2035-05-01................................................................................................................................................................................................................................................................................................Federal National Mortgage Association 3% 0.00 14,216 14,725 2042-07-01Federal National Mortgage Association 4% 0.00 14,192 13,951 2040-12-01Government National Mortgage Association 4.5% 0.00 14,192 13,616 2039-09-15UTAH TRANSIT AUTH 5.94% 0.00 14,177 11,548 2039-06-15Federal Home Loan Mortgage Corporation 5% 0.00 14,156 13,463 2036-05-01................................................................................................................................................................................................................................................................................................Federal Home Loan Mortgage Corporation 4% 0.00 14,155 13,830 2026-04-01Government National Mortgage Association 4.5% 0.00 14,120 13,535 2039-04-15WELLS FARGO COMMERCIAL MORTGAGE TRUST2.95%
0.00 14,109 14,134 2047-12-15
Federal National Mortgage Association 6% 0.00 14,054 12,755 2039-10-01Federal National Mortgage Association 7% 0.00 14,049 13,022 2031-03-01................................................................................................................................................................................................................................................................................................NEW YORK N Y 6.25% 0.00 14,043 13,473 2035-06-01Federal Home Loan Mortgage Corporation 4% 0.00 14,022 13,724 2024-12-01Federal Home Loan Mortgage Corporation 5.5% 0.00 14,022 12,756 2037-06-01Federal Home Loan Mortgage Corporation 5% 0.00 14,016 13,891 2021-09-01Verisk Analytics, Inc. 5.5% 0.00 14,006 13,858 2045-06-15................................................................................................................................................................................................................................................................................................Government National Mortgage Association 5% 0.00 14,004 13,398 2033-06-15Aetna, Inc. 6.75% 0.00 14,001 11,163 2037-12-15Government National Mortgage Association 8% 0.00 13,950 11,648 2030-09-20Government National Mortgage Association 5.5% 0.00 13,949 12,847 2037-02-15Government National Mortgage Association 5% 0.00 13,936 13,124 2033-07-15................................................................................................................................................................................................................................................................................................Government National Mortgage Association 7.5% 0.00 13,928 12,331 2029-12-20Government National Mortgage Association 5% 0.00 13,904 13,088 2039-04-15Piedmont Natural Gas Company, Inc. 4.1% 0.00 13,901 14,628 2034-09-18Government National Mortgage Association 5.5% 0.00 13,896 12,796 2033-06-15Federal National Mortgage Association 6% 0.00 13,886 12,864 2031-02-01................................................................................................................................................................................................................................................................................................
©2018 Morningstar, Inc., Morningstar Investment Profiles™ 312-696-6000. All rights reserved. The information contained herein: (1) is proprietary to Morningstar and/or its content providers; (2) maynot be copied or distributed and (3) is not warranted to be accurate, complete or timely. Neither Morningstar nor its content providers are responsible for any damages or losses arising from any use ofinformation. Past performance is no guarantee of future performance. Visit our investment website at www.morningstar.com ß
®
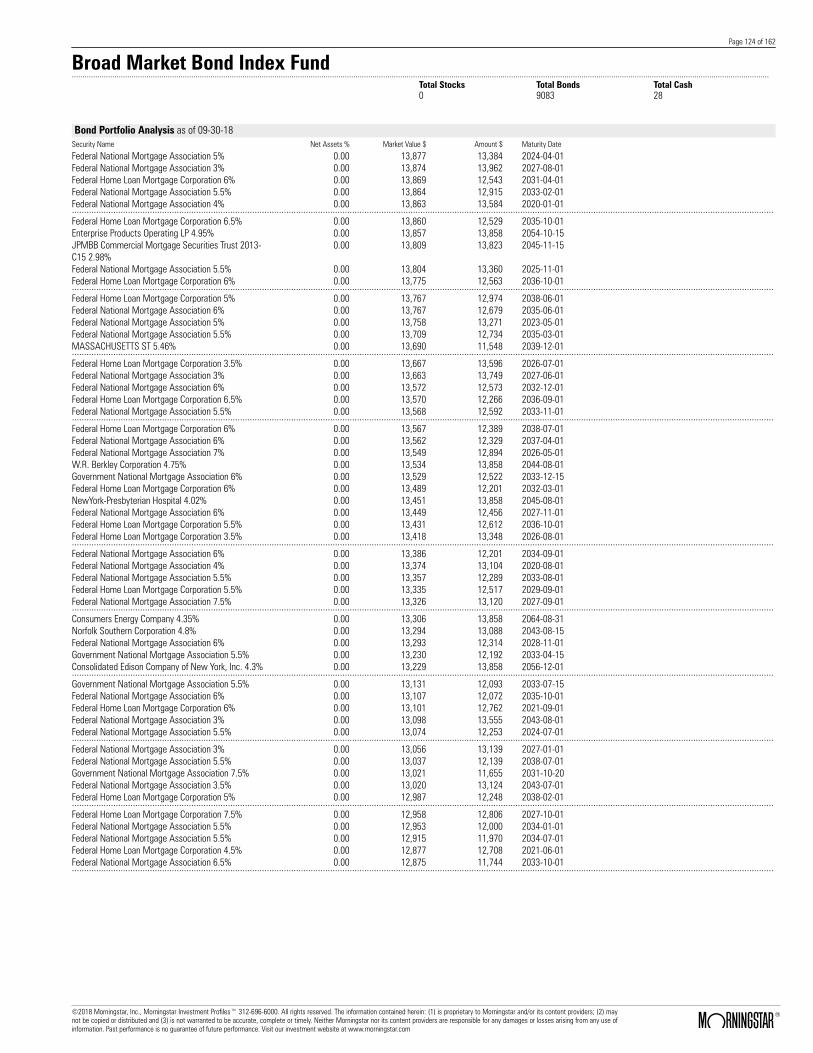
Page 124 of 162
Broad Market Bond Index Fund.......................................................................................................................................................................................................................................................................................................................................
Total Stocks Total Bonds Total Cash0 9083 28
Bond Portfolio Analysis as of 09-30-18Security Name Net Assets % Market Value $ Amount $ Maturity Date
Federal National Mortgage Association 5% 0.00 13,877 13,384 2024-04-01Federal National Mortgage Association 3% 0.00 13,874 13,962 2027-08-01Federal Home Loan Mortgage Corporation 6% 0.00 13,869 12,543 2031-04-01Federal National Mortgage Association 5.5% 0.00 13,864 12,915 2033-02-01Federal National Mortgage Association 4% 0.00 13,863 13,584 2020-01-01................................................................................................................................................................................................................................................................................................Federal Home Loan Mortgage Corporation 6.5% 0.00 13,860 12,529 2035-10-01Enterprise Products Operating LP 4.95% 0.00 13,857 13,858 2054-10-15JPMBB Commercial Mortgage Securities Trust 2013-C15 2.98%
0.00 13,809 13,823 2045-11-15
Federal National Mortgage Association 5.5% 0.00 13,804 13,360 2025-11-01Federal Home Loan Mortgage Corporation 6% 0.00 13,775 12,563 2036-10-01................................................................................................................................................................................................................................................................................................Federal Home Loan Mortgage Corporation 5% 0.00 13,767 12,974 2038-06-01Federal National Mortgage Association 6% 0.00 13,767 12,679 2035-06-01Federal National Mortgage Association 5% 0.00 13,758 13,271 2023-05-01Federal National Mortgage Association 5.5% 0.00 13,709 12,734 2035-03-01MASSACHUSETTS ST 5.46% 0.00 13,690 11,548 2039-12-01................................................................................................................................................................................................................................................................................................Federal Home Loan Mortgage Corporation 3.5% 0.00 13,667 13,596 2026-07-01Federal National Mortgage Association 3% 0.00 13,663 13,749 2027-06-01Federal National Mortgage Association 6% 0.00 13,572 12,573 2032-12-01Federal Home Loan Mortgage Corporation 6.5% 0.00 13,570 12,266 2036-09-01Federal National Mortgage Association 5.5% 0.00 13,568 12,592 2033-11-01................................................................................................................................................................................................................................................................................................Federal Home Loan Mortgage Corporation 6% 0.00 13,567 12,389 2038-07-01Federal National Mortgage Association 6% 0.00 13,562 12,329 2037-04-01Federal National Mortgage Association 7% 0.00 13,549 12,894 2026-05-01W.R. Berkley Corporation 4.75% 0.00 13,534 13,858 2044-08-01Government National Mortgage Association 6% 0.00 13,529 12,522 2033-12-15Federal Home Loan Mortgage Corporation 6% 0.00 13,489 12,201 2032-03-01NewYork-Presbyterian Hospital 4.02% 0.00 13,451 13,858 2045-08-01Federal National Mortgage Association 6% 0.00 13,449 12,456 2027-11-01Federal Home Loan Mortgage Corporation 5.5% 0.00 13,431 12,612 2036-10-01Federal Home Loan Mortgage Corporation 3.5% 0.00 13,418 13,348 2026-08-01................................................................................................................................................................................................................................................................................................Federal National Mortgage Association 6% 0.00 13,386 12,201 2034-09-01Federal National Mortgage Association 4% 0.00 13,374 13,104 2020-08-01Federal National Mortgage Association 5.5% 0.00 13,357 12,289 2033-08-01Federal Home Loan Mortgage Corporation 5.5% 0.00 13,335 12,517 2029-09-01Federal National Mortgage Association 7.5% 0.00 13,326 13,120 2027-09-01................................................................................................................................................................................................................................................................................................Consumers Energy Company 4.35% 0.00 13,306 13,858 2064-08-31Norfolk Southern Corporation 4.8% 0.00 13,294 13,088 2043-08-15Federal National Mortgage Association 6% 0.00 13,293 12,314 2028-11-01Government National Mortgage Association 5.5% 0.00 13,230 12,192 2033-04-15Consolidated Edison Company of New York, Inc. 4.3% 0.00 13,229 13,858 2056-12-01................................................................................................................................................................................................................................................................................................Government National Mortgage Association 5.5% 0.00 13,131 12,093 2033-07-15Federal National Mortgage Association 6% 0.00 13,107 12,072 2035-10-01Federal Home Loan Mortgage Corporation 6% 0.00 13,101 12,762 2021-09-01Federal National Mortgage Association 3% 0.00 13,098 13,555 2043-08-01Federal National Mortgage Association 5.5% 0.00 13,074 12,253 2024-07-01................................................................................................................................................................................................................................................................................................Federal National Mortgage Association 3% 0.00 13,056 13,139 2027-01-01Federal National Mortgage Association 5.5% 0.00 13,037 12,139 2038-07-01Government National Mortgage Association 7.5% 0.00 13,021 11,655 2031-10-20Federal National Mortgage Association 3.5% 0.00 13,020 13,124 2043-07-01Federal Home Loan Mortgage Corporation 5% 0.00 12,987 12,248 2038-02-01................................................................................................................................................................................................................................................................................................Federal Home Loan Mortgage Corporation 7.5% 0.00 12,958 12,806 2027-10-01Federal National Mortgage Association 5.5% 0.00 12,953 12,000 2034-01-01Federal National Mortgage Association 5.5% 0.00 12,915 11,970 2034-07-01Federal Home Loan Mortgage Corporation 4.5% 0.00 12,877 12,708 2021-06-01Federal National Mortgage Association 6.5% 0.00 12,875 11,744 2033-10-01................................................................................................................................................................................................................................................................................................
©2018 Morningstar, Inc., Morningstar Investment Profiles™ 312-696-6000. All rights reserved. The information contained herein: (1) is proprietary to Morningstar and/or its content providers; (2) maynot be copied or distributed and (3) is not warranted to be accurate, complete or timely. Neither Morningstar nor its content providers are responsible for any damages or losses arising from any use ofinformation. Past performance is no guarantee of future performance. Visit our investment website at www.morningstar.com ß
®
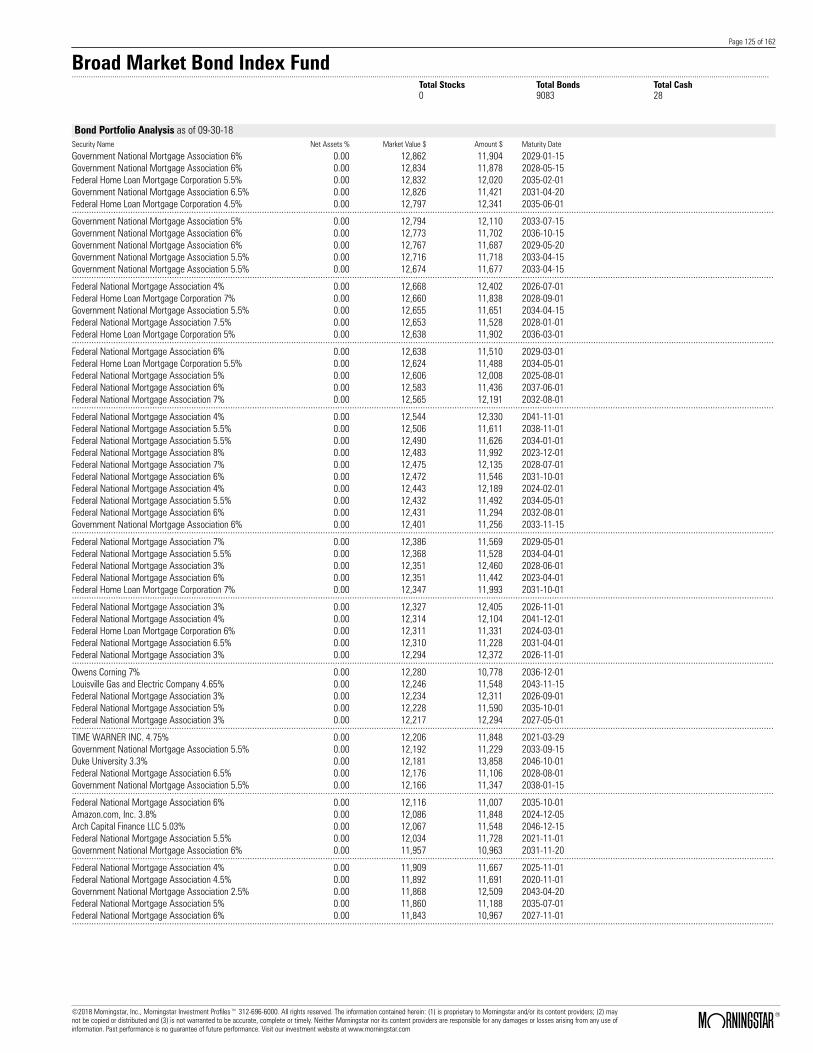
Page 125 of 162
Broad Market Bond Index Fund.......................................................................................................................................................................................................................................................................................................................................
Total Stocks Total Bonds Total Cash0 9083 28
Bond Portfolio Analysis as of 09-30-18Security Name Net Assets % Market Value $ Amount $ Maturity Date
Government National Mortgage Association 6% 0.00 12,862 11,904 2029-01-15Government National Mortgage Association 6% 0.00 12,834 11,878 2028-05-15Federal Home Loan Mortgage Corporation 5.5% 0.00 12,832 12,020 2035-02-01Government National Mortgage Association 6.5% 0.00 12,826 11,421 2031-04-20Federal Home Loan Mortgage Corporation 4.5% 0.00 12,797 12,341 2035-06-01................................................................................................................................................................................................................................................................................................Government National Mortgage Association 5% 0.00 12,794 12,110 2033-07-15Government National Mortgage Association 6% 0.00 12,773 11,702 2036-10-15Government National Mortgage Association 6% 0.00 12,767 11,687 2029-05-20Government National Mortgage Association 5.5% 0.00 12,716 11,718 2033-04-15Government National Mortgage Association 5.5% 0.00 12,674 11,677 2033-04-15................................................................................................................................................................................................................................................................................................Federal National Mortgage Association 4% 0.00 12,668 12,402 2026-07-01Federal Home Loan Mortgage Corporation 7% 0.00 12,660 11,838 2028-09-01Government National Mortgage Association 5.5% 0.00 12,655 11,651 2034-04-15Federal National Mortgage Association 7.5% 0.00 12,653 11,528 2028-01-01Federal Home Loan Mortgage Corporation 5% 0.00 12,638 11,902 2036-03-01................................................................................................................................................................................................................................................................................................Federal National Mortgage Association 6% 0.00 12,638 11,510 2029-03-01Federal Home Loan Mortgage Corporation 5.5% 0.00 12,624 11,488 2034-05-01Federal National Mortgage Association 5% 0.00 12,606 12,008 2025-08-01Federal National Mortgage Association 6% 0.00 12,583 11,436 2037-06-01Federal National Mortgage Association 7% 0.00 12,565 12,191 2032-08-01................................................................................................................................................................................................................................................................................................Federal National Mortgage Association 4% 0.00 12,544 12,330 2041-11-01Federal National Mortgage Association 5.5% 0.00 12,506 11,611 2038-11-01Federal National Mortgage Association 5.5% 0.00 12,490 11,626 2034-01-01Federal National Mortgage Association 8% 0.00 12,483 11,992 2023-12-01Federal National Mortgage Association 7% 0.00 12,475 12,135 2028-07-01Federal National Mortgage Association 6% 0.00 12,472 11,546 2031-10-01Federal National Mortgage Association 4% 0.00 12,443 12,189 2024-02-01Federal National Mortgage Association 5.5% 0.00 12,432 11,492 2034-05-01Federal National Mortgage Association 6% 0.00 12,431 11,294 2032-08-01Government National Mortgage Association 6% 0.00 12,401 11,256 2033-11-15................................................................................................................................................................................................................................................................................................Federal National Mortgage Association 7% 0.00 12,386 11,569 2029-05-01Federal National Mortgage Association 5.5% 0.00 12,368 11,528 2034-04-01Federal National Mortgage Association 3% 0.00 12,351 12,460 2028-06-01Federal National Mortgage Association 6% 0.00 12,351 11,442 2023-04-01Federal Home Loan Mortgage Corporation 7% 0.00 12,347 11,993 2031-10-01................................................................................................................................................................................................................................................................................................Federal National Mortgage Association 3% 0.00 12,327 12,405 2026-11-01Federal National Mortgage Association 4% 0.00 12,314 12,104 2041-12-01Federal Home Loan Mortgage Corporation 6% 0.00 12,311 11,331 2024-03-01Federal National Mortgage Association 6.5% 0.00 12,310 11,228 2031-04-01Federal National Mortgage Association 3% 0.00 12,294 12,372 2026-11-01................................................................................................................................................................................................................................................................................................Owens Corning 7% 0.00 12,280 10,778 2036-12-01Louisville Gas and Electric Company 4.65% 0.00 12,246 11,548 2043-11-15Federal National Mortgage Association 3% 0.00 12,234 12,311 2026-09-01Federal National Mortgage Association 5% 0.00 12,228 11,590 2035-10-01Federal National Mortgage Association 3% 0.00 12,217 12,294 2027-05-01................................................................................................................................................................................................................................................................................................TIME WARNER INC. 4.75% 0.00 12,206 11,848 2021-03-29Government National Mortgage Association 5.5% 0.00 12,192 11,229 2033-09-15Duke University 3.3% 0.00 12,181 13,858 2046-10-01Federal National Mortgage Association 6.5% 0.00 12,176 11,106 2028-08-01Government National Mortgage Association 5.5% 0.00 12,166 11,347 2038-01-15................................................................................................................................................................................................................................................................................................Federal National Mortgage Association 6% 0.00 12,116 11,007 2035-10-01Amazon.com, Inc. 3.8% 0.00 12,086 11,848 2024-12-05Arch Capital Finance LLC 5.03% 0.00 12,067 11,548 2046-12-15Federal National Mortgage Association 5.5% 0.00 12,034 11,728 2021-11-01Government National Mortgage Association 6% 0.00 11,957 10,963 2031-11-20................................................................................................................................................................................................................................................................................................Federal National Mortgage Association 4% 0.00 11,909 11,667 2025-11-01Federal National Mortgage Association 4.5% 0.00 11,892 11,691 2020-11-01Government National Mortgage Association 2.5% 0.00 11,868 12,509 2043-04-20Federal National Mortgage Association 5% 0.00 11,860 11,188 2035-07-01Federal National Mortgage Association 6% 0.00 11,843 10,967 2027-11-01................................................................................................................................................................................................................................................................................................
©2018 Morningstar, Inc., Morningstar Investment Profiles™ 312-696-6000. All rights reserved. The information contained herein: (1) is proprietary to Morningstar and/or its content providers; (2) maynot be copied or distributed and (3) is not warranted to be accurate, complete or timely. Neither Morningstar nor its content providers are responsible for any damages or losses arising from any use ofinformation. Past performance is no guarantee of future performance. Visit our investment website at www.morningstar.com ß
®
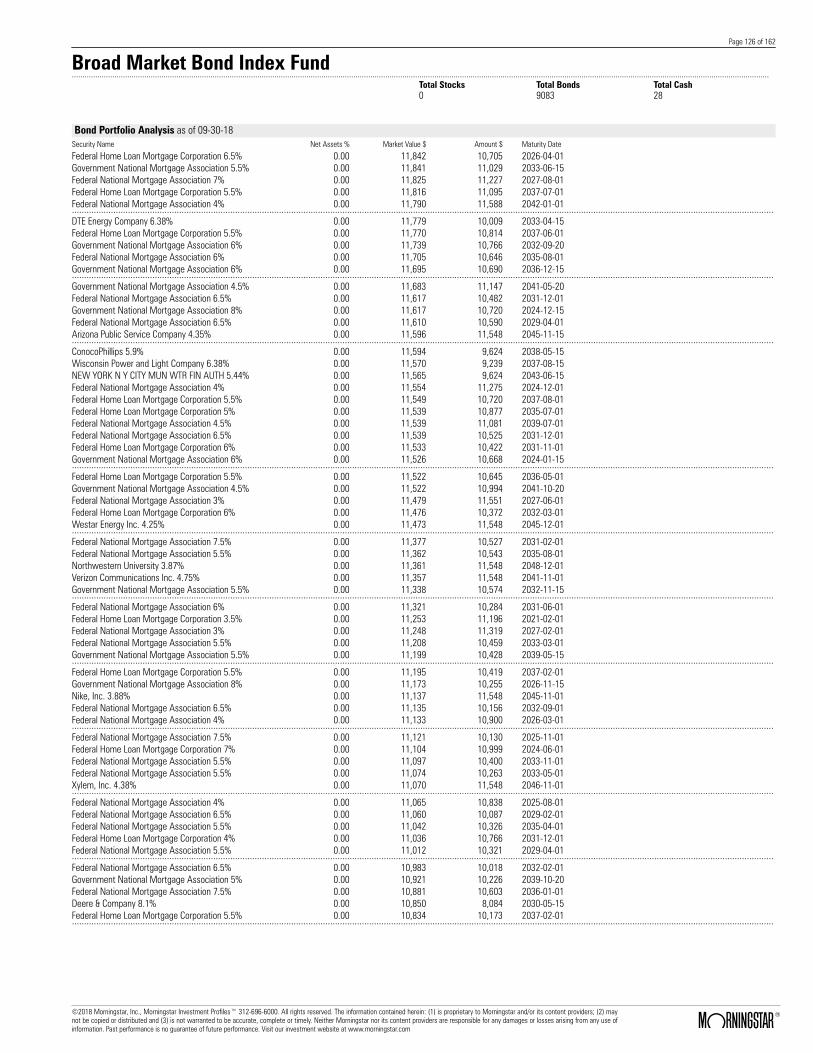
Page 126 of 162
Broad Market Bond Index Fund.......................................................................................................................................................................................................................................................................................................................................
Total Stocks Total Bonds Total Cash0 9083 28
Bond Portfolio Analysis as of 09-30-18Security Name Net Assets % Market Value $ Amount $ Maturity Date
Federal Home Loan Mortgage Corporation 6.5% 0.00 11,842 10,705 2026-04-01Government National Mortgage Association 5.5% 0.00 11,841 11,029 2033-06-15Federal National Mortgage Association 7% 0.00 11,825 11,227 2027-08-01Federal Home Loan Mortgage Corporation 5.5% 0.00 11,816 11,095 2037-07-01Federal National Mortgage Association 4% 0.00 11,790 11,588 2042-01-01................................................................................................................................................................................................................................................................................................DTE Energy Company 6.38% 0.00 11,779 10,009 2033-04-15Federal Home Loan Mortgage Corporation 5.5% 0.00 11,770 10,814 2037-06-01Government National Mortgage Association 6% 0.00 11,739 10,766 2032-09-20Federal National Mortgage Association 6% 0.00 11,705 10,646 2035-08-01Government National Mortgage Association 6% 0.00 11,695 10,690 2036-12-15................................................................................................................................................................................................................................................................................................Government National Mortgage Association 4.5% 0.00 11,683 11,147 2041-05-20Federal National Mortgage Association 6.5% 0.00 11,617 10,482 2031-12-01Government National Mortgage Association 8% 0.00 11,617 10,720 2024-12-15Federal National Mortgage Association 6.5% 0.00 11,610 10,590 2029-04-01Arizona Public Service Company 4.35% 0.00 11,596 11,548 2045-11-15................................................................................................................................................................................................................................................................................................ConocoPhillips 5.9% 0.00 11,594 9,624 2038-05-15Wisconsin Power and Light Company 6.38% 0.00 11,570 9,239 2037-08-15NEW YORK N Y CITY MUN WTR FIN AUTH 5.44% 0.00 11,565 9,624 2043-06-15Federal National Mortgage Association 4% 0.00 11,554 11,275 2024-12-01Federal Home Loan Mortgage Corporation 5.5% 0.00 11,549 10,720 2037-08-01Federal Home Loan Mortgage Corporation 5% 0.00 11,539 10,877 2035-07-01Federal National Mortgage Association 4.5% 0.00 11,539 11,081 2039-07-01Federal National Mortgage Association 6.5% 0.00 11,539 10,525 2031-12-01Federal Home Loan Mortgage Corporation 6% 0.00 11,533 10,422 2031-11-01Government National Mortgage Association 6% 0.00 11,526 10,668 2024-01-15................................................................................................................................................................................................................................................................................................Federal Home Loan Mortgage Corporation 5.5% 0.00 11,522 10,645 2036-05-01Government National Mortgage Association 4.5% 0.00 11,522 10,994 2041-10-20Federal National Mortgage Association 3% 0.00 11,479 11,551 2027-06-01Federal Home Loan Mortgage Corporation 6% 0.00 11,476 10,372 2032-03-01Westar Energy Inc. 4.25% 0.00 11,473 11,548 2045-12-01................................................................................................................................................................................................................................................................................................Federal National Mortgage Association 7.5% 0.00 11,377 10,527 2031-02-01Federal National Mortgage Association 5.5% 0.00 11,362 10,543 2035-08-01Northwestern University 3.87% 0.00 11,361 11,548 2048-12-01Verizon Communications Inc. 4.75% 0.00 11,357 11,548 2041-11-01Government National Mortgage Association 5.5% 0.00 11,338 10,574 2032-11-15................................................................................................................................................................................................................................................................................................Federal National Mortgage Association 6% 0.00 11,321 10,284 2031-06-01Federal Home Loan Mortgage Corporation 3.5% 0.00 11,253 11,196 2021-02-01Federal National Mortgage Association 3% 0.00 11,248 11,319 2027-02-01Federal National Mortgage Association 5.5% 0.00 11,208 10,459 2033-03-01Government National Mortgage Association 5.5% 0.00 11,199 10,428 2039-05-15................................................................................................................................................................................................................................................................................................Federal Home Loan Mortgage Corporation 5.5% 0.00 11,195 10,419 2037-02-01Government National Mortgage Association 8% 0.00 11,173 10,255 2026-11-15Nike, Inc. 3.88% 0.00 11,137 11,548 2045-11-01Federal National Mortgage Association 6.5% 0.00 11,135 10,156 2032-09-01Federal National Mortgage Association 4% 0.00 11,133 10,900 2026-03-01................................................................................................................................................................................................................................................................................................Federal National Mortgage Association 7.5% 0.00 11,121 10,130 2025-11-01Federal Home Loan Mortgage Corporation 7% 0.00 11,104 10,999 2024-06-01Federal National Mortgage Association 5.5% 0.00 11,097 10,400 2033-11-01Federal National Mortgage Association 5.5% 0.00 11,074 10,263 2033-05-01Xylem, Inc. 4.38% 0.00 11,070 11,548 2046-11-01................................................................................................................................................................................................................................................................................................Federal National Mortgage Association 4% 0.00 11,065 10,838 2025-08-01Federal National Mortgage Association 6.5% 0.00 11,060 10,087 2029-02-01Federal National Mortgage Association 5.5% 0.00 11,042 10,326 2035-04-01Federal Home Loan Mortgage Corporation 4% 0.00 11,036 10,766 2031-12-01Federal National Mortgage Association 5.5% 0.00 11,012 10,321 2029-04-01................................................................................................................................................................................................................................................................................................Federal National Mortgage Association 6.5% 0.00 10,983 10,018 2032-02-01Government National Mortgage Association 5% 0.00 10,921 10,226 2039-10-20Federal National Mortgage Association 7.5% 0.00 10,881 10,603 2036-01-01Deere & Company 8.1% 0.00 10,850 8,084 2030-05-15Federal Home Loan Mortgage Corporation 5.5% 0.00 10,834 10,173 2037-02-01................................................................................................................................................................................................................................................................................................
©2018 Morningstar, Inc., Morningstar Investment Profiles™ 312-696-6000. All rights reserved. The information contained herein: (1) is proprietary to Morningstar and/or its content providers; (2) maynot be copied or distributed and (3) is not warranted to be accurate, complete or timely. Neither Morningstar nor its content providers are responsible for any damages or losses arising from any use ofinformation. Past performance is no guarantee of future performance. Visit our investment website at www.morningstar.com ß
®

Page 127 of 162
Broad Market Bond Index Fund.......................................................................................................................................................................................................................................................................................................................................
Total Stocks Total Bonds Total Cash0 9083 28
Bond Portfolio Analysis as of 09-30-18Security Name Net Assets % Market Value $ Amount $ Maturity Date
Federal National Mortgage Association 3.5% 0.00 10,791 10,730 2025-11-01Federal National Mortgage Association 6.5% 0.00 10,787 9,839 2031-03-01VIRGINIA COMWLTH TRANSN BRD 5.35% 0.00 10,763 9,624 2035-05-15Government National Mortgage Association 6% 0.00 10,738 9,938 2028-11-15Federal Home Loan Mortgage Corporation 6.5% 0.00 10,733 9,702 2032-06-01................................................................................................................................................................................................................................................................................................Federal National Mortgage Association 4% 0.00 10,726 10,501 2026-09-01Federal Home Loan Mortgage Corporation 7% 0.00 10,722 10,610 2025-11-01Federal National Mortgage Association 7% 0.00 10,709 10,509 2028-08-01Federal National Mortgage Association 4.5% 0.00 10,700 10,312 2025-05-01Federal National Mortgage Association 6.5% 0.00 10,682 9,693 2030-08-01................................................................................................................................................................................................................................................................................................NEW YORK N Y 5.21% 0.00 10,678 9,624 2031-10-01Government National Mortgage Association 6% 0.00 10,649 9,857 2029-07-15Federal National Mortgage Association 6% 0.00 10,631 9,787 2034-08-01Federal Home Loan Mortgage Corporation 3.5% 0.00 10,615 10,560 2021-07-01Federal National Mortgage Association 5.5% 0.00 10,603 9,872 2036-01-01Pacific Gas and Electric Company 4.25% 0.00 10,590 11,548 2046-03-15Federal National Mortgage Association 7.5% 0.00 10,571 9,467 2029-01-01Federal Home Loan Mortgage Corporation 5% 0.00 10,566 9,956 2034-01-01Federal Home Loan Mortgage Corporation 6.5% 0.00 10,526 9,515 2029-04-01Federal National Mortgage Association 4.5% 0.00 10,519 10,137 2024-07-01................................................................................................................................................................................................................................................................................................Federal Home Loan Mortgage Corporation 6% 0.00 10,515 9,655 2023-11-01Federal National Mortgage Association 5.5% 0.00 10,485 9,741 2033-10-01The Boeing Company 5.88% 0.00 10,470 8,469 2040-02-15Federal National Mortgage Association 5.5% 0.00 10,461 9,694 2037-03-01Ford Credit Auto Owner Trust 2.14% 0.00 10,455 10,592 2022-10-15................................................................................................................................................................................................................................................................................................Federal Home Loan Mortgage Corporation 3.5% 0.00 10,399 10,345 2025-10-01Federal National Mortgage Association 4.5% 0.00 10,382 10,012 2035-10-01Federal National Mortgage Association 5% 0.00 10,338 9,805 2038-05-01Federal National Mortgage Association 5.5% 0.00 10,291 9,644 2032-02-01Federal Home Loan Mortgage Corporation 6.5% 0.00 10,278 9,109 2031-09-01................................................................................................................................................................................................................................................................................................Federal National Mortgage Association 5.5% 0.00 10,273 9,601 2037-02-01Mexico (United Mexican States) 7.5% 0.00 10,246 8,084 2033-04-08Baylor Scott & White Holdings 3.97% 0.00 10,233 10,778 2046-11-15Federal Home Loan Mortgage Corporation 4% 0.00 10,222 10,012 2019-07-01Federal National Mortgage Association 7% 0.00 10,214 9,111 2031-10-01................................................................................................................................................................................................................................................................................................Federal National Mortgage Association 7% 0.00 10,194 8,976 2031-05-01Northrop Grumman Corporation 7.75% 0.00 10,170 7,699 2031-02-15Federal National Mortgage Association 6% 0.00 10,169 9,420 2033-01-01Federal Home Loan Mortgage Corporation 8% 0.00 10,167 9,209 2030-05-01ILLINOIS ST 6.63% 0.00 10,147 9,624 2035-02-01................................................................................................................................................................................................................................................................................................Federal National Mortgage Association 6.5% 0.00 10,135 9,244 2029-04-01Government National Mortgage Association 4.5% 0.00 10,103 9,682 2041-11-15Federal Home Loan Mortgage Corporation 5.5% 0.00 10,077 9,462 2036-09-01Federal Home Loan Mortgage Corporation 6% 0.00 10,062 9,100 2036-03-01Federal Home Loan Mortgage Corporation 7.5% 0.00 10,059 9,271 2031-03-01................................................................................................................................................................................................................................................................................................Government National Mortgage Association 5% 0.00 10,020 9,437 2040-05-15Federal Home Loan Mortgage Corporation 4.5% 0.00 10,012 9,828 2024-03-01Federal Home Loan Mortgage Corporation 3% 0.00 9,966 10,039 2026-01-01Federal National Mortgage Association 8% 0.00 9,959 8,617 2031-11-01Government National Mortgage Association 5.5% 0.00 9,937 9,221 2034-01-15................................................................................................................................................................................................................................................................................................DALLAS TEX CONVENTION CTR HOTEL DEV CORP7.09%
0.00 9,934 7,699 2042-01-01
Federal National Mortgage Association 6% 0.00 9,869 8,973 2029-09-01DALLAS TEX AREA RAPID TRAN 6.25% 0.00 9,833 9,624 2034-12-01Federal National Mortgage Association 5.5% 0.00 9,813 9,091 2034-04-01Government National Mortgage Association 6% 0.00 9,767 9,040 2032-03-15................................................................................................................................................................................................................................................................................................
©2018 Morningstar, Inc., Morningstar Investment Profiles™ 312-696-6000. All rights reserved. The information contained herein: (1) is proprietary to Morningstar and/or its content providers; (2) maynot be copied or distributed and (3) is not warranted to be accurate, complete or timely. Neither Morningstar nor its content providers are responsible for any damages or losses arising from any use ofinformation. Past performance is no guarantee of future performance. Visit our investment website at www.morningstar.com ß
®

Page 128 of 162
Broad Market Bond Index Fund.......................................................................................................................................................................................................................................................................................................................................
Total Stocks Total Bonds Total Cash0 9083 28
Bond Portfolio Analysis as of 09-30-18Security Name Net Assets % Market Value $ Amount $ Maturity Date
Southern California Gas Company 5.75% 0.00 9,744 8,469 2035-11-15Federal National Mortgage Association 5.5% 0.00 9,719 9,096 2033-07-01Federal National Mortgage Association 7% 0.00 9,707 8,858 2036-01-01Massachusetts Institute of Technology 3.96% 0.00 9,670 9,624 2038-07-01Federal Home Loan Mortgage Corporation 5.5% 0.00 9,662 9,473 2021-10-01................................................................................................................................................................................................................................................................................................Federal Home Loan Mortgage Corporation 5.5% 0.00 9,648 8,952 2038-05-01Government National Mortgage Association 6.5% 0.00 9,634 8,571 2031-08-20Consolidated Edison Company of New York, Inc. 6.3% 0.00 9,583 7,699 2037-08-15METROPOLITAN TRANSN AUTH N Y 6.09% 0.00 9,575 7,699 2040-11-15Federal National Mortgage Association 6% 0.00 9,566 9,501 2023-02-01................................................................................................................................................................................................................................................................................................Federal National Mortgage Association 4% 0.00 9,565 9,372 2024-04-01Government National Mortgage Association 6% 0.00 9,564 8,852 2031-04-15Federal National Mortgage Association 5.5% 0.00 9,538 8,801 2035-08-01Federal National Mortgage Association 5.5% 0.00 9,522 8,924 2031-04-01Federal Home Loan Mortgage Corporation 7.5% 0.00 9,508 8,396 2032-11-01Government National Mortgage Association 5% 0.00 9,475 9,094 2035-09-15Federal National Mortgage Association 6% 0.00 9,465 8,768 2035-03-01Government National Mortgage Association 6.5% 0.00 9,461 8,605 2028-05-20Federal Home Loan Mortgage Corporation 6% 0.00 9,432 8,682 2032-04-01Government National Mortgage Association 6.5% 0.00 9,431 8,489 2037-10-15................................................................................................................................................................................................................................................................................................Federal National Mortgage Association 7% 0.00 9,423 8,341 2031-09-01Potomac Electric Power Company 7.9% 0.00 9,417 6,544 2038-12-15Government National Mortgage Association 6.5% 0.00 9,409 8,625 2028-03-20Federal National Mortgage Association 6.5% 0.00 9,400 8,574 2032-01-01Federal National Mortgage Association 6.5% 0.00 9,359 8,537 2029-07-01................................................................................................................................................................................................................................................................................................Federal Home Loan Mortgage Corporation 7% 0.00 9,339 8,458 2029-11-01Government National Mortgage Association 5.5% 0.00 9,328 8,591 2033-06-15Federal National Mortgage Association 5.5% 0.00 9,313 8,729 2031-04-01Federal National Mortgage Association 6.5% 0.00 9,289 8,473 2028-07-01Federal National Mortgage Association 4.5% 0.00 9,275 8,960 2031-12-01................................................................................................................................................................................................................................................................................................Federal Home Loan Mortgage Corporation 6.5% 0.00 9,205 8,320 2029-03-01Federal Home Loan Mortgage Corporation 6.5% 0.00 9,205 8,321 2032-01-01Government National Mortgage Association 6.5% 0.00 9,195 8,381 2033-05-15Government National Mortgage Association 4.5% 0.00 9,190 8,885 2039-01-15Federal National Mortgage Association 8% 0.00 9,186 8,378 2030-08-01................................................................................................................................................................................................................................................................................................Federal National Mortgage Association 7.5% 0.00 9,153 8,359 2031-09-01Government National Mortgage Association 3% 0.00 9,152 9,217 2021-11-20Federal National Mortgage Association 6.5% 0.00 9,133 8,330 2031-05-01Federal National Mortgage Association 5% 0.00 9,125 8,660 2035-07-01Government National Mortgage Association 5% 0.00 9,116 8,581 2033-07-15................................................................................................................................................................................................................................................................................................Government National Mortgage Association 4.5% 0.00 9,083 8,665 2041-04-20Federal National Mortgage Association 6% 0.00 9,048 8,382 2027-11-01Federal National Mortgage Association 5.5% 0.00 9,035 8,387 2036-11-01Federal Home Loan Mortgage Corporation 5.5% 0.00 9,009 8,355 2038-09-01Government National Mortgage Association 9% 0.00 8,996 8,877 2025-01-15................................................................................................................................................................................................................................................................................................Tampa Electric Company 4.35% 0.00 8,990 9,239 2044-05-15Federal National Mortgage Association 5.5% 0.00 8,975 8,317 2034-08-01Federal National Mortgage Association 6% 0.00 8,958 8,298 2031-03-01Federal Home Loan Mortgage Corporation 3.5% 0.00 8,954 8,908 2021-01-01Government National Mortgage Association 4.5% 0.00 8,934 8,638 2036-05-15................................................................................................................................................................................................................................................................................................William Marsh Rice University 3.77% 0.00 8,926 9,624 2055-05-15Federal National Mortgage Association 6.5% 0.00 8,909 8,126 2028-06-01Methanex Corporation 5.65% 0.00 8,898 9,239 2044-12-01Federal National Mortgage Association 7% 0.00 8,879 8,424 2028-06-01CSX Corporation 4.5% 0.00 8,872 9,239 2054-08-01................................................................................................................................................................................................................................................................................................Federal National Mortgage Association 5.5% 0.00 8,866 8,309 2034-07-01Federal National Mortgage Association 7% 0.00 8,858 8,378 2027-10-01Federal National Mortgage Association 5.5% 0.00 8,855 8,225 2037-06-01Federal Home Loan Mortgage Corporation 5.5% 0.00 8,843 8,304 2037-05-01Federal National Mortgage Association 6.5% 0.00 8,838 8,062 2033-06-01................................................................................................................................................................................................................................................................................................
©2018 Morningstar, Inc., Morningstar Investment Profiles™ 312-696-6000. All rights reserved. The information contained herein: (1) is proprietary to Morningstar and/or its content providers; (2) maynot be copied or distributed and (3) is not warranted to be accurate, complete or timely. Neither Morningstar nor its content providers are responsible for any damages or losses arising from any use ofinformation. Past performance is no guarantee of future performance. Visit our investment website at www.morningstar.com ß
®

Page 129 of 162
Broad Market Bond Index Fund.......................................................................................................................................................................................................................................................................................................................................
Total Stocks Total Bonds Total Cash0 9083 28
Bond Portfolio Analysis as of 09-30-18Security Name Net Assets % Market Value $ Amount $ Maturity Date
Transcontinental Gas Pipe Line Company, LLC 4.45% 0.00 8,829 9,239 2042-08-01Federal Home Loan Mortgage Corporation 4.5% 0.00 8,818 8,710 2019-05-01Federal Home Loan Mortgage Corporation 6.5% 0.00 8,796 7,951 2028-05-01Federal National Mortgage Association 5.5% 0.00 8,794 8,242 2034-07-01Government National Mortgage Association 6% 0.00 8,773 8,120 2036-08-15................................................................................................................................................................................................................................................................................................QVC, Inc. 5.95% 0.00 8,725 9,624 2043-03-15Federal Home Loan Mortgage Corporation 6% 0.00 8,665 8,548 2020-12-01Government National Mortgage Association 5.5% 0.00 8,654 7,988 2039-03-15Federal National Mortgage Association 6.5% 0.00 8,643 7,883 2028-12-01Federal National Mortgage Association 5% 0.00 8,612 8,111 2033-07-01Federal National Mortgage Association 7% 0.00 8,608 7,783 2029-02-01Federal National Mortgage Association 6% 0.00 8,607 7,834 2036-09-01Federal National Mortgage Association 6.5% 0.00 8,596 7,841 2029-08-01Federal National Mortgage Association 6.5% 0.00 8,593 7,838 2032-10-01Federal National Mortgage Association 5.5% 0.00 8,583 8,045 2029-02-01................................................................................................................................................................................................................................................................................................Northern States Power Company 5.25% 0.00 8,571 7,699 2035-07-15Federal National Mortgage Association 6% 0.00 8,570 7,807 2036-10-01Government National Mortgage Association 6% 0.00 8,531 7,896 2029-02-15Federal Home Loan Mortgage Corporation 6.5% 0.00 8,520 7,702 2028-12-01Federal Home Loan Mortgage Corporation 6% 0.00 8,515 7,777 2028-11-01................................................................................................................................................................................................................................................................................................Federal Home Loan Mortgage Corporation 7% 0.00 8,498 7,672 2029-05-01Federal National Mortgage Association 7% 0.00 8,432 7,831 2030-09-01Government National Mortgage Association 6.5% 0.00 8,421 7,572 2038-12-15Federal Home Loan Mortgage Corporation 3.5% 0.00 8,410 8,367 2021-04-01Federal National Mortgage Association 6% 0.00 8,389 7,698 2035-10-01................................................................................................................................................................................................................................................................................................Federal National Mortgage Association 5.5% 0.00 8,361 7,745 2033-06-01Federal National Mortgage Association 6.5% 0.00 8,310 7,580 2030-10-01Federal Home Loan Mortgage Corporation 4.5% 0.00 8,291 8,016 2025-06-01Federal National Mortgage Association 6.5% 0.00 8,290 7,562 2031-09-01UNIVERSITY TEX PERM UNIV FD 5.26% 0.00 8,285 6,929 2039-07-01................................................................................................................................................................................................................................................................................................Federal National Mortgage Association 6.5% 0.00 8,281 7,554 2031-10-01Federal National Mortgage Association 5.5% 0.00 8,280 7,731 2033-07-01Federal Home Loan Mortgage Corporation 8% 0.00 8,273 7,688 2027-08-01Federal Home Loan Mortgage Corporation 7% 0.00 8,249 7,569 2030-02-01Federal National Mortgage Association 6% 0.00 8,231 8,109 2021-08-01................................................................................................................................................................................................................................................................................................Government National Mortgage Association 6% 0.00 8,228 7,616 2036-02-15Government National Mortgage Association 6% 0.00 8,216 7,526 2032-02-15Federal National Mortgage Association 5.5% 0.00 8,169 7,574 2035-05-01Hershey Co (The) 3.38% 0.00 8,133 9,239 2046-08-15Federal National Mortgage Association 5.5% 0.00 8,126 7,555 2032-01-01................................................................................................................................................................................................................................................................................................Government National Mortgage Association 6% 0.00 8,105 7,421 2033-11-20Federal National Mortgage Association 6.5% 0.00 8,060 7,351 2032-08-01Federal Home Loan Mortgage Corporation 6% 0.00 8,057 7,416 2029-06-01Federal National Mortgage Association 6.5% 0.00 8,027 7,321 2033-12-01Federal National Mortgage Association 7% 0.00 7,992 7,271 2032-01-01................................................................................................................................................................................................................................................................................................Federal National Mortgage Association 6% 0.00 7,974 7,387 2029-04-01Federal National Mortgage Association 4% 0.00 7,973 7,809 2026-12-01Federal National Mortgage Association 6.5% 0.00 7,952 7,253 2028-10-01Federal Home Loan Mortgage Corporation 6% 0.00 7,939 7,307 2028-12-01Government National Mortgage Association 6% 0.00 7,935 7,261 2032-10-15................................................................................................................................................................................................................................................................................................Government National Mortgage Association 6.5% 0.00 7,889 7,190 2034-08-15Government National Mortgage Association 6% 0.00 7,886 7,299 2028-10-15Federal Home Loan Mortgage Corporation 3% 0.00 7,865 7,977 2021-11-01Federal Home Loan Mortgage Corporation 5.5% 0.00 7,860 7,378 2035-05-01Federal Home Loan Mortgage Corporation 3% 0.00 7,842 7,900 2025-12-01................................................................................................................................................................................................................................................................................................Enterprise Products Operating LP 5.7% 0.00 7,838 6,929 2042-02-15Federal National Mortgage Association 4.5% 0.00 7,838 7,568 2031-11-01Federal National Mortgage Association 6% 0.00 7,834 7,134 2036-04-01Progress Energy, Inc. 6% 0.00 7,824 6,544 2039-12-01Federal Home Loan Mortgage Corporation 3.5% 0.00 7,807 7,767 2027-08-01................................................................................................................................................................................................................................................................................................
©2018 Morningstar, Inc., Morningstar Investment Profiles™ 312-696-6000. All rights reserved. The information contained herein: (1) is proprietary to Morningstar and/or its content providers; (2) maynot be copied or distributed and (3) is not warranted to be accurate, complete or timely. Neither Morningstar nor its content providers are responsible for any damages or losses arising from any use ofinformation. Past performance is no guarantee of future performance. Visit our investment website at www.morningstar.com ß
®

Page 130 of 162
Broad Market Bond Index Fund.......................................................................................................................................................................................................................................................................................................................................
Total Stocks Total Bonds Total Cash0 9083 28
Bond Portfolio Analysis as of 09-30-18Security Name Net Assets % Market Value $ Amount $ Maturity Date
Federal National Mortgage Association 5.5% 0.00 7,805 7,271 2038-08-01Federal National Mortgage Association 5.5% 0.00 7,799 7,294 2033-08-01Federal National Mortgage Association 7.5% 0.00 7,787 7,395 2027-11-01Federal National Mortgage Association 4.5% 0.00 7,777 7,496 2036-01-01Federal National Mortgage Association 7% 0.00 7,737 7,474 2036-10-01Federal National Mortgage Association 6.5% 0.00 7,728 7,048 2036-09-01Lockheed Martin Corporation 5.72% 0.00 7,679 6,544 2040-06-01Federal Home Loan Mortgage Corporation 5.5% 0.00 7,671 7,509 2022-11-01Government National Mortgage Association 6% 0.00 7,659 7,089 2023-12-15Federal National Mortgage Association 6.5% 0.00 7,648 6,976 2031-05-01................................................................................................................................................................................................................................................................................................Federal National Mortgage Association 6.5% 0.00 7,614 6,945 2028-04-01Federal Home Loan Mortgage Corporation 7.5% 0.00 7,610 7,494 2024-08-01Federal National Mortgage Association 7.5% 0.00 7,599 6,888 2031-05-01Federal Home Loan Mortgage Corporation 3.5% 0.00 7,591 7,552 2021-03-01Federal National Mortgage Association 6% 0.00 7,582 6,900 2031-06-01................................................................................................................................................................................................................................................................................................Federal National Mortgage Association 7% 0.00 7,572 6,815 2032-03-01Government National Mortgage Association 6% 0.00 7,548 6,908 2033-04-15Federal National Mortgage Association 6.5% 0.00 7,540 6,878 2028-10-01Federal Home Loan Mortgage Corporation 5.5% 0.00 7,526 7,064 2036-08-01Federal National Mortgage Association 4.5% 0.00 7,506 7,239 2033-09-01................................................................................................................................................................................................................................................................................................Government National Mortgage Association 6.5% 0.00 7,506 6,633 2031-03-20Federal Home Loan Mortgage Corporation 5% 0.00 7,411 7,009 2033-10-01Federal Home Loan Mortgage Corporation 6% 0.00 7,385 6,797 2032-06-01Federal National Mortgage Association 7% 0.00 7,346 6,854 2025-09-01Federal National Mortgage Association 6.5% 0.00 7,270 6,631 2031-12-01................................................................................................................................................................................................................................................................................................Federal National Mortgage Association 5% 0.00 7,262 7,049 2020-09-01Federal National Mortgage Association 6% 0.00 7,261 6,596 2037-08-01Government National Mortgage Association 6% 0.00 7,250 6,586 2036-01-15Government National Mortgage Association 6% 0.00 7,237 6,628 2034-10-20Government National Mortgage Association 6% 0.00 7,236 6,698 2034-08-15................................................................................................................................................................................................................................................................................................Albemarle Corp 5.45% 0.00 7,233 6,929 2044-12-01Federal National Mortgage Association 6.5% 0.00 7,220 6,586 2031-09-01Federal National Mortgage Association 7.5% 0.00 7,215 6,604 2027-06-01Federal National Mortgage Association 7.5% 0.00 7,193 6,854 2028-05-01Federal National Mortgage Association 5.5% 0.00 7,179 6,666 2032-01-01................................................................................................................................................................................................................................................................................................Federal National Mortgage Association 6% 0.00 7,178 6,647 2032-06-01Government National Mortgage Association 6% 0.00 7,138 6,536 2036-11-20Government National Mortgage Association 4.5% 0.00 7,127 6,891 2035-08-15Federal Home Loan Mortgage Corporation 6.5% 0.00 7,071 6,392 2028-12-01Federal Home Loan Mortgage Corporation 4.5% 0.00 7,059 6,967 2022-08-01................................................................................................................................................................................................................................................................................................Federal Home Loan Mortgage Corporation 6.5% 0.00 7,059 6,381 2023-10-01Federal National Mortgage Association 7% 0.00 7,058 6,645 2031-01-01Federal Home Loan Mortgage Corporation 6.5% 0.00 7,047 6,370 2029-09-01Federal National Mortgage Association 5.5% 0.00 7,040 6,529 2033-03-01Federal National Mortgage Association 4.5% 0.00 7,026 6,770 2034-09-01................................................................................................................................................................................................................................................................................................Federal National Mortgage Association 5.5% 0.00 6,992 6,439 2033-03-01Federal Home Loan Mortgage Corporation 6% 0.00 6,972 6,307 2031-12-01Federal National Mortgage Association 5% 0.00 6,958 6,556 2034-06-01Federal National Mortgage Association 4.5% 0.00 6,945 6,858 2020-01-01Federal National Mortgage Association 7% 0.00 6,920 6,290 2029-09-01................................................................................................................................................................................................................................................................................................Federal Home Loan Mortgage Corporation 7% 0.00 6,918 6,187 2031-10-01Federal Home Loan Mortgage Corporation 6.5% 0.00 6,904 6,241 2026-04-01Federal Home Loan Mortgage Corporation 6% 0.00 6,895 6,347 2032-01-01Federal Home Loan Mortgage Corporation 4.5% 0.00 6,886 6,801 2019-05-01Government National Mortgage Association 5.5% 0.00 6,877 6,403 2038-06-15................................................................................................................................................................................................................................................................................................Federal Home Loan Mortgage Corporation 7% 0.00 6,876 6,211 2028-08-01Federal Home Loan Mortgage Corporation 5.5% 0.00 6,873 6,402 2035-06-01Federal National Mortgage Association 5.5% 0.00 6,873 6,375 2034-09-01Federal National Mortgage Association 6.5% 0.00 6,860 6,257 2033-12-01Federal National Mortgage Association 7.5% 0.00 6,834 6,408 2027-09-01
©2018 Morningstar, Inc., Morningstar Investment Profiles™ 312-696-6000. All rights reserved. The information contained herein: (1) is proprietary to Morningstar and/or its content providers; (2) maynot be copied or distributed and (3) is not warranted to be accurate, complete or timely. Neither Morningstar nor its content providers are responsible for any damages or losses arising from any use ofinformation. Past performance is no guarantee of future performance. Visit our investment website at www.morningstar.com ß
®
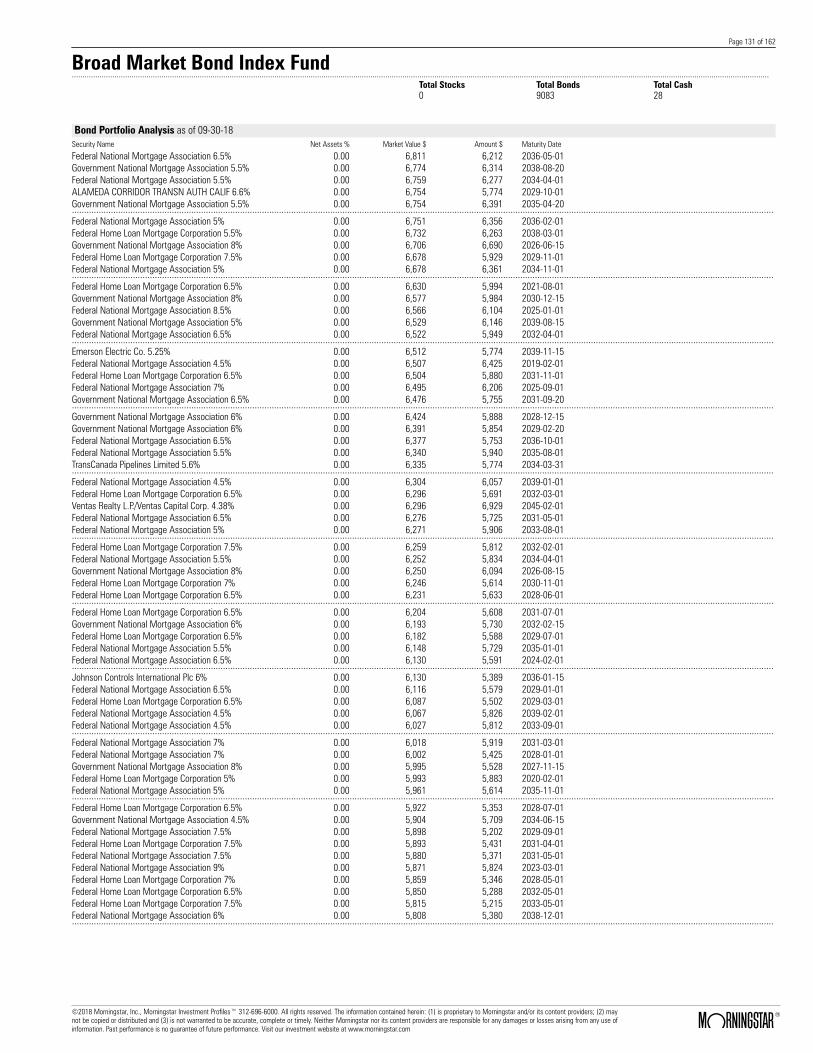
Page 131 of 162
Broad Market Bond Index Fund.......................................................................................................................................................................................................................................................................................................................................
Total Stocks Total Bonds Total Cash0 9083 28
Bond Portfolio Analysis as of 09-30-18Security Name Net Assets % Market Value $ Amount $ Maturity Date
Federal National Mortgage Association 6.5% 0.00 6,811 6,212 2036-05-01Government National Mortgage Association 5.5% 0.00 6,774 6,314 2038-08-20Federal National Mortgage Association 5.5% 0.00 6,759 6,277 2034-04-01ALAMEDA CORRIDOR TRANSN AUTH CALIF 6.6% 0.00 6,754 5,774 2029-10-01Government National Mortgage Association 5.5% 0.00 6,754 6,391 2035-04-20................................................................................................................................................................................................................................................................................................Federal National Mortgage Association 5% 0.00 6,751 6,356 2036-02-01Federal Home Loan Mortgage Corporation 5.5% 0.00 6,732 6,263 2038-03-01Government National Mortgage Association 8% 0.00 6,706 6,690 2026-06-15Federal Home Loan Mortgage Corporation 7.5% 0.00 6,678 5,929 2029-11-01Federal National Mortgage Association 5% 0.00 6,678 6,361 2034-11-01................................................................................................................................................................................................................................................................................................Federal Home Loan Mortgage Corporation 6.5% 0.00 6,630 5,994 2021-08-01Government National Mortgage Association 8% 0.00 6,577 5,984 2030-12-15Federal National Mortgage Association 8.5% 0.00 6,566 6,104 2025-01-01Government National Mortgage Association 5% 0.00 6,529 6,146 2039-08-15Federal National Mortgage Association 6.5% 0.00 6,522 5,949 2032-04-01................................................................................................................................................................................................................................................................................................Emerson Electric Co. 5.25% 0.00 6,512 5,774 2039-11-15Federal National Mortgage Association 4.5% 0.00 6,507 6,425 2019-02-01Federal Home Loan Mortgage Corporation 6.5% 0.00 6,504 5,880 2031-11-01Federal National Mortgage Association 7% 0.00 6,495 6,206 2025-09-01Government National Mortgage Association 6.5% 0.00 6,476 5,755 2031-09-20................................................................................................................................................................................................................................................................................................Government National Mortgage Association 6% 0.00 6,424 5,888 2028-12-15Government National Mortgage Association 6% 0.00 6,391 5,854 2029-02-20Federal National Mortgage Association 6.5% 0.00 6,377 5,753 2036-10-01Federal National Mortgage Association 5.5% 0.00 6,340 5,940 2035-08-01TransCanada Pipelines Limited 5.6% 0.00 6,335 5,774 2034-03-31................................................................................................................................................................................................................................................................................................Federal National Mortgage Association 4.5% 0.00 6,304 6,057 2039-01-01Federal Home Loan Mortgage Corporation 6.5% 0.00 6,296 5,691 2032-03-01Ventas Realty L.P./Ventas Capital Corp. 4.38% 0.00 6,296 6,929 2045-02-01Federal National Mortgage Association 6.5% 0.00 6,276 5,725 2031-05-01Federal National Mortgage Association 5% 0.00 6,271 5,906 2033-08-01................................................................................................................................................................................................................................................................................................Federal Home Loan Mortgage Corporation 7.5% 0.00 6,259 5,812 2032-02-01Federal National Mortgage Association 5.5% 0.00 6,252 5,834 2034-04-01Government National Mortgage Association 8% 0.00 6,250 6,094 2026-08-15Federal Home Loan Mortgage Corporation 7% 0.00 6,246 5,614 2030-11-01Federal Home Loan Mortgage Corporation 6.5% 0.00 6,231 5,633 2028-06-01................................................................................................................................................................................................................................................................................................Federal Home Loan Mortgage Corporation 6.5% 0.00 6,204 5,608 2031-07-01Government National Mortgage Association 6% 0.00 6,193 5,730 2032-02-15Federal Home Loan Mortgage Corporation 6.5% 0.00 6,182 5,588 2029-07-01Federal National Mortgage Association 5.5% 0.00 6,148 5,729 2035-01-01Federal National Mortgage Association 6.5% 0.00 6,130 5,591 2024-02-01................................................................................................................................................................................................................................................................................................Johnson Controls International Plc 6% 0.00 6,130 5,389 2036-01-15Federal National Mortgage Association 6.5% 0.00 6,116 5,579 2029-01-01Federal Home Loan Mortgage Corporation 6.5% 0.00 6,087 5,502 2029-03-01Federal National Mortgage Association 4.5% 0.00 6,067 5,826 2039-02-01Federal National Mortgage Association 4.5% 0.00 6,027 5,812 2033-09-01................................................................................................................................................................................................................................................................................................Federal National Mortgage Association 7% 0.00 6,018 5,919 2031-03-01Federal National Mortgage Association 7% 0.00 6,002 5,425 2028-01-01Government National Mortgage Association 8% 0.00 5,995 5,528 2027-11-15Federal Home Loan Mortgage Corporation 5% 0.00 5,993 5,883 2020-02-01Federal National Mortgage Association 5% 0.00 5,961 5,614 2035-11-01................................................................................................................................................................................................................................................................................................Federal Home Loan Mortgage Corporation 6.5% 0.00 5,922 5,353 2028-07-01Government National Mortgage Association 4.5% 0.00 5,904 5,709 2034-06-15Federal National Mortgage Association 7.5% 0.00 5,898 5,202 2029-09-01Federal Home Loan Mortgage Corporation 7.5% 0.00 5,893 5,431 2031-04-01Federal National Mortgage Association 7.5% 0.00 5,880 5,371 2031-05-01Federal National Mortgage Association 9% 0.00 5,871 5,824 2023-03-01Federal Home Loan Mortgage Corporation 7% 0.00 5,859 5,346 2028-05-01Federal Home Loan Mortgage Corporation 6.5% 0.00 5,850 5,288 2032-05-01Federal Home Loan Mortgage Corporation 7.5% 0.00 5,815 5,215 2033-05-01Federal National Mortgage Association 6% 0.00 5,808 5,380 2038-12-01................................................................................................................................................................................................................................................................................................
©2018 Morningstar, Inc., Morningstar Investment Profiles™ 312-696-6000. All rights reserved. The information contained herein: (1) is proprietary to Morningstar and/or its content providers; (2) maynot be copied or distributed and (3) is not warranted to be accurate, complete or timely. Neither Morningstar nor its content providers are responsible for any damages or losses arising from any use ofinformation. Past performance is no guarantee of future performance. Visit our investment website at www.morningstar.com ß
®

Page 132 of 162
Broad Market Bond Index Fund.......................................................................................................................................................................................................................................................................................................................................
Total Stocks Total Bonds Total Cash0 9083 28
Bond Portfolio Analysis as of 09-30-18Security Name Net Assets % Market Value $ Amount $ Maturity Date
Government National Mortgage Association 6% 0.00 5,802 5,370 2033-08-15Federal Home Loan Mortgage Corporation 6.5% 0.00 5,800 5,243 2028-09-01Federal National Mortgage Association 8% 0.00 5,798 5,428 2028-02-01Federal Home Loan Mortgage Corporation 5.5% 0.00 5,797 5,355 2033-03-01Commercial Mortgage Trust 2.97% 0.00 5,793 5,882 2046-08-10................................................................................................................................................................................................................................................................................................Federal Home Loan Mortgage Corporation 7% 0.00 5,785 5,592 2023-06-01Government National Mortgage Association 5% 0.00 5,780 5,443 2034-11-15Pacific Gas and Electric Company 5.4% 0.00 5,755 5,389 2040-01-15Federal National Mortgage Association 5.5% 0.00 5,751 5,390 2032-01-01Federal Home Loan Mortgage Corporation 6.5% 0.00 5,750 5,197 2031-03-01................................................................................................................................................................................................................................................................................................Government National Mortgage Association 6% 0.00 5,743 5,315 2029-04-15Federal National Mortgage Association 6% 0.00 5,716 5,295 2031-01-01Federal National Mortgage Association 7% 0.00 5,716 5,074 2029-12-01Federal Home Loan Mortgage Corporation 7.5% 0.00 5,699 5,645 2024-05-01Federal National Mortgage Association 8% 0.00 5,673 5,362 2030-10-01................................................................................................................................................................................................................................................................................................Federal National Mortgage Association 5.5% 0.00 5,663 5,251 2036-01-01Federal Home Loan Mortgage Corporation 7% 0.00 5,653 5,645 2024-06-01Federal National Mortgage Association 7.5% 0.00 5,651 5,399 2032-10-01Federal National Mortgage Association 6.5% 0.00 5,646 5,054 2037-12-01Government National Mortgage Association 5% 0.00 5,603 5,275 2038-07-15................................................................................................................................................................................................................................................................................................Federal National Mortgage Association 7.5% 0.00 5,602 5,312 2024-06-01Government National Mortgage Association 6% 0.00 5,577 5,162 2038-12-15Federal National Mortgage Association 5.5% 0.00 5,560 5,172 2038-01-01Federal National Mortgage Association 7.5% 0.00 5,558 5,479 2023-07-01Federal National Mortgage Association 6.5% 0.00 5,552 5,064 2024-10-01................................................................................................................................................................................................................................................................................................Federal National Mortgage Association 7% 0.00 5,537 5,398 2030-01-01Federal National Mortgage Association 6.5% 0.00 5,514 5,029 2023-11-01Federal Home Loan Mortgage Corporation 6% 0.00 5,481 5,024 2028-10-01Federal National Mortgage Association 6.5% 0.00 5,436 4,958 2032-10-01Federal National Mortgage Association 7% 0.00 5,433 4,782 2031-04-01................................................................................................................................................................................................................................................................................................Federal Home Loan Mortgage Corporation 5% 0.00 5,400 5,254 2022-03-01United Parcel Service, Inc. 4.88% 0.00 5,397 5,004 2040-11-15Federal National Mortgage Association 7% 0.00 5,390 5,363 2028-03-01Federal National Mortgage Association 7.5% 0.00 5,380 4,871 2031-07-01Government National Mortgage Association 7.5% 0.00 5,368 4,939 2028-02-20................................................................................................................................................................................................................................................................................................Government National Mortgage Association 6% 0.00 5,347 4,903 2032-10-20Federal National Mortgage Association 6.5% 0.00 5,342 4,872 2032-05-01Federal National Mortgage Association 6.5% 0.00 5,336 4,867 2029-06-01Federal National Mortgage Association 7% 0.00 5,330 4,744 2032-03-01Federal National Mortgage Association 5.5% 0.00 5,324 5,241 2024-06-01................................................................................................................................................................................................................................................................................................Federal Home Loan Mortgage Corporation 6.5% 0.00 5,323 4,811 2029-04-01Federal Home Loan Mortgage Corporation 5.5% 0.00 5,311 5,204 2021-07-01Federal Home Loan Mortgage Corporation 6.5% 0.00 5,280 4,772 2037-12-01Federal National Mortgage Association 7% 0.00 5,273 4,933 2024-01-01Federal National Mortgage Association 7.5% 0.00 5,267 4,969 2026-09-01................................................................................................................................................................................................................................................................................................Federal National Mortgage Association 7.5% 0.00 5,267 5,191 2030-01-01Government National Mortgage Association 6.5% 0.00 5,250 4,649 2032-05-20Federal Home Loan Mortgage Corporation 4.5% 0.00 5,244 5,180 2019-01-01Federal National Mortgage Association 6.5% 0.00 5,230 4,771 2022-01-01Federal Home Loan Mortgage Corporation 7% 0.00 5,229 5,165 2023-09-01Federal National Mortgage Association 7% 0.00 5,214 4,729 2031-06-01Government National Mortgage Association 4.5% 0.00 5,212 5,030 2034-01-15Federal National Mortgage Association 6% 0.00 5,181 4,799 2023-09-01Federal National Mortgage Association 6% 0.00 5,180 4,798 2028-12-01Federal Home Loan Mortgage Corporation 6% 0.00 5,172 4,678 2029-06-01................................................................................................................................................................................................................................................................................................Federal National Mortgage Association 6% 0.00 5,139 4,758 2031-04-01Federal National Mortgage Association 7% 0.00 5,131 4,848 2027-04-01Federal National Mortgage Association 7% 0.00 5,127 4,651 2038-03-01Federal National Mortgage Association 5.5% 0.00 5,126 4,751 2037-02-01Federal Home Loan Mortgage Corporation 6% 0.00 5,117 4,671 2029-04-01................................................................................................................................................................................................................................................................................................
©2018 Morningstar, Inc., Morningstar Investment Profiles™ 312-696-6000. All rights reserved. The information contained herein: (1) is proprietary to Morningstar and/or its content providers; (2) maynot be copied or distributed and (3) is not warranted to be accurate, complete or timely. Neither Morningstar nor its content providers are responsible for any damages or losses arising from any use ofinformation. Past performance is no guarantee of future performance. Visit our investment website at www.morningstar.com ß
®

Page 133 of 162
Broad Market Bond Index Fund.......................................................................................................................................................................................................................................................................................................................................
Total Stocks Total Bonds Total Cash0 9083 28
Bond Portfolio Analysis as of 09-30-18Security Name Net Assets % Market Value $ Amount $ Maturity Date
Federal National Mortgage Association 6.5% 0.00 5,113 4,664 2029-08-01Federal National Mortgage Association 5.5% 0.00 5,103 4,728 2034-04-01Federal National Mortgage Association 4.5% 0.00 5,092 5,028 2020-11-01Federal National Mortgage Association 6% 0.00 5,083 5,019 2021-09-01Government National Mortgage Association 6.5% 0.00 5,075 4,625 2037-01-15................................................................................................................................................................................................................................................................................................Federal National Mortgage Association 6.5% 0.00 5,071 4,607 2036-03-01Federal Home Loan Mortgage Corporation 6.5% 0.00 5,069 4,582 2028-04-01Federal National Mortgage Association 6.5% 0.00 5,053 4,609 2027-11-01Federal National Mortgage Association 6.5% 0.00 5,052 4,608 2031-12-01Federal Home Loan Mortgage Corporation 3% 0.00 5,050 5,101 2026-03-01................................................................................................................................................................................................................................................................................................Federal National Mortgage Association 7.5% 0.00 5,048 4,625 2029-11-01Federal National Mortgage Association 8% 0.00 5,046 4,549 2030-12-01Federal Home Loan Mortgage Corporation 5.5% 0.00 5,030 4,722 2033-02-01Federal Home Loan Mortgage Corporation 5% 0.00 5,015 4,776 2036-07-01Government National Mortgage Association 6.5% 0.00 5,007 4,531 2028-10-20................................................................................................................................................................................................................................................................................................Federal Home Loan Mortgage Corporation 7% 0.00 5,005 4,848 2029-06-01Federal Home Loan Mortgage Corporation 6.5% 0.00 4,995 4,515 2026-05-01Federal National Mortgage Association 6.5% 0.00 4,983 4,545 2029-08-01Federal Home Loan Mortgage Corporation 7% 0.00 4,982 4,489 2030-12-01The Hartford Financial Services Group, Inc. 6.1% 0.00 4,966 4,234 2041-10-01................................................................................................................................................................................................................................................................................................Government National Mortgage Association 6% 0.00 4,962 4,592 2032-04-15Southwestern Public Service Company 6% 0.00 4,948 4,234 2036-10-01Federal Home Loan Mortgage Corporation 6.5% 0.00 4,939 4,465 2029-06-01Dominion Energy Inc 6.3% 0.00 4,914 4,234 2033-03-15Federal Home Loan Mortgage Corporation 6.5% 0.00 4,914 4,397 2032-01-01................................................................................................................................................................................................................................................................................................Federal Home Loan Mortgage Corporation 6% 0.00 4,911 4,442 2032-01-01Federal National Mortgage Association 6% 0.00 4,897 4,511 2032-01-01Federal Home Loan Mortgage Corporation 7% 0.00 4,855 4,408 2028-07-01Federal National Mortgage Association 6.5% 0.00 4,855 4,429 2027-12-01Public Service Electric and Gas Company 5.38% 0.00 4,848 4,234 2039-11-01................................................................................................................................................................................................................................................................................................Federal Home Loan Mortgage Corporation 5.5% 0.00 4,842 4,798 2020-07-01Northern States Power Company 6.2% 0.00 4,842 3,849 2037-07-01Federal Home Loan Mortgage Corporation 5% 0.00 4,829 4,751 2020-02-01Federal Home Loan Mortgage Corporation 6% 0.00 4,827 4,366 2032-07-01Wisconsin Electric Power Company 5.62% 0.00 4,824 4,234 2033-05-15................................................................................................................................................................................................................................................................................................Government National Mortgage Association 8% 0.00 4,821 4,353 2029-12-15Federal Home Loan Mortgage Corporation 8% 0.00 4,777 4,275 2027-06-01Federal Home Loan Mortgage Corporation 5.5% 0.00 4,772 4,690 2021-04-01Federal Home Loan Mortgage Corporation 5.5% 0.00 4,771 4,441 2031-12-01Canadian Pacific Railway Company 5.75% 0.00 4,769 4,234 2033-03-15................................................................................................................................................................................................................................................................................................Federal National Mortgage Association 7% 0.00 4,765 4,609 2029-08-01Federal National Mortgage Association 5.5% 0.00 4,735 4,395 2033-01-01Government National Mortgage Association 6.5% 0.00 4,722 4,359 2026-04-20Federal National Mortgage Association 6.5% 0.00 4,691 4,279 2032-03-01Government National Mortgage Association 8% 0.00 4,684 4,246 2027-06-20Government National Mortgage Association 6% 0.00 4,682 4,254 2032-01-20Enterprise Products Operating LP 6.65% 0.00 4,674 3,849 2034-10-15Federal Home Loan Mortgage Corporation 7.5% 0.00 4,670 4,197 2027-09-01Federal Home Loan Mortgage Corporation 6% 0.00 4,664 4,293 2023-10-01Dover Corporation 5.38% 0.00 4,656 4,234 2035-10-15................................................................................................................................................................................................................................................................................................Government National Mortgage Association 4.5% 0.00 4,647 4,494 2033-07-15Federal Home Loan Mortgage Corporation 6.5% 0.00 4,644 4,198 2032-01-01Federal National Mortgage Association 6% 0.00 4,644 4,301 2029-01-01Government National Mortgage Association 6% 0.00 4,642 4,297 2028-07-15Federal National Mortgage Association 5% 0.00 4,632 4,367 2036-06-01................................................................................................................................................................................................................................................................................................Federal Home Loan Mortgage Corporation 4.5% 0.00 4,613 4,556 2019-06-01Government National Mortgage Association 8% 0.00 4,611 4,295 2026-07-15Government National Mortgage Association 7.5% 0.00 4,593 4,262 2026-02-20Federal Home Loan Mortgage Corporation 7% 0.00 4,590 4,346 2028-01-01Federal Home Loan Mortgage Corporation 8.5% 0.00 4,585 4,234 2026-07-01................................................................................................................................................................................................................................................................................................
©2018 Morningstar, Inc., Morningstar Investment Profiles™ 312-696-6000. All rights reserved. The information contained herein: (1) is proprietary to Morningstar and/or its content providers; (2) maynot be copied or distributed and (3) is not warranted to be accurate, complete or timely. Neither Morningstar nor its content providers are responsible for any damages or losses arising from any use ofinformation. Past performance is no guarantee of future performance. Visit our investment website at www.morningstar.com ß
®
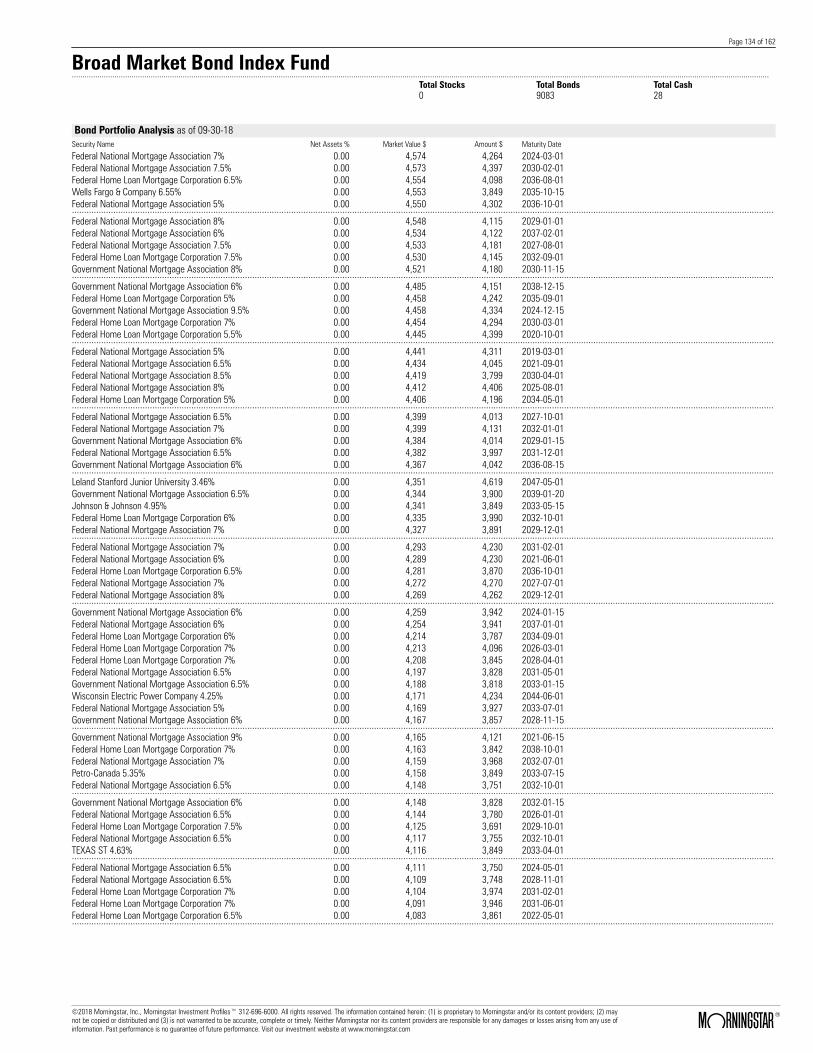
Page 134 of 162
Broad Market Bond Index Fund.......................................................................................................................................................................................................................................................................................................................................
Total Stocks Total Bonds Total Cash0 9083 28
Bond Portfolio Analysis as of 09-30-18Security Name Net Assets % Market Value $ Amount $ Maturity Date
Federal National Mortgage Association 7% 0.00 4,574 4,264 2024-03-01Federal National Mortgage Association 7.5% 0.00 4,573 4,397 2030-02-01Federal Home Loan Mortgage Corporation 6.5% 0.00 4,554 4,098 2036-08-01Wells Fargo & Company 6.55% 0.00 4,553 3,849 2035-10-15Federal National Mortgage Association 5% 0.00 4,550 4,302 2036-10-01................................................................................................................................................................................................................................................................................................Federal National Mortgage Association 8% 0.00 4,548 4,115 2029-01-01Federal National Mortgage Association 6% 0.00 4,534 4,122 2037-02-01Federal National Mortgage Association 7.5% 0.00 4,533 4,181 2027-08-01Federal Home Loan Mortgage Corporation 7.5% 0.00 4,530 4,145 2032-09-01Government National Mortgage Association 8% 0.00 4,521 4,180 2030-11-15................................................................................................................................................................................................................................................................................................Government National Mortgage Association 6% 0.00 4,485 4,151 2038-12-15Federal Home Loan Mortgage Corporation 5% 0.00 4,458 4,242 2035-09-01Government National Mortgage Association 9.5% 0.00 4,458 4,334 2024-12-15Federal Home Loan Mortgage Corporation 7% 0.00 4,454 4,294 2030-03-01Federal Home Loan Mortgage Corporation 5.5% 0.00 4,445 4,399 2020-10-01................................................................................................................................................................................................................................................................................................Federal National Mortgage Association 5% 0.00 4,441 4,311 2019-03-01Federal National Mortgage Association 6.5% 0.00 4,434 4,045 2021-09-01Federal National Mortgage Association 8.5% 0.00 4,419 3,799 2030-04-01Federal National Mortgage Association 8% 0.00 4,412 4,406 2025-08-01Federal Home Loan Mortgage Corporation 5% 0.00 4,406 4,196 2034-05-01................................................................................................................................................................................................................................................................................................Federal National Mortgage Association 6.5% 0.00 4,399 4,013 2027-10-01Federal National Mortgage Association 7% 0.00 4,399 4,131 2032-01-01Government National Mortgage Association 6% 0.00 4,384 4,014 2029-01-15Federal National Mortgage Association 6.5% 0.00 4,382 3,997 2031-12-01Government National Mortgage Association 6% 0.00 4,367 4,042 2036-08-15................................................................................................................................................................................................................................................................................................Leland Stanford Junior University 3.46% 0.00 4,351 4,619 2047-05-01Government National Mortgage Association 6.5% 0.00 4,344 3,900 2039-01-20Johnson & Johnson 4.95% 0.00 4,341 3,849 2033-05-15Federal Home Loan Mortgage Corporation 6% 0.00 4,335 3,990 2032-10-01Federal National Mortgage Association 7% 0.00 4,327 3,891 2029-12-01................................................................................................................................................................................................................................................................................................Federal National Mortgage Association 7% 0.00 4,293 4,230 2031-02-01Federal National Mortgage Association 6% 0.00 4,289 4,230 2021-06-01Federal Home Loan Mortgage Corporation 6.5% 0.00 4,281 3,870 2036-10-01Federal National Mortgage Association 7% 0.00 4,272 4,270 2027-07-01Federal National Mortgage Association 8% 0.00 4,269 4,262 2029-12-01................................................................................................................................................................................................................................................................................................Government National Mortgage Association 6% 0.00 4,259 3,942 2024-01-15Federal National Mortgage Association 6% 0.00 4,254 3,941 2037-01-01Federal Home Loan Mortgage Corporation 6% 0.00 4,214 3,787 2034-09-01Federal Home Loan Mortgage Corporation 7% 0.00 4,213 4,096 2026-03-01Federal Home Loan Mortgage Corporation 7% 0.00 4,208 3,845 2028-04-01Federal National Mortgage Association 6.5% 0.00 4,197 3,828 2031-05-01Government National Mortgage Association 6.5% 0.00 4,188 3,818 2033-01-15Wisconsin Electric Power Company 4.25% 0.00 4,171 4,234 2044-06-01Federal National Mortgage Association 5% 0.00 4,169 3,927 2033-07-01Government National Mortgage Association 6% 0.00 4,167 3,857 2028-11-15................................................................................................................................................................................................................................................................................................Government National Mortgage Association 9% 0.00 4,165 4,121 2021-06-15Federal Home Loan Mortgage Corporation 7% 0.00 4,163 3,842 2038-10-01Federal National Mortgage Association 7% 0.00 4,159 3,968 2032-07-01Petro-Canada 5.35% 0.00 4,158 3,849 2033-07-15Federal National Mortgage Association 6.5% 0.00 4,148 3,751 2032-10-01................................................................................................................................................................................................................................................................................................Government National Mortgage Association 6% 0.00 4,148 3,828 2032-01-15Federal National Mortgage Association 6.5% 0.00 4,144 3,780 2026-01-01Federal Home Loan Mortgage Corporation 7.5% 0.00 4,125 3,691 2029-10-01Federal National Mortgage Association 6.5% 0.00 4,117 3,755 2032-10-01TEXAS ST 4.63% 0.00 4,116 3,849 2033-04-01................................................................................................................................................................................................................................................................................................Federal National Mortgage Association 6.5% 0.00 4,111 3,750 2024-05-01Federal National Mortgage Association 6.5% 0.00 4,109 3,748 2028-11-01Federal Home Loan Mortgage Corporation 7% 0.00 4,104 3,974 2031-02-01Federal Home Loan Mortgage Corporation 7% 0.00 4,091 3,946 2031-06-01Federal Home Loan Mortgage Corporation 6.5% 0.00 4,083 3,861 2022-05-01................................................................................................................................................................................................................................................................................................
©2018 Morningstar, Inc., Morningstar Investment Profiles™ 312-696-6000. All rights reserved. The information contained herein: (1) is proprietary to Morningstar and/or its content providers; (2) maynot be copied or distributed and (3) is not warranted to be accurate, complete or timely. Neither Morningstar nor its content providers are responsible for any damages or losses arising from any use ofinformation. Past performance is no guarantee of future performance. Visit our investment website at www.morningstar.com ß
®

Page 135 of 162
Broad Market Bond Index Fund.......................................................................................................................................................................................................................................................................................................................................
Total Stocks Total Bonds Total Cash0 9083 28
Bond Portfolio Analysis as of 09-30-18Security Name Net Assets % Market Value $ Amount $ Maturity Date
Veolia Environnement S.A. 6.75% 0.00 4,078 3,465 2038-06-01Federal National Mortgage Association 6% 0.00 4,072 3,711 2029-04-01Federal National Mortgage Association 5.5% 0.00 4,070 4,024 2021-05-01Federal Home Loan Mortgage Corporation 8% 0.00 4,068 3,706 2027-08-01Federal Home Loan Mortgage Corporation 5.5% 0.00 4,055 4,036 2019-09-01................................................................................................................................................................................................................................................................................................Federal National Mortgage Association 6.5% 0.00 4,028 3,646 2031-10-01Federal National Mortgage Association 6.5% 0.00 4,023 3,670 2024-04-01Government National Mortgage Association 8% 0.00 3,999 3,355 2030-08-20E.I. Du Pont de Nemours and Company 4.9% 0.00 3,964 3,849 2041-01-15Federal National Mortgage Association 7% 0.00 3,957 3,876 2030-06-01................................................................................................................................................................................................................................................................................................Federal Home Loan Mortgage Corporation 6.5% 0.00 3,953 3,573 2024-02-01Government National Mortgage Association 6% 0.00 3,938 3,622 2037-11-20Government National Mortgage Association 6.5% 0.00 3,933 3,585 2033-09-15Government National Mortgage Association 6.5% 0.00 3,928 3,547 2029-03-20Federal Home Loan Mortgage Corporation 7% 0.00 3,927 3,558 2028-11-01................................................................................................................................................................................................................................................................................................Federal Home Loan Mortgage Corporation 7% 0.00 3,914 3,908 2024-08-01Government National Mortgage Association 8% 0.00 3,908 3,877 2030-12-15Federal National Mortgage Association 6.5% 0.00 3,890 3,542 2029-03-01Government National Mortgage Association 6% 0.00 3,882 3,593 2028-09-15Federal National Mortgage Association 6.5% 0.00 3,879 3,493 2031-12-01................................................................................................................................................................................................................................................................................................Federal Home Loan Mortgage Corporation 4.5% 0.00 3,875 3,827 2019-05-01Federal National Mortgage Association 7% 0.00 3,858 3,474 2028-10-01Federal Home Loan Mortgage Corporation 6% 0.00 3,853 3,546 2029-01-01Government National Mortgage Association 6% 0.00 3,834 3,518 2031-03-20Federal Home Loan Mortgage Corporation 7% 0.00 3,813 3,696 2032-04-01................................................................................................................................................................................................................................................................................................Government National Mortgage Association 8% 0.00 3,813 3,507 2026-06-20Government National Mortgage Association 6% 0.00 3,790 3,468 2032-07-15Federal National Mortgage Association 5% 0.00 3,771 3,551 2034-05-01Federal National Mortgage Association 6% 0.00 3,771 3,709 2021-07-01Federal National Mortgage Association 6.5% 0.00 3,765 3,380 2034-05-01................................................................................................................................................................................................................................................................................................Federal National Mortgage Association 6.5% 0.00 3,745 3,416 2033-11-01Federal Home Loan Mortgage Corporation 7% 0.00 3,742 3,360 2028-09-01Federal National Mortgage Association 6.5% 0.00 3,742 3,413 2036-01-01Federal Home Loan Mortgage Corporation 7.5% 0.00 3,740 3,521 2028-04-01Federal National Mortgage Association 6.5% 0.00 3,730 3,403 2026-05-01Government National Mortgage Association 6% 0.00 3,725 3,416 2033-01-15Federal National Mortgage Association 6.5% 0.00 3,723 3,396 2027-03-01Federal Home Loan Mortgage Corporation 7.5% 0.00 3,707 3,309 2028-04-01Federal National Mortgage Association 7% 0.00 3,690 3,412 2026-01-01Federal National Mortgage Association 6% 0.00 3,679 3,408 2023-10-01................................................................................................................................................................................................................................................................................................Government National Mortgage Association 8% 0.00 3,676 3,667 2026-02-15Federal National Mortgage Association 8% 0.00 3,675 3,558 2028-07-01Federal Home Loan Mortgage Corporation 5.5% 0.00 3,665 3,441 2035-07-01Federal National Mortgage Association 7.5% 0.00 3,648 3,195 2029-10-01Federal Home Loan Mortgage Corporation 4.5% 0.00 3,644 3,516 2034-05-01................................................................................................................................................................................................................................................................................................Federal National Mortgage Association 7% 0.00 3,639 3,596 2024-08-01Federal National Mortgage Association 7% 0.00 3,637 3,481 2025-11-01Federal Home Loan Mortgage Corporation 8% 0.00 3,626 3,569 2024-09-01Federal Home Loan Mortgage Corporation 7.5% 0.00 3,618 3,318 2028-03-01Federal National Mortgage Association 7% 0.00 3,612 3,147 2038-11-01................................................................................................................................................................................................................................................................................................Federal National Mortgage Association 8% 0.00 3,610 3,477 2030-06-01Federal National Mortgage Association 6% 0.00 3,602 3,337 2023-12-01Federal National Mortgage Association 7% 0.00 3,600 3,576 2026-10-01Federal National Mortgage Association 7% 0.00 3,591 3,342 2031-01-01Federal Home Loan Mortgage Corporation 6.5% 0.00 3,588 3,243 2029-04-01................................................................................................................................................................................................................................................................................................Federal Home Loan Mortgage Corporation 6.5% 0.00 3,580 3,236 2028-12-01Federal National Mortgage Association 6.5% 0.00 3,574 3,260 2021-10-01Syngenta Finance N.V. 4.38% 0.00 3,566 4,619 2042-03-28Government National Mortgage Association 9% 0.00 3,565 3,555 2020-03-15Federal National Mortgage Association 5% 0.00 3,550 3,380 2037-12-01................................................................................................................................................................................................................................................................................................
©2018 Morningstar, Inc., Morningstar Investment Profiles™ 312-696-6000. All rights reserved. The information contained herein: (1) is proprietary to Morningstar and/or its content providers; (2) maynot be copied or distributed and (3) is not warranted to be accurate, complete or timely. Neither Morningstar nor its content providers are responsible for any damages or losses arising from any use ofinformation. Past performance is no guarantee of future performance. Visit our investment website at www.morningstar.com ß
®
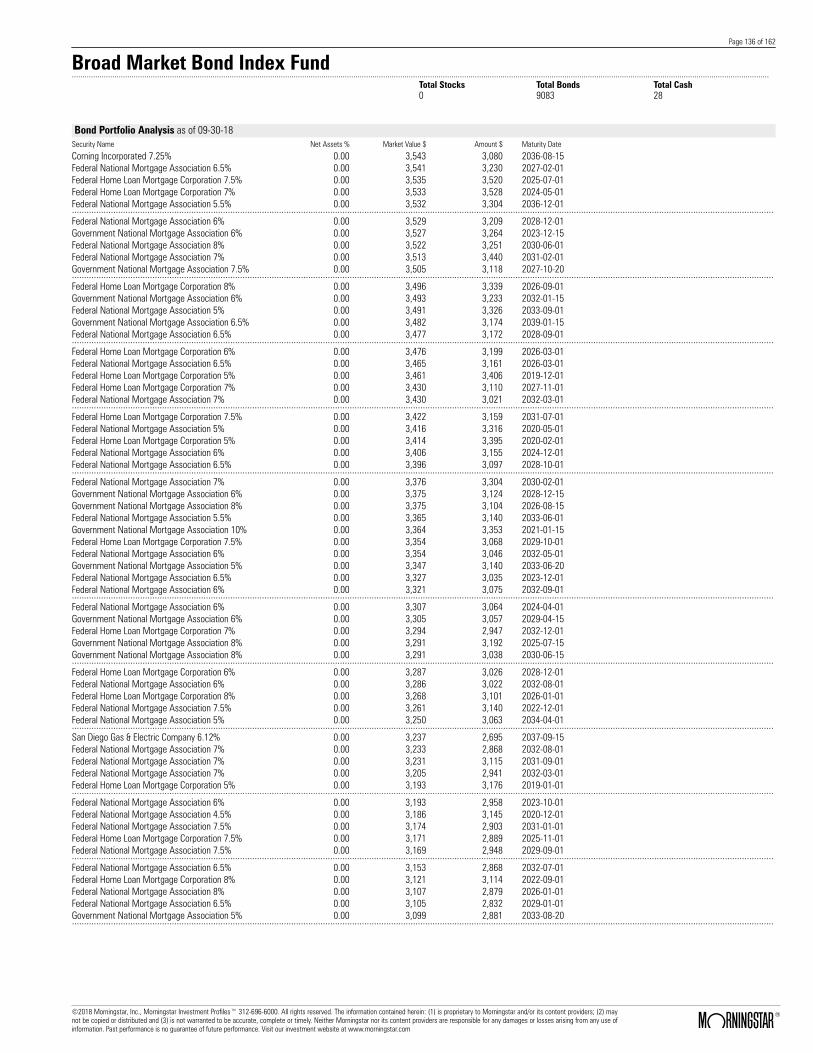
Page 136 of 162
Broad Market Bond Index Fund.......................................................................................................................................................................................................................................................................................................................................
Total Stocks Total Bonds Total Cash0 9083 28
Bond Portfolio Analysis as of 09-30-18Security Name Net Assets % Market Value $ Amount $ Maturity Date
Corning Incorporated 7.25% 0.00 3,543 3,080 2036-08-15Federal National Mortgage Association 6.5% 0.00 3,541 3,230 2027-02-01Federal Home Loan Mortgage Corporation 7.5% 0.00 3,535 3,520 2025-07-01Federal Home Loan Mortgage Corporation 7% 0.00 3,533 3,528 2024-05-01Federal National Mortgage Association 5.5% 0.00 3,532 3,304 2036-12-01................................................................................................................................................................................................................................................................................................Federal National Mortgage Association 6% 0.00 3,529 3,209 2028-12-01Government National Mortgage Association 6% 0.00 3,527 3,264 2023-12-15Federal National Mortgage Association 8% 0.00 3,522 3,251 2030-06-01Federal National Mortgage Association 7% 0.00 3,513 3,440 2031-02-01Government National Mortgage Association 7.5% 0.00 3,505 3,118 2027-10-20................................................................................................................................................................................................................................................................................................Federal Home Loan Mortgage Corporation 8% 0.00 3,496 3,339 2026-09-01Government National Mortgage Association 6% 0.00 3,493 3,233 2032-01-15Federal National Mortgage Association 5% 0.00 3,491 3,326 2033-09-01Government National Mortgage Association 6.5% 0.00 3,482 3,174 2039-01-15Federal National Mortgage Association 6.5% 0.00 3,477 3,172 2028-09-01................................................................................................................................................................................................................................................................................................Federal Home Loan Mortgage Corporation 6% 0.00 3,476 3,199 2026-03-01Federal National Mortgage Association 6.5% 0.00 3,465 3,161 2026-03-01Federal Home Loan Mortgage Corporation 5% 0.00 3,461 3,406 2019-12-01Federal Home Loan Mortgage Corporation 7% 0.00 3,430 3,110 2027-11-01Federal National Mortgage Association 7% 0.00 3,430 3,021 2032-03-01................................................................................................................................................................................................................................................................................................Federal Home Loan Mortgage Corporation 7.5% 0.00 3,422 3,159 2031-07-01Federal National Mortgage Association 5% 0.00 3,416 3,316 2020-05-01Federal Home Loan Mortgage Corporation 5% 0.00 3,414 3,395 2020-02-01Federal National Mortgage Association 6% 0.00 3,406 3,155 2024-12-01Federal National Mortgage Association 6.5% 0.00 3,396 3,097 2028-10-01................................................................................................................................................................................................................................................................................................Federal National Mortgage Association 7% 0.00 3,376 3,304 2030-02-01Government National Mortgage Association 6% 0.00 3,375 3,124 2028-12-15Government National Mortgage Association 8% 0.00 3,375 3,104 2026-08-15Federal National Mortgage Association 5.5% 0.00 3,365 3,140 2033-06-01Government National Mortgage Association 10% 0.00 3,364 3,353 2021-01-15Federal Home Loan Mortgage Corporation 7.5% 0.00 3,354 3,068 2029-10-01Federal National Mortgage Association 6% 0.00 3,354 3,046 2032-05-01Government National Mortgage Association 5% 0.00 3,347 3,140 2033-06-20Federal National Mortgage Association 6.5% 0.00 3,327 3,035 2023-12-01Federal National Mortgage Association 6% 0.00 3,321 3,075 2032-09-01................................................................................................................................................................................................................................................................................................Federal National Mortgage Association 6% 0.00 3,307 3,064 2024-04-01Government National Mortgage Association 6% 0.00 3,305 3,057 2029-04-15Federal Home Loan Mortgage Corporation 7% 0.00 3,294 2,947 2032-12-01Government National Mortgage Association 8% 0.00 3,291 3,192 2025-07-15Government National Mortgage Association 8% 0.00 3,291 3,038 2030-06-15................................................................................................................................................................................................................................................................................................Federal Home Loan Mortgage Corporation 6% 0.00 3,287 3,026 2028-12-01Federal National Mortgage Association 6% 0.00 3,286 3,022 2032-08-01Federal Home Loan Mortgage Corporation 8% 0.00 3,268 3,101 2026-01-01Federal National Mortgage Association 7.5% 0.00 3,261 3,140 2022-12-01Federal National Mortgage Association 5% 0.00 3,250 3,063 2034-04-01................................................................................................................................................................................................................................................................................................San Diego Gas & Electric Company 6.12% 0.00 3,237 2,695 2037-09-15Federal National Mortgage Association 7% 0.00 3,233 2,868 2032-08-01Federal National Mortgage Association 7% 0.00 3,231 3,115 2031-09-01Federal National Mortgage Association 7% 0.00 3,205 2,941 2032-03-01Federal Home Loan Mortgage Corporation 5% 0.00 3,193 3,176 2019-01-01................................................................................................................................................................................................................................................................................................Federal National Mortgage Association 6% 0.00 3,193 2,958 2023-10-01Federal National Mortgage Association 4.5% 0.00 3,186 3,145 2020-12-01Federal National Mortgage Association 7.5% 0.00 3,174 2,903 2031-01-01Federal Home Loan Mortgage Corporation 7.5% 0.00 3,171 2,889 2025-11-01Federal National Mortgage Association 7.5% 0.00 3,169 2,948 2029-09-01................................................................................................................................................................................................................................................................................................Federal National Mortgage Association 6.5% 0.00 3,153 2,868 2032-07-01Federal Home Loan Mortgage Corporation 8% 0.00 3,121 3,114 2022-09-01Federal National Mortgage Association 8% 0.00 3,107 2,879 2026-01-01Federal National Mortgage Association 6.5% 0.00 3,105 2,832 2029-01-01Government National Mortgage Association 5% 0.00 3,099 2,881 2033-08-20................................................................................................................................................................................................................................................................................................
©2018 Morningstar, Inc., Morningstar Investment Profiles™ 312-696-6000. All rights reserved. The information contained herein: (1) is proprietary to Morningstar and/or its content providers; (2) maynot be copied or distributed and (3) is not warranted to be accurate, complete or timely. Neither Morningstar nor its content providers are responsible for any damages or losses arising from any use ofinformation. Past performance is no guarantee of future performance. Visit our investment website at www.morningstar.com ß
®

Page 137 of 162
Broad Market Bond Index Fund.......................................................................................................................................................................................................................................................................................................................................
Total Stocks Total Bonds Total Cash0 9083 28
Bond Portfolio Analysis as of 09-30-18Security Name Net Assets % Market Value $ Amount $ Maturity Date
Federal Home Loan Mortgage Corporation 6.5% 0.00 3,095 2,797 2027-09-01Government National Mortgage Association 8.5% 0.00 3,065 3,056 2025-02-15Federal Home Loan Mortgage Corporation 5% 0.00 3,059 2,999 2021-01-01Federal Home Loan Mortgage Corporation 6.5% 0.00 3,047 2,754 2029-07-01Government National Mortgage Association 8% 0.00 3,045 2,787 2030-04-15................................................................................................................................................................................................................................................................................................Federal Home Loan Mortgage Corporation 6% 0.00 3,041 2,797 2024-01-01Government National Mortgage Association 6.5% 0.00 3,039 2,702 2031-07-20Federal National Mortgage Association 6.5% 0.00 3,036 2,769 2032-09-01Federal National Mortgage Association 8% 0.00 3,035 2,590 2030-10-01Federal Home Loan Mortgage Corporation 6.5% 0.00 3,029 2,738 2023-11-01................................................................................................................................................................................................................................................................................................Federal Home Loan Mortgage Corporation 7.5% 0.00 3,025 3,019 2024-08-01Federal National Mortgage Association 6.5% 0.00 3,010 2,745 2036-06-01Federal National Mortgage Association 7.5% 0.00 2,986 2,953 2029-09-01Federal National Mortgage Association 7% 0.00 2,985 2,924 2024-06-01Federal Home Loan Mortgage Corporation 4.5% 0.00 2,978 2,872 2035-10-01................................................................................................................................................................................................................................................................................................Federal Home Loan Mortgage Corporation 7% 0.00 2,975 2,954 2028-03-01Federal National Mortgage Association 6.5% 0.00 2,973 2,707 2029-08-01Federal Home Loan Mortgage Corporation 6.5% 0.00 2,964 2,679 2024-01-01Federal National Mortgage Association 5.5% 0.00 2,959 2,757 2037-12-01MetLife Inc. 10.75% 0.00 2,954 1,925 2069-08-01................................................................................................................................................................................................................................................................................................Arch Capital Group Ltd. 7.35% 0.00 2,948 2,310 2034-05-01Federal National Mortgage Association 6% 0.00 2,948 2,729 2032-05-01Federal Home Loan Mortgage Corporation 6% 0.00 2,941 2,707 2033-03-01Federal Home Loan Mortgage Corporation 6.5% 0.00 2,939 2,656 2029-04-01Federal National Mortgage Association 6.5% 0.00 2,939 2,681 2032-04-01Government National Mortgage Association 6% 0.00 2,939 2,717 2032-07-15Federal National Mortgage Association 6.5% 0.00 2,938 2,680 2031-12-01Government National Mortgage Association 8% 0.00 2,935 2,855 2025-06-15Federal National Mortgage Association 7.5% 0.00 2,933 2,874 2031-01-01Federal Home Loan Mortgage Corporation 6.5% 0.00 2,925 2,644 2029-11-01................................................................................................................................................................................................................................................................................................Federal Home Loan Mortgage Corporation 6% 0.00 2,901 2,621 2033-02-01Government National Mortgage Association 6% 0.00 2,876 2,662 2023-11-15Federal National Mortgage Association 6.5% 0.00 2,874 2,621 2029-04-01Government National Mortgage Association 6.5% 0.00 2,867 2,536 2031-05-20Federal Home Loan Mortgage Corporation 7.5% 0.00 2,857 2,626 2026-08-01................................................................................................................................................................................................................................................................................................Federal National Mortgage Association 9% 0.00 2,851 2,806 2024-12-01Federal National Mortgage Association 5.5% 0.00 2,832 2,654 2033-09-01Federal Home Loan Mortgage Corporation 6% 0.00 2,809 2,585 2036-10-01Federal Home Loan Mortgage Corporation 7.5% 0.00 2,807 2,586 2032-01-01Federal Home Loan Mortgage Corporation 6.5% 0.00 2,801 2,532 2026-03-01................................................................................................................................................................................................................................................................................................Federal National Mortgage Association 6.5% 0.00 2,795 2,549 2023-09-01Federal National Mortgage Association 6% 0.00 2,779 2,574 2026-05-01Federal National Mortgage Association 7% 0.00 2,770 2,466 2032-06-01Federal Home Loan Mortgage Corporation 8% 0.00 2,767 2,761 2030-02-01Federal National Mortgage Association 6.5% 0.00 2,760 2,518 2028-08-01................................................................................................................................................................................................................................................................................................Federal Home Loan Mortgage Corporation 7.5% 0.00 2,752 2,434 2030-09-01Federal Home Loan Mortgage Corporation 7% 0.00 2,748 2,744 2023-12-01Federal Home Loan Mortgage Corporation 6.5% 0.00 2,746 2,482 2026-05-01Federal National Mortgage Association 7% 0.00 2,742 2,437 2029-12-01Federal National Mortgage Association 6% 0.00 2,733 2,531 2023-10-01................................................................................................................................................................................................................................................................................................Federal National Mortgage Association 6.5% 0.00 2,733 2,493 2028-10-01Federal National Mortgage Association 5.5% 0.00 2,731 2,560 2034-08-01Federal National Mortgage Association 6.5% 0.00 2,730 2,490 2032-03-01Federal National Mortgage Association 6.5% 0.00 2,727 2,487 2029-06-01Federal National Mortgage Association 6% 0.00 2,717 2,470 2033-02-01................................................................................................................................................................................................................................................................................................Federal National Mortgage Association 6.5% 0.00 2,713 2,475 2024-04-01Federal National Mortgage Association 5.5% 0.00 2,697 2,686 2019-09-01Federal National Mortgage Association 7% 0.00 2,692 2,542 2028-06-01Federal Home Loan Mortgage Corporation 7.5% 0.00 2,677 2,417 2030-05-01Federal Home Loan Mortgage Corporation 7% 0.00 2,662 2,422 2028-03-01................................................................................................................................................................................................................................................................................................
©2018 Morningstar, Inc., Morningstar Investment Profiles™ 312-696-6000. All rights reserved. The information contained herein: (1) is proprietary to Morningstar and/or its content providers; (2) maynot be copied or distributed and (3) is not warranted to be accurate, complete or timely. Neither Morningstar nor its content providers are responsible for any damages or losses arising from any use ofinformation. Past performance is no guarantee of future performance. Visit our investment website at www.morningstar.com ß
®

Page 138 of 162
Broad Market Bond Index Fund.......................................................................................................................................................................................................................................................................................................................................
Total Stocks Total Bonds Total Cash0 9083 28
Bond Portfolio Analysis as of 09-30-18Security Name Net Assets % Market Value $ Amount $ Maturity Date
Government National Mortgage Association 9% 0.00 2,660 2,652 2025-04-15Federal Home Loan Mortgage Corporation 6% 0.00 2,652 2,441 2028-10-01Federal Home Loan Mortgage Corporation 7.5% 0.00 2,651 2,381 2027-06-01Federal National Mortgage Association 7.5% 0.00 2,642 2,299 2031-06-01Federal National Mortgage Association 7% 0.00 2,638 2,592 2024-07-01................................................................................................................................................................................................................................................................................................Federal National Mortgage Association 8% 0.00 2,638 2,486 2025-05-01Government National Mortgage Association 6.5% 0.00 2,638 2,380 2029-07-20Federal National Mortgage Association 7% 0.00 2,628 2,626 2026-01-01Federal Home Loan Mortgage Corporation 7.5% 0.00 2,625 2,620 2031-01-01Federal Home Loan Mortgage Corporation 7.5% 0.00 2,616 2,311 2030-10-01................................................................................................................................................................................................................................................................................................Federal National Mortgage Association 7% 0.00 2,609 2,403 2031-09-01PacifiCorp 7.7% 0.00 2,599 1,925 2031-11-15Federal Home Loan Mortgage Corporation 9% 0.00 2,597 2,590 2024-12-01Federal National Mortgage Association 6% 0.00 2,590 2,556 2021-04-01Federal National Mortgage Association 7.5% 0.00 2,576 2,377 2031-01-01................................................................................................................................................................................................................................................................................................Government National Mortgage Association 6% 0.00 2,576 2,384 2032-01-15Government National Mortgage Association 8% 0.00 2,575 2,501 2026-01-15Federal National Mortgage Association 6% 0.00 2,572 2,383 2029-01-01Federal Home Loan Mortgage Corporation 6.5% 0.00 2,566 2,319 2029-05-01Government National Mortgage Association 8% 0.00 2,565 2,496 2027-01-15Government National Mortgage Association 6% 0.00 2,558 2,338 2029-03-15Federal National Mortgage Association 7.5% 0.00 2,535 2,525 2027-12-01XTO Energy Inc. 6.75% 0.00 2,526 1,925 2037-08-01Federal Home Loan Mortgage Corporation 7.5% 0.00 2,524 2,312 2031-02-01Federal Home Loan Mortgage Corporation 4.5% 0.00 2,516 2,485 2019-02-01................................................................................................................................................................................................................................................................................................Federal National Mortgage Association 8% 0.00 2,502 2,312 2027-10-01Government National Mortgage Association 6% 0.00 2,492 2,306 2028-10-15Federal Home Loan Mortgage Corporation 7% 0.00 2,487 2,226 2031-10-01Federal National Mortgage Association 4% 0.00 2,479 2,429 2021-05-01Federal National Mortgage Association 6.5% 0.00 2,476 2,258 2029-03-01................................................................................................................................................................................................................................................................................................Federal National Mortgage Association 5.5% 0.00 2,472 2,317 2038-08-01Puget Sound Energy Inc. 6.72% 0.00 2,466 1,925 2036-06-15Conagra Brands Inc 8.25% 0.00 2,462 1,925 2030-09-15Government National Mortgage Association 7.5% 0.00 2,460 2,184 2027-08-20Federal Home Loan Mortgage Corporation 7% 0.00 2,445 2,404 2026-05-01................................................................................................................................................................................................................................................................................................Midamerican Energy Company 6.75% 0.00 2,442 1,925 2031-12-30Federal Home Loan Mortgage Corporation 6.5% 0.00 2,441 2,207 2029-05-01Federal National Mortgage Association 6.5% 0.00 2,441 2,227 2036-04-01Government National Mortgage Association 8% 0.00 2,438 2,359 2030-05-15Government National Mortgage Association 9% 0.00 2,431 2,407 2020-11-15................................................................................................................................................................................................................................................................................................Federal Home Loan Mortgage Corporation 6% 0.00 2,417 2,193 2032-02-01Federal Home Loan Mortgage Corporation 6.5% 0.00 2,417 2,185 2027-01-01Federal Home Loan Mortgage Corporation 6.5% 0.00 2,414 2,377 2021-06-01Federal Home Loan Mortgage Corporation 6% 0.00 2,410 2,218 2031-01-01Federal National Mortgage Association 6.5% 0.00 2,409 2,197 2029-07-01................................................................................................................................................................................................................................................................................................Federal Home Loan Mortgage Corporation 8% 0.00 2,402 2,104 2030-09-01Federal National Mortgage Association 6% 0.00 2,402 2,225 2031-03-01Federal National Mortgage Association 6.5% 0.00 2,402 2,191 2025-09-01Federal Home Loan Mortgage Corporation 7.5% 0.00 2,398 2,289 2024-05-01Federal National Mortgage Association 7% 0.00 2,392 2,284 2029-07-01................................................................................................................................................................................................................................................................................................Federal Home Loan Mortgage Corporation 7.5% 0.00 2,391 2,297 2027-01-01Federal Home Loan Mortgage Corporation 6% 0.00 2,379 2,172 2029-01-01Federal Home Loan Mortgage Corporation 8% 0.00 2,371 2,260 2022-04-01Federal National Mortgage Association 5% 0.00 2,368 2,298 2019-02-01Federal National Mortgage Association 6% 0.00 2,360 2,186 2028-12-01................................................................................................................................................................................................................................................................................................Federal Home Loan Mortgage Corporation 7% 0.00 2,358 2,217 2024-03-01Federal National Mortgage Association 6% 0.00 2,358 2,184 2028-08-01Government National Mortgage Association 8% 0.00 2,358 2,353 2023-08-15Federal National Mortgage Association 6% 0.00 2,355 2,180 2031-06-01Federal Home Loan Mortgage Corporation 6.5% 0.00 2,353 2,127 2028-01-01................................................................................................................................................................................................................................................................................................
©2018 Morningstar, Inc., Morningstar Investment Profiles™ 312-696-6000. All rights reserved. The information contained herein: (1) is proprietary to Morningstar and/or its content providers; (2) maynot be copied or distributed and (3) is not warranted to be accurate, complete or timely. Neither Morningstar nor its content providers are responsible for any damages or losses arising from any use ofinformation. Past performance is no guarantee of future performance. Visit our investment website at www.morningstar.com ß
®
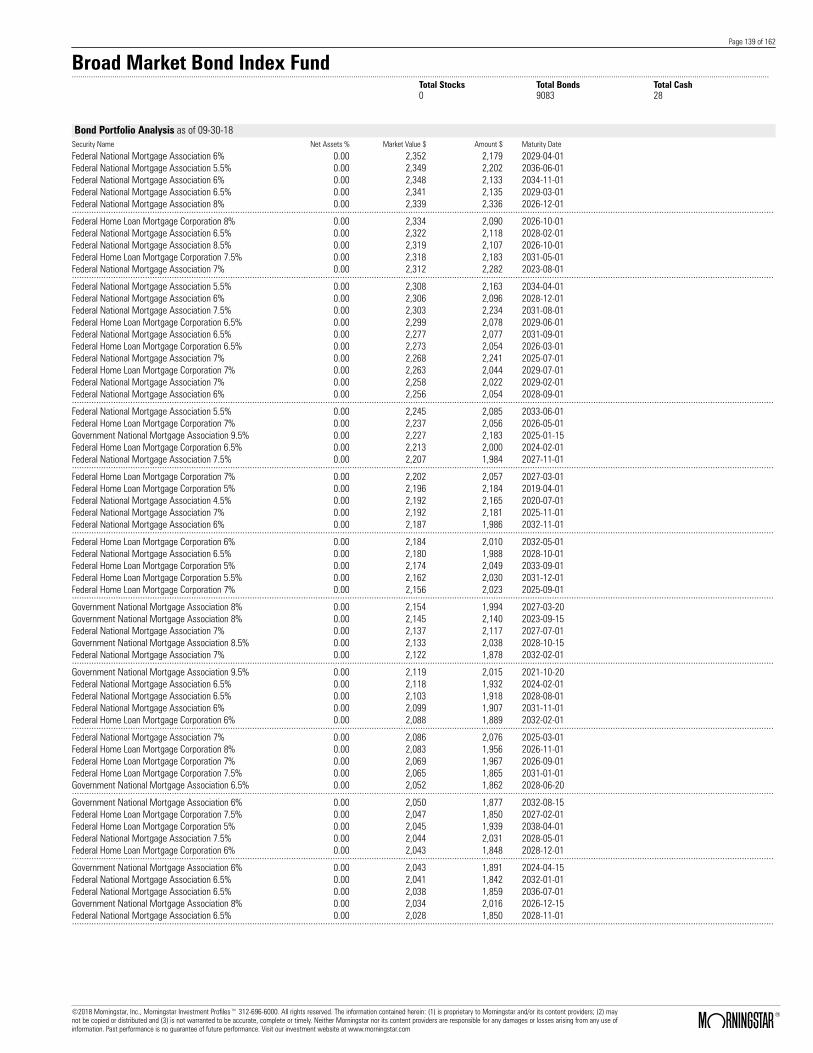
Page 139 of 162
Broad Market Bond Index Fund.......................................................................................................................................................................................................................................................................................................................................
Total Stocks Total Bonds Total Cash0 9083 28
Bond Portfolio Analysis as of 09-30-18Security Name Net Assets % Market Value $ Amount $ Maturity Date
Federal National Mortgage Association 6% 0.00 2,352 2,179 2029-04-01Federal National Mortgage Association 5.5% 0.00 2,349 2,202 2036-06-01Federal National Mortgage Association 6% 0.00 2,348 2,133 2034-11-01Federal National Mortgage Association 6.5% 0.00 2,341 2,135 2029-03-01Federal National Mortgage Association 8% 0.00 2,339 2,336 2026-12-01................................................................................................................................................................................................................................................................................................Federal Home Loan Mortgage Corporation 8% 0.00 2,334 2,090 2026-10-01Federal National Mortgage Association 6.5% 0.00 2,322 2,118 2028-02-01Federal National Mortgage Association 8.5% 0.00 2,319 2,107 2026-10-01Federal Home Loan Mortgage Corporation 7.5% 0.00 2,318 2,183 2031-05-01Federal National Mortgage Association 7% 0.00 2,312 2,282 2023-08-01................................................................................................................................................................................................................................................................................................Federal National Mortgage Association 5.5% 0.00 2,308 2,163 2034-04-01Federal National Mortgage Association 6% 0.00 2,306 2,096 2028-12-01Federal National Mortgage Association 7.5% 0.00 2,303 2,234 2031-08-01Federal Home Loan Mortgage Corporation 6.5% 0.00 2,299 2,078 2029-06-01Federal National Mortgage Association 6.5% 0.00 2,277 2,077 2031-09-01Federal Home Loan Mortgage Corporation 6.5% 0.00 2,273 2,054 2026-03-01Federal National Mortgage Association 7% 0.00 2,268 2,241 2025-07-01Federal Home Loan Mortgage Corporation 7% 0.00 2,263 2,044 2029-07-01Federal National Mortgage Association 7% 0.00 2,258 2,022 2029-02-01Federal National Mortgage Association 6% 0.00 2,256 2,054 2028-09-01................................................................................................................................................................................................................................................................................................Federal National Mortgage Association 5.5% 0.00 2,245 2,085 2033-06-01Federal Home Loan Mortgage Corporation 7% 0.00 2,237 2,056 2026-05-01Government National Mortgage Association 9.5% 0.00 2,227 2,183 2025-01-15Federal Home Loan Mortgage Corporation 6.5% 0.00 2,213 2,000 2024-02-01Federal National Mortgage Association 7.5% 0.00 2,207 1,984 2027-11-01................................................................................................................................................................................................................................................................................................Federal Home Loan Mortgage Corporation 7% 0.00 2,202 2,057 2027-03-01Federal Home Loan Mortgage Corporation 5% 0.00 2,196 2,184 2019-04-01Federal National Mortgage Association 4.5% 0.00 2,192 2,165 2020-07-01Federal National Mortgage Association 7% 0.00 2,192 2,181 2025-11-01Federal National Mortgage Association 6% 0.00 2,187 1,986 2032-11-01................................................................................................................................................................................................................................................................................................Federal Home Loan Mortgage Corporation 6% 0.00 2,184 2,010 2032-05-01Federal National Mortgage Association 6.5% 0.00 2,180 1,988 2028-10-01Federal Home Loan Mortgage Corporation 5% 0.00 2,174 2,049 2033-09-01Federal Home Loan Mortgage Corporation 5.5% 0.00 2,162 2,030 2031-12-01Federal Home Loan Mortgage Corporation 7% 0.00 2,156 2,023 2025-09-01................................................................................................................................................................................................................................................................................................Government National Mortgage Association 8% 0.00 2,154 1,994 2027-03-20Government National Mortgage Association 8% 0.00 2,145 2,140 2023-09-15Federal National Mortgage Association 7% 0.00 2,137 2,117 2027-07-01Government National Mortgage Association 8.5% 0.00 2,133 2,038 2028-10-15Federal National Mortgage Association 7% 0.00 2,122 1,878 2032-02-01................................................................................................................................................................................................................................................................................................Government National Mortgage Association 9.5% 0.00 2,119 2,015 2021-10-20Federal National Mortgage Association 6.5% 0.00 2,118 1,932 2024-02-01Federal National Mortgage Association 6.5% 0.00 2,103 1,918 2028-08-01Federal National Mortgage Association 6% 0.00 2,099 1,907 2031-11-01Federal Home Loan Mortgage Corporation 6% 0.00 2,088 1,889 2032-02-01................................................................................................................................................................................................................................................................................................Federal National Mortgage Association 7% 0.00 2,086 2,076 2025-03-01Federal Home Loan Mortgage Corporation 8% 0.00 2,083 1,956 2026-11-01Federal Home Loan Mortgage Corporation 7% 0.00 2,069 1,967 2026-09-01Federal Home Loan Mortgage Corporation 7.5% 0.00 2,065 1,865 2031-01-01Government National Mortgage Association 6.5% 0.00 2,052 1,862 2028-06-20................................................................................................................................................................................................................................................................................................Government National Mortgage Association 6% 0.00 2,050 1,877 2032-08-15Federal Home Loan Mortgage Corporation 7.5% 0.00 2,047 1,850 2027-02-01Federal Home Loan Mortgage Corporation 5% 0.00 2,045 1,939 2038-04-01Federal National Mortgage Association 7.5% 0.00 2,044 2,031 2028-05-01Federal Home Loan Mortgage Corporation 6% 0.00 2,043 1,848 2028-12-01................................................................................................................................................................................................................................................................................................Government National Mortgage Association 6% 0.00 2,043 1,891 2024-04-15Federal National Mortgage Association 6.5% 0.00 2,041 1,842 2032-01-01Federal National Mortgage Association 6.5% 0.00 2,038 1,859 2036-07-01Government National Mortgage Association 8% 0.00 2,034 2,016 2026-12-15Federal National Mortgage Association 6.5% 0.00 2,028 1,850 2028-11-01................................................................................................................................................................................................................................................................................................
©2018 Morningstar, Inc., Morningstar Investment Profiles™ 312-696-6000. All rights reserved. The information contained herein: (1) is proprietary to Morningstar and/or its content providers; (2) maynot be copied or distributed and (3) is not warranted to be accurate, complete or timely. Neither Morningstar nor its content providers are responsible for any damages or losses arising from any use ofinformation. Past performance is no guarantee of future performance. Visit our investment website at www.morningstar.com ß
®
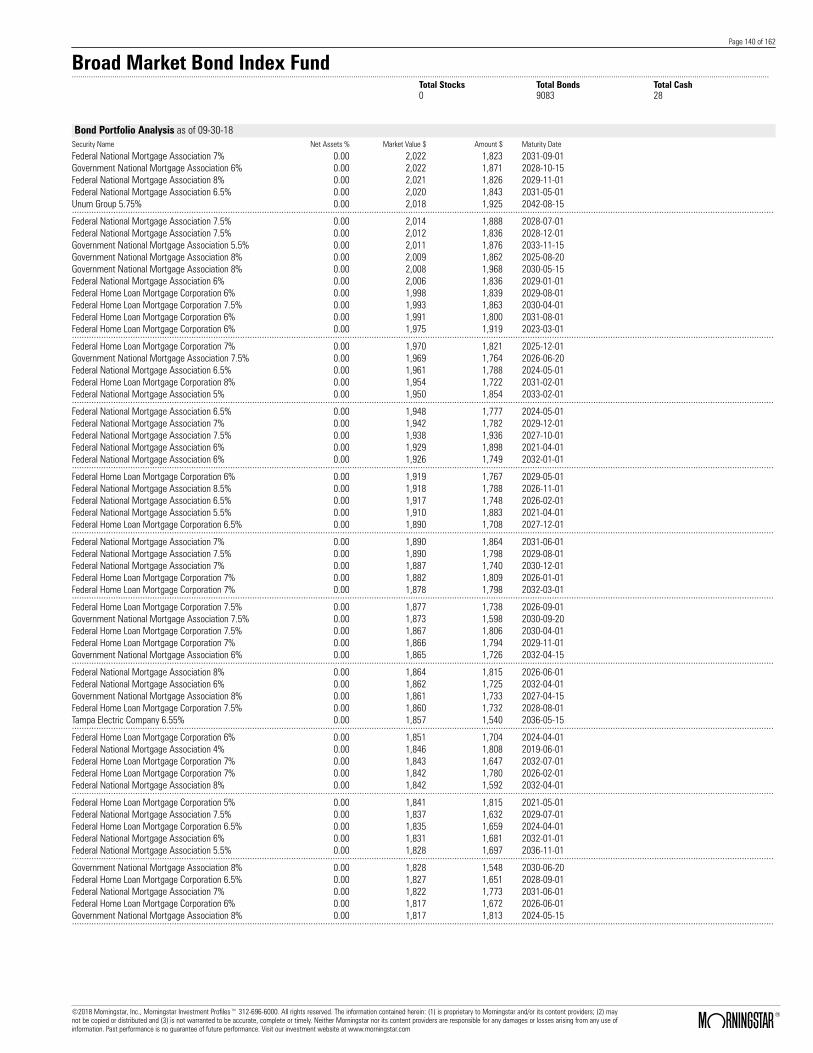
Page 140 of 162
Broad Market Bond Index Fund.......................................................................................................................................................................................................................................................................................................................................
Total Stocks Total Bonds Total Cash0 9083 28
Bond Portfolio Analysis as of 09-30-18Security Name Net Assets % Market Value $ Amount $ Maturity Date
Federal National Mortgage Association 7% 0.00 2,022 1,823 2031-09-01Government National Mortgage Association 6% 0.00 2,022 1,871 2028-10-15Federal National Mortgage Association 8% 0.00 2,021 1,826 2029-11-01Federal National Mortgage Association 6.5% 0.00 2,020 1,843 2031-05-01Unum Group 5.75% 0.00 2,018 1,925 2042-08-15................................................................................................................................................................................................................................................................................................Federal National Mortgage Association 7.5% 0.00 2,014 1,888 2028-07-01Federal National Mortgage Association 7.5% 0.00 2,012 1,836 2028-12-01Government National Mortgage Association 5.5% 0.00 2,011 1,876 2033-11-15Government National Mortgage Association 8% 0.00 2,009 1,862 2025-08-20Government National Mortgage Association 8% 0.00 2,008 1,968 2030-05-15Federal National Mortgage Association 6% 0.00 2,006 1,836 2029-01-01Federal Home Loan Mortgage Corporation 6% 0.00 1,998 1,839 2029-08-01Federal Home Loan Mortgage Corporation 7.5% 0.00 1,993 1,863 2030-04-01Federal Home Loan Mortgage Corporation 6% 0.00 1,991 1,800 2031-08-01Federal Home Loan Mortgage Corporation 6% 0.00 1,975 1,919 2023-03-01................................................................................................................................................................................................................................................................................................Federal Home Loan Mortgage Corporation 7% 0.00 1,970 1,821 2025-12-01Government National Mortgage Association 7.5% 0.00 1,969 1,764 2026-06-20Federal National Mortgage Association 6.5% 0.00 1,961 1,788 2024-05-01Federal Home Loan Mortgage Corporation 8% 0.00 1,954 1,722 2031-02-01Federal National Mortgage Association 5% 0.00 1,950 1,854 2033-02-01................................................................................................................................................................................................................................................................................................Federal National Mortgage Association 6.5% 0.00 1,948 1,777 2024-05-01Federal National Mortgage Association 7% 0.00 1,942 1,782 2029-12-01Federal National Mortgage Association 7.5% 0.00 1,938 1,936 2027-10-01Federal National Mortgage Association 6% 0.00 1,929 1,898 2021-04-01Federal National Mortgage Association 6% 0.00 1,926 1,749 2032-01-01................................................................................................................................................................................................................................................................................................Federal Home Loan Mortgage Corporation 6% 0.00 1,919 1,767 2029-05-01Federal National Mortgage Association 8.5% 0.00 1,918 1,788 2026-11-01Federal National Mortgage Association 6.5% 0.00 1,917 1,748 2026-02-01Federal National Mortgage Association 5.5% 0.00 1,910 1,883 2021-04-01Federal Home Loan Mortgage Corporation 6.5% 0.00 1,890 1,708 2027-12-01................................................................................................................................................................................................................................................................................................Federal National Mortgage Association 7% 0.00 1,890 1,864 2031-06-01Federal National Mortgage Association 7.5% 0.00 1,890 1,798 2029-08-01Federal National Mortgage Association 7% 0.00 1,887 1,740 2030-12-01Federal Home Loan Mortgage Corporation 7% 0.00 1,882 1,809 2026-01-01Federal Home Loan Mortgage Corporation 7% 0.00 1,878 1,798 2032-03-01................................................................................................................................................................................................................................................................................................Federal Home Loan Mortgage Corporation 7.5% 0.00 1,877 1,738 2026-09-01Government National Mortgage Association 7.5% 0.00 1,873 1,598 2030-09-20Federal Home Loan Mortgage Corporation 7.5% 0.00 1,867 1,806 2030-04-01Federal Home Loan Mortgage Corporation 7% 0.00 1,866 1,794 2029-11-01Government National Mortgage Association 6% 0.00 1,865 1,726 2032-04-15................................................................................................................................................................................................................................................................................................Federal National Mortgage Association 8% 0.00 1,864 1,815 2026-06-01Federal National Mortgage Association 6% 0.00 1,862 1,725 2032-04-01Government National Mortgage Association 8% 0.00 1,861 1,733 2027-04-15Federal Home Loan Mortgage Corporation 7.5% 0.00 1,860 1,732 2028-08-01Tampa Electric Company 6.55% 0.00 1,857 1,540 2036-05-15................................................................................................................................................................................................................................................................................................Federal Home Loan Mortgage Corporation 6% 0.00 1,851 1,704 2024-04-01Federal National Mortgage Association 4% 0.00 1,846 1,808 2019-06-01Federal Home Loan Mortgage Corporation 7% 0.00 1,843 1,647 2032-07-01Federal Home Loan Mortgage Corporation 7% 0.00 1,842 1,780 2026-02-01Federal National Mortgage Association 8% 0.00 1,842 1,592 2032-04-01................................................................................................................................................................................................................................................................................................Federal Home Loan Mortgage Corporation 5% 0.00 1,841 1,815 2021-05-01Federal National Mortgage Association 7.5% 0.00 1,837 1,632 2029-07-01Federal Home Loan Mortgage Corporation 6.5% 0.00 1,835 1,659 2024-04-01Federal National Mortgage Association 6% 0.00 1,831 1,681 2032-01-01Federal National Mortgage Association 5.5% 0.00 1,828 1,697 2036-11-01................................................................................................................................................................................................................................................................................................Government National Mortgage Association 8% 0.00 1,828 1,548 2030-06-20Federal Home Loan Mortgage Corporation 6.5% 0.00 1,827 1,651 2028-09-01Federal National Mortgage Association 7% 0.00 1,822 1,773 2031-06-01Federal Home Loan Mortgage Corporation 6% 0.00 1,817 1,672 2026-06-01Government National Mortgage Association 8% 0.00 1,817 1,813 2024-05-15................................................................................................................................................................................................................................................................................................
©2018 Morningstar, Inc., Morningstar Investment Profiles™ 312-696-6000. All rights reserved. The information contained herein: (1) is proprietary to Morningstar and/or its content providers; (2) maynot be copied or distributed and (3) is not warranted to be accurate, complete or timely. Neither Morningstar nor its content providers are responsible for any damages or losses arising from any use ofinformation. Past performance is no guarantee of future performance. Visit our investment website at www.morningstar.com ß
®

Page 141 of 162
Broad Market Bond Index Fund.......................................................................................................................................................................................................................................................................................................................................
Total Stocks Total Bonds Total Cash0 9083 28
Bond Portfolio Analysis as of 09-30-18Security Name Net Assets % Market Value $ Amount $ Maturity Date
Federal Home Loan Mortgage Corporation 5% 0.00 1,816 1,730 2022-12-01Federal National Mortgage Association 6% 0.00 1,814 1,680 2029-01-01Government National Mortgage Association 8% 0.00 1,808 1,647 2029-12-15Federal National Mortgage Association 5.5% 0.00 1,804 1,691 2032-10-01Federal National Mortgage Association 6.5% 0.00 1,801 1,643 2028-03-01Federal National Mortgage Association 7% 0.00 1,801 1,790 2031-10-01Federal National Mortgage Association 7.5% 0.00 1,799 1,758 2030-12-01Government National Mortgage Association 8% 0.00 1,796 1,582 2026-09-20Federal National Mortgage Association 6.5% 0.00 1,782 1,625 2023-09-01Federal National Mortgage Association 7% 0.00 1,782 1,734 2029-11-01................................................................................................................................................................................................................................................................................................Federal Home Loan Mortgage Corporation 7.5% 0.00 1,777 1,734 2031-09-01Federal National Mortgage Association 7% 0.00 1,776 1,655 2032-05-01Federal National Mortgage Association 6.5% 0.00 1,775 1,619 2028-11-01Federal National Mortgage Association 6% 0.00 1,769 1,609 2032-07-01Federal National Mortgage Association 6.5% 0.00 1,761 1,606 2028-11-01................................................................................................................................................................................................................................................................................................Federal National Mortgage Association 6% 0.00 1,755 1,595 2032-08-01Federal Home Loan Mortgage Corporation 6% 0.00 1,752 1,613 2029-01-01Federal National Mortgage Association 5.5% 0.00 1,751 1,625 2033-08-01Federal National Mortgage Association 7% 0.00 1,751 1,553 2032-07-01Federal Home Loan Mortgage Corporation 7.5% 0.00 1,743 1,719 2032-12-01................................................................................................................................................................................................................................................................................................Federal Home Loan Mortgage Corporation 8.5% 0.00 1,742 1,737 2025-05-01Government National Mortgage Association 6% 0.00 1,741 1,612 2028-12-15Federal National Mortgage Association 7% 0.00 1,737 1,721 2028-06-01McDonald's Corporation 5.7% 0.00 1,727 1,540 2039-02-01Federal National Mortgage Association 8% 0.00 1,721 1,706 2027-08-01................................................................................................................................................................................................................................................................................................Government National Mortgage Association 8% 0.00 1,715 1,701 2030-07-15Federal National Mortgage Association 9% 0.00 1,706 1,702 2025-04-01Federal Home Loan Mortgage Corporation 7.5% 0.00 1,696 1,693 2023-01-01Federal National Mortgage Association 5.5% 0.00 1,696 1,589 2031-03-01Federal Home Loan Mortgage Corporation 6.5% 0.00 1,690 1,528 2029-06-01................................................................................................................................................................................................................................................................................................Federal National Mortgage Association 5.5% 0.00 1,690 1,576 2037-02-01Federal National Mortgage Association 6.5% 0.00 1,690 1,541 2024-06-01Federal National Mortgage Association 6% 0.00 1,688 1,563 2029-02-01Government National Mortgage Association 6% 0.00 1,686 1,560 2024-01-15Federal Home Loan Mortgage Corporation 7% 0.00 1,684 1,618 2026-05-01................................................................................................................................................................................................................................................................................................Federal National Mortgage Association 7% 0.00 1,683 1,682 2029-09-01Federal Home Loan Mortgage Corporation 6.5% 0.00 1,680 1,519 2034-06-01Federal National Mortgage Association 7% 0.00 1,678 1,586 2032-04-01Federal National Mortgage Association 6.5% 0.00 1,671 1,516 2032-06-01Federal National Mortgage Association 6% 0.00 1,668 1,546 2028-11-01................................................................................................................................................................................................................................................................................................Federal Home Loan Mortgage Corporation 7% 0.00 1,662 1,528 2026-12-01Federal Home Loan Mortgage Corporation 6.5% 0.00 1,659 1,642 2023-02-01Federal National Mortgage Association 5.5% 0.00 1,658 1,550 2035-09-01Federal National Mortgage Association 5.5% 0.00 1,651 1,619 2022-06-01Federal National Mortgage Association 7.5% 0.00 1,650 1,574 2023-09-01................................................................................................................................................................................................................................................................................................Federal National Mortgage Association 6.5% 0.00 1,648 1,503 2028-10-01Government National Mortgage Association 9% 0.00 1,635 1,630 2027-06-15Federal Home Loan Mortgage Corporation 6% 0.00 1,630 1,500 2028-09-01Government National Mortgage Association 5% 0.00 1,622 1,556 2036-03-15Government National Mortgage Association 8% 0.00 1,620 1,387 2030-05-20................................................................................................................................................................................................................................................................................................Federal National Mortgage Association 6.5% 0.00 1,613 1,471 2024-04-01Federal Home Loan Mortgage Corporation 6.5% 0.00 1,596 1,521 2022-06-01Federal Home Loan Mortgage Corporation 7% 0.00 1,590 1,413 2031-09-01Federal Home Loan Mortgage Corporation 6.5% 0.00 1,589 1,436 2029-06-01Federal Home Loan Mortgage Corporation 6.5% 0.00 1,586 1,502 2021-05-01................................................................................................................................................................................................................................................................................................Government National Mortgage Association 7.5% 0.00 1,586 1,372 2030-03-20Government National Mortgage Association 8% 0.00 1,583 1,437 2029-09-15Federal National Mortgage Association 6.5% 0.00 1,578 1,440 2031-12-01Federal Home Loan Mortgage Corporation 7% 0.00 1,572 1,430 2028-02-01Federal Home Loan Mortgage Corporation 6.5% 0.00 1,564 1,414 2032-02-01
©2018 Morningstar, Inc., Morningstar Investment Profiles™ 312-696-6000. All rights reserved. The information contained herein: (1) is proprietary to Morningstar and/or its content providers; (2) maynot be copied or distributed and (3) is not warranted to be accurate, complete or timely. Neither Morningstar nor its content providers are responsible for any damages or losses arising from any use ofinformation. Past performance is no guarantee of future performance. Visit our investment website at www.morningstar.com ß
®

Page 142 of 162
Broad Market Bond Index Fund.......................................................................................................................................................................................................................................................................................................................................
Total Stocks Total Bonds Total Cash0 9083 28
Bond Portfolio Analysis as of 09-30-18Security Name Net Assets % Market Value $ Amount $ Maturity Date
Federal Home Loan Mortgage Corporation 7.5% 0.00 1,558 1,555 2024-05-01Federal National Mortgage Association 8% 0.00 1,552 1,398 2030-09-01Federal National Mortgage Association 7.5% 0.00 1,547 1,514 2029-08-01Government National Mortgage Association 9% 0.00 1,545 1,540 2025-03-15Government National Mortgage Association 8% 0.00 1,543 1,409 2025-08-15................................................................................................................................................................................................................................................................................................Government National Mortgage Association 5% 0.00 1,537 1,447 2038-02-20Federal National Mortgage Association 6.5% 0.00 1,536 1,401 2031-09-01Federal National Mortgage Association 7% 0.00 1,535 1,481 2024-12-01Federal Home Loan Mortgage Corporation 6.5% 0.00 1,530 1,383 2024-01-01Federal Home Loan Mortgage Corporation 7.5% 0.00 1,529 1,441 2024-05-01................................................................................................................................................................................................................................................................................................Federal National Mortgage Association 6% 0.00 1,525 1,412 2028-11-01Federal National Mortgage Association 6% 0.00 1,525 1,502 2021-07-01Federal Home Loan Mortgage Corporation 7% 0.00 1,524 1,482 2031-05-01Government National Mortgage Association 8.5% 0.00 1,524 1,508 2023-05-15Federal National Mortgage Association 6% 0.00 1,523 1,519 2021-07-01................................................................................................................................................................................................................................................................................................Federal National Mortgage Association 8.5% 0.00 1,514 1,511 2026-08-01Federal Home Loan Mortgage Corporation 7.5% 0.00 1,509 1,451 2030-12-01Federal National Mortgage Association 7% 0.00 1,499 1,318 2031-08-01Federal National Mortgage Association 6.5% 0.00 1,498 1,367 2031-12-01Government National Mortgage Association 6% 0.00 1,498 1,374 2028-12-15................................................................................................................................................................................................................................................................................................Federal Home Loan Mortgage Corporation 7.5% 0.00 1,497 1,490 2021-10-01Government National Mortgage Association 8% 0.00 1,490 1,474 2027-03-15Federal National Mortgage Association 6.5% 0.00 1,485 1,354 2026-05-01Federal National Mortgage Association 7.5% 0.00 1,480 1,295 2030-01-01Federal Home Loan Mortgage Corporation 5% 0.00 1,479 1,454 2019-10-01................................................................................................................................................................................................................................................................................................Federal Home Loan Mortgage Corporation 5% 0.00 1,477 1,457 2021-10-01Federal Home Loan Mortgage Corporation 6% 0.00 1,473 1,356 2029-07-01Federal National Mortgage Association 7% 0.00 1,473 1,455 2028-06-01Federal National Mortgage Association 5% 0.00 1,462 1,382 2034-05-01Federal National Mortgage Association 7% 0.00 1,461 1,458 2025-12-01................................................................................................................................................................................................................................................................................................Government National Mortgage Association 8% 0.00 1,459 1,442 2022-10-15Federal National Mortgage Association 4.5% 0.00 1,457 1,439 2019-03-01Federal Home Loan Mortgage Corporation 7.5% 0.00 1,456 1,453 2027-12-01Federal National Mortgage Association 5.5% 0.00 1,455 1,455 2019-01-01Federal National Mortgage Association 5% 0.00 1,447 1,363 2033-07-01................................................................................................................................................................................................................................................................................................Federal Home Loan Mortgage Corporation 7.5% 0.00 1,445 1,283 2031-06-01Federal National Mortgage Association 7.5% 0.00 1,444 1,366 2028-02-01Federal Home Loan Mortgage Corporation 7.5% 0.00 1,439 1,282 2029-12-01Federal National Mortgage Association 6.5% 0.00 1,435 1,309 2029-09-01Federal National Mortgage Association 5.5% 0.00 1,434 1,328 2036-05-01................................................................................................................................................................................................................................................................................................Federal National Mortgage Association 4.5% 0.00 1,429 1,411 2019-06-01Federal National Mortgage Association 7% 0.00 1,428 1,326 2031-12-01Federal National Mortgage Association 6.5% 0.00 1,427 1,302 2028-09-01Government National Mortgage Association 6.5% 0.00 1,427 1,371 2026-06-20Federal National Mortgage Association 6.5% 0.00 1,423 1,298 2029-03-01................................................................................................................................................................................................................................................................................................Government National Mortgage Association 6% 0.00 1,414 1,294 2029-01-20Federal National Mortgage Association 6.5% 0.00 1,412 1,288 2022-03-01Federal National Mortgage Association 8% 0.00 1,408 1,254 2029-09-01Federal National Mortgage Association 8.5% 0.00 1,408 1,336 2023-11-01Government National Mortgage Association 8% 0.00 1,408 1,404 2024-06-15................................................................................................................................................................................................................................................................................................Federal Home Loan Mortgage Corporation 7.5% 0.00 1,407 1,405 2028-10-01Federal National Mortgage Association 6.5% 0.00 1,404 1,281 2031-11-01Government National Mortgage Association 8.5% 0.00 1,398 1,385 2024-08-15Federal Home Loan Mortgage Corporation 8.5% 0.00 1,396 1,322 2030-06-01Federal National Mortgage Association 8.5% 0.00 1,392 1,389 2030-06-01Federal National Mortgage Association 6% 0.00 1,389 1,287 2026-01-01Federal National Mortgage Association 7.5% 0.00 1,388 1,386 2026-11-01Federal National Mortgage Association 6.5% 0.00 1,384 1,262 2028-07-01Federal National Mortgage Association 7.5% 0.00 1,378 1,255 2029-12-01Government National Mortgage Association 8.5% 0.00 1,376 1,373 2019-11-15................................................................................................................................................................................................................................................................................................
©2018 Morningstar, Inc., Morningstar Investment Profiles™ 312-696-6000. All rights reserved. The information contained herein: (1) is proprietary to Morningstar and/or its content providers; (2) maynot be copied or distributed and (3) is not warranted to be accurate, complete or timely. Neither Morningstar nor its content providers are responsible for any damages or losses arising from any use ofinformation. Past performance is no guarantee of future performance. Visit our investment website at www.morningstar.com ß
®

Page 143 of 162
Broad Market Bond Index Fund.......................................................................................................................................................................................................................................................................................................................................
Total Stocks Total Bonds Total Cash0 9083 28
Bond Portfolio Analysis as of 09-30-18Security Name Net Assets % Market Value $ Amount $ Maturity Date
Federal Home Loan Mortgage Corporation 6.5% 0.00 1,373 1,241 2029-04-01Federal National Mortgage Association 7.5% 0.00 1,355 1,353 2029-09-01Federal Home Loan Mortgage Corporation 5.5% 0.00 1,353 1,248 2032-10-01Federal National Mortgage Association 7% 0.00 1,353 1,225 2028-01-01Federal National Mortgage Association 6% 0.00 1,347 1,248 2024-01-01................................................................................................................................................................................................................................................................................................Federal National Mortgage Association 7% 0.00 1,347 1,253 2031-09-01Federal National Mortgage Association 7.5% 0.00 1,345 1,278 2023-08-01Government National Mortgage Association 6% 0.00 1,345 1,244 2038-11-15Federal Home Loan Mortgage Corporation 7.5% 0.00 1,341 1,281 2029-08-01Federal National Mortgage Association 6.5% 0.00 1,341 1,223 2026-04-01................................................................................................................................................................................................................................................................................................Federal National Mortgage Association 6.5% 0.00 1,334 1,216 2029-06-01Government National Mortgage Association 5% 0.00 1,334 1,280 2036-05-15Federal National Mortgage Association 8% 0.00 1,330 1,294 2026-12-01Federal Home Loan Mortgage Corporation 5% 0.00 1,324 1,252 2034-05-01Federal Home Loan Mortgage Corporation 6% 0.00 1,317 1,212 2029-07-01................................................................................................................................................................................................................................................................................................Federal National Mortgage Association 8% 0.00 1,314 1,183 2031-05-01Federal National Mortgage Association 6.5% 0.00 1,313 1,198 2031-06-01Federal Home Loan Mortgage Corporation 7.5% 0.00 1,312 1,161 2030-02-01Federal National Mortgage Association 5.5% 0.00 1,312 1,309 2022-01-01Federal National Mortgage Association 7% 0.00 1,306 1,306 2028-09-01................................................................................................................................................................................................................................................................................................Federal National Mortgage Association 6.5% 0.00 1,305 1,190 2032-04-01Federal Home Loan Mortgage Corporation 6% 0.00 1,304 1,180 2029-04-01Federal Home Loan Mortgage Corporation 6.5% 0.00 1,303 1,178 2029-05-01Federal National Mortgage Association 6.5% 0.00 1,303 1,176 2032-08-01Federal National Mortgage Association 6.5% 0.00 1,301 1,187 2032-08-01................................................................................................................................................................................................................................................................................................Government National Mortgage Association 5% 0.00 1,299 1,246 2036-03-15Federal National Mortgage Association 5% 0.00 1,298 1,223 2033-09-01Federal National Mortgage Association 8.5% 0.00 1,294 1,282 2023-02-01Government National Mortgage Association 8% 0.00 1,290 1,261 2030-08-15Government National Mortgage Association 9% 0.00 1,278 1,274 2025-07-15................................................................................................................................................................................................................................................................................................Federal Home Loan Mortgage Corporation 6.5% 0.00 1,271 1,149 2032-08-01Government National Mortgage Association 8% 0.00 1,270 1,254 2025-09-15Federal National Mortgage Association 5.5% 0.00 1,266 1,187 2038-02-01Government National Mortgage Association 8% 0.00 1,261 1,178 2026-08-15Federal National Mortgage Association 6.5% 0.00 1,260 1,149 2031-10-01................................................................................................................................................................................................................................................................................................Federal National Mortgage Association 6% 0.00 1,259 1,166 2031-05-01Government National Mortgage Association 8% 0.00 1,255 1,221 2030-06-15Government National Mortgage Association 6.5% 0.00 1,254 1,128 2029-08-20Federal National Mortgage Association 6.5% 0.00 1,253 1,143 2027-11-01Federal Home Loan Mortgage Corporation 7% 0.00 1,244 1,119 2031-11-01................................................................................................................................................................................................................................................................................................Government National Mortgage Association 8% 0.00 1,244 1,241 2023-10-15Federal Home Loan Mortgage Corporation 5.5% 0.00 1,242 1,237 2019-07-01Federal National Mortgage Association 6% 0.00 1,242 1,150 2029-01-01Federal National Mortgage Association 7.5% 0.00 1,241 1,240 2026-04-01Federal National Mortgage Association 6.5% 0.00 1,233 1,125 2029-01-01................................................................................................................................................................................................................................................................................................Federal Home Loan Mortgage Corporation 7% 0.00 1,228 1,176 2032-03-01Federal Home Loan Mortgage Corporation 8.5% 0.00 1,225 1,145 2025-06-01Federal National Mortgage Association 6% 0.00 1,225 1,129 2029-03-01Government National Mortgage Association 6% 0.00 1,225 1,134 2031-04-15Government National Mortgage Association 8% 0.00 1,224 1,177 2022-09-15Federal Home Loan Mortgage Corporation 7% 0.00 1,218 1,183 2030-12-01Federal Home Loan Mortgage Corporation 8% 0.00 1,218 1,075 2030-06-01Government National Mortgage Association 8% 0.00 1,218 1,149 2024-11-15Federal Home Loan Mortgage Corporation 6% 0.00 1,215 1,118 2028-12-01Federal National Mortgage Association 6.5% 0.00 1,215 1,108 2025-11-01................................................................................................................................................................................................................................................................................................Federal National Mortgage Association 9% 0.00 1,213 1,118 2025-07-01Federal Home Loan Mortgage Corporation 6.5% 0.00 1,211 1,094 2023-11-01Federal Home Loan Mortgage Corporation 6.5% 0.00 1,204 1,088 2029-06-01Federal National Mortgage Association 7% 0.00 1,201 1,187 2028-07-01Federal National Mortgage Association 8% 0.00 1,200 1,027 2030-06-01................................................................................................................................................................................................................................................................................................
©2018 Morningstar, Inc., Morningstar Investment Profiles™ 312-696-6000. All rights reserved. The information contained herein: (1) is proprietary to Morningstar and/or its content providers; (2) maynot be copied or distributed and (3) is not warranted to be accurate, complete or timely. Neither Morningstar nor its content providers are responsible for any damages or losses arising from any use ofinformation. Past performance is no guarantee of future performance. Visit our investment website at www.morningstar.com ß
®

Page 144 of 162
Broad Market Bond Index Fund.......................................................................................................................................................................................................................................................................................................................................
Total Stocks Total Bonds Total Cash0 9083 28
Bond Portfolio Analysis as of 09-30-18Security Name Net Assets % Market Value $ Amount $ Maturity Date
Federal Home Loan Mortgage Corporation 7.5% 0.00 1,192 1,099 2026-10-01Federal National Mortgage Association 7% 0.00 1,192 1,180 2020-01-01Government National Mortgage Association 6% 0.00 1,187 1,099 2032-02-15Federal National Mortgage Association 7% 0.00 1,186 1,170 2028-06-01Government National Mortgage Association 7.5% 0.00 1,185 1,088 2030-10-15................................................................................................................................................................................................................................................................................................Government National Mortgage Association 8% 0.00 1,185 1,122 2024-05-15Federal National Mortgage Association 8% 0.00 1,178 1,010 2030-07-01Federal National Mortgage Association 7% 0.00 1,177 1,137 2032-01-01Federal National Mortgage Association 5.5% 0.00 1,176 1,090 2037-01-01Federal National Mortgage Association 6.5% 0.00 1,176 1,073 2028-11-01................................................................................................................................................................................................................................................................................................Federal Home Loan Mortgage Corporation 6.5% 0.00 1,173 1,061 2029-04-01Federal Home Loan Mortgage Corporation 7.5% 0.00 1,173 1,150 2031-07-01Federal National Mortgage Association 7% 0.00 1,167 1,149 2025-11-01Federal National Mortgage Association 7.5% 0.00 1,167 1,086 2025-08-01Federal National Mortgage Association 7% 0.00 1,165 1,162 2025-10-01................................................................................................................................................................................................................................................................................................Federal National Mortgage Association 6% 0.00 1,164 1,078 2024-05-01Federal National Mortgage Association 7% 0.00 1,156 1,111 2026-12-01Federal Home Loan Mortgage Corporation 5.5% 0.00 1,155 1,153 2019-06-01Federal National Mortgage Association 7.5% 0.00 1,149 1,058 2027-01-01Federal National Mortgage Association 8% 0.00 1,141 1,003 2030-06-01................................................................................................................................................................................................................................................................................................Federal National Mortgage Association 7.5% 0.00 1,140 1,082 2026-01-01Federal National Mortgage Association 7% 0.00 1,138 1,093 2024-01-01Federal Home Loan Mortgage Corporation 7% 0.00 1,137 1,067 2024-04-01Federal National Mortgage Association 5.5% 0.00 1,135 1,064 2033-07-01Federal Home Loan Mortgage Corporation 7% 0.00 1,129 1,062 2024-02-01................................................................................................................................................................................................................................................................................................Federal National Mortgage Association 7% 0.00 1,128 999 2032-01-01Federal National Mortgage Association 6.5% 0.00 1,125 1,027 2024-01-01Government National Mortgage Association 7.5% 0.00 1,123 968 2030-05-20Federal National Mortgage Association 8.5% 0.00 1,122 1,011 2024-10-01Federal National Mortgage Association 6% 0.00 1,120 1,019 2029-10-01................................................................................................................................................................................................................................................................................................Federal Home Loan Mortgage Corporation 6.5% 0.00 1,112 1,005 2026-03-01Federal Home Loan Mortgage Corporation 7% 0.00 1,109 1,020 2027-02-01Federal National Mortgage Association 7.5% 0.00 1,109 974 2032-05-01Federal National Mortgage Association 6.5% 0.00 1,105 1,008 2028-12-01Federal National Mortgage Association 6% 0.00 1,103 1,017 2032-06-01................................................................................................................................................................................................................................................................................................Federal Home Loan Mortgage Corporation 8% 0.00 1,102 1,038 2025-06-01Government National Mortgage Association 9.5% 0.00 1,101 1,097 2022-01-15Federal Home Loan Mortgage Corporation 8% 0.00 1,100 1,019 2026-12-01Federal Home Loan Mortgage Corporation 8% 0.00 1,099 1,035 2025-05-01Federal National Mortgage Association 7% 0.00 1,095 975 2032-06-01................................................................................................................................................................................................................................................................................................Federal National Mortgage Association 7% 0.00 1,094 1,004 2030-10-01Government National Mortgage Association 8% 0.00 1,094 1,004 2029-11-15Federal National Mortgage Association 5.5% 0.00 1,093 1,022 2032-01-01Government National Mortgage Association 8.5% 0.00 1,091 1,020 2025-08-15Federal Home Loan Mortgage Corporation 4.5% 0.00 1,090 1,075 2021-09-01Federal National Mortgage Association 7% 0.00 1,089 1,077 2023-12-01Federal Home Loan Mortgage Corporation 7% 0.00 1,086 1,085 2023-11-01Federal Home Loan Mortgage Corporation 6.5% 0.00 1,085 981 2024-02-01Government National Mortgage Association 8% 0.00 1,084 1,079 2029-12-15Federal Home Loan Mortgage Corporation 6.5% 0.00 1,082 978 2029-06-01................................................................................................................................................................................................................................................................................................Federal Home Loan Mortgage Corporation 7.5% 0.00 1,082 1,076 2031-05-01Federal National Mortgage Association 7.5% 0.00 1,081 1,069 2023-12-01Government National Mortgage Association 6.5% 0.00 1,079 1,000 2028-04-20Federal National Mortgage Association 7% 0.00 1,078 1,002 2031-11-01Federal National Mortgage Association 6.5% 0.00 1,073 979 2030-01-01................................................................................................................................................................................................................................................................................................Federal National Mortgage Association 6% 0.00 1,069 984 2033-01-01Federal National Mortgage Association 6.5% 0.00 1,065 971 2027-12-01Federal National Mortgage Association 6.5% 0.00 1,061 968 2031-06-01Federal National Mortgage Association 7% 0.00 1,053 941 2029-07-01Federal National Mortgage Association 5% 0.00 1,052 1,022 2019-03-01................................................................................................................................................................................................................................................................................................
©2018 Morningstar, Inc., Morningstar Investment Profiles™ 312-696-6000. All rights reserved. The information contained herein: (1) is proprietary to Morningstar and/or its content providers; (2) maynot be copied or distributed and (3) is not warranted to be accurate, complete or timely. Neither Morningstar nor its content providers are responsible for any damages or losses arising from any use ofinformation. Past performance is no guarantee of future performance. Visit our investment website at www.morningstar.com ß
®

Page 145 of 162
Broad Market Bond Index Fund.......................................................................................................................................................................................................................................................................................................................................
Total Stocks Total Bonds Total Cash0 9083 28
Bond Portfolio Analysis as of 09-30-18Security Name Net Assets % Market Value $ Amount $ Maturity Date
Federal National Mortgage Association 5.5% 0.00 1,051 985 2032-02-01Federal Home Loan Mortgage Corporation 5% 0.00 1,048 991 2033-11-01Federal National Mortgage Association 6% 0.00 1,046 969 2025-11-01Federal Home Loan Mortgage Corporation 7.5% 0.00 1,043 1,027 2020-02-01Government National Mortgage Association 7.5% 0.00 1,041 963 2029-12-15................................................................................................................................................................................................................................................................................................Federal Home Loan Mortgage Corporation 7% 0.00 1,038 1,036 2023-08-01Federal Home Loan Mortgage Corporation 6.5% 0.00 1,036 936 2030-07-01Federal Home Loan Mortgage Corporation 6.5% 0.00 1,035 1,032 2019-07-01Government National Mortgage Association 6% 0.00 1,033 956 2029-01-15Government National Mortgage Association 8% 0.00 1,033 1,011 2029-11-15................................................................................................................................................................................................................................................................................................Federal National Mortgage Association 6.5% 0.00 1,026 936 2028-11-01Federal Home Loan Mortgage Corporation 6.5% 0.00 1,024 926 2032-06-01Federal National Mortgage Association 7.5% 0.00 1,023 959 2023-02-01Federal National Mortgage Association 6.5% 0.00 1,022 932 2028-10-01Federal Home Loan Mortgage Corporation 7% 0.00 1,020 915 2031-08-01................................................................................................................................................................................................................................................................................................Federal National Mortgage Association 7% 0.00 1,019 954 2024-02-01Federal Home Loan Mortgage Corporation 5% 0.00 1,018 962 2034-05-01Federal National Mortgage Association 6.5% 0.00 1,018 929 2028-09-01Federal National Mortgage Association 7.5% 0.00 1,017 1,018 2029-12-01Government National Mortgage Association 9.5% 0.00 1,017 1,000 2022-02-15................................................................................................................................................................................................................................................................................................Federal Home Loan Mortgage Corporation 8% 0.00 1,016 973 2022-12-01Federal National Mortgage Association 6% 0.00 1,016 941 2032-05-01Federal National Mortgage Association 6.5% 0.00 1,016 927 2031-05-01Federal National Mortgage Association 7% 0.00 1,016 969 2026-07-01Federal Home Loan Mortgage Corporation 6% 0.00 1,015 934 2029-02-01................................................................................................................................................................................................................................................................................................Federal Home Loan Mortgage Corporation 8% 0.00 1,011 1,009 2025-07-01Federal Home Loan Mortgage Corporation 6.5% 0.00 1,008 911 2031-08-01Federal National Mortgage Association 6.5% 0.00 1,008 919 2031-11-01Federal Home Loan Mortgage Corporation 7.5% 0.00 1,007 1,006 2026-02-01Federal National Mortgage Association 6.5% 0.00 1,006 917 2029-06-01................................................................................................................................................................................................................................................................................................Federal National Mortgage Association 6% 0.00 1,005 992 2021-09-01Federal Home Loan Mortgage Corporation 6.5% 0.00 1,003 907 2026-04-01Federal National Mortgage Association 7% 0.00 1,003 1,000 2023-11-01Federal Home Loan Mortgage Corporation 6.5% 0.00 1,002 906 2029-09-01Federal National Mortgage Association 7% 0.00 990 984 2026-01-01................................................................................................................................................................................................................................................................................................Government National Mortgage Association 8% 0.00 988 894 2029-12-15Federal National Mortgage Association 6% 0.00 980 973 2021-08-01Federal National Mortgage Association 8% 0.00 978 973 2023-09-01Government National Mortgage Association 7.5% 0.00 978 948 2029-05-15Federal National Mortgage Association 7% 0.00 976 859 2031-04-01Government National Mortgage Association 8% 0.00 973 971 2027-05-15Government National Mortgage Association 8.5% 0.00 971 968 2021-11-15Federal Home Loan Mortgage Corporation 6.5% 0.00 970 877 2029-05-01Federal Home Loan Mortgage Corporation 6% 0.00 967 890 2024-01-01Federal National Mortgage Association 6.5% 0.00 965 880 2026-01-01................................................................................................................................................................................................................................................................................................Federal National Mortgage Association 6% 0.00 963 890 2031-07-01Federal Home Loan Mortgage Corporation 7.5% 0.00 962 894 2026-01-01Government National Mortgage Association 8% 0.00 955 953 2026-10-15Federal National Mortgage Association 7% 0.00 953 941 2029-10-01Government National Mortgage Association 8% 0.00 952 898 2024-11-15................................................................................................................................................................................................................................................................................................Federal Home Loan Mortgage Corporation 7% 0.00 941 908 2030-09-01Federal Home Loan Mortgage Corporation 5% 0.00 940 931 2022-02-01Federal Home Loan Mortgage Corporation 6.5% 0.00 940 850 2029-02-01Federal Home Loan Mortgage Corporation 8% 0.00 936 934 2023-02-01Federal National Mortgage Association 6.5% 0.00 933 851 2024-04-01................................................................................................................................................................................................................................................................................................Government National Mortgage Association 6% 0.00 925 856 2024-01-15Federal National Mortgage Association 6.5% 0.00 914 834 2026-03-01Government National Mortgage Association 8% 0.00 914 876 2022-12-15Federal Home Loan Mortgage Corporation 6.5% 0.00 912 824 2024-01-01Federal National Mortgage Association 7% 0.00 910 900 2022-09-01................................................................................................................................................................................................................................................................................................
©2018 Morningstar, Inc., Morningstar Investment Profiles™ 312-696-6000. All rights reserved. The information contained herein: (1) is proprietary to Morningstar and/or its content providers; (2) maynot be copied or distributed and (3) is not warranted to be accurate, complete or timely. Neither Morningstar nor its content providers are responsible for any damages or losses arising from any use ofinformation. Past performance is no guarantee of future performance. Visit our investment website at www.morningstar.com ß
®
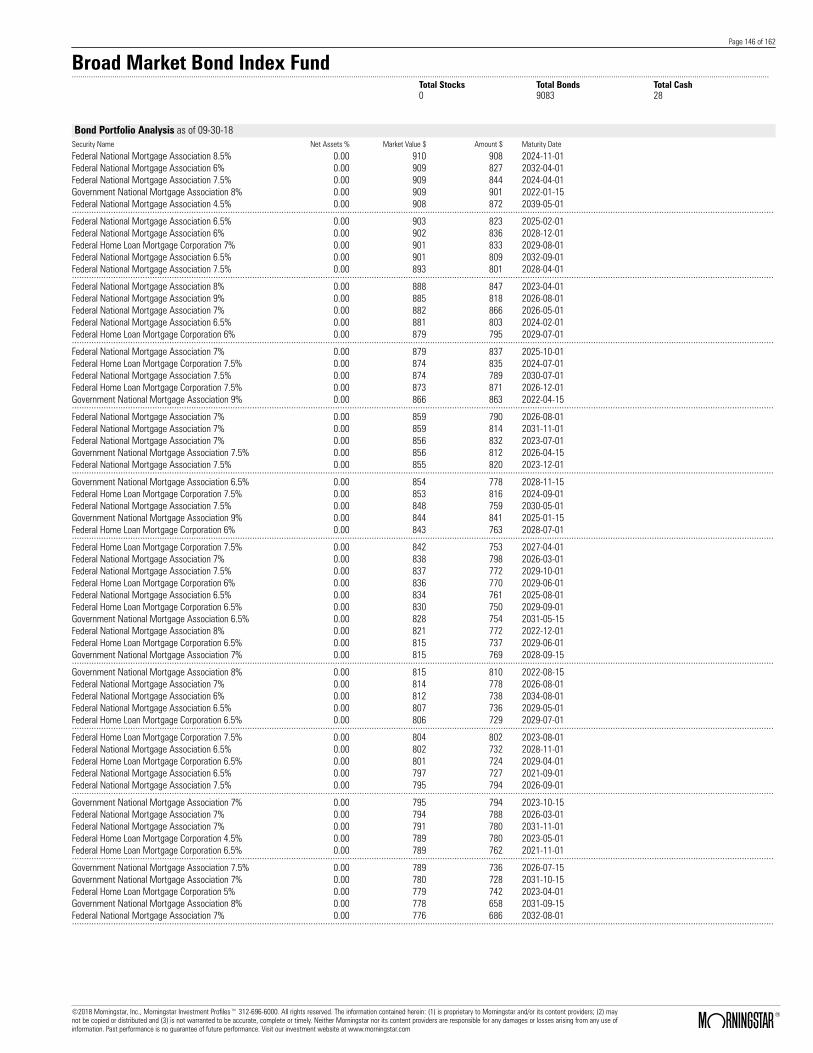
Page 146 of 162
Broad Market Bond Index Fund.......................................................................................................................................................................................................................................................................................................................................
Total Stocks Total Bonds Total Cash0 9083 28
Bond Portfolio Analysis as of 09-30-18Security Name Net Assets % Market Value $ Amount $ Maturity Date
Federal National Mortgage Association 8.5% 0.00 910 908 2024-11-01Federal National Mortgage Association 6% 0.00 909 827 2032-04-01Federal National Mortgage Association 7.5% 0.00 909 844 2024-04-01Government National Mortgage Association 8% 0.00 909 901 2022-01-15Federal National Mortgage Association 4.5% 0.00 908 872 2039-05-01................................................................................................................................................................................................................................................................................................Federal National Mortgage Association 6.5% 0.00 903 823 2025-02-01Federal National Mortgage Association 6% 0.00 902 836 2028-12-01Federal Home Loan Mortgage Corporation 7% 0.00 901 833 2029-08-01Federal National Mortgage Association 6.5% 0.00 901 809 2032-09-01Federal National Mortgage Association 7.5% 0.00 893 801 2028-04-01................................................................................................................................................................................................................................................................................................Federal National Mortgage Association 8% 0.00 888 847 2023-04-01Federal National Mortgage Association 9% 0.00 885 818 2026-08-01Federal National Mortgage Association 7% 0.00 882 866 2026-05-01Federal National Mortgage Association 6.5% 0.00 881 803 2024-02-01Federal Home Loan Mortgage Corporation 6% 0.00 879 795 2029-07-01................................................................................................................................................................................................................................................................................................Federal National Mortgage Association 7% 0.00 879 837 2025-10-01Federal Home Loan Mortgage Corporation 7.5% 0.00 874 835 2024-07-01Federal National Mortgage Association 7.5% 0.00 874 789 2030-07-01Federal Home Loan Mortgage Corporation 7.5% 0.00 873 871 2026-12-01Government National Mortgage Association 9% 0.00 866 863 2022-04-15................................................................................................................................................................................................................................................................................................Federal National Mortgage Association 7% 0.00 859 790 2026-08-01Federal National Mortgage Association 7% 0.00 859 814 2031-11-01Federal National Mortgage Association 7% 0.00 856 832 2023-07-01Government National Mortgage Association 7.5% 0.00 856 812 2026-04-15Federal National Mortgage Association 7.5% 0.00 855 820 2023-12-01................................................................................................................................................................................................................................................................................................Government National Mortgage Association 6.5% 0.00 854 778 2028-11-15Federal Home Loan Mortgage Corporation 7.5% 0.00 853 816 2024-09-01Federal National Mortgage Association 7.5% 0.00 848 759 2030-05-01Government National Mortgage Association 9% 0.00 844 841 2025-01-15Federal Home Loan Mortgage Corporation 6% 0.00 843 763 2028-07-01................................................................................................................................................................................................................................................................................................Federal Home Loan Mortgage Corporation 7.5% 0.00 842 753 2027-04-01Federal National Mortgage Association 7% 0.00 838 798 2026-03-01Federal National Mortgage Association 7.5% 0.00 837 772 2029-10-01Federal Home Loan Mortgage Corporation 6% 0.00 836 770 2029-06-01Federal National Mortgage Association 6.5% 0.00 834 761 2025-08-01Federal Home Loan Mortgage Corporation 6.5% 0.00 830 750 2029-09-01Government National Mortgage Association 6.5% 0.00 828 754 2031-05-15Federal National Mortgage Association 8% 0.00 821 772 2022-12-01Federal Home Loan Mortgage Corporation 6.5% 0.00 815 737 2029-06-01Government National Mortgage Association 7% 0.00 815 769 2028-09-15................................................................................................................................................................................................................................................................................................Government National Mortgage Association 8% 0.00 815 810 2022-08-15Federal National Mortgage Association 7% 0.00 814 778 2026-08-01Federal National Mortgage Association 6% 0.00 812 738 2034-08-01Federal National Mortgage Association 6.5% 0.00 807 736 2029-05-01Federal Home Loan Mortgage Corporation 6.5% 0.00 806 729 2029-07-01................................................................................................................................................................................................................................................................................................Federal Home Loan Mortgage Corporation 7.5% 0.00 804 802 2023-08-01Federal National Mortgage Association 6.5% 0.00 802 732 2028-11-01Federal Home Loan Mortgage Corporation 6.5% 0.00 801 724 2029-04-01Federal National Mortgage Association 6.5% 0.00 797 727 2021-09-01Federal National Mortgage Association 7.5% 0.00 795 794 2026-09-01................................................................................................................................................................................................................................................................................................Government National Mortgage Association 7% 0.00 795 794 2023-10-15Federal National Mortgage Association 7% 0.00 794 788 2026-03-01Federal National Mortgage Association 7% 0.00 791 780 2031-11-01Federal Home Loan Mortgage Corporation 4.5% 0.00 789 780 2023-05-01Federal Home Loan Mortgage Corporation 6.5% 0.00 789 762 2021-11-01................................................................................................................................................................................................................................................................................................Government National Mortgage Association 7.5% 0.00 789 736 2026-07-15Government National Mortgage Association 7% 0.00 780 728 2031-10-15Federal Home Loan Mortgage Corporation 5% 0.00 779 742 2023-04-01Government National Mortgage Association 8% 0.00 778 658 2031-09-15Federal National Mortgage Association 7% 0.00 776 686 2032-08-01................................................................................................................................................................................................................................................................................................
©2018 Morningstar, Inc., Morningstar Investment Profiles™ 312-696-6000. All rights reserved. The information contained herein: (1) is proprietary to Morningstar and/or its content providers; (2) maynot be copied or distributed and (3) is not warranted to be accurate, complete or timely. Neither Morningstar nor its content providers are responsible for any damages or losses arising from any use ofinformation. Past performance is no guarantee of future performance. Visit our investment website at www.morningstar.com ß
®

Page 147 of 162
Broad Market Bond Index Fund.......................................................................................................................................................................................................................................................................................................................................
Total Stocks Total Bonds Total Cash0 9083 28
Bond Portfolio Analysis as of 09-30-18Security Name Net Assets % Market Value $ Amount $ Maturity Date
Federal National Mortgage Association 7% 0.00 769 769 2024-09-01Federal Home Loan Mortgage Corporation 8% 0.00 767 713 2025-10-01Government National Mortgage Association 6% 0.00 766 709 2032-01-15Federal National Mortgage Association 5.5% 0.00 764 761 2019-08-01Federal National Mortgage Association 8% 0.00 763 718 2024-06-01................................................................................................................................................................................................................................................................................................Federal National Mortgage Association 7.5% 0.00 762 726 2023-02-01Federal National Mortgage Association 7% 0.00 761 705 2025-12-01Federal Home Loan Mortgage Corporation 6.5% 0.00 760 687 2029-07-01Federal National Mortgage Association 7% 0.00 759 718 2029-09-01Government National Mortgage Association 7% 0.00 756 723 2028-06-15................................................................................................................................................................................................................................................................................................Federal Home Loan Mortgage Corporation 4.5% 0.00 755 728 2034-03-01Federal National Mortgage Association 7% 0.00 749 737 2029-12-01Government National Mortgage Association 8.5% 0.00 749 741 2024-08-15Government National Mortgage Association 6.5% 0.00 747 681 2028-10-15Government National Mortgage Association 7% 0.00 747 724 2029-04-15................................................................................................................................................................................................................................................................................................Federal Home Loan Mortgage Corporation 7% 0.00 744 678 2032-04-01Federal Home Loan Mortgage Corporation 4% 0.00 738 723 2019-01-01Federal National Mortgage Association 6% 0.00 735 677 2029-01-01Federal National Mortgage Association 5.5% 0.00 734 731 2019-08-01Federal National Mortgage Association 7.5% 0.00 734 733 2030-08-01................................................................................................................................................................................................................................................................................................Government National Mortgage Association 6.5% 0.00 731 667 2031-07-15Federal Home Loan Mortgage Corporation 6.5% 0.00 726 657 2024-06-01Federal National Mortgage Association 6.5% 0.00 724 661 2029-07-01Federal National Mortgage Association 7% 0.00 724 690 2025-11-01Federal Home Loan Mortgage Corporation 6% 0.00 723 666 2029-03-01................................................................................................................................................................................................................................................................................................Government National Mortgage Association 6.5% 0.00 722 658 2024-04-15Federal National Mortgage Association 7% 0.00 721 707 2026-06-01Federal National Mortgage Association 6% 0.00 716 651 2029-05-01Federal National Mortgage Association 7.5% 0.00 716 713 2019-11-01Government National Mortgage Association 9.5% 0.00 716 705 2025-04-15Federal National Mortgage Association 6% 0.00 715 657 2036-02-01Federal National Mortgage Association 6.5% 0.00 714 651 2028-10-01Federal Home Loan Mortgage Corporation 9% 0.00 713 659 2025-03-01Federal National Mortgage Association 5% 0.00 711 690 2019-10-01Government National Mortgage Association 9% 0.00 711 705 2020-01-15................................................................................................................................................................................................................................................................................................Federal National Mortgage Association 7.5% 0.00 707 648 2027-12-01Federal National Mortgage Association 6% 0.00 705 653 2032-06-01Government National Mortgage Association 9% 0.00 702 700 2025-04-15Federal National Mortgage Association 6% 0.00 700 636 2029-05-01Federal National Mortgage Association 8% 0.00 695 637 2025-07-01................................................................................................................................................................................................................................................................................................Federal National Mortgage Association 5.5% 0.00 691 691 2019-03-01Federal National Mortgage Association 6.5% 0.00 691 630 2029-03-01Government National Mortgage Association 7% 0.00 689 643 2029-10-15Federal Home Loan Mortgage Corporation 8% 0.00 682 633 2027-10-01Federal National Mortgage Association 7.5% 0.00 682 649 2023-06-01................................................................................................................................................................................................................................................................................................Federal National Mortgage Association 7.5% 0.00 681 626 2029-09-01Federal National Mortgage Association 6.5% 0.00 679 619 2027-11-01Government National Mortgage Association 7.5% 0.00 678 676 2025-08-15Federal National Mortgage Association 5% 0.00 672 633 2033-07-01Federal National Mortgage Association 7.5% 0.00 671 615 2031-06-01................................................................................................................................................................................................................................................................................................Federal Home Loan Mortgage Corporation 8% 0.00 668 632 2024-08-01Federal Home Loan Mortgage Corporation 8.5% 0.00 666 612 2027-06-01Federal National Mortgage Association 7% 0.00 659 656 2023-10-01Government National Mortgage Association 7% 0.00 658 652 2028-06-15Federal National Mortgage Association 6.5% 0.00 654 596 2026-04-01................................................................................................................................................................................................................................................................................................Government National Mortgage Association 10% 0.00 651 649 2020-09-15Federal Home Loan Mortgage Corporation 7% 0.00 649 642 2026-02-01Federal Home Loan Mortgage Corporation 8% 0.00 648 614 2022-09-01Federal Home Loan Mortgage Corporation 7% 0.00 644 610 2023-06-01Federal National Mortgage Association 7% 0.00 644 596 2032-07-01................................................................................................................................................................................................................................................................................................
©2018 Morningstar, Inc., Morningstar Investment Profiles™ 312-696-6000. All rights reserved. The information contained herein: (1) is proprietary to Morningstar and/or its content providers; (2) maynot be copied or distributed and (3) is not warranted to be accurate, complete or timely. Neither Morningstar nor its content providers are responsible for any damages or losses arising from any use ofinformation. Past performance is no guarantee of future performance. Visit our investment website at www.morningstar.com ß
®
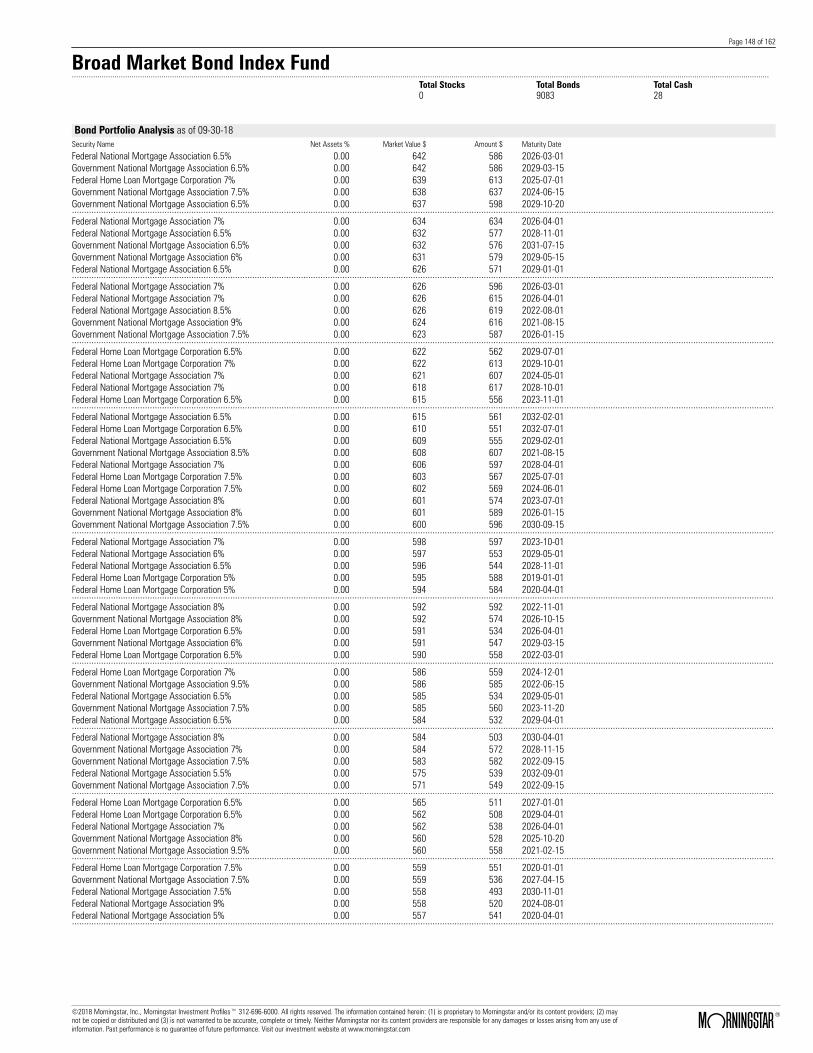
Page 148 of 162
Broad Market Bond Index Fund.......................................................................................................................................................................................................................................................................................................................................
Total Stocks Total Bonds Total Cash0 9083 28
Bond Portfolio Analysis as of 09-30-18Security Name Net Assets % Market Value $ Amount $ Maturity Date
Federal National Mortgage Association 6.5% 0.00 642 586 2026-03-01Government National Mortgage Association 6.5% 0.00 642 586 2029-03-15Federal Home Loan Mortgage Corporation 7% 0.00 639 613 2025-07-01Government National Mortgage Association 7.5% 0.00 638 637 2024-06-15Government National Mortgage Association 6.5% 0.00 637 598 2029-10-20................................................................................................................................................................................................................................................................................................Federal National Mortgage Association 7% 0.00 634 634 2026-04-01Federal National Mortgage Association 6.5% 0.00 632 577 2028-11-01Government National Mortgage Association 6.5% 0.00 632 576 2031-07-15Government National Mortgage Association 6% 0.00 631 579 2029-05-15Federal National Mortgage Association 6.5% 0.00 626 571 2029-01-01................................................................................................................................................................................................................................................................................................Federal National Mortgage Association 7% 0.00 626 596 2026-03-01Federal National Mortgage Association 7% 0.00 626 615 2026-04-01Federal National Mortgage Association 8.5% 0.00 626 619 2022-08-01Government National Mortgage Association 9% 0.00 624 616 2021-08-15Government National Mortgage Association 7.5% 0.00 623 587 2026-01-15................................................................................................................................................................................................................................................................................................Federal Home Loan Mortgage Corporation 6.5% 0.00 622 562 2029-07-01Federal Home Loan Mortgage Corporation 7% 0.00 622 613 2029-10-01Federal National Mortgage Association 7% 0.00 621 607 2024-05-01Federal National Mortgage Association 7% 0.00 618 617 2028-10-01Federal Home Loan Mortgage Corporation 6.5% 0.00 615 556 2023-11-01................................................................................................................................................................................................................................................................................................Federal National Mortgage Association 6.5% 0.00 615 561 2032-02-01Federal Home Loan Mortgage Corporation 6.5% 0.00 610 551 2032-07-01Federal National Mortgage Association 6.5% 0.00 609 555 2029-02-01Government National Mortgage Association 8.5% 0.00 608 607 2021-08-15Federal National Mortgage Association 7% 0.00 606 597 2028-04-01Federal Home Loan Mortgage Corporation 7.5% 0.00 603 567 2025-07-01Federal Home Loan Mortgage Corporation 7.5% 0.00 602 569 2024-06-01Federal National Mortgage Association 8% 0.00 601 574 2023-07-01Government National Mortgage Association 8% 0.00 601 589 2026-01-15Government National Mortgage Association 7.5% 0.00 600 596 2030-09-15................................................................................................................................................................................................................................................................................................Federal National Mortgage Association 7% 0.00 598 597 2023-10-01Federal National Mortgage Association 6% 0.00 597 553 2029-05-01Federal National Mortgage Association 6.5% 0.00 596 544 2028-11-01Federal Home Loan Mortgage Corporation 5% 0.00 595 588 2019-01-01Federal Home Loan Mortgage Corporation 5% 0.00 594 584 2020-04-01................................................................................................................................................................................................................................................................................................Federal National Mortgage Association 8% 0.00 592 592 2022-11-01Government National Mortgage Association 8% 0.00 592 574 2026-10-15Federal Home Loan Mortgage Corporation 6.5% 0.00 591 534 2026-04-01Government National Mortgage Association 6% 0.00 591 547 2029-03-15Federal Home Loan Mortgage Corporation 6.5% 0.00 590 558 2022-03-01................................................................................................................................................................................................................................................................................................Federal Home Loan Mortgage Corporation 7% 0.00 586 559 2024-12-01Government National Mortgage Association 9.5% 0.00 586 585 2022-06-15Federal National Mortgage Association 6.5% 0.00 585 534 2029-05-01Government National Mortgage Association 7.5% 0.00 585 560 2023-11-20Federal National Mortgage Association 6.5% 0.00 584 532 2029-04-01................................................................................................................................................................................................................................................................................................Federal National Mortgage Association 8% 0.00 584 503 2030-04-01Government National Mortgage Association 7% 0.00 584 572 2028-11-15Government National Mortgage Association 7.5% 0.00 583 582 2022-09-15Federal National Mortgage Association 5.5% 0.00 575 539 2032-09-01Government National Mortgage Association 7.5% 0.00 571 549 2022-09-15................................................................................................................................................................................................................................................................................................Federal Home Loan Mortgage Corporation 6.5% 0.00 565 511 2027-01-01Federal Home Loan Mortgage Corporation 6.5% 0.00 562 508 2029-04-01Federal National Mortgage Association 7% 0.00 562 538 2026-04-01Government National Mortgage Association 8% 0.00 560 528 2025-10-20Government National Mortgage Association 9.5% 0.00 560 558 2021-02-15................................................................................................................................................................................................................................................................................................Federal Home Loan Mortgage Corporation 7.5% 0.00 559 551 2020-01-01Government National Mortgage Association 7.5% 0.00 559 536 2027-04-15Federal National Mortgage Association 7.5% 0.00 558 493 2030-11-01Federal National Mortgage Association 9% 0.00 558 520 2024-08-01Federal National Mortgage Association 5% 0.00 557 541 2020-04-01................................................................................................................................................................................................................................................................................................
©2018 Morningstar, Inc., Morningstar Investment Profiles™ 312-696-6000. All rights reserved. The information contained herein: (1) is proprietary to Morningstar and/or its content providers; (2) maynot be copied or distributed and (3) is not warranted to be accurate, complete or timely. Neither Morningstar nor its content providers are responsible for any damages or losses arising from any use ofinformation. Past performance is no guarantee of future performance. Visit our investment website at www.morningstar.com ß
®

Page 149 of 162
Broad Market Bond Index Fund.......................................................................................................................................................................................................................................................................................................................................
Total Stocks Total Bonds Total Cash0 9083 28
Bond Portfolio Analysis as of 09-30-18Security Name Net Assets % Market Value $ Amount $ Maturity Date
Federal Home Loan Mortgage Corporation 7% 0.00 553 552 2030-02-01Federal National Mortgage Association 6.5% 0.00 553 504 2024-01-01Federal National Mortgage Association 6.5% 0.00 553 504 2031-08-01Federal Home Loan Mortgage Corporation 6.5% 0.00 551 498 2029-06-01Federal National Mortgage Association 6.5% 0.00 551 503 2024-04-01................................................................................................................................................................................................................................................................................................Federal National Mortgage Association 7% 0.00 550 515 2029-08-01Government National Mortgage Association 7% 0.00 549 541 2029-03-15Federal Home Loan Mortgage Corporation 6.5% 0.00 548 495 2024-02-01Federal National Mortgage Association 6% 0.00 547 507 2029-03-01Federal Home Loan Mortgage Corporation 4% 0.00 546 535 2019-01-01................................................................................................................................................................................................................................................................................................Federal Home Loan Mortgage Corporation 8% 0.00 545 509 2024-07-01Government National Mortgage Association 6.5% 0.00 543 495 2026-04-15Federal National Mortgage Association 7% 0.00 542 506 2031-09-01Government National Mortgage Association 9.5% 0.00 540 539 2019-11-15Federal Home Loan Mortgage Corporation 7.5% 0.00 537 496 2031-02-01................................................................................................................................................................................................................................................................................................Federal National Mortgage Association 7% 0.00 537 508 2027-09-01Federal Home Loan Mortgage Corporation 7.5% 0.00 535 486 2027-01-01Federal National Mortgage Association 9% 0.00 535 500 2024-08-01Federal National Mortgage Association 8.5% 0.00 533 498 2025-08-01Government National Mortgage Association 6.5% 0.00 533 486 2026-04-15Federal National Mortgage Association 8% 0.00 531 458 2030-01-01Federal National Mortgage Association 5% 0.00 530 502 2039-07-01Government National Mortgage Association 7% 0.00 526 507 2023-05-15Government National Mortgage Association 8% 0.00 524 523 2029-12-15Federal National Mortgage Association 6% 0.00 523 484 2028-02-01................................................................................................................................................................................................................................................................................................Government National Mortgage Association 7% 0.00 521 508 2023-06-15Federal Home Loan Mortgage Corporation 7% 0.00 519 495 2024-05-01Federal Home Loan Mortgage Corporation 8% 0.00 518 473 2026-07-01Government National Mortgage Association 8% 0.00 518 503 2029-12-15Federal Home Loan Mortgage Corporation 6.5% 0.00 516 466 2026-05-01................................................................................................................................................................................................................................................................................................Federal National Mortgage Association 7% 0.00 514 455 2031-02-01Federal National Mortgage Association 7% 0.00 514 514 2021-08-01Government National Mortgage Association 6.5% 0.00 513 468 2028-10-15Government National Mortgage Association 9% 0.00 513 495 2026-07-15Federal National Mortgage Association 6.5% 0.00 511 466 2028-09-01................................................................................................................................................................................................................................................................................................Federal National Mortgage Association 6% 0.00 509 464 2028-12-01Government National Mortgage Association 7.5% 0.00 508 502 2023-11-15Federal National Mortgage Association 8% 0.00 507 506 2025-07-01Federal National Mortgage Association 6% 0.00 505 468 2028-10-01Government National Mortgage Association 8% 0.00 505 501 2022-05-15................................................................................................................................................................................................................................................................................................Federal Home Loan Mortgage Corporation 4.5% 0.00 503 497 2020-09-01Federal Home Loan Mortgage Corporation 6.5% 0.00 502 454 2019-04-01Government National Mortgage Association 7% 0.00 501 484 2023-10-15Federal Home Loan Mortgage Corporation 6% 0.00 500 460 2031-03-01Federal National Mortgage Association 9% 0.00 498 463 2025-04-01................................................................................................................................................................................................................................................................................................Federal Home Loan Mortgage Corporation 4.5% 0.00 496 489 2020-09-01Government National Mortgage Association 9.5% 0.00 495 493 2020-06-15Federal National Mortgage Association 7% 0.00 494 477 2025-10-01Federal Home Loan Mortgage Corporation 7.5% 0.00 492 492 2024-04-01Federal National Mortgage Association 7.5% 0.00 492 462 2027-07-01................................................................................................................................................................................................................................................................................................Government National Mortgage Association 7% 0.00 490 467 2026-03-15Federal Home Loan Mortgage Corporation 8.5% 0.00 487 455 2024-12-01Federal National Mortgage Association 5% 0.00 487 459 2035-11-01Federal National Mortgage Association 6% 0.00 484 448 2028-03-01Federal National Mortgage Association 7% 0.00 484 453 2030-05-01................................................................................................................................................................................................................................................................................................Federal Home Loan Mortgage Corporation 5.5% 0.00 482 476 2020-11-01Government National Mortgage Association 7% 0.00 475 459 2029-08-15Federal Home Loan Mortgage Corporation 8.5% 0.00 473 472 2025-04-01Federal Home Loan Mortgage Corporation 9% 0.00 473 446 2025-07-01Federal National Mortgage Association 6.5% 0.00 473 431 2026-03-01................................................................................................................................................................................................................................................................................................
©2018 Morningstar, Inc., Morningstar Investment Profiles™ 312-696-6000. All rights reserved. The information contained herein: (1) is proprietary to Morningstar and/or its content providers; (2) maynot be copied or distributed and (3) is not warranted to be accurate, complete or timely. Neither Morningstar nor its content providers are responsible for any damages or losses arising from any use ofinformation. Past performance is no guarantee of future performance. Visit our investment website at www.morningstar.com ß
®

Page 150 of 162
Broad Market Bond Index Fund.......................................................................................................................................................................................................................................................................................................................................
Total Stocks Total Bonds Total Cash0 9083 28
Bond Portfolio Analysis as of 09-30-18Security Name Net Assets % Market Value $ Amount $ Maturity Date
Federal National Mortgage Association 7.5% 0.00 473 415 2030-09-01Federal National Mortgage Association 6.5% 0.00 472 431 2026-03-01Government National Mortgage Association 7.5% 0.00 471 468 2028-06-15Federal National Mortgage Association 8.5% 0.00 470 442 2025-11-01Federal Home Loan Mortgage Corporation 6.5% 0.00 468 423 2024-02-01................................................................................................................................................................................................................................................................................................Federal Home Loan Mortgage Corporation 4.5% 0.00 465 459 2019-05-01Federal Home Loan Mortgage Corporation 6.5% 0.00 464 420 2023-12-01Federal National Mortgage Association 5% 0.00 463 441 2033-12-01Federal Home Loan Mortgage Corporation 6% 0.00 461 454 2021-10-01Federal National Mortgage Association 6.5% 0.00 461 421 2028-09-01................................................................................................................................................................................................................................................................................................Government National Mortgage Association 6.5% 0.00 461 420 2024-05-15Government National Mortgage Association 8% 0.00 461 459 2021-11-15Federal National Mortgage Association 6.5% 0.00 460 419 2025-11-01Federal National Mortgage Association 6.5% 0.00 460 420 2028-11-01Federal National Mortgage Association 7.5% 0.00 458 419 2032-02-01Government National Mortgage Association 7% 0.00 456 430 2028-10-15Government National Mortgage Association 7% 0.00 455 452 2026-06-15Federal Home Loan Mortgage Corporation 7.5% 0.00 453 452 2022-10-01Government National Mortgage Association 8% 0.00 453 427 2024-09-15Federal Home Loan Mortgage Corporation 6.5% 0.00 451 408 2029-01-01................................................................................................................................................................................................................................................................................................Federal National Mortgage Association 6.5% 0.00 450 410 2032-01-01Federal Home Loan Mortgage Corporation 6% 0.00 449 413 2029-06-01Government National Mortgage Association 8% 0.00 449 434 2022-09-15Federal Home Loan Mortgage Corporation 8.5% 0.00 448 443 2022-07-01Federal National Mortgage Association 9% 0.00 447 408 2026-06-01................................................................................................................................................................................................................................................................................................Federal National Mortgage Association 7% 0.00 445 445 2026-04-01Federal Home Loan Mortgage Corporation 7.5% 0.00 443 420 2026-01-01Federal National Mortgage Association 7% 0.00 442 442 2024-01-01Federal Home Loan Mortgage Corporation 7% 0.00 439 396 2029-02-01Federal National Mortgage Association 7.5% 0.00 439 405 2029-12-01................................................................................................................................................................................................................................................................................................Government National Mortgage Association 7.5% 0.00 438 414 2026-03-15Federal National Mortgage Association 7% 0.00 437 422 2023-11-01Federal National Mortgage Association 6% 0.00 436 404 2032-02-01Federal National Mortgage Association 7% 0.00 434 405 2024-12-01Federal National Mortgage Association 8% 0.00 433 415 2025-12-01................................................................................................................................................................................................................................................................................................Federal Home Loan Mortgage Corporation 7.5% 0.00 430 429 2026-09-01Federal National Mortgage Association 7% 0.00 430 413 2024-07-01Federal National Mortgage Association 6% 0.00 429 397 2029-01-01Federal National Mortgage Association 7% 0.00 429 424 2027-06-01Federal National Mortgage Association 6.5% 0.00 428 390 2029-04-01................................................................................................................................................................................................................................................................................................Federal National Mortgage Association 6.5% 0.00 426 388 2028-12-01Federal National Mortgage Association 7% 0.00 426 425 2023-12-01Federal National Mortgage Association 7% 0.00 423 423 2023-12-01Government National Mortgage Association 7% 0.00 422 421 2024-03-15Government National Mortgage Association 7% 0.00 420 417 2027-11-15................................................................................................................................................................................................................................................................................................Government National Mortgage Association 8% 0.00 418 396 2024-02-15Government National Mortgage Association 8% 0.00 416 413 2030-07-15Federal Home Loan Mortgage Corporation 7.5% 0.00 415 412 2031-02-01Government National Mortgage Association 8% 0.00 414 413 2030-05-15Federal National Mortgage Association 7% 0.00 413 406 2026-06-01................................................................................................................................................................................................................................................................................................Federal National Mortgage Association 8% 0.00 413 386 2026-12-01Government National Mortgage Association 6% 0.00 413 383 2026-04-15Federal Home Loan Mortgage Corporation 7.5% 0.00 412 364 2029-08-01Federal National Mortgage Association 7% 0.00 412 388 2023-11-01Federal Home Loan Mortgage Corporation 8% 0.00 410 387 2024-09-01................................................................................................................................................................................................................................................................................................Federal National Mortgage Association 8% 0.00 410 410 2026-12-01Government National Mortgage Association 9% 0.00 409 407 2024-09-15Federal National Mortgage Association 6.5% 0.00 408 372 2029-06-01Government National Mortgage Association 6.5% 0.00 407 371 2024-04-15Federal National Mortgage Association 6.5% 0.00 406 370 2029-04-01................................................................................................................................................................................................................................................................................................
©2018 Morningstar, Inc., Morningstar Investment Profiles™ 312-696-6000. All rights reserved. The information contained herein: (1) is proprietary to Morningstar and/or its content providers; (2) maynot be copied or distributed and (3) is not warranted to be accurate, complete or timely. Neither Morningstar nor its content providers are responsible for any damages or losses arising from any use ofinformation. Past performance is no guarantee of future performance. Visit our investment website at www.morningstar.com ß
®

Page 151 of 162
Broad Market Bond Index Fund.......................................................................................................................................................................................................................................................................................................................................
Total Stocks Total Bonds Total Cash0 9083 28
Bond Portfolio Analysis as of 09-30-18Security Name Net Assets % Market Value $ Amount $ Maturity Date
Federal National Mortgage Association 6.5% 0.00 404 368 2028-10-01Government National Mortgage Association 9% 0.00 404 403 2022-01-15Federal National Mortgage Association 8.5% 0.00 402 375 2024-09-01Federal Home Loan Mortgage Corporation 6.5% 0.00 399 360 2028-03-01Government National Mortgage Association 8% 0.00 398 397 2029-11-15................................................................................................................................................................................................................................................................................................Federal Home Loan Mortgage Corporation 7.5% 0.00 397 369 2031-02-01Federal National Mortgage Association 7.5% 0.00 396 368 2028-07-01Federal National Mortgage Association 9% 0.00 396 386 2020-04-01Government National Mortgage Association 6.5% 0.00 396 361 2033-02-15Federal National Mortgage Association 6.5% 0.00 394 360 2029-03-01Government National Mortgage Association 7% 0.00 393 378 2023-11-15Government National Mortgage Association 8% 0.00 393 392 2022-08-15Government National Mortgage Association 8% 0.00 393 392 2023-03-15Government National Mortgage Association 7% 0.00 392 384 2028-04-15Federal National Mortgage Association 6.5% 0.00 391 357 2023-08-01................................................................................................................................................................................................................................................................................................Federal National Mortgage Association 7.5% 0.00 391 376 2024-04-01Federal National Mortgage Association 7% 0.00 390 376 2030-12-01Federal Home Loan Mortgage Corporation 7% 0.00 389 387 2019-06-01Government National Mortgage Association 8% 0.00 387 382 2029-12-15Federal National Mortgage Association 7.5% 0.00 386 385 2028-03-01................................................................................................................................................................................................................................................................................................Federal National Mortgage Association 6.5% 0.00 385 351 2028-09-01Government National Mortgage Association 7% 0.00 381 380 2023-11-15Government National Mortgage Association 9% 0.00 381 380 2022-05-15Federal Home Loan Mortgage Corporation 7% 0.00 380 368 2023-03-01Federal National Mortgage Association 6.5% 0.00 380 346 2029-07-01................................................................................................................................................................................................................................................................................................Government National Mortgage Association 6.5% 0.00 380 346 2032-09-15Federal Home Loan Mortgage Corporation 7.5% 0.00 378 371 2023-06-01Government National Mortgage Association 7.5% 0.00 376 367 2031-11-15Government National Mortgage Association 8% 0.00 376 376 2022-11-15Federal Home Loan Mortgage Corporation 6% 0.00 375 345 2029-04-01................................................................................................................................................................................................................................................................................................Federal National Mortgage Association 6.5% 0.00 374 341 2025-10-01Government National Mortgage Association 7.5% 0.00 373 365 2029-10-15Federal Home Loan Mortgage Corporation 8.5% 0.00 371 360 2026-08-01Federal National Mortgage Association 7.5% 0.00 371 334 2029-08-01Government National Mortgage Association 7% 0.00 369 348 2028-08-15................................................................................................................................................................................................................................................................................................Federal National Mortgage Association 6.5% 0.00 368 336 2028-11-01Government National Mortgage Association 9.5% 0.00 367 366 2020-11-15Government National Mortgage Association 8.5% 0.00 365 362 2019-11-15Federal National Mortgage Association 7.5% 0.00 364 348 2030-03-01Federal National Mortgage Association 8% 0.00 364 341 2025-06-01................................................................................................................................................................................................................................................................................................Government National Mortgage Association 8% 0.00 364 361 2029-11-15Federal National Mortgage Association 5% 0.00 362 352 2019-01-01Government National Mortgage Association 7.5% 0.00 361 358 2023-09-15Government National Mortgage Association 8% 0.00 361 358 2026-12-15Government National Mortgage Association 7% 0.00 360 347 2024-03-15................................................................................................................................................................................................................................................................................................Federal Home Loan Mortgage Corporation 6% 0.00 358 324 2028-04-01Federal National Mortgage Association 7.5% 0.00 354 335 2026-10-01Federal National Mortgage Association 7.5% 0.00 352 331 2023-05-01Federal National Mortgage Association 7% 0.00 351 340 2030-10-01Federal National Mortgage Association 7% 0.00 351 349 2026-08-01................................................................................................................................................................................................................................................................................................Federal National Mortgage Association 7.5% 0.00 351 337 2024-03-01Government National Mortgage Association 6.5% 0.00 350 319 2023-10-15Federal Home Loan Mortgage Corporation 6.5% 0.00 348 315 2026-05-01Federal National Mortgage Association 8% 0.00 348 348 2030-07-01Federal National Mortgage Association 8% 0.00 347 319 2031-01-01................................................................................................................................................................................................................................................................................................Government National Mortgage Association 7% 0.00 347 343 2026-05-15Government National Mortgage Association 9% 0.00 347 334 2021-10-15Government National Mortgage Association 8% 0.00 345 334 2029-12-15Federal National Mortgage Association 6.5% 0.00 341 311 2029-02-01Federal National Mortgage Association 8.5% 0.00 340 319 2025-05-01................................................................................................................................................................................................................................................................................................
©2018 Morningstar, Inc., Morningstar Investment Profiles™ 312-696-6000. All rights reserved. The information contained herein: (1) is proprietary to Morningstar and/or its content providers; (2) maynot be copied or distributed and (3) is not warranted to be accurate, complete or timely. Neither Morningstar nor its content providers are responsible for any damages or losses arising from any use ofinformation. Past performance is no guarantee of future performance. Visit our investment website at www.morningstar.com ß
®

Page 152 of 162
Broad Market Bond Index Fund.......................................................................................................................................................................................................................................................................................................................................
Total Stocks Total Bonds Total Cash0 9083 28
Bond Portfolio Analysis as of 09-30-18Security Name Net Assets % Market Value $ Amount $ Maturity Date
Federal National Mortgage Association 7% 0.00 338 333 2029-08-01Government National Mortgage Association 7% 0.00 338 328 2023-05-15Government National Mortgage Association 9.5% 0.00 338 337 2020-10-15Federal National Mortgage Association 7% 0.00 336 326 2023-01-01Government National Mortgage Association 7% 0.00 336 325 2023-08-15Federal National Mortgage Association 8% 0.00 335 314 2026-02-01Government National Mortgage Association 6.5% 0.00 332 302 2026-06-15Government National Mortgage Association 6.5% 0.00 331 301 2024-01-15Federal National Mortgage Association 7% 0.00 330 301 2031-12-01Federal National Mortgage Association 7.5% 0.00 329 326 2028-01-01................................................................................................................................................................................................................................................................................................Federal National Mortgage Association 7.5% 0.00 327 289 2031-03-01Government National Mortgage Association 7.5% 0.00 327 313 2023-09-15Government National Mortgage Association 7% 0.00 326 313 2026-03-15Federal National Mortgage Association 6% 0.00 325 296 2031-04-01Government National Mortgage Association 7.5% 0.00 325 319 2026-05-15................................................................................................................................................................................................................................................................................................Federal Home Loan Mortgage Corporation 7% 0.00 324 314 2023-03-01Government National Mortgage Association 8.5% 0.00 324 320 2030-12-15Federal National Mortgage Association 7.5% 0.00 323 306 2025-07-01Federal National Mortgage Association 6.5% 0.00 322 294 2029-05-01Federal Home Loan Mortgage Corporation 8% 0.00 320 319 2030-07-01................................................................................................................................................................................................................................................................................................Federal National Mortgage Association 6.5% 0.00 320 291 2031-07-01Federal National Mortgage Association 8% 0.00 319 288 2031-01-01Federal Home Loan Mortgage Corporation 7.5% 0.00 317 313 2025-09-01Federal National Mortgage Association 7% 0.00 317 311 2030-04-01Government National Mortgage Association 7% 0.00 317 313 2029-08-15................................................................................................................................................................................................................................................................................................Government National Mortgage Association 9.5% 0.00 314 310 2021-08-15Federal National Mortgage Association 5.5% 0.00 311 311 2019-02-01Government National Mortgage Association 7.5% 0.00 310 310 2029-03-15Government National Mortgage Association 8.5% 0.00 310 304 2030-10-15Government National Mortgage Association 6.5% 0.00 308 281 2029-01-15................................................................................................................................................................................................................................................................................................Federal National Mortgage Association 6.5% 0.00 305 278 2029-07-01Federal National Mortgage Association 6.5% 0.00 304 278 2032-02-01Government National Mortgage Association 7.5% 0.00 302 289 2024-02-15Federal National Mortgage Association 7% 0.00 301 298 2028-07-01Government National Mortgage Association 7% 0.00 301 291 2023-10-15................................................................................................................................................................................................................................................................................................Federal Home Loan Mortgage Corporation 8.5% 0.00 300 299 2020-06-01Government National Mortgage Association 8% 0.00 300 288 2023-05-15Government National Mortgage Association 8% 0.00 300 298 2023-12-15Government National Mortgage Association 7% 0.00 296 296 2024-01-15Federal National Mortgage Association 9% 0.00 295 294 2021-03-01................................................................................................................................................................................................................................................................................................Federal Home Loan Mortgage Corporation 7.5% 0.00 293 290 2023-08-01Federal National Mortgage Association 8% 0.00 293 264 2029-11-01Government National Mortgage Association 7.5% 0.00 292 288 2027-11-15Government National Mortgage Association 6% 0.00 289 267 2029-03-15Federal National Mortgage Association 7% 0.00 288 267 2026-03-01................................................................................................................................................................................................................................................................................................Federal National Mortgage Association 8% 0.00 287 271 2028-06-01Federal National Mortgage Association 6.5% 0.00 286 261 2027-12-01Government National Mortgage Association 9% 0.00 286 285 2021-08-15Government National Mortgage Association 7% 0.00 285 272 2028-01-15Government National Mortgage Association 8.5% 0.00 283 282 2021-08-15................................................................................................................................................................................................................................................................................................Federal National Mortgage Association 7% 0.00 282 269 2026-12-01Federal National Mortgage Association 8.5% 0.00 279 279 2020-03-01Government National Mortgage Association 7.5% 0.00 279 278 2023-08-15Federal National Mortgage Association 6% 0.00 275 250 2032-01-01Federal National Mortgage Association 6.5% 0.00 272 248 2031-07-01................................................................................................................................................................................................................................................................................................Federal Home Loan Mortgage Corporation 6% 0.00 271 248 2028-11-01Federal National Mortgage Association 7.5% 0.00 270 268 2026-02-01Government National Mortgage Association 8% 0.00 270 261 2030-07-15Federal Home Loan Mortgage Corporation 8.5% 0.00 269 249 2024-10-01Federal National Mortgage Association 6.5% 0.00 269 245 2031-12-01
©2018 Morningstar, Inc., Morningstar Investment Profiles™ 312-696-6000. All rights reserved. The information contained herein: (1) is proprietary to Morningstar and/or its content providers; (2) maynot be copied or distributed and (3) is not warranted to be accurate, complete or timely. Neither Morningstar nor its content providers are responsible for any damages or losses arising from any use ofinformation. Past performance is no guarantee of future performance. Visit our investment website at www.morningstar.com ß
®

Page 153 of 162
Broad Market Bond Index Fund.......................................................................................................................................................................................................................................................................................................................................
Total Stocks Total Bonds Total Cash0 9083 28
Bond Portfolio Analysis as of 09-30-18Security Name Net Assets % Market Value $ Amount $ Maturity Date
Federal National Mortgage Association 7% 0.00 268 262 2026-04-01Federal National Mortgage Association 4.5% 0.00 267 263 2020-11-01Government National Mortgage Association 6.5% 0.00 267 244 2026-03-15Federal National Mortgage Association 6% 0.00 265 265 2021-09-01Government National Mortgage Association 7.5% 0.00 262 251 2023-07-15................................................................................................................................................................................................................................................................................................Government National Mortgage Association 6.5% 0.00 261 238 2023-10-15Federal National Mortgage Association 6% 0.00 260 236 2034-01-01Government National Mortgage Association 10% 0.00 260 259 2021-01-15Federal National Mortgage Association 6% 0.00 259 240 2031-09-01Federal National Mortgage Association 7.5% 0.00 258 258 2025-07-01................................................................................................................................................................................................................................................................................................Federal Home Loan Mortgage Corporation 7% 0.00 257 237 2028-11-01Federal National Mortgage Association 7% 0.00 257 257 2023-10-01Federal Home Loan Mortgage Corporation 4% 0.00 256 250 2019-06-01Federal National Mortgage Association 7.5% 0.00 256 245 2025-04-01Government National Mortgage Association 7% 0.00 256 240 2029-08-15................................................................................................................................................................................................................................................................................................Federal National Mortgage Association 8% 0.00 255 254 2022-03-01Government National Mortgage Association 7% 0.00 255 246 2028-07-15Government National Mortgage Association 7.5% 0.00 255 250 2029-12-15Federal National Mortgage Association 6.5% 0.00 254 231 2024-05-01Federal Home Loan Mortgage Corporation 7% 0.00 253 253 2023-11-01................................................................................................................................................................................................................................................................................................Federal Home Loan Mortgage Corporation 7.5% 0.00 253 251 2029-11-01Government National Mortgage Association 6.5% 0.00 253 231 2023-11-15Federal Home Loan Mortgage Corporation 4% 0.00 251 246 2020-06-01Federal Home Loan Mortgage Corporation 6% 0.00 251 231 2024-01-01Federal National Mortgage Association 6.5% 0.00 250 228 2025-11-01................................................................................................................................................................................................................................................................................................Federal National Mortgage Association 9.5% 0.00 250 250 2022-01-01Government National Mortgage Association 7% 0.00 249 232 2029-08-15Government National Mortgage Association 9.5% 0.00 248 248 2019-09-15Federal National Mortgage Association 7% 0.00 244 244 2023-09-01Government National Mortgage Association 7.5% 0.00 240 227 2026-03-15................................................................................................................................................................................................................................................................................................Federal Home Loan Mortgage Corporation 7.5% 0.00 238 236 2022-05-01Federal Home Loan Mortgage Corporation 7.5% 0.00 237 219 2030-06-01Federal National Mortgage Association 6% 0.00 237 219 2023-12-01Government National Mortgage Association 7% 0.00 236 228 2024-01-15Government National Mortgage Association 9% 0.00 236 224 2022-01-15................................................................................................................................................................................................................................................................................................Federal National Mortgage Association 7% 0.00 235 235 2023-09-01Government National Mortgage Association 7.5% 0.00 235 216 2031-02-15Federal Home Loan Mortgage Corporation 6% 0.00 232 214 2029-04-01Federal National Mortgage Association 7% 0.00 232 229 2023-11-01Federal Home Loan Mortgage Corporation 7% 0.00 231 222 2023-10-01................................................................................................................................................................................................................................................................................................Federal Home Loan Mortgage Corporation 6.5% 0.00 227 205 2022-04-01Federal National Mortgage Association 6% 0.00 227 211 2024-03-01Federal National Mortgage Association 6% 0.00 226 222 2021-07-01Government National Mortgage Association 7.5% 0.00 226 212 2026-09-15Government National Mortgage Association 8.5% 0.00 225 224 2021-09-15................................................................................................................................................................................................................................................................................................Federal National Mortgage Association 7% 0.00 224 223 2026-10-01Government National Mortgage Association 7% 0.00 223 222 2028-01-15Federal National Mortgage Association 6.5% 0.00 222 203 2031-08-01Federal National Mortgage Association 7% 0.00 222 210 2023-09-01Federal National Mortgage Association 7.5% 0.00 222 215 2030-02-01................................................................................................................................................................................................................................................................................................Federal National Mortgage Association 8% 0.00 222 205 2025-09-01Federal Home Loan Mortgage Corporation 8.5% 0.00 221 205 2025-05-01Government National Mortgage Association 7.5% 0.00 221 213 2031-03-15Federal Home Loan Mortgage Corporation 8% 0.00 217 206 2024-10-01Government National Mortgage Association 8% 0.00 217 217 2022-02-15Federal National Mortgage Association 6.5% 0.00 216 197 2026-05-01Government National Mortgage Association 6% 0.00 215 199 2023-12-15Federal Home Loan Mortgage Corporation 7% 0.00 214 204 2022-11-01Federal National Mortgage Association 6.5% 0.00 214 195 2029-03-01Federal National Mortgage Association 7% 0.00 214 210 2030-12-01................................................................................................................................................................................................................................................................................................
©2018 Morningstar, Inc., Morningstar Investment Profiles™ 312-696-6000. All rights reserved. The information contained herein: (1) is proprietary to Morningstar and/or its content providers; (2) maynot be copied or distributed and (3) is not warranted to be accurate, complete or timely. Neither Morningstar nor its content providers are responsible for any damages or losses arising from any use ofinformation. Past performance is no guarantee of future performance. Visit our investment website at www.morningstar.com ß
®

Page 154 of 162
Broad Market Bond Index Fund.......................................................................................................................................................................................................................................................................................................................................
Total Stocks Total Bonds Total Cash0 9083 28
Bond Portfolio Analysis as of 09-30-18Security Name Net Assets % Market Value $ Amount $ Maturity Date
Government National Mortgage Association 9% 0.00 214 213 2025-03-15Federal National Mortgage Association 7% 0.00 213 209 2024-05-01Federal National Mortgage Association 6% 0.00 212 196 2027-12-01Government National Mortgage Association 7.5% 0.00 212 208 2025-10-15Government National Mortgage Association 8% 0.00 212 212 2024-06-15................................................................................................................................................................................................................................................................................................Federal Home Loan Mortgage Corporation 6.5% 0.00 211 191 2026-03-01Government National Mortgage Association 7% 0.00 210 209 2028-10-15Government National Mortgage Association 9% 0.00 209 208 2019-11-15Government National Mortgage Association 7% 0.00 208 207 2024-04-15Government National Mortgage Association 7.5% 0.00 206 203 2023-06-15................................................................................................................................................................................................................................................................................................Federal National Mortgage Association 6.5% 0.00 205 187 2029-06-01Federal National Mortgage Association 7% 0.00 205 203 2023-11-01Government National Mortgage Association 6% 0.00 205 189 2031-12-15Federal Home Loan Mortgage Corporation 7.5% 0.00 204 204 2024-09-01Federal National Mortgage Association 7.5% 0.00 204 193 2023-01-01................................................................................................................................................................................................................................................................................................Government National Mortgage Association 7% 0.00 204 201 2023-06-15Federal National Mortgage Association 7.5% 0.00 203 192 2022-11-01Federal National Mortgage Association 7.5% 0.00 202 202 2023-12-01Federal National Mortgage Association 7.5% 0.00 202 188 2026-07-01Government National Mortgage Association 7.5% 0.00 200 198 2022-12-15................................................................................................................................................................................................................................................................................................Federal Home Loan Mortgage Corporation 8% 0.00 199 186 2025-06-01Government National Mortgage Association 8% 0.00 197 194 2025-10-15Federal Home Loan Mortgage Corporation 8% 0.00 196 174 2030-01-01Federal National Mortgage Association 8% 0.00 195 179 2031-03-01Government National Mortgage Association 7% 0.00 195 188 2023-06-15................................................................................................................................................................................................................................................................................................Government National Mortgage Association 9% 0.00 195 195 2019-12-15Federal Home Loan Mortgage Corporation 7% 0.00 193 193 2024-03-01Federal National Mortgage Association 7% 0.00 193 193 2025-11-01Federal Home Loan Mortgage Corporation 8.5% 0.00 192 181 2025-02-01Federal National Mortgage Association 7% 0.00 192 181 2023-07-01................................................................................................................................................................................................................................................................................................Federal National Mortgage Association 9% 0.00 192 191 2026-10-01Government National Mortgage Association 7% 0.00 192 189 2023-10-15Government National Mortgage Association 7.5% 0.00 192 191 2023-03-15Government National Mortgage Association 7.5% 0.00 192 192 2024-01-15Federal Home Loan Mortgage Corporation 8.5% 0.00 191 174 2030-03-01................................................................................................................................................................................................................................................................................................Federal National Mortgage Association 7% 0.00 191 190 2024-05-01Federal Home Loan Mortgage Corporation 7% 0.00 190 181 2026-02-01Government National Mortgage Association 8% 0.00 190 188 2026-04-15Government National Mortgage Association 8% 0.00 190 178 2026-09-15Government National Mortgage Association 9.5% 0.00 190 189 2020-07-15................................................................................................................................................................................................................................................................................................Federal National Mortgage Association 8% 0.00 189 180 2023-01-01Federal Home Loan Mortgage Corporation 8% 0.00 187 186 2022-04-01Federal National Mortgage Association 5% 0.00 186 175 2033-06-01Government National Mortgage Association 10.5% 0.00 186 185 2021-01-15Government National Mortgage Association 7% 0.00 186 182 2029-08-15................................................................................................................................................................................................................................................................................................Federal National Mortgage Association 7% 0.00 184 178 2023-03-01Federal National Mortgage Association 7.5% 0.00 184 176 2023-09-01Federal National Mortgage Association 8.5% 0.00 184 175 2022-07-01Government National Mortgage Association 7.5% 0.00 183 183 2025-09-15Federal Home Loan Mortgage Corporation 7% 0.00 182 171 2025-08-01Federal National Mortgage Association 6% 0.00 182 168 2028-12-01Government National Mortgage Association 7.5% 0.00 182 177 2027-04-15Federal National Mortgage Association 7% 0.00 181 181 2026-02-01Federal National Mortgage Association 7% 0.00 181 178 2029-08-01Federal Home Loan Mortgage Corporation 7.5% 0.00 180 178 2020-10-01................................................................................................................................................................................................................................................................................................Federal National Mortgage Association 6.5% 0.00 180 162 2031-07-01Government National Mortgage Association 6% 0.00 180 167 2028-11-15Federal National Mortgage Association 5.5% 0.00 179 179 2021-10-01Federal National Mortgage Association 7% 0.00 178 168 2024-02-01Government National Mortgage Association 7.5% 0.00 178 172 2022-10-15................................................................................................................................................................................................................................................................................................
©2018 Morningstar, Inc., Morningstar Investment Profiles™ 312-696-6000. All rights reserved. The information contained herein: (1) is proprietary to Morningstar and/or its content providers; (2) maynot be copied or distributed and (3) is not warranted to be accurate, complete or timely. Neither Morningstar nor its content providers are responsible for any damages or losses arising from any use ofinformation. Past performance is no guarantee of future performance. Visit our investment website at www.morningstar.com ß
®

Page 155 of 162
Broad Market Bond Index Fund.......................................................................................................................................................................................................................................................................................................................................
Total Stocks Total Bonds Total Cash0 9083 28
Bond Portfolio Analysis as of 09-30-18Security Name Net Assets % Market Value $ Amount $ Maturity Date
Government National Mortgage Association 7% 0.00 177 169 2026-05-15Federal National Mortgage Association 7% 0.00 176 174 2024-04-01Federal Home Loan Mortgage Corporation 7% 0.00 174 173 2026-04-01Federal National Mortgage Association 7% 0.00 173 172 2025-08-01Government National Mortgage Association 7% 0.00 172 171 2023-04-15................................................................................................................................................................................................................................................................................................Federal Home Loan Mortgage Corporation 7% 0.00 171 170 2026-02-01Federal Home Loan Mortgage Corporation 6% 0.00 170 156 2028-11-01Government National Mortgage Association 8% 0.00 170 164 2022-02-15Government National Mortgage Association 9% 0.00 170 170 2019-10-15Federal National Mortgage Association 9% 0.00 169 166 2020-02-01................................................................................................................................................................................................................................................................................................Government National Mortgage Association 6.5% 0.00 167 152 2024-04-15Government National Mortgage Association 9.5% 0.00 167 167 2019-02-15Federal Home Loan Mortgage Corporation 8.5% 0.00 166 154 2026-10-01Government National Mortgage Association 8% 0.00 166 163 2030-06-15Government National Mortgage Association 7% 0.00 164 164 2024-02-15................................................................................................................................................................................................................................................................................................Government National Mortgage Association 9.5% 0.00 164 162 2021-07-15Federal Home Loan Mortgage Corporation 9% 0.00 163 162 2021-01-01Federal National Mortgage Association 7% 0.00 163 155 2024-06-01Government National Mortgage Association 7% 0.00 163 157 2023-06-15Federal Home Loan Mortgage Corporation 6.5% 0.00 161 145 2029-05-01................................................................................................................................................................................................................................................................................................Government National Mortgage Association 7.5% 0.00 161 159 2023-01-15Federal Home Loan Mortgage Corporation 7% 0.00 160 160 2023-09-01Government National Mortgage Association 6.5% 0.00 160 146 2024-03-15Government National Mortgage Association 9% 0.00 160 159 2019-11-15Federal Home Loan Mortgage Corporation 7% 0.00 158 148 2024-05-01................................................................................................................................................................................................................................................................................................Federal National Mortgage Association 7% 0.00 158 154 2029-09-01Federal National Mortgage Association 8.5% 0.00 158 148 2025-06-01Government National Mortgage Association 10% 0.00 158 158 2019-05-15Government National Mortgage Association 7.5% 0.00 158 155 2026-07-15Federal National Mortgage Association 5.5% 0.00 155 155 2019-02-01................................................................................................................................................................................................................................................................................................Government National Mortgage Association 9% 0.00 155 150 2021-08-20Federal National Mortgage Association 6.5% 0.00 154 140 2028-11-01Federal Home Loan Mortgage Corporation 6% 0.00 153 141 2028-10-01Government National Mortgage Association 7% 0.00 153 145 2028-05-15Government National Mortgage Association 7.5% 0.00 153 150 2023-08-15................................................................................................................................................................................................................................................................................................Government National Mortgage Association 7.5% 0.00 152 151 2029-07-15Federal National Mortgage Association 7% 0.00 151 142 2030-03-01Government National Mortgage Association 7% 0.00 151 150 2025-12-15Government National Mortgage Association 7.5% 0.00 151 144 2030-11-15Federal Home Loan Mortgage Corporation 7.5% 0.00 149 145 2031-11-01................................................................................................................................................................................................................................................................................................Federal National Mortgage Association 7% 0.00 148 139 2031-07-01Federal National Mortgage Association 9% 0.00 147 147 2026-11-01Government National Mortgage Association 7.5% 0.00 147 141 2023-04-15Government National Mortgage Association 9% 0.00 147 147 2019-02-15Government National Mortgage Association 7.5% 0.00 146 143 2030-01-15Federal National Mortgage Association 6% 0.00 145 132 2028-12-01Government National Mortgage Association 9% 0.00 144 143 2019-12-15Government National Mortgage Association 9% 0.00 144 143 2021-11-15Federal National Mortgage Association 6.5% 0.00 143 130 2031-05-01Federal National Mortgage Association 7% 0.00 143 143 2024-05-01................................................................................................................................................................................................................................................................................................Government National Mortgage Association 6.5% 0.00 142 129 2026-02-15Government National Mortgage Association 6.5% 0.00 142 129 2028-12-15Government National Mortgage Association 7.5% 0.00 141 139 2026-09-15Federal Home Loan Mortgage Corporation 7% 0.00 139 138 2023-06-01Federal Home Loan Mortgage Corporation 7% 0.00 139 137 2024-04-01................................................................................................................................................................................................................................................................................................Government National Mortgage Association 6.5% 0.00 139 127 2023-10-15Government National Mortgage Association 7.5% 0.00 139 138 2025-09-15Government National Mortgage Association 8.5% 0.00 139 139 2029-12-15Federal National Mortgage Association 8% 0.00 136 120 2030-08-01Government National Mortgage Association 8.5% 0.00 136 133 2023-03-15................................................................................................................................................................................................................................................................................................
©2018 Morningstar, Inc., Morningstar Investment Profiles™ 312-696-6000. All rights reserved. The information contained herein: (1) is proprietary to Morningstar and/or its content providers; (2) maynot be copied or distributed and (3) is not warranted to be accurate, complete or timely. Neither Morningstar nor its content providers are responsible for any damages or losses arising from any use ofinformation. Past performance is no guarantee of future performance. Visit our investment website at www.morningstar.com ß
®

Page 156 of 162
Broad Market Bond Index Fund.......................................................................................................................................................................................................................................................................................................................................
Total Stocks Total Bonds Total Cash0 9083 28
Bond Portfolio Analysis as of 09-30-18Security Name Net Assets % Market Value $ Amount $ Maturity Date
Federal Home Loan Mortgage Corporation 7% 0.00 135 135 2023-11-01Federal National Mortgage Association 6.5% 0.00 135 124 2027-02-01Federal Home Loan Mortgage Corporation 9% 0.00 134 133 2021-07-01Government National Mortgage Association 7.5% 0.00 134 129 2023-02-15Federal Home Loan Mortgage Corporation 6% 0.00 133 122 2028-12-01................................................................................................................................................................................................................................................................................................Federal Home Loan Mortgage Corporation 8% 0.00 133 126 2022-05-01Government National Mortgage Association 7.5% 0.00 133 133 2029-09-15Federal National Mortgage Association 6.5% 0.00 132 120 2026-05-01Government National Mortgage Association 7.5% 0.00 132 130 2024-06-15Federal Home Loan Mortgage Corporation 7% 0.00 130 120 2026-01-01................................................................................................................................................................................................................................................................................................Federal National Mortgage Association 6.5% 0.00 130 119 2031-08-01Government National Mortgage Association 6.5% 0.00 130 119 2028-10-15Government National Mortgage Association 7.5% 0.00 130 127 2025-08-15Federal Home Loan Mortgage Corporation 7% 0.00 129 129 2024-06-01Government National Mortgage Association 7% 0.00 129 124 2023-10-15................................................................................................................................................................................................................................................................................................Federal Home Loan Mortgage Corporation 6.5% 0.00 128 116 2023-10-01Federal National Mortgage Association 9% 0.00 128 127 2024-12-01Federal National Mortgage Association 9% 0.00 128 127 2020-08-01Government National Mortgage Association 9% 0.00 128 119 2025-03-15Federal Home Loan Mortgage Corporation 7% 0.00 126 113 2031-01-01................................................................................................................................................................................................................................................................................................Government National Mortgage Association 7.5% 0.00 125 119 2025-06-20Federal National Mortgage Association 6.5% 0.00 124 113 2023-06-01Federal National Mortgage Association 7.5% 0.00 123 123 2025-06-01Federal National Mortgage Association 7% 0.00 122 117 2026-03-01Government National Mortgage Association 8% 0.00 122 121 2023-03-15................................................................................................................................................................................................................................................................................................Federal Home Loan Mortgage Corporation 7.5% 0.00 120 116 2024-06-01Federal Home Loan Mortgage Corporation 7.5% 0.00 119 115 2022-02-01Federal National Mortgage Association 6.5% 0.00 119 109 2027-02-01Government National Mortgage Association 8% 0.00 119 113 2023-07-15Federal National Mortgage Association 6.5% 0.00 118 108 2024-04-01................................................................................................................................................................................................................................................................................................Federal National Mortgage Association 8.5% 0.00 118 112 2022-04-01Government National Mortgage Association 7.5% 0.00 118 107 2030-07-20Federal National Mortgage Association 8% 0.00 117 113 2022-05-01Government National Mortgage Association 7% 0.00 115 111 2023-09-15Government National Mortgage Association 8% 0.00 115 115 2027-12-15................................................................................................................................................................................................................................................................................................Federal Home Loan Mortgage Corporation 9% 0.00 113 113 2020-09-01Federal National Mortgage Association 6% 0.00 113 105 2023-10-01Federal National Mortgage Association 6.5% 0.00 113 103 2028-09-01Federal National Mortgage Association 8% 0.00 112 108 2021-12-01Government National Mortgage Association 7.5% 0.00 109 109 2030-12-15Government National Mortgage Association 9% 0.00 109 103 2022-07-20Federal Home Loan Mortgage Corporation 8.5% 0.00 108 101 2025-01-01Federal National Mortgage Association 7% 0.00 108 108 2025-12-01Government National Mortgage Association 8% 0.00 108 108 2023-03-15Federal National Mortgage Association 6.5% 0.00 107 98 2023-08-01................................................................................................................................................................................................................................................................................................Government National Mortgage Association 7% 0.00 107 100 2028-05-15Federal National Mortgage Association 7% 0.00 106 106 2026-09-01Federal National Mortgage Association 8.5% 0.00 105 105 2027-05-01Federal Home Loan Mortgage Corporation 8.5% 0.00 104 103 2023-05-01Government National Mortgage Association 8% 0.00 103 102 2029-12-15................................................................................................................................................................................................................................................................................................Federal National Mortgage Association 7.5% 0.00 102 102 2029-11-01Government National Mortgage Association 7% 0.00 102 97 2026-06-15Federal Home Loan Mortgage Corporation 8.5% 0.00 100 94 2025-07-01Federal National Mortgage Association 9% 0.00 100 98 2022-04-01Federal Home Loan Mortgage Corporation 6.5% 0.00 99 89 2028-05-01................................................................................................................................................................................................................................................................................................Federal Home Loan Mortgage Corporation 8% 0.00 99 95 2022-11-01Federal National Mortgage Association 7% 0.00 99 98 2023-12-01Federal National Mortgage Association 7% 0.00 99 97 2024-06-01Government National Mortgage Association 7.5% 0.00 99 98 2023-08-15Government National Mortgage Association 7.5% 0.00 99 98 2027-09-15................................................................................................................................................................................................................................................................................................
©2018 Morningstar, Inc., Morningstar Investment Profiles™ 312-696-6000. All rights reserved. The information contained herein: (1) is proprietary to Morningstar and/or its content providers; (2) maynot be copied or distributed and (3) is not warranted to be accurate, complete or timely. Neither Morningstar nor its content providers are responsible for any damages or losses arising from any use ofinformation. Past performance is no guarantee of future performance. Visit our investment website at www.morningstar.com ß
®
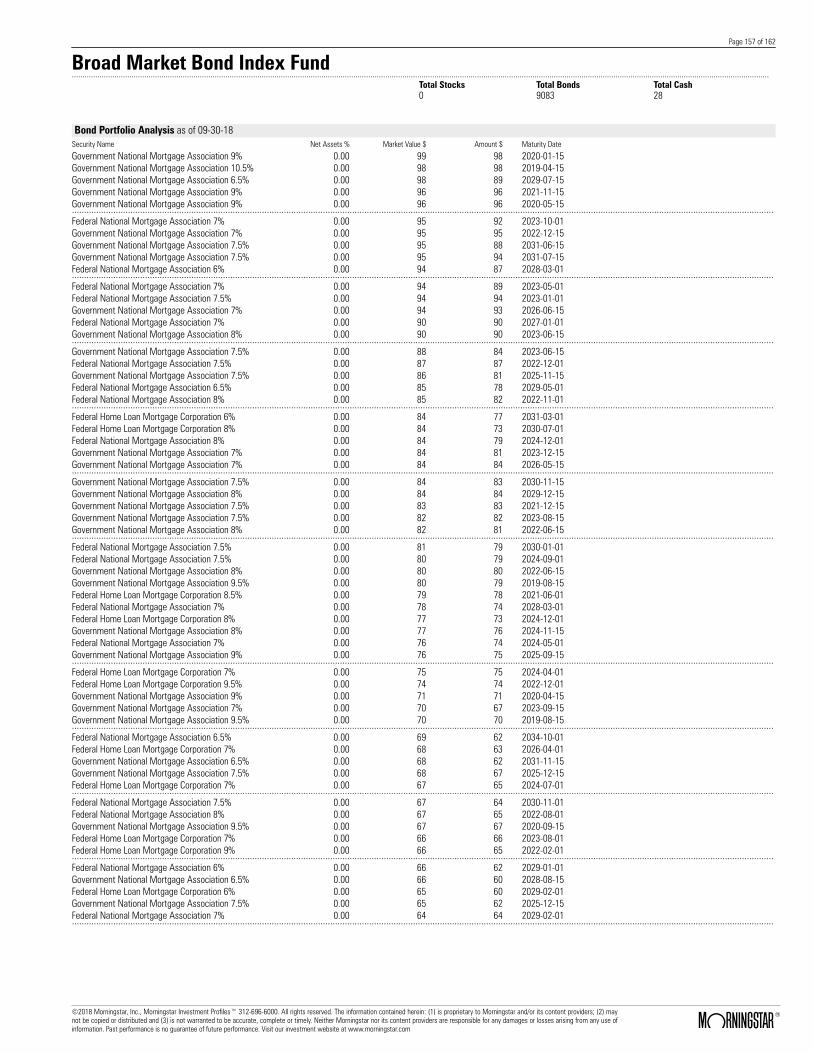
Page 157 of 162
Broad Market Bond Index Fund.......................................................................................................................................................................................................................................................................................................................................
Total Stocks Total Bonds Total Cash0 9083 28
Bond Portfolio Analysis as of 09-30-18Security Name Net Assets % Market Value $ Amount $ Maturity Date
Government National Mortgage Association 9% 0.00 99 98 2020-01-15Government National Mortgage Association 10.5% 0.00 98 98 2019-04-15Government National Mortgage Association 6.5% 0.00 98 89 2029-07-15Government National Mortgage Association 9% 0.00 96 96 2021-11-15Government National Mortgage Association 9% 0.00 96 96 2020-05-15................................................................................................................................................................................................................................................................................................Federal National Mortgage Association 7% 0.00 95 92 2023-10-01Government National Mortgage Association 7% 0.00 95 95 2022-12-15Government National Mortgage Association 7.5% 0.00 95 88 2031-06-15Government National Mortgage Association 7.5% 0.00 95 94 2031-07-15Federal National Mortgage Association 6% 0.00 94 87 2028-03-01................................................................................................................................................................................................................................................................................................Federal National Mortgage Association 7% 0.00 94 89 2023-05-01Federal National Mortgage Association 7.5% 0.00 94 94 2023-01-01Government National Mortgage Association 7% 0.00 94 93 2026-06-15Federal National Mortgage Association 7% 0.00 90 90 2027-01-01Government National Mortgage Association 8% 0.00 90 90 2023-06-15................................................................................................................................................................................................................................................................................................Government National Mortgage Association 7.5% 0.00 88 84 2023-06-15Federal National Mortgage Association 7.5% 0.00 87 87 2022-12-01Government National Mortgage Association 7.5% 0.00 86 81 2025-11-15Federal National Mortgage Association 6.5% 0.00 85 78 2029-05-01Federal National Mortgage Association 8% 0.00 85 82 2022-11-01................................................................................................................................................................................................................................................................................................Federal Home Loan Mortgage Corporation 6% 0.00 84 77 2031-03-01Federal Home Loan Mortgage Corporation 8% 0.00 84 73 2030-07-01Federal National Mortgage Association 8% 0.00 84 79 2024-12-01Government National Mortgage Association 7% 0.00 84 81 2023-12-15Government National Mortgage Association 7% 0.00 84 84 2026-05-15................................................................................................................................................................................................................................................................................................Government National Mortgage Association 7.5% 0.00 84 83 2030-11-15Government National Mortgage Association 8% 0.00 84 84 2029-12-15Government National Mortgage Association 7.5% 0.00 83 83 2021-12-15Government National Mortgage Association 7.5% 0.00 82 82 2023-08-15Government National Mortgage Association 8% 0.00 82 81 2022-06-15................................................................................................................................................................................................................................................................................................Federal National Mortgage Association 7.5% 0.00 81 79 2030-01-01Federal National Mortgage Association 7.5% 0.00 80 79 2024-09-01Government National Mortgage Association 8% 0.00 80 80 2022-06-15Government National Mortgage Association 9.5% 0.00 80 79 2019-08-15Federal Home Loan Mortgage Corporation 8.5% 0.00 79 78 2021-06-01Federal National Mortgage Association 7% 0.00 78 74 2028-03-01Federal Home Loan Mortgage Corporation 8% 0.00 77 73 2024-12-01Government National Mortgage Association 8% 0.00 77 76 2024-11-15Federal National Mortgage Association 7% 0.00 76 74 2024-05-01Government National Mortgage Association 9% 0.00 76 75 2025-09-15................................................................................................................................................................................................................................................................................................Federal Home Loan Mortgage Corporation 7% 0.00 75 75 2024-04-01Federal Home Loan Mortgage Corporation 9.5% 0.00 74 74 2022-12-01Government National Mortgage Association 9% 0.00 71 71 2020-04-15Government National Mortgage Association 7% 0.00 70 67 2023-09-15Government National Mortgage Association 9.5% 0.00 70 70 2019-08-15................................................................................................................................................................................................................................................................................................Federal National Mortgage Association 6.5% 0.00 69 62 2034-10-01Federal Home Loan Mortgage Corporation 7% 0.00 68 63 2026-04-01Government National Mortgage Association 6.5% 0.00 68 62 2031-11-15Government National Mortgage Association 7.5% 0.00 68 67 2025-12-15Federal Home Loan Mortgage Corporation 7% 0.00 67 65 2024-07-01................................................................................................................................................................................................................................................................................................Federal National Mortgage Association 7.5% 0.00 67 64 2030-11-01Federal National Mortgage Association 8% 0.00 67 65 2022-08-01Government National Mortgage Association 9.5% 0.00 67 67 2020-09-15Federal Home Loan Mortgage Corporation 7% 0.00 66 66 2023-08-01Federal Home Loan Mortgage Corporation 9% 0.00 66 65 2022-02-01................................................................................................................................................................................................................................................................................................Federal National Mortgage Association 6% 0.00 66 62 2029-01-01Government National Mortgage Association 6.5% 0.00 66 60 2028-08-15Federal Home Loan Mortgage Corporation 6% 0.00 65 60 2029-02-01Government National Mortgage Association 7.5% 0.00 65 62 2025-12-15Federal National Mortgage Association 7% 0.00 64 64 2029-02-01................................................................................................................................................................................................................................................................................................
©2018 Morningstar, Inc., Morningstar Investment Profiles™ 312-696-6000. All rights reserved. The information contained herein: (1) is proprietary to Morningstar and/or its content providers; (2) maynot be copied or distributed and (3) is not warranted to be accurate, complete or timely. Neither Morningstar nor its content providers are responsible for any damages or losses arising from any use ofinformation. Past performance is no guarantee of future performance. Visit our investment website at www.morningstar.com ß
®
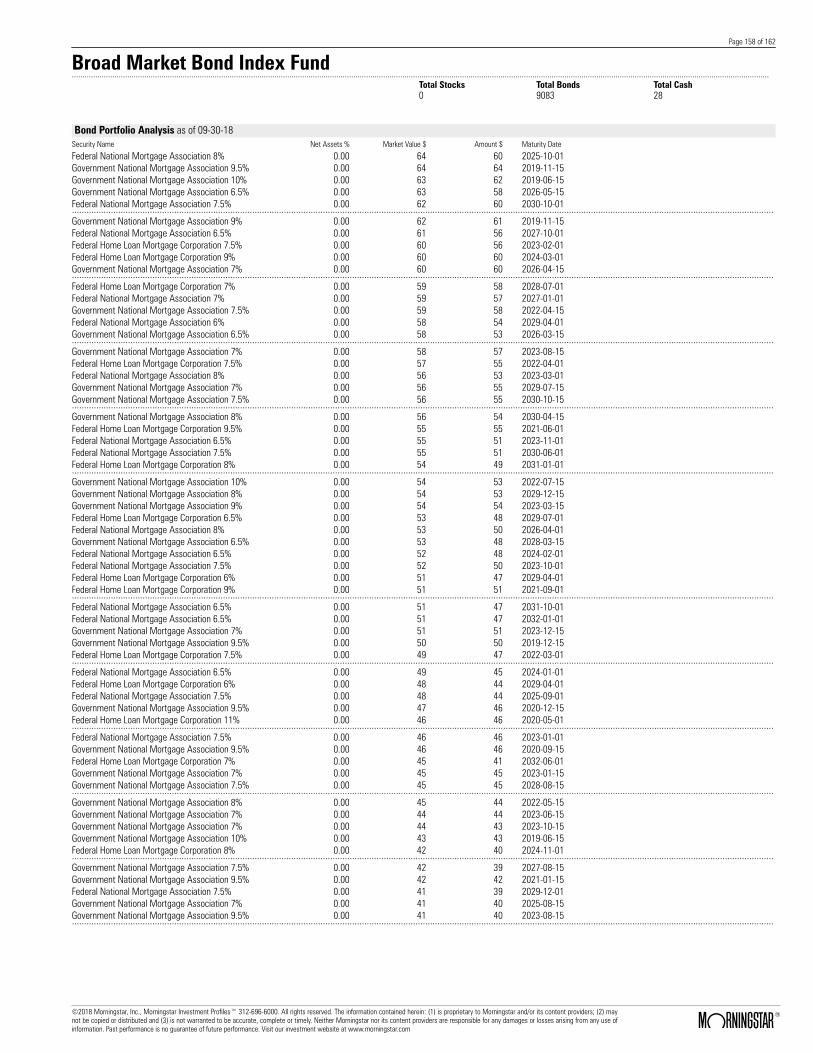
Page 158 of 162
Broad Market Bond Index Fund.......................................................................................................................................................................................................................................................................................................................................
Total Stocks Total Bonds Total Cash0 9083 28
Bond Portfolio Analysis as of 09-30-18Security Name Net Assets % Market Value $ Amount $ Maturity Date
Federal National Mortgage Association 8% 0.00 64 60 2025-10-01Government National Mortgage Association 9.5% 0.00 64 64 2019-11-15Government National Mortgage Association 10% 0.00 63 62 2019-06-15Government National Mortgage Association 6.5% 0.00 63 58 2026-05-15Federal National Mortgage Association 7.5% 0.00 62 60 2030-10-01................................................................................................................................................................................................................................................................................................Government National Mortgage Association 9% 0.00 62 61 2019-11-15Federal National Mortgage Association 6.5% 0.00 61 56 2027-10-01Federal Home Loan Mortgage Corporation 7.5% 0.00 60 56 2023-02-01Federal Home Loan Mortgage Corporation 9% 0.00 60 60 2024-03-01Government National Mortgage Association 7% 0.00 60 60 2026-04-15................................................................................................................................................................................................................................................................................................Federal Home Loan Mortgage Corporation 7% 0.00 59 58 2028-07-01Federal National Mortgage Association 7% 0.00 59 57 2027-01-01Government National Mortgage Association 7.5% 0.00 59 58 2022-04-15Federal National Mortgage Association 6% 0.00 58 54 2029-04-01Government National Mortgage Association 6.5% 0.00 58 53 2026-03-15................................................................................................................................................................................................................................................................................................Government National Mortgage Association 7% 0.00 58 57 2023-08-15Federal Home Loan Mortgage Corporation 7.5% 0.00 57 55 2022-04-01Federal National Mortgage Association 8% 0.00 56 53 2023-03-01Government National Mortgage Association 7% 0.00 56 55 2029-07-15Government National Mortgage Association 7.5% 0.00 56 55 2030-10-15................................................................................................................................................................................................................................................................................................Government National Mortgage Association 8% 0.00 56 54 2030-04-15Federal Home Loan Mortgage Corporation 9.5% 0.00 55 55 2021-06-01Federal National Mortgage Association 6.5% 0.00 55 51 2023-11-01Federal National Mortgage Association 7.5% 0.00 55 51 2030-06-01Federal Home Loan Mortgage Corporation 8% 0.00 54 49 2031-01-01................................................................................................................................................................................................................................................................................................Government National Mortgage Association 10% 0.00 54 53 2022-07-15Government National Mortgage Association 8% 0.00 54 53 2029-12-15Government National Mortgage Association 9% 0.00 54 54 2023-03-15Federal Home Loan Mortgage Corporation 6.5% 0.00 53 48 2029-07-01Federal National Mortgage Association 8% 0.00 53 50 2026-04-01Government National Mortgage Association 6.5% 0.00 53 48 2028-03-15Federal National Mortgage Association 6.5% 0.00 52 48 2024-02-01Federal National Mortgage Association 7.5% 0.00 52 50 2023-10-01Federal Home Loan Mortgage Corporation 6% 0.00 51 47 2029-04-01Federal Home Loan Mortgage Corporation 9% 0.00 51 51 2021-09-01................................................................................................................................................................................................................................................................................................Federal National Mortgage Association 6.5% 0.00 51 47 2031-10-01Federal National Mortgage Association 6.5% 0.00 51 47 2032-01-01Government National Mortgage Association 7% 0.00 51 51 2023-12-15Government National Mortgage Association 9.5% 0.00 50 50 2019-12-15Federal Home Loan Mortgage Corporation 7.5% 0.00 49 47 2022-03-01................................................................................................................................................................................................................................................................................................Federal National Mortgage Association 6.5% 0.00 49 45 2024-01-01Federal Home Loan Mortgage Corporation 6% 0.00 48 44 2029-04-01Federal National Mortgage Association 7.5% 0.00 48 44 2025-09-01Government National Mortgage Association 9.5% 0.00 47 46 2020-12-15Federal Home Loan Mortgage Corporation 11% 0.00 46 46 2020-05-01................................................................................................................................................................................................................................................................................................Federal National Mortgage Association 7.5% 0.00 46 46 2023-01-01Government National Mortgage Association 9.5% 0.00 46 46 2020-09-15Federal Home Loan Mortgage Corporation 7% 0.00 45 41 2032-06-01Government National Mortgage Association 7% 0.00 45 45 2023-01-15Government National Mortgage Association 7.5% 0.00 45 45 2028-08-15................................................................................................................................................................................................................................................................................................Government National Mortgage Association 8% 0.00 45 44 2022-05-15Government National Mortgage Association 7% 0.00 44 44 2023-06-15Government National Mortgage Association 7% 0.00 44 43 2023-10-15Government National Mortgage Association 10% 0.00 43 43 2019-06-15Federal Home Loan Mortgage Corporation 8% 0.00 42 40 2024-11-01................................................................................................................................................................................................................................................................................................Government National Mortgage Association 7.5% 0.00 42 39 2027-08-15Government National Mortgage Association 9.5% 0.00 42 42 2021-01-15Federal National Mortgage Association 7.5% 0.00 41 39 2029-12-01Government National Mortgage Association 7% 0.00 41 40 2025-08-15Government National Mortgage Association 9.5% 0.00 41 40 2023-08-15................................................................................................................................................................................................................................................................................................
©2018 Morningstar, Inc., Morningstar Investment Profiles™ 312-696-6000. All rights reserved. The information contained herein: (1) is proprietary to Morningstar and/or its content providers; (2) maynot be copied or distributed and (3) is not warranted to be accurate, complete or timely. Neither Morningstar nor its content providers are responsible for any damages or losses arising from any use ofinformation. Past performance is no guarantee of future performance. Visit our investment website at www.morningstar.com ß
®

Page 159 of 162
Broad Market Bond Index Fund.......................................................................................................................................................................................................................................................................................................................................
Total Stocks Total Bonds Total Cash0 9083 28
Bond Portfolio Analysis as of 09-30-18Security Name Net Assets % Market Value $ Amount $ Maturity Date
Federal National Mortgage Association 10% 0.00 40 40 2021-11-01Federal Home Loan Mortgage Corporation 6% 0.00 39 36 2029-03-01Government National Mortgage Association 8% 0.00 39 39 2022-12-15Federal Home Loan Mortgage Corporation 7.5% 0.00 38 37 2023-06-01Federal Home Loan Mortgage Corporation 7.5% 0.00 38 37 2022-02-01................................................................................................................................................................................................................................................................................................Federal Home Loan Mortgage Corporation 7% 0.00 37 36 2029-07-01Government National Mortgage Association 8% 0.00 37 35 2023-06-15Government National Mortgage Association 8% 0.00 37 37 2023-11-15Government National Mortgage Association 9.5% 0.00 37 36 2020-11-15Government National Mortgage Association 10% 0.00 36 35 2020-08-20................................................................................................................................................................................................................................................................................................Government National Mortgage Association 9% 0.00 36 36 2020-05-15Federal National Mortgage Association 8% 0.00 35 35 2023-05-01Government National Mortgage Association 9% 0.00 35 35 2025-08-15Government National Mortgage Association 9.5% 0.00 35 35 2020-08-15Federal National Mortgage Association 9.5% 0.00 34 32 2022-08-01................................................................................................................................................................................................................................................................................................Government National Mortgage Association 8% 0.00 34 34 2022-04-15Federal Home Loan Mortgage Corporation 7% 0.00 33 32 2028-09-01Government National Mortgage Association 7.5% 0.00 33 31 2029-09-15Government National Mortgage Association 8% 0.00 33 33 2024-02-15Government National Mortgage Association 9% 0.00 33 33 2019-11-15................................................................................................................................................................................................................................................................................................Government National Mortgage Association 9.5% 0.00 30 30 2019-12-15Federal National Mortgage Association 8.5% 0.00 29 26 2030-07-01Government National Mortgage Association 9% 0.00 29 29 2019-08-15Federal Home Loan Mortgage Corporation 8% 0.00 28 28 2029-11-01Federal Home Loan Mortgage Corporation 7% 0.00 27 25 2032-06-01Government National Mortgage Association 7% 0.00 27 27 2029-05-15Government National Mortgage Association 9.5% 0.00 27 27 2020-11-15Federal National Mortgage Association 6.5% 0.00 26 24 2024-03-01Government National Mortgage Association 8.5% 0.00 26 25 2022-01-15Government National Mortgage Association 9.5% 0.00 26 25 2020-10-15................................................................................................................................................................................................................................................................................................Federal National Mortgage Association 9.5% 0.00 25 24 2020-08-01Federal Home Loan Mortgage Corporation 6.5% 0.00 24 22 2026-05-01Federal Home Loan Mortgage Corporation 8.5% 0.00 24 24 2025-05-01Federal National Mortgage Association 8.5% 0.00 24 24 2024-11-01Government National Mortgage Association 8% 0.00 24 24 2029-12-15................................................................................................................................................................................................................................................................................................Federal National Mortgage Association 8.5% 0.00 23 22 2022-08-01Federal Home Loan Mortgage Corporation 7% 0.00 22 20 2026-01-01Federal National Mortgage Association 9% 0.00 22 21 2021-07-01Government National Mortgage Association 7% 0.00 22 22 2028-01-15Government National Mortgage Association 8% 0.00 22 22 2022-05-15................................................................................................................................................................................................................................................................................................Government National Mortgage Association 9% 0.00 22 22 2019-10-15Government National Mortgage Association 9% 0.00 22 22 2019-12-15Federal Home Loan Mortgage Corporation 9.5% 0.00 21 21 2020-07-01Federal National Mortgage Association 8.5% 0.00 21 21 2024-12-01Government National Mortgage Association 9% 0.00 21 21 2021-07-15................................................................................................................................................................................................................................................................................................Federal National Mortgage Association 9.5% 0.00 20 20 2019-11-01Federal National Mortgage Association 9% 0.00 19 19 2019-12-01Government National Mortgage Association 7% 0.00 19 18 2023-08-15Government National Mortgage Association 7.5% 0.00 19 19 2023-05-15Government National Mortgage Association 8% 0.00 19 19 2022-08-15................................................................................................................................................................................................................................................................................................Federal National Mortgage Association 8% 0.00 16 15 2023-02-01Government National Mortgage Association 9% 0.00 16 16 2020-06-15Government National Mortgage Association 9% 0.00 15 15 2019-10-15Federal National Mortgage Association 9.5% 0.00 14 14 2021-11-01Federal National Mortgage Association 6.5% 0.00 13 12 2032-03-01................................................................................................................................................................................................................................................................................................Government National Mortgage Association 9% 0.00 13 13 2021-07-15Government National Mortgage Association 6.5% 0.00 12 11 2026-01-15Government National Mortgage Association 7.5% 0.00 12 12 2030-12-15Federal Home Loan Mortgage Corporation 9.5% 0.00 11 11 2020-12-01Federal National Mortgage Association 8% 0.00 11 11 2022-05-01................................................................................................................................................................................................................................................................................................
©2018 Morningstar, Inc., Morningstar Investment Profiles™ 312-696-6000. All rights reserved. The information contained herein: (1) is proprietary to Morningstar and/or its content providers; (2) maynot be copied or distributed and (3) is not warranted to be accurate, complete or timely. Neither Morningstar nor its content providers are responsible for any damages or losses arising from any use ofinformation. Past performance is no guarantee of future performance. Visit our investment website at www.morningstar.com ß
®
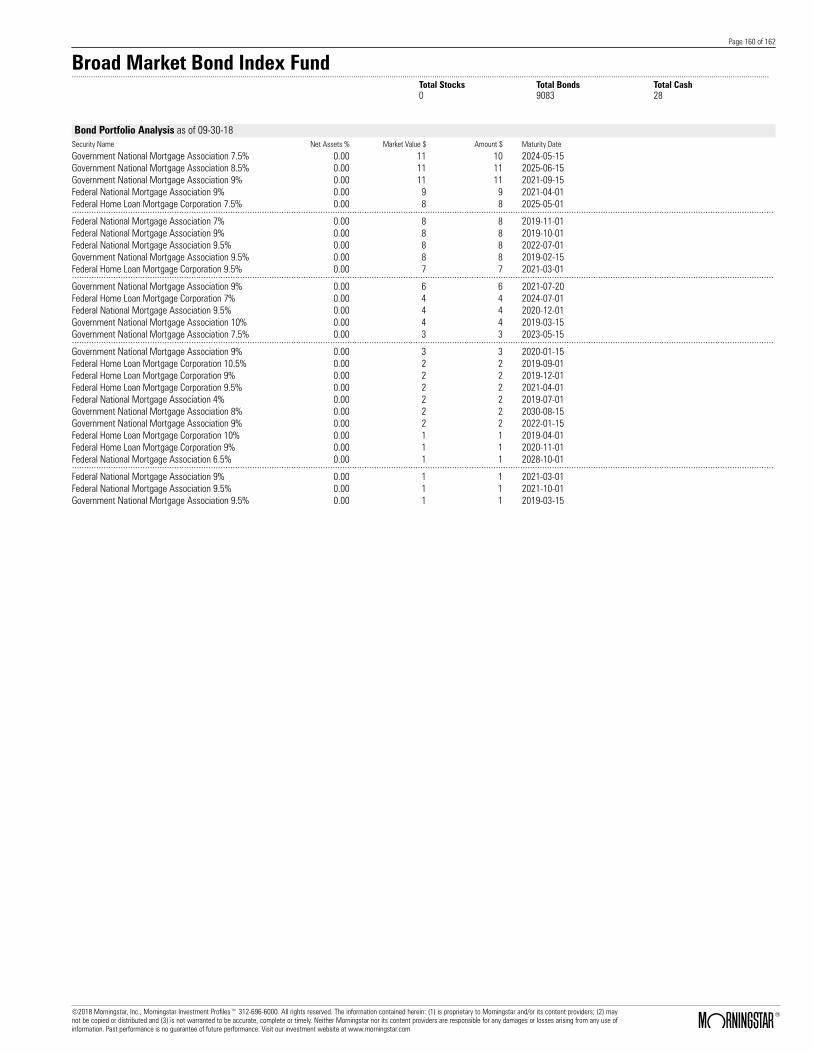
Page 160 of 162
Broad Market Bond Index Fund.......................................................................................................................................................................................................................................................................................................................................
Total Stocks Total Bonds Total Cash0 9083 28
Bond Portfolio Analysis as of 09-30-18Security Name Net Assets % Market Value $ Amount $ Maturity Date
Government National Mortgage Association 7.5% 0.00 11 10 2024-05-15Government National Mortgage Association 8.5% 0.00 11 11 2025-06-15Government National Mortgage Association 9% 0.00 11 11 2021-09-15Federal National Mortgage Association 9% 0.00 9 9 2021-04-01Federal Home Loan Mortgage Corporation 7.5% 0.00 8 8 2025-05-01................................................................................................................................................................................................................................................................................................Federal National Mortgage Association 7% 0.00 8 8 2019-11-01Federal National Mortgage Association 9% 0.00 8 8 2019-10-01Federal National Mortgage Association 9.5% 0.00 8 8 2022-07-01Government National Mortgage Association 9.5% 0.00 8 8 2019-02-15Federal Home Loan Mortgage Corporation 9.5% 0.00 7 7 2021-03-01................................................................................................................................................................................................................................................................................................Government National Mortgage Association 9% 0.00 6 6 2021-07-20Federal Home Loan Mortgage Corporation 7% 0.00 4 4 2024-07-01Federal National Mortgage Association 9.5% 0.00 4 4 2020-12-01Government National Mortgage Association 10% 0.00 4 4 2019-03-15Government National Mortgage Association 7.5% 0.00 3 3 2023-05-15................................................................................................................................................................................................................................................................................................Government National Mortgage Association 9% 0.00 3 3 2020-01-15Federal Home Loan Mortgage Corporation 10.5% 0.00 2 2 2019-09-01Federal Home Loan Mortgage Corporation 9% 0.00 2 2 2019-12-01Federal Home Loan Mortgage Corporation 9.5% 0.00 2 2 2021-04-01Federal National Mortgage Association 4% 0.00 2 2 2019-07-01Government National Mortgage Association 8% 0.00 2 2 2030-08-15Government National Mortgage Association 9% 0.00 2 2 2022-01-15Federal Home Loan Mortgage Corporation 10% 0.00 1 1 2019-04-01Federal Home Loan Mortgage Corporation 9% 0.00 1 1 2020-11-01Federal National Mortgage Association 6.5% 0.00 1 1 2028-10-01................................................................................................................................................................................................................................................................................................Federal National Mortgage Association 9% 0.00 1 1 2021-03-01Federal National Mortgage Association 9.5% 0.00 1 1 2021-10-01Government National Mortgage Association 9.5% 0.00 1 1 2019-03-15
©2018 Morningstar, Inc., Morningstar Investment Profiles™ 312-696-6000. All rights reserved. The information contained herein: (1) is proprietary to Morningstar and/or its content providers; (2) maynot be copied or distributed and (3) is not warranted to be accurate, complete or timely. Neither Morningstar nor its content providers are responsible for any damages or losses arising from any use ofinformation. Past performance is no guarantee of future performance. Visit our investment website at www.morningstar.com ß
®

Page 161 of 162
Broad Market Bond Index Fund.......................................................................................................................................................................................................................................................................................................................................
Total Stocks Total Bonds Total Cash0 9083 28
Cash Portfolio Analysis as of 09-30-18Security Name Net Assets % Market Value $
United States Treasury Bills 0% 0.05 3,842,227Nt Col Stif 0.01 1,265,227Federal National Mortgage Association 4.5% 0.00 2,605Federal National Mortgage Association 4.5% 0.00 1,959Federal Home Loan Mortgage Corporation 4.5% 0.00 1,570................................................................................................................................................................................................................................................................................................Federal Home Loan Mortgage Corporation 5% 0.00 1,359Federal National Mortgage Association 4.5% 0.00 1,312Federal National Mortgage Association 4.5% 0.00 858Federal National Mortgage Association 4.5% 0.00 653Federal Home Loan Mortgage Corporation 5% 0.00 600................................................................................................................................................................................................................................................................................................Federal National Mortgage Association 4.5% 0.00 512Federal National Mortgage Association 4% 0.00 430Federal Home Loan Mortgage Corporation 4% 0.00 271Federal Home Loan Mortgage Corporation 5% 0.00 250Federal Home Loan Mortgage Corporation 5.5% 0.00 224................................................................................................................................................................................................................................................................................................Federal Home Loan Mortgage Corporation 6.5% 0.00 120Federal National Mortgage Association 5% 0.00 118Federal National Mortgage Association 5% 0.00 105Federal Home Loan Mortgage Corporation 6.5% 0.00 101Federal National Mortgage Association 5% 0.00 87................................................................................................................................................................................................................................................................................................Federal Home Loan Mortgage Corporation 5% 0.00 82Federal National Mortgage Association 4% 0.00 58Federal National Mortgage Association 4.5% 0.00 37Government National Mortgage Association 4.5% 0.00 37Federal National Mortgage Association 4.5% 0.00 8................................................................................................................................................................................................................................................................................................Government National Mortgage Association 11% 0.00 5Federal National Mortgage Association 4% 0.00 3Federal Home Loan Mortgage Corporation 10% 0.00 2
©2018 Morningstar, Inc., Morningstar Investment Profiles™ 312-696-6000. All rights reserved. The information contained herein: (1) is proprietary to Morningstar and/or its content providers; (2) maynot be copied or distributed and (3) is not warranted to be accurate, complete or timely. Neither Morningstar nor its content providers are responsible for any damages or losses arising from any use ofinformation. Past performance is no guarantee of future performance. Visit our investment website at www.morningstar.com ß
®

Page 162 of 162
Broad Market Bond Index Fund.......................................................................................................................................................................................................................................................................................................................................
Total Stocks Total Bonds Total Cash0 9083 28
Other Portfolio Analysis as of 09-30-18Security Name Net Assets % Market Value $
Royal Bank of Scotland Group plc 4.52% 0.02 1,575,273Barclays PLC 4.34% 0.01 1,092,441Royal Bank of Canada 4.65% 0.00 403,933
©2018 Morningstar, Inc., Morningstar Investment Profiles™ 312-696-6000. All rights reserved. The information contained herein: (1) is proprietary to Morningstar and/or its content providers; (2) maynot be copied or distributed and (3) is not warranted to be accurate, complete or timely. Neither Morningstar nor its content providers are responsible for any damages or losses arising from any use ofinformation. Past performance is no guarantee of future performance. Visit our investment website at www.morningstar.com ß
®