brst br fact sheet stbrstbr br … corporation of india ltd 9 united spirits ltd 10 kotak mahindra...
TRANSCRIPT

BRSTRSTBRST
BRSTRSTBRST
BRSTBRSTBRSTBR
BRSTBRSTBRBRSTBR
ST
BRBRSTBRSTBRSTBRST
STBRST March 2018
FACT SHEETFACT SHEET
The Finance Budget of the Government of India has introduced long term capital gains tax at the rate
of 10% on gains from sale of equity assets held over a period of one year with a caveat of
grandfathering of prices as at 31st January 2018.
If we had our way thinking from investors' perspective because we ourselves are our biggest equity
investor; we would have loved to have continuance of the holiday on capital gains tax, but
considering national imperatives if a tax indeed had to be introduced, then we believe this was
probably the best way of doing so. In the past there has been discontent on implementing policy
changes which impact investments made in an older tax regime with no view on what could come up
in future. But the budget is clear that all gains made by investing in the past all the way upto the
highest price on the day of January 31, 2018 are not to be taxed. The tax will be applicable only on the
gains from the highest price of January 31, 2018 or the cost, whichever is higher and only on gains of
over Rs 1 lac in a financial year.
The markets have not reacted too well to this announcement. It is difficult to isolate how much of the
market reaction is towards the introduction of tax and how much of it is because of fiscal slippage
and resultant rise in bond yields in India, or because of a global correction in response to rise in US
bond yields and imminent Fed action to move on inflationary expectations. Few things that we
would like to submit for investors' consideration:
1) Taxes are an outcome; an outcome only if one has a gain. In many ways, a happy problem to have.
This means the returns come first and tax comes later. After this tantrum in the market, investors
will eventually go back to evaluating investments based on their relative return potential.
2) Even before this budgetary announcement came in, the markets were perceived to be over-
valued and they were priming for a correction. When this is the state in the market, any trigger
can cause a much-anticipated correction and talking of triggers we can't have our choice of
what's a nice trigger and what's not a nice trigger. Usually a trigger that makes the market correct
significantly is one which impairs growth potential of the underlying investment. It's very rare
one gets a correction basis a trigger which only impacts the tax on the outcomes and not the
potential outcomes itself. To that extent, let's just call this a market tantrum like a teenager
would when they don't have their way.
3) Yes; growth potential can be impacted if the macro turns challenging with rising rates and the US
scenario, there is increasing credence being given to such narrative and we cannot turn a blind
eye to the changing macro. But having said that, how to position portfolios is a key aspect. We
believe the budget has done enough to spur growth in sectors that we tend to own as pre-
dominant positions in our portfolios. In the background the economy is improving and corporate
results have surprised on the positive. We believe that when the dust settles, there will be returns
to be made and what we are witnessing now and may do so for another few days, will present
good opportunities.
4) In the last 6 months we have received concerns relating to underperformance vis-à-vis benchmark
indices where we had sent a note dated Nov 30, 2017 explaining that we have been
underperforming due to high quality high growth focus whereas in the market high beta, cheap,
contrarian, cyclicals and deep value ideas like PSU Banks, Metals, Telecom, Real Estate etc. have
been flying. From our investors' perspective this huge beta correction in indices would eventually
ensure we close the underperformance and start gaining alpha because whatever the budget has
done is beneficial to our portfolio positions.
Budget is clear that all gains
made by investing in the
past all the way upto the
highest price on the day of
January 31, 2018 are not to
be taxed. The tax will be
applicable only on the gains
from the highest price of
January 31, 2018 or the cost,
whichever is higher and only
on gains of over Rs 1 lac in a
financial year.
“
”
Usually a trigger that makes
t h e m a r k e t c o r r e c t
significantly is one which
impairs growth potential of
the underlying investment.
It's very rare one gets a
correction basis a trigger
which only impacts the tax
on the outcomes and not the
potential outcomes itself. To
that extent, let's just call this
a market tantrum like a
teenager would when they
don't have their way.
“
”
Aashish P SomaiyaaCEO

BRSTBRSTBRSTB
BRSTRSTBRST
BRSTBR
BRSTBRSTBRSBRSTBRS
ST
BRST5) Lastly on the markets, our past experience shows that whenever the market corrects due to
global concerns and Foreign Investors (FII) selling, eventually when the dust settles they buy
back more than what they sold because the impact of global events on domestically oriented
Indian companies is very limited and if at all, its short term. Our portfolio strategies are typically
60-70% domestic economy centric.
Moving forward, this note elucidates on the implications for our investors. Investors participate by
way of direct equities, PMS, AIFs and Mutual Funds when it comes to investing in equities. While the
budget documents and the Honorable Finance Minister's speech deals with just introduction of tax,
there are different implications for each mode of investing depending on who is the underlying
investor and what is the corporate structure of the vehicle of investment.
Mutual Funds continue to be an attractive proposition considering that they are sheltered entities
and buying and selling within the fund done by fund managers doesn't attract capital gains taxes. In
the past even redemption of funds after a year did not attract capital gains tax. To that extent there is
a change from here because now there will be 10% tax on gains at the time of redemption.
Yours Sincerely,
Aashish P Somaiyaa
CEO
Lastly on the markets, our
past experience shows that
w h e n e v e r t h e m a r ke t
corrects due to global
c o n c e r n s a n d F o r e i g n
Investors (F I I ) se l l ing,
eventually when the dust
settles they buy back more
t h a n w h a t t h e y s o l d
because the impact of
g l o b a l e v e n t s o n
d o m e st i ca l l y o r i e nte d
Indian companies is very
limited and if at all, its short
t e r m . O u r p o r t f o l i o
strategies are typically 60-
70% domestic economy
centric.
“
”
Mutual Funds continue to
be an attractive proposition
considering that they are
sheltered ent i t ies and
buying and selling within
the fund done by fund
managers doesn't attract
capital gains taxes. In the
past even redemption of
funds after a year did not
attract capital gains tax. To
that extent there is a change
from here because now
there will be 10% tax on
g a i n s a t t h e t i m e o f
redemption.
“
”

BRSTBRSTBRSTB
BRSTRSTBRST
BRSTBR
BRSTBRSTBRSBRSTBRS
ST
BRSTMotilal Oswal Focused 25 Fund (MOF25) (An open ended equity scheme investing in maximum 25 stocks intending to focus on Large Cap stocks)
Performance (As on 28-Feb-2018)
SIP Performance (As on 28-Feb-2018)
Date of inception: 13-May-13. = Incase, the start/end date of the concerned period is non business date (NBD), the NAV of the previous date is considered for computation of returns. The NAV per unit shown in the table is as on the start date of the said period. Past performance may or may not be sustained in the future. Performance is for Regular Plan Growth option. Different plans have different expense structure. = Mr. Siddharth Bothra is the Fund Manager for equity component since 23-Nov-2016; = Mr. Gautam Sinha Roy is the Co-Fund Manager for equity component since 26- Dec- 2016 and Mr. Abhiroop Mukherjee is the Fund Manager for debt component since inception. The performance of the Schemes managed by them are on page no. 2 ,3, 4, 5 and 6 = The scheme has been in existence for less than 5 years.
* Also represents additional benchmarkFor SIP returns, monthly investment of ` 10,000/- invested on the 1st day of every month has been considered. Performance is for Regular Plan Growth Option. Past performance may or may not be sustained in the future.
Industry Allocation
(Data as on 28-Feb-2018) Industry classification as recommended by AMFI
(Data as on 28-Feb-2018)
ScripSr. No. Weightage (%)
1 HDFC Bank Ltd
2 Maruti Suzuki India Ltd
3 HDFC Ltd
4
5
ICICI Lombard General Insurance Company Ltd
HDFC Standard Life InsuranceCompany Ltd
6
7
Britannia Industries Ltd8
Container Corporation of India Ltd
9 United Spirits Ltd
10 Kotak Mahindra Bank Ltd
8.76
8.68
8.17
6.44
6.40
6.27
5.90
5.37
5.13
4.94
Top 10 Holdings
Fund and Co-Fund Manager
Mr. Siddharth BothraManaging this fund since 23-Nov-2016He has a rich experience of more than 17 years
Mr. Gautam Sinha RoyCo-managing this fund since 26-Dec-2016He has close to 15 years of experience
Dividend HistoryDividend
perUnit (`)Cum Dividend
NAVEx Dividend
NAV
1.12
1.09
0.50
0.50
1.00
1.00
15.2579
14.9024
16.8789
15.9292
15.5745
14.9854
14.1379
13.8124
16.3789
15.4292
14.5745
13.9854
Record Date
Direct Plan
Regular Plan
Direct Plan
Regular Plan
Direct Plan
Regular Plan
21-Nov-2014
01-Jan-2016
24-Mar-2017
1 Year 3 Year Since Inception
CAGR(%)
Current Value ofInvestment of
` 10,000CAGR
(%)
Current Value ofInvestment of
` 10,000CAGR
(%)
Current Value ofInvestment of
` 10,000
8.47 16.90Scheme 17.84 12,761 21,15811,784
6.99 13.85Nifty 50 TRI (Benchmark) 19.75 12,248 18,63911,975
10.000016.579517.9544 NAV (`) Per Unit(21.1576 : as on 28-Feb-2018)
Scheme Statistics
7.45% (Annualised)Tracking Error*
Standard Deviation 12.8 (Annualised)
Sharpe Ratio# 0.19(Annualised)
Portfolio Turnover Ratio 0.42Beta 0.79
` 998.87(` cr)Monthly AAUM
Latest AUM (28-Feb-2018) ` 1007.81(` cr)
R-Squared 0.7
*Against the benchmark Nifty 50 Index. # Risk free returns based on last overnight MIBOR cut-off of 6.05% (Data as on 28-Feb-2018)
Mr. Abhiroop Mukherjee
Investment Objective
The investment objective of the Scheme is to achieve long term capital appreciation by investing in up to 25 companies with long term sustainable competitive advantage and growth potential. However, there can be no assurance or guarantee that the investment objective of the Scheme would be achieved.
BenchmarkNifty 50 TRI
Continuous OfferMinimum Application Amount : `5,000/- and in multiples of ̀ 1 /- thereafter.
Additional Application Amount : `1,000/- and in multiples of ̀ 1/- thereafter.
Redemption proceeds
Normally within 3 Business days from acceptance of redemption request.
Entry / Exit Load
Date of Allotment
13-May-2013
NAVRegular Plan Growth Option : ̀ 21.1576
Regular Plan Dividend Option : ̀ 17.7177
Direct Plan Growth Option : ̀ 22.6457
Direct Plan Dividend Option : ̀ 19.0562 ABB India Ltd
For Equity Component
For Debt Component since Inception
Pursuant to payment of dividend, NAV per unit will fall to the extent of the dividend payout and statutory levy (if applicable). Face value ` 10/-. Past performance may or may not be sustained in future.
3.18%
4.46%
6.44%
7.59%
13.60%
13.70%
14.94%
29.77%
Cement
Consumer Durables
Industrial Capital Goods
Transportation
Consumer Non Durables
Banks
Auto
Finance
5.54%Petroleum Products
1
Particular
People who have never withdrawn
Avg SIP amount
Average age of Investor (in years)
No. of locations from which inflow is received
Number of unique investors
LiveSIPs
Amount in Live SIP
Amount from new SIP in the month
Top 5% stocks to NAV
Top 10% stocks to NAV
New SIP registration in the month
43.72
2,301
47,780
33,491
14.31Crs
` 31,21,300
38.45%
66.05%
653
` 4274
68,532
Rolling Returns
Scheme
% times returns are in excess of 15%
Maximum
Average
Nifty 50 TRI
64.04%
21.92%
15.96%
76.17%
65.74%
% times returns arein excess of 7%
% times negative returns
68.72%
53.80%
16.11%
18.72%
55.74%
Minimum -18.02% -21.53%
98.88%
19.57%
11.46%
0.00%
10.71%
6.39%
1 Year
17.19%
0.00%
100.00%
25.59%
0.00%
75.00%
7.54%
3 Year 1 Year 3 Year
The above table depicts the daily rolling returns for Regular Plan Growth Option on compounded annualized basis from inception to 1 year & 3 year periods. It provides the maximum, minimum and average returns derived for all these time periods. Total number of time periods: 1year-940; 3years-448. The above chart is provided for illustration purpose only. Motilal Oswal AMC does not provide any guarantee/ assurance any minimum or maximum returns. Past performance may or may not be sustained in future
1.33%Cash & Equivalent
Investor Insights
Investor Age Bucket
1-30Years Not Available Grand Total
6,268 24,880 12,967 880 5,512 50,507
30-50Years
50-75Years
>75Years
BSE 100 TRI (Additional Benchmark)
1 Year 3 Year Since Inception
Scheme Nifty 50 TRI BSE* 100 TRI
Scheme Nifty 50 TRI BSE* 100 TRI Scheme Nifty 50 TRI BSE*
100 TRI
120,000 360,000 570,000 Invested Amount
Returns (CAGR) %
125,486 128,532 128,116 440,243 443,007 448,129 831,978 782,893 801,255Market Value
8.66 13.56 12.89 13.55 13.99 14.79 15.98 13.36 14.36
6.69 13.8420.46 12,145 18,63012,046
CategoryFocused Fund intending to invest in large cap stocks
Entry Load: Nil
Exit Load: 1% - If redeemed on or before 1 year from the date of allotment; Nil - If redeemed after 1 year from the date of allotment
No Exit Load applies for switch between MOF25, MOF30, MOF35 & MOFDYNAMIC. No Load for switch between Options within the Scheme. Investors have option to withdraw up to 12% p.a. of original investment cost (OIC) within 1 year (from date of investment) with no exit load. If the withdrawal amount is beyond 12% p.a. of OIC, the normal exit load applies on the amount greater than 12 % p.a.
BRSTBRSTBRSTB
BRSTRSTBRST
BRSTBR
BRSTBRSTBRSBRSTBRS
ST
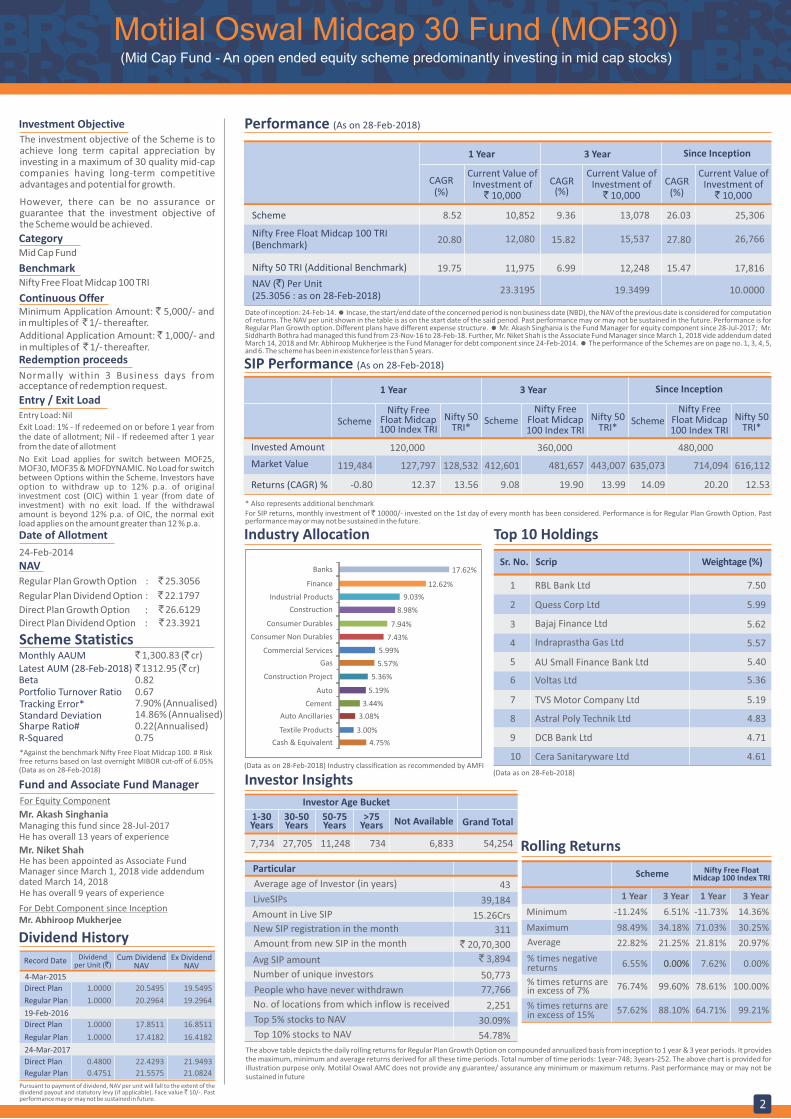
BRSTMotilal Oswal Midcap 30 Fund (MOF30)(Mid Cap Fund - An open ended equity scheme predominantly investing in mid cap stocks)
2
Performance (As on 28-Feb-2018)
Date of inception: 24-Feb-14. = Incase, the start/end date of the concerned period is non business date (NBD), the NAV of the previous date is considered for computation of returns. The NAV per unit shown in the table is as on the start date of the said period. Past performance may or may not be sustained in the future. Performance is for Regular Plan Growth option. Different plans have different expense structure. = Mr. Akash Singhania is the Fund Manager for equity component since 28-Jul-2017; Mr. Siddharth Bothra had managed this fund from 23-Nov-16 to 28-Feb-18. Further, Mr. Niket Shah is the Associate Fund Manager since March 1, 2018 vide addendum dated March 14, 2018 and Mr. Abhiroop Mukherjee is the Fund Manager for debt component since 24-Feb-2014. = The performance of the Schemes are on page no. 1, 3, 4, 5, and 6. The scheme has been in existence for less than 5 years.
* Also represents additional benchmarkFor SIP returns, monthly investment of ` 10000/- invested on the 1st day of every month has been considered. Performance is for Regular Plan Growth Option. Past performance may or may not be sustained in the future.
Industry Allocation
(Data as on 28-Feb-2018) Industry classification as recommended by AMFI
1 Year 3 Year Since Inception
19.3499 10.0000NAV (`) Per Unit(25.3056 : as on 28-Feb-2018)
CAGR (%)
Current Value ofInvestment of
` 10,000
CAGR (%)
Current Value ofInvestment of
` 10,000
CAGR(%)
Current Value ofInvestment of
` 10,000
23.3195
9.36 26.03Scheme 8.52
15.82 27.80 Nifty Free Float Midcap 100 TRI (Benchmark) 20.80
6.99
13,078
15,537
12,248 15.47
25,306
26,766
17,816Nifty 50 TRI (Additional Benchmark) 19.75
10,852
12,080
11,975
(Data as on 28-Feb-2018)
ScripSr. No. Weightage (%)
1 RBL Bank Ltd
2 Quess Corp Ltd
3 Bajaj Finance Ltd
4 Indraprastha Gas Ltd
5 AU Small Finance Bank Ltd
Voltas Ltd6
7 TVS Motor Company Ltd
8 Astral Poly Technik Ltd
9 DCB Bank Ltd
10 Cera Sanitaryware Ltd
7.50
5.99
5.62
5.57
5.40
5.36
5.19
4.83
4.71
4.61
Top 10 Holdings
Dividend HistoryDividend
per Unit (`)Cum Dividend
NAVEx Dividend
NAV
1.0000
1.0000
0.4800
0.4751
1.0000
1.0000
20.5495
20.2964
22.4293
21.5575
17.8511
17.4182
19.5495
19.2964
21.9493
21.0824
16.8511
16.4182
Record Date
Direct Plan
Regular Plan
Direct Plan
Regular Plan
Direct Plan
Regular Plan
4-Mar-2015
19-Feb-2016
24-Mar-2017
3.00%
3.08%
3.44%
5.19%
5.36%
5.57%
5.99%
7.43%
7.94%
8.98%
9.03%
12.62%
17.62%
Textile Products
Auto Ancillaries
Cement
Auto
Construction Project
Gas
Commercial Services
Consumer Non Durables
Consumer Durables
Construction
Industrial Products
Finance
Banks
4.75%Cash & Equivalent
Fund and Associate Fund Manager
Mr. Akash SinghaniaManaging this fund since 28-Jul-2017He has overall 13 years of experience
Mr. Niket ShahHe has been appointed as Associate Fund Manager since March 1, 2018 vide addendumdated March 14, 2018
Mr. Abhiroop Mukherjee
Investment ObjectiveThe investment objective of the Scheme is to achieve long term capital appreciation by investing in a maximum of 30 quality mid-cap companies having long-term competitive advantages and potential for growth.
However, there can be no assurance or guarantee that the investment objective of the Scheme would be achieved.
BenchmarkNifty Free Float Midcap 100 TRI
Continuous OfferMinimum Application Amount: ` 5,000/- and in multiples of ̀ 1/- thereafter.Additional Application Amount: ` 1,000/- and in multiples of ̀ 1/- thereafter.Redemption proceeds
Normally within 3 Business days from acceptance of redemption request.
Entry / Exit Load
Date of Allotment
24-Feb-2014
NAVRegular Plan Growth Option : ̀ 25.3056
Regular Plan Dividend Option : ̀ 22.1797
Direct Plan Growth Option : ̀ 26.6129
Direct Plan Dividend Option : ̀ 23.3921
Scheme Statistics
0.67Tracking Error*Standard Deviation
7.90% (Annualised)
Sharpe Ratio# 0.22(Annualised)
Portfolio Turnover RatioBeta 0.82
` 1,300.83 (` cr)Monthly AAUMLatest AUM (28-Feb-2018) ` 1312.95 (` cr)
14.86% (Annualised)
R-Squared 0.75
*Against the benchmark Nifty Free Float Midcap 100. # Risk free returns based on last overnight MIBOR cut-off of 6.05%(Data as on 28-Feb-2018)
For Equity Component
For Debt Component since Inception
Particular
People who have never withdrawn
Avg SIP amount
Average age of Investor (in years)
No. of locations from which inflow is received
Number of unique investors
LiveSIPs
Amount in Live SIP
Amount from new SIP in the month
Top 5% stocks to NAV
Top 10% stocks to NAV
New SIP registration in the month
43
2,251
50,773
39,184
15.26Crs
` 20,70,300
30.09%
54.78%
311
` 3,894
77,766
Rolling Returns
Scheme
% times returns are in excess of 15%
Maximum
Average
Nifty Free Float Midcap 100 Index TRI
98.49%
22.82%
6.55%
76.74%
57.62%
21.25%
0.00%
99.60%% times returns arein excess of 7%
% times negative returns
34.18%
0.00%
88.10%
78.61%
71.03%
21.81%
7.62%
64.71%
Minimum -11.24% 6.51% -11.73%
100.00%
30.25%
20.97%
0.00%
99.21%
14.36%
1 Year 3 Year 1 Year 3 Year
The above table depicts the daily rolling returns for Regular Plan Growth Option on compounded annualized basis from inception to 1 year & 3 year periods. It provides the maximum, minimum and average returns derived for all these time periods. Total number of time periods: 1year-748; 3years-252. The above chart is provided for illustration purpose only. Motilal Oswal AMC does not provide any guarantee/ assurance any minimum or maximum returns. Past performance may or may not be sustained in future
SIP Performance (As on 28-Feb-2018)
1 Year 3 Year Since Inception
SchemeNifty Free
Float Midcap100 Index TRI
Nifty 50TRI*
SchemeNifty Free
Float Midcap100 Index TRI
Nifty 50TRI*
SchemeNifty Free
Float Midcap100 Index TRI
Nifty 50TRI*
120,000 360,000 480,000 Invested Amount
Returns (CAGR) %
119,484 127,797 128,532 412,601 481,657 443,007 635,073 714,094 616,112Market Value
-0.80 12.37 13.56 9.08 19.90 13.99 14.09 20.20 12.53
Investor Insights
1-30Years Not Available Grand Total
7,734 27,705 11,248 734 6,833 54,254
30-50Years
50-75Years
>75Years
Investor Age Bucket
Pursuant to payment of dividend, NAV per unit will fall to the extent of the dividend payout and statutory levy (if applicable). Face value ` 10/-. Past performance may or may not be sustained in future.
CategoryMid Cap Fund
He has overall 9 years of experience
Entry Load: Nil
Exit Load: 1% - If redeemed on or before 1 year from the date of allotment; Nil - If redeemed after 1 year from the date of allotment
No Exit Load applies for switch between MOF25, MOF30, MOF35 & MOFDYNAMIC. No Load for switch between Options within the Scheme. Investors have option to withdraw up to 12% p.a. of original investment cost (OIC) within 1 year (from date of investment) with no exit load. If the withdrawal amount is beyond 12% p.a. of OIC, the normal exit load applies on the amount greater than 12 % p.a.

BRSTBRSTBRSTB
BRSTRSTBRST
BRSTBR
BRSTBRSTBRSBRSTBRS
ST
BRSTMotilal Oswal Multicap 35 Fund (MOF35)(Multi Cap Fund - An open ended equity scheme investing across large cap, mid cap, small cap stocks)
3
Performance (As on 28-Feb-2018)
Date of inception: 28-Apr-14. = Incase, the start/end date of the concerned period is non business date (NBD), the NAV of the previous date is considered for computation of returns. The NAV per unit shown in the table is as on the start date of the said period. Past performance may or may not be sustained in the future. Performance is for Regular Plan Growth option. Different plans have different expense structure.=Mr. Gautam Sinha Roy is the Fund Manager for equity component since 5-May-2014; = Mr. Siddharth Bothra is the Co-Fund Manager for equity component since 23-Nov-2016, Mr. Abhiroop Mukherjee is the Fund Manager for debt component since 28-Apr-2014 and Mr. Swapnil Mayekar for Foreign Securities since 10-Aug-2015. The performance of the Schemes managed by them are on page no. 1,2,4,5 and 6 = The scheme has been in existence for less than 5 years.
* Also represents additional benchmarkFor SIP returns, monthly investment of ` 10000/- invested on the 1st day of every month has been considered. Performance is for Regular Plan Growth Option. Past performance may or may not be sustained in the future.
Industry Allocation
(Data as on 28-Feb-2018) Industry classification as recommended by AMFI (Data as on 28-Feb-2018)
ScripSr. No. Weightage (%)
1 HDFC Ltd
2 HDFC Bank Ltd
3 Maruti Suzuki India Ltd
4 Hindustan Petroleum Corporation Ltd
5 Interglobe Aviation Ltd
IndusInd Bank Ltd6
7 Bharat Petroleum Corporation Ltd
8 Eicher Motors Ltd
9 United Spirits Ltd
10 Jubilant Life Sciences Ltd
9.22
7.89
7.79
5.20
4.72
4.58
4.39
4.32
4.27
3.92
Top 10 Holdings
Dividend History
1 Year 3 Year Since Inception
16.8487 10.0000NAV (`) Per Unit(26.4597 as on 28-Feb-2018)
CAGR(%)
Current Value ofInvestment of
` 10,000
CAGR(%)
Current Value ofInvestment of
` 10,000
CAGR(%)
Current Value ofInvestment of
` 10,000
21.7393
16.24 28.83Scheme 21.71
9.86 16.87Nifty 500 TRI (Benchmark) 21.70
6.99
15,704
13,261
12,248 13.55
26,460
18,202
16,290Nifty 50 TRI (Additional Benchmark) 19.75
12,171
12,170
11,975
Dividendper Unit (`)
Cum DividendNAV
Ex DividendNAV
0.3000
0.3000
24.5332
23.7803
24.2332
23.4803
Record Date
Direct Plan
Regular Plan
30-June-2017
Investment Objective
The investment objective of the Scheme is to achieve long term capital appreciation by primarily investing in a maximum of 35 equity & equity related instruments across sectors and market-capitalization levels.
However, there can be no assurance or guarantee that the investment objective of the Scheme would be achieved.
BenchmarkNifty 500 TRI
Continuous OfferMinimum Application Amount: ` 5,000/- and in multiples of ̀ 1/- thereafter.
Additional Application Amount: ` 1,000/- and in multiples of ̀ 1/- thereafter.
Redemption proceedsNormally within 3 Business days from acceptance of redemption request.
Entry / Exit Load
2.36%
2.80%
3.44%
4.72%
9.53%
9.60%
9.83%
12.11%
17.19%
27.10%
Software
Consumer Durables
Gas
Transportation
Pharmaceuticals
Petroleum Products
Consumer Non Durables
Auto
Banks
Finance
1.33%Cash & Equivalent
Fund and Co-Fund Manager
Date of Allotment
28-Apr-2014
NAV
Regular Plan Growth Option : ̀ 26.4597
Regular Plan Dividend Option : ̀ 26.1266
Direct Plan Growth Option : ̀ 27.4684
Direct Plan Dividend Option : ̀ 27.1338
Scheme Statistics
0.16
Tracking Error*
Standard Deviation6.81% (Annualised)
Sharpe Ratio# 0.71 (Annualised)
Portfolio Turnover RatioBeta 0.92
` 11,838.37 (` cr)Monthly AAUM
Latest AUM (28-Feb-2018) `12,032.00 (` cr)
14.41% (Annualised)
R-Squared 0.78
*Against the benchmark Nifty 500. # Risk free returns based on last overnight MIBOR cut-off of 6.05%
(Data as on 28-Feb-2018)
Mr. Gautam Sinha RoyManaging this fund since 5-May-2014
He has close to 15 years of experienceMr. Siddharth BothraCo-managing this fund since 23-Nov-2016
He has a rich experience of more than 17 years
Mr. Abhiroop Mukherjee
For Equity Component
For Debt Component since Inception
Mr. Swapnil Mayekar
Foreign Securities
Managing since 10-Aug-2015
Particular
People who have never withdrawn
Avg SIP amount
Average age of Investor (in years)
No. of locations from which inflow is received
Number of unique investors
LiveSIPs
Amount in Live SIP
Amount from new SIP in the month
Top 5% stocks to NAV
Top 10% stocks to NAV
New SIP registration in the month
41.87
8468
42,8588
2,87,509
135.48Crs
` 720,199,70
34.84%
56.32%
15,337
` 4712
515,158
Rolling Returns
Scheme
% times returns are in excess of 15%
Maximum
Average
Nifty 500 TRI
66.68%
24.45%
7.65%
79.04%
68.27%
24.52%
0.00%
100.00%% times returns arein excess of 7%
% times negative returns
33.63%
0.00%
100.00%
64.45%
39.63%
12.78%
19.55%
48.30%
Minimum -12.27% 15.32% -20.06%
100.00%
18.03%
12.62%
0.00%
6.67%
9.47%
1 Year 3 Year 1 Year 3 Year
The above table depicts the daily rolling returns for Regular Plan Growth Option on compounded annualized basis from inception to 1 year & 3 year periods. It provides the maximum, minimum and average returns derived for all these time periods. Total number of time periods: 1year-706; 3years-210. The above chart is provided for illustration purpose only. Motilal Oswal AMC does not provide any guarantee/ assurance any minimum or maximum returns. Past performance may or may not be sustained in future
SIP Performance (As on 28-Feb-2018)
Investor Insights
Investor Age Bucket
1-30Years
Not Available Grand Total
84,903 2,37,923 98,299 6,525 33,779 4,61,429
30-50Years
50-75Years
>75Years
1 Year 3 Year Since Inception
Scheme Nifty 500 TRI
Nifty 50TRI*
Scheme Nifty 500 TRI
Nifty 50TRI*
Scheme Nifty 500 TRI
Nifty 50TRI*
120,000 360,000 460,000 Invested Amount
Returns (CAGR) %
127,451 128,957 128,532 479,819 458,808 443,007 684,912 610,466 581,747Market Value
11.81 14.25 13.56 19.63 16.45 13.99 20.20 14.90 12.30
CategoryMulticap
Pursuant to payment of dividend, NAV per unit will fall to the extent of the dividend payout and statutory levy (if applicable). Face value ` 10/-. Past performance may or may not be sustained in future.
Entry Load: Nil
Exit Load: 1% - If redeemed on or before 1 year from the date of allotment; Nil - If redeemed after 1 year from the date of allotment
No Exit Load applies for switch between MOF25, MOF30, MOF35 & MOFDYNAMIC. No Load for switch between Options within the Scheme. Investors have option to withdraw up to 12% p.a. of original investment cost (OIC) within 1 year (from date of investment) with no exit load. If the withdrawal amount is beyond 12% p.a. of OIC, the normal exit load applies on the amount greater than 12 % p.a.

1.43%Cash & Equivalent
1.55%Pesticides
1.80%Auto Ancillaries
4.17%
3.26%
4.29%
4.33%
5.47%
7.02%
11.18%
11.47%
13.99%
26.74%
Software
Gas
Commercial Services
Consumer Non Durables
Transportation
Petroleum Products
Pharmaceuticals
Auto
Banks
Finance
2.30%Consumer Durables
BRSTBRSTBRSTB
BRSTRSTBRST
BRSTBR
BRSTBRSTBRSBRSTBRS
ST
BRSTMotilal Oswal Long Term Equity Fund (MOFLTE)(An open ended equity linked saving scheme with a statutory lock in of 3 years and tax benefit)
4
Performance (As on 28-Feb-2018)
SIP Performance (As on 28-Feb-2018)
Date of inception: 21-Jan-15. = Incase, the start/end date of the concerned period is non business date (NBD), the NAV of the previous date is considered for computation of returns. The NAV per unit shown in the table is as on the start date of the said period. Past performance may or may not be sustained in the future. Performance is for Regular Plan Growth Option. Different plans have different expense structure. = Mr. Gautam Sinha Roy is the Fund Manager for equity component since inception; = Mr. Siddharth Bothra is the Co-Fund Manager for equity component since 26- Dec- 2016 and Mr. Abhiroop Mukherjee is the Fund Manager for debt component since inception. The performance of the Schemes managed by them are on page no. 1, 2, 3, 5 and 6 = The scheme has been in existence for less than 5 years.
* Also represents additional benchmarkFor SIP returns, monthly investment of ` 10000/- invested on the 1st day of every month has been considered. Performance is for Regular Plan Growth Option. Past performance may or may not be sustained in the future.
Industry Allocation
(Data as on 28-Feb-2018) Industry classification as recommended by AMFI(Data as on 28-Feb-2018)
ScripSr. No. Weightage (%)
1 HDFC Ltd
2 HDFC Bank Ltd
3 Maruti Suzuki India Ltd
4 IndusInd Bank Ltd
5 Interglobe Aviation Ltd
Eris Lifesciences Ltd6
7ICICI Lombard General InsuranceCompany Ltd
8 Bharat Petroleum Corporation Ltd
9 Eicher Motors Ltd
10 Jubilant Life Sciences Ltd
8.94
7.91
7.12
6.09
5.47
4.75
4.98
4.48
4.35
4.30
Top 10 Holdings
Fund and Co-Fund Manager
Investment Objective
The investment objective of the Scheme is to generate long-term capital appreciation from a diversified portfolio of predominantly equity and equity related instruments. However, there can be no assurance or guarantee that the investment objective of the Scheme would be achieved.
BenchmarkNifty 500 TRI
Continuous Offer
Minimum Application Amount: ` 500/- and in multiples of ̀ 500/- thereafter.
Additional Purchase: ` 500/- and in multiples of ̀ 500/- thereafter.
Redemption proceeds
Normally within 3 Business days from acceptance of redemption request.
Entry / Exit LoadNil
Date of Allotment
21-Jan-2015
NAV
Regular Plan Growth Option : ̀ 17.9107
Regular Plan Dividend Option : ̀ 16.2857
Direct Plan Growth Option : ̀ 18.7108
Direct Plan Dividend Option : ̀ 17.0771
Scheme Statistics
Dividend HistoryDividend
per Unit (`)Cum Dividend
NAVEx Dividend
NAV
0.50
0.50
15.0915
14.6324
14.5915
14.1324
Record Date
Direct Plan
Regular Plan
24-March-2017
Mr. Gautam Sinha RoyManaging this fund since inceptionHe has close to 15 years of experience
Mr. Siddharth BothraCo-managing this fund since 26-Dec-2016He has a rich experience of more than 17 years
Mr. Abhiroop Mukherjee
For Equity Component
For Debt Component since Inception
Particular
People who have never withdrawn
Avg SIP amount
Average age of Investor (in years)
No. of locations from which inflow is received
Number of unique investors
LiveSIPs
Amount in Live SIP
Amount from new SIP in the month
Top 5% stocks to NAV
Top 10% stocks to NAV
New SIP registration in the month
41
3,967
90,375
42,528
14.64Crs
` 39,02,950
35.52%
58.38%
1,160
` 3,443
97,662
Rolling Returns
Scheme
% times returns are in excess of 15%
Maximum
Average
Nifty 500 TRI
% times returns arein excess of 7%
% times negative returns
Minimum
50.60%
23.19%
8.81%
77.97%
66.67%
-6.95%
1 Year
67.24%
42.05%
14.63%
16.67%
56.90%
-18.66%
1 Year
The above table depicts the daily rolling returns for Regular Plan Growth Option on compounded annualized basis from inception to 1 year period. It provides the maximum, minimum and average returns derived for all these time periods. Total number of time periods: 1year-522. The above chart is provided for illustration purpose only. Motilal Oswal AMC does not provide any guarantee/ assurance any minimum or maximum returns. Past performance may or may not be sustained in future
1 Year 3 Year Since Inception
10.5302 10.0000NAV (`) Per Unit(17.9107 as on 28-Feb-2018)
CAGR(%)
Current Value ofInvestment of
` 10,000
CAGR(%)
Current Value ofInvestment of
` 10,000
CAGR(%)
Current Value ofInvestment of
` 10,000
14.0838
18.97 20.63 Scheme 27.17
9.86 10.22 Nifty 500 TRI (Benchmark) 21.70
6.99
16,840
13,261
12,248 7.43
17,911
13,528
12,494Nifty 50 TRI (Additional Benchmark) 19.75
12,717
12,170
11,975
0.3606
Tracking Error*
Standard Deviation
6.31% (Annualised)
Sharpe Ratio# 0.94 (Annualised)
Portfolio Turnover RatioBeta 0.88
` 830.99 (` cr)Monthly AAUM
Latest AUM (28-Feb-2018) ` 851.89 (` cr)
13.7% (Annualised)
R-Squared 0.8
*Against the benchmark Nifty 500. # Risk free returns based on last overnight MIBOR cut-off of 6.05%
(Data as on 28-Feb-2018)
Investor Insights
1-30Years Not Available Grand Total
19,055 41,496 17,765 1,946 8,542 88,804
30-50Years
50-75Years
>75Years
Investor Age Bucket
1 Year 3 Year Since Inception
Scheme Nifty 500 TRI
Nifty 50TRI*
Scheme Nifty 500 TRI
Nifty 50TRI*
Scheme Nifty 500 TRI
Nifty 50TRI*
120,000 360,000 370,000 Invested Amount
Returns (CAGR) %
130,800 128,957 128,532 504,975 458,808 443,007 522,886 472,336 455,501Market Value
17.25 14.25 13.56 23.32 16.45 13.99 23.15 16.08 13.61
Pursuant to payment of dividend, NAV per unit will fall to the extent of the dividend payout and statutory levy (if applicable). Face value ` 10/-. Past performance may or may not be sustained in future.
Category
ELSS
1.00
1.00
18.6816
17.8836
17.6816
16.8836
Direct Plan
Regular Plan
05-February-2018

BRSTBRSTBRSTB
BRSTRSTBRST
BRSTBR
BRSTBRSTBRSBRSTBRS
ST
BRSTMotilal Oswal Dynamic Fund (MOFDYNAMIC)(An open ended dynamic asset allocation fund)
5
Performance (As on 28-Feb-2018)
SIP Performance (As on 28-Feb-2018)
Date of inception: 27-Sep-2016 = Incase, the start/end date of the concerned period is non business date (NBD), the NAV of the previous date is considered for computation of returns. The NAV per unit shown in the table is as on the start date of the said period. Past performance may or may not be sustained in the future. Performance is for Regular Plan Growth Option. Different plans have different expense structure. = Mr. Gautam Sinha Roy is the Fund Manager for equity component since 23-Nov-2016; = Mr. Siddharth Bothra is the Co-Fund Manager for equity component since 23-Nov-2016 and Mr. Abhiroop Mukherjee is the Fund Manager for debt component since inception. The performanceof the Schemes managed by them are on page no. 1,2,3, 4 and 6. = The scheme has been in existence for less than 3 years
1 Year Since Inception
* Also represents additional benchmarkFor SIP returns, monthly investment of ` 10000/- invested on the 1st day of every month has been considered. Performance is for Regular Plan Growth Option. Past performance may or may not be sustained in the future.
Industry Allocation
(Data as on 28-Feb-2018) Industry classification as recommended by AMFI
Scheme CRISIL Hybrid 35 + 65 - Aggressive Index TRI
Nifty 50 TRI*
Scheme CRISIL Hybrid 35 + 65 - Aggressive Index TRI
Nifty 50 TRI*
120,000 170,000 Invested Amount
(Data as on 28-Feb-2018)
ScripSr. No. Weightage (%)
1 HDFC Ltd
2 Maruti Suzuki India Ltd
3 Bajaj Finance Ltd
4 Lupin Ltd
5 HDFC Bank Ltd
United Spirits Ltd6
7 Jubilant Life Sciences Ltd
8 Interglobe Aviation Ltd
9 Titan Company Ltd
10 Eicher Motors Ltd
8.03
7.14
6.33
4.64
4.43
3.75
3.14
3.10
2.82
2.70
Top 10 Holdings
Fund and Co-Fund Manager
Dividend History
1 Year Since Inception
10.0000NAV (`) Per Unit(11.9939: as on 28-Feb-2018)
CAGR (%) Current Value ofInvestment of ` 10,000
CAGR (%)Current Value of
Investment of ` 10,000
10.4300
13.64Scheme 14.99
12.25 CRISIL Hybrid 35 + 65 - Aggressive TRI (Benchmark)
14.71
15.31
11,994
11,787
12,245Nifty 50 TRI (Additional Benchmark) 19.75
11,499
11,471
11,975
Returns (CAGR) %
126,102 125,687 137,687 128,533 185,038 191,344Market Value
9.64 8.98 28.29 13.56 11.92 16.93
Dividendper Unit (`)
Cum DividendNAV
Ex DividendNAV
0.1200
0.0700
0.2600
0.1200
0.0700
11.7876
12.1794
11.8446
11.6028
11.9529
11.6676
12.1094
11.5846
11.4828
11.8829
Record Date
23-Oct-2017
29-Jan-2018
23-Oct-2017
Annual Dividend( Regular Plan)
23-Oct-2017
29-Jan-2018
Quarterly Dividend (Direct Plan)
Quarterly Dividend (Regular Plan)
Annual Dividend( Direct Plan)
0.2600 11.6879 11.427923-Oct-2017
Equity
Bonds and NCDs
Fixed Deposit
CBLO
Cash and Cash Equivalent (including Book Value of Futures)
Equity Derivatives
Instrument Name
Allocation
65.93
Weightage%
24.82
Total
0.76
2.27
31.99
-25.76
100
Investment Objective
The investment objective is to generate long term capital appreciation by investing in equity and equity related instruments including equity derivatives, debt, money market instruments and units issued by REITs and InvITs.
However, there can be no assurance or guarantee that the investment objective of the Scheme would be achieved.
BenchmarkCRISIL Hybrid 35 + 65 - Aggressive TRI
Continuous OfferMinimum Application Amount : ` 5,000/- and in multiples of ̀ 1/- thereafter.
Additional Application Amount: ` 1,000/- and in multiples of ̀ 1/- thereafter.
Redemption proceeds
Normally within 3 Business days from acceptance of redemption request.
Date of Allotment27-Sep-2016
NAVRegular Plan Growth Option : ̀ 11.9939Regular Plan - Quarterly Dividend Option : ̀ 11.7144
Direct Plan Growth Option : ` 12.1983Direct Plan - Quarterly Dividend Option : ̀ 11.9470
Scheme Statistics
Portfolio Turnover Ratio 4.49
` 1,534.45 (` cr)Monthly AAUMLatest AUM (28-Feb-2018) ` 1574.81(cr)
Regular Plan - Annual Dividend Option : ̀ 11.7271
Direct Plan - Annual Dividend Option : ̀ 11.9305
Entry / Exit Load
Mr. Gautam Sinha RoyManaging this fund since 23-Nov-2016He has close to 15 years of experience
Mr. Siddharth BothraCo-managing this fund since 23-Nov-2016 He has a rich experience of more than 17 years
Mr. Abhiroop Mukherjee
Investors Behavioural Analysis
Investor Age Bucket
1-30 Years 30-50 Years 50-75 Years > 75 years Not AvailableGrandTotal
5,695 21,196 16,205 1,581 3,322 47,999
Particular
Investor Insights
Average age of Investor (in years)
LiveSIPs
Amount in Live SIP
New SIP registration in the month
Amount from new SIP in the month
Avg SIP amount
Number of unique investors
People who have never withdrawn
No. of locations from which inflow is received
Top 5% stocks to NAV
Top 10% stocks to NAV
47.33
8,713
4.52Crs
175
` 9,07,230
`5186
44,931
1,164
30.57%
46.08%
57,301
For Equity Component
For Debt Component since Inception
Quantitative Indicators
(Data as on 28-Feb-2018)
Average Maturity
YTMPortfolio Modified Duration
3.21 Yrs
8.45%0.07 yrs
1.97%
2.42%
2.82%
2.86%
3.10%
4.61%
6.34%
8.83%
9.84%
21.76%
Software
Commercial Services
Consumer Durables
Petroleum Products
Transportation
Consumer Non Durables
Banks
Pharmaceuticals
Auto
Finance
1.36%Gas
(Data as on 28-Feb-2018)
Pursuant to payment of dividend, NAV per unit will fall to the extent of the dividend payout and statutory levy (if applicable). Face value ` 10/-. Past performance may or may not be sustained in future.
CategoryDynamic Asset Allocation
Entry Load: Nil
Exit Load: 1% - If redeemed on or before 1 year from the date of allotment; Nil - If redeemed after 1 year from the date of allotment
No Exit Load applies for switch between MOF25, MOF30, MOF35 & MOFDYNAMIC. No Load for switch between Options within the Scheme. Investors have option to withdraw up to 12% p.a. of original investment cost (OIC) within 1 year (from date of investment) with no exit load. If the withdrawal amount is beyond 12% p.a. of OIC, the normal exit load applies on the amount greater than 12 % p.a.

BRSTBRSTBRSTB
BRSTRSTBRST
BRSTBR
BRSTBRSTBRSBRSTBRS
ST
BRSTInvestment Objective
The investment objective of the Scheme is to generate optimal returns consistent with moderate levels of risk and liquidity by investing in debt securities and money market securities.
However, there can be no assurance or guarantee that the investment objective of the Scheme would be achieved.
BenchmarkCRISIL Ultra Short Term Debt TRI
Continuous Offer
Minimum Application Amount : `5,000/- and in multiples of ̀ 1/- thereafter.Additional Application Amount : `1000/- and in multiples of ̀ 1/- thereafter.
Redemption proceeds
Normally within 1 Business day from acceptance of redemption request.
Entry / Exit LoadNil
Date of Allotment6-Sep-2013
NAV
Motilal Oswal Ultra Short Term Fund (MOFUSTF)(An open ended ultra-short term debt scheme investing in instruments such that the Macaulay#
duration of the portfolio is between 3 months and 6 months)
6
Performance (As on 28-Feb-2018)
Scheme Statistics` 1,005.23 (` cr)Monthly AAUM
Latest AUM (28-Feb-2018)` 1023.22 (` cr)
Fund Manager
Mr. Abhiroop Mukherjee Managing this fund since inception
He has over 10 years of experience
Dividend HistoryDividend
per Unit (`)Cum Dividend
NAVEx Dividend
NAV
0.16
0.15
10.1781
10.1746
10.1700
10.1715
10.0212
10.0241
10.0299
10.0344
Record Date
30-Jun-2017
29-Sep-2017
30-Jun-2017
29-Sep-2017
Quarterly Dividend (Direct Plan)
Quarterly Dividend (Regular Plan)
0.14 10.1607 10.020829-Dec-2017
0.14
0.140.13 10.1596 10.031329-Dec-2017
10.0470
10.0384
10.0000
10.0000
24-Dec-2017
29-Jan-2018
Monthly Dividend (Direct Plan)
0.05
0.040.05 10.0467 10.000023-Feb-2018
10.0441
10.0362
10.0016
10.0015
29-Dec-2017
29-Jan-2018
Monthly Dividend (Regular Plan)
0.04
0.040.04 10.0447 10.001523-Feb-2018
1 Year 3 Year Since Inception
10.0000NAV (`) Per Unit ( 13.3311 as on28-Feb-2018)
CAGR(%)
Current Value ofInvestment of
` 10,000
CAGR (%)
Current Value ofInvestment of
` 10,000
CAGR(%)
Current Value ofInvestment of
` 10,000
6.10 6.62Scheme 5.51
7.77 8.71CRISIL Short Term Bond Fund TRI** 5.67
7.36
11,945
12,519
12,377 8.04
13,331
14,537
14,143CRISIL Liquifex TRI (Additional Benchmark) 6.68
10,551
10,567
10,668
Regular Plan Growth Option
Regular Plan - Daily Dividend Option
Regular Plan - Fortnightly Dividend Option
Regular Plan - Monthly Dividend Option
Regular Plan - Weekly Dividend Option
Regular Plan - Quarterly Dividend Option
Direct Plan Growth Option
Direct Plan Growth - Daily Dividend Option
Direct Plan Growth - Weekly Dividend Option
Direct Plan Growth - Fortnightly Dividend Option
Direct Plan Growth - Monthly Dividend Option
Direct Plan Growth - Quarterly Dividend Option
: ̀ 13.3311
: ` 10.0109
: ` 10.008
: ` 10.003
: ̀ 10.0045
: ̀ 10.1125
: ̀ 13.6715
: ̀ 10.0008
: ̀ 10.0079
: ̀ 10.0052
: ̀ 10.0022
: ̀ 10.1095
11.158612.6352
Quantitative Indicators
*For Motilal Oswal Ultra Short Term Fund Modified Duration is equal to its Average maturity(Data as on 28-Feb-2018)
Average Maturity
YTM
112.26 days/0.31
6.80%
Pursuant to payment of dividend, NAV per unit will fall to the extent of the dividend payout and statutory levy (if applicable). Face value ` 10/-. Past performance may or may not be sustained in future.
Date of inception: 6-Sep-2013. = Incase, the start/end date of the concerned period is non business date (NBD), the NAV of the previous date is considered for computation of returns. The NAV per unit shown in the table is as on the start date of the said period. Past performance may or may not be sustained in the future. Performance is for Regular Plan Growth option. Different plans have different expense structure. = Mr. Abhiroop Mukherjee is the Fund Manager since 6-Sep-2013. The performance of the Schemes managed by him are on page no. 1,2,3,4 and 5 = The scheme has been in existence for less than 5 years.
Catagory
Ultra Short Duration Fund
(Data as on 28-Feb-2018)
Small Industries Development Bank of India 2.408
CRISIL A1+
ICRA A1+
CARE A1+
IND A1+
Rating
Rating
% to Net Assets
69.24
21.51
4.84
2.29
Power Finance Corporation Ltd
Security
Top 10 Holdings Commercial Paper (CP)
9.63
Weightage (%)
Housing Development Finance Corporation Ltd 9.47
Bajaj Finance Ltd 4.88
Bajaj Finance Ltd 4.86
Tata Sons Ltd 4.64
Mahindra & Mahindra Financial Services Ltd 2.44
Kotak Mahindra Prime Ltd 2.42
Kotak Mahindra Investments Ltd 2.41
PNB Housing Finance Ltd 2.38
Sr. No.
1
2
3
4
5
6
7
8
9
IDFC Bank Ltd
Security
Top 10 Holdings Certificate of Deposit (CD)
7.18
Weightage (%)
IndusInd Bank Ltd 4.87
ICICI Bank Ltd 4.78
Axis Bank Ltd 4.77
Small Industries Development Bank of India Ltd 4.62
Axis Bank Ltd 2.44
Vijaya Bank 2.44
ICICI Bank Ltd 2.43
Yes Bank Ltd 2.43
Sr. No.
1
2
3
4
5
6
7
8
9
(Data as on 28-Feb-2018)
(Data as on 28-Feb-2018)
Cash and Cash Equivalent 2.13
#please refer to page no.21 of SID of MOFUSTF
**Returns are against old benchmark CRISIL Short Term Bond Fund Index TRI. The benchmark has been changed from 9th February 2018 to CRISIL Ultra Short Term Debt TRI
BRSTBRSTBRSTB
BRSTRSTBRST
BRSTBR
BRSTBRSTBRSBRSTBRS
ST
BRSTInvestment Objective
The Scheme seeks investment return that corresponds (before fees and expenses) generally to the performance of the Nifty 50 Index (Underlying Index), subject to tracking error. However, there can be no assurance or guarantee that the investment objective of the Scheme would be achieved.
Benchmark
Nifty 50 TRI
Continuous Offer
On NSE: Investors can buy/sell units of the Scheme in round lot of 1 unit and in multiples thereof.
Directly with the Mutual Fund: Investors can buy/sell units of the Scheme only in creation unit size i.e. 50,000 units and in multiples thereof.
Redemption proceeds
Normally within 3 Business days from acceptance of redemption request.
Date of Allotment
28-Jul-2010
NAV
Growth Option : ̀ 100.4933
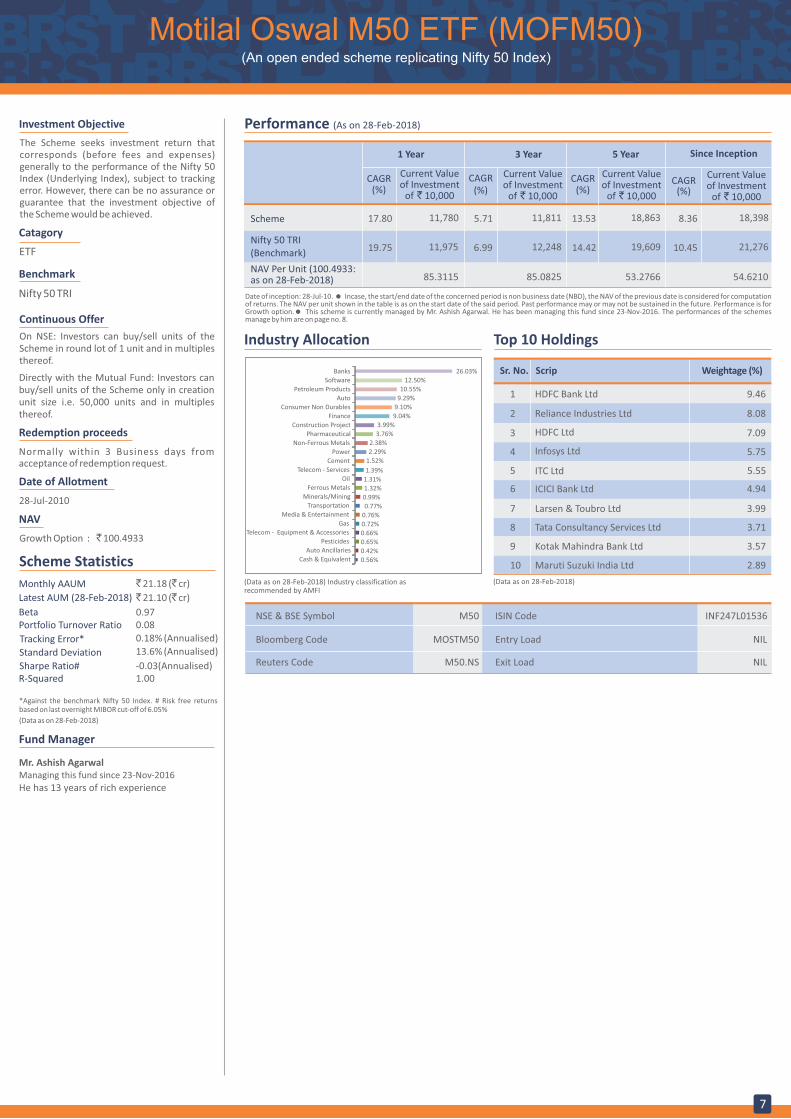
Motilal Oswal M50 ETF (MOFM50)(An open ended scheme replicating Nifty 50 Index)
7
Performance (As on 28-Feb-2018)
Scheme Statistics
Fund Manager
0.08
Tracking Error*
Standard Deviation
0.18% (Annualised)
Sharpe Ratio# -0.03(Annualised)
Portfolio Turnover RatioBeta 0.97
` 21.18 (` cr)Monthly AAUM
Latest AUM (28-Feb-2018) ` 21.10 (` cr)
13.6% (Annualised)
R-Squared 1.00
1 Year 3 Year Since Inception
CAGR (%)
Current Valueof Investment
of ` 10,000
CAGR (%)
Current Valueof Investment
of ` 10,000
CAGR(%)
Current Valueof Investment
of ` 10,000
5.71 8.36Scheme 17.80
6.99 10.45Nifty 50 TRI (Benchmark)
19.75
11,811
12,248
18,398
21,276
11,780
11,975
54.621085.082585.3115NAV Per Unit (100.4933: as on 28-Feb-2018)
5 Year
CAGR (%)
13.53
14.42
Current Valueof Investment
of ` 10,000
18,863
19,609
53.2766
Mr. Ashish Agarwal Managing this fund since 23-Nov-2016
He has 13 years of rich experience
*Against the benchmark Nifty 50 Index. # Risk free returns based on last overnight MIBOR cut-off of 6.05%
(Data as on 28-Feb-2018)
Industry Allocation
(Data as on 28-Feb-2018) Industry classification as recommended by AMFI
(Data as on 28-Feb-2018)
ScripSr. No. Weightage (%)
1 HDFC Bank Ltd
2 Reliance Industries Ltd
3 HDFC Ltd
4 Infosys Ltd
5 ITC Ltd
ICICI Bank Ltd6
7 Larsen & Toubro Ltd
8 Tata Consultancy Services Ltd
9 Kotak Mahindra Bank Ltd
10 Maruti Suzuki India Ltd
9.46
8.08
7.09
5.75
5.55
4.94
3.99
3.71
3.57
2.89
Top 10 Holdings
0.56%
0.42%
0.65%
0.66%
0.72%
0.76%
0.77%
0.99%
1.32%
1.31%
1.39%
1.52%
2.29%
2.38%
3.76%
3.99%
9.04%
9.10%
9.29%
10.55%
12.50%
26.03%
Cash & Equivalent
Auto Ancillaries
Pesticides
Telecom - Equipment & Accessories
Gas
Media & Entertainment
Transportation
Minerals/Mining
Ferrous Metals
Oil
Telecom - Services
Cement
Power
Non-Ferrous Metals
Pharmaceutical
Construction Project
Finance
Consumer Non Durables
Auto
Petroleum Products
Software
Banks
NSE & BSE Symbol
Bloomberg Code
Reuters Code
M50
MOSTM50
M50.NS
ISIN Code
Entry Load
Exit Load
INF247L01536
NIL
NIL
Date of inception: 28-Jul-10. = Incase, the start/end date of the concerned period is non business date (NBD), the NAV of the previous date is considered for computation of returns. The NAV per unit shown in the table is as on the start date of the said period. Past performance may or may not be sustained in the future. Performance is for Growth option.= This scheme is currently managed by Mr. Ashish Agarwal. He has been managing this fund since 23-Nov-2016. The performances of the schemes manage by him are on page no. 8.
Catagory
ETF
BRSTBRSTBRSTB
BRSTRSTBRST
BRSTBR
BRSTBRSTBRSBRSTBRS
ST
BRSTInvestment Objective
The Scheme seeks investment return that corresponds (before fees and expenses) to the performance of Nifty Free Float Midcap 100 Index (Underlying Index), subject to tracking error. However, there can be no assurance or guarantee that the investment objective of the Scheme would be achieved.
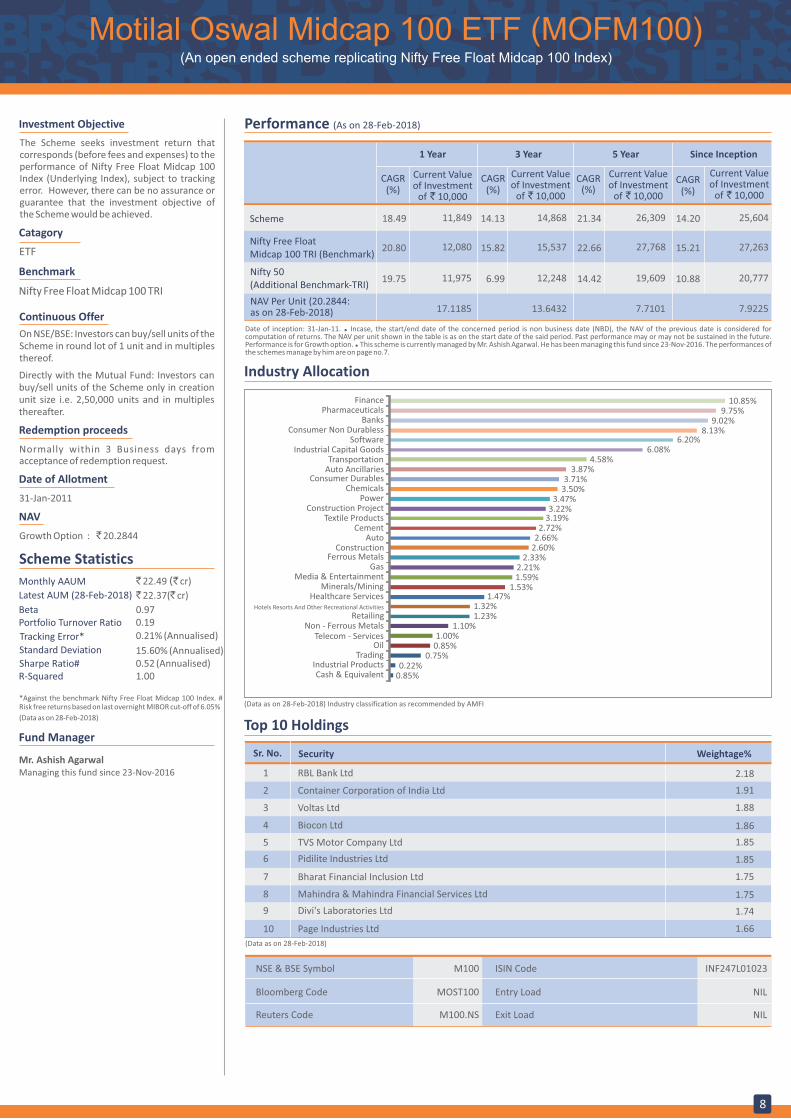
Motilal Oswal Midcap 100 ETF (MOFM100)(An open ended scheme replicating Nifty Free Float Midcap 100 Index)
8
Performance (As on 28-Feb-2018)
1 Year 3 Year Since Inception
CAGR(%)
Current Valueof Investment
of ` 10,000
CAGR (%)
Current Valueof Investment
of ` 10,000
CAGR (%)
Current Valueof Investment
of ` 10,000
14.13 14.20Scheme 18.49 14,868 25,60411,849
5 Year
CAGR (%)
21.34
Current Valueof Investment
of ` 10,000
26,309
6.99 10.88Nifty 50 (Additional Benchmark-TRI)
19.75 12,248 20,77711,975 14.42 19,609
7.922513.643217.1185NAV Per Unit (20.2844:as on 28-Feb-2018) 7.7101
15.82 15.21Nifty Free Float Midcap 100 TRI (Benchmark)
20.80 15,537 27,26312,080 22.66 27,768
Benchmark
Nifty Free Float Midcap 100 TRI
Continuous Offer
On NSE/BSE: Investors can buy/sell units of the Scheme in round lot of 1 unit and in multiples thereof.
Directly with the Mutual Fund: Investors can buy/sell units of the Scheme only in creation unit size i.e. 2,50,000 units and in multiples thereafter.
Redemption proceeds
Normally within 3 Business days from acceptance of redemption request.
Date of Allotment
31-Jan-2011
NAV
Growth Option : ̀ 20.2844
Scheme Statistics
Fund Manager
0.19
Tracking Error*
Standard Deviation
0.21% (Annualised)
Sharpe Ratio# 0.52 (Annualised)
Portfolio Turnover RatioBeta 0.97
` 22.49 (` cr)Monthly AAUM
Latest AUM (28-Feb-2018) ` 22.37(` cr)
15.60% (Annualised)
R-Squared 1.00
*Against the benchmark Nifty Free Float Midcap 100 Index. # Risk free returns based on last overnight MIBOR cut-off of 6.05%
(Data as on 28-Feb-2018)
Mr. Ashish Agarwal Managing this fund since 23-Nov-2016
Industry Allocation
(Data as on 28-Feb-2018) Industry classification as recommended by AMFI
0.75%0.85%1.00%
1.10%1.23%1.32%
1.47%1.53%
1.59%2.21%
2.33%2.60%2.66%2.72%
3.19%3.22%
3.47%3.50%3.71%
3.87%4.58%
6.08%6.20%
8.13%9.02%
9.75%10.85%
Oil
RetailingNon - Ferrous Metals
Hotels Resorts And Other Recreational Activities
Healthcare ServicesMinerals/Mining
Media & EntertainmentGas
Ferrous MetalsConstruction
AutoCement
Textile ProductsConstruction Project
PowerChemicals
Consumer DurablesAuto AncillariesTransportation
Industrial Capital GoodsSoftware
Consumer Non DurablessBanks
PharmaceuticalsFinance
0.22%Industrial Products
(Data as on 28-Feb-2018)
RBL Bank Ltd
Security
Top 10 Holdings
2.18
Weightage%
Container Corporation of India Ltd 1.91
Voltas Ltd 1.88
Biocon Ltd 1.86
TVS Motor Company Ltd 1.85
Pidilite Industries Ltd 1.85
Bharat Financial Inclusion Ltd 1.75
Mahindra & Mahindra Financial Services Ltd 1.75
Divi's Laboratories Ltd 1.74
Page Industries Ltd 1.66
Sr. No.
1
2
3
4
5
6
7
8
9
10
Telecom - Services
Trading
NSE & BSE Symbol
Bloomberg Code
Reuters Code
M100
MOST100
M100.NS
ISIN Code
Entry Load
Exit Load
INF247L01023
NIL
NIL
Date of inception: 31-Jan-11. = Incase, the start/end date of the concerned period is non business date (NBD), the NAV of the previous date is considered for computation of returns. The NAV per unit shown in the table is as on the start date of the said period. Past performance may or may not be sustained in the future. Performance is for Growth option. = This scheme is currently managed by Mr. Ashish Agarwal. He has been managing this fund since 23-Nov-2016. The performances of the schemes manage by him are on page no.7.
0.85%Cash & Equivalent
Catagory
ETF
BRSTBRSTBRSTB
BRSTRSTBRST
BRSTBR
BRSTBRSTBRSBRSTBRS
ST
BRSTInvestment Objective
The Scheme seeks investment return that corresponds (before fees and expenses) generally to the performance of the NASDAQ-100 Index, subject to tracking error. However, there can be no assurance or guarantee that the investment objective of the Scheme would be achieved.
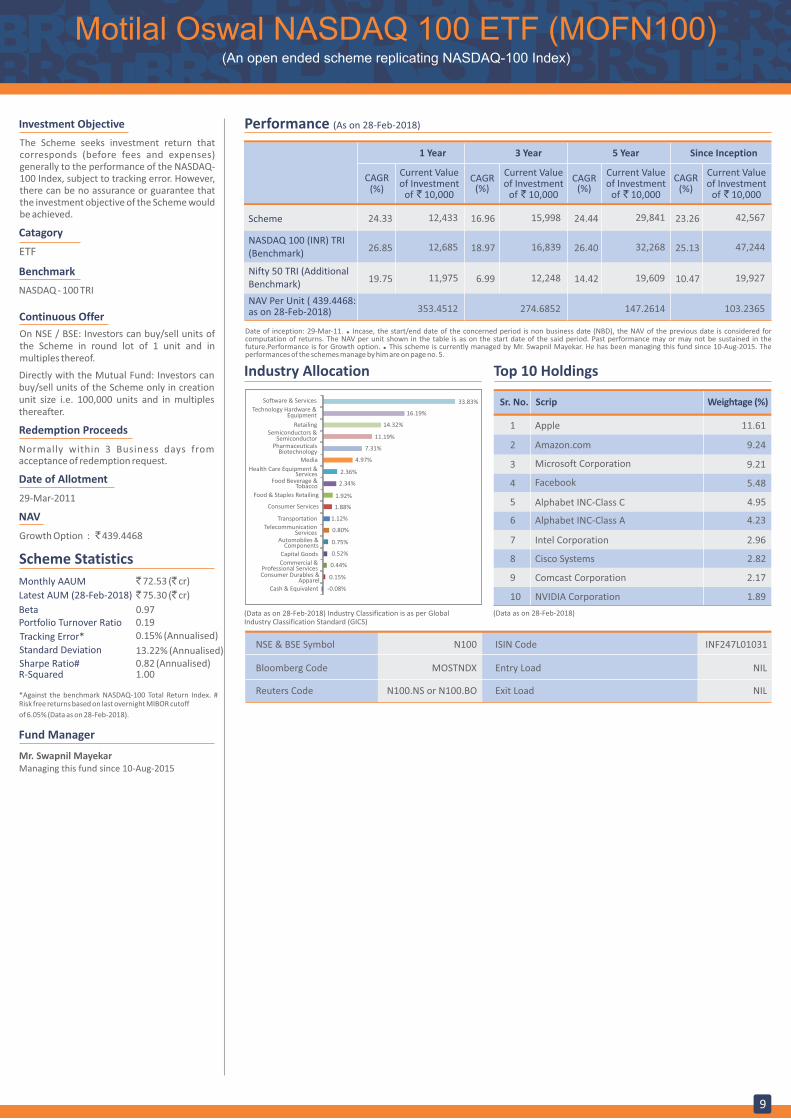
Motilal Oswal NASDAQ 100 ETF (MOFN100)(An open ended scheme replicating NASDAQ-100 Index)
9
Performance (As on 28-Feb-2018)
1 Year 3 Year Since Inception
CAGR (%)
Current Valueof Investment
of ` 10,000
CAGR (%)
Current Valueof Investment
of ` 10,000
CAGR(%)
Current Valueof Investment
of ` 10,000
16.96 23.26Scheme 24.33 15,998 42,56712,433
5 Year
CAGR (%)
24.44
Current Valueof Investment
of ` 10,000
29,841
6.99 10.47Nifty 50 TRI (Additional Benchmark)
19.75 12,248 19,92711,975 14.42 19,609
103.2365274.6852353.4512NAV Per Unit ( 439.4468: as on 28-Feb-2018) 147.2614
18.97 25.13NASDAQ 100 (INR) TRI (Benchmark)
26.85 16,839 47,24412,685 26.40 32,268
Benchmark
NASDAQ - 100 TRI
Continuous Offer
On NSE / BSE: Investors can buy/sell units of the Scheme in round lot of 1 unit and in multiples thereof.
Directly with the Mutual Fund: Investors can buy/sell units of the Scheme only in creation unit size i.e. 100,000 units and in multiples thereafter.
Redemption Proceeds
Normally within 3 Business days from acceptance of redemption request.
Date of Allotment
29-Mar-2011
NAV
Growth Option : ̀ 439.4468
Scheme Statistics
Fund Manager
0.19
Tracking Error*
Standard Deviation
0.15% (Annualised)
Sharpe Ratio# 0.82 (Annualised)
Portfolio Turnover RatioBeta 0.97
` 72.53 (` cr)Monthly AAUM
Latest AUM (28-Feb-2018) ` 75.30 (` cr)
13.22% (Annualised)
R-Squared 1.00
*Against the benchmark NASDAQ-100 Total Return Index. # Risk free returns based on last overnight MIBOR cutoff
of 6.05% (Data as on 28-Feb-2018).
Mr. Swapnil MayekarManaging this fund since 10-Aug-2015
Industry Allocation
(Data as on 28-Feb-2018) Industry Classification is as per Global Industry Classification Standard (GICS)
(Data as on 28-Feb-2018)
ScripSr. No. Weightage (%)
1 Apple
2 Amazon.com
3 Microsoft Corporation
4 Facebook
5 Alphabet INC-Class C
Alphabet INC-Class A6
7 Intel Corporation
8 Cisco Systems
9 Comcast Corporation
10 NVIDIA Corporation
11.61
9.24
9.21
5.48
4.95
4.23
2.96
2.82
2.17
1.89
Top 10 Holdings
-0.08%
0.15%
0.44%
0.52%
0.75%
0.80%
1.12%
1.88%
1.92%
2.34%
2.36%
4.97%
7.31%
11.19%
14.32%
16.19%
33.83%
Cash & Equivalent
Consumer Durables &Apparel
Commercial &Professional Services
Capital Goods
Automobiles &Components
TelecommunicationServices
Transportation
Consumer Services
Food & Staples Retailing
Food Beverage &Tobacco
Health Care Equipment &Services
Media
PharmaceuticalsBiotechnology
Semiconductors &Semiconductor
Retailing
Technology Hardware &Equipment
Software & Services
NSE & BSE Symbol
Bloomberg Code
Reuters Code
N100
MOSTNDX
N100.NS or N100.BO
ISIN Code
Entry Load
Exit Load
INF247L01031
NIL
NIL
Date of inception: 29-Mar-11. = Incase, the start/end date of the concerned period is non business date (NBD), the NAV of the previous date is considered for computation of returns. The NAV per unit shown in the table is as on the start date of the said period. Past performance may or may not be sustained in the future.Performance is for Growth option. = This scheme is currently managed by Mr. Swapnil Mayekar. He has been managing this fund since 10-Aug-2015. The performances of the schemes manage by him are on page no. 5.
Catagory
ETF
BRSTBRSTBRSTB
BRSTRSTBRST
BRSTBR
BRSTBRSTBRSBRSTBRS
ST
BRST
10
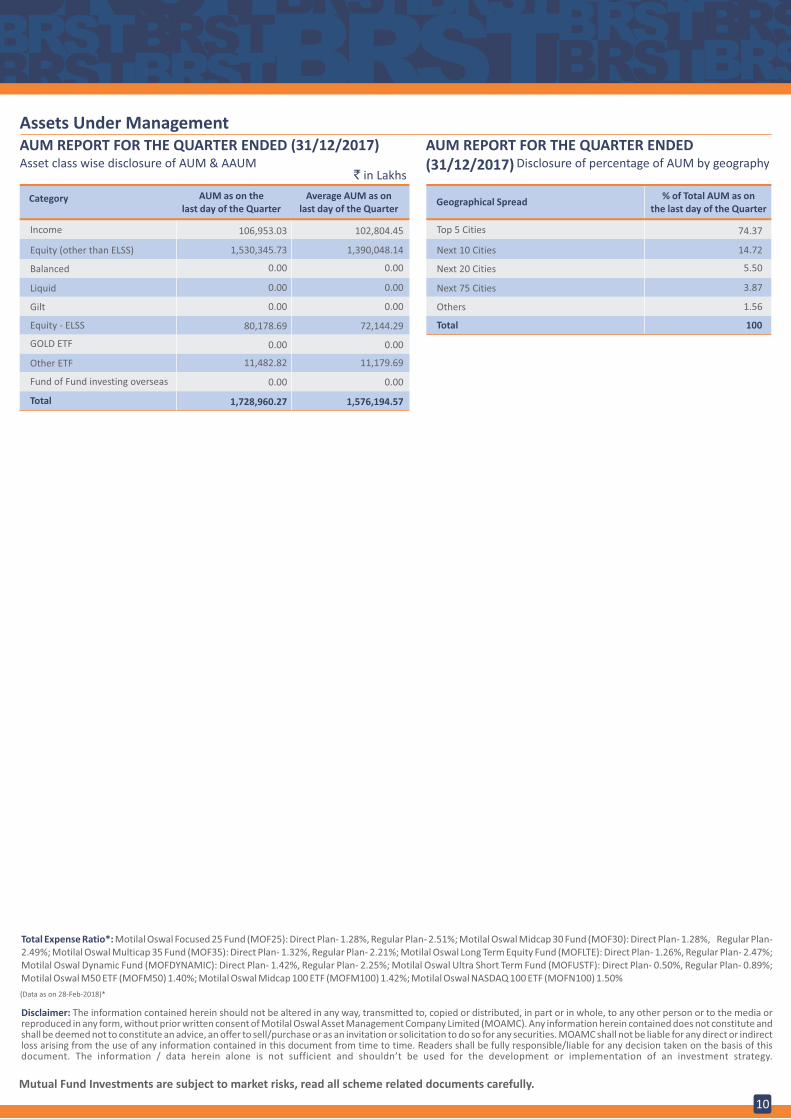
Assets Under Management
AUM REPORT FOR THE QUARTER ENDED (31/12/2017)Asset class wise disclosure of AUM & AAUM
` in Lakhs
Income
Category AUM as on the last day of the Quarter
Average AUM as on last day of the Quarter
Equity (other than ELSS)
Balanced
Liquid
Gilt
Equity - ELSS
GOLD ETF
Other ETF
Fund of Fund investing overseas
Total
106,953.03
1,530,345.73
0.00
0.00
0.00
80,178.69
0.00
11,482.82
0.00
1,728,960.27
102,804.45
1,390,048.14
0.00
0.00
0.00
72,144.29
0.00
11,179.69
0.00
1,576,194.57
AUM REPORT FOR THE QUARTER ENDED (31/12/2017) Disclosure of percentage of AUM by geography
Top 5 Cities
Geographical Spread % of Total AUM as on
the last day of the Quarter
Next 10 Cities
Next 20 Cities
Next 75 Cities
Others
Total
74.37
14.72
5.50
3.87
1.56
100
Total Expense Ratio*: Motilal Oswal Focused 25 Fund (MOF25): Direct Plan- 1.28%, Regular Plan- 2.51%; Motilal Oswal Midcap 30 Fund (MOF30): Direct Plan- 1.28%, Regular Plan- 2.49%; Motilal Oswal Multicap 35 Fund (MOF35): Direct Plan- 1.32%, Regular Plan- 2.21%; Motilal Oswal Long Term Equity Fund (MOFLTE): Direct Plan- 1.26%, Regular Plan- 2.47%; Motilal Oswal Dynamic Fund (MOFDYNAMIC): Direct Plan- 1.42%, Regular Plan- 2.25%; Motilal Oswal Ultra Short Term Fund (MOFUSTF): Direct Plan- 0.50%, Regular Plan- 0.89%; Motilal Oswal M50 ETF (MOFM50) 1.40%; Motilal Oswal Midcap 100 ETF (MOFM100) 1.42%; Motilal Oswal NASDAQ 100 ETF (MOFN100) 1.50%
Disclaimer: The information contained herein should not be altered in any way, transmitted to, copied or distributed, in part or in whole, to any other person or to the media orreproduced in any form, without prior written consent of Motilal Oswal Asset Management Company Limited (MOAMC). Any information herein contained does not constitute andshall be deemed not to constitute an advice, an offer to sell/purchase or as an invitation or solicitation to do so for any securities. MOAMC shall not be liable for any direct or indirectloss arising from the use of any information contained in this document from time to time. Readers shall be fully responsible/liable for any decision taken on the basis of thisdocument. The information / data herein alone is not sufficient and shouldn’t be used for the development or implementation of an investment strategy.
Mutual Fund Investments are subject to market risks, read all scheme related documents carefully.
(Data as on 28-Feb-2018)*
BRSTBRSTBRSTB
BRSTRSTBRST
BRSTBR
BRSTBRSTBRSBRSTBRS
ST
BRST
11
RR
00
00
4_4
01
12
_01
0
Risk Disclosure and Disclaimer
Statutory Details: Constitution: Motilal Oswal Mutual Fund has been set up as a trust under the Indian Trust Act, 1882. Trustee: Motilal Oswal Trustee Company Ltd. Investment Manager: Motilal Oswal Asset Management Company Ltd. Sponsor: Motilal Oswal Securities Ltd. Risk Factors: (1) All Mutual Funds and securities investments are subject to market risks and there can be no assurance that the Scheme's objectives will be achieved (2) As the price / value / interest rates of the securities in which the Scheme invests fluctuates, the Net Asset Value (NAV) of units issued under the Scheme may go up or down depending upon the factors and forces affecting the securities market (3) Past performance of the Sponsor/AMC/Mutual Fund and its affiliates does not indicate the future performance of the Scheme and may not provide a basis of comparison with other investments (4) The name of the Schemes does not in any manner indicate the quality of the Schemes, its future prospects and returns. Investors are therefore urged to study the terms of offer carefully and consult their Investment Advisor before they invest in the Scheme (5) The Sponsor is not responsible or liable for any loss or shortfall resulting from the operation of the Mutual Fund beyond the initial contribution made by it of an amount of Rs. 1 Lac towards setting up of the Mutual Fund (6) The present Schemes are not guaranteed or assured return Schemes. Mutual Fund investments are subject to market risks, read all scheme related documents carefully.
IISL Disclaimer: (MOFM50) and (MOFM100): (MOFM50) and (MOFM100) offered by Motilal Oswal Asset Management Company Limited (MOAMC) or its affiliates is not sponsored, endorsed, sold or promoted by India Index Services & Products Limited (IISL) and its affiliates. IISL and its affiliates do not make any representation or warranty, express or implied (including warranties of merchantability or fitness for particular purpose or use) to the owners of (MOFM50) and (MOFM100) or any member of the public regarding the advisability of investing in securities generally or in the (MOFM50) and (MOFM100) linked to Nifty 50 Index and Nifty Free Float Midcap 100 Index respectively or particularly in the ability of Nifty 50 Index and Nifty Free Float Midcap 100 Index to track general stock market performance in India. Please read the full Disclaimers in relation to the Nifty 50 Index and Nifty Free Float Midcap 100 Index in the Scheme Information Document. NASDAQ-100 Disclaimer: (MOFN100): NASDAQ®, OMX®, NASDAQ OMX®, NASDAQ-100®, and NASDAQ-100 Index®, are registered trademarks of The NASDAQ OMX Group, Inc. (which with its affiliates is referred to as the “Corporations”) and are licensed for use by MOAMC. MOSt Shares NASDAQ 100 (the Product) has not been passed on by the Corporations as to their legality or suitability. The Product are not issued, endorsed, sold, or promoted by the Corporations. THE CORPORATIONS MAKE NO WARRANTIES AND BEAR NO LIABILITY WITH RESPECT TO THE PRODUCT. NSE Disclaimer: It is to be distinctly understood that the permission given by NSE should not in any way be deemed or construed that the Scheme Information Document has been cleared or approved by NSE nor does it certify the correctness or completeness of any of the contents of the Scheme Information Document. BSE Disclaimer: It is to be distinctly understood that the permission given by Bombay Stock Exchange Ltd. should not in any way be deemed or construed that the SID has been cleared or approved by Bombay Stock Exchange Ltd. nor does it certify the correctness or completeness of any of the contents of the SID. The investors are advised to refer to the SID for the full text of the Disclaimer Clause of the Bombay Stock Exchange Ltd.
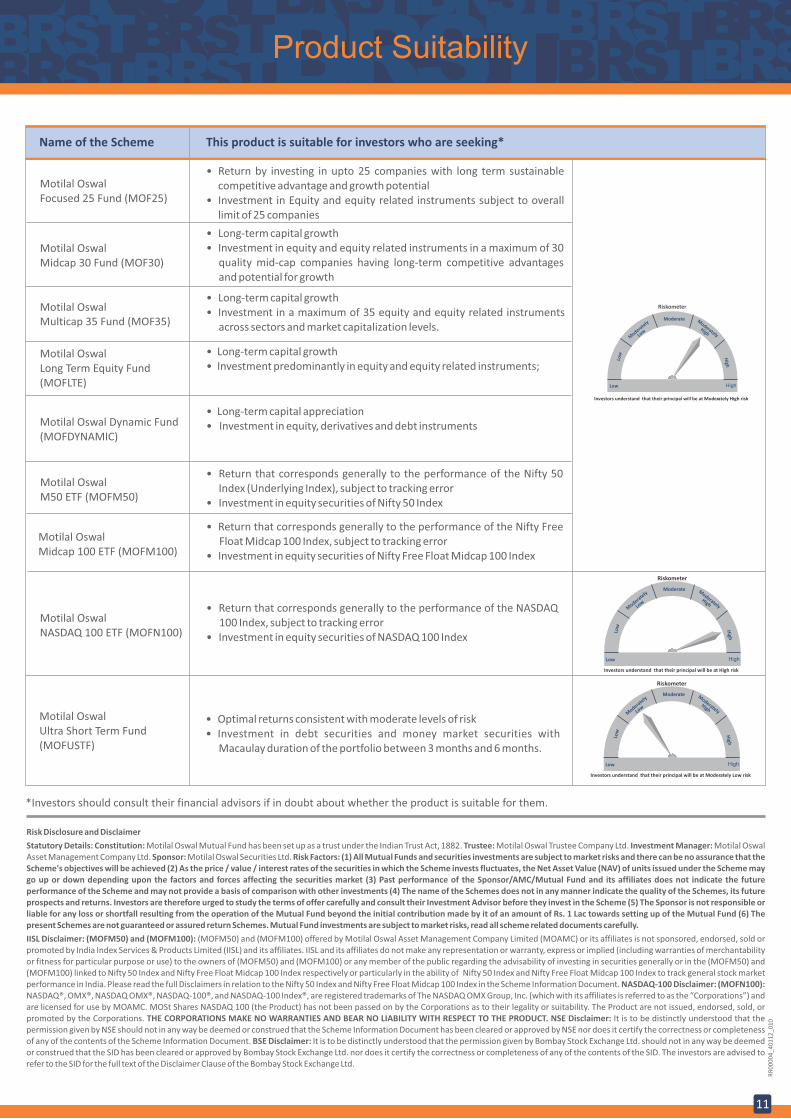
*Investors should consult their financial advisors if in doubt about whether the product is suitable for them.
Name of the Scheme This product is suitable for investors who are seeking*
Motilal Oswal Focused 25 Fund (MOF25)
• Return by investing in upto 25 companies with long term sustainable competitive advantage and growth potential
• Investment in Equity and equity related instruments subject to overall limit of 25 companies
Motilal OswalMidcap 30 Fund (MOF30)
• Long-term capital growth• Investment in equity and equity related instruments in a maximum of 30
quality mid-cap companies having long-term competitive advantages and potential for growth
Motilal OswalMulticap 35 Fund (MOF35)
• Long-term capital growth• Investment in a maximum of 35 equity and equity related instruments
across sectors and market capitalization levels.
Motilal OswalLong Term Equity Fund(MOFLTE)
• Long-term capital growth• Investment predominantly in equity and equity related instruments;
Motilal Oswal M50 ETF (MOFM50)
• Return that corresponds generally to the performance of the Nifty 50 Index (Underlying Index), subject to tracking error
• Investment in equity securities of Nifty 50 Index
Motilal Oswal Midcap 100 ETF (MOFM100)
• Return that corresponds generally to the performance of the Nifty Free Float Midcap 100 Index, subject to tracking error
• Investment in equity securities of Nifty Free Float Midcap 100 Index
Low
Modera
tely
Low
High
ModeratelyHigh
Moderate
HighLow
Investors understand that their principal will be at Moderately High risk
Riskometer
Motilal Oswal Ultra Short Term Fund (MOFUSTF)
• Optimal returns consistent with moderate levels of risk • Investment in debt securities and money market securities with
Macaulay duration of the portfolio between 3 months and 6 months.
Low
Modera
tely
Low
High
ModeratelyHigh
Moderate
HighLow
Investors understand that their principal will be at Moderately Low risk
Riskometer
Motilal Oswal NASDAQ 100 ETF (MOFN100)
• Return that corresponds generally to the performance of the NASDAQ 100 Index, subject to tracking error
• Investment in equity securities of NASDAQ 100 Index
Low
Modera
tely
Low
High
ModeratelyHigh
Moderate
HighLow
Investors understand that their principal will be at High risk
Riskometer
Motilal Oswal Dynamic Fund (MOFDYNAMIC)
• Long-term capital appreciation• Investment in equity, derivatives and debt instruments
Product Suitability

BRSTBRSTBRST
BRSTBRST
BRSTBRST
Sit Tight Approach
BUY RIGHT : SIT TIGHTBuying quality companies and riding their growth cycle