brunel international n.v. - cdn.beleggen.nl · brunel international annual report 2011 | message to...
TRANSCRIPT


brunel international n.v.annual report2011

brunel international | annual report 2011 | contents | 3
contents
chapters index
1 message to the shareholders 4
2 management 6
3 corporate profile of brunel international 8
4 financial highlights 10
5 report from the supervisory board 14
6 corporate governance 19
7 risks, risk management and control systems 23
8 brunel’s vision, objectives and strategy 29
9 report from the board of directors 35
10 the brunel share 44
11 annual accounts 2011 47
12 other information 79
independent auditor’s report 81
13 group financial record 83
14 addresses 85

1message to the shareholders
brunel international annual report 2011 | message to the shareholders | 5
Brunel, our company, organisation and business developed extremely well in 2011. With a revenue growth of 36% and an increase in EBIT of 72% the results are exceptional. We are very proud of all of our colleagues who made this possible. The good performance in 2011 should not be taken in isolation but rather as part of Brunel’s growth over the last 10 years. This continuous growth has, over the last 10 years, increased the revenue by a multiple of five. In this period the organisation became stronger with a focus on global growth markets.
Brunel in Europe increased revenue in 2011 by 27% over that of 2010. Brunel is well placed to benefit from the more positive economic conditions in Germany, The Netherlands, Belgium and Austria. With 55 Branches well located in the most significant industrial areas we further developed our business in highly specialised markets.
Total revenue in our global operations of the Oil and Gas Industry increased in 2011 by 41% over that of 2010. This growth has been achieved by our flexibility in being able to provide our services in the positive growth regions of Canada, South East Asia and Australia. We need, at this point, to mention and thank specifically our team in Australia for their particularly successful business achievements in the offshore sector.
Our strategy is simple, we aim to further expand globally in the specialised technical segment. The quality of the Brunel team and the entrepreneurial culture are the keys to our continued successful business development. Our organisational culture includes a strong focus on the quality of our service to the clients.
Last year was good despite the existing economic difficulties. Europe and other world economic regions continue to face uncertainty. However, Brunel is well placed to deal with these uncertainties through the global flexibility of the Oil and Gas division together with the technical specialties of Brunel Germany. Brunel weathered the downturn in 2008 – 2009 very well, in fact increasing market share. Being able to focus our business in the more positive regions of the world means we can manage the negative effects of the economic circumstances and be very confident of continued growth.
The Board of Directors Jan Arie van Barneveld Chief Executive Officer Rob van der Hoek Chief Financial Officer

2management

brunel international annual report 2011 | management | 7
Board of Directors
J.A. (Jan Arie) van Barneveld
Chief Executive Officer, male (1950)
Jan Arie van Barneveld was appointed Chief Executive Officer of Brunel International N.V. on September 29th, 2000.
His most recent position before transferring to Brunel was as director of Avéro Life & Mortgages (part of the Achmea Insurance Group) Before that Jan Arie van Barneveld held successive general management positions at Hooge Huys Insurances, Belgian insurance company Corona and engineering factory Meijn. Van Barneveld started his career at Coopers & Lybrand. He completed his Quantitative Business Economics and Accounting studies at the Vrije Universiteit Amsterdam.
R. (Rob) van der Hoek
Chief Financial Officer, male (1954)
Rob van der Hoek was appointed Chief Financial Officer of Brunel International N.V. on August 20th 2009 for a period of 4 years.
Van der Hoek holds a master degree in Business Economics from the University of Groningen. He started his career at Coopers & Lybrand. He held various positions at United Biscuits and Sara Lee/DE. Since 2006, Van der Hoek has been Associate with Boer & Croon Executive Managers.
3corporate profile of brunel

brunel international annual report 2011 | corporate profile of brunel international | 9
Brunel is a global provider of business services that specialises in project management and the flexible placement of professionals.
Brunel had developed a strong global brand and operates from its own international network of 97 branch offices in 34 countries.Brunel serves the world market from two main perspectives. On the one hand, the company aims its services at specific supra-regional business lines. Examples include our focus on the worldwide Oil and Gas industry and on the international automotive, rail, aerospace, telecom and pharmacy sectors. On the other hand, Brunel focuses on Europe, more specific Germany, The Netherlands, Belgium, Austria and Poland.
Access to excellenceIn everything we do we follow our – firmly rooted - cultural values: eagerness, result driven, operational excellence. This allows us to provide added value for clients in business and government by filling their knowledge and project capacity needs in a highly effective manner. The company stands out from its competitors thanks to the superior services, which centre around high-quality account management and recruitment management and in-depth knowledge of the market segments and related disciplines.
Since its incorporation in 1975, Brunel has developed into an international group with over 10,000 employees and an annual revenue of EUR 980 million (2011).
Brunel International N.V. is listed on Euronext Amsterdam and is included in the Mid Cap Index (AMX).

4financial highlights

brunel international annual report 2011 | financial highlights | 11
EUR million, unless stated otherwise
2011 2010 ProfitNet revenue 979.9 720.9Gross profit 193.6 152.0Other income 0.0 -2.1Operating costs 129.2 112.6Operating profit (EBIT) 64.4 37.3Result before tax 65.3 38.4Tax 22.2 12.8Group income 43.1 25.6Net income 42.9 25.2 Ratios Change in revenue on previous year 35.9% -2.4%Gross margin 19.8% 21.1%Operating profit / revenue 6.6% 5.2%Group income / revenue 4.4% 3.6% Balance Working capital 207.7 175.0Group equity 236.6 202.2Balance sheet total 388.7 294.2Net cash flow 20.5 -15.0 Ratios Shareholders’ equity / total assets 60.8% 68.7%Current assets / current liabilities 2.38 2.91 WorkforceEmployees total (average) 9,545 7,656Employees indirect (average) 1,225 1,077Employees total (year end) 10,386 8,766Employees indirect (year end) 1,254 1,082 Shares in EurosEarnings per share 1.83 1.09Shareholders’ equity per share 10.05 8.69Dividend per share 0.90 0.80Highest price 34.95 29.63Lowest price 20.00 19.46Closing price at 31 December 22.78 29.49

brunel international annual report 2011 | financial highlights | 12
revenue (x euro million) operating profit (x euro million)
net income (x euro million) earnings per share (x euro)
0
200
400
600
800
1,000
201120102009200820070
10
20
30
40
50
60
70
80
20112010200920082007
0
10
20
30
40
50
201120102009200820070,0
0,5
1,0
1,5
2,0
20112010200920082007
revenue (x euro million) operating profit (x euro million)
net income (x euro million) earnings per share (x euro)
0
200
400
600
800
1,000
201120102009200820070
10
20
30
40
50
60
70
80
20112010200920082007
0
10
20
30
40
50
201120102009200820070,0
0,5
1,0
1,5
2,0
20112010200920082007
revenue (x euro million) operating profit (x euro million)
net income (x euro million) earnings per share (x euro)
0
200
400
600
800
1,000
201120102009200820070
10
20
30
40
50
60
70
80
20112010200920082007
0
10
20
30
40
50
201120102009200820070,0
0,5
1,0
1,5
2,0
20112010200920082007
revenue (x euro million) operating profit (x euro million)
net income (x euro million) earnings per share (x euro)
0
200
400
600
800
1,000
201120102009200820070
10
20
30
40
50
60
70
80
20112010200920082007
0
10
20
30
40
50
201120102009200820070,0
0,5
1,0
1,5
2,0
20112010200920082007

brunel international annual report 2011 | financial highlights | 13
group equity (x euro million) group equity / total assets (%)
average number of direct employees working capital (x euro million)
0
50
100
150
200
250
201120102009200820070
10
20
30
40
50
60
70
80
20112010200920082007
0
2,000
4,000
6,000
8,000
10,000
201120102009200820070
50
100
150
200
250
20112010200920082007

5report from the supervisory board

brunel international annual report 2011 | report from the supervisory board | 15
Mr. J.E. (Hans Eric) Jansen Chairman, (1937, male, Dutch) At the Annual General Meeting of Shareholders on 12 May 2011 Mr. Jansen stepped down, after having
reached the end of his third and final four-year term as Supervisory Board member of which he served 11 years as Chairman.
Drs. A. (Aat) Schouwenaar Chairman, (1946, male, Dutch) Appointed: Annual General Meeting of Shareholders on 22 May 2001 Current term: 2009 – 2013 Former main directorship: Chairman of the Management Board and Chief Executive Officer of Endemol B.V. Other directorships: Chairman of the Supervisory Board of Asito Dienstengroep S.E. and Holland Casino, Member of the
Supervisory Board of Stage Entertainment B.V., Docdata N.V. and Stadion Amsterdam N.V.
Ir. D. (Daan) van Doorn Vice Chairman, (1948, male, Dutch) Appointed: Annual General Meeting of Shareholders on 18 May 2006 Current term: 2010 – 2014 Former main directorship: Chief Executive Officer and Chairman of the Executive Board of Vion N.V. Other directorships: Chairman of the Supervisory Board of Delta N.V.
Drs. J.C.M. (Maarten) Schönfeld Supervisory Director, (1949, male, Dutch) Appointed: Annual General Meeting of Shareholders on 12 May 2011 Current term: 2011 – 2015 Former main directorship: Chief Financial Officer and Vice Chairman of the Executive Board of Stork B.V. Other directorships: Member of the Supervisory Board of Arcadis N.V., S&B Industrial Minerals S.A. Athens (Greece), Technical
University Delft, University of the Arts The Hague, Board member of VEUO and member of the AFM committee on financial reporting
Appointment and selectionThe members of the Supervisory Board are appointed for a term of 4 years and may thereafter be reappointed. They can remain up to 12 years from the date of their first appointment.

brunel international annual report 2011 | report from the supervisory board | 16
Position and major topics in 2011The company has a strong position and succeeded in even strengthening its position versus the competition. The Supervisory Board considers the company’s strategy, the development of senior management and sustainable growth in turnover and profitability to be among its key areas of focus. In the year under review, it was closely involved in assessing business objectives and strategic planning for the future. The discussions included the presentations of the Board of Directors on strategy and operations, including the IT-infrastructure and the development of the Energy division. The current challenging economic situation and the debt crisis in Europe required special attention of the Supervisory Board. The Board discussed the possible implications on in particular the European activities and the scenarios that were designed to intervene on time. On this basis, the Supervisory Board believes that adequate measures were taken by the Board of Directors. Continuous vigilance is required. In addition the Supervisory Board was informed about the development of the large Energy projects in Australia.In order to become acquainted with the business and the senior management of the various group entities in an independent way, the Supervisory Board attaches great importance to meeting local management. In 2011 the members of the Supervisory Board attended a two-day meeting of senior global management in Thailand.
Corporate Social ResponsibilityDuring the year under review the Supervisory Board examined how the different aspects of Corporate Social Responsibility (‘CSR’) are structurally integrated into the business and how CSR is embedded at all levels of the organisation. Between the locations are significant differences in this area. The Supervisory Board encourages discussion on CSR.
FinancingWith a solvency ratio of 61% and a healthy cash position the company has a solid equity to fund the projected growth from its own resources.
Tax planningThe Board of Directors has explained the current tax risks and tax control framework of the company in detail. The fiscal policy is conservative. The Supervisory Board has approved the fiscal policy of the company.
Compliance with laws and regulationsThe national and international laws and regulations relating to the company cover areas such as employment, work permits, health and safety, foreign exchange and taxes. The Supervisory Board has discussed how the compliance with relevant laws and regulations is ensured. Gaps in the quality assurance system and significant violations are reported in the periodic consultation with the Supervisory Board. The Supervisory Board obtained information from the Board of Directors about the extent and nature of various regulations and how compliance is monitored internally.
Corporate Governance StructureThe Board of Directors and Supervisory Board are responsible for compliance with the Dutch Corporate Governance Code (‘the Code’) and maintaining the corporate governance structure. Once a year, compliance with the best practice provisions of the Code is discussed with the Board of Directors. Compliance with the Code is described in chapter 6 of the annual report. In the year 2011 no relevant changes have occurred in the corporate governance structure and compliance with the Code.
MeetingsIn 2011 the Supervisory Board held five scheduled meetings which were all attended by the entire Board of Directors and Supervisory Board. Further, one extraordinary meeting was held to discuss the company’s strategy. The Supervisory Board further held two closed meetings which were not attended by the Board of Directors. By-laws and terms of reference for the Supervisory Board are posted on the company’s website.

brunel international annual report 2011 | report from the supervisory board | 17
CommitteesAccording to the guidelines of the Code, Brunel is not obliged to set up separate auditing, remuneration and selection & appointments committees. However Brunel has had an Audit Committee since 2001 and has opted to retain this structure. The complete Supervisory Board also serves as the Remuneration and Selection & Appointments Committees. By-laws and terms of reference for both the Supervisory Board and its committees are posted on the company’s website.
Assessment of the Board of DirectorsThe performance of the Board of Directors as a whole, and of its individual members, was reviewed. The Supervisory Board believes that currently no changes are required in the size and composition of the Board of Directors.
Self-evaluation of the Supervisory BoardAt a closed meeting, the Supervisory Board reflected on its own performance and that of its individual members. According to its own judgment, the Supervisory Board consists of a sufficient number of independent members.
Remuneration CommitteeThis assesses the remuneration, including the short term and long term bonus of the members of the Board of Directors, makes the remuneration report and oversees the remuneration policy of the company.
Remuneration PolicyThe remuneration policy remained unchanged. The Supervisory Board believes that the remuneration policy expedites achieving the short-term operational performance and the long-term objectives of the company provides an incentive to achieve the strategic goals. The remuneration report outlines the remuneration policy, a description of the implementation of the remuneration policy in 2011 and set out the remuneration of the members of the Board of Directors. The Supervisory Board remuneration has been approved
on the General Meeting of Shareholders held in May 2010. The remuneration policy and the remuneration report are posted on the company’s website.
Audit CommitteeThe Audit Committee selects the external auditors and has a supervisory role on the integrity of the internal and external financial reports of the company, risk management and information technology. The Supervisory Board, the Board of Directors and the external auditor are represented in the Audit Committee. The Audit Committee met two times during the year under review, prior to the publication of the full year 2010 figures and prior to announcing the 2011 semi-annual figures. The Audit Committee’s Chairman reported the committees’ findings to all members of the Supervisory Board. The Audit Committee is chaired by Mr. Maarten Schönfeld.
Risks and internal risk management systemsThe Supervisory Board in 2011 discussed with the Executive Board the risks associated with the strategy and the nature of the business and the way the Board of Directors monitors the design and operation of the internal risk management systems. Brunel is fast growing in a challenging business environment. To reap the maximum benefit of the continuous investments in the organisation a robust risk assessment has been initiated to support decision making and achieving strategic objectives in the next years. The operational and strategic risks related to the company are described in chapter 7 of the annual report.
Information and Communication TechnologyIn 2011 a start was made with the implementation of the strategy ‘one Brunel one IT’. The project manager has explained the progress of the implementation to the Supervisory Board.
Financial ReportingThe Board of Directors informed the Supervisory Board on the processes for the preparation of the financial reports and the way the quality of the financial reporting is monitored. On this basis and the report of the external auditor, the Supervisory Board believes that the

brunel international annual report 2011 | report from the supervisory board | 18
Board of Directors adequately interprets its responsibility for the quality of the financial information.
Consultation with the external auditorThe Supervisory Board has discussed the annual accounts, annual report, management letter and risk management policy with the Board of Directors and the external auditor. The Supervisory Board assessed the independence of the auditor. It was concluded that given the very limited amount of non-audit services, threats to independence are absent. The Supervisory Board believes that the external auditor provided the Supervisory Board with all relevant information in order to exercise its supervisory responsibilities. The external auditor found no irregularities in the financial reports.
Relationship with shareholdersThe Supervisory Board discussed with The Board of Directors how to take into account the interest of shareholders and the issues raised by shareholders at the last Annual General Meeting of Shareholders. The Supervisory Board believes that the company acted in a constructive and careful way with the shareholders’ interests.
DetailsThe Supervisory Board approved the operational and financial objectives of the company and also approved the strategy designed to achieve the objectives and the preconditions associated with that strategy. The Supervisory Board endorsed the Board of Director’s policy on corporate social responsibility and the particular aspects that are relevant to the enterprise. Furthermore, no matters occurred which under the law, the statutes or the Code require the approval of the Supervisory Board.
Conflicts of interestIn 2011, no particular matters occurred involving conflicts of interest of directors, members, shareholders and/or external auditors that are of material significance to the company and/or the respective directors, members, shareholders and/or external auditors.
Financial statements 2011The financial statements and the qualitative notes thereto have been audited by Deloitte Accountants B.V. which provided an unqualified audit opinion (see page 81). The financial statements will be presented at the General Meeting of Shareholders on 3 May, 2012. We recommend the General Meeting of Shareholders to adopt the financial statements and to discharge the members of the Board of Directors.The Supervisory Board supports the proposal of the Board of Directors to declare a dividend of EURO 0.90 per share and to add the remainder of the profit to the reserves.
Amsterdam, 12 March 2012
The Supervisory BoardDrs. A. Schouwenaar, ChairmanIr. D. van Doorn, Vice ChairmanDrs. J.M.C. Schönfeld

corporate governance6
brunel international annual report 2011 | corporate governance | 20
Brunel International’s understanding of corporate governance is based on applicable laws, the rules and regulations applicable to companies listed on the NYSE Euronext Amsterdam stock exchange and the Dutch corporate governance code (the “Code”). The full text of the Code can be viewed on www.commisiecorporategovernance.nl.
Compliance and continuationThe Board of Directors and Supervisory Board are responsible for maintaining the corporate governance structure and for ensuring compliance with that structure. They render joint account on these issues to the General Meeting of Shareholders. Following the introduction of the Code in 2005, Brunel International’s corporate governance structure was discussed at the Annual General Meeting of Shareholders in May 2005. This included aspects where our corporate governance deviates from the Code. In December 2008, the revised Code was introduced. Where feasible and relevant, Brunel implemented these changes through an amendment of the by-laws of the Board of Directors and Supervisory Board respectively. In May 2010 an overview report on corporate governance was submitted for discussion to the General Meeting of Shareholders under a separate agenda item.
Brunel International is of the opinion that the vast majority of the principles and best practices of the Code are being applied. This chapter describes the principal aspects of the corporate governance structure. If applicable, explanations for deviating from the Code’s best practice stipulations are provided. The corporate governance structure at Brunel International and the deviations from the Code are based on current conditions and views within Brunel International. Conditions may change which may lead to adjustments in the structure and in the way in which Brunel International complies with the Code. Every substantial change to the corporate governance structure and compliance with the Code will be submitted to the General Meeting of Shareholders for discussion on separate agenda item.
Deviations from the Dutch corporate governance code
Best practice provision II.1 Contrary to the provisions of best practice provision II.1.1, the CEO has been appointed for an indefinite period of time. The CEO was appointed before the Code was implemented and the company wishes to respect the existing contract with the CEO. In line with best practice provision II.1.1, the CFO was appointed in 2009 for a period of four years.
Best practice provision II.3.4The number of positions in supervisory boards of Dutch listed companies held by Mr. Schouwenaar in 2011 exceeds the maximum as laid down in best practice provision III.3.4. Different options are being reviewed to again achieve compliance with the best practices outlined in the Code.
Best practice provision IV.1In 2005 the General Meeting of Shareholders decided to discontinue the adoption of the rules applicable to statutory two-tier entities (“structuurregime”). The Supervisory Board was granted the right to submit a binding nomination in the case of the appointment of Directors and Supervisory Directors. In deviation from best practice provision IV.1.1 such nomination may only be rejected by the General Meeting of Shareholders by means of a two-thirds majority of votes cast, representing more than half the issued capital. These criteria were prescribed as the Supervisory Board considers it necessary, in light of Brunel’s specific circumstances, to ensure that its position is as strong as possible in the current structure.
Best practice provision IV.3Information for analysts, shareholders, the press and other parties in the financial markets is provided in accordance with the relevant recommendations in the code. However Brunel does not entirely comply with the requirement of having public meetings, for example
brunel international annual report 2011 | corporate governance | 21
through transmission on the Internet, as we believe this implies a disproportionate burden for our organisation. However, the company posts pre-recorded interviews with the CEO on its website in which he elaborates on the results to date.
Board of DirectorsTasked with the management of the company, the Board of Directors is responsible for setting Brunel International’s mission, vision and strategy and execution of its implementation, takes responsibility for Brunel International’s overall results and addresses the corporate responsibility issues. The Board of Directors operates in accordance with the interest of Brunel International and is to that end required to consider all appropriate interests associated with the company. The Board of Directors is responsible for complying with all relevant primary and secondary legislation, the risk profile associated with the strategy, the corporate responsibility issues relevant to the company, its financing, and its external communications. The Board of Directors is required to report developments on the abovementioned subjects to, and discuss the internal risk management and control systems with Brunel International’s Supervisory Board and its Audit Committee.
Supervisory BoardBrunel International’s Articles of Association determine that the Supervisory Board consists of a minimum of three members. The Supervisory Board determines the number of its members.The Supervisory Board is charged with supervising the Board of Directors and the general course of affairs of Brunel International, as well as by advising the Board of Directors. The Supervisory Board evaluates the corporate structure and the control mechanisms established by the Board of Directors.In performing its duties the Supervisory Board shall take into account the relevant interest of the company’s stakeholders, and, to that end, consider all appropriate interests associated with the company.Members of the Supervisory Board perform their duties without mandate and independent of any particular interest in the business of
the company. The Supervisory Board is responsible for the quality of its own performance and for this purpose annually reviews its performance. The responsibility for proper performance of its duties is vested in the Supervisory Board as a whole. Brunel International ensures that there are structured reporting lines to the Supervisory Board. The Audit Committee assists the Supervisory Board in fulfilling its supervisory responsibilities for the integrity of the financial reporting process, the system of internal business controls and risk management, the external audit process, the external auditor’s qualifications, independence and performance.
The Chairman of the Supervisory Board ensures the proper functioning of the Board and its committees and acts on behalf of the Supervisory Board as the main contact for the Board of Directors. The Vice Chairman replaces the Chairman when required and acts as contact for the other Board members concerning the functioning of the Chairman.The by-laws of the Supervisory Board and the resignation schedule are posted on the company’s website, www.brunel.net.
Structure and SharesThe authorised capital of Brunel International N.V. is EUR 5 million, divided into 99.8 million ordinary shares and 1 priority share. The par value of the ordinary shares is EUR 0.05 each.
Priority ShareThe priority share, which has a par value of EUR 10,000, has been issued to Stichting Prioriteit Brunel, subject to the condition precedent that the majority shareholder loses its majority share in Brunel International’s share capital. The priority share will be fully paid up as soon as the issue becomes unconditional. The protective stipulations are included in the Articles of Association of Brunel International and are posted on the company’s website.
Major shareholderAccording to The Netherlands Authority for the Financial Markets (AFM) register on notification of substantial holdings, Brunel founder Mr. J. Brand directly or indirectly holds a capital interest of approximately 63%, with corresponding voting rights.

brunel international annual report 2011 | corporate governance | 22
Annual General Meeting of ShareholdersBrunel International is required to hold an Annual General Meeting of Shareholders within 6 months after the end of the financial year in order to, among other things, adopt the financial statements and to decide on any proposal concerning dividends. Further to Dutch law, the release from liability of the members of the Board of Directors and release from the liability of Supervisory Board members for the performance of their respective duties during the financial year are also agenda items for this meeting.
Voting rightsEach shareholder has the right to attend General Meetings of Shareholders, either in person or by written or electronic proxy, to address the meeting and to exercise voting rights, subject to the provisions of Brunel’s Articles of Association. An eligible shareholder has the aforementioned rights if registered as shareholder on the applicable record date as set by the Board of Directors.Each of the shares in Brunel International’s share capital carries the right to cast one vote. Unless otherwise required by Dutch law or Brunel’s Articles of Association, resolutions are passed by a simple majority of votes cast by the shareholders present or represented at the meeting.
AuditorThe Annual General Meeting of Shareholders charges the external auditors with the task of auditing Brunel International’s annual accounts.
DelegationOn 12 May 2011, the Annual General Meeting of Shareholders authorised the Board of Directors for a period of 18 months to issue (rights) to shares and to restrict or exclude shareholders’ pre-emption rights, with due observance of the law and Articles of Association (which require the approval of the Supervisory Board). The authorisation is limited to 5 per cent of Brunel Internationals N.V.’s issued share capital, as at the date of issue. A new authorisation will be submitted for approval to the Annual General Meeting of Shareholders of 3 May 2012.
On 12 May 2011, the Annual General Meeting of Shareholders also authorised the Board of Directors for a period of 18 months to acquire own shares with due observance of the law and the Articles of Association (which require the approval of the Supervisory Board) to the maximum of 10 per cent of the issued share capital of Brunel International N.V, by means of stock market purchases or in any other way, at prices lying within the bandwidth of 10% above and 10% below the Euronext Amsterdam opening price for the company’s shares on the day of the purchase, or, in default thereof, the most recent prices registered. A new authorisation will be submitted for approval to the Annual General Meeting of Shareholders of 3 May 2012.
Amendment to the Articles of AssociationAmendment to Brunel International’s Articles of Association can take place upon a proposal of the Board of Directors approved by the Supervisory Board and adopted by the General Meeting of Shareholders. A proposal to amend the Articles of Association must be stated in a notice convening a General Meeting of Shareholders. The proposal shall be passed upon an absolute majority of the votes cast in the General Meeting of Shareholders.

7risks, risk management and control systems

brunel international annual report 2011 | risks, risk management and control systems | 24
The Board of Directors of Brunel International N.V. is of the opinion that the ability to control strategic, operational, compliance, financial reporting and financial risks is crucial to the continuity of the company. For that reason, risk management and internal control are subjects to which management pays considerable attention at all relevant levels. In this respect, during the reporting year a global risk assessment was executed. More information on the risk assessment is provided in the section below. Our key company-specific risks are identified and discussed and information about our risk mitigation is included to provide more comprehensive insight into Brunel’s risks and risk management.
Strategic risksOn the strategic level, Brunel has identified the following key risks:- Unfavourable macro-economic conditions: the continuing
unfavourable macro-economic conditions affect many markets and companies including Brunel. Brunel is not able to eliminate these unfavourable conditions or the impact thereof on the company. However, the effect on the company is limited because Brunel uses to a large extend temporary employment contracts, which provides flexibility. The macro-economic conditions mainly affect the business by resulting in pressure on growth and margins.
- Competition: in all market segments we face competition, both local as well as international, and from existing competitors as well as from new entrants to the market. Brunel strives to mitigate this strategic risk by reducing its impact on the overall company. Despite the high degree of uniformity within Brunel’s range of activities, these are focused in different markets, clients and sectors. Examples are: the German market versus the Dutch market; the global Oil and Gas industry versus the secondment business in Europe; and the various business lines in which Brunel operates on the Dutch market.
- Market risk: despite the above-mentioned high degree of uniformity within Brunel’s range of activities, they target different markets, clients and sectors. Given that those markets and sectors have different economic cycles Brunel is less sensitive to cyclical trends,
which reduces the impact of cyclical effects on the Group. Market risks also include economic, political and social risks. Brunel focuses predominantly on clients and countries in or oriented towards the Western part of the world, where these risks are acceptable.
Operational risksIn the operational field, Brunel has identified a number of risks which also qualify as distinctive value drivers:- Attraction and retention of qualified employees: Brunel
acknowledges that on-going effort is needed to attract and retain qualified employees and contractors. A shortage of qualified people on the labour markets could result in Brunel not being able to fully staff clients’ projects. Brunel reduces the probability of the recruitment and retention risks by securing its high reputation, internal education and training facilities and periodic progress reviews.
- Management and retention of successful employees in key positions and succession planning: next to the recruitment of employees for projects, Brunel also is aware of the challenge to recruit and retain persons with the required characteristics of competence to avoid vacancies for key personnel in Brunel’s (senior) management functions. Brunel is continuously monitoring this risk and reduces this risk by preparing current successful employees for future key positions and attracting new employees that are potentially capable to fulfil future key positions.
- Productivity: this applies specific to the secondment business in Europe where employment contracts are based on contractual agreements with our clients. Potential early termination of deployed employees can result in loss of productivity. Productivity is measured on a daily basis and reported on a weekly basis and subsequent corrective actions can be taken in a timely manner.

brunel international annual report 2011 | risks, risk management and control systems | 25
Compliance risksNon-compliance with laws, regulations, local standards and codes: Brunel targets different markets and sectors and operates in several countries. This also means that Brunel has to ensure that sufficient knowledge on the provisions of such specific jurisdictions is available to avoid non-compliance with laws, regulations and local standards, including tax. Especially, knowledge is needed to guarantee proper interpretation of provisions. Non-compliance could not only result in penalties, but also in reputational damage. Information on local amendments to laws or new regulations is shared with Brunel’s legal department.
Financial reporting risksAlthough the risk analysis did not indicate Brunel’s financial reporting to be one of the main risks, Brunel regards the reliability of financial reporting to be most important and will keep ensuring to meet high standards of reporting. The main measures to control the quality of the financial reporting and to prevent unintentional and intentional errors are external auditing and internal auditing.
Financial risksBrunel has always been characterised by exceptionally high solvency rates. The company does not use any long-term credit lines and boasts favourable liquidity positions and bank facilities which accommodate the day-to-day management of the working capital. During the global financial crisis that started in 2008 this has proven to be an advantage, as our strong balance sheet was recognised by both our clients as well as by our employees. Brunel is considered a solid partner in business. Brunel’s assets include a limited amount of goodwill. As a result, impairment risks and the associated deterioration of the solvency level are ruled out. Brunel’s most important financial
assets are its account receivables, spread over more than two thousand clients. Despite internal procedures, uncollectible debts cannot be ruled out but the risk of a material erosion of the operating profit is very small. In the year under review the cash collection process remained tight in order to limit the potential negative impact of the economic downturn. The Brunel Group does incur currency risks. Revenues and expenses are often stated in the same currency, which helps to reduce the effect of exchange rate differences. There are also translation risks in connection with our accounts receivable positions and foreign participations. Awarded pension schemes concern defined contribution schemes managed by external parties.
Internal risk management and control systems
The Board of Directors is responsible for internal risk management and internal control systems. The purpose of those systems is to ensure optimum management of the most significant risks that have been identified within the Group. Even so, these systems are not designed to guarantee full protection against material errors and violations of laws and regulations. Brunel’s internal risk management and control measures are based on the COSO framework and distinguish eight components:1. Internal environment2. Objective setting3. Event identification4. Risk assessment5. Risk response6. Control activities7. Information and communication8. Monitoring

brunel international annual report 2011 | risks, risk management and control systems | 26
1. Internal environmentThe Board of Directors is responsible for the coherence between the various internal control and risk management elements. Factors that influence the internal environment include integrity, management style and the tone set at the top, generally accepted business standards and ethical values to reflect how risk is viewed and addressed by Brunel, and the risk management philosophy and risk appetite. Periodically the Chief Executive Officer as well as the Chief Financial Officer visit – together with a senior officer from Corporate Finance & Control if required – the most important operating companies to facilitate complex decision-making, to control financial progress and monitor realisation of the business objectives. Another important aspect of the internal environment is the code of conduct, which includes the whistle-blower policy. The code has been posted on the corporate website.
2. Objective settingBrunel has set its objectives based on its strategic growth pillars. The chosen objectives support and align with Brunel’s mission and are consistent with our risk appetite.
3. Event identificationBrunel strives to ensure that all potential events that can affect the achievement of the objectives that Brunel has set are identified. This includes internal and external events. Brunel conducted a global risk analysis in the reporting year and is planning to do so on a regular basis. The first step of such a risk analysis is identifying events that are capable of affecting the achievement of Brunel’s objectives.
4. Risk assessmentThe global risk analysis that Brunel conducted in the reporting year enables us to have continuous and thorough insight into the risks our business is confronted with as well as the risks we face at group level. After identifying the events that could affect the achievement of objectives, the risk analysis supported us in effectively assessing and prioritising the risks we face, based on the impact of the risks on the company and the likelihood of the risks occurring. It also improved our understanding of the controls in place to manage these risks. The risk assessment enables Brunel to further improve its risk management and provide additional confidence that the corporate objectives will be achieved. The risks disclosed above are our main, material and company-specific risks based on the risk analysis.
5. Risk responseThe risk analysis conducted during this reporting year, not only improved our understanding of the controls in place to manage these risks and but also their effectiveness. With this information Brunel was able to determine how to manage our risks and select our risk responses, such as avoiding, accepting, reducing, or sharing the risks. The set of actions that Brunel has complemented is aligned with our risk appetite.
6. Control activitiesThe risk analysis that Brunel has conducted included an analysis of the cause and effect of Brunel’s main risks, a study on the effectiveness of current risk controls and the additional risk controls needed as well as an action plan to implement those additional controls. Brunel has also established and implemented policies and procedures to help ensure that the risk responses are effectively carried out. All Brunel divisions are subject to general policy rules and

brunel international annual report 2011 | risks, risk management and control systems | 27
procedures aimed at controlling our risks. The most important policies and procedures are:- An annual budgeting cycle which includes financial and non-financial
information, followed by quarterly evaluations of the targets (forecasts);
- A monthly financial reporting cycle which, again, includes financial and non-financial information. The reports are analysed and compared with previously adopted budgets and reports. The results are discussed with local management;
- A weekly reporting on the operational Key Performance Indicators, which are discussed with local management;
- An accounting manual that includes valuation principles, definitions, explanations of the various reports, internal procedures, a code of conduct and an ethics code;
- An insurance manual including insurance policies in the fields of employment relationships, liabilities and business continuity;
- An internal letter of representation, in which the general and financial managers of the operating companies confirm the accuracy and completeness of the submitted financial reports and the proper use of the Brunel accounting manual;
- Periodic field visits by members of the Corporate Finance & Control department, to review the internal financial reports as well as to assess the local administrative organisation and measures of internal control and the reporting processes;
- As regards to treasury, dual authorisation is required and external financing arrangements are not permitted;
- Commercial transactions with third parties worth more than USD 1 million require the Board of Directors’ prior approval. This also applies to investments in excess of USD 25,000.
7. Information and communicationThe information and communication policy for internal risk management and control systems is aimed at acceptance and implementation at all organisational levels. This has resulted in a generally accepted code of conduct, internal training courses for new
employees and training-on-the-job programmes. Relevant information on Brunel’s main risks is clearly communicated throughout the organisation. Effective communication also occurs in a broader sense, flowing down, across, and up the entity. For that reason, various types of business deliberation are conducted. Each year, the financial community within Brunel holds an international meeting which is attended by all regional financial controllers to discuss best practices and the latest developments in financial management and internal controls, and subsequently document and implement them company-wide.
8. MonitoringMonitoring the adequacy and effectiveness of internal risk management and control systems is an on-going improvement process. Monitoring activities are arranged in periodic consultation between the Board of Directors and local managers, and through frequent contact between Corporate Finance & Control and local financial management. These discussions are partly based upon the issued weekly operational and monthly financial reports. Despite the absence of an internal auditor at Brunel International N.V., reviews are made both at holding level by Corporate Finance & Control and at segment level by regional financial controllers. Corporate Finance & Control is an independent department that reports directly to the Board of Directors and the Audit Committee. In addition, it advises local management in connection with possible improvements in internal risk management and control systems. The external auditor is responsible for auditing the annual financial statements. The auditor reports findings in the form of management letters at the level of the Group or individual operating companies. In addition, he reports directly to the Audit Committee. The external auditor attends the meetings of the Supervisory Board at which the annual accounts are adopted. The auditor also attends – and is authorised to address – the General Meeting of Shareholders.

brunel international annual report 2011 | risks, risk management and control systems | 28
Concluding remarksThe Board of Directors is responsible for the quality and completeness of all financial statements published by the company. The Supervisory Board oversees the way in which the Board of Directors exercises that responsibility. Taking the afore described risks and control systems into consideration, according to the Board of Directors the internal risk management and control systems have been working adequately during the year under review and provide reasonable assurance that the financial report does not contain material misstatements. The Board of Directors is not aware of any signs that, in a general sense, the risk management and control systems were materially ineffective during the year under review, nor of any signs that these measures can be expected to be ineffective in 2012.
8brunel’s vision,objectivesand strategy

brunel international annual report 2011 | brunel’s vision, objectives and strategy | 30
The international business community increasingly recognises the positive effects of flexible working practices on a company’s productivity and competitiveness. This will lead to a new dynamic, with international economies demanding more and more flexibility. We believe this will lead to a global increase in the market for the flexible deployment of specialists. Many international economies appear to be on the threshold of a new period of growth, which will provide an additional boost to the trend towards increased flexibility.Brunel’s core business is the provision of specialist personnel on flexible deployment, particularly highly educated talent. Brunel, operating in a large number of regions and professional sectors, is ideally positioned to play a leading role in the development of increased personnel deployment efficiency. The services range from secondment to project management, contingency recruitment and consultancy.
International labour market developments
The ageing population and slowing of the population growth are issues in several highly developed economic societies. The inflow of young, highly educated personnel is not sufficient to compensate for the age-related outflow. This dynamic continues to lead to a structural shortage of available highly educated specialists in a number of sectors, especially the technical sector. The effects of this are already being seen in the market. Solutions to the personnel shortage issues will increasingly be cross-border in nature. The structural shortage of specialists in highly industrialised regions is counterbalanced by a surplus of highly educated young people in Asia and Eastern Europe. The personnel market will rapidly become an international platform. The demand for flexible working practices is increasing at the individual company level. Companies are opting to form a flexible structure supporting a fixed set of core competencies and skills. This enables them to respond more quickly and effectively to economic developments and other
changes encountered in their businesses. The global trend towards greater flexibility will lead to new concepts in which traditional methods are combined with, or replaced by, new forms of project management and flexible project teams. Large companies are working with fewer and fewer suppliers and expect the preferred suppliers to provide a total product based on innovative concepts, high-quality and rapid service delivery, operational excellence and a global presence.A major shift is also being seen on the supply side. Specialists have increasing demands with regard to their working environments and the content of assignments and are becoming more internationally oriented, preferring a combination of flexibility and security and paying particular attention to career planning. The specialist of the future will expect to be facilitated in all of these aspects by an employer.Education and training will be more important than ever. Specialists will expect access to the latest insights in their area of expertise. Keeping knowledge and skills up to date will increasingly become a continuous process, particularly in sectors like engineering and IT, where new developments are the order of the day.
Corporate objectivesBrunel’s objective is to play a leading role in specific sectors of the international personnel market. As an authority on national and international recruitment, Brunel can immediately respond to new market developments in the interest of clients and specialists. Brunel aims for balanced growth in revenue and profit in all regions and sectors of operations. Brunel’s revenue increased substantially in the period from 2003 to 2008. Although the global recession that followed slowed this growth down, Brunel came through this challenging period strongly and has been able to improve its relative position compared to the competition. Brunel is in an excellent position in all of its markets and sectors to achieve structural growth through the economic cycle.

brunel international annual report 2011 | brunel’s vision, objectives and strategy | 31
StrategyBrunel’s strategy is focused on providing excellent services to both its clients and the specialists it deploys. This process involves a crucial role for Brunel’s account managers, who form the bridge between the client’s demand and the expertise and skills of the available specialists. In order to properly fulfil this role, Brunel’s account management must have the necessary sector knowledge, a proactive and flexible attitude, a high degree of commitment and the ability to communicate effectively with those involved in every phase of the recruitment process. These are the building blocks used to create long-term relationships with clients and specialists.Brunel’s strategy is based on entrepreneurship through high quality account management. This enables the company to optimally respond to the demands and wishes of both the client and the prospective specialist. The quality of account management will be a continuous point of attention in the company’s policy in the years to come. Issues, particularly those of cross-border deployment, are becoming more and more complex and require an increasingly higher level of performance from Brunel’s account management. Brunel regards the quality of its account management as key to its future success. Brunel’s strategy is supported by five sub-strategies:
High-quality specialised servicesBrunel opts for a specialist approach to the market. The selection of specific sectors, regions and disciplines leads to in-depth knowledge of the related labour market. This makes it possible to offer clients tailor-made services, ranging from secondment to project management, contingency recruitment and consultancy, depending on the specific demands of the market and/or individual clients.
Operational excellenceBrunel’s process is based on speed, reliability, efficiency and transparency. Excellent procedures are a precondition for the provision of high-quality service. Brunel continually invests in technology throughout the whole organisation, aimed at the highest possible quality in (administrative) procedures.
High-quality specialistsHaving access to highly educated and experienced specialists is of overriding importance in the provision of the service. Brunel owns and has access to extensive databases of specialists, subdivided into specific regions and market sectors. Enlarging and updating our database is an on-going process involving a wide range of communication tools.
Global distributionBrunel employs the principle of having a local presence where the clients require our service. The international network currently comprises 97 offices in 34 countries. The network is further refined according to the development of demand in new, promising regions and/or specific requirements of international clients. Each office has in-depth knowledge of the local labour market with regard to legislation, forms of contracts, availability of the right specialists, social conditions and the possibilities for education and training. Each location is also an important player in the international personnel market thanks to its access to the international knowledge, experience and in-house data of the Brunel group.
Intensive branding of Brunel Brunel’s specialist nature and unique approach are systematically expressed through a global communication programme based on the slogan ‘Access to Excellence’. This slogan illustrates the building blocks of the Brunel brand that make Brunel a unique company: professional knowledge, personal commitment, reliability and flexibility.
Organisation and human resourcesBrunel organisational modelBrunel’s international organisational structure is based on the principle ‘Freedom in Restraint’. Each region and business line is controlled by its local management team which, within the limits of Brunel’s mission and strategy, is directly responsible for marketing and day-to-day business affairs. The basis for managing the company is maintaining a flat organisation. Having the minimum number of management layers
brunel international annual report 2011 | brunel’s vision, objectives and strategy | 32
keeps the organisation transparent and controllable. The flat organisation model is a policy starting point for the long term. This starting point will continue to be maintained, even when the revenue, the number of employees and branches continue to grow. A characteristic of Brunel is the careful balance between freedom and working within a controlled framework. Working freedom is a feature of Brunel’s culture. Account management departments have ample scope to take action in their specific market situation. This explains why Brunel is particularly attractive to young, ambitious, talented people who need the space to excel. Eagerness is, with good reason, the most important element in Brunel’s culture. The limits of individual entrepreneurship are established by consistently focusing on the performance of business units, departments and employees maintaining clear policy frameworks and establishing a well controlled back-office. The ‘Freedom in Restraint’ principle is anchored in Brunel’s nature and is fundamental to the company’s success.
Human resourcesBrunel’s core competency is supporting highly educated and experienced professional and technical personnel. Even in the current personnel market, finding and placing professionals is a specialised activity whose success depends largely on the competitive edge of the market position. Specialists are in demand and can often choose from a range of alternative situations. Their choices will depend greatly on the added value that the various parties can offer them. This added value comes in the form of various benefits such as employment conditions, career counselling, opportunities for personal development and for increasing know-how, coaching facilities and the particular appeal of the projects and clients to which the specialists will be assigned.Brunel’s Human Resources policy is geared specifically to achieving the benefits as described above. The employment packages are designed to be as attractive as possible within each market and centre around individual options. Possible career moves are mapped out on an individual basis. In general, Brunel specialists are usually employed for a limited number of years. By definition, the wide variety that Brunel can offer in terms of clients and projects increases the mobility of the employees concerned and vastly increases their career options once
they leave Brunel. Supervision and the continuous development of staff is ensured by Brunel’s primary process, in which the account managers and recruiters, assisted by HRM, regularly discuss the progress of current projects with both the client and the specialist in question. Our long term and continuing cooperation with a large number of prominent firms guarantees a selection of diverse and challenging projects. Additionally, the growth of our worldwide network provides more and more opportunities for employees to opt for a global career. In recent years, employees have regularly transferred between the various regions. We actively encourage this talent exchange.
TrainingBrunel’s training strategy is aimed at providing the best service to its many clients. The quality of the services depends primarily on the quality of our account management and recruitment management efforts, and on the availability of specialists with up-to-date know-how and skills. In line with this strategy, Brunel devotes a great deal of effort to training both supporting staff and specialists. Account managers joining Brunel are enrolled in an extensive induction programme. Participants are trained in the various fields including legislation, interviewing and sales techniques, account management and recruitment skills. For specialists we draw up personal development plans and review these annually. The element of training plays an important part in these plans. Any gaps in the employee’s know-how and skills are filled through generic training or, depending on the situation, through personal improvement schedules. All training programmes are arranged by the Brunel Academy. Some of the programmes are provided in-house, but in most cases we cooperate with reputable external institutes to ensure that the educational terms are formalised in a professional manner. In addition, dedicated programmes are organised to provide experienced account and recruitment managers with advanced training to maintain the highest level of professionalism. Finally, Brunel offers an international Management Development Programme. This programme enables successful and talented sales staff to achieve higher positions, and serves as a gateway for them to reach international management positions.

brunel international annual report 2011 | brunel’s vision, objectives and strategy | 33
Corporate social responsibilityBrunel is a people-based company. It specialises in flexible work for specialists with a professional or university education. Over nine thousand people work at local and international companies for and on behalf of Brunel worldwide and Brunel is responsible for each and every one. They expect us to support them in the development of their careers and to provide good terms of employment, safety and security. Our employees also expect Brunel to play a role that they can be proud of in the community. This is a mutual interest. From Brunel’s point of view it is important for all Brunel employees to act as valuable ambassadors of the company, wherever they may be in the world.Our role in the community is not limited to our own company and employees. The responsibility extends further to our clients, suppliers, candidates, the education sector and society in general.Because of the nature of our business activities, Brunel’s corporate social responsibility (CSR) policy focuses on the aspects that are related to work in the broadest sense. However, Brunel also endeavours to make a constructive contribution to the quality of life in our community by taking measures that reduce environmental impacts wherever possible. A summary is provided below of the main aspects of Brunel’s CSR policy.
Brunel’s role in the labour marketA reflection of societyBrunel has adopted a worldwide personnel policy that focuses on the participation of the labour supply. The criteria for cooperating with Brunel are knowledge, skills, the will to learn and an intrinsic motivation towards personal development. Age, gender, social position, occupational disability, sexual orientation and cultural background are emphatically not selection criteria.
IntegrityBrunel’s code of conduct focuses on honesty, loyalty, meticulousness in agreements and handling sensitive and personal information with
absolute discretion. We also encourage care for each other. The code of conduct is concerned with how we treat each other but also with social and business interactions with clients and suppliers. Brunel has a complaints handling procedure and has appointed confidential advisers who can be brought in when the normal social process is unable to offer a solution.
Working conditionsBrunel provides a working environment that focuses on the safety, health and welfare of employees. Examples of this include encouraging and facilitating healthy nutrition, a regular medical fitness check-up, a hygienic workspace and a bicycle for personaluse scheme.
Personal developmentBrunel pays a lot of attention to the personal development of its employees. This is partially concerned with keeping knowledge and skills up to date in relation to clients’ requirements and wishes. However, Brunel also believes it has a responsibility for the long-term career development of its employees, even when this is not within the Brunel organisation.The Brunel Academy is the umbrella organisation for all study programmes and training courses offered to employees. Depending on the situation, these include skill-training courses, seminars, workshops, a management development course, vocational training courses and other internal or external study programmes which fit in with the employee’s personal development plans.
Information and career coachingSecondary schools and higher vocational training courses are the gateway to a business career. Brunel provides information classes intended to provide students with a proper impression of the field of work and their prospects in it. Brunel also advises thousands of candidates a year about their career prospects, often with the aid of assessments. Finally, Brunel facilitates job application training courses, mediates in dissertation subjects and traineeships, provides accommodation for dual students (work-study students) and supervises first-year students.

brunel international annual report 2011 | brunel’s vision, objectives and strategy | 34
Working on the futureBrunel plays an active role in social projects intended to streamline the labour market for the future. A notable example of this is our continued participation in Jet-Net, the Youth and Technology Network Netherlands. Jet-Net encourages students to follow educational courses in technology.
Brunel and Socially Responsible BusinessEach of the branches in the Brunel global network is part of a local community. The branch management is authorised to support local initiatives by providing knowledge, facilities and/or funds. The result is a wide range of sponsoring activities for sport and health, human rights and fighting life-threatening diseases.
Brunel and the environmentAlthough business services are considered to be among the ‘clean’ sectors, a lot can be gained from adopting an environmentally aware approach to the daily process of running the business. After all, it involves using paper; employees drive cars; offices use energy for the IT infrastructure; waste is produced and cleaning agents are used. Brunel has carefully analysed which aspects of its operations have an impact on the environment and what can be done to minimise it. The result is a broad package of measures covering waste separation, paper use, CO2 neutral postal dispatches, transport, energy consumption and office cleaning. Employees are made aware of the value of behavioural changes and are encouraged to take this into account in their immediate workspace.

9report from the board of directors

brunel international annual report 2011 | report from the board of directors | 36
Highlights of 2011
X EUR 000 2011 2010 %Revenue 979,868 720,924 36%*Gross profit 193,566 151,980 27%Gross margin 19.8% 21.1% -1.3ppt Other income -2,100Operating profit (EBIT) 64,403 37,346 72%EBIT percentage 6.6% 5.2% 1.4ppt
Net profit 43,143 25,601 69%Total average workforce 9,545 7,656 25%Working capital 207,658 175,016 19%
*+37% at constant currencies
2011 Where Brunel meets growth2011 was an excellent year for Brunel. Being a diversified company targeting different markets all over the world, Brunel has in 2011 benefitted from both increased activity in the global Oil and Gas market and improved market conditions in Europe. The growth that commenced in the fourth quarter of 2010 continued during 2011 leading to a 36% increase in revenue. All divisions contributed to this growth. The graph below reflects the development of revenue and EBIT over the past 10 years. It clearly shows that the impact of the economic developments in the years 2008 and 2009 has been limited on Brunel. It also shows that the investments in the organisation made during this period have paid off and resulted in high growth in 2011. Investments in the quantity and quality of the commercial organisation enabled us to further improve our position in the market of
-200
0
200
400
600
800
1,000
1,200
1,400
1,600
-10
0
10
20
30
40
50
60
70
80EBIT
turnover
2011201020092008200720062005200420032002
EBIT
revenue
Revenue and EBIT in Euro million

brunel international annual report 2011 | report from the board of directors | 37
professional secondment and recruitment services in both The Netherlands and Germany as well as in the international Oil and Gas industry for providing high-quality specialist personnel.
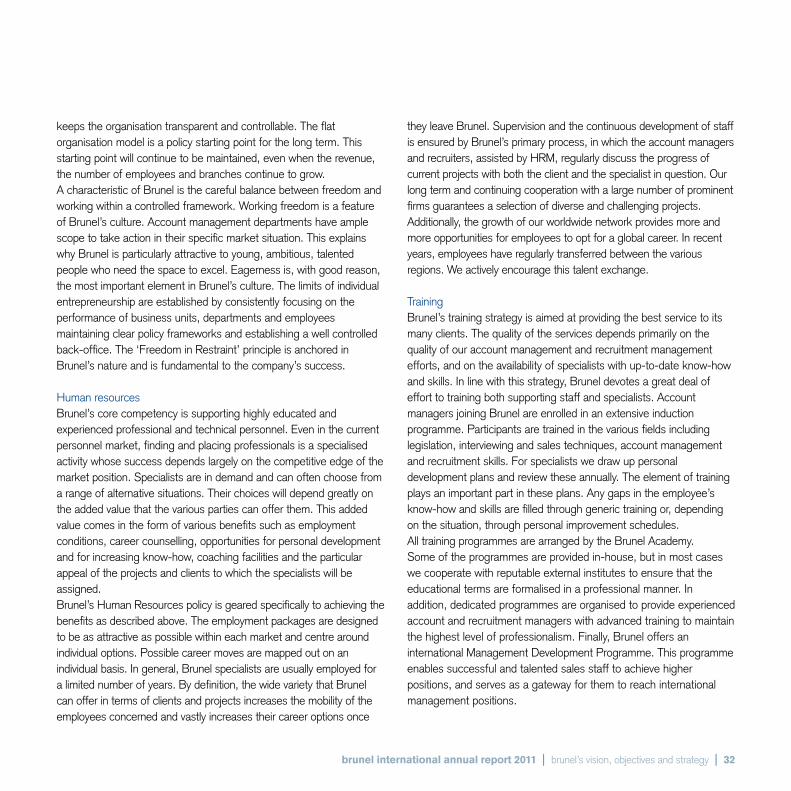
Revenue Revenue increased to Euro 980 million in 2011, an increase of 36% compared to 2010. This was all organic growth as the movement in foreign exchange rates has only had a limited net impact.During each quarter of 2011 an increase of 30% or more has been realised in comparison to 2010 and all our divisions contributed to this growth. The Energy division was the largest contributor with a revenue increase of over 41% to Euro 642 million. The Oil and Gas business has benefitted to a large extent from the increased activities in respect of the exploration of the natural gas recourses in the Australian region.
Despite the economic and monetary conditions on the European market we have been able to continue our revenue growth in all quarters of 2011. We are confident that our strategy of continuous investments in the organisation have contributed to the excellent performance.
The shares of total revenue of Brunel Energy, Brunel The Netherlands, Brunel Germany, Brunel Belgium and other countries have changed slightly compared to previous years. The Energy division outpaced the growth of the European entities resulting in a 66% share of total revenue versus 64% in 2010. The graphs below show the respective shares of revenue of the divisions in 2010 and 2011.
Gross profit and Gross marginIn 2011 Brunel International’s gross profit increased by 27% to Euro 194 million. The gross margin realised in 2011 (19.8%) is slightly lower than the 21.1% realised during 2010.
The lower gross margin is largely attributable to the Energy division where large projects account for an increased share of total revenue. This project revenue is volume based; a large number of contractors is deployed at a lower gross margin in conjunction with a lower overhead base. Gross margin of the Energy division 2011 is 11.6% compared to 12.9% in 2010.
The Dutch economy has not recovered as strongly as the German economy but we are confident that we have been able to further
3%
64%
15%
18%2%
66% 1%
15%
16%3%
64%
15%
18%2%
66% 1%
15%
16%
energy
netherlands
germany
belgium
other
revenue 2010 revenue 2011

brunel international annual report 2011 | report from the board of directors | 38
increase our position in the market segments we operate in. Due to the economic conditions and corresponding uncertainty, in a mature market, limited pressure on the gross margins is inevitable. Given the circumstances we are pleased we have been able to limit the decrease in gross margin to 1.0 ppt, from 35% in 2010 to 34% in 2011. Brunel Germany has continued its’ strong performance that commenced in 2010. Gross profit increased by 40% to Euro 59 million. The gross margin further improved to 38.8% from 38.2% in 2010. The German market for flexible deployment is not as mature as the Dutch market which partly explains the higher gross margins. In addition the increased activity in the German industrial sectors have enabled us to increase productivity.
The increase in gross profit in Belgium (+22%) has exceeded the growth of revenue (+12%) due to an increased focus on margins but also resulting from the lower share of revenue generated in the Financial services industry, which is characterised by lower gross margins.
Overhead Brunel International’s overhead costs increased in 2011 by 15% compared to the level of 2010. Starting during the downturn in 2009 Brunel continuously invested in the organisation with the purpose of being able to handle the expected growth in a controlled manner. Most of these investments relate to an increase in employees in the operating entities, both commercial staff as well as business support staff. These invesments were mainly made in the Energy division and Brunel Germany. Another significant part of the investments relates to efforts made in the IT environment, one of the foundations for our success, now and in the future. The use of new technologies will enable us to further improve our efficiency and ability to meet the client’s requirements. The investments associated with these IT developments are being capitalised and depreciated over time but also additional costs are incurred to support these new systems in house.
Operating profit Operating profit increased from Euro 37 million in 2010 to Euro 64 million in 2011. In 2011 we have not incurred one-off costs whereas
in 2010 the operating profit was negatively effected by Euro 4 million one-off costs.The operating profit as a percentage of revenue increased from 5.2% (5.7% excluding one-offs) in 2010 to 6.6% in 2011. This improvement is mainly the result of the increased revenue.
Balance sheet 2011The balance sheet of Brunel has been recognised as being a very strong asset, both in the financial world as well as by our clients and contracted fee earners. Brunel is considered a solid partner that combines operational excellence with financial solidity.
Our solvency remained strong with 61% compared to 69% in 2010. Working capital increased from Euro 175 million at the end of 2010 to Euro 208 million in 2011. Accounts receivable amounted to Euro 191 million (2010: 151 million) reflecting the strong revenue in the last quarter of the year.
Total capitalised goodwill in 2011 remained Euro 7 million, 3% of shareholders’ equity.
Average workforce
X EUR 000 2011 2010 %Direct employees 8,320 6,579 26%Indirect employees 1,225 1,077 14%Total workforce 9,545 7,656 25%
Average gross profit per 158 141 12%indirect employee in Euro’000 Direct/indirect ratio 6.8 6.1 11%
The average number of fee earners over 2011 increased by 26% compared to 2010. Per 31 December 2011 the total headcount stands at 10,386 of which 1,254 are indirect employees.

brunel international annual report 2011 | report from the board of directors | 39
Brunel The Netherlands Brunel The Netherlands operates in specialised areas and targets these areas through separate business lines. All business lines aim to attract highly educated candidates to provide clients with high-quality recruitment, selection and project management services.
Dutch back office functions are centralised in Amsterdam whereas the business lines operate regionally from ten sales offices across The Netherlands.
Brunel The Netherlands in 2011
X EUR 000 2011 2010 %Revenue 156,171 132,890 18%Gross profit 52,624 46,092 14%Gross margin 33.7% 34.7% -1.0pptOperating profit (EBIT) 17,925 12,220 47%EBIT percentage 11.5% 9.2% 2.3ppt Total average direct workforce 1,674 1,408 19%Total average indirect workforce 316 308 3%
At the end of 2010 the number of fee earners started increasing again. This has continued throughout 2011 resulting in a revenue growth of 18%. In every quarter of 2011 revenue was higher than in the same quarter in 2010. This positive development appears to outperform the general economic developments in The Netherlands as well as the performance of other companies we are competing with. This is considered a confirmation of our strategy to focus on the supply of highly skilled temporary staff to specific segments.
The Dutch organisation has commenced with the transition from a commercial organisation, per businessline, to an organisation with a focus on clients and candidates that is structured across all business lines. This change has strengthened our position, both towards
existing and new clients but also towards our employees and candidates as we are able to improve their career opportunities. Both existing and potential clients do confirm that there is a strong requirement to limit the number of suppliers to a selective number of preferred suppliers. Brunel is continuously improving its’ organisation to meet the clients’ requirement where quality and time to act are in harmony with our strive for access to excellence.
During 2011 the Dutch economy has not performed as well as was expected early in the year. The economic development in Europe was hampered by the uncertainty that has dominated the economic climate. This resulted in reluctance with clients to expand their businesses and as a result stagnation in the labour market.The upside for Brunel in this situation is that companies are more willing to fill the remaining vacancies with flexible employment contracts. Brunel has managed to strengthen its’ commercial organisation and was therefore best positioned to grow in this labour market, that is much more competitive as it was before the downturn of 2009.
The revenue growth has been realised in all business lines but the business line Finance performed exceptionally well with an increase in revenue of 38% compared to 2010. Brunel has managed to outperform the competition in this highly competitive market segment. The Business line IT, which was the first business line to start growing again in 2010, continued to grow and realised a revenue growth of 19% compared to 2010.The business line Engineering, which represents almost 50% of total revenue in The Netherlands, was also able to increase its revenue by more than 10%.
The gross margin realised in 2011 is 33.7% which is slightly lower than the gross margin realised in 2010. This is the result of the changed circumstances. Compared to the pre-crisis period, more high skilled specialists have chosen to switch from being an employee to being an independent contractor. Deploying contractors with our customers reduces our risk but does also generate a lower gross margin. In addition to the increased share of independent contractors, the economic circumstances have had a slightly negative impact on the rates.

brunel international annual report 2011 | report from the board of directors | 40
Outlook We do foresee that in the years ahead, the shortage of qualified engineers and IT specialists will increase and Brunel will continue to benefit from its’ strong foothold in the market.For the short term we are confident that we will continue to grow but this expectation is based on the assumption that Europe will resolve the current monetary crisis. A low or flat growth rate for the Dutch economy will be sufficient base for Brunel for profitable revenue growth.
Brunel Germany Brunel Germany provides its’ clients with highly qualified engineers, technicians and IT specialists. Brunel’s specialists usually carry out their activities on a temporary basis. In addition to traditional secondment service, Brunel Germany provides consultancy, project management and interim services. It operates in the automotive, IT, aerospace, mechanical and plant engineering, rail systems and shipbuilding segments. Brunel Germany’s headquarters is in Bremen. The company has sales offices in 35 locations from which services are provided to the client and (candidate-) employees.
Brunel Germany in 2011
X EUR 000 2011 2010 %Revenue 152,294 110,710 38%Gross profit 59,156 42,279 40%Gross margin 38.8% 38.2% 0.6 pptOther income - -2,100 Operating profit (EBIT) 21,567 8,234 162%EBIT percentage 14.2% 7.4% 6.8ppt
Total average direct workforce 1,672 1,248 34%Total average indirect workforce 315 278 13%
In 2011 Brunel Germany’s revenue increased, compared to 2010, by 38% to Euro 152 million. This increase is fully attributable to the increase in the number of fee earners. The growth realised in 2011 is, in part, the result of the continued positive development of the German economy which is driven by industrial growth. It is due to the investments in the commercial organisation that we have been able to maximise the returns in this growing market.
The revenue growth has been realised in a variety of engineering sectors but predominantly in automotive, mechanical and electrical engineering. In 2011 Brunel Germany is taking full advantage of the turnaround that was made in the previous years. Management has been strengthened and the commercial organisation has been able to exceed our expectations. During the year we have continued to increase our sales organisation as we consider this to be the best investment to be made in our organisation to support our growth ambitions. The German labour market is still catching up in the process of making it more flexible.
The gross margin improved further in 2011 and has reached almost 39% during this year. The main contributors to this strong performance are the commercial focus on margin as well as the high productivity realised. Productivity is one of the key performance indicators for Brunel as it measures our efficiency, and when market conditions improve productivity increases as a result of higher demand. The situation in 2011 can be characterised as a slow but gradual shift towards a supply side driven market where skilled engineers are more difficult to find but are relatively easy contracted out.We do note in Germany as well that an increasing number of young engineers make the switch from being company employed to being an independent contractor. This does have a small downwards effect on realisable gross margins. After two years of reducing overhead costs, these increased in 2011 as a direct result of the investments in the commercial headcount. Total costs increased, compared to previous year, by Euro 5.6 million.

brunel international annual report 2011 | report from the board of directors | 41
The increase is fully explained by an increase in personnel costs as well as increased marketing costs. Brunel Germany operates at the top end of the German market with limited own engineering activities. The value of having centres of excellence to attract both customers as well as highly qualified and motivated engineers is considered to be of significant importance and does make Brunel stand out from its’ competitors.
Outlook In general our outlook for Brunel in Germany is positive although we do recognise that in 2012 the European economy may struggle as a result of the effects of the monetary crisis. We do not foresee a quick solution to this issue but are confident that further growth for Brunel is possible. We will continue our strategy of continued strengthening of the commercial organisation and thus be prepared for accelerated growth. In line with the prospect for The Netherlands, the German labour market will reveal the underlying shortage for skilled engineers once the economy is picking up again.
Brunel BelgiumBrunel in Belgium is a dynamic company that specialises in providing engineers and IT specialists with its’ headquarters in Mechelen. In Belgium the Brunel organisation has proven to be a sound, effective organisation, able to achieve improving results despite difficult market conditions.Engineering services mainly operates in the construction, energy and petrochemical sectors and the IT-related activities do offer opportunities in a variety of sectors
Brunel Belgium in 2011
X EUR 000 2011 2010 %Revenue 23,831 21,336 12%Gross profit 5,427 4,456 22%Gross margin 22.8% 20.9% 1.9pptOperating profit (EBIT) 1,729 959 81%EBIT percentage 7.3% 4.5% 2.8ppt
Total average direct workforce 290 255 14%Total average indirect workforce 33 32 3%
The economic circumstances in 2011 have been challenging in Belgium. Especially the financial sector, where Brunel IT historically generates a significant share of its revenue, has been affected severely. The 12% increase in revenue compared to previous year is fully attributable to the Engineering division.
The Engineering division has realised growth in both revenue and gross margin. Revenue growth has flattened during the year as a consequence of the increasing political and monetary uncertainty. As a result of increased focus on the realisable margins management has been able to improve the gross margin by almost 2 ppt. The organisation has been strengthened during 2011 but has also been able to limit the increase in overhead costs to a minimum and consequently carry the gross margin improvement to the Ebit level.
OutlookWe are positive about the future for Brunel in Belgium although the economic circumstances in Belgium, especially the financial sector, do cause us to be careful about projections for the near future.
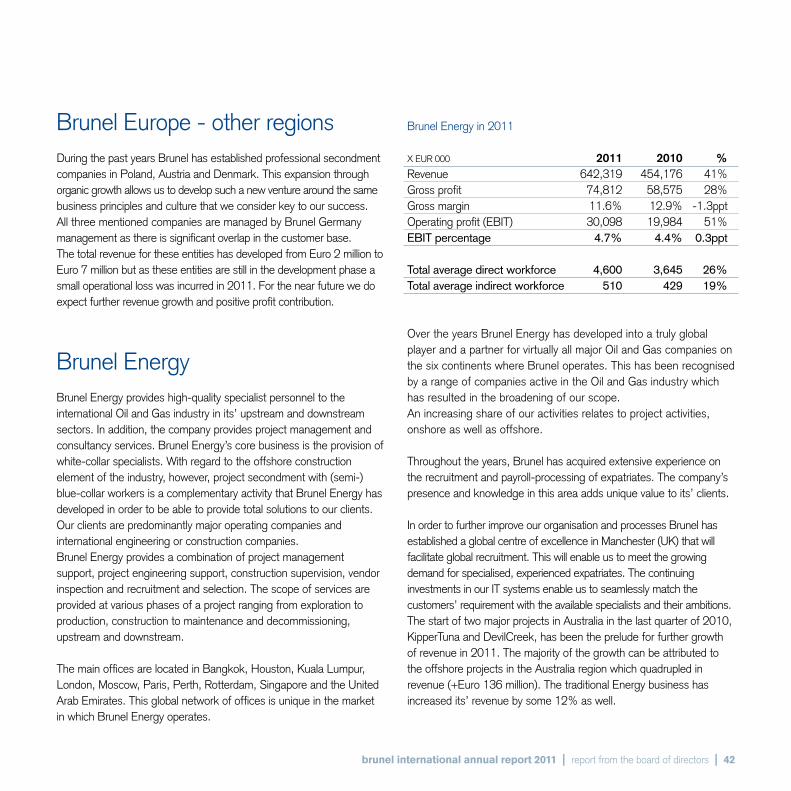
brunel international annual report 2011 | report from the board of directors | 42
Brunel Europe - other regionsDuring the past years Brunel has established professional secondment companies in Poland, Austria and Denmark. This expansion through organic growth allows us to develop such a new venture around the same business principles and culture that we consider key to our success. All three mentioned companies are managed by Brunel Germany management as there is significant overlap in the customer base. The total revenue for these entities has developed from Euro 2 million to Euro 7 million but as these entities are still in the development phase a small operational loss was incurred in 2011. For the near future we do expect further revenue growth and positive profit contribution.
Brunel Energy Brunel Energy provides high-quality specialist personnel to the international Oil and Gas industry in its’ upstream and downstream sectors. In addition, the company provides project management and consultancy services. Brunel Energy’s core business is the provision of white-collar specialists. With regard to the offshore construction element of the industry, however, project secondment with (semi-) blue-collar workers is a complementary activity that Brunel Energy has developed in order to be able to provide total solutions to our clients. Our clients are predominantly major operating companies and international engineering or construction companies.Brunel Energy provides a combination of project management support, project engineering support, construction supervision, vendor inspection and recruitment and selection. The scope of services are provided at various phases of a project ranging from exploration to production, construction to maintenance and decommissioning, upstream and downstream.
The main offices are located in Bangkok, Houston, Kuala Lumpur, London, Moscow, Paris, Perth, Rotterdam, Singapore and the United Arab Emirates. This global network of offices is unique in the market in which Brunel Energy operates.
Brunel Energy in 2011
X EUR 000 2011 2010 %Revenue 642,319 454,176 41%Gross profit 74,812 58,575 28%Gross margin 11.6% 12.9% -1.3ppt Operating profit (EBIT) 30,098 19,984 51%EBIT percentage 4.7% 4.4% 0.3ppt
Total average direct workforce 4,600 3,645 26%Total average indirect workforce 510 429 19%
Over the years Brunel Energy has developed into a truly global player and a partner for virtually all major Oil and Gas companies on the six continents where Brunel operates. This has been recognised by a range of companies active in the Oil and Gas industry which has resulted in the broadening of our scope. An increasing share of our activities relates to project activities, onshore as well as offshore.
Throughout the years, Brunel has acquired extensive experience on the recruitment and payroll-processing of expatriates. The company’s presence and knowledge in this area adds unique value to its’ clients.
In order to further improve our organisation and processes Brunel has established a global centre of excellence in Manchester (UK) that will facilitate global recruitment. This will enable us to meet the growing demand for specialised, experienced expatriates. The continuing investments in our IT systems enable us to seamlessly match the customers’ requirement with the available specialists and their ambitions. The start of two major projects in Australia in the last quarter of 2010, KipperTuna and DevilCreek, has been the prelude for further growth of revenue in 2011. The majority of the growth can be attributed to the offshore projects in the Australia region which quadrupled in revenue (+Euro 136 million). The traditional Energy business has increased its’ revenue by some 12% as well.

brunel international annual report 2011 | report from the board of directors | 43
The lower gross margin compared to the previous year is largely explained by the increased volume and proportion of the lower margin offshore project revenue.
OutlookThe outlook in the Oil and Gas industry for 2012 remains positive. Growth is expected not only as a result of project revenue in the Australian region but we also do expect continued revenue growth with the regular Oil and Gas business.
Note: The following sections of this Annual Report together form the management report (jaarverslag) within the meaning of section 2:391 of the Dutch Civil Code: Corporate profile of Brunel International, Corporate Governance, Risks, Risk management and Control Systems, Brunel’s Vision, Objectives and Strategy, Report from the Board of Directors and the subsection Remuneration included in the Report from the Supervisory Board.
Declarations The members of the Board of Directors as required by section 5:25c, paragraph 2, under c of the Dutch Act on Financial Supervision (Wet op Financieel Toezicht) confirm that to the best of their knowledge:
- These 2011 financial statements give a true and fair view of the assets, liabilities, financial position and profit or loss of the Company and the undertakings included in the consolidation taken as a whole;
- This Annual Report gives a true and fair view of the Company’s position and the undertakings included in the consolidation taken as a whole as of December 31, 2011 and of the development and performance of the business for the financial year then ended;
- This Annual Report includes a description of the principal risks and uncertainties that the Company faces.
This annual report and the 2011 financial statements, audited by Deloitte Accountants BV., have been presented to the Supervisory Board. The 2011 financial statements and the external auditor’s report relating to the audit of the 2011 financial statements were discussed with the Audit Committee in the presence of the Board of Directors and the external auditor. The Supervisory Board endorses the recommendation of the Board of Directors that the General Meeting of Shareholders adopts the 2011 financial statements included in this annual report and the Board of Directors recommends the proposal to pay a cash dividend for the financial year of 2011 of Euro 0.90 per common share.
Amsterdam, 12 March 2012
Board of Directors Jan Arie Van Barneveld Chief Executive Officer Rob van der Hoek Chief Financial Officer

10the brunel share

brunel international annual report 2011 | the brunel share | 45
Structures and sharesBrunel International N.V. is a public limited liability company. It’s authorised capital is € 5 million, divided into 99.8 million ordinary shares and one priority share. The par value of the ordinary shares is € 0.05 each. The par value of the priority share is € 10,000. The priority share has not been issued.
Stock exchange listingBrunel International N.V. ordinary shares are listed at the NYSE Euronext stock exchange in Amsterdam (ticker symbol BRNL). In 2010 the Brunel share became part of the Amsterdam Midkap Index (AMX).Since April 2011options on Brunel shares are also traded on NYSE Liffe, the derivatives market of NYSE Euronext.
Share capitalThe total number of shares outstanding on 31 December 2011 is 23,531,312, giving a market capitalisation of € 536 million at that time. The number of shares outstanding at year-end 2010 was 23,246,312. The increase in the number of shares outstanding is due to the exercise of stock option rights.
Share option schemeIn 2011, option rights were granted to the members of the Board of Directors, under the Articles of Association. A note explaining these grants is included in the Supervisory Board’s remuneration report, which is available on the company’s website. Several senior management members were also granted option rights.
InterestsAccording to the AFM register on notification of substantial holdings, Mr. J. Brand, the company’s founder, directly or indirectly holds a capital interest of approximately 63%, with corresponding voting rights.
Share price developmentThe Brunel share price rose in the first half of the year reaching a high of € 34,95 in May. Despite continued excellent operational performance the share price then decreased and, in line with the general trend on the AMX and other stock markets, reached a low of € 20,00 in August.
The Brunel share closed 2011 at a price of € 22.78, 23% below the 2010 closing price of € 29,49. The share therefore performed slightly better than the AMX which decreased by 27% during 2011.
Brunel share price (€)
2007 2008 2009 2010 2011Year-end 16.35 8.55 23.45 29.49 22.78High 26.66 18.55 23.83 29.63 34.95Low 14.86 8.10 7.01 19.46 20.00
LiquidityAfter two subsequent years of increasing liquidity , the liquidity of Brunel shares decreased in 2011. The total number of shares traded during the year was almost 24% lower than in 2010. This reduction may be attributable to the one-off positive impact that the introduction of Brunel shares into the AMX in 2010 had on the volume of shares traded.
The average holding period of the free float shares was approximately 8 months during 2011.

brunel international annual report 2011 | the brunel share | 46
Earnings per shareBrunel earnings per share (€)
2007 2008 2009 2010 2011EPS 1.59 1.96 1.35 1.09 1.83
DividendBrunel’s dividend policy is based on a payout ratio of 30 to 50 per cent of net income. During the past two years we have deviated from this policy, resulting in higher payout ratios. For this year we propose to pay a dividend of € 0.90 per share to the General Meeting of Shareholders.
2007 2008 2009 2010 2011 Dividend (€) 0.70 0.80 0.80 0.80 0.90Payout (%) 44% 41% 59% 73% 49%
Financial calendarMay 3, 2012 Annual General Meeting of ShareholdersMay 3, 2012 Trading update for the first quarter 2012May 7, 2012 Ex-dividend listingMay 17, 2012 Dividend available for paymentAugust 17, 2012 Half year results 2012November 2, 2012 Trading update for the third quarter 2012

11brunel international nvannual accounts 2011

brunel international annual report 2011 | annual accounts 2011 | 48
Annual Accounts page
Consolidated financial statements
Consolidated balance sheet .................................................................................................................................................................... 49
Consolidated profit and loss account ....................................................................................................................................................... 50
Consolidated statement of comprehensive income ................................................................................................................................... 51
Consolidated cash flow statement ........................................................................................................................................................... 52
Consolidated statement of changes in equity ........................................................................................................................................... 53
Notes to the consolidated financial statements ........................................................................................................................................ 54
Company financial statements
Company balance sheet ......................................................................................................................................................................... 75
Company profit and loss account ............................................................................................................................................................ 76
Notes to the company balance sheet and profit and loss account ............................................................................................................. 76

brunel international annual report 2011 | annual accounts 2011 | 49
Consolidated balance sheet as per 31 December 2011x EUR 000, before profit appropriation
2011 2010Non-current assetsGoodwill (1) 7,003 6,972 Other intangible assets (2) 8,789 5,277 Property, plant and equipment (3) 8,719 9,085 Deferred income tax assets (11) 5,712 6,298 30,223 27,632
Current assets net of current liabilitiesDebtors and other receivables (4) 260,995 190,882 Income tax receivables (11) 11,483 11,752 Cash (5) 86,034 63,924 Total current assets 358,512 266,558 Current liabilities (6) 135,329 83,737 Income tax payables (11) 15,525 7,805 Total current liabilities 150,854 91,542 Working capital 207,658 175,016
Non-current liabilitiesDeferred income tax liabilities (11) 1,263 454
Group equity (7)Share capital 1,177 1,162 Share premium 47,028 41,900 Reserves 145,367 133,725 Unappropriated result 42,852 25,178 Minority interest 194 229 236,618 202,194 Balance sheet total 388,735 294,190
brunel international annual report 2011 | annual accounts 2011 | 50
Consolidated profit and loss account 2011x EUR 000
2011 2010Revenue 979,868 720,924 Direct personnel expenses (8) 786,302 568,944 Gross Profit 193,566 151,980 Other income and expenses -2,100 Indirect personnel expenses (8) 81,743 68,877 Depreciation (9) 3,710 3,633 Other general and administrative expenses (10) 43,710 40,024 Total operating costs 129,163 112,534 Operating profit 64,403 37,346 Exchange differences 164 274 Interest income 701 740 Financial income and expense 865 1,014 Result before tax 65,268 38,360 Tax (11) 22,125 12,759 Group result after tax 43,143 25,601 Net income for the year 43,143 25,601 Net income attributable to minority interest -291 -423 Net income attributable to equity holders of the parent (ordinary shares) 42,852 25,178 Basic earnings per share in Euros (12) 1.83 1.09 Diluted earnings per share in Euros (12) 1.82 1.08
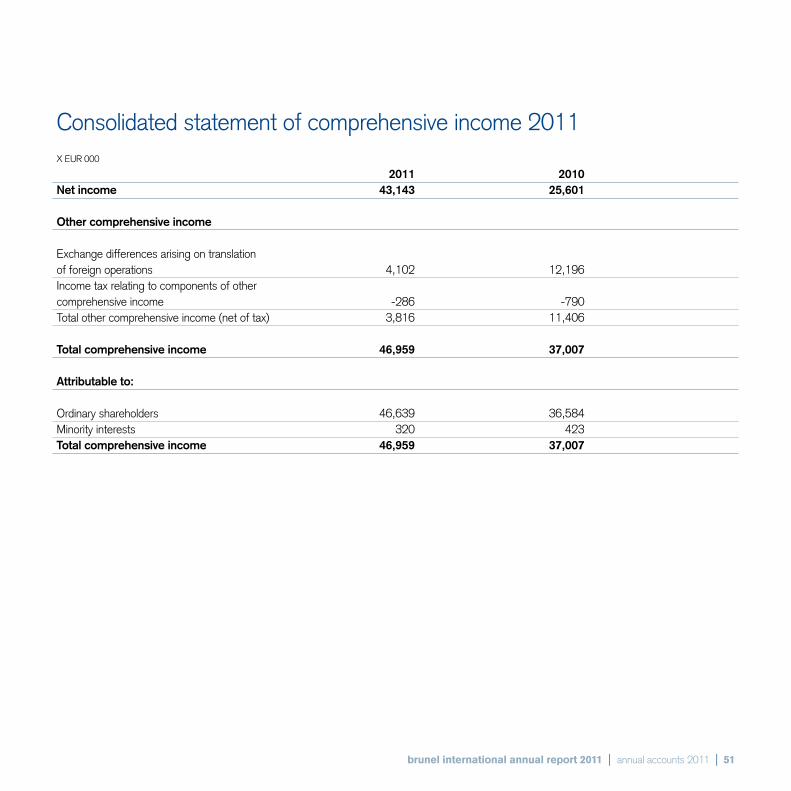
brunel international annual report 2011 | annual accounts 2011 | 51
Consolidated statement of comprehensive income 2011X EUR 000
2011 2010 Net income 43,143 25,601 Other comprehensive income Exchange differences arising on translation of foreign operations 4,102 12,196 Income tax relating to components of other comprehensive income -286 -790 Total other comprehensive income (net of tax) 3,816 11,406 Total comprehensive income 46,959 37,007 Attributable to: Ordinary shareholders 46,639 36,584 Minority interests 320 423 Total comprehensive income 46,959 37,007

brunel international annual report 2011 | annual accounts 2011 | 52
Consolidated cash flow statement 2011x EUR 000
2011 2010Cash flow from operational activities Result before tax 65,268 38,360Adjustments for: Depreciation (9) 3,710 3,633Other non cash expenses (4) 897 187Interest received -701 -740Share based payments 1,493 980Changes in: Receivables (13) -64,627 -34,665Current liabilities (14) 48,288 12,478Cash flow from operations 54,328 20,233Income tax paid (11) -13,622 -16,468 40,706 3,765
Cash flow from investments Additions to property, plant & equipment (3) -2,651 -2,323Additions to software (2) -4,477 -981Disposals of property, plant & equipment (2,3) 235 479Interest received 701 740 -6,192 -2,085
Cash flow from financing activities Issue of new shares 5,143 2,632Acquisitions minority interest -185Dividend minority interest -355 -552Dividend ordinary shareholders -18,816 -18,545 -14,028 -16,650 Net increase in cash 20,486 -14,970 Cash position at 1 January 63,924 73,157Exchange rate movements 1,624 5,737
Cash position at 31 December 86,034 63,924

brunel international annual report 2011 | annual accounts 2011 | 53
Consolidated statement of changes in equityx EUR 000 RESERVES Share Un- Attributable Trans- based approp- to ordinary Share Share lation pay- Treasury Retained riated share- Minority capital premium reserve ments shares earnings result holders interest Total
Balance at 1 January 2010 1,156 39,274 -6,058 1,750 0 113,134 31,062 180,318 539 180,857 Net income 25,178 25,178 423 25,601Exchange differences arising on translation of foreign operations 12,155 37 12,192 4 12,196Income tax relating to components of other comprehensive income -790 -790 -790 Total comprehensive income 11,365 37 25,178 36,580 427 37,007 Cash dividend -18,545 -18,545 -552 -19,097Appropriation of result 12,517 -12,517 Share based payments 980 980 980Option rights exercised 6 2,626 2,632 2,632Acquisition of minority interest -185 -185
Balance at 1 January 2011 1,162 41,900 5,307 2,730 0 125,688 25,178 201,965 229 202,194
Net income 42,852 42,852 291 43,143
Exchange differences arising on
translation of foreign operations 4,073 4,073 29 4,102
Income tax relating to components
of other comprehensive income -286 -286 -286
Total comprehensive income 3,787 42,852 46,639 320 46,959
Cash dividend -18,816 -18,816 -355 -19,171
Appropriation of result 6,362 -6,362
Share based payments 1,493 1,493 1,493
Option rights exercised 15 5,128 5,143 5,143
Balance at 31 December 2011 1,177 47,028 9,094 4,223 0 132,050 42,852 236,424 194 236,618

brunel international annual report 2011 | annual accounts 2011 | 54
Notes to the consolidated financial statements
ParticipationsBrunel International’s main participations are listed below. These are included in the consolidated financial statements of Brunel International. Unless otherwise stated all these participations are, directly or indirectly, wholly-owned and Brunel has full or over half the voting power. Some non-material participations are not included in the list.
Brunel Nederland BV, Rotterdam, The NetherlandsBrunel Energy Holding BV, Rotterdam, The NetherlandsBrunel Energy Europe BV, Rotterdam, The NetherlandsBrunel ICT NV, Mechelen, BelgiumBrunel Engineering Consultants NV, Mechelen, BelgiumBrunel International UK Ltd, Glasgow, United KingdomBrunel GmbH, Bremen, GermanyCar Synergies GmbH, Bochum, GermanyBrunel Energy Dubai LLC, Dubai, United Arab Emirates (75%)Brunel Oil & Gas Services WLL, Doha, Qatar (75%)Brunel International South East Asia Pte Ltd, SingaporeBrunel Technical Services, Pte Ltd, SingaporeBrunel Energy Malaysia SDN BHD, Kuala Lumpur, MalaysiaBrunel Technical Services Thailand Ltd, Bangkok, ThailandBrunel Energy (Thailand) Ltd, Bangkok, ThailandBrunel Energy Pty Ltd, Perth, AustraliaBrunel Technical Services Pty Ltd, Perth, AustraliaBrunel Energy Inc, Houston, Unites States of AmericaBrunel Energy Nigeria Ltd, Lagos, NigeriaBrunel Recruitment Kazakhstan LLP, Atyrau, KazakhstanBrunel Energy Canada Inc, Calgary, CanadaMultec Canada Ltd, Toronto, CanadaBrunel Korea Ltd, Ulsan, South KoreaBrunel International France Sarl, Paris, FranceBrunel New Zealand, Perth, AustraliaBrunel Energy Servicos Ltda Brasil, Rio de Janeiro, BrasilBrunel Energy Hong Kong Ltd, Hong Kong, ChinaBrunel EPDS Pty Ltd, Perth, AustraliaBrunel Technical Services Philippines Inc, Makati City, PhilippinesBrunel India Private Ltd, Mumbai, IndiaBrunel Energy Kuwait WLL, Farwania, Kuwait (75%)Brunel CR BV, Amsterdam, The NetherlandsBrunel Italia SRL, Verona, ItalyBrunel Austria GmbH, Salzburg, AustriaBrunel Polska Sp. Z o.o., Wroclaw, PolandBrunel Denmark ApS, Copenhagen, Denmark

brunel international annual report 2011 | annual accounts 2011 | 55
General informationBrunel International N.V. is a public limited liability company domiciled in Amsterdam, The Netherlands and listed at the NYSE Euronext stock exchange in Amsterdam (ticker symbol BRNL). The head office of the company is located in Amsterdam, the address is:John M. Keynesplein 331066 EP Amsterdam The Netherlands
The consolidated financial statements of Brunel include the company and its subsidiaries (together referred to as ‘Brunel’) and Brunel’s interest in joint ventures. A summary of the main subsidiaries is included on page 54 of this report.
The financial statements were signed and authorised for issue by the Board of Directors and released for publication on 12 March 2012. The financial statements and the dividend proposal are subject to adoption by the General Meeting of Shareholders on 3 May 2012.
All the information in these financial statements is in thousands of Euro, unless stated otherwise.
Brunel’s activities are mainly secondment, project management, recruitment and consultancy.
Statement of complianceThe financial statements have been prepared in accordance with International Financial Reporting Standards (IFRS) as adopted by the European Union and also comply with the financial reporting requirements included in Part 9 Book 2 of the Netherlands Civil Code
Adoption of new and revised IFRSsThe following new and revised IFRSs have been adopted in these consolidated financial statements. The application of these new and revised IFRSs has not had any material impact on the amounts reported for the current and prior years but may affect the accounting for future transactions or arrangements.
•AmendmentstoIAS1:PresentationofFinancialStatements(aspartof Improvements to IFRSs issued in 2010)
•IAS24:RelatedPartyDisclosures(asrevisedin2009)•AmendmentstoIFRS3:BusinessCombinations•AmendmentstoIAS32:ClassificationofRightsIssues•AmendmentstoIFRIC14:PrepaymentsofaMinimumFunding
Requirement•IFRIC19:ExtinguishingFinancialLiabilitieswithEquityInstruments•ImprovementstoIFRSsissuedin2010
New and revised IFRSs issued but not yet effective The Group has not applied the following new and revised IFRSs that have been issued but are not yet effective:
•IFRS7(asrevisedin2011):FinancialInstruments:Disclosures 2
•IFRS9:FinancialInstruments2
•IFRS10:ConsolidatedFinancialStatements2
•IFRS11:JointArrangements2
•IFRS12:DisclosureofInterestsinOtherEntities2
•IFRS13:FairValueMeasurement2
•AmendmentstoIAS1:PresentationofItemsofOtherComprehensive Income3
•AmendmentstoIAS12:DeferredTax–RecoveryofUnderlyingAssets4
•IAS19(asrevisedin2011):EmployeeBenefits2
•IAS27(asrevisedin2011):SeparateFinancialStatements2
•IAS28(asrevisedin2011):InvestmentsinAssociatesandJointVenture2
•IAS32(asrevisedin2011):FinancialInstruments:Presentation5
1 Effective for annual periods beginning on or after 1 July 2011.2 Effective for annual periods beginning on or after 1 January 2013.3 Effective for annual periods beginning on or after 1 July 2012.4 Effective for annual periods beginning on or after 1 January 2012.5 Effective for annual periods beginning on or after 1 January 2014.
IFRS 10, 11, 12, 13 and IAS 19 have not (yet) been endorsed by EU.

brunel international annual report 2011 | annual accounts 2011 | 56
Principles of consolidationThe consolidated annual accounts include the financial information of Brunel International N.V. and its subsidiaries.Subsidiaries relate to companies controlled directly or indirectly by Brunel International N.V. These companies are listed on page 54. Control is achieved where the company has the power to govern the financial and operating policies of an entity so as to obtain benefits from its activities.The results of acquired or disposed companies are consolidated from the date of acquisition or sale, respectively. All intra-group transactions, balances, income and expenses are eliminated on consolidation.
Minority interests in the net assets of consolidated subsidiaries are identified separately from Brunel’s equity therein. Minority interests consist of the net equity value of those interests at the date of the original business combination and the minority’s share of changes in equity since the date of the combination. Losses applicable to the minority in excess of the minority’s interest in the subsidiary’s equity are allocated against the interests of Brunel except to the extent that the minority has a binding obligation and is able to make an additional investment to cover the losses.
The financial information relating to Brunel International N.V. is presented in the consolidated financial statements. Accordingly, in accordance with article 2:402 of The Netherlands Civil Code, the company financial statements only contain an abridged profit and loss account.
Accounting principles for the valuation of assets and liabilities and determination of profitThe book value of Brunel’s assets is reviewed for impairment whenever events or changes in circumstances indicate that the book value may not be recoverable. In case of these events or changes in circumstances the recoverable value of the asset concerned is determined. If this is not possible, the recoverable amount of the cash-generating unit to which the asset belongs, is determined. For purposes of impairment testing, assets are grouped at the lowest levels for which there are separately identifiable cash flows. An asset
is impaired if its book value is exceeding the recoverable value. The recoverable value is the higher of an asset’s fair value less costs to sell and its value in use. The value in use is determined by means of the present value of estimated cash flow projections.
All business combinations are accounted for by applying the purchase method. When a company or business is acquired, the acquirer recognises goodwill as an asset. The asset recognised is measured as the excess of the cost of acquisition over the acquirer’s interest in the fair value of assets, liabilities and contingent liabilities acquired. Impairment of goodwill will be tested at least annually. An impairment loss recognised for goodwill is not reversed in a subsequent period. Changes in ownership interests in subsidiaries that do not result in loss of control are dealt with in equity.Software, plant, property and equipment are valued at historical cost less depreciation using the straight-line method over their expected useful life.
Financial assets are, depending on the nature of the asset concerned, valued at either amortised costs, using the effective interest method less impairment either the equity method.
Trade receivables are initially stated at fair value. Subsequent measurement is at amortised costs less provision for impairment.
The other assets and liabilities are initially stated at cost.
All receivables and liabilities are classified as originated loans and receivables.
Balance sheet items denominated in foreign currencies are translated at the rates of exchange prevailing at the balance sheet date; profit and loss account items are translated at the average rates during the financial year. Exchange differences due to the consolidation of foreign companies are charged or credited directly to the translation reserve.Share based payments are granted to the directors of the company and senior management. These option plans are settled in ordinary

brunel international annual report 2011 | annual accounts 2011 | 57
shares. The fair value of these share-based payments, calculated on grant date, is included in the indirect personnel expenses. The expenses are credited to equity for the same amount. The fair value is calculated based on the Black and Scholes option valuation model. At each balance sheet date, Brunel revises its estimates of the number of options that are expected to become exercisable, taking into account the lapse of options and the conditional requirements. The impact of the revision of original estimates, if any, is recognised in the income statement with a corresponding adjustment to equity over the remaining period.
Revenue comprises the fair value of the consideration received or receivable, excluding any taxes levied thereon, for time based services rendered during the financial year to third parties. Revenue generated from non-recurring recruitment services is charged, and recognised, as revenue upon completion.
Direct costs relate to costs attributed directly to the services provided, with personnel costs as the main cost item.
Retirement benefit costs: All pension plans prevailing within Brunel are defined contribution plans. Payments to these plans are charged as an expense as they fall due.
Leasing: Rentals payable under operating leases are charged to profit or loss on a straight-line basis over the term of the relevant lease. Benefits received and receivable as an incentive to enter into an operating lease are also spread on a straight-line basis over the lease term.
Taxation: Income tax expense represents the sum of the tax currently payable and deferred tax.The tax currently payable is based on taxable profit for the year. Taxable profit differs from profit as reported in the income statement because it excludes items of income or expense that are taxable or deductible in other years and it further excludes items that are never taxable or deductible. Brunel’s liability for current tax is calculated using applicable rates.
Deferred tax is recognised on differences between the carrying amounts of assets and liabilities in the financial statements and the corresponding tax bases used in the computation of taxable profit. Deferred tax liabilities are generally recognised for all taxable temporary differences and deferred tax assets are recognised to the extent that it is probable that taxable profits will be available against which deductible temporary differences can be utilised.
The carrying amount of deferred tax assets is reviewed at each balance sheet date and reduced to the extent that it is no longer probable that sufficient taxable profits will be available to allow all or part of the asset to be recovered.
Deferred tax is calculated at the tax rates that are expected to apply in the period when the liability is settled or the asset realised. Deferred tax is charged or credited to profit or loss, except when it relates to items charged or credited directly to equity, in which case the deferred tax is also dealt with in equity.
Accounting principles for determining the consolidated cash flow statementThe cash flow statement has been prepared according to the indirect method, whereby profit or loss is adjusted for the effects of transactions of a non-cash nature, any deferrals or accruals of past or future operating cash receipts or payments, and items of income or expense associated with investing or financing cash flows.
Accounting principles for segment reportingOperating segments have been identified on the basis of internal reports about components of the Group that are regularly reviewed by the chief operating decision maker in order to allocate resources to the segments and to assess their performance. Information reported to the Group’s chief operating decision maker is focused at components engaged in providing services in a particular economic environment from those of other segments. A geographical segment is engaged in providing services in a particular economic environment which are subject to risks and returns that are different from those segments operating in other economic environments.
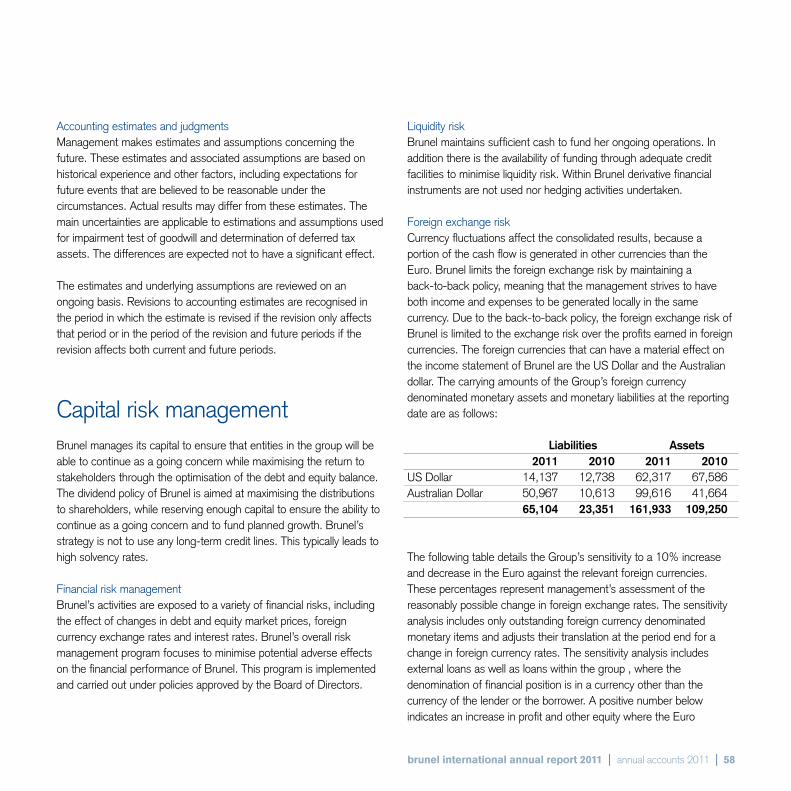
brunel international annual report 2011 | annual accounts 2011 | 58
Accounting estimates and judgmentsManagement makes estimates and assumptions concerning the future. These estimates and associated assumptions are based on historical experience and other factors, including expectations for future events that are believed to be reasonable under the circumstances. Actual results may differ from these estimates. The main uncertainties are applicable to estimations and assumptions used for impairment test of goodwill and determination of deferred tax assets. The differences are expected not to have a significant effect.
The estimates and underlying assumptions are reviewed on an ongoing basis. Revisions to accounting estimates are recognised in the period in which the estimate is revised if the revision only affects that period or in the period of the revision and future periods if the revision affects both current and future periods.
Capital risk managementBrunel manages its capital to ensure that entities in the group will be able to continue as a going concern while maximising the return to stakeholders through the optimisation of the debt and equity balance. The dividend policy of Brunel is aimed at maximising the distributions to shareholders, while reserving enough capital to ensure the ability to continue as a going concern and to fund planned growth. Brunel’s strategy is not to use any long-term credit lines. This typically leads to high solvency rates.
Financial risk managementBrunel’s activities are exposed to a variety of financial risks, including the effect of changes in debt and equity market prices, foreign currency exchange rates and interest rates. Brunel’s overall risk management program focuses to minimise potential adverse effects on the financial performance of Brunel. This program is implemented and carried out under policies approved by the Board of Directors.
Liquidity riskBrunel maintains sufficient cash to fund her ongoing operations. In addition there is the availability of funding through adequate credit facilities to minimise liquidity risk. Within Brunel derivative financial instruments are not used nor hedging activities undertaken.
Foreign exchange riskCurrency fluctuations affect the consolidated results, because a portion of the cash flow is generated in other currencies than the Euro. Brunel limits the foreign exchange risk by maintaining a back-to-back policy, meaning that the management strives to have both income and expenses to be generated locally in the same currency. Due to the back-to-back policy, the foreign exchange risk of Brunel is limited to the exchange risk over the profits earned in foreign currencies. The foreign currencies that can have a material effect on the income statement of Brunel are the US Dollar and the Australian dollar. The carrying amounts of the Group’s foreign currency denominated monetary assets and monetary liabilities at the reporting date are as follows:
Liabilities Assets 2011 2010 2011 2010US Dollar 14,137 12,738 62,317 67,586Australian Dollar 50,967 10,613 99,616 41,664 65,104 23,351 161,933 109,250
The following table details the Group’s sensitivity to a 10% increase and decrease in the Euro against the relevant foreign currencies. These percentages represent management’s assessment of the reasonably possible change in foreign exchange rates. The sensitivity analysis includes only outstanding foreign currency denominated monetary items and adjusts their translation at the period end for a change in foreign currency rates. The sensitivity analysis includes external loans as well as loans within the group , where the denomination of financial position is in a currency other than the currency of the lender or the borrower. A positive number below indicates an increase in profit and other equity where the Euro

brunel international annual report 2011 59
weakens 10% against the relevant currency. For a 10% strengthening of the Euro against the relevant currency, there would be an equal and opposite impact on the profit and other equity, and the balances below would be negative.
US Australian Dollar impact Dollar impact 2011 2010 2011 2010Profit or loss 640 362 834 192Other equity 3,557 3,095 2,072 1,812Total Equity 4,197 3,457 2,906 2,004
Revenue 23,245 15,393 23,436 10,251
Credit riskCredit risk refers to the risk that a counterparty will default on its contractual obligations resulting in financial loss to the company. Brunel has no significant concentrations of credit risk. The most important balance sheet items that are imposed to credit risk are the trade and other receivables. The trade accounts receivable do include an allowance for bad debts, reference is made to note 4. Generally services are provided to large and financially strong companies. In order to minimise credit risk exposure, Brunel intensively monitors the payment behavior of their customers. Other policies limit the amount of credit exposure to any financial institution. Despite these internal procedures, uncollectible debts can not be ruled out, but the risk of a material erosion of the operating profit is small. As per 31 December 2011 the largest receivable against a single counterparty amounted € 13.2 million.
Interest rate riskDue to the nature of Brunel’s business the operating cash flows are substantially independent of changes in market interest rates. Interest coverage is the leading parameter in managing interest exposure. Due to the capital structure of Brunel, the interest paid and received are immaterial amounts and hence no material interest rate risk applies.
Notes to the consolidated balance sheet
X EUR 000, unless stated otherwise
1. Goodwill Movements during the year under review:
2011 2010At cost at 1 January 9,598 9,598Accumulated impairment and exchange rate movements -2,626 -2,691Balance at 1 January 6,972 6,907 Changes in book value: Exchange rate movements 31 65Balance at 31 December 7,003 6,972 At cost at 31 December 9,598 9,598Accumulated impairment and exchange rate movements -2,595 -2,626Balance at 31 December 7,003 6,972
Goodwill has been allocated for impairment testing purposes to four individual cash generating units:
2011 2010Brunel Germany 2,844 2,844Brunel Energy Inc. (USA) 942 911Brunel Commonwealth Resources 253 253Brunel Insurance & Banking 2,964 2,964 7,003 6,972
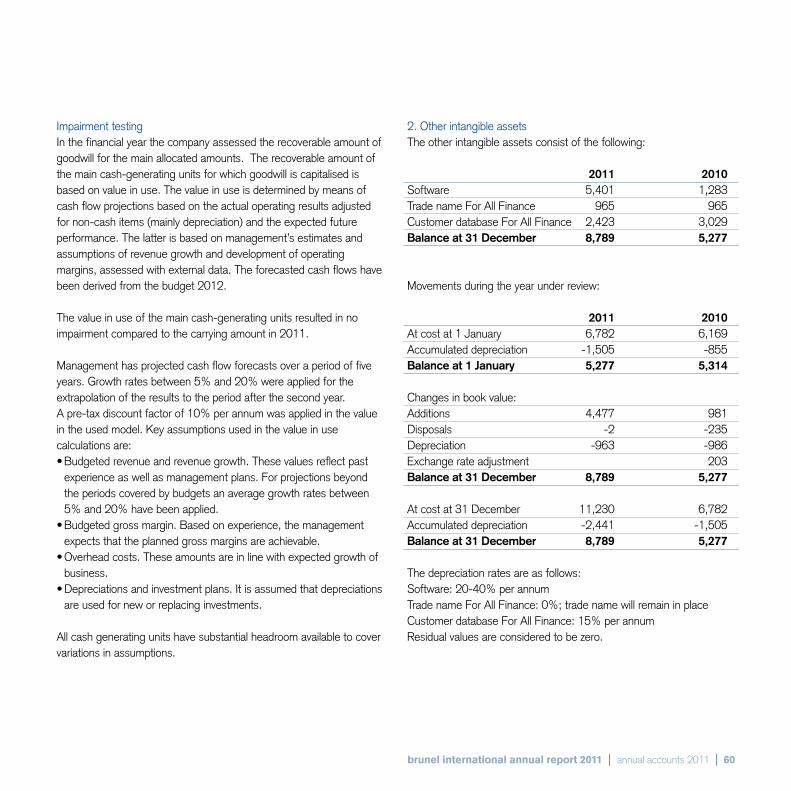
brunel international annual report 2011 | annual accounts 2011 | 60
Impairment testingIn the financial year the company assessed the recoverable amount of goodwill for the main allocated amounts. The recoverable amount of the main cash-generating units for which goodwill is capitalised is based on value in use. The value in use is determined by means of cash flow projections based on the actual operating results adjusted for non-cash items (mainly depreciation) and the expected future performance. The latter is based on management’s estimates and assumptions of revenue growth and development of operating margins, assessed with external data. The forecasted cash flows have been derived from the budget 2012. The value in use of the main cash-generating units resulted in no impairment compared to the carrying amount in 2011.
Management has projected cash flow forecasts over a period of five years. Growth rates between 5% and 20% were applied for the extrapolation of the results to the period after the second year. A pre-tax discount factor of 10% per annum was applied in the value in the used model. Key assumptions used in the value in use calculations are:•Budgetedrevenueandrevenuegrowth.Thesevaluesreflectpast
experience as well as management plans. For projections beyond the periods covered by budgets an average growth rates between 5% and 20% have been applied.
•Budgetedgrossmargin.Basedonexperience,themanagementexpects that the planned gross margins are achievable.
•Overheadcosts.Theseamountsareinlinewithexpectedgrowthofbusiness.
•Depreciationsandinvestmentplans.Itisassumedthatdepreciationsare used for new or replacing investments.
All cash generating units have substantial headroom available to cover variations in assumptions.
2. Other intangible assetsThe other intangible assets consist of the following:
2011 2010Software 5,401 1,283Trade name For All Finance 965 965Customer database For All Finance 2,423 3,029Balance at 31 December 8,789 5,277
Movements during the year under review:
2011 2010At cost at 1 January 6,782 6,169Accumulated depreciation -1,505 -855Balance at 1 January 5,277 5,314 Changes in book value: Additions 4,477 981Disposals -2 -235Depreciation -963 -986Exchange rate adjustment 203Balance at 31 December 8,789 5,277 At cost at 31 December 11,230 6,782Accumulated depreciation -2,441 -1,505Balance at 31 December 8,789 5,277
The depreciation rates are as follows:Software: 20-40% per annumTrade name For All Finance: 0%; trade name will remain in placeCustomer database For All Finance: 15% per annumResidual values are considered to be zero.
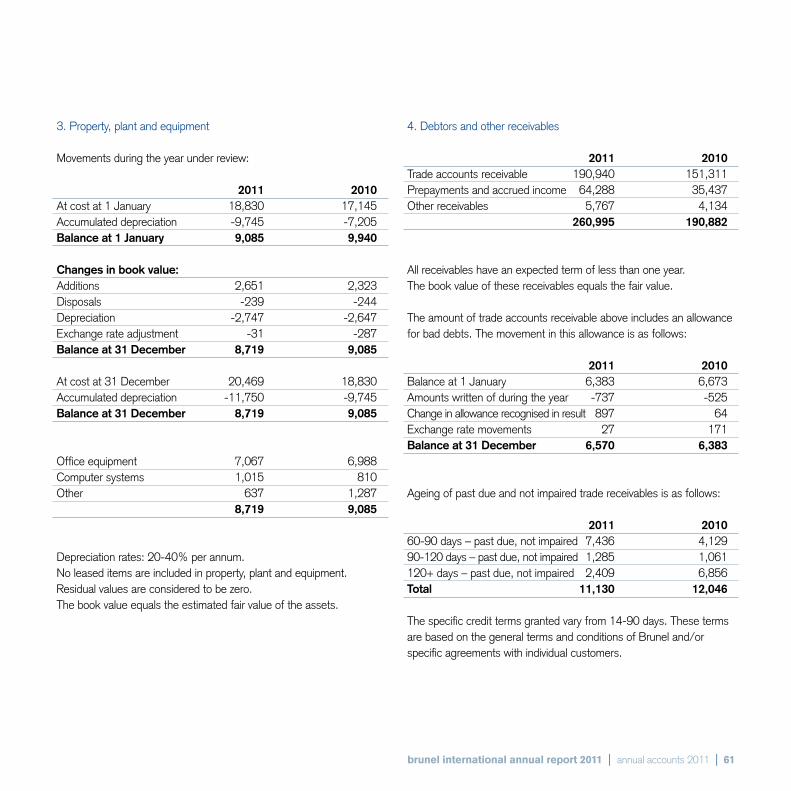
brunel international annual report 2011 | annual accounts 2011 | 61
3. Property, plant and equipment
Movements during the year under review:
2011 2010At cost at 1 January 18,830 17,145Accumulated depreciation -9,745 -7,205Balance at 1 January 9,085 9,940 Changes in book value: Additions 2,651 2,323Disposals -239 -244Depreciation -2,747 -2,647Exchange rate adjustment -31 -287Balance at 31 December 8,719 9,085 At cost at 31 December 20,469 18,830Accumulated depreciation -11,750 -9,745Balance at 31 December 8,719 9,085
Office equipment 7,067 6,988Computer systems 1,015 810Other 637 1,287 8,719 9,085
Depreciation rates: 20-40% per annum.No leased items are included in property, plant and equipment.Residual values are considered to be zero.The book value equals the estimated fair value of the assets.
4. Debtors and other receivables
2011 2010Trade accounts receivable 190,940 151,311Prepayments and accrued income 64,288 35,437Other receivables 5,767 4,134 260,995 190,882
All receivables have an expected term of less than one year. The book value of these receivables equals the fair value.
The amount of trade accounts receivable above includes an allowance for bad debts. The movement in this allowance is as follows:
2011 2010Balance at 1 January 6,383 6,673Amounts written of during the year -737 -525Change in allowance recognised in result 897 64Exchange rate movements 27 171Balance at 31 December 6,570 6,383
Ageing of past due and not impaired trade receivables is as follows:
2011 201060-90 days – past due, not impaired 7,436 4,12990-120 days – past due, not impaired 1,285 1,061120+ days – past due, not impaired 2,409 6,856Total 11,130 12,046
The specific credit terms granted vary from 14-90 days. These terms are based on the general terms and conditions of Brunel and/or specific agreements with individual customers.

brunel international annual report 2011 | annual accounts 2011 | 62
5. Cash This item consists mainly of bank balances, part of which € 2.4 (2010: € 1.6) million, is not freely disposable on grounds of issued bank guarantees.
6. Current liabilities
2011 2010Trade payables 29,823 21,548Taxes and social security charges 30,459 24,892Pensions 715 669Accrued employee expenses 48,214 20,533Other liabilities and accrued expenses 26,118 16,095 135,329 83,737
Practically all liabilities have an expected term of less than one year. The majority of trade payables and taxes and social security charges are due within a range of 0 – 45 days. The majority of the other liabilities and accrued employee expenses are due within a range of 60 – 180 days.The book value of these liabilities equals the fair value.
7. Group EquityThe authorised capital is € 5,000,000 divided into one priority share with a nominal value of € 10,000 and 99.8 million ordinary shares with a nominal value of € 0.05. The subscribed capital consists of 23,531,312 ordinary shares (2010: 23,246,312) with a value of € 1,176,565.60.
The movement in the number of issued shares is:
2011 2010Issued at 1 January 23,246,312 23,121,312Issue of shares 285,000 125,000Issued at 31 December 23,531,312 23,246,312
Further information is provided in the consolidated statement of changes in Group equity on page 53 of this report.In 2010 the cash dividend per share was € 0.80. The proposed cash dividend for 2011 will be € 0.90 per share.
Minority interestThe movement in minority interest is as follows:
2011 2010Balance at 1 January 229 539Result for the year 291 423Dividend -355 -552Acquisition of minority interest -185Exchange rate movements 29 4Balance at 31 December 194 229

brunel international annual report 2011 | annual accounts 2011 | 63
Option rightsOutstanding options:
Year granted 2006 2007 2008 2009 2010 2011 TotalWeighted average exercise price in Euros 22.90 24.37 15.50 8.27 26.19 30.25
Outstanding at 1 January 2011 55,000 95,000 360,000 481,000 570,000 0 1,561,000
Granted in 2011 662,000 662,000 Exercised in 2011 -55,000 -35,000 -195,000 -285,000 Forfeited in 2011 -5,000 -8,500 -7,000 -302,000 -26,000 -348,500
Outstanding at 31 December 2011 0 55,000 156,500 474,000 268,000 636,000 1,589,500
Of which Board of Directors 25,000 40,000 85,000 60,000 80,000 290,000 Range of exercise prices in Euros 23.77 15.50 7.40- 25.30 30.62 19.30
Expiry date 2012 2013 2014 2015 2016

brunel international annual report 2011 | annual accounts 2011 | 64
Year granted 2006 2007 2008 2009 2010 2011 Total
Outstanding option rights Board of Directors at 1 January 2011 J.A. van Barneveld 25,000 25,000 40,000 50,000 50,000 190,000 R. van der Hoek - - - 35,000 10,000 45,000 Range of exercise prices in Euro 22.90 23.77 15.50 7.40 – 25.30 19.30
Outstanding option rights Board of Directors at 31 December 2011 J.A. van Barneveld 25,000 40,000 50,000 50,000 50,000 215,000 R. van der Hoek - - 35,000 10,000 30,000 75,000 Range of exercise prices in Euro 23.77 15.50 7.40 – 25.30 30.62 19.30 Expiry date 2012 2013 2014 2015 2016
The options granted to personnel are conditional and linked to performance targets for the year of allocation. The vesting period is three years. Options can be exercised during two years after vesting on condition that the employee is still in the service of the company. The method of settlement can be sale of treasury shares or share issue.The options granted to the Board of Directors are conditional, meaning that they can be exercised after three years on condition that the applicable board member still holds the position.
The option valuation model to calculate the fair value of the options is the Black and Scholes model. This model is based on historical volatility over the past three years, a dividend policy of 0.5% and calculates an interest of 3.0%. The weighted average fair value of options granted in 2011 amounts to € 8.66. The weighted average share price of options exercised in 2011 amounts to € 30.70.The reference dates are the date of granting, and precisely three years later. As per 31 December 2011 only the 2007 and 2008 outstanding options can be exercised.
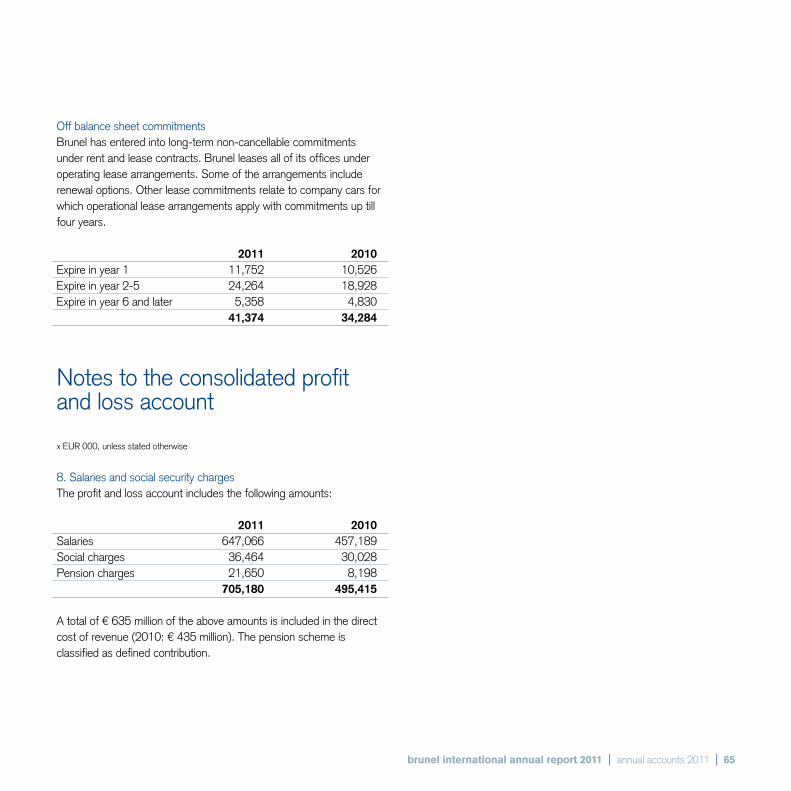
brunel international annual report 2011 | annual accounts 2011 | 65
Off balance sheet commitmentsBrunel has entered into long-term non-cancellable commitments under rent and lease contracts. Brunel leases all of its offices under operating lease arrangements. Some of the arrangements include renewal options. Other lease commitments relate to company cars for which operational lease arrangements apply with commitments up till four years.
2011 2010Expire in year 1 11,752 10,526Expire in year 2-5 24,264 18,928Expire in year 6 and later 5,358 4,830 41,374 34,284
Notes to the consolidated profit and loss account
x EUR 000, unless stated otherwise
8. Salaries and social security chargesThe profit and loss account includes the following amounts:
2011 2010Salaries 647,066 457,189Social charges 36,464 30,028Pension charges 21,650 8,198 705,180 495,415
A total of € 635 million of the above amounts is included in the direct cost of revenue (2010: € 435 million). The pension scheme is classified as defined contribution.

brunel international annual report 2011 | annual accounts 2011 | 66
Remuneration of directors The directors’ remunerations charged to the results in 2011 (2010) are set out below: Salary Bonus Pension Share based Total payments Board of Directors: J.A. van Barneveld , CEO 400 (400) 300 (250) 162(162) 439 (299) 1,301 (1,111)R. van der Hoek, CFO 325 (325) 150 (125) 49 (49) 263 (60) 787 (559)
Supervisory Board: J.E. Jansen 11 (45) 0 0 0 11 (45)A. Schouwenaar 44 (40) 0 0 0 44 (40)D. van Doorn 39 (35) 0 0 0 39 (35)J.C.M. Schönfeld 26 (0) 0 0 0 26 (0)
Mr. van Barneveld has 53,190 shares in the company, in addition to 215,000 conditional share options.Mr. van der Hoek has 5,000 shares in the company, in addition to 75,000 conditional share options.The members of the Supervisory Board hold neither shares nor share options in the company. The weighted average exercise price of the options granted in 2011 amounts to € 30.62
9. DepreciationThe costs for depreciation in the profit and loss account consist of:
2011 2010Other intangible assets (2) 963 986Property, plant and equipment (3) 2,747 2,647 3,710 3,633
10. Other general and administrative expensesThe 2011 other general and administrative expenses include for € 11.1 million (2010: € 9.9 million) of rental costs and leasing costs.

brunel international annual report 2011 | annual accounts 2011 | 67
Audit costs Deloitte member Deloitte member Account- firms/ Total Account- firms/ Total ants BV affiliates 2011 ants BV affiliates 2010Audit fees 138 460 598 125 491 616Audit related fees 8 8 1 152 153Tax services 187 187 221 221Other non-audit fees 30 30 26 26 176 647 823 126 890 1,016
11. Tax 2011 2010Current tax (income)/expense 20,620 12,933Deferred tax (income)/expense 1,505 -174Tax (income)/expense 22,125 12,759
In 2011, the effective tax rate on the result before tax is 33.9% (2010: 33.3%).
The reconciliation between the actual tax expense and the tax expense based on the Dutch corporate income tax rate (2011: 25% and 2010: 25.5%) is as follows:
2011 % 2010 %Income tax at Dutch corporation income tax rate 16,317 25.0% 9,782 25.5%Permanent differences:Difference with foreign tax rates 4,155 6.3% 1,204 3.1%Adjustment previous years 308 0.5% 45 0.1%Derecognition Deferred Tax Asset 1,503 3.9%Non taxable items 1,087 1.7% 449 1.2%Tax losses not recognised as deferred taxasset (in previous years) 232 0.4% -148 -0.4%Other taxes 26 0.0% -76 -0.1%Effective tax charge 22,125 33.9% 12,759 33.3%

brunel international annual report 2011 | annual accounts 2011 | 68
The effective tax rate is strongly affected by changes in the mix of results of subsidiaries in countries with different tax rates and/or systems. Countries with alternative minimum taxes had a relatively higher share in the results.The movements of the tax assets and liabilities can be summarised as follows:
Movement schedule tax assets and liabilities
Current Deferred TotalBalance at 1 January 2011 Tax asset 11,752 6,298 18,050Tax liability -7,805 -454 -8,259 3,947 5,844 9,791
Movements during the yearPaid/Received 13,622 13,622Through Profit and loss -20,620 -1,505 -22,125Through equity -286 -286Exchange rate adjustment -705 110 -595 -7,989 -1,395 -9,384 Balance at 31 December 2011 Tax asset 11,483 5,712 17,195Tax liability -15,525 -1,263 -16,788 -4,042 4,449 407
During the financial year an amount of € 286 was charged directly to the shareholders’ equity (2010: € 790) as deferred tax relating to foreign exchange results recorded directly in the shareholders’ equity.
The deferred tax assets originate from accumulated tax losses, foreign tax credits and temporary differences. Recognition of these assets is based on the forecasted results for the relevant group companies.
The deferred tax liabilities relate to retained earnings in foreign subsidiaries which will be subject to Dutch corporate income tax once distributed to the relevant parent company.
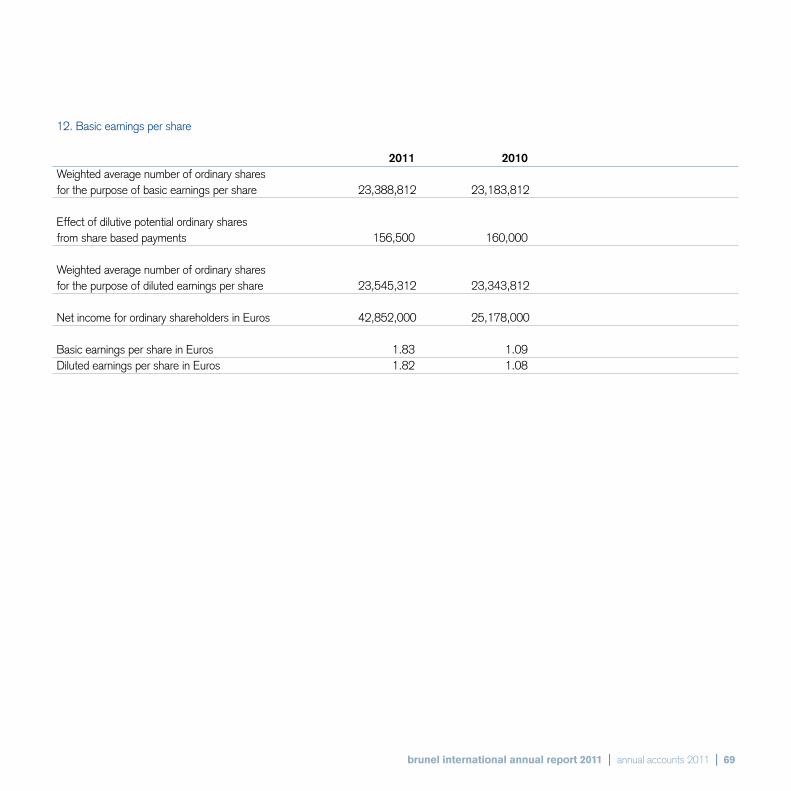
brunel international annual report 2011 | annual accounts 2011 | 69
12. Basic earnings per share
2011 2010Weighted average number of ordinary shares for the purpose of basic earnings per share 23,388,812 23,183,812 Effect of dilutive potential ordinary shares from share based payments 156,500 160,000 Weighted average number of ordinary shares for the purpose of diluted earnings per share 23,545,312 23,343,812 Net income for ordinary shareholders in Euros 42,852,000 25,178,000 Basic earnings per share in Euros 1.83 1.09Diluted earnings per share in Euros 1.82 1.08

brunel international annual report 2011 | annual accounts 2011 | 70
Notes to the consolidated cash flow statement
The majority of the items on the consolidated cash flow statement are, on an individual basis cross-referenced to the relevant notes on the consolidated profit and loss account and balance sheet. For the remainder of the material items, the reconciliation between amounts included in the consolidated cash flow statement and related amounts in profit and loss account and balance sheet is shown below.
13. Receivables
2011 2010Balance at 1 January 190,882 145,561Change in allowance for bad debts 160 -461Change in receivables 63,570 34,665Exchange rate movements 6,383 11,117Balance at 31 December 260,995 190,882
14. Current liabilities
2011 2010Balance at 1 January 83,737 67,916Change in current liabilities 48,288 12,478Exchange rate movements 3,304 3,343Balance at 31 December 135,329 83,737
Transactions with related partiesIncluded under other operating expenses is an amount of € 79 (2010: € 79) paid as consultancy fee to the majority shareholder of Brunel International N.V.

brunel international annual report 2011 | annual accounts 2011 | 71
Segment reporting x EUR 000, unless stated otherwise
Segment activities Oil and GasThe reportable segments are identified at components engaged in providing services that are subject to risks and returns that are different from those of other segments in a geographical overview of these activities. The Energy division supplies engineers, project management and consultancy services to Oil and Gas companies and related industries. As the Energy operations are similar in the nature of the products and services, the type of customers and the methods used to provide the services, a further stratification of this segment is not deemed to be useful.
Reportable segments Revenue Gross profit Operating profit 2011 2010 2011 2010 2011 2010Netherlands 156,171 132,890 52,624 46,092 17,925 12,220Worldwide Energy * 642,319 454,176 74,812 58,575 30,098 19,984Germany 152,294 110,710 59,156 42,279 21,567 8,234Other regions 29,084 23,148 6,974 5,034 50 -675Unallocated -5,237 -2,417 979,868 720,924 193,566 151,980 64,403 37,346
* Included in Worldwide Energy revenue is € 11.0 million (2010 € 8.3 million) revenue generated in The Netherlands.
Balance sheet total Non current assets Investment in IFA & PPE 2011 2010 2011 2010 2011 2010Netherlands 64,087 55,492 13,266 11,299 3,463 974Worldwide Energy 250,640 174,114 7,824 7,595 2,599 1,747Germany 45,215 37,514 7,409 7,343 1,018 401Other regions 28,793 27,070 1,724 1,395 48 182 388,735 294,190 30,223 27,632 7,128 3,304
External liabilities Depreciation 2011 2010 2011 2010Netherlands 24,262 20,112 1,489 1,565Worldwide Energy 99,826 47,458 1,106 872 Germany 14,790 10,168 895 936 Other regions 11,976 13,804 220 260 150,854 91,542 3,710 3,633

brunel international annual report 2011 | annual accounts 2011 | 72
EmployeesThe total number of direct and indirect employees with the group companies is set out below:
Average workforce 2011 2010 Direct Indirect Direct IndirectNetherlands 1,674 316 1,408 308Worldwide Energy 4,600 510 3,645 429Germany 1,672 315 1,248 278Unallocated 374 84 278 62 8,320 1,225 6,579 1,077 Total workforce 9,545 7,656
Workforce at 31 December 2011 2010 Direct Indirect Direct IndirectNetherlands 1,820 322 1,529 312Worldwide Energy 5,124 501 4,382 423Germany 1,815 340 1,433 282Unallocated 373 91 340 65 9,132 1,254 7,684 1,082 Total workforce 10,386 8,766

brunel international annual report 2011 | annual accounts 2011 | 73
Other segment informationOther segment information provides an overview of the activities with regard to professional specialisation.
Revenue Gross profit Operating profit 2011 2010 2011 2010 2011 2010Engineering 248,174 193,369 91,295 71,866 32,981 19,342Energy 642,319 454,176 74,812 58,575 30,098 19,984ICT 52,393 46,114 15,552 13,535 4,977 2,400Unallocated 36,982 27,265 11,907 8,004 -3,653 -4,380 979,868 720,924 193,566 151,980 64,403 37,346
Balance sheet total Investment in IFA & PPE Depreciation 2011 2010 2011 2010 2011 2010Engineering 93,889 70,117 1,047 806 1,083 1,101Energy 250,640 174,114 2,599 1,747 1,106 872ICT 20,757 15,813 24 41 145 110Unallocated 23,449 34,146 3,458 710 1,376 1,550 388,735 294,190 7,128 3,304 3,710 3,633

brunel international annual report 2011 | annual accounts 2011 | 74
EmployeesThe total number of direct and indirect employees with the group companies is set out below:
Average workforce
2011 2010 Direct Indirect Direct IndirectEngineering 2,762 473 2,144 415Energy 4,600 510 3,645 429ICT 559 76 498 78Unallocated 399 166 292 155 8,320 1,225 6,579 1,077 Total workforce 9,545 7,656
Workforce at 31 December
2011 2010 Direct Indirect Direct IndirectEngineering 3,006 508 2,443 426Energy 5,124 501 4,382 423ICT 570 80 544 77Unallocated 432 165 315 156 9,132 1,254 7,684 1,082 Total workforce 10,386 8,766

brunel international annual report 2011 | annual accounts 2011 | 75
Company balance sheet as per 31 December 2011x EUR 000, before profit appropriation
2011 2010Non-current assets Other intangible assets 3,650 470 Property, plant & equipment 18 78 Financial assets (15) 157,094 142,160 Deferred tax income assets 91 93 160,853 142,801 Current assets net of current liabilities Debtors and other receivables (16) 72,536 63,496 Income tax receivables 1,093 5,204 Cash 7,985 9,109 Total current assets 81,614 77,809 Current liabilities (17) 5,607 13,643 Income tax payables 4,557 Total current liabilities 5,607 18,200 Working capital 76,007 59,609
Non-current liabilites Defferred income tax liabilities 436 445 Shareholders’ equity (18) Share capital 1,177 1,162 Share premium 47,028 41,900 Reserves 136,273 128,418 Translation reserve 9,094 5,307 Unappropriated result 42,852 25,178 236,424 201,965 Balance sheet total 242,467 220,610

brunel international annual report 2011 | annual accounts 2011 | 76
Company profit and loss account 2011
x EUR 000
2011 2010Result on participations (19) 44,396 25,621Other income and expenses -1,544 -443 Net result 42,852 25,178
Notes to the company balance sheet and profit and loss account
X EUR 000, unless stated otherwise
General The company financial statements of Brunel International N.V. have been prepared in accordance with Part 9, Book 2 of The Netherlands Civil Code using the option of section 362 of Book 2 of The Netherlands Civil Code, meaning that the accounting principles used are the same as for the consolidated financial statements. Foreign currency has been translated, assets and liabilities have been valued, and net income has been determined, in accordance with the principles of valuation and determination of income on pages 56 and 57.Subsidiaries of Brunel International N.V. are accounted for using the equity method.
15. Financial assets
2011 2010Balance at 1 January 142,160 111,411Changes in book valueCapital contributions and acquisitions 11Profit for the year 44,396 25,621Dividend payment -33,251 -6,200Other movements 194 -220Exchange rate movements 3,595 11,537 Balance at 31 December 157,094 142,160
16. Debtors and other receivables
2011 2010Group companies 72,408 62,532Other receivables 128 964 72,536 63,496
17. Current liabilities
2011 2010Group companies 4,291 12,153Other liabilities 1,316 1,490 5,607 13,643

brunel international annual report 2011 | annual accounts 2011 | 77
18. Shareholders’ equity Composition of and changes in shareholders’ equity:
Share Share General Translation Unapropria- Total Total capital premium reserve reserve ted result/ 2011 2010 (legal result finan- reserve) cial yearBalance at 1 January 1,162 41,900 128,418 5,307 25,178 201,965 180,318
Exchange differences result 3,787 3,787 11,402Result financial year 42,852 42,852 25,178Cash dividend -18,816 -18,816 -18,545Appropriation of result 6,362 -6,362 Share based payments 1,493 1,493 980Option rights exercised 15 5,128 5,143 2,632
Balance at 31 December 1,177 47,028 136,273 9,094 42,852 236,424 201,965
In the year under review the cash dividend per share was € 0.80. The proposed dividend for 2011 will be € 0.90 per share. Information on outstanding options is provided in the notes to the consolidated balance sheet. The details on the composition of and changes in the shareholders’ equity of 2011 are disclosed in the consolidated statement of changes in equity.
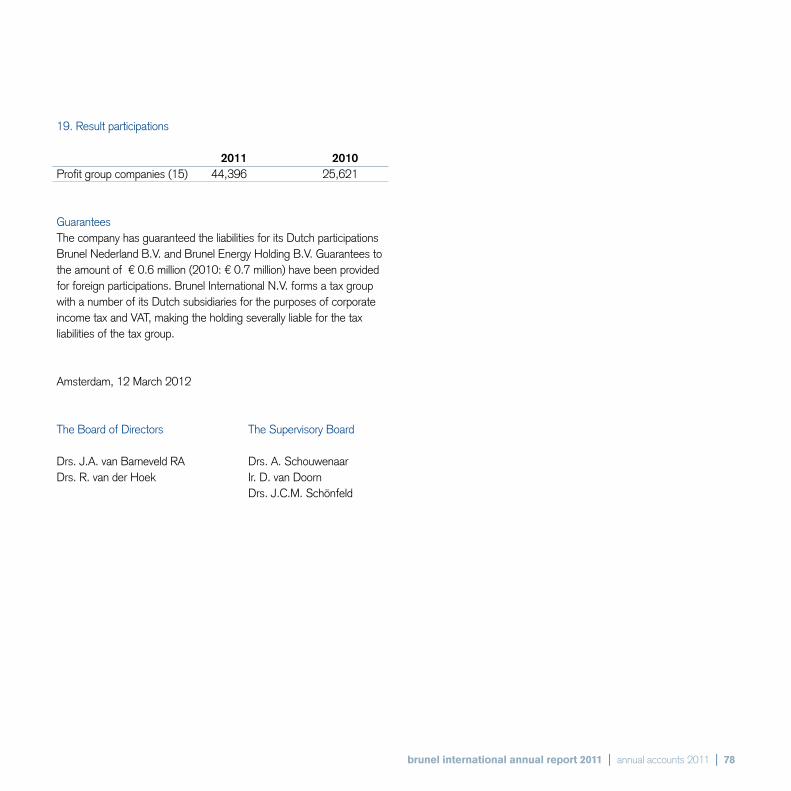
brunel international annual report 2011 | annual accounts 2011 | 78
19. Result participations
2011 2010Profit group companies (15) 44,396 25,621
GuaranteesThe company has guaranteed the liabilities for its Dutch participations Brunel Nederland B.V. and Brunel Energy Holding B.V. Guarantees to the amount of € 0.6 million (2010: € 0.7 million) have been provided for foreign participations. Brunel International N.V. forms a tax group with a number of its Dutch subsidiaries for the purposes of corporate income tax and VAT, making the holding severally liable for the tax liabilities of the tax group.
Amsterdam, 12 March 2012
The Board of Directors The Supervisory Board
Drs. J.A. van Barneveld RA Drs. A. SchouwenaarDrs. R. van der Hoek Ir. D. van Doorn Drs. J.C.M. Schönfeld

12otherinformation
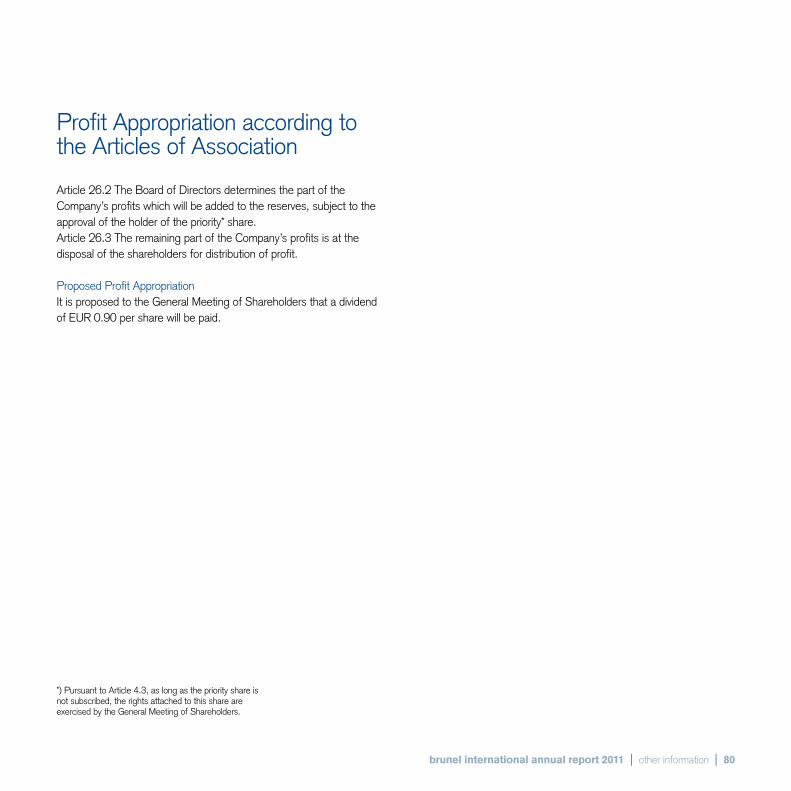
brunel international annual report 2011 | other information | 80
Profit Appropriation according to the Articles of Association
Article 26.2 The Board of Directors determines the part of the Company’s profits which will be added to the reserves, subject to the approval of the holder of the priority* share. Article 26.3 The remaining part of the Company’s profits is at the disposal of the shareholders for distribution of profit.
Proposed Profit Appropriation It is proposed to the General Meeting of Shareholders that a dividend of EUR 0.90 per share will be paid.
*) Pursuant to Article 4.3, as long as the priority share is not subscribed, the rights attached to this share are exercised by the General Meeting of Shareholders.

brunel international annual report 2011 | independent auditor’s report | 81
Independent Auditor’s ReportTo: the General Meeting of Shareholders of Brunel International N.V.
Report on the financial statementsWe have audited the accompanying annual accounts 2011 of Brunel International N.V., Amsterdam. The annual accounts include the consolidated financial statements and the company financial statements. The consolidated financial statements comprise the consolidated balance sheet as at December 31, 2011, the consolidated profit and loss account, the consolidated statements of comprehensive income, changes in equity and cash flows for the year then ended, and notes, comprising a summary of the significant accounting policies and other explanatory information. The company financial statements comprise the company balance sheet as at December 31, 2011, the company profit and loss account for the year then ended and the notes, comprising a summary of the accounting policies and other explanatory information.
Board of directors’ responsibilityThe board of directors is responsible for the preparation and fair presentation of these financial statements in accordance with International Financial Reporting Standards as adopted by the European Union and with Part 9 of Book 2 of the Dutch Civil Code, and for the preparation of the report from the board of directors in accordance with Part 9 of Book 2 of the Dutch Civil Code. Furthermore the board of directors is responsible for such internal control as it determines is necessary to enable the preparation of the financial statements that are free from material misstatement, whether due to fraud or error.
Auditor’s responsibilityOur responsibility is to express an opinion on these financial statements based on our audit. We conducted our audit in accordance with Dutch law, including the Dutch Standards on Auditing. This requires that we comply with ethical requirements and plan and perform the audit to obtain reasonable assurance about whether the financial statements are free from material misstatement.An audit involves performing procedures to obtain audit evidence about the amounts and disclosures in the financial statements. The procedures selected depend on the auditor’s judgment, including the assessment of the risks of material misstatement of the financial statements, whether due to fraud or error.In making those risk assessments, the auditor considers internal control relevant to the entity’s preparation and fair presentation of the financial statements in order to design audit procedures that are appropriate in the circumstances, but not for the purpose of expressing an opinion on the effectiveness of the entity’s internal control. An audit also includes evaluating the appropriateness of accounting policies used and the reasonableness of accounting estimates made by the board of directors, as well as evaluating the overall presentation of the financial statements.We believe that the audit evidence we have obtained is sufficient and appropriate to provide a basis for our audit opinion.
Opinion with respect to the consolidated financial statementsIn our opinion, the consolidated financial statements give a true and fair view of the financial position of Brunel International N.V. as at December 31, 2011 and of its result and its cashflows for the year then ended in accordance with International Financial Reporting Standards as adopted by the European Union and with Part 9 of Book 2 of the Dutch Civil Code.

brunel international annual report 2011 | independent auditor’s report | 82
Opinion with respect to the company financial statementsIn our opinion, the company financial statements give a true and fair view of the financial position of Brunel International N.V. as at December 31, 2011 and of its result for the year then ended in accordance with Part 9 of Book 2 of the Dutch Civil Code.
Report on other legal and regulatory requirementsPursuant to the legal requirement under Section 2:393 sub 5 at e and f of the Dutch Civil Code, we have no deficiencies to report as a result of our examination whether the report from the board of directors, to the extent we can assess, has been prepared in accordance with Part 9 of Book 2 of this Code, and whether the information as required under Section 2:392 sub 1 at b-h has been annexed. Further we report that the report from the board of directors, to the extent we can assess, is consistent with the financial statements as required by Section 2:391 sub 4 of the Dutch Civil Code.
Rotterdam, March 12, 2012
Deloitte Accountants B.V.K.G. Tan

13group financial record

brunel international annual report 2011 | group financial record | 84
x EUR million, unless stated otherwise
2011 2010 2009 2008 2007 2006 2005 2004 2003 2002 2001Profit Revenue 979.9 720.9 738.4 714.2 579.9 499.1 390.8 312.7 245.7 204.7 210.5Gross profit 193.6 152.0 151.8 167.0 136.3 115.3 88.4 67.8 55.7 48.8 58.9Operating profit 64.4 37.3 45.1 62.1 51.2 35.3 23.5 10.9 2.8 -7.6 3.9Result before tax 65.3 38.4 44.7 62.5 51.3 35.3 24.1 11.3 3.4 -6.8 5.9Extraordinary income and expenses before tax - - - - - - - - - -1.4 -0.3Group result after tax 43.1 25.6 32.1 45.6 36.9 24.2 16.0 7.5 2.2 -4.4 3.8Net income 42.9 25.2 31.1 44.8 36.1 26.3 15.9 7.4 2.2 -4.4 3.8Cash flow (net profit + depreciations/ impairment) 46.9 29.2 35.5 48.0 39.2 29.7 18.7 11.0 5.4 -1.2 6.3Depreciation of tangible fixed assets and amortisation 3.7 3.6 3.4 3.2 3.1 3.0 2.8 4.1 3.2 3.2 2.5Additions to tangible fixed assets 2.7 2.3 5.3 4.0 4.3 4.5 2.5 1.9 1.4 7.8 4.4 Workforce Average over the year 9,545 7,656 7,847 7,904 7,248 6,148 4,796 3,984 3,499 3,419 3,516 Balance sheet information Non-current assets 30.2 27.6 28.9 19.6 17.3 15.1 6.4 5.5 8.1 10.7 6.9Working capital 207.7 175.0 152.5 144.6 118.6 99.0 90.3 73.9 68.3 64.9 78.0Group equity 236.6 202.2 180.9 163.8 135.4 113.6 96.7 79.4 75.8 75.0 81.8Balance sheet total 388.7 294.2 254.7 235.4 197.9 178.5 150.3 118.9 106.4 100.1 113.0 Ratios Change in revenue on previous year 35.9% -2.4% 3.4% 23.2% 16.2% 28.0% 25.0% 27.3% 20.1% -2.8% -1.4%Gross margin 19.8% 21.1% 20.6% 23.4% 23.5% 23.1% 22.6% 21.7% 22.7% 23.9% 28.0%Operating profit/revenue 6.6% 5.2% 6.1% 8.7% 8.8% 7.1% 6.0% 3.4% 1.2% -3.7% 1.9%Group result/revenue 4.4% 3.6% 4.3% 6.4% 6.3% 4.8% 4.1% 2.3% 0.9% -2.2% 1.8%Group equity/total assets 60.8% 68.7% 71.0% 69.6% 68.5% 63.6% 64.4% 66.7% 71.3% 75.0% 72.3%Current assets/current liabilities 2.38 2.91 3.08 3.03 2.91 2.54 2.69 2.87 3.27 3.65 3.77 Shares (in euros) Earnings per share 1.83 1.09 1.35 1.96 1.59 1.16 0.70 0.33 0.10 -0.19 0.17Shareholders’ equity per share 10.05 8.69 7.82 7.16 5.93 5.00 4.27 3.49 3.35 3.32 3.61Dividend per share 0.90 0.80 0.80 0.80 0.70 0.50 0.30 0.15 0.10 - 0.11Highest price 34.95 29.63 23.83 18.55 26.66 34.94 18.00 9.00 5.60 5.83 5.20Lowest price 20.00 19.46 7.01 8.10 14.86 16.95 8.65 4.86 2.35 2.35 3.06Closing price at 31 December 22.78 29.49 23.45 8.55 16.35 26.00 18.00 9.00 4.90 3.13 3.95Prior to transition date (1 January 2005) the data have not been adjusted to IFRS.

14addresses

brunel international annual report 2011 | addresses | 86
Brunel International N.V.
Head Office
Amsterdam John M. Keynesplein 331066 EP AmsterdamThe Netherlands T +31 20 312 5000 F +31 20 312 5099 [email protected]
The Netherlands
AmsterdamJohn M. Keynesplein 331066 EP AmsterdamT +31 20 312 5000 F +31 20 312 5099 [email protected]
ArnhemKroonpark 2 6831 GR Arnhem T +31 20 312 5000 F +31 26 327 3308 [email protected]
Capelle aan den IJsselRivium 1ste straat 121 2909 LE Capelle aan den IJssel T +31 10 266 6444F +31 10 266 6379 [email protected]
DeventerKeulenstraat 6C 7418 ET DeventerT +31 20 312 5000F +31 57 068 2899 [email protected]
EindhovenDr. Holtroplaan 35 5652 XR EindhovenT +31 20 312 5000F +31 40 257 [email protected]
EnschedeHengelosestraat 5557521 AG EnschedeT +31 20 312 5000F +31 88 002 [email protected]
GroningenRozenburglaan 19727 DL GroningenT +31 20 312 5000 F +31 50 318 [email protected]
The HagueWolga 92491 BK The HagueT +31 20 312 5000F +31 70 320 [email protected]
UtrechtHerculesplein 923584 AA UtrechtT +31 20 312 5000F +31 30 231 [email protected]
ZwolleNoordzeelaan 20A8017 JW ZwolleT +31 20 312 5000 F +31 88 002 [email protected]
Worldwide Offices
Angola
LuandaBuilding 22 Travessa Engracia FragosBairro Ingombotas Luanda T +244 921 062 961 M +244 917 041 450 [email protected]
Austria
GrazLiebenauer Haupt Straße 2-6A-8041 GrazT +43 316 468 2208F +43 316 468 [email protected]
InnsbruckEduard Bodem Gasse 3A-6020 InnsbruckT +43 512 3432 0510F +43 512 3432 [email protected]
LinzLunzer Straße 64A-4031 LinzT +43 732 6987 76120F +43 732 6987 [email protected]
brunel international annual report 2011 | addresses | 87
SalzburgAnton Hall Straße 3A-5020 SalzburgT +43 662 8300 0110F +43 662 8300 [email protected]
ViennaAm Euro Platz 2A-1120 WienT +43 1 7172 8172F +43 1 7172 [email protected]
Australia
BrisbaneLevel 7, 127 Creek StreetBrisbane QLD 4000T +61 7 3112 2700F +61 7 3112 [email protected]
PerthLevel 2, 101 St Georges TerracePerth WA 6000T +61 8 9429 5600F +61 8 9429 [email protected]
Azerbaijan
Baku44 J. Jabbarly StreetAZ 1065 [email protected]
Belgium
GentOttergemsesteenweg 439B-9000 GentT +32 9220 8120F +32 9220 [email protected]
MechelenStephenson PlazaBlarenberglaan 3 A2800 MechelenT +32 1527 3333F +32 1527 [email protected]
Brazil
Rio de JaneiroAvenida das Américas nº 4200 bloco 07 cob 301Barra da Tijuca 22640-102Rio de Janeiro RJ T +55 21 [email protected]
Canada
Calgary1500, 635 8th Avenue SWCalgaryAlberta T2P 3M3T +1 403 539 5009F +1 403 294 [email protected]
Montreal1405 Trans-Canada, Suite 610 MontrealQuebec H9P 2V9T +1 514 396 7890F +1 514 396 [email protected]
Toronto200 Ronson Drive, Suite 200TorontoM9W 5Z9 OntarioT +1 416 244 2402F +1 416 244 [email protected]
Chad
N’DjamenaQuartier BeguinageRue (1029) du Havre, Porte 247N’DjamenaT +235 2252 4355F +235 2252 [email protected]
China
Hong KongRoom 1003, 10F9 Queen Victoria StreetCentral, HongkongT +65 6532 2480F +65 6532 [email protected]
Denmark
CopenhagenHavnegade 391058 CopenhagenT +45 70 20 3210F +45 70 20 [email protected]
France
Courbevoie56 Boulevard de la Mission Marchand 92418 CourbevoieT + 33 1 49 05 02 45F + 33 1 55 70 04 [email protected]
brunel international annual report 2011 | addresses | 88
Germany
BremenHead OfficeHermann Köhl Straße 128199 BremenT +49 421 1 78 860F +49 421 1 78 [email protected]
AachenSchloß Rahe Straße 1552072 AachenT +49 241 9367 1600F +49 241 9367 [email protected]
AugsburgBergiusstraße 1386199 AugsburgT +49 821 8104 020F +49 821 8104 [email protected]
BerlinCicerostraße 2110709 Berlin T +49 30 3480 650F +49 30 3480 [email protected]
BielefeldDetmolder Straße 23533605 BielefeldT +49 521 986 410F +49 521 986 [email protected]
BochumDinnendahl Straße 944809 BochumT +49 234 417 10T +49 234 417 [email protected]
BonnWalter Flex Straße 2 53113 BonnT +49 0228 8502 8610F +49 0228 8502 [email protected]
BraunschweigFrankfurter Straße 438122 BraunschweigT +49 531 243 380F +49 531 243 [email protected]
CologneAachener Straße 22250931 KölnT +49 221 179 680F +49 221 179 [email protected]
DortmundRuhrallee 944139 DortmundT +49 231 793 070F +49 231 793 [email protected]
DresdenTatzberg 4701307 DresdenT +49 351 438 150F +49 351 438 [email protected]
DuisburgSchiffer Straße 16647059 DuisburgT +49 203 289 560F +49 203 289 [email protected]
DüsseldorfFranz Rennefeld Weg 4 40472 Düsseldorf T +49 211 5662 2920 F +49 211 5662 [email protected]
ErfurtKonrad Zuse Straße 1599099 ErfurtT +49 361 6539 890F +49 361 6539 [email protected]
EssenWeststadt Carrée Altendorfer Straße 11 45127 [email protected]
HamburgFerdinand Straße 25-2720095 HamburgT +49 40 23 64 840F +49 40 23 64 [email protected]
HannoverKarl Wiechert Allee 74A30625 HannoverT +49 511 6262 883F +49 511 6262 8845
HildesheimDaimlerring 931135 HildesheimT +49 5121 1760 900F +49 5121 1760 [email protected]
IngolstadtMilch Straße 285049 IngolstadtT +49 841 491 050F +49 841 491 [email protected]
KarlsruheAlbert Nestler Straße 976131 Karlsruhe T +49 721 9154 8410F +49 721 9154 [email protected]

brunel international annual report 2011 | addresses | 89
KasselWilhelms Straße 2 A34117 KasselT +49 561 3105 930F +49 561 3105 [email protected]
KielWall 3024103 KielT +49 431 997 640F +49 431 997 [email protected]
Leipzig Kreuzstraße 7A 04103 Leipzig T +49 341 2560 110 F +49 341 2560 [email protected]
LindauEuropaplatz 188131 LindauT +49 8382 273 660F +49 8382 73 [email protected]
MannheimAugustaanlage 3268165 MannheimT +49 621 729 670F +49 621 729 [email protected]
MunichMozart Straße 285622 Feldkirchen bei MünchenT +49 893 588 230F +49 893 588 [email protected]
NurembergBahnhof Straße 11B90402 NürnbergT +49 911 9297 153F +49 911 9297 [email protected]
Offenbach am MainStrahlenberger Straße 11063067 Offenbach am MainT +49 69 1 5393 010F +49 69 1 5393 [email protected]
OsnabrückNikolaiort 1-249074 OsnabrückT +49 541 941 670F +49 541 941 [email protected]
RostockAm Strande 3A18055 RostockT +49 381 252 200F +49 381 252 [email protected]
StuttgartLöffel Straße 4070597 StuttgartT +49 711 3890 000F +49 711 3890 [email protected]
UlmEinsteinstraße 5589077 UlmT +49 731 140 190F +49 731 140 [email protected]
WolfsburgHeinrich Nordhoff Straße 10138440 WolfsburgT +49 5361 307 120F +49 5361 307 [email protected]
WuppertalAlte Lenneper Weg 21 42289 Wuppertal T +49 202 5148 [email protected]
WürzburgBeethoven Straße 5A97080 WürzburgT +49 931 3209 2910F +49 931 3209 [email protected]
India
Mumbai001, Ascot CentreNear Hotel ITC Grand MarathaSahar Airport Road, Andheri (East), Mumbai 400099T +91 22 6759 6759F +91 22 6759 [email protected]
Italy
VeronaVia IV Novembre 1137126 VeronaT +39 45 2080 860F +39 45 2080 [email protected]
Kazakhstan
AtyrauKulmanova Street Building 113Atyrau 060011T +77 122 211 801F +77 122 202 [email protected]

brunel international annual report 2011 | addresses | 90
Kuwait
FarwaniyaOffice 3, Waha MallDajeej Area, Farwaniya T +965 2433 7398F +965 2433 [email protected]
Libya
TripoliMaari Sttreet. (Beside Corinthea Hotel)Building 3, Apt.10TripoliT +218 21 337 0325F +218 21 337 [email protected]
Malaysia
Kuala Lumpur25.2, Level 25 Menara Standard Chartered30 Jalan Sultan Ismail50250 Kuala LumpurT +60 3 2144 3451F +60 3 2713 [email protected]
SarawakLot No. 2348 Jalan Datuk Edward JeliPiasau98000 Miri, SarawakT +85 655911F +85 663079energy@ brunel.com.my
Nigeria
Lagos7 Onikepo-Akande StreetOff Admiralty Way, Road 12Lekki Phase 1, Victoria IslandLagosT +234 1271 4023F +234 1271 [email protected]
Norway
SandnesVestre Svanholmen 44313 SandnesT +47 51 220 744F +47 51 220 [email protected]
Papua New Guinea
Port Moresbyc/o level 4, Curthbertson HouseCurthbertson StreetPort Moresby NCDT +675 321 3600F +675 321 [email protected]
Philippines
Makati City5046 P Burgos StreetPoblacionMakati CityT +632 897 8632F +632 890 [email protected]
Poland
Warsawul. Zlota 5900-120 Warszawa T +48 22 222 4680F +48 22 222 4601
WroclawStrzegomska 2-453-611 WroclawT +48 71 776 0745F +48 71 776 [email protected]
Qatar
DohaBuilding No.3, office 3108 Al Waab City, Commercial DistrictSalwa RoadDohaT +974 44666275F +974 [email protected]
Russia
IrkutskBaykalskaja Street, 295b 30 Irkutsk 664050 T +7 495 783 6677F +7 495 783 [email protected]
Moscow16 Myasnitskaya StreetMoscow 101000T +7 495 783 6677F +7 495 783 [email protected]
NovorossiyskSvobody Street 1, letter A, office 410 Novorossiysk 353900T +7 861 760 1390 F +7 861 760 [email protected]

brunel international annual report 2011 | addresses | 91
Tyumen61 Respubliki Street, office 404Tyumen 625000 T +7 345 250 0425 F +7 345 250 [email protected]
Yuzhno-Sakhalinsk234, Lenina Street, office 309Yuzhno-Sakhalinsk 693000T +7 4242 727 124F +7 4242 727 [email protected]
Singapore
Singapore77 Robinson Road# 10-03 Robinson 77 Singapore 068896T +65 6532 2480F +65 6532 [email protected]
South Korea
UlsanLevel 2, 1028-1Bangeo-DongDong-KuUlsan 682-806T +82 52 201 8950F +82 52 201 [email protected]
Spain
MadridCalle General MoscardóN° 1,2° IzdaCP 28020 MadridT +34 915 342 777F +34 915 972 [email protected]
Thailand
BangkokUnited Business Centre IIUnit 2201-2202, 591 Sukhumvit Road (Soi 33)North Klongton,WattanaBangkok 10110T +66 2 662 0770F +66 2 662 [email protected]
Chonburi4/25-26 Moo 10Sukhumvit RoadTungsukhla, Sriracha, Chonburi 20230 T +66 38 401 591-3F +66 38 401 [email protected]
United Arab Emirates
Abu DhabiOffice No 601, 6th FloorAl Falah BuildingOpposite to Al Falah Plaza Muroor RoadAbu DhabiT +971 2 642 9994F +971 2 642 [email protected]
Bur DubaiKhalid Bin Waleed StreetOffice 105, Business Centre BuildingBur DubaiDubai T +971 4 397 4778F +971 4 397 [email protected]
United Kingdom
GlasgowCorunna House39 Cadogan StreetGlasgow G2 7ABT +44 141 302 3000F +44 141 302 [email protected]
London22 Buckingham GateLondon SW1E 6LBT +44 207 931 7900F +44 207 931 [email protected]
Manchester19 Spring GardensManchester M2 1FBT +44 161 885 2130F +44 161 885 [email protected]
United States of America
Houston5333 Westheimer, Suite 840HoustonTX 77056T +1 713 333 1024F +1 713 333 [email protected]