bts group holdings pcl - listed...
TRANSCRIPT
prepared by Investor Relations department BTS Group Holdings PCL
BTS Group General Presentation
BTS Group Holdings PCL
General Presentation April 2017
prepared by Investor Relations department BTS Group Holdings PCL
IR Contact
2
This document has been prepared and distributed by the Investor Relations Department of BTS Group Holdings PCL (“BTSG”) solely for information purposes. It does not represent or constitute an offer, invitation, recommendation or solicitation to trade shares in BTSG and should not be relied on as such. Some of the information in this document has not been independently verified, and also includes information made available from public sources and other third party opinion or analyst. BTSG does not monitor or control the content of third party opinion or statements and does not endorse or accept any responsibility for the content or the use of any such opinion or statements. Thus, BTSG assumes no responsibility and makes no representations with respect to the accuracy and/or completeness of the information described herein. None of BTSG or any of its agents, or all of their respective affiliates, or representatives shall have any liability (in negligence or otherwise) for any loss howsoever arising from any use of this document or its contents or otherwise arising in connection with this document. All information contained in this document is presented as of the date indicated within, and BTSG assumes no duty to confirm, revise or update the information. Certain statements in this document may be deemed to contain forward-looking statements, including the statements included or incorporated with the words "believe", "anticipate", "estimate", "target", or "hope", or that otherwise relate to objectives, strategies, plans, intentions, beliefs or expectations or that have been constructed as statements as to future performance or events. These forward-looking statements are not guarantees of future performance and involve risks and uncertainties that could cause actual results to differ materially from historical results or those anticipated at the time the forward-looking statements are made. Thus, BTSG assumes no responsibility and makes no representations with respect to the accuracy and/or completeness of the forward-looking statements. BTSG undertakes no obligation to publicly update or revise any forward-looking statements, whether as a result of new information, future events or otherwise.
Disclaimer
Address: BTS Group Holdings PCL IR Department 15th Floor, TST Tower, 21 Soi Choei Phuang, Viphavadi-Rangsit Rd. Chomphon, Chatuchak, Bangkok, Thailand 10900 Telephone: +66(0) 2273 8611-15 Fax: +66(0) 2273 8610 Email: [email protected] Website: www.btsgroup.co.th
BTS Group General Presentation
prepared by Investor Relations department BTS Group Holdings PCL
Section 1 BTS Group in Brief
Section 2 Business Segment Profiles
Section 2.1 Mass Transit Business
Section 2.2 Media Business
Section 2.3 Property Business
Section 2.4 Services Business
Section 3 Financial Summary
Appendices Appendix 1: Key Terms of the Core Network Concession Agreement
Appendix 2: Future Funding Requirements (Mass Transit)
Appendix 3: BTS-W3
Appendix 4: BTS Group CAPEX History
Appendix 5: BTSC’s Quality Management System
3
Contents
BTS Group General Presentation
prepared by Investor Relations department BTS Group Holdings PCL
4
BTS Group History
BTS Group General Presentation Section 1: BTS Group in Brief
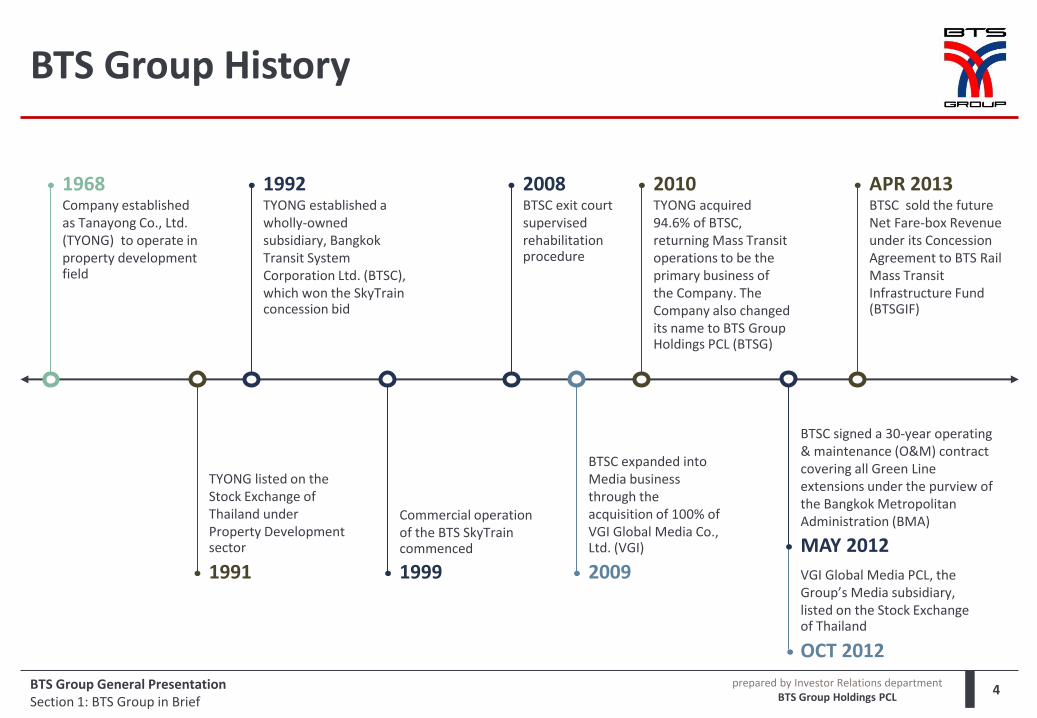
Company established as Tanayong Co., Ltd. (TYONG) to operate in property development field
1968
TYONG listed on the Stock Exchange of Thailand under Property Development sector
1991
TYONG established a wholly-owned subsidiary, Bangkok Transit System Corporation Ltd. (BTSC), which won the SkyTrain concession bid
1992
Commercial operation of the BTS SkyTrain commenced
1999
BTSC exit court supervised rehabilitation procedure
2008
BTSC expanded into Media business through the acquisition of 100% of VGI Global Media Co., Ltd. (VGI)
2009
TYONG acquired 94.6% of BTSC, returning Mass Transit operations to be the primary business of the Company. The Company also changed its name to BTS Group Holdings PCL (BTSG)
2010 BTSC sold the future Net Fare-box Revenue under its Concession Agreement to BTS Rail Mass Transit Infrastructure Fund (BTSGIF)
APR 2013
VGI Global Media PCL, the Group’s Media subsidiary, listed on the Stock Exchange of Thailand
OCT 2012
BTSC signed a 30-year operating & maintenance (O&M) contract covering all Green Line extensions under the purview of the Bangkok Metropolitan Administration (BMA)
MAY 2012
prepared by Investor Relations department BTS Group Holdings PCL
50% Nine Square
Property Co., Ltd.
100%
BTS Sansiri Holding Fifteen Limited
50%
75.47%
51%
Keystone Estate Co., Ltd.
100%
BTS Sansiri Holding Twelve Limited
50%
Bayswater Co., Ltd.
50%
5
BTS Group Holdings PCL
BTS Group General Presentation Section 1: BTS Group in Brief
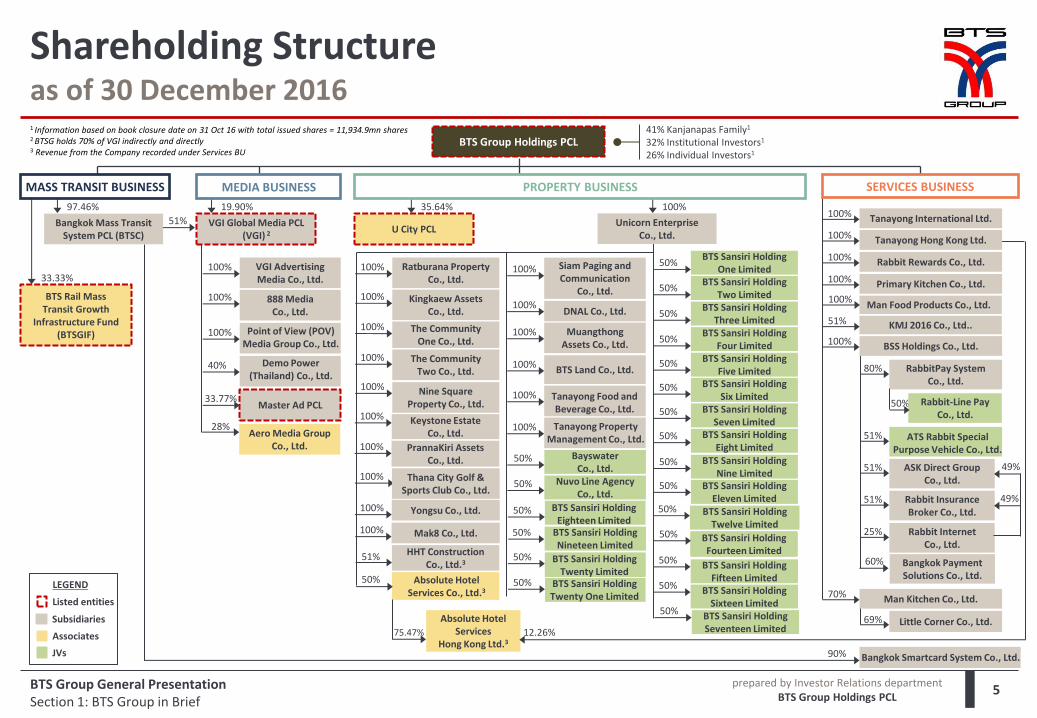
Shareholding Structure as of 30 December 2016
BTS Rail Mass Transit Growth
Infrastructure Fund (BTSGIF)
97.46%
Mak8 Co., Ltd. 100%
BTS Sansiri Holding Eleven Limited
50%
BTS Sansiri Holding Nine Limited
50%
Yongsu Co., Ltd. 100%
BTS Sansiri Holding Eight Limited
50%
BTS Sansiri Holding Seven Limited
50%
BTS Sansiri Holding Six Limited
50%
BTS Land Co., Ltd. 100%
BTS Sansiri Holding Five Limited
50%
Muangthong Assets Co., Ltd.
100% BTS Sansiri Holding Four Limited
50%
DNAL Co., Ltd. 100%
The Community One Co., Ltd.
100%
Siam Paging and Communication
Co., Ltd.
100%
Kingkaew Assets Co., Ltd.
100%
PrannaKiri Assets Co., Ltd.
100%
Ratburana Property Co., Ltd.
100%
Bangkok Mass Transit System PCL (BTSC)
U City PCL
19.90%
MEDIA BUSINESS
41% Kanjanapas Family1
32% Institutional Investors1 26% Individual Investors1
35.64% 100%
PROPERTY BUSINESS
VGI Advertising Media Co., Ltd.
100%
888 Media Co., Ltd.
100%
100%
Master Ad PCL 33.77%
Aero Media Group Co., Ltd.
28%
VGI Global Media PCL (VGI) 2
Point of View (POV) Media Group Co., Ltd.
Unicorn Enterprise Co., Ltd.
100% Tanayong Food and Beverage Co., Ltd.
100% Tanayong Property Management Co., Ltd.
33.33%
MASS TRANSIT BUSINESS
Tanayong International Ltd. 100%
SERVICES BUSINESS
RabbitPay System Co., Ltd.
80%
Rabbit-Line Pay Co., Ltd.
ASK Direct Group Co., Ltd.
51%
Rabbit Insurance Broker Co., Ltd.
51%
Rabbit Internet Co., Ltd.
25%
Tanayong Hong Kong Ltd. 100%
Rabbit Rewards Co., Ltd. 100%
Primary Kitchen Co., Ltd. 100%
BSS Holdings Co., Ltd. 100%
51% ATS Rabbit Special Purpose Vehicle Co., Ltd.
Little Corner Co., Ltd. 69%
Man Kitchen Co., Ltd. 70%
HHT Construction Co., Ltd.3
51%
Absolute Hotel Services
Hong Kong Ltd.3
90%
12.26%
Bangkok Smartcard System Co., Ltd.
1 Information based on book closure date on 31 Oct 16 with total issued shares = 11,934.9mn shares 2 BTSG holds 70% of VGI indirectly and directly 3 Revenue from the Company recorded under Services BU
Listed entities
Subsidiaries
Associates
LEGEND
The Community Two Co., Ltd.
100%
BTS Sansiri Holding Fourteen Limited
50%
50%
50% BTS Sansiri Holding Nineteen Limited
50% BTS Sansiri Holding Three Limited
100% Thana City Golf & Sports Club Co., Ltd.
50%
KMJ 2016 Co., Ltd.. 51%
100% Man Food Products Co., Ltd.
Absolute Hotel Services Co., Ltd.3
Bangkok Payment Solutions Co., Ltd.
60%
JVs
BTS Sansiri Holding Eighteen Limited
40% Demo Power (Thailand) Co., Ltd.
BTS Sansiri Holding Sixteen Limited
50%
BTS Sansiri Holding Twenty Limited
BTS Sansiri Holding Three Limited
50%
BTS Sansiri Holding Two Limited
50%
BTS Sansiri Holding One Limited
50%
Nuvo Line Agency Co., Ltd.
50%
BTS Sansiri Holding Seventeen Limited
50%
50% BTS Sansiri Holding Twenty One Limited
49%
49%
prepared by Investor Relations department BTS Group Holdings PCL
6 BTS Group General Presentation Section 1: BTS Group in Brief
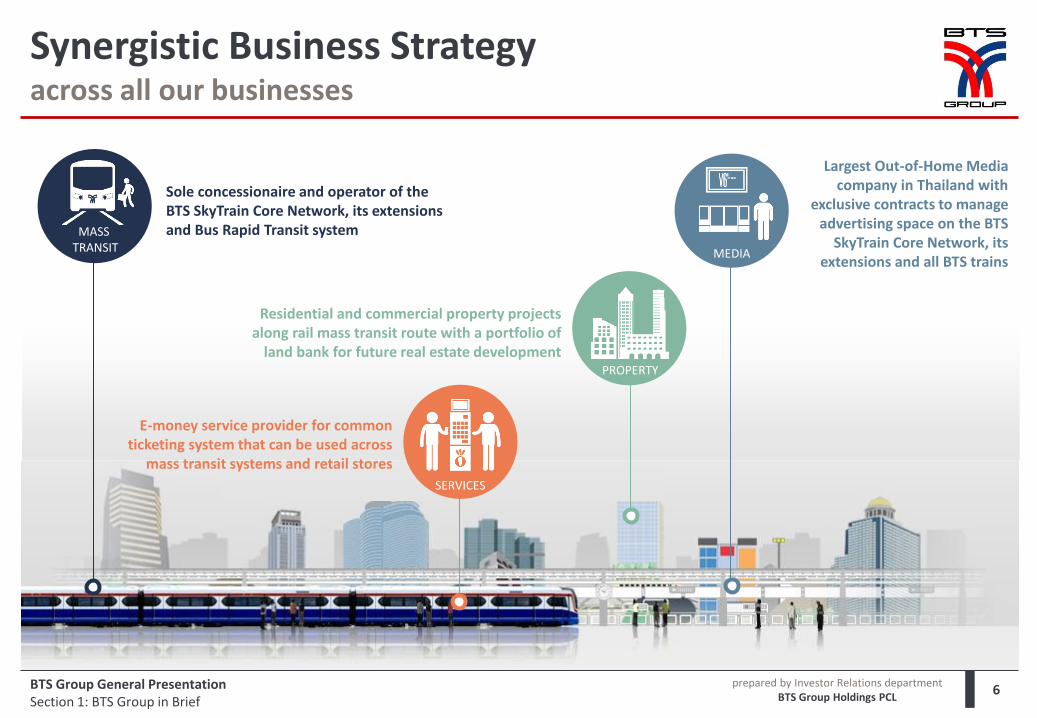
Synergistic Business Strategy across all our businesses
MASS TRANSIT
Sole concessionaire and operator of the BTS SkyTrain Core Network, its extensions and Bus Rapid Transit system
MEDIA
PROPERTY
SERVICES
E-money service provider for common ticketing system that can be used across
mass transit systems and retail stores
Residential and commercial property projects along rail mass transit route with a portfolio of
land bank for future real estate development
Largest Out-of-Home Media company in Thailand with
exclusive contracts to manage advertising space on the BTS
SkyTrain Core Network, its extensions and all BTS trains
prepared by Investor Relations department BTS Group Holdings PCL
7 BTS Group General Presentation Section 1: BTS Group in Brief
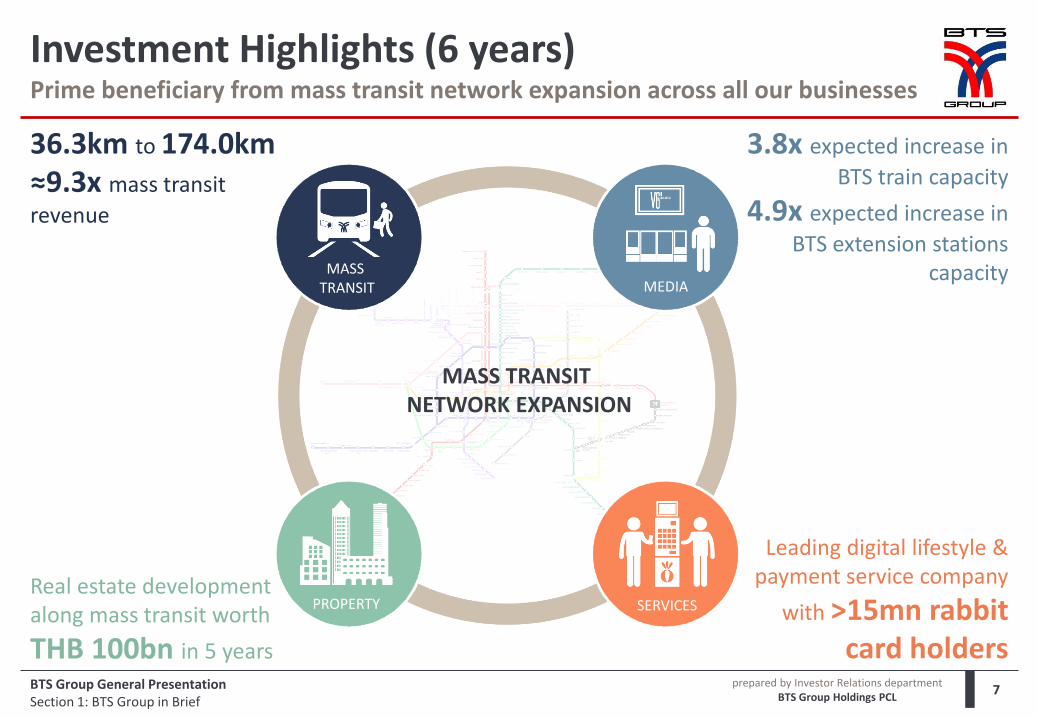
Investment Highlights (6 years) Prime beneficiary from mass transit network expansion across all our businesses
3.8x expected increase in
BTS train capacity
4.9x expected increase in
BTS extension stations capacity
Real estate development along mass transit worth
THB 100bn in 5 years
Leading digital lifestyle & payment service company
with >15mn rabbit card holders
MEDIA
PROPERTY SERVICES
MASS TRANSIT
MASS TRANSIT NETWORK EXPANSION
36.3km to 174.0km ≈9.3x mass transit
revenue
prepared by Investor Relations department BTS Group Holdings PCL
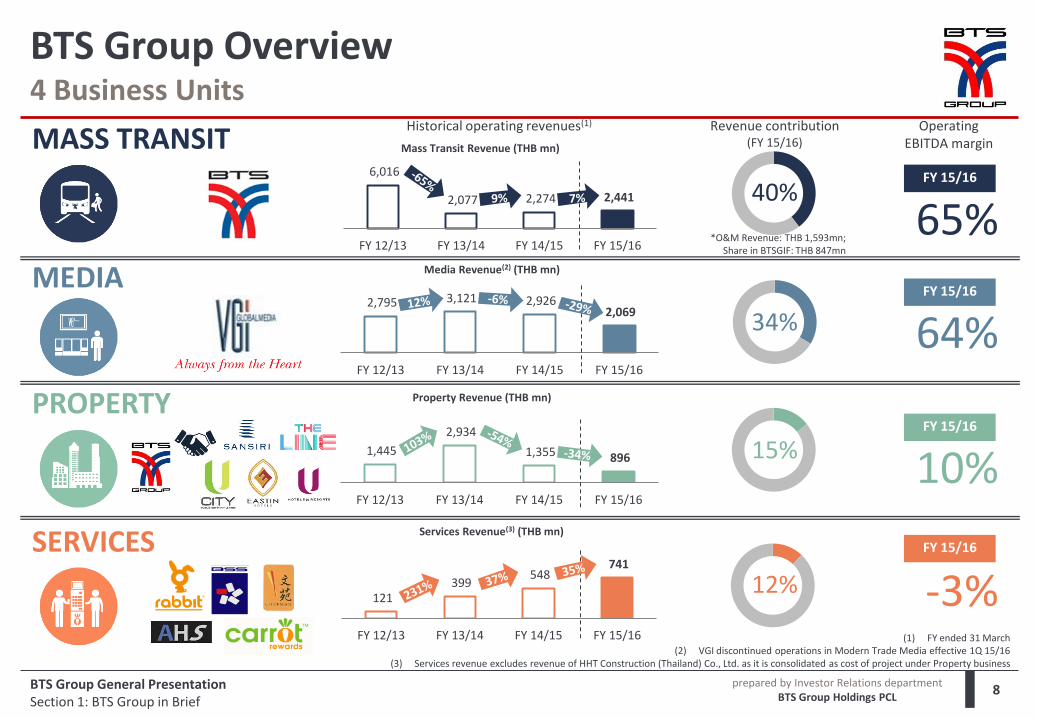
121 399
548 741
FY 12/13 FY 13/14 FY 14/15 FY 15/16
1,445
2,934
1,355 896
FY 12/13 FY 13/14 FY 14/15 FY 15/16
6,016
2,077 2,274 2,441
FY 12/13 FY 13/14 FY 14/15 FY 15/16
2,795 3,121 2,926 2,069
FY 12/13 FY 13/14 FY 14/15 FY 15/16
(1) FY ended 31 March (2) VGI discontinued operations in Modern Trade Media effective 1Q 15/16
(3) Services revenue excludes revenue of HHT Construction (Thailand) Co., Ltd. as it is consolidated as cost of project under Property business
BTS Group Overview 4 Business Units
MASS TRANSIT
PROPERTY
MEDIA
SERVICES
Historical operating revenues(1)
Media Revenue(2) (THB mn)
Property Revenue (THB mn)
Services Revenue(3) (THB mn)
Mass Transit Revenue (THB mn)
Revenue contribution (FY 15/16)
65% FY 15/16
64% FY 15/16
10% FY 15/16
-3% FY 15/16
*O&M Revenue: THB 1,593mn; Share in BTSGIF: THB 847mn
BTS Group General Presentation Section 1: BTS Group in Brief
8
Operating EBITDA margin
40%
34%
15%
12%

prepared by Investor Relations department BTS Group Holdings PCL
2,748
4,359
7,073 7,094 8,048
2011/12 2012/13 2013/14 2014/15 2015/16
BTSG at a Glance
PROGRESSIVE DIVIDEND POLICY
Completed Minimum THB 21bn committed dividends over 3 years:
No less than THB 6bn in 2013/14
No less than THB 7bn in 2014/15
No less than THB 8bn in 2015/16
Current Policy: Not less than 50% of net profit (stand alone basis)
BTS Group General Presentation Section 1: BTS Group in Brief
HISTORICAL DIVIDEND PAYMENTS / DIVIDEND YIELD
KEY FIGURES (as of 31 Mar 2016)
EMPLOYEES (as of 31 Mar 2016)
BTS Group Holdings 129
Mass Transit 2,144
Media 236
Property 476
Services 767
Total 3,752
THB (mn) USD (mn)**
Operating revenue 6,148 175
Operating EBITDA 2,560 73
Net income*** 4,141 118
Total assets 66,811 1,896
Excess cash and liquid investments 16,435 467
Cash 2,365 67
Current investments 3,272 93
Long-term investments 9,559 271
Restricted deposits 1,239 35
Free cash flow (7,815) (222)
**Source: Bank of Thailand; based on Interbank Exchange Rate of USD 1 = THB 32.548 as of 28 May 2015 ***to equity holders of the parent 7.3% 6.2%
7.8%
4.8% 6.5%
Actual dividend paid (THB mn)
Dividend yield* (%)
* Calculated based on share price one day before the Board of Directors’ approval date for relevant dividend payment
Committed dividend period
9
prepared by Investor Relations department BTS Group Holdings PCL
8.70
0
200
400
600
800
1,000
1,200
6.00
7.00
8.00
9.00
10.00
11.00
12.00
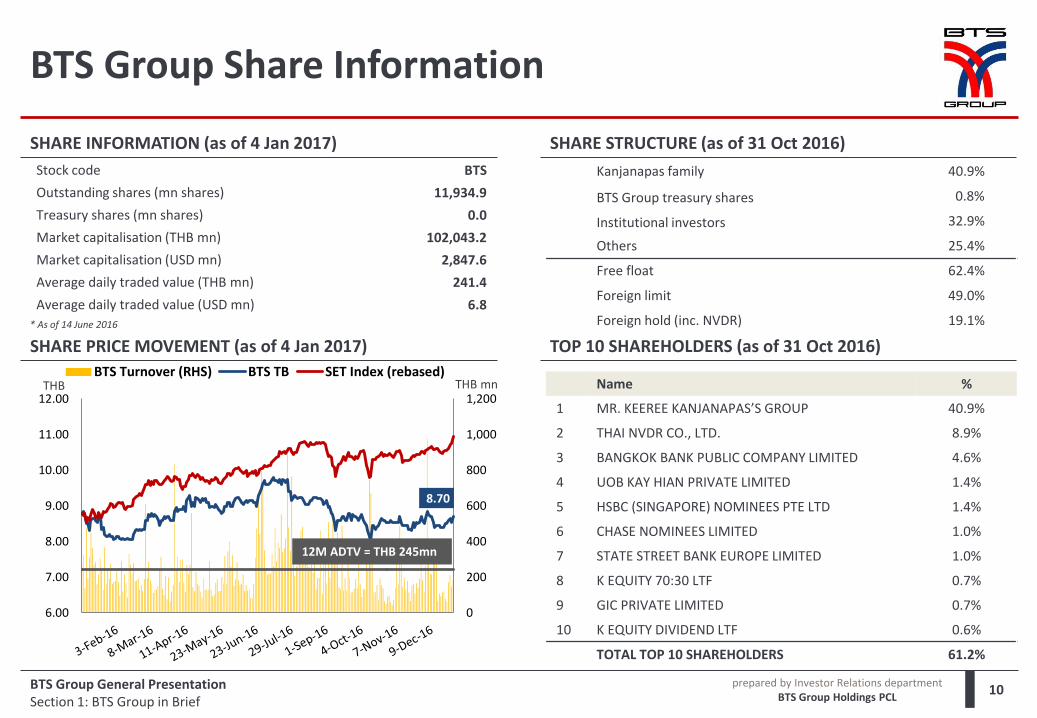
BTS Turnover (RHS) BTS TB SET Index (rebased)Name %
1 MR. KEEREE KANJANAPAS’S GROUP 40.9%
2 THAI NVDR CO., LTD. 8.9%
3 BANGKOK BANK PUBLIC COMPANY LIMITED 4.6%
4 UOB KAY HIAN PRIVATE LIMITED 1.4%
5 HSBC (SINGAPORE) NOMINEES PTE LTD 1.4%
6 CHASE NOMINEES LIMITED 1.0%
7 STATE STREET BANK EUROPE LIMITED 1.0%
8 K EQUITY 70:30 LTF 0.7%
9 GIC PRIVATE LIMITED 0.7%
10 K EQUITY DIVIDEND LTF 0.6%
TOTAL TOP 10 SHAREHOLDERS 61.2%
Stock code BTS
Outstanding shares (mn shares) 11,934.9
Treasury shares (mn shares) 0.0
Market capitalisation (THB mn) 102,043.2
Market capitalisation (USD mn) 2,847.6
Average daily traded value (THB mn) 241.4
Average daily traded value (USD mn) 6.8
BTS Group Share Information
SHARE INFORMATION (as of 4 Jan 2017)
BTS Group General Presentation Section 1: BTS Group in Brief
SHARE PRICE MOVEMENT (as of 4 Jan 2017)
SHARE STRUCTURE (as of 31 Oct 2016)
Kanjanapas family 40.9%
BTS Group treasury shares 0.8%
Institutional investors 32.9%
Others 25.4%
Free float 62.4%
Foreign limit 49.0%
Foreign hold (inc. NVDR) 19.1%
TOP 10 SHAREHOLDERS (as of 31 Oct 2016)
10
THB THB mn
* As of 14 June 2016
12M ADTV = THB 245mn
prepared by Investor Relations department BTS Group Holdings PCL
Section 1 BTS Group in Brief
Section 2 Business Segment Profiles
Section 2.1 Mass Transit Business
Section 2.2 Media Business
Section 2.3 Property Business
Section 2.4 Services Business
Section 3 Financial Summary
Appendices Appendix 1: Key Terms of the Core Network Concession Agreement
Appendix 2: Future Funding Requirements (Mass Transit)
Appendix 3: BTS-W3
Appendix 4: BTS Group CAPEX History
Appendix 5: BTSC’s Quality Management System
Contents
BTS Group General Presentation 11
prepared by Investor Relations department BTS Group Holdings PCL
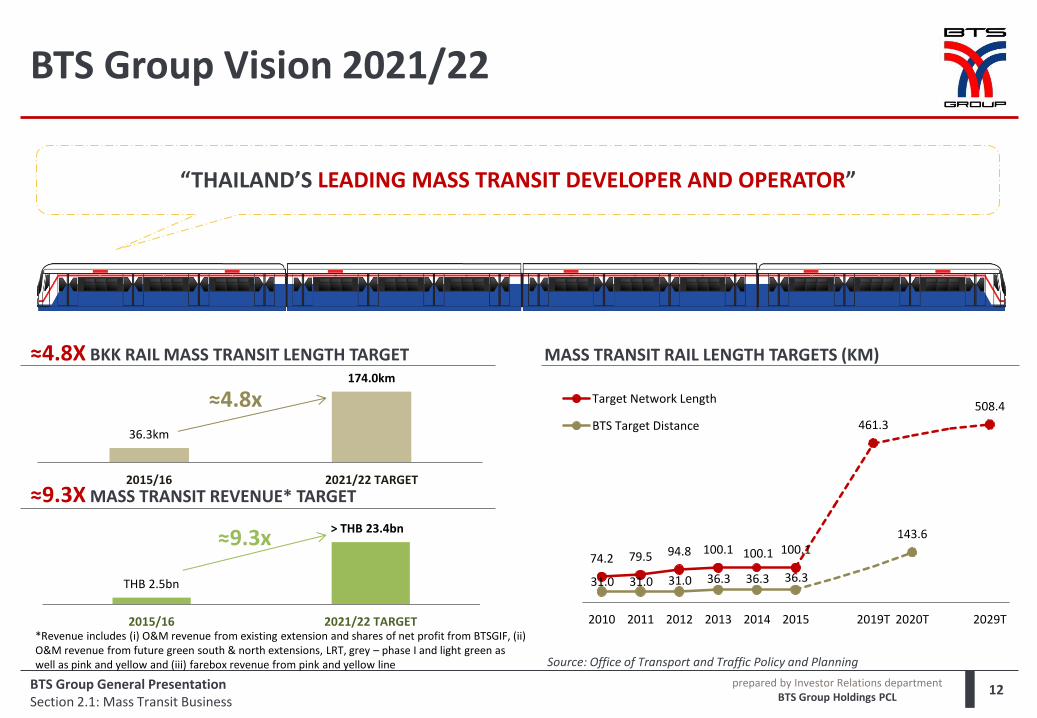
THB 2.5bn
> THB 23.4bn
2015/16 2021/22 TARGET
36.3km
174.0km
2015/16 2021/22 TARGET
≈9.3x
≈4.8x
BTS Group Vision 2021/22
“THAILAND’S LEADING MASS TRANSIT DEVELOPER AND OPERATOR”
≈4.8X BKK RAIL MASS TRANSIT LENGTH TARGET
≈9.3X MASS TRANSIT REVENUE* TARGET
MASS TRANSIT RAIL LENGTH TARGETS (KM)
Source: Office of Transport and Traffic Policy and Planning
12
*Revenue includes (i) O&M revenue from existing extension and shares of net profit from BTSGIF, (ii) O&M revenue from future green south & north extensions, LRT, grey – phase I and light green as well as pink and yellow and (iii) farebox revenue from pink and yellow line
74.2 79.5 94.8 100.1 100.1 100.1
461.3
508.4
31.0 31.0 31.0 36.3 36.3 36.3
143.6
2010 2011 2012 2013 2014 2015 2019T 2020T 2029T
Target Network Length
BTS Target Distance
BTS Group General Presentation Section 2.1: Mass Transit Business
prepared by Investor Relations department BTS Group Holdings PCL
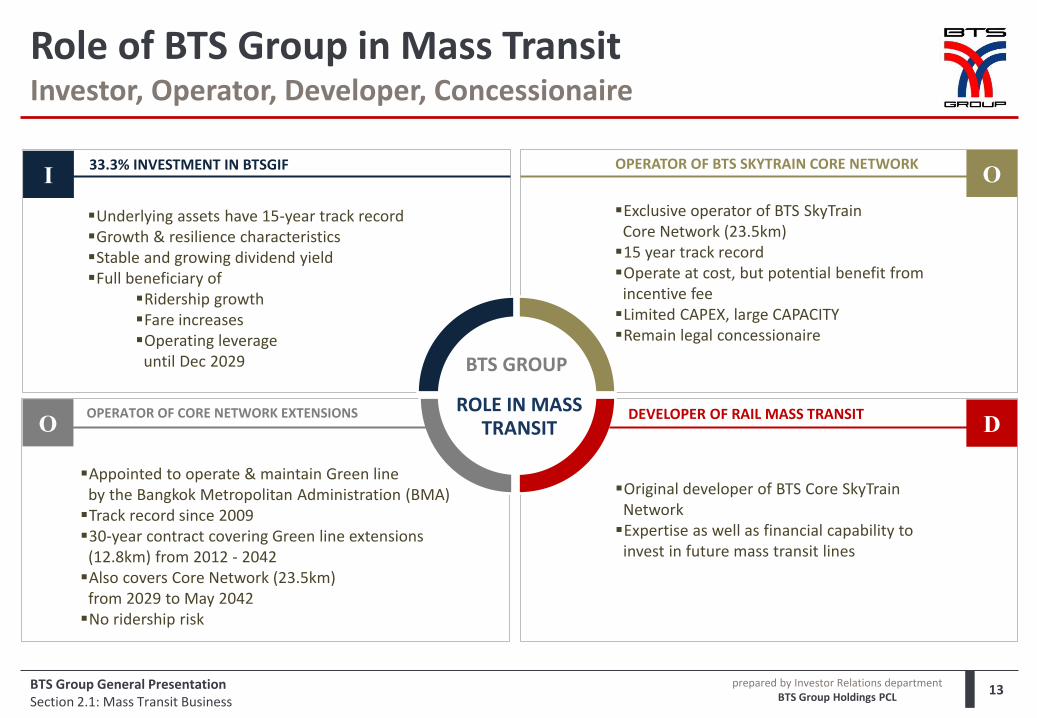
Role of BTS Group in Mass Transit Investor, Operator, Developer, Concessionaire
13
OPERATOR OF CORE NETWORK EXTENSIONS DEVELOPER OF RAIL MASS TRANSIT
BTS GROUP
ROLE IN MASS TRANSIT
OPERATOR OF BTS SKYTRAIN CORE NETWORK
Underlying assets have 15-year track record Growth & resilience characteristics Stable and growing dividend yield Full beneficiary of
Ridership growth Fare increases Operating leverage until Dec 2029
Exclusive operator of BTS SkyTrain Core Network (23.5km) 15 year track record Operate at cost, but potential benefit from incentive fee Limited CAPEX, large CAPACITY Remain legal concessionaire
Appointed to operate & maintain Green line by the Bangkok Metropolitan Administration (BMA) Track record since 2009 30-year contract covering Green line extensions (12.8km) from 2012 - 2042 Also covers Core Network (23.5km) from 2029 to May 2042 No ridership risk
Original developer of BTS Core SkyTrain Network Expertise as well as financial capability to invest in future mass transit lines
33.3% INVESTMENT IN BTSGIF
O
O
D
I
BTS Group General Presentation Section 2.1: Mass Transit Business
prepared by Investor Relations department BTS Group Holdings PCL
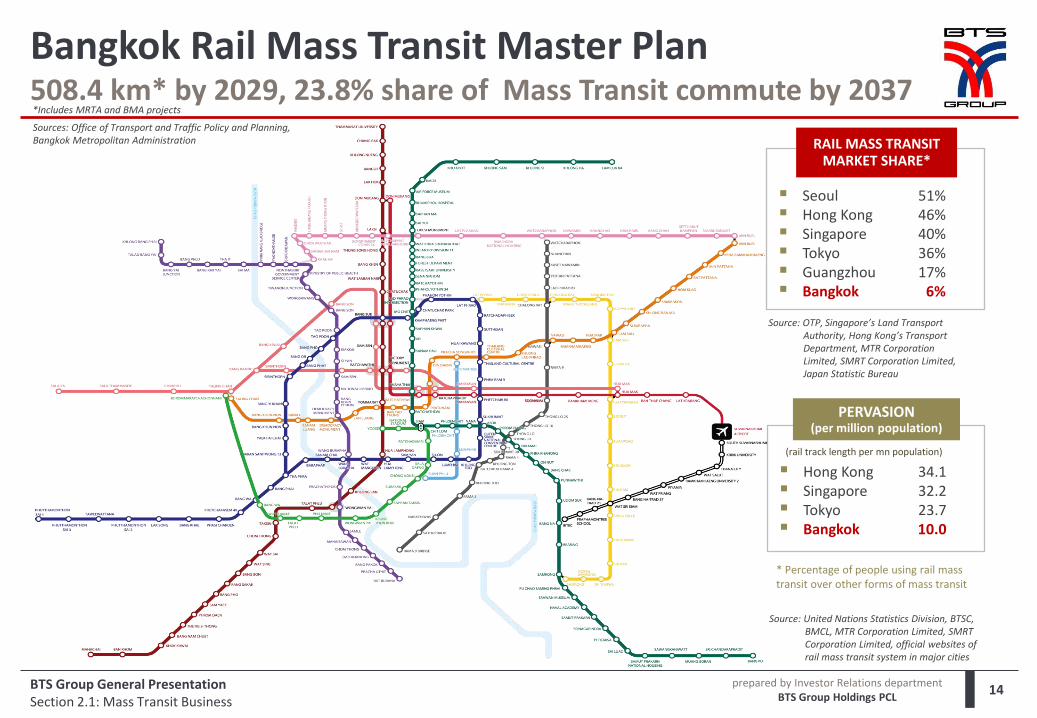
Bangkok Rail Mass Transit Master Plan 508.4 km* by 2029, 23.8% share of Mass Transit commute by 2037 Sources: Office of Transport and Traffic Policy and Planning, Bangkok Metropolitan Administration
Source: United Nations Statistics Division, BTSC, BMCL, MTR Corporation Limited, SMRT Corporation Limited, official websites of rail mass transit system in major cities
Seoul 51% Hong Kong 46% Singapore 40% Tokyo 36% Guangzhou 17% Bangkok 6%
RAIL MASS TRANSIT MARKET SHARE*
Hong Kong 34.1 Singapore 32.2 Tokyo 23.7 Bangkok 10.0
PERVASION (per million population)
Source: OTP, Singapore’s Land Transport Authority, Hong Kong’s Transport Department, MTR Corporation Limited, SMRT Corporation Limited, Japan Statistic Bureau
(rail track length per mn population)
* Percentage of people using rail mass transit over other forms of mass transit
*Includes MRTA and BMA projects
14 BTS Group General Presentation Section 2.1: Mass Transit Business
prepared by Investor Relations department BTS Group Holdings PCL
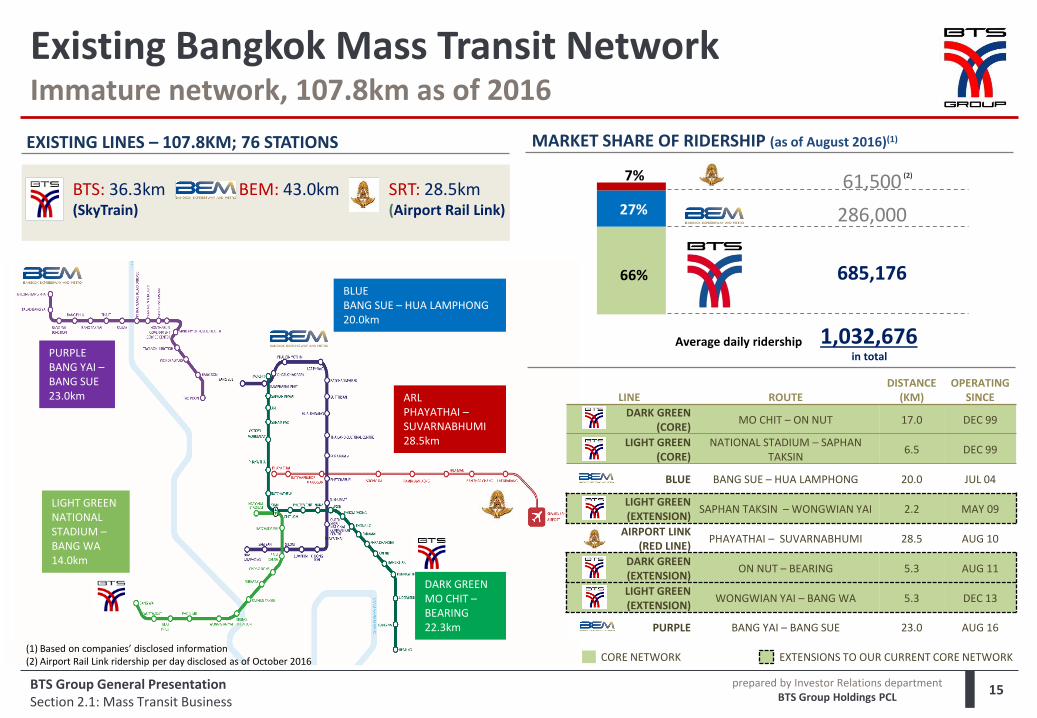
Existing Bangkok Mass Transit Network Immature network, 107.8km as of 2016
EXISTING LINES – 107.8KM; 76 STATIONS
15
Average daily ridership
66% 685,176
286,000
61,500
1,032,676
in total
27%
7%
LINE ROUTE DISTANCE
(KM) OPERATING
SINCE
DARK GREEN (CORE)
MO CHIT – ON NUT 17.0 DEC 99
LIGHT GREEN (CORE)
NATIONAL STADIUM – SAPHAN TAKSIN
6.5 DEC 99
BLUE BANG SUE – HUA LAMPHONG 20.0 JUL 04
LIGHT GREEN (EXTENSION)
SAPHAN TAKSIN – WONGWIAN YAI 2.2 MAY 09
AIRPORT LINK (RED LINE)
PHAYATHAI – SUVARNABHUMI 28.5 AUG 10
DARK GREEN (EXTENSION)
ON NUT – BEARING 5.3 AUG 11
LIGHT GREEN (EXTENSION)
WONGWIAN YAI – BANG WA 5.3 DEC 13
PURPLE BANG YAI – BANG SUE 23.0 AUG 16
CORE NETWORK EXTENSIONS TO OUR CURRENT CORE NETWORK
(2)
66%
MARKET SHARE OF RIDERSHIP (as of August 2016)(1)
BLUE BANG SUE – HUA LAMPHONG 20.0km
PURPLE BANG YAI – BANG SUE 23.0km
LIGHT GREEN NATIONAL STADIUM – BANG WA 14.0km
DARK GREEN MO CHIT – BEARING 22.3km
ARL PHAYATHAI – SUVARNABHUMI 28.5km
BTS: 36.3km (SkyTrain)
BEM: 43.0km
SRT: 28.5km (Airport Rail Link)
(1) Based on companies’ disclosed information (2) Airport Rail Link ridership per day disclosed as of October 2016
BTS Group General Presentation Section 2.1: Mass Transit Business
prepared by Investor Relations department BTS Group Holdings PCL
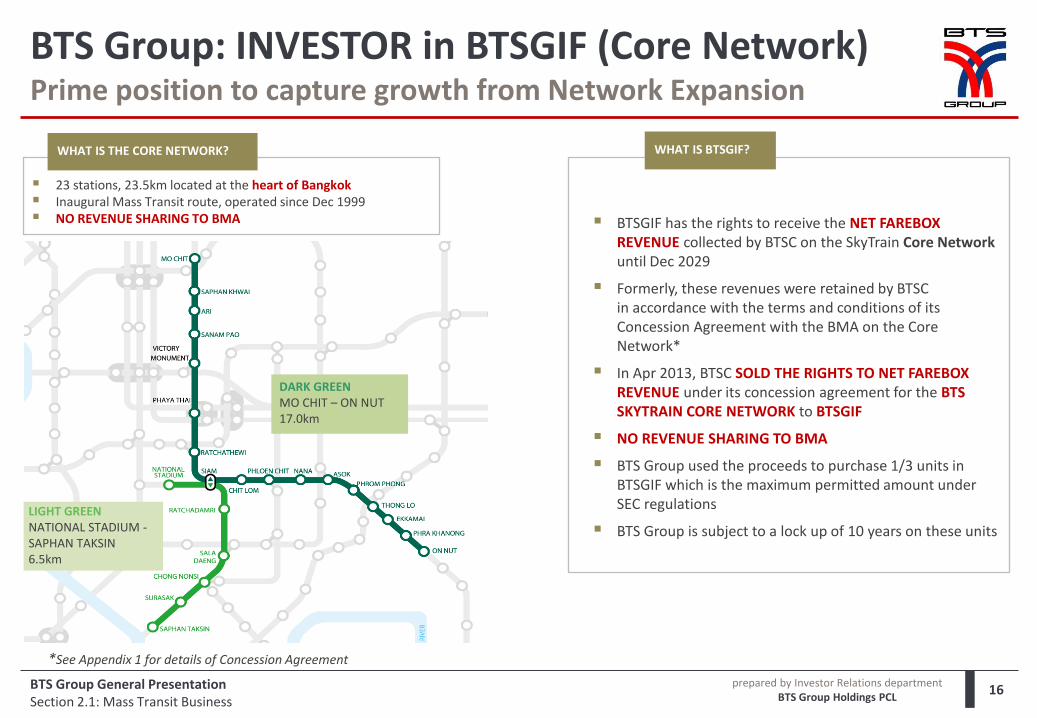
BTS Group: INVESTOR in BTSGIF (Core Network) Prime position to capture growth from Network Expansion
16
*See Appendix 1 for details of Concession Agreement
BTSGIF has the rights to receive the NET FAREBOX REVENUE collected by BTSC on the SkyTrain Core Network until Dec 2029
Formerly, these revenues were retained by BTSC in accordance with the terms and conditions of its Concession Agreement with the BMA on the Core Network*
In Apr 2013, BTSC SOLD THE RIGHTS TO NET FAREBOX REVENUE under its concession agreement for the BTS SKYTRAIN CORE NETWORK to BTSGIF
NO REVENUE SHARING TO BMA
BTS Group used the proceeds to purchase 1/3 units in BTSGIF which is the maximum permitted amount under SEC regulations
BTS Group is subject to a lock up of 10 years on these units
WHAT IS BTSGIF? WHAT IS THE CORE NETWORK?
23 stations, 23.5km located at the heart of Bangkok Inaugural Mass Transit route, operated since Dec 1999 NO REVENUE SHARING TO BMA
DARK GREEN MO CHIT – ON NUT 17.0km
LIGHT GREEN NATIONAL STADIUM - SAPHAN TAKSIN 6.5km
BTS Group General Presentation Section 2.1: Mass Transit Business
prepared by Investor Relations department BTS Group Holdings PCL
1,4
19
1,7
80
2,1
22
2,2
94
2,5
73
2,8
17
3,0
66
3,2
24
3,2
92
3,4
85
3,5
45
4,2
97
4,8
96
5,6
77
5,8
74
6,3
97
59
79
96 105
118 132 139 133 136
144 145
176
197
215 219 233
-
10
20
30
40
50
60
70
80
90
100
110
120
130
140
150
160
170
180
190
200
210
220
230
240
2000/01 2001/02 2002/03 2003/04 2004/05 2005/06 2006/07 2007/08 2008/09 2009/10 2010/11 2011/12 2012/13 2013/14 2014/15 2015/16
Farebox revenue (THB mn) Ridership (mn)
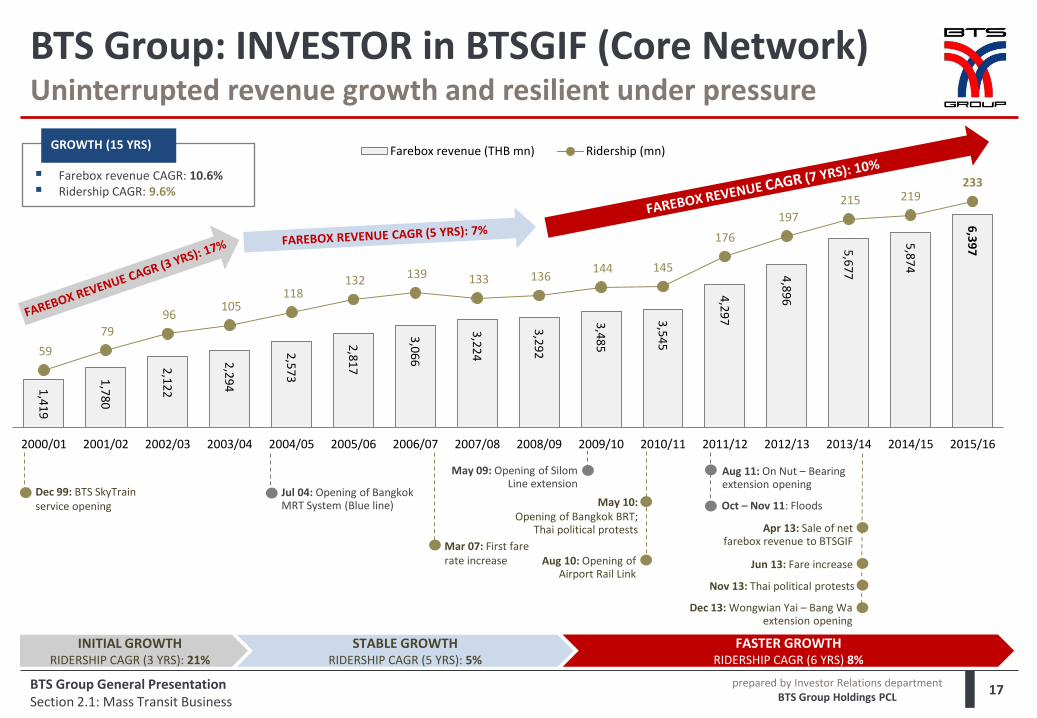
BTS Group: INVESTOR in BTSGIF (Core Network) Uninterrupted revenue growth and resilient under pressure
17
Jul 04: Opening of Bangkok MRT System (Blue line) May 10:
Opening of Bangkok BRT; Thai political protests
Aug 10: Opening of Airport Rail Link
Aug 11: On Nut – Bearing extension opening
Oct – Nov 11: Floods
INITIAL GROWTH RIDERSHIP CAGR (3 YRS): 21%
STABLE GROWTH RIDERSHIP CAGR (5 YRS): 5%
FASTER GROWTH RIDERSHIP CAGR (6 YRS) 8%
Dec 99: BTS SkyTrain service opening
Mar 07: First fare rate increase
May 09: Opening of Silom Line extension
Farebox revenue CAGR: 10.6% Ridership CAGR: 9.6%
GROWTH (15 YRS)
Nov 13: Thai political protests
Dec 13: Wongwian Yai – Bang Wa extension opening
Apr 13: Sale of net farebox revenue to BTSGIF
Jun 13: Fare increase
BTS Group General Presentation Section 2.1: Mass Transit Business

prepared by Investor Relations department BTS Group Holdings PCL
22
.1
24
.2
24
.2
24
.1
24
.4
24
.4
24
.8
26
.4
26
.9
27
.5
2006/07 2007/08 2008/09 2009/10 2010/11 2011/12 2012/13 2013/14 2014/15 2015/16
SJT 36% AVG FARE THB 30.8
30-DAY PASS (ADULT)* 29% AVG FARE THB 25.8
PURSE (STV)* 27% AVG FARE THB 26.4
30-DAY PASS (STUDENT)* 7% AVG FARE THB 20.8
ONE-DAY PASS 1% AVG FARE THB 35.7
18
FARE ADJUSTMENT MECHANISM
Can be adjusted no more than once every 18 months by making announcement to BMA and public 30 days in advance Must not exceed the Authorised fare
EFFECTIVE FARE
Normal situation: upon change of Bangkok’s CPI >=5%, may adjust up to 7% (No approval required)
Special situation: upon change of CPI (>= 9%), USD/THB foreign exchange rate, interest rate or electricity costs (BMA approval required)
AUTHORISED FARE
HISTORICAL AVERAGE FARE RIDERSHIP BY TICKET TYPES (FY 15/16)
DISTANCE-BASED FARE (BY NO. OF STATIONS)
THB / Trip
20.1
26.8
33.5
40.2
46.9
53.6
60.3
15.0
22.0 25.0
28.0 31.0
34.0 37.0
42.0
0 1 2 3 4 5 6 7 8 9 10 11 12 13 14 15 16 17
AUTHORISED FARE
EFFECTIVE FARE
POTENTIAL FARE UPSIDE
NO. OF STATIONS
THB
* Counted as Rabbit
BTS Group General Presentation Section 2.1: Mass Transit Business
BTS Group: INVESTOR in BTSGIF (Core Network) Flexibility to increase fares
prepared by Investor Relations department BTS Group Holdings PCL
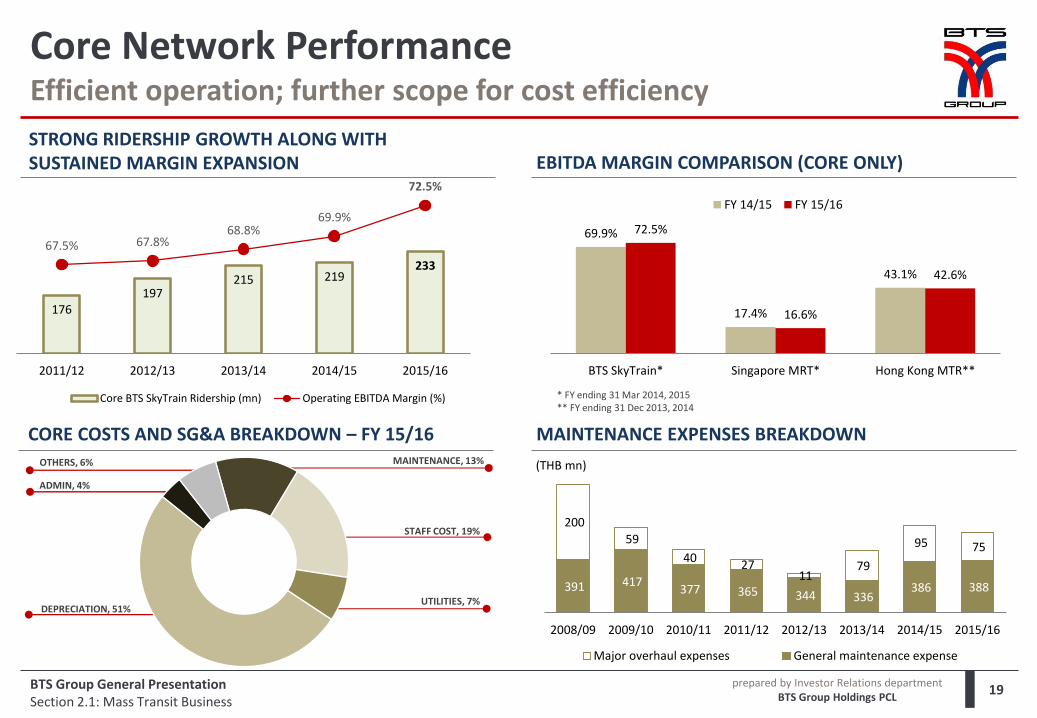
Core Network Performance Efficient operation; further scope for cost efficiency
19
STRONG RIDERSHIP GROWTH ALONG WITH SUSTAINED MARGIN EXPANSION
CORE COSTS AND SG&A BREAKDOWN – FY 15/16
EBITDA MARGIN COMPARISON (CORE ONLY)
MAINTENANCE EXPENSES BREAKDOWN MAINTENANCE, 13%
STAFF COST, 19%
UTILITIES, 7% DEPRECIATION, 51%
ADMIN, 4%
* FY ending 31 Mar 2014, 2015 ** FY ending 31 Dec 2013, 2014
OTHERS, 6%
BTS Group General Presentation Section 2.1: Mass Transit Business
176 197
215 219 233
67.5% 67.8% 68.8%
69.9%
72.5%
60. 0%
62. 0%
64. 0%
66. 0%
68. 0%
70. 0%
72. 0%
2011/12 2012/13 2013/14 2014/15 2015/16
100
120
140
160
180
200
220
240
260
280
300
Core BTS SkyTrain Ridership (mn) Operating EBITDA Margin (%)
69.9%
17.4%
43.1%
72.5%
16.6%
42.6%
BTS SkyTrain* Singapore MRT* Hong Kong MTR**
FY 14/15 FY 15/16
391 417 377 365 344 336
386 388
200
59
40 27
11 79
95 75
250
300
350
400
450
500
550
600
650
2008/09 2009/10 2010/11 2011/12 2012/13 2013/14 2014/15 2015/16
Major overhaul expenses General maintenance expense
(THB mn)
prepared by Investor Relations department BTS Group Holdings PCL
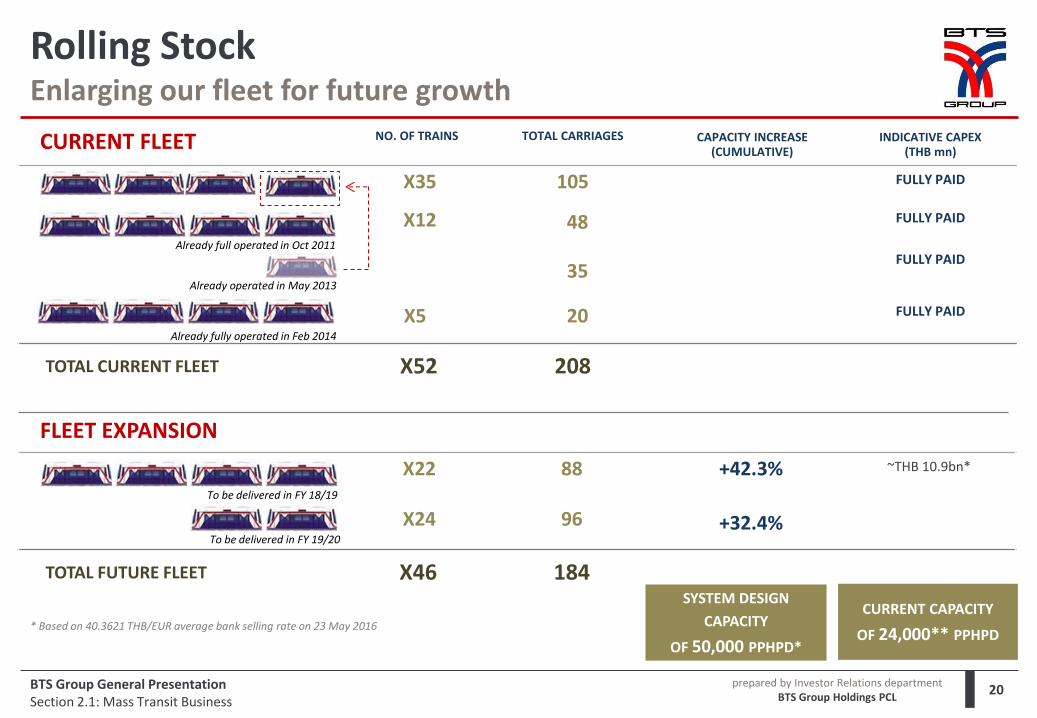
FLEET EXPANSION
X22 88 +42.3% ~THB 10.9bn*
X24 96
+32.4%
TOTAL FUTURE FLEET X46 184
CURRENT FLEET NO. OF TRAINS TOTAL CARRIAGES CAPACITY INCREASE (CUMULATIVE)
INDICATIVE CAPEX (THB mn)
X35 105 FULLY PAID
X12 48
35
FULLY PAID
FULLY PAID
X5 20
FULLY PAID
TOTAL CURRENT FLEET X52 208
Rolling Stock Enlarging our fleet for future growth
20
SYSTEM DESIGN
CAPACITY
OF 50,000 PPHPD*
CURRENT CAPACITY
OF 24,000** PPHPD * Based on 40.3621 THB/EUR average bank selling rate on 23 May 2016
Already operated in May 2013
Already fully operated in Feb 2014
To be delivered in FY 18/19
To be delivered in FY 19/20
BTS Group General Presentation Section 2.1: Mass Transit Business
Already full operated in Oct 2011
prepared by Investor Relations department BTS Group Holdings PCL
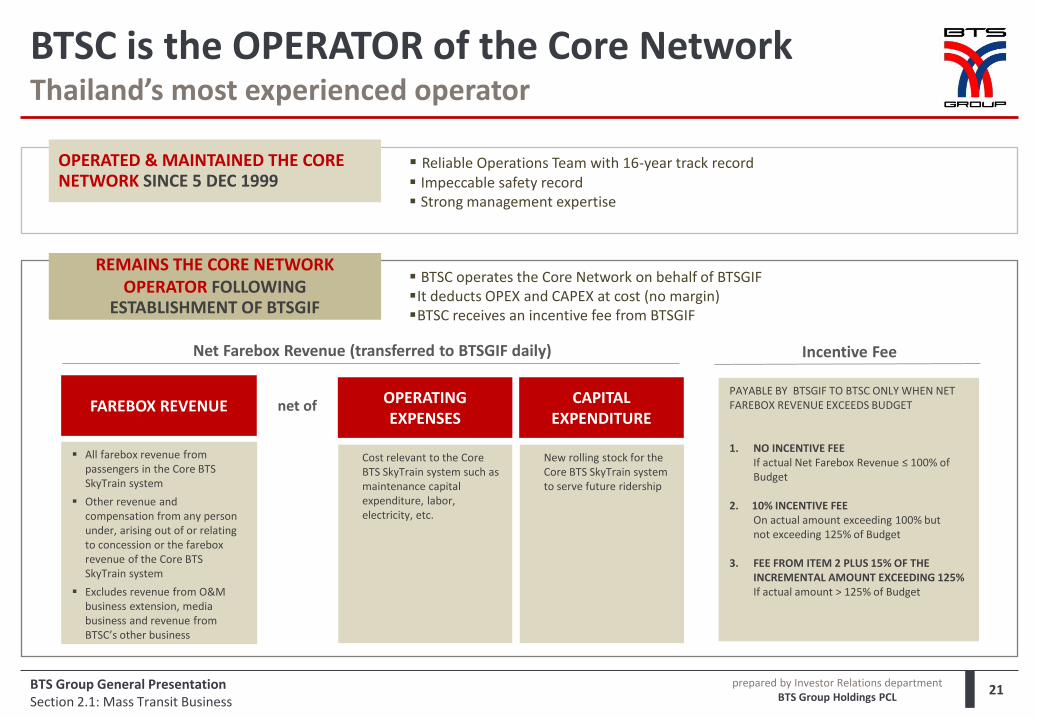
BTSC is the OPERATOR of the Core Network Thailand’s most experienced operator
21
Reliable Operations Team with 16-year track record Impeccable safety record Strong management expertise
OPERATED & MAINTAINED THE CORE NETWORK SINCE 5 DEC 1999
REMAINS THE CORE NETWORK OPERATOR FOLLOWING
ESTABLISHMENT OF BTSGIF
BTSC operates the Core Network on behalf of BTSGIF It deducts OPEX and CAPEX at cost (no margin) BTSC receives an incentive fee from BTSGIF
Net Farebox Revenue (transferred to BTSGIF daily)
FAREBOX REVENUE OPERATING EXPENSES
CAPITAL EXPENDITURE
Incentive Fee
All farebox revenue from passengers in the Core BTS SkyTrain system
Other revenue and compensation from any person under, arising out of or relating to concession or the farebox revenue of the Core BTS SkyTrain system
Excludes revenue from O&M business extension, media business and revenue from BTSC’s other business
Cost relevant to the Core BTS SkyTrain system such as maintenance capital expenditure, labor, electricity, etc.
New rolling stock for the Core BTS SkyTrain system to serve future ridership
net of PAYABLE BY BTSGIF TO BTSC ONLY WHEN NET FAREBOX REVENUE EXCEEDS BUDGET
1. NO INCENTIVE FEE If actual Net Farebox Revenue ≤ 100% of
Budget 2. 10% INCENTIVE FEE On actual amount exceeding 100% but not exceeding 125% of Budget 3. FEE FROM ITEM 2 PLUS 15% OF THE
INCREMENTAL AMOUNT EXCEEDING 125% If actual amount > 125% of Budget
BTS Group General Presentation Section 2.1: Mass Transit Business
prepared by Investor Relations department BTS Group Holdings PCL
TH
B 1
.5b
n
THB
3.7
bn
T
HB
4.6
bn
14
/15
15
/16
16
/17
17
/18
18
/19
19
/20
20
/21
21
/22
22
/23
23
/24
24
/25
25
/26
26
/27
27
/28
28
/29
29
/30
30
/31
31
/32
32
/33
33
/34
34
/35
35
/36
36
/37
37
/38
38
/39
39
/40
40
/41
41
/42
42
/43
Interest income O&M - Core Network O&M - Extension
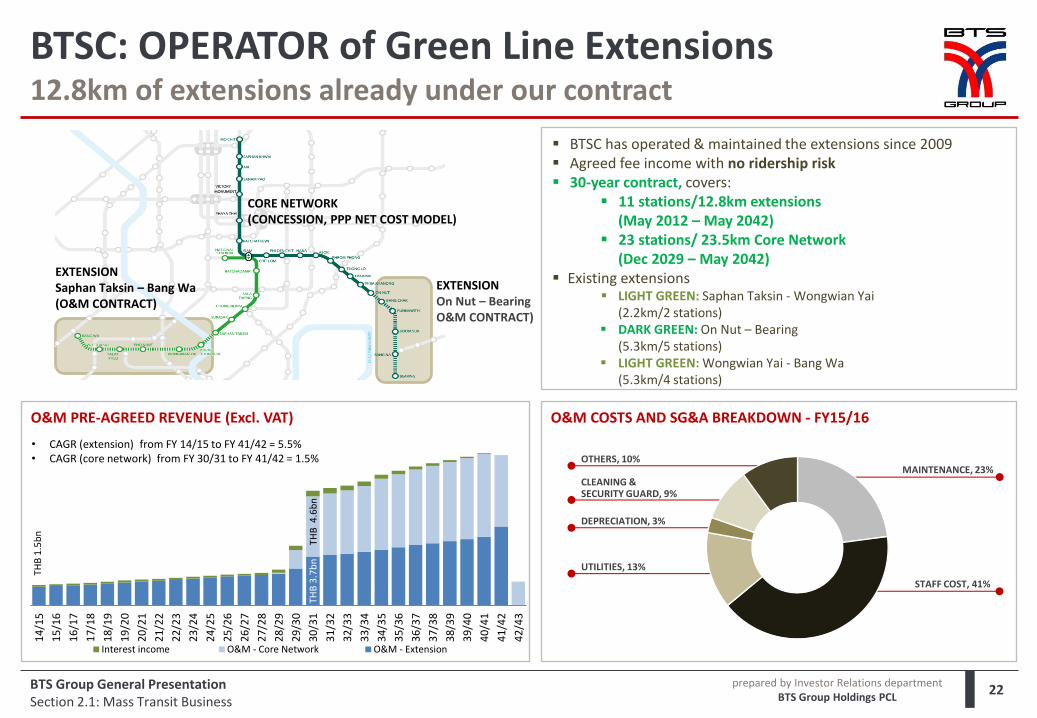
BTSC: OPERATOR of Green Line Extensions 12.8km of extensions already under our contract
22
O&M COSTS AND SG&A BREAKDOWN - FY15/16
BTSC has operated & maintained the extensions since 2009 Agreed fee income with no ridership risk 30-year contract, covers:
11 stations/12.8km extensions (May 2012 – May 2042) 23 stations/ 23.5km Core Network (Dec 2029 – May 2042)
Existing extensions LIGHT GREEN: Saphan Taksin - Wongwian Yai (2.2km/2 stations) DARK GREEN: On Nut – Bearing
(5.3km/5 stations) LIGHT GREEN: Wongwian Yai - Bang Wa
(5.3km/4 stations)
MAINTENANCE, 23%
STAFF COST, 41%
OTHERS, 10%
CLEANING & SECURITY GUARD, 9%
DEPRECIATION, 3%
UTILITIES, 13%
EXTENSION Saphan Taksin – Bang Wa (O&M CONTRACT)
EXTENSION On Nut – Bearing O&M CONTRACT)
CORE NETWORK (CONCESSION, PPP NET COST MODEL)
O&M PRE-AGREED REVENUE (Excl. VAT)
• CAGR (extension) from FY 14/15 to FY 41/42 = 5.5% • CAGR (core network) from FY 30/31 to FY 41/42 = 1.5%
BTS Group General Presentation Section 2.1: Mass Transit Business
prepared by Investor Relations department BTS Group Holdings PCL
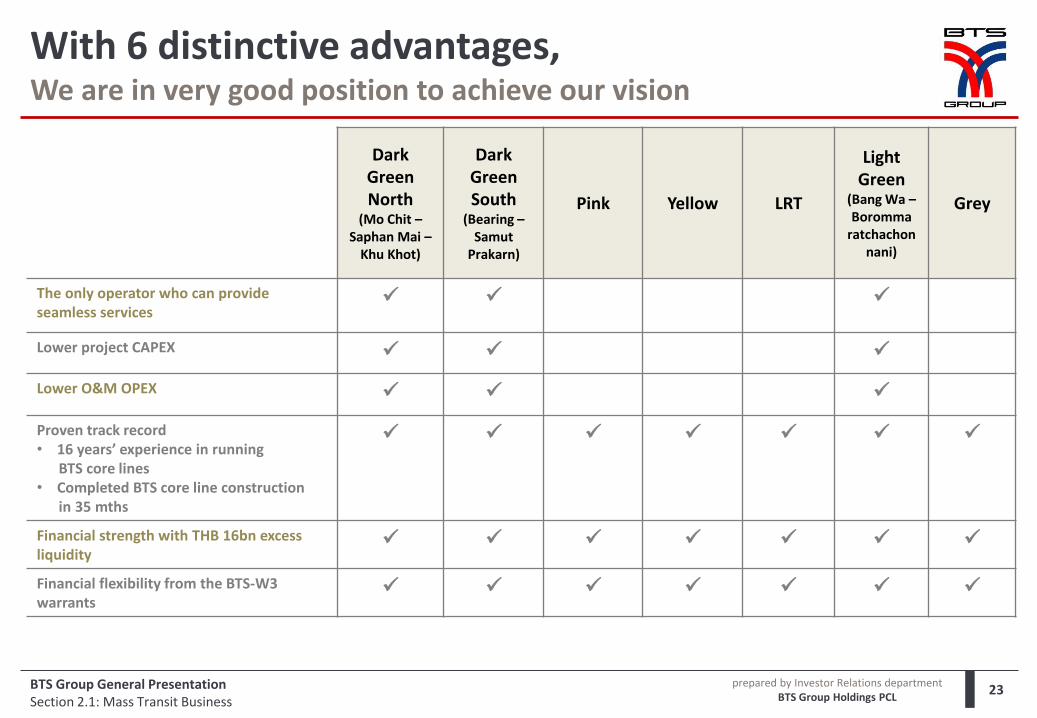
With 6 distinctive advantages, We are in very good position to achieve our vision
23
Dark Green North
(Mo Chit – Saphan Mai –
Khu Khot)
Dark Green South
(Bearing – Samut
Prakarn)
Pink Yellow LRT
Light Green
(Bang Wa – Boromma
ratchachonnani)
Grey
The only operator who can provide seamless services
Lower project CAPEX
Lower O&M OPEX
Proven track record • 16 years’ experience in running BTS core lines • Completed BTS core line construction in 35 mths
Financial strength with THB 16bn excess liquidity
Financial flexibility from the BTS-W3 warrants
BTS Group General Presentation Section 2.1: Mass Transit Business
prepared by Investor Relations department BTS Group Holdings PCL
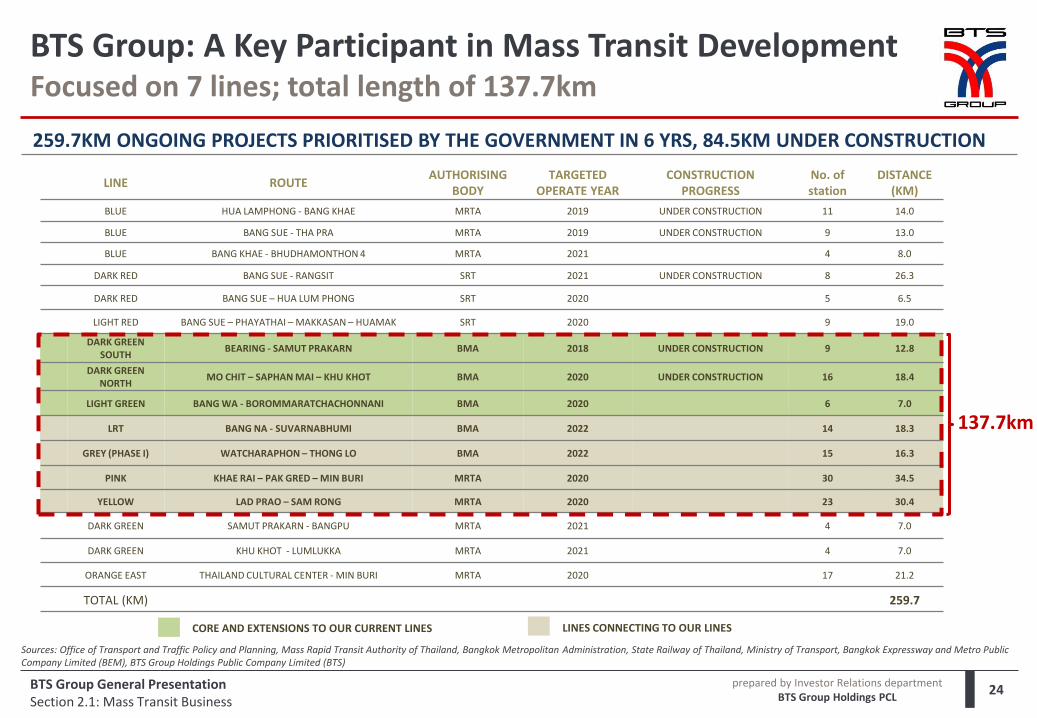
LINE ROUTE AUTHORISING
BODY TARGETED
OPERATE YEAR CONSTRUCTION
PROGRESS No. of station
DISTANCE (KM)
BLUE HUA LAMPHONG - BANG KHAE MRTA 2019 UNDER CONSTRUCTION 11 14.0
BLUE BANG SUE - THA PRA MRTA 2019 UNDER CONSTRUCTION 9 13.0
BLUE BANG KHAE - BHUDHAMONTHON 4 MRTA 2021 4 8.0
DARK RED BANG SUE - RANGSIT SRT 2021 UNDER CONSTRUCTION 8 26.3
DARK RED BANG SUE – HUA LUM PHONG SRT 2020 5 6.5
LIGHT RED BANG SUE – PHAYATHAI – MAKKASAN – HUAMAK SRT 2020 9 19.0
DARK GREEN SOUTH
BEARING - SAMUT PRAKARN BMA 2018 UNDER CONSTRUCTION 9 12.8
DARK GREEN NORTH
MO CHIT – SAPHAN MAI – KHU KHOT BMA 2020 UNDER CONSTRUCTION 16 18.4
LIGHT GREEN BANG WA - BOROMMARATCHACHONNANI BMA 2020 6 7.0
LRT BANG NA - SUVARNABHUMI BMA 2022 14 18.3
GREY (PHASE I) WATCHARAPHON – THONG LO BMA 2022 15 16.3
PINK KHAE RAI – PAK GRED – MIN BURI MRTA 2020 30 34.5
YELLOW LAD PRAO – SAM RONG MRTA 2020 23 30.4
DARK GREEN SAMUT PRAKARN - BANGPU MRTA 2021 4 7.0
DARK GREEN KHU KHOT - LUMLUKKA MRTA 2021 4 7.0
ORANGE EAST THAILAND CULTURAL CENTER - MIN BURI MRTA 2020 17 21.2
TOTAL (KM) 259.7
259.7KM ONGOING PROJECTS PRIORITISED BY THE GOVERNMENT IN 6 YRS, 84.5KM UNDER CONSTRUCTION
CORE AND EXTENSIONS TO OUR CURRENT LINES LINES CONNECTING TO OUR LINES
137.7km
BTS Group: A Key Participant in Mass Transit Development Focused on 7 lines; total length of 137.7km
24
Sources: Office of Transport and Traffic Policy and Planning, Mass Rapid Transit Authority of Thailand, Bangkok Metropolitan Administration, State Railway of Thailand, Ministry of Transport, Bangkok Expressway and Metro Public Company Limited (BEM), BTS Group Holdings Public Company Limited (BTS)
BTS Group General Presentation Section 2.1: Mass Transit Business
prepared by Investor Relations department BTS Group Holdings PCL
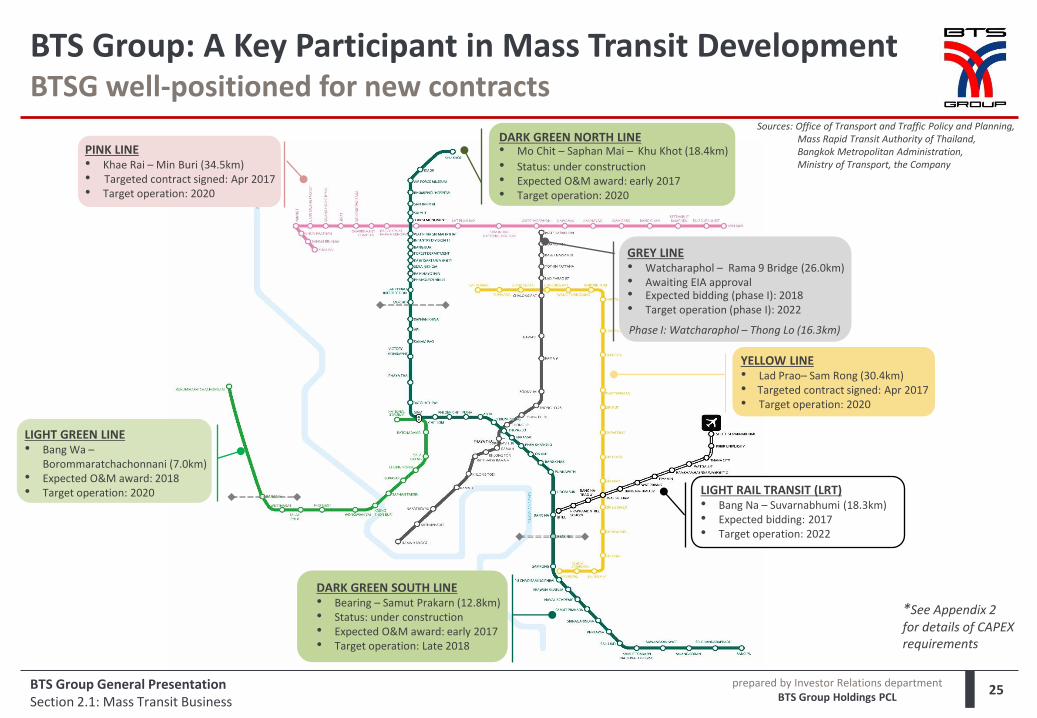
BTS Group: A Key Participant in Mass Transit Development BTSG well-positioned for new contracts
25 BTS Group General Presentation Section 2.1: Mass Transit Business
*See Appendix 2 for details of CAPEX requirements
PINK LINE • Khae Rai – Min Buri (34.5km) • Targeted contract signed: Apr 2017 • Target operation: 2020
DARK GREEN NORTH LINE • Mo Chit – Saphan Mai – Khu Khot (18.4km)
• Status: under construction • Expected O&M award: early 2017 • Target operation: 2020
GREY LINE • Watcharaphol – Rama 9 Bridge (26.0km) • Awaiting EIA approval • Expected bidding (phase I): 2018 • Target operation (phase I): 2022
Phase I: Watcharaphol – Thong Lo (16.3km)
LIGHT RAIL TRANSIT (LRT) • Bang Na – Suvarnabhumi (18.3km) • Expected bidding: 2017 • Target operation: 2022
DARK GREEN SOUTH LINE • Bearing – Samut Prakarn (12.8km) • Status: under construction • Expected O&M award: early 2017 • Target operation: Late 2018
Sources: Office of Transport and Traffic Policy and Planning, Mass Rapid Transit Authority of Thailand, Bangkok Metropolitan Administration, Ministry of Transport, the Company
LIGHT GREEN LINE • Bang Wa –
Borommaratchachonnani (7.0km) • Expected O&M award: 2018 • Target operation: 2020
YELLOW LINE • Lad Prao– Sam Rong (30.4km) • Targeted contract signed: Apr 2017 • Target operation: 2020
prepared by Investor Relations department BTS Group Holdings PCL
Section 1 BTS Group in Brief
Section 2 Business Segment Profiles
Section 2.1 Mass Transit Business
Section 2.2 Media Business
Section 2.3 Property Business
Section 2.4 Services Business
Section 3 Financial Summary
Appendices Appendix 1: Key Terms of the Core Network Concession Agreement
Appendix 2: Future Funding Requirements (Mass Transit)
Appendix 3: BTS-W3
Appendix 4: BTS Group CAPEX History
Appendix 5: BTSC’s Quality Management System
Contents
26 BTS Group General Presentation
prepared by Investor Relations department BTS Group Holdings PCL
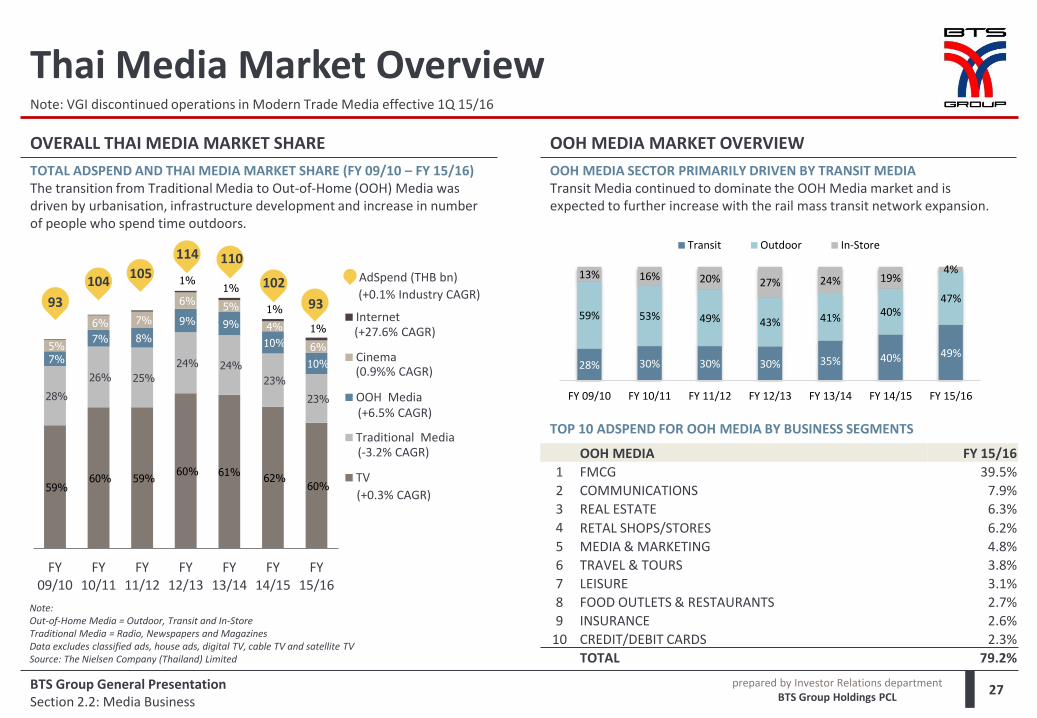
TOTAL ADSPEND AND THAI MEDIA MARKET SHARE (FY 09/10 – FY 15/16) The transition from Traditional Media to Out-of-Home (OOH) Media was driven by urbanisation, infrastructure development and increase in number of people who spend time outdoors.
59% 60% 59%
60% 61% 62%
60%
28%
26% 25%
24% 24%
23%
23%
7%
7% 8%
9% 9%
10%
10%
5%
6% 7%
6% 5%
4%
6%
1% 1%
1%
1%
FY09/10
FY10/11
FY11/12
FY12/13
FY13/14
FY14/15
FY15/16
Internet
Cinema
OOH Media
Traditional Media
TV
OOH MEDIA FY 15/16
1 FMCG 39.5%
2 COMMUNICATIONS 7.9%
3 REAL ESTATE 6.3%
4 RETAL SHOPS/STORES 6.2%
5 MEDIA & MARKETING 4.8%
6 TRAVEL & TOURS 3.8%
7 LEISURE 3.1%
8 FOOD OUTLETS & RESTAURANTS 2.7%
9 INSURANCE 2.6%
10 CREDIT/DEBIT CARDS 2.3%
TOTAL 79.2%
OVERALL THAI MEDIA MARKET SHARE OOH MEDIA MARKET OVERVIEW
OOH MEDIA SECTOR PRIMARILY DRIVEN BY TRANSIT MEDIA Transit Media continued to dominate the OOH Media market and is expected to further increase with the rail mass transit network expansion.
BTS Group General Presentation Section 2.2: Media Business
27
Thai Media Market Overview
Note: Out-of-Home Media = Outdoor, Transit and In-Store Traditional Media = Radio, Newspapers and Magazines Data excludes classified ads, house ads, digital TV, cable TV and satellite TV Source: The Nielsen Company (Thailand) Limited
TOP 10 ADSPEND FOR OOH MEDIA BY BUSINESS SEGMENTS
Note: VGI discontinued operations in Modern Trade Media effective 1Q 15/16
AdSpend (THB bn)
93
104 105 114 110
102
(+27.6% CAGR)
(0.9%% CAGR)
(+6.5% CAGR)
(-3.2% CAGR)
(+0.3% CAGR)
(+0.1% Industry CAGR) 93
28% 30% 30% 30% 35% 40% 49%
59% 53% 49% 43% 41% 40% 47%
13% 16% 20% 27% 24% 19% 4%
FY 09/10 FY 10/11 FY 11/12 FY 12/13 FY 13/14 FY 14/15 FY 15/16
Transit Outdoor In-Store
prepared by Investor Relations department BTS Group Holdings PCL
BTS Group General Presentation Section 2.2: Media Business
28
Thai Media Market Overview Media Landscape in Thailand
60
80
100
120
140
160
180
200
2008 2009 2010 2011 2012 2013 2014 2015
Total Industry TV* Traditional media OOH Media Cinema
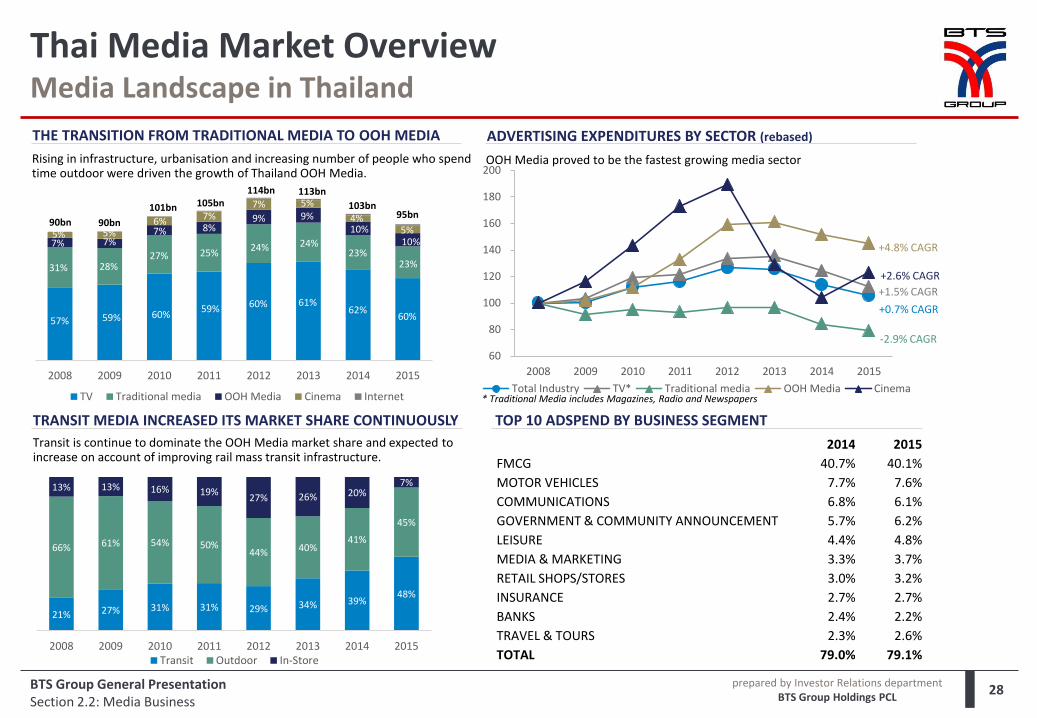
ADVERTISING EXPENDITURES BY SECTOR (rebased)
OOH Media proved to be the fastest growing media sector
* Traditional Media includes Magazines, Radio and Newspapers
TRANSIT MEDIA INCREASED ITS MARKET SHARE CONTINUOUSLY Transit is continue to dominate the OOH Media market share and expected to increase on account of improving rail mass transit infrastructure.
THE TRANSITION FROM TRADITIONAL MEDIA TO OOH MEDIA
Rising in infrastructure, urbanisation and increasing number of people who spend time outdoor were driven the growth of Thailand OOH Media.
TOP 10 ADSPEND BY BUSINESS SEGMENT
+0.7% CAGR
+2.6% CAGR
-2.9% CAGR
+1.5% CAGR
+4.8% CAGR
21% 27% 31% 31% 29% 34% 39% 48%
66% 61% 54% 50% 44% 40%
41%
45%
13% 13% 16% 19% 27% 26% 20%
7%
2008 2009 2010 2011 2012 2013 2014 2015Transit Outdoor In-Store
2008 2009 2010 2011 2012 2013 2014 2015
TV Traditional media OOH Media Cinema Internet
95bn
113bn
103bn
114bn 105bn 101bn
90bn 90bn
2014 2015
FMCG 40.7% 40.1%
MOTOR VEHICLES 7.7% 7.6%
COMMUNICATIONS 6.8% 6.1%
GOVERNMENT & COMMUNITY ANNOUNCEMENT 5.7% 6.2%
LEISURE 4.4% 4.8%
MEDIA & MARKETING 3.3% 3.7%
RETAIL SHOPS/STORES 3.0% 3.2%
INSURANCE 2.7% 2.7%
BANKS 2.4% 2.2%
TRAVEL & TOURS 2.3% 2.6%
TOTAL 79.0% 79.1%
57% 59% 60% 59% 60% 61%
62% 60%
31% 28% 27% 25%
24% 24% 23%
23%
7% 7% 7% 8%
9% 9% 10%
10% 5%
4%
5% 7% 7% 6%
5% 5%
prepared by Investor Relations department BTS Group Holdings PCL
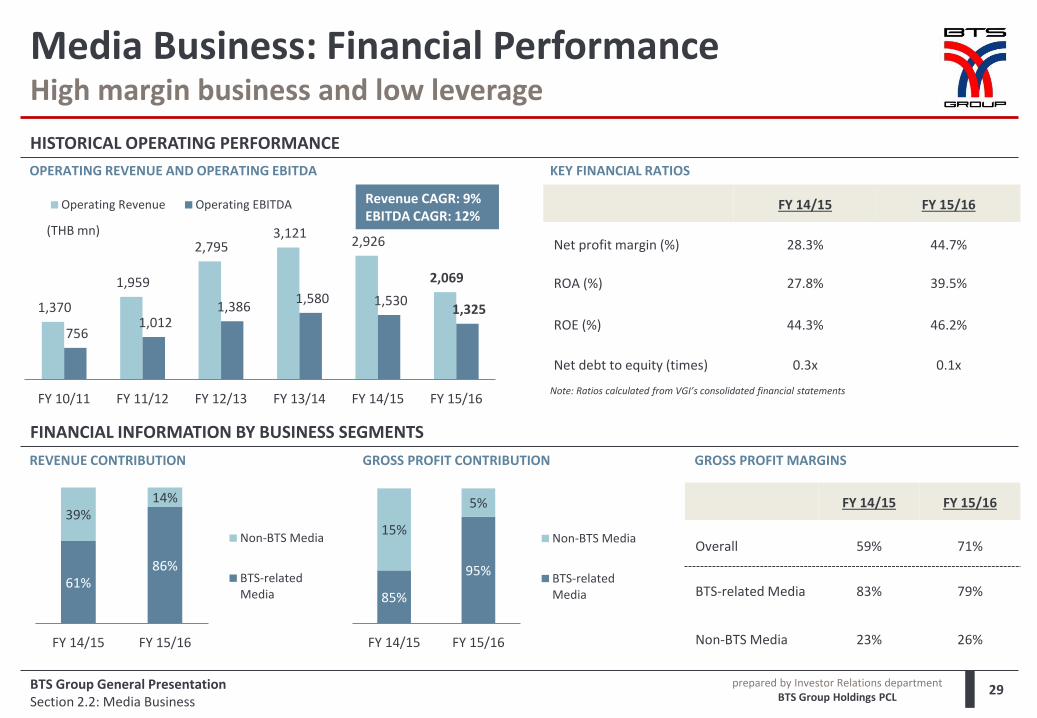
1,370
1,959
2,795 3,121
2,926
2,069
756 1,012
1,386 1,580 1,530
1,325
FY 10/11 FY 11/12 FY 12/13 FY 13/14 FY 14/15 FY 15/16
Operating Revenue Operating EBITDA
REVENUE CONTRIBUTION
FY 14/15 FY 15/16
Net profit margin (%) 28.3% 44.7%
ROA (%) 27.8% 39.5%
ROE (%) 44.3% 46.2%
Net debt to equity (times) 0.3x 0.1x
HISTORICAL OPERATING PERFORMANCE
BTS Group General Presentation Section 2.2: Media Business
29
GROSS PROFIT MARGINS
Media Business: Financial Performance High margin business and low leverage
(THB mn)
OPERATING REVENUE AND OPERATING EBITDA
Revenue CAGR: 9% EBITDA CAGR: 12%
FY 14/15 FY 15/16
Overall 59% 71%
BTS-related Media 83% 79%
Non-BTS Media 23% 26%
GROSS PROFIT CONTRIBUTION
Note: Ratios calculated from VGI’s consolidated financial statements
FINANCIAL INFORMATION BY BUSINESS SEGMENTS
KEY FINANCIAL RATIOS
61% 86%
39% 14%
FY 14/15 FY 15/16
Non-BTS Media
BTS-relatedMedia 85%
95%
15%
5%
FY 14/15 FY 15/16
Non-BTS Media
BTS-relatedMedia
prepared by Investor Relations department BTS Group Holdings PCL
BTS-related Media Overview
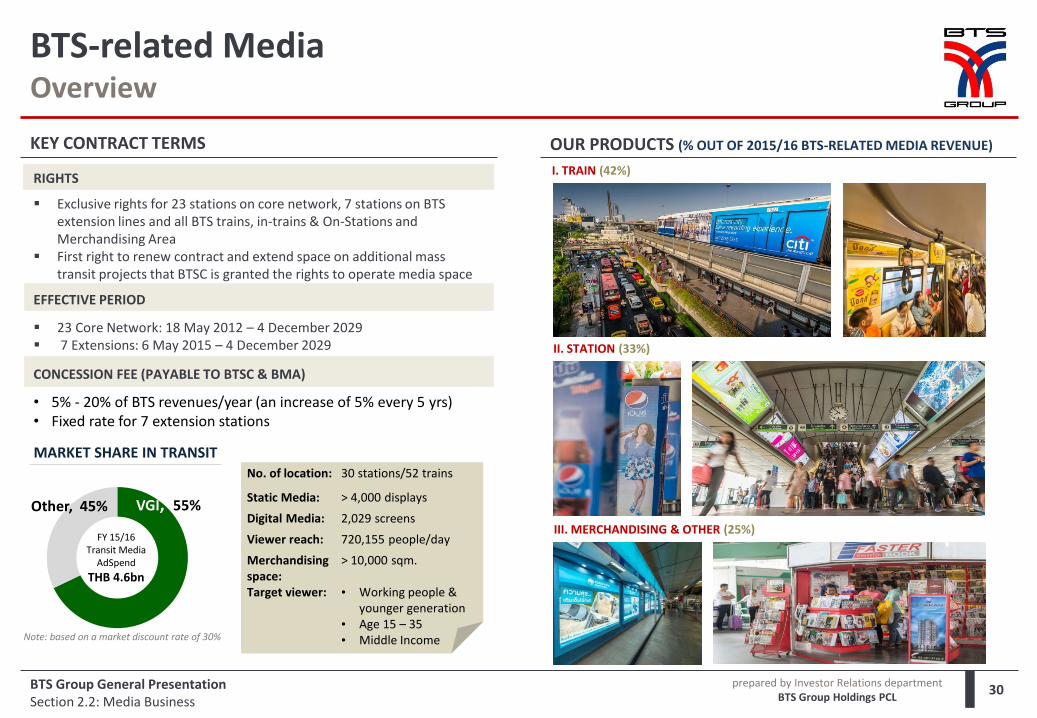
KEY CONTRACT TERMS OUR PRODUCTS (% OUT OF 2015/16 BTS-RELATED MEDIA REVENUE)
30 BTS Group General Presentation Section 2.2: Media Business
RIGHTS
Exclusive rights for 23 stations on core network, 7 stations on BTS extension lines and all BTS trains, in-trains & On-Stations and Merchandising Area
First right to renew contract and extend space on additional mass transit projects that BTSC is granted the rights to operate media space
EFFECTIVE PERIOD
23 Core Network: 18 May 2012 – 4 December 2029 7 Extensions: 6 May 2015 – 4 December 2029
CONCESSION FEE (PAYABLE TO BTSC & BMA)
• 5% - 20% of BTS revenues/year (an increase of 5% every 5 yrs) • Fixed rate for 7 extension stations
FY 15/16 Transit Media
AdSpend
THB 4.6bn
VGI, 55%
Note: based on a market discount rate of 30%
Other, 45%
MARKET SHARE IN TRANSIT No. of location: 30 stations/52 trains
Static Media: > 4,000 displays
Digital Media: 2,029 screens
Viewer reach: 720,155 people/day
Merchandising space:
> 10,000 sqm.
Target viewer: • Working people & younger generation
• Age 15 – 35 • Middle Income
I. TRAIN (42%)
II. STATION (33%)
III. MERCHANDISING & OTHER (25%)
prepared by Investor Relations department BTS Group Holdings PCL
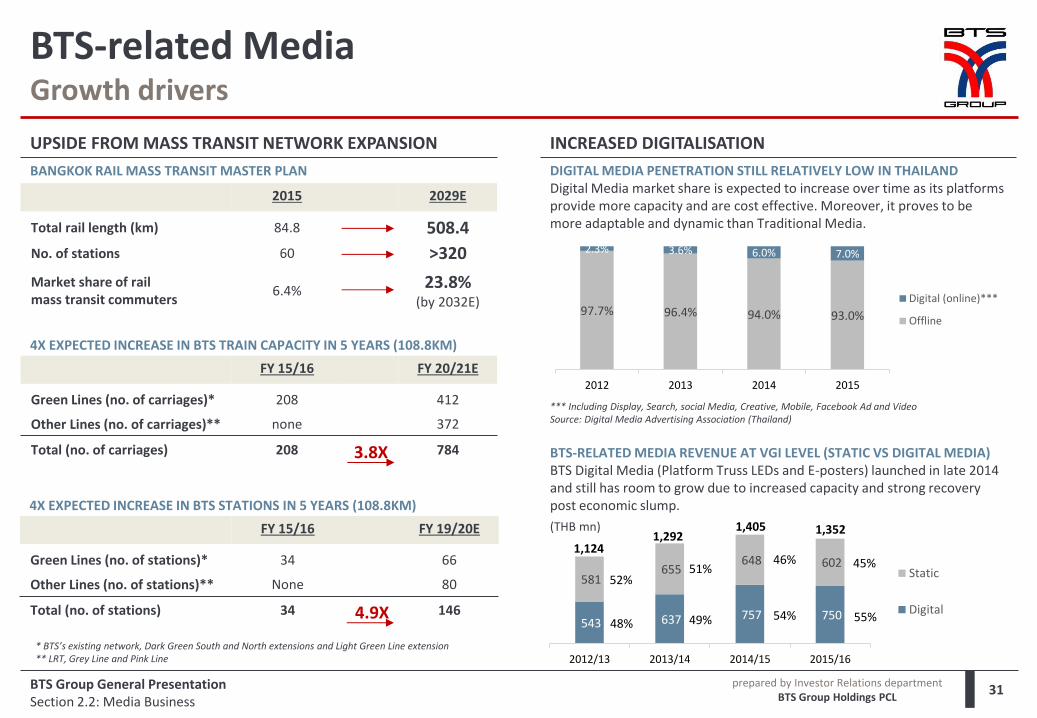
2015 2029E
Total rail length (km) 84.8 508.4
No. of stations 60 >320
Market share of rail mass transit commuters
6.4% 23.8%
(by 2032E)
UPSIDE FROM MASS TRANSIT NETWORK EXPANSION INCREASED DIGITALISATION
DIGITAL MEDIA PENETRATION STILL RELATIVELY LOW IN THAILAND Digital Media market share is expected to increase over time as its platforms provide more capacity and are cost effective. Moreover, it proves to be more adaptable and dynamic than Traditional Media.
BTS Group General Presentation Section 2.2: Media Business
31
BTS-related Media Growth drivers
4X EXPECTED INCREASE IN BTS TRAIN CAPACITY IN 5 YEARS (108.8KM)
FY 15/16 FY 20/21E
Green Lines (no. of carriages)* 208 412
Other Lines (no. of carriages)** none 372
Total (no. of carriages) 208 3.8X 784
4X EXPECTED INCREASE IN BTS STATIONS IN 5 YEARS (108.8KM)
FY 15/16 FY 19/20E
Green Lines (no. of stations)* 34 66
Other Lines (no. of stations)** None 80
Total (no. of stations) 34 4.9X 146
BANGKOK RAIL MASS TRANSIT MASTER PLAN
* BTS’s existing network, Dark Green South and North extensions and Light Green Line extension ** LRT, Grey Line and Pink Line
*** Including Display, Search, social Media, Creative, Mobile, Facebook Ad and Video Source: Digital Media Advertising Association (Thailand)
BTS-RELATED MEDIA REVENUE AT VGI LEVEL (STATIC VS DIGITAL MEDIA) BTS Digital Media (Platform Truss LEDs and E-posters) launched in late 2014 and still has room to grow due to increased capacity and strong recovery post economic slump.
97.7% 96.4% 94.0% 93.0%
2.3% 3.6% 6.0% 7.0%
2012 2013 2014 2015
Digital (online)***
Offline
(THB mn)
543 637 757 750
581 655
648 602
2012/13 2013/14 2014/15 2015/16
Static
Digital48% 49% 54%
46% 51%
52%
1,124 1,292
1,405 1,352
55%
45%
prepared by Investor Relations department BTS Group Holdings PCL
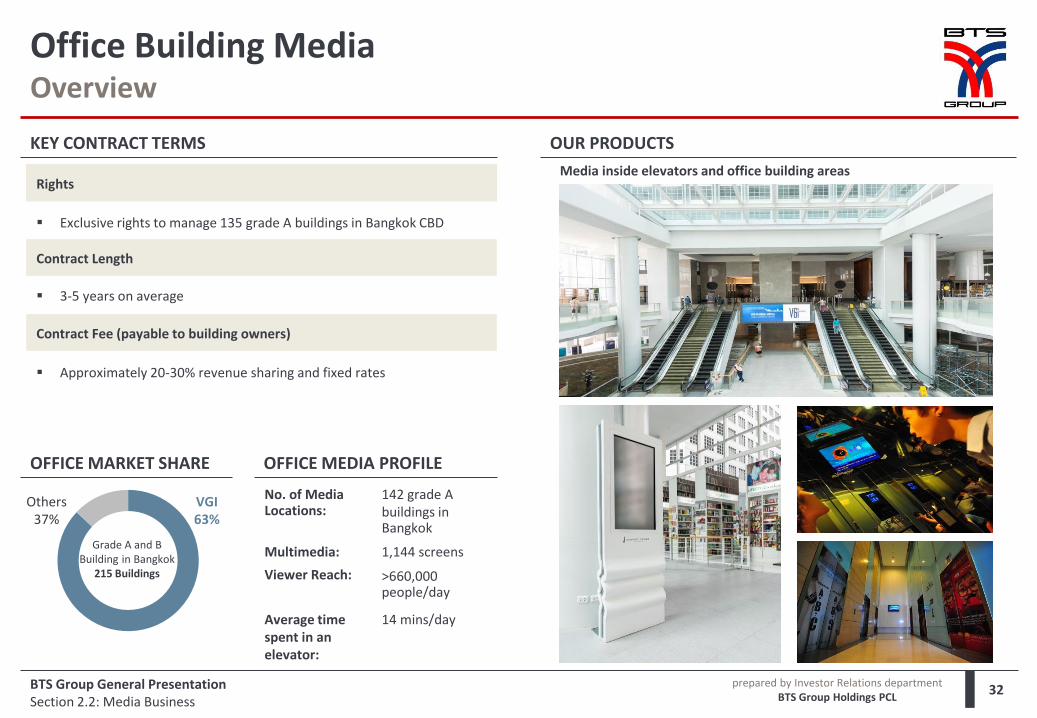
Office Building Media Overview
KEY CONTRACT TERMS OUR PRODUCTS
32
OFFICE MARKET SHARE
No. of Media Locations:
142 grade A buildings in Bangkok
Multimedia: 1,144 screens
Viewer Reach: >660,000 people/day
Average time spent in an elevator:
14 mins/day
VGI 63%
Others 37%
Grade A and B Building in Bangkok
215 Buildings
OFFICE MEDIA PROFILE
Media inside elevators and office building areas Rights
Exclusive rights to manage 135 grade A buildings in Bangkok CBD
Contract Length
3-5 years on average
Contract Fee (payable to building owners)
Approximately 20-30% revenue sharing and fixed rates
BTS Group General Presentation Section 2.2: Media Business
prepared by Investor Relations department BTS Group Holdings PCL
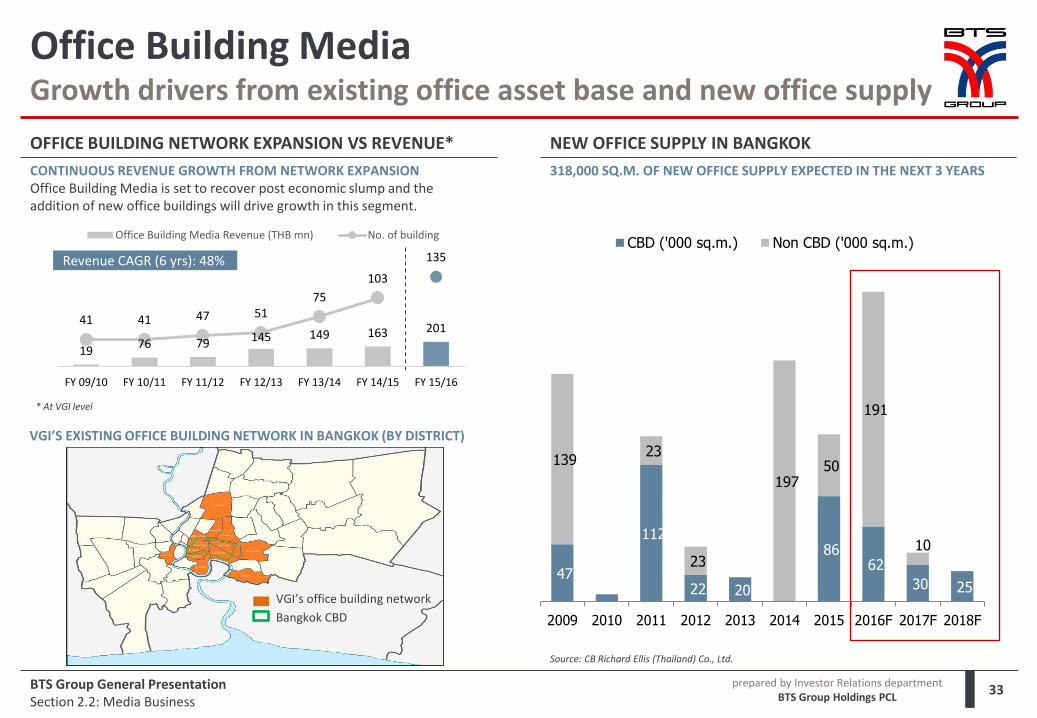
OFFICE BUILDING NETWORK EXPANSION VS REVENUE* NEW OFFICE SUPPLY IN BANGKOK
318,000 SQ.M. OF NEW OFFICE SUPPLY EXPECTED IN THE NEXT 3 YEARS
BTS Group General Presentation Section 2.2: Media Business
33
Office Building Media Growth drivers from existing office asset base and new office supply
VGI’S EXISTING OFFICE BUILDING NETWORK IN BANGKOK (BY DISTRICT)
CONTINUOUS REVENUE GROWTH FROM NETWORK EXPANSION Office Building Media is set to recover post economic slump and the addition of new office buildings will drive growth in this segment.
* At VGI level
Source: CB Richard Ellis (Thailand) Co., Ltd.
Revenue CAGR (6 yrs): 48%
VGI’s office building network
Bangkok CBD
19 76 79 145 149 163 201
41 41 47 51 75
103
135
0
50
100
150
0
200
400
600
800
FY 09/10 FY 10/11 FY 11/12 FY 12/13 FY 13/14 FY 14/15 FY 15/16
Office Building Media Revenue (THB mn) No. of building
47 6
112
22 20
-
86 62
30 25
139 23
23
197 50
191
10
2009 2010 2011 2012 2013 2014 2015 2016F 2017F 2018F
CBD ('000 sq.m.) Non CBD ('000 sq.m.)

prepared by Investor Relations department BTS Group Holdings PCL
KEY INVESTMENT AND CONTRACT DETAILS OUR PRODUCTS
34
I. Investments in MACO, AERO MEDIA & MIDAS
BTS Group General Presentation Section 2.2: Media Business
Investments
OUTDOOR MEDIA (Billboards, Street Furniture & Transit Media) 33.88% stake in Master Ad PCL (MACO; listed on SET)
AVIATION MEDIA 28% stake in Aero Media Co., Ltd. (342 screens across 13 airports)
ROADSIDE MEDIA 11.11% stake in Midas Global Media Co., Ltd. (MIDAS; non-listed)
Contracts
CHAMCHURI SQUARE (3-yr + 3-yr contract) Exclusive rights to manage media (≈127 media panels)
EMPIRE TOWER (5-yr contract) Exclusive rights to operate mega LED screens at Empire Tower
BUSES Chulalongkorn University (CU Bus): 15 buses and 15 bus stops BRT buses
Exclusive Selling Agent
ARTISTA MEDIA Manage 549 LCD screens in 219 residential buildings
THAI AIRASIA (3-yr contract with renewable rights) Manage media on 30 planes & future fleets
STREET FURNITURE (3-yr contract) Street Furniture including BTS columns and bridge columns at major
junctions across Bangkok
MEGA LEDS >200 sq.m. LEDs in Bangkok and Laos
II. Contracts and Exclusive Selling Agent
Other Media Overview
prepared by Investor Relations department BTS Group Holdings PCL
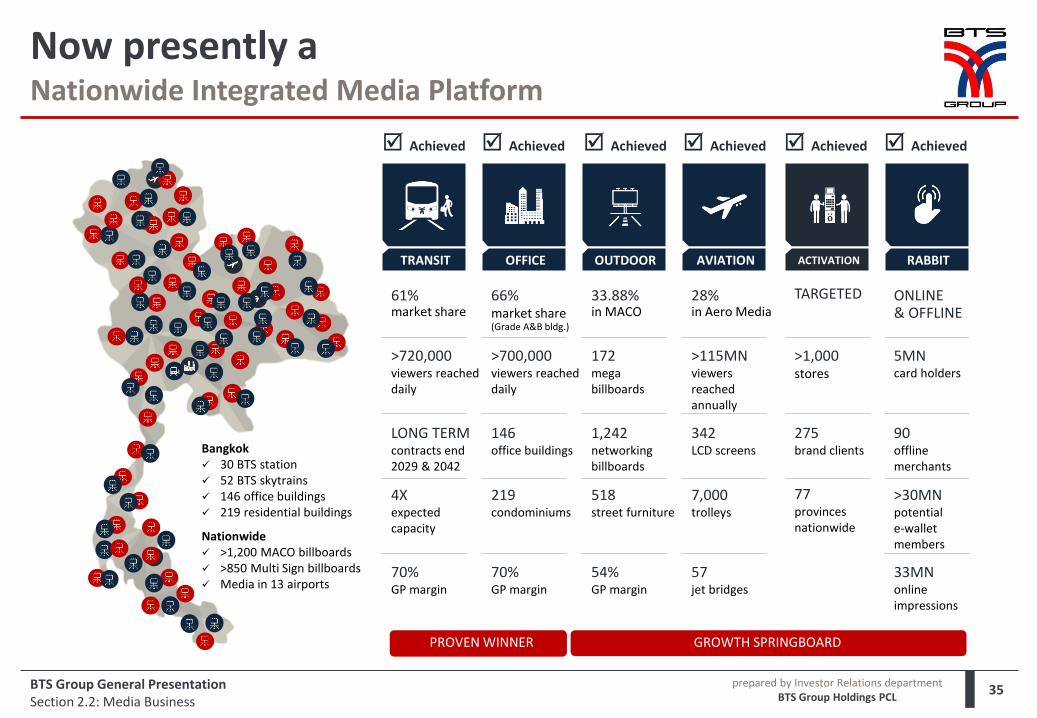
35
Now presently a Nationwide Integrated Media Platform
PROVEN WINNER GROWTH SPRINGBOARD
BTS Group General Presentation Section 2.2: Media Business
ACTIVATION TRANSIT OFFICE OUTDOOR AVIATION
61% market share
LONG TERM contracts end 2029 & 2042
70% GP margin
>720,000 viewers reached daily
4X expected capacity
66% market share (Grade A&B bldg.)
146 office buildings
70% GP margin
>700,000 viewers reached daily
219 condominiums
33.88% in MACO
1,242 networking billboards
54% GP margin
172 mega billboards
518 street furniture
28% in Aero Media
342 LCD screens
57 jet bridges
>115MN viewers reached annually
7,000 trolleys
Achieved Achieved Achieved Achieved
ONLINE & OFFLINE
5MN card holders
90 offline merchants
>30MN potential e-wallet members
33MN online impressions
Achieved
TARGETED
275 brand clients
77 provinces nationwide
>1,000 stores
Achieved
RABBIT
Bangkok 30 BTS station 52 BTS skytrains 146 office buildings 219 residential buildings
Nationwide >1,200 MACO billboards >850 Multi Sign billboards Media in 13 airports
prepared by Investor Relations department BTS Group Holdings PCL
36
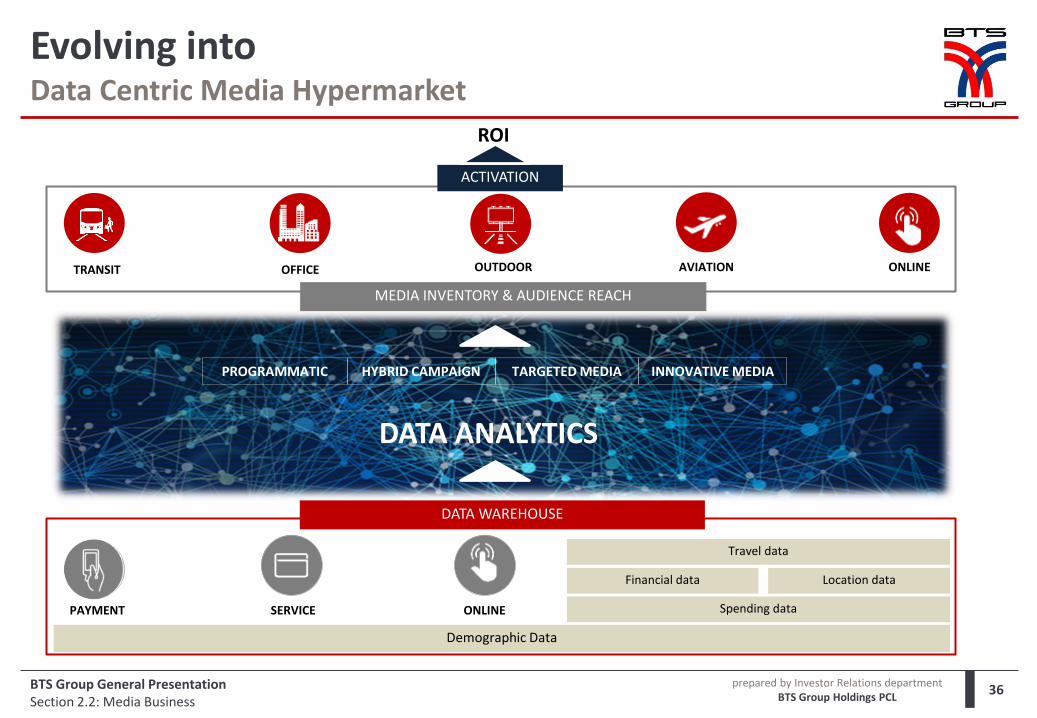
Evolving into Data Centric Media Hypermarket
BTS Group General Presentation Section 2.2: Media Business
Demographic Data
Travel data
Financial data
DATA WAREHOUSE
DATA ANALYTICS
PAYMENT SERVICE ONLINE
PROGRAMMATIC HYBRID CAMPAIGN TARGETED MEDIA INNOVATIVE MEDIA
OFFICE OUTDOOR AVIATION ONLINE TRANSIT
MEDIA INVENTORY & AUDIENCE REACH
ACTIVATION
ROI
Location data
Spending data
prepared by Investor Relations department BTS Group Holdings PCL
Section 1 BTS Group in Brief
Section 2 Business Segment Profiles
Section 2.1 Mass Transit Business
Section 2.2 Media Business
Section 2.3 Property Business
Section 2.4 Services Business
Section 3 Financial Summary
Appendices Appendix 1: Key Terms of the Core Network Concession Agreement
Appendix 2: Future Funding Requirements (Mass Transit)
Appendix 3: BTS-W3
Appendix 4: BTS Group CAPEX History
Appendix 5: BTSC’s Quality Management System
Contents
37 BTS Group General Presentation
prepared by Investor Relations department BTS Group Holdings PCL
38
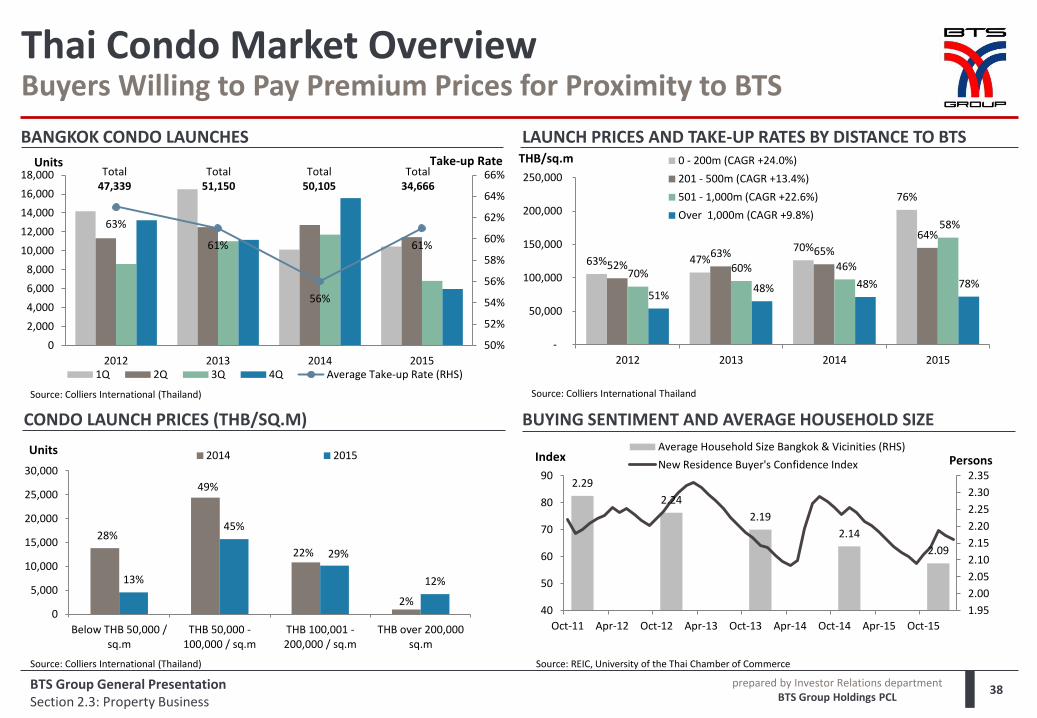
BANGKOK CONDO LAUNCHES
63%
61%
56%
61%
50%
52%
54%
56%
58%
60%
62%
64%
66%
0
2,000
4,000
6,000
8,000
10,000
12,000
14,000
16,000
18,000
2012 2013 2014 2015
Take-up Rate Units
1Q 2Q 3Q 4Q Average Take-up Rate (RHS)
Total 47,339
Total 51,150
Total 50,105
Total 34,666
CONDO LAUNCH PRICES (THB/SQ.M)
LAUNCH PRICES AND TAKE-UP RATES BY DISTANCE TO BTS
63% 47% 70%
76%
52% 63% 65%
64%
70% 60% 46%
58%
51% 48% 48% 78%
-
50,000
100,000
150,000
200,000
250,000
2012 2013 2014 2015
THB/sq.m 0 - 200m (CAGR +24.0%)
201 - 500m (CAGR +13.4%)
501 - 1,000m (CAGR +22.6%)
Over 1,000m (CAGR +9.8%)
28%
49%
22%
2%
13%
45%
29%
12%
0
5,000
10,000
15,000
20,000
25,000
30,000
Below THB 50,000 /sq.m
THB 50,000 -100,000 / sq.m
THB 100,001 -200,000 / sq.m
THB over 200,000sq.m
Units 2014 2015
BUYING SENTIMENT AND AVERAGE HOUSEHOLD SIZE
Thai Condo Market Overview Buyers Willing to Pay Premium Prices for Proximity to BTS
2.29
2.24
2.19
2.14
2.09
1.95
2.00
2.05
2.10
2.15
2.20
2.25
2.30
2.35
40
50
60
70
80
90
Oct-11 Apr-12 Oct-12 Apr-13 Oct-13 Apr-14 Oct-14 Apr-15 Oct-15
Persons Index Average Household Size Bangkok & Vicinities (RHS)
New Residence Buyer's Confidence Index
Source: Colliers International (Thailand) Source: Colliers International Thailand
Source: Colliers International (Thailand) Source: REIC, University of the Thai Chamber of Commerce
BTS Group General Presentation Section 2.3: Property Business
prepared by Investor Relations department BTS Group Holdings PCL
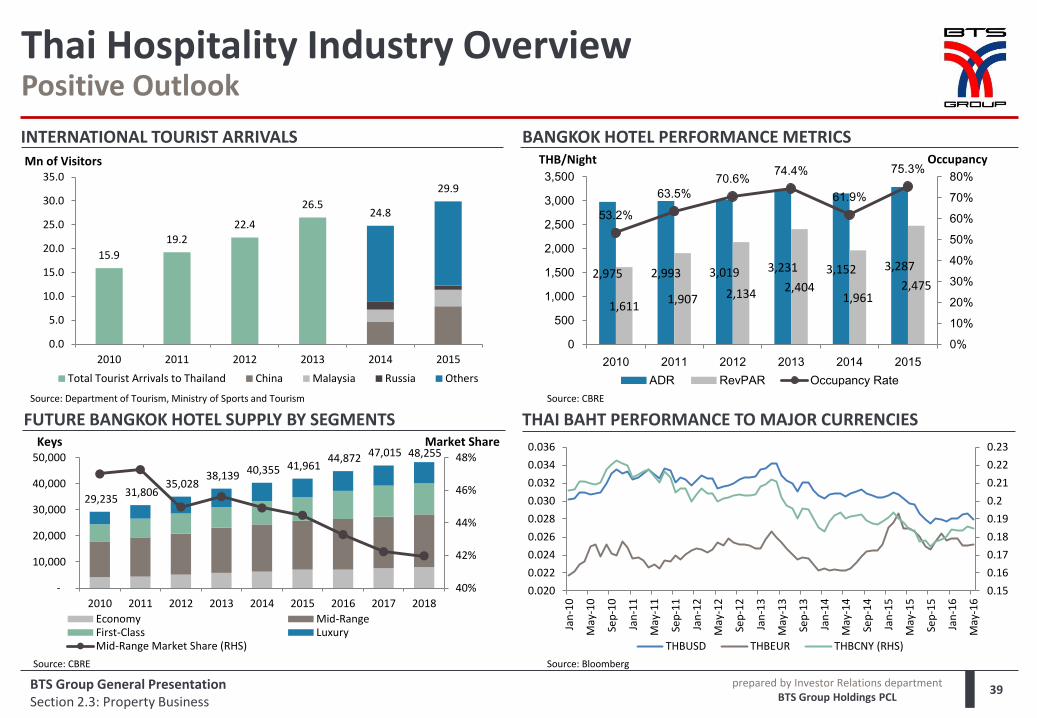
2,975 2,993 3,019 3,231 3,152 3,287
1,611 1,907 2,134 2,404
1,961 2,475
53.2%
63.5% 70.6%
74.4%
61.9%
75.3%
0%
10%
20%
30%
40%
50%
60%
70%
80%
0
500
1,000
1,500
2,000
2,500
3,000
3,500
2010 2011 2012 2013 2014 2015
Occupancy THB/Night
ADR RevPAR Occupancy Rate
39
INTERNATIONAL TOURIST ARRIVALS
FUTURE BANGKOK HOTEL SUPPLY BY SEGMENTS
BANGKOK HOTEL PERFORMANCE METRICS
THAI BAHT PERFORMANCE TO MAJOR CURRENCIES
Thai Hospitality Industry Overview Positive Outlook
15.9
19.2 22.4
26.5 24.8
29.9
0.0
5.0
10.0
15.0
20.0
25.0
30.0
35.0
2010 2011 2012 2013 2014 2015
Mn of Visitors
Total Tourist Arrivals to Thailand China Malaysia Russia Others
29,235 31,806
35,028 38,139 40,355 41,961
44,872 47,015 48,255
40%
42%
44%
46%
48%
-
10,000
20,000
30,000
40,000
50,000
2010 2011 2012 2013 2014 2015 2016 2017 2018
Market Share Keys
Economy Mid-RangeFirst-Class LuxuryMid-Range Market Share (RHS)
Source: Department of Tourism, Ministry of Sports and Tourism Source: CBRE
Source: Bloomberg Source: CBRE
BTS Group General Presentation Section 2.3: Property Business
0.15
0.16
0.17
0.18
0.19
0.2
0.21
0.22
0.23
0.020
0.022
0.024
0.026
0.028
0.030
0.032
0.034
0.036
Jan
-10
May
-10
Sep
-10
Jan
-11
May
-11
Sep
-11
Jan
-12
May
-12
Sep
-12
Jan
-13
May
-13
Sep
-13
Jan
-14
May
-14
Sep
-14
Jan
-15
May
-15
Sep
-15
Jan
-16
May
-16
THBUSD THBEUR THBCNY (RHS)
prepared by Investor Relations department BTS Group Holdings PCL
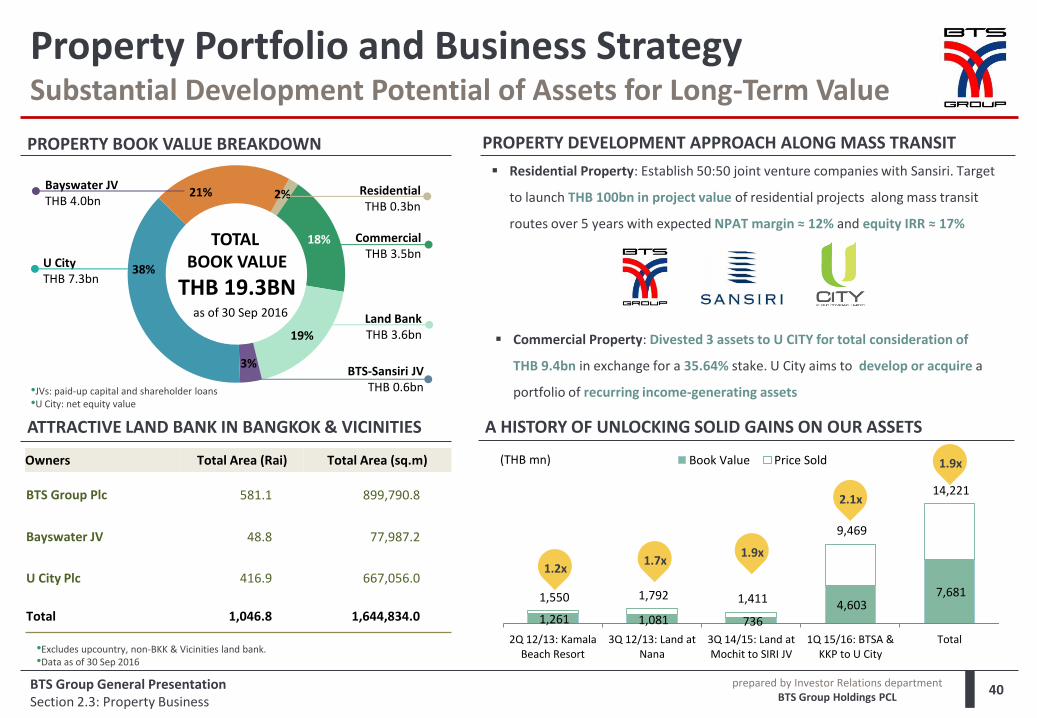
2%
18%
19%
3%
38%
21%
Property Portfolio and Business Strategy Substantial Development Potential of Assets for Long-Term Value
40
PROPERTY BOOK VALUE BREAKDOWN PROPERTY DEVELOPMENT APPROACH ALONG MASS TRANSIT
Owners Total Area (Rai) Total Area (sq.m)
BTS Group Plc 581.1 899,790.8
Bayswater JV 48.8 77,987.2
U City Plc 416.9 667,056.0
Total 1,046.8 1,644,834.0
•Excludes upcountry, non-BKK & Vicinities land bank. •Data as of 30 Sep 2016
TOTAL BOOK VALUE
THB 19.3BN
ATTRACTIVE LAND BANK IN BANGKOK & VICINITIES
BTS Group General Presentation Section 2.3: Property Business
U City THB 7.3bn
Commercial THB 3.5bn
Residential THB 0.3bn
Land Bank THB 3.6bn
BTS-Sansiri JV THB 0.6bn
A HISTORY OF UNLOCKING SOLID GAINS ON OUR ASSETS
Residential Property: Establish 50:50 joint venture companies with Sansiri. Target
to launch THB 100bn in project value of residential projects along mass transit
routes over 5 years with expected NPAT margin ≈ 12% and equity IRR ≈ 17%
Commercial Property: Divested 3 assets to U CITY for total consideration of
THB 9.4bn in exchange for a 35.64% stake. U City aims to develop or acquire a
portfolio of recurring income-generating assets
1,261 1,081 736 4,603
7,681 1,550 1,792 1,411
9,469
14,221
2Q 12/13: KamalaBeach Resort
3Q 12/13: Land atNana
3Q 14/15: Land atMochit to SIRI JV
1Q 15/16: BTSA &KKP to U City
Total
Book Value Price Sold
1.2x 1.7x
1.9x
2.1x
(THB mn) 1.9x
as of 30 Sep 2016
Bayswater JV THB 4.0bn
•JVs: paid-up capital and shareholder loans •U City: net equity value
prepared by Investor Relations department BTS Group Holdings PCL
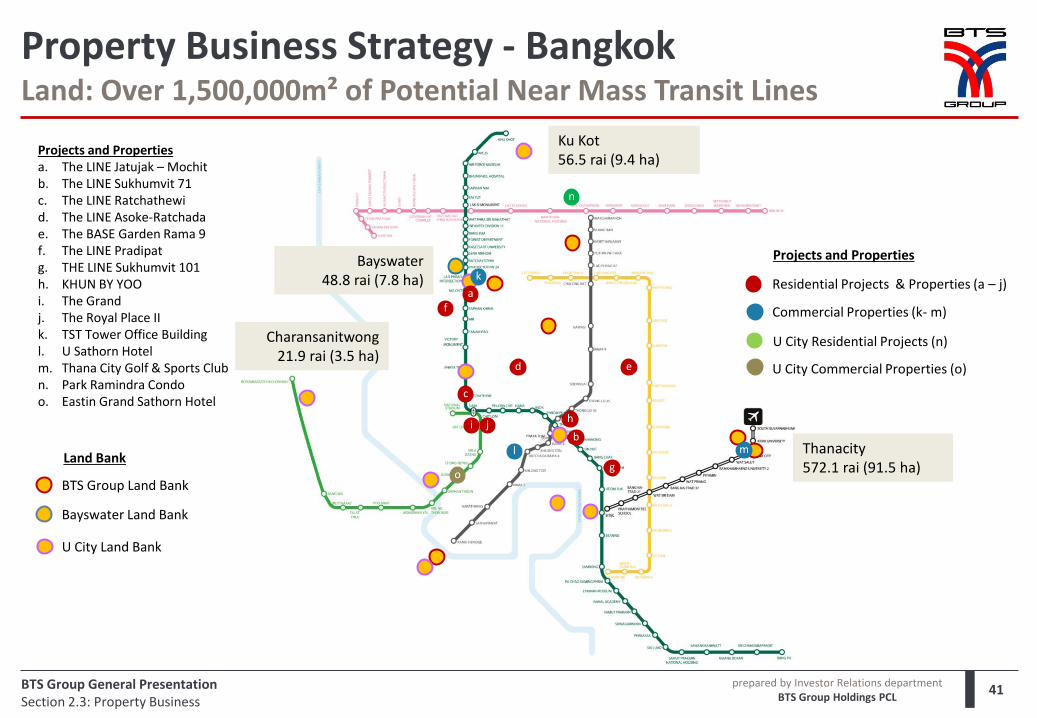
Property Business Strategy - Bangkok Land: Over 1,500,000m² of Potential Near Mass Transit Lines
BTS Group General Presentation Section 2.3: Property Business
n
a
b
c
k
i j
l m
o
Projects and Properties a. The LINE Jatujak – Mochit b. The LINE Sukhumvit 71 c. The LINE Ratchathewi d. The LINE Asoke-Ratchada e. The BASE Garden Rama 9 f. The LINE Pradipat g. THE LINE Sukhumvit 101 h. KHUN BY YOO i. The Grand j. The Royal Place II k. TST Tower Office Building l. U Sathorn Hotel m. Thana City Golf & Sports Club n. Park Ramindra Condo o. Eastin Grand Sathorn Hotel
BTS Group Land Bank
U City Land Bank
Bayswater Land Bank
Commercial Properties (k- m)
Residential Projects & Properties (a – j)
U City Commercial Properties (o)
U City Residential Projects (n)
Projects and Properties
Land Bank
d
41
e
f
g
h
Ku Kot 56.5 rai (9.4 ha)
Bayswater 48.8 rai (7.8 ha)
Thanacity 572.1 rai (91.5 ha)
Charansanitwong 21.9 rai (3.5 ha)
prepared by Investor Relations department BTS Group Holdings PCL
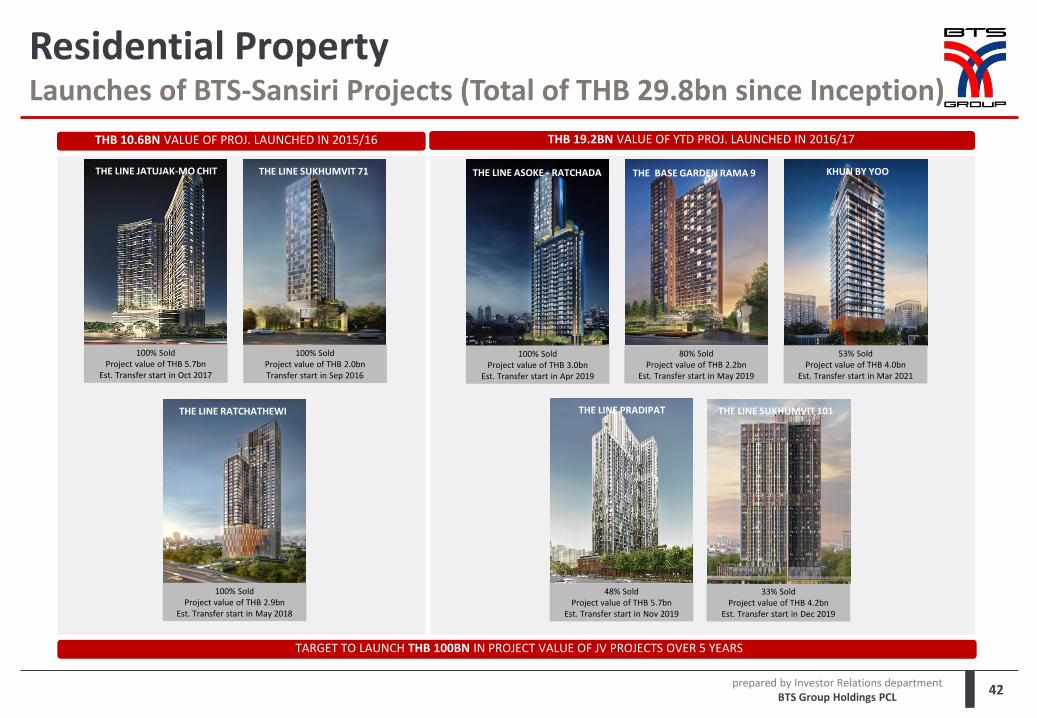
Residential Property Launches of BTS-Sansiri Projects (Total of THB 29.8bn since Inception)
42
THE LINE SUKHUMVIT 71
100% Sold Project value of THB 2.0bn Transfer start in Sep 2016
THE LINE JATUJAK-MO CHIT
100% Sold Project value of THB 5.7bn
Est. Transfer start in Oct 2017
THE LINE RATCHATHEWI
100% Sold Project value of THB 2.9bn
Est. Transfer start in May 2018
53% Sold Project value of THB 4.0bn
Est. Transfer start in Mar 2021
KHUN BY YOO
48% Sold Project value of THB 5.7bn
Est. Transfer start in Nov 2019
THE LINE PRADIPAT
33% Sold Project value of THB 4.2bn
Est. Transfer start in Dec 2019
THE LINE SUKHUMVIT 101
THB 10.6BN VALUE OF PROJ. LAUNCHED IN 2015/16 THB 19.2BN VALUE OF YTD PROJ. LAUNCHED IN 2016/17
THE BASE GARDEN RAMA 9
80% Sold Project value of THB 2.2bn
Est. Transfer start in May 2019
THE LINE ASOKE - RATCHADA
100% Sold Project value of THB 3.0bn
Est. Transfer start in Apr 2019
TARGET TO LAUNCH THB 100BN IN PROJECT VALUE OF JV PROJECTS OVER 5 YEARS
prepared by Investor Relations department BTS Group Holdings PCL
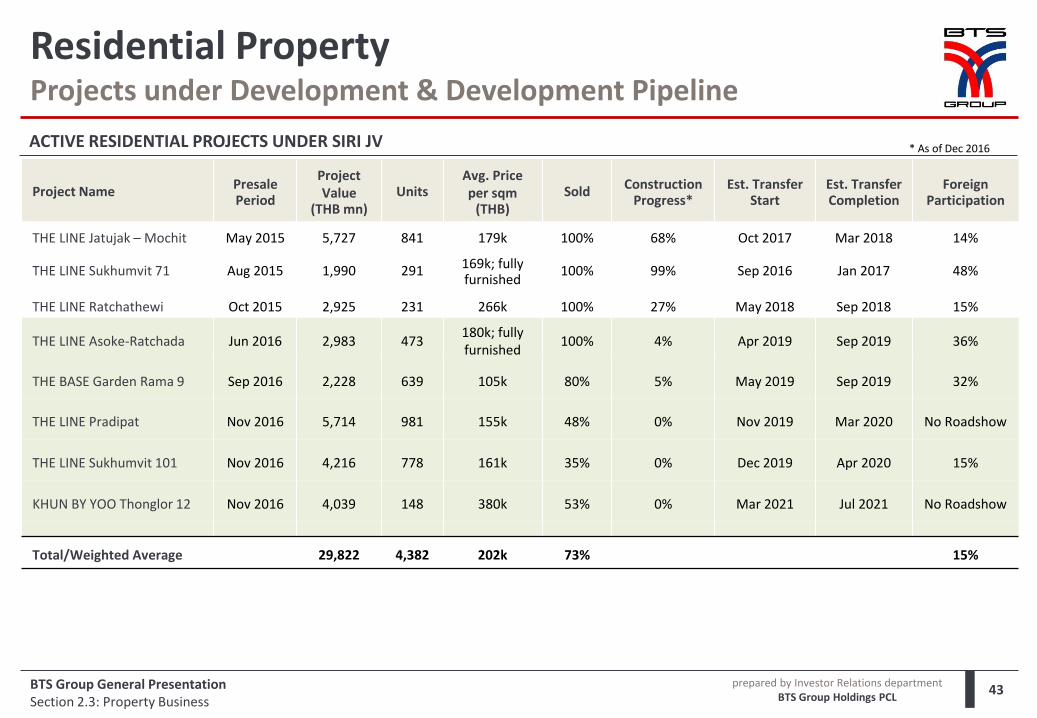
Project Name Presale Period
Project Value
(THB mn) Units
Avg. Price per sqm
(THB) Sold Construction
Progress* Est. Transfer
Start Est. Transfer Completion
Foreign Participation
THE LINE Jatujak – Mochit May 2015 5,727 841 179k 100% 68% Oct 2017 Mar 2018 14%
THE LINE Sukhumvit 71 Aug 2015 1,990 291 169k; fully furnished
100% 99% Sep 2016 Jan 2017 48%
THE LINE Ratchathewi Oct 2015 2,925 231 266k 100% 27% May 2018 Sep 2018 15%
THE LINE Asoke-Ratchada Jun 2016 2,983 473 180k; fully furnished
100% 4% Apr 2019 Sep 2019 36%
THE BASE Garden Rama 9 Sep 2016 2,228 639 105k 80% 5% May 2019 Sep 2019 32%
THE LINE Pradipat Nov 2016 5,714 981 155k 48% 0% Nov 2019 Mar 2020 No Roadshow
THE LINE Sukhumvit 101 Nov 2016 4,216 778 161k 35% 0% Dec 2019 Apr 2020 15%
KHUN BY YOO Thonglor 12 Nov 2016 4,039 148 380k 53% 0% Mar 2021 Jul 2021 No Roadshow
Total/Weighted Average 29,822 4,382 202k 73% 15%
Residential Property Projects under Development & Development Pipeline
43 BTS Group General Presentation Section 2.3: Property Business
ACTIVE RESIDENTIAL PROJECTS UNDER SIRI JV * As of Dec 2016
prepared by Investor Relations department BTS Group Holdings PCL
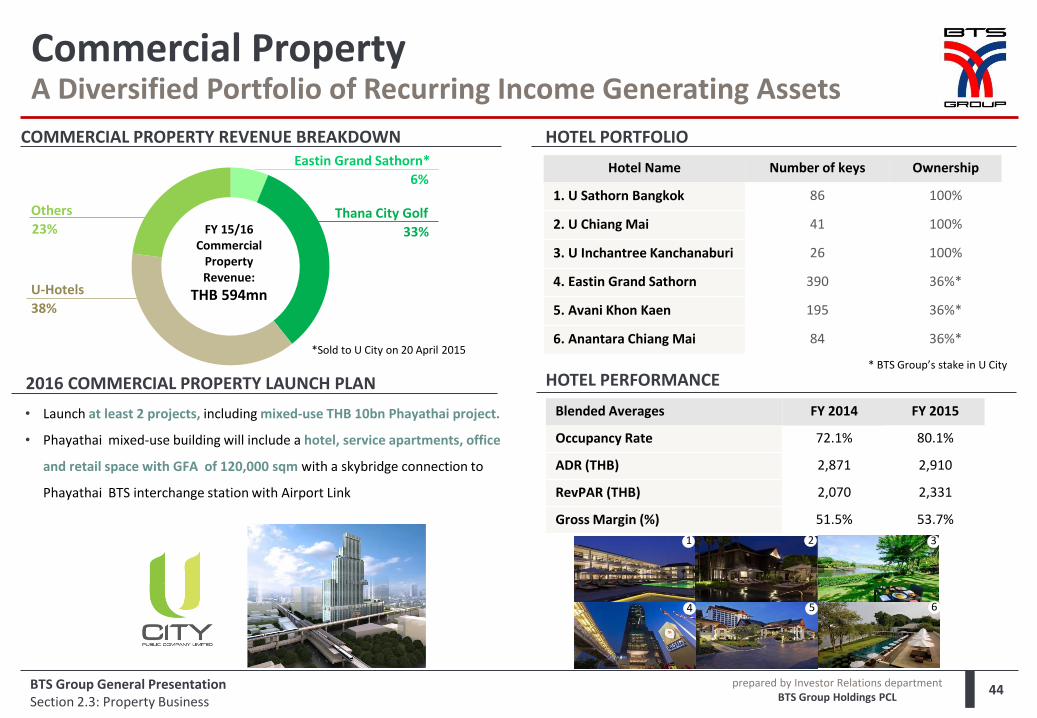
• Launch at least 2 projects, including mixed-use THB 10bn Phayathai project.
• Phayathai mixed-use building will include a hotel, service apartments, office
and retail space with GFA of 120,000 sqm with a skybridge connection to
Phayathai BTS interchange station with Airport Link
44
COMMERCIAL PROPERTY REVENUE BREAKDOWN HOTEL PORTFOLIO
BTS Group General Presentation Section 2.3: Property Business
Hotel Name Number of keys Ownership
1. U Sathorn Bangkok 86 100%
2. U Chiang Mai 41 100%
3. U Inchantree Kanchanaburi 26 100%
4. Eastin Grand Sathorn 390 36%*
5. Avani Khon Kaen 195 36%*
6. Anantara Chiang Mai 84 36%*
Blended Averages FY 2014 FY 2015
Occupancy Rate 72.1% 80.1%
ADR (THB) 2,871 2,910
RevPAR (THB) 2,070 2,331
Gross Margin (%) 51.5% 53.7%
HOTEL PERFORMANCE * BTS Group’s stake in U City
*Sold to U City on 20 April 2015
1 2 3
4 5 6
2016 COMMERCIAL PROPERTY LAUNCH PLAN
Commercial Property A Diversified Portfolio of Recurring Income Generating Assets
Others 23%
U-Hotels 38%
Thana City Golf 33% FY 15/16
Commercial Property Revenue:
THB 594mn
Eastin Grand Sathorn* 6%
prepared by Investor Relations department BTS Group Holdings PCL
Section 1 BTS Group in Brief
Section 2 Business Segment Profiles
Section 2.1 Mass Transit Business
Section 2.2 Media Business
Section 2.3 Property Business
Section 2.4 Services Business
Section 3 Financial Summary
Appendices Appendix 1: Key Terms of the Core Network Concession Agreement
Appendix 2: Future Funding Requirements (Mass Transit)
Appendix 3: BTS-W3
Appendix 4: BTS Group CAPEX History
Appendix 5: BTSC’s Quality Management System
Contents
45 BTS Group General Presentation
prepared by Investor Relations department BTS Group Holdings PCL
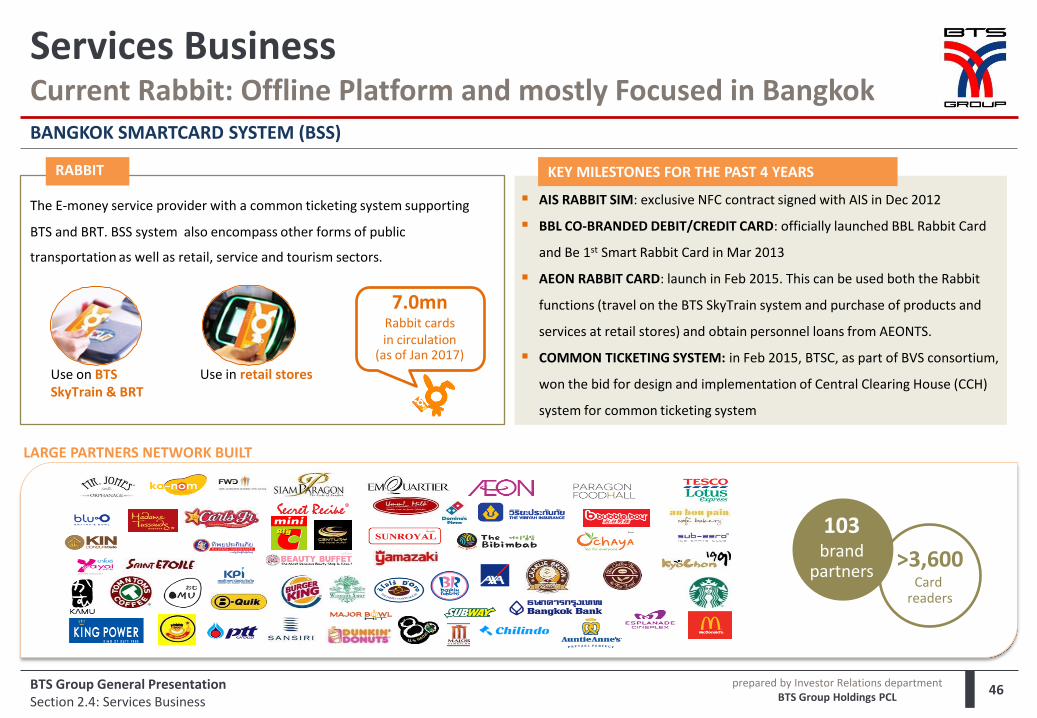
Services Business Current Rabbit: Offline Platform and mostly Focused in Bangkok
46
BANGKOK SMARTCARD SYSTEM (BSS)
The E-money service provider with a common ticketing system supporting
BTS and BRT. BSS system also encompass other forms of public
transportation as well as retail, service and tourism sectors.
RABBIT
Use on BTS SkyTrain & BRT
Use in retail stores
7.0mn Rabbit cards in circulation
(as of Jan 2017)
BTS Group General Presentation Section 2.4: Services Business
LARGE PARTNERS NETWORK BUILT
103 brand
partners >3,600 Card
readers
AIS RABBIT SIM: exclusive NFC contract signed with AIS in Dec 2012
BBL CO-BRANDED DEBIT/CREDIT CARD: officially launched BBL Rabbit Card
and Be 1st Smart Rabbit Card in Mar 2013
AEON RABBIT CARD: launch in Feb 2015. This can be used both the Rabbit
functions (travel on the BTS SkyTrain system and purchase of products and
services at retail stores) and obtain personnel loans from AEONTS.
COMMON TICKETING SYSTEM: in Feb 2015, BTSC, as part of BVS consortium,
won the bid for design and implementation of Central Clearing House (CCH)
system for common ticketing system
KEY MILESTONES FOR THE PAST 4 YEARS
prepared by Investor Relations department BTS Group Holdings PCL
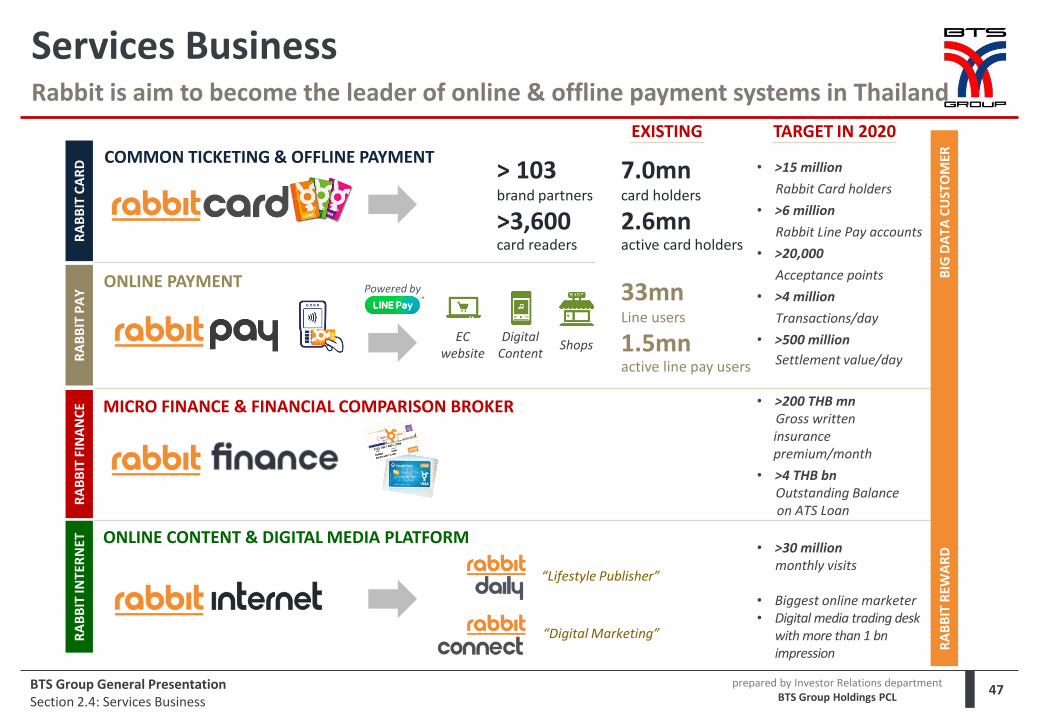
47
ONLINE PAYMENT
MICRO FINANCE & FINANCIAL COMPARISON BROKER
ONLINE CONTENT & DIGITAL MEDIA PLATFORM
RA
BB
IT C
AR
D
RA
BB
IT P
AY
R
AB
BIT
FIN
AN
CE
RA
BB
IT IN
TER
NET
COMMON TICKETING & OFFLINE PAYMENT • >15 million
Rabbit Card holders
• >6 million
Rabbit Line Pay accounts
• >20,000
Acceptance points
• >4 million
Transactions/day
• >500 million
Settlement value/day
• >200 THB mn Gross written
insurance premium/month
• >4 THB bn Outstanding Balance
on ATS Loan
“Lifestyle Publisher”
“Digital Marketing”
• >30 million monthly visits
• Biggest online marketer • Digital media trading desk
with more than 1 bn impression
RA
BB
IT R
EWA
RD
B
IG D
ATA
CU
STO
MER
Powered by
EC website
Digital Content
Shops
7.0mn card holders
2.6mn active card holders
33mn Line users
1.5mn active line pay users
EXISTING TARGET IN 2020
> 103 brand partners
>3,600 card readers
Rabbit is aim to become the leader of online & offline payment systems in Thailand
Services Business
BTS Group General Presentation Section 2.4: Services Business
prepared by Investor Relations department BTS Group Holdings PCL
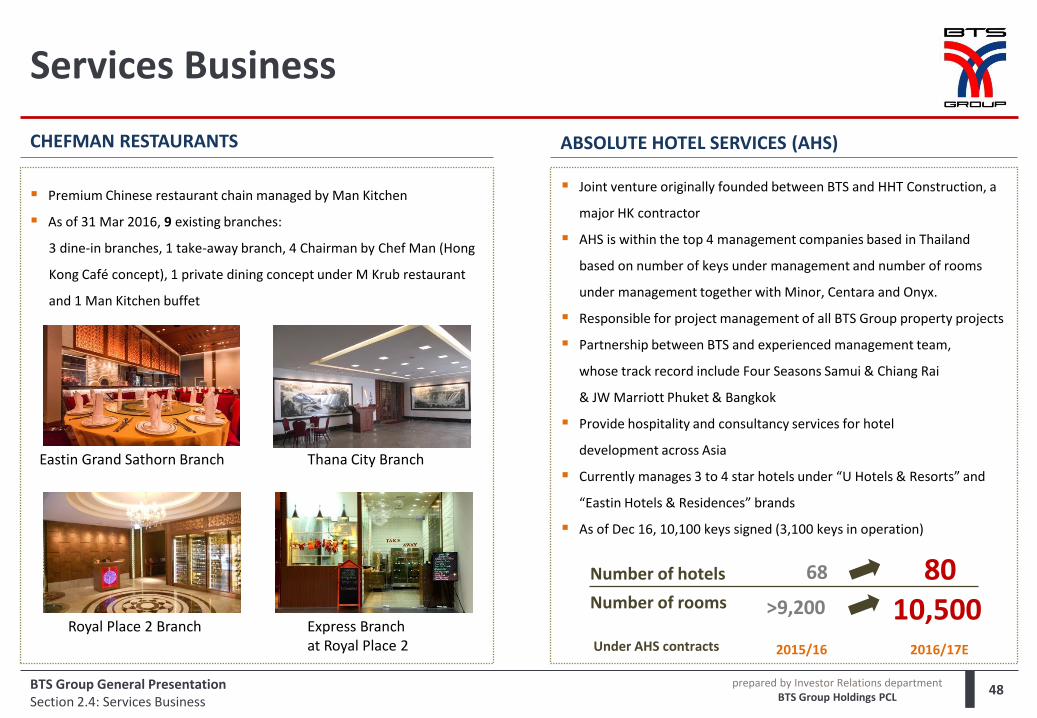
Thana City Branch
Services Business
48
Premium Chinese restaurant chain managed by Man Kitchen
As of 31 Mar 2016, 9 existing branches:
3 dine-in branches, 1 take-away branch, 4 Chairman by Chef Man (Hong
Kong Café concept), 1 private dining concept under M Krub restaurant
and 1 Man Kitchen buffet
Joint venture originally founded between BTS and HHT Construction, a
major HK contractor
AHS is within the top 4 management companies based in Thailand
based on number of keys under management and number of rooms
under management together with Minor, Centara and Onyx.
Responsible for project management of all BTS Group property projects
Partnership between BTS and experienced management team,
whose track record include Four Seasons Samui & Chiang Rai
& JW Marriott Phuket & Bangkok
Provide hospitality and consultancy services for hotel
development across Asia
Currently manages 3 to 4 star hotels under “U Hotels & Resorts” and
“Eastin Hotels & Residences” brands
As of Dec 16, 10,100 keys signed (3,100 keys in operation)
Number of hotels 68 80 Number of rooms >9,200 10,500 Under AHS contracts 2015/16 2016/17E
CHEFMAN RESTAURANTS ABSOLUTE HOTEL SERVICES (AHS)
Eastin Grand Sathorn Branch
Express Branch at Royal Place 2
Royal Place 2 Branch
BTS Group General Presentation Section 2.4: Services Business
prepared by Investor Relations department BTS Group Holdings PCL
Section 1 BTS Group in Brief
Section 2 Business Segment Profiles
Section 2.1 Mass Transit Business
Section 2.2 Media Business
Section 2.3 Property Business
Section 2.4 Services Business
Section 3 Financial Summary
Appendices Appendix 1: Key Terms of the Core Network Concession Agreement
Appendix 2: Future Funding Requirements (Mass Transit)
Appendix 3: BTS-W3
Appendix 4: BTS Group CAPEX History
Appendix 5: BTSC’s Quality Management System
Contents
49 BTS Group General Presentation
prepared by Investor Relations department BTS Group Holdings PCL
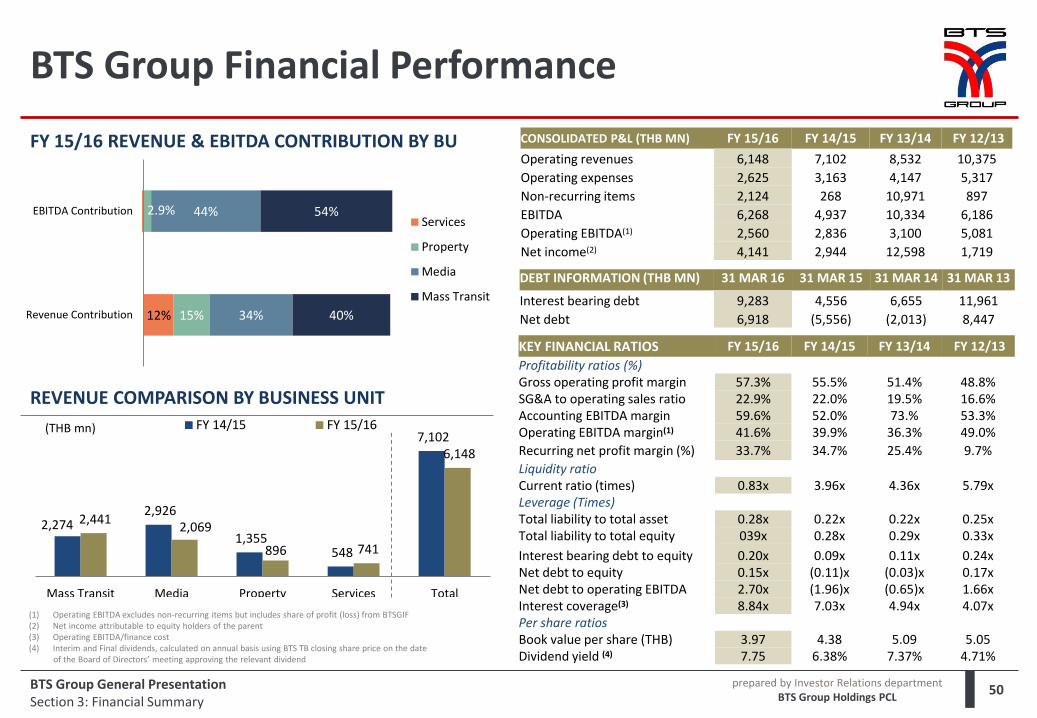
KEY FINANCIAL RATIOS FY 15/16 FY 14/15 FY 13/14 FY 12/13
Profitability ratios (%) Gross operating profit margin 57.3% 55.5% 51.4% 48.8% SG&A to operating sales ratio 22.9% 22.0% 19.5% 16.6% Accounting EBITDA margin 59.6% 52.0% 73.% 53.3% Operating EBITDA margin(1) 41.6% 39.9% 36.3% 49.0%
Recurring net profit margin (%) 33.7% 34.7% 25.4% 9.7%
Liquidity ratio Current ratio (times) 0.83x 3.96x 4.36x 5.79x Leverage (Times) Total liability to total asset 0.28x 0.22x 0.22x 0.25x Total liability to total equity 039x 0.28x 0.29x 0.33x
Interest bearing debt to equity 0.20x 0.09x 0.11x 0.24x Net debt to equity 0.15x (0.11)x (0.03)x 0.17x Net debt to operating EBITDA 2.70x (1.96)x (0.65)x 1.66x Interest coverage(3) 8.84x 7.03x 4.94x 4.07x Per share ratios Book value per share (THB) 3.97 4.38 5.09 5.05 Dividend yield (4) 7.75 6.38% 7.37% 4.71%
FY 15/16 REVENUE & EBITDA CONTRIBUTION BY BU
(1) Operating EBITDA excludes non-recurring items but includes share of profit (loss) from BTSGIF (2) Net income attributable to equity holders of the parent (3) Operating EBITDA/finance cost (4) Interim and Final dividends, calculated on annual basis using BTS TB closing share price on the date
of the Board of Directors’ meeting approving the relevant dividend
REVENUE COMPARISON BY BUSINESS UNIT
50
(THB mn)
CONSOLIDATED P&L (THB MN) FY 15/16 FY 14/15 FY 13/14 FY 12/13
Operating revenues 6,148 7,102 8,532 10,375
Operating expenses 2,625 3,163 4,147 5,317
Non-recurring items 2,124 268 10,971 897
EBITDA 6,268 4,937 10,334 6,186
Operating EBITDA(1) 2,560 2,836 3,100 5,081
Net income(2) 4,141 2,944 12,598 1,719
DEBT INFORMATION (THB MN) 31 MAR 16 31 MAR 15 31 MAR 14 31 MAR 13
Interest bearing debt 9,283 4,556 6,655 11,961
Net debt 6,918 (5,556) (2,013) 8,447
BTS Group General Presentation Section 3: Financial Summary
BTS Group Financial Performance
12% 15%
2.9%
34%
44%
40%
54%
Revenue Contribution
EBITDA ContributionServices
Property
Media
Mass Transit
2,274 2,926
1,355 548
7,102
2,441 2,069
896 741
6,148
Mass Transit Media Property Services Total
FY 14/15 FY 15/16
prepared by Investor Relations department BTS Group Holdings PCL
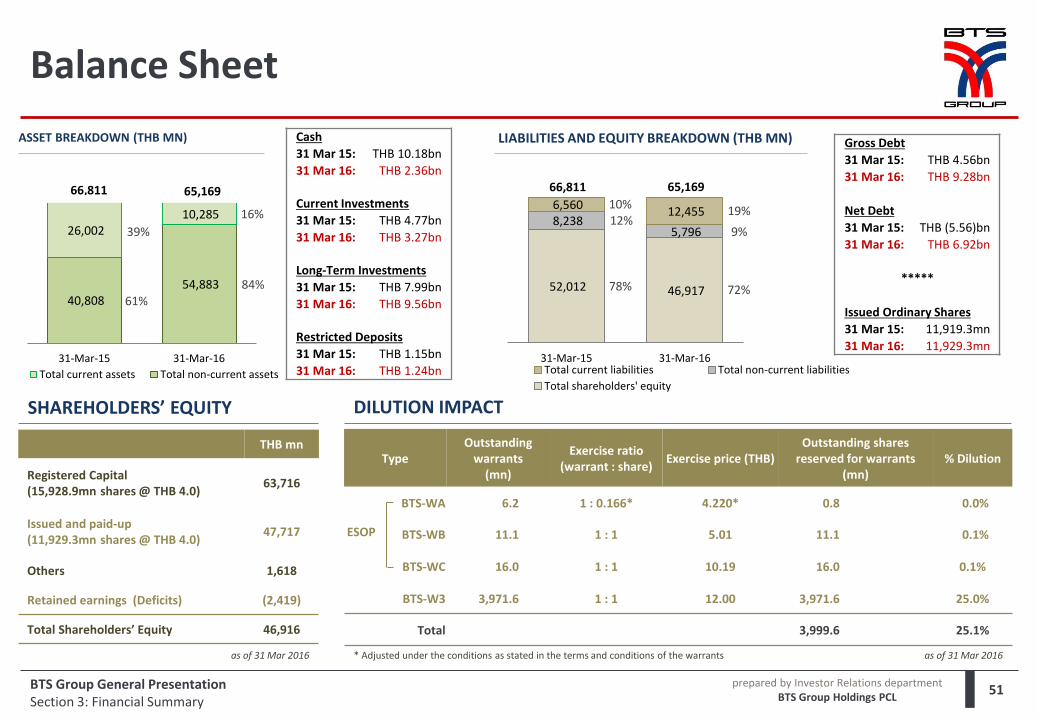
THB mn
Registered Capital (15,928.9mn shares @ THB 4.0)
63,716
Issued and paid-up (11,929.3mn shares @ THB 4.0)
47,717
Others 1,618
Retained earnings (Deficits) (2,419)
Total Shareholders’ Equity 46,916
Type Outstanding
warrants (mn)
Exercise ratio (warrant : share)
Exercise price (THB) Outstanding shares
reserved for warrants (mn)
% Dilution
BTS-WA 6.2 1 : 0.166* 4.220* 0.8 0.0%
BTS-WB 11.1 1 : 1 5.01 11.1 0.1%
BTS-WC 16.0 1 : 1 10.19 16.0 0.1%
BTS-W3 3,971.6 1 : 1 12.00 3,971.6 25.0%
Total 3,999.6 25.1%
SHAREHOLDERS’ EQUITY
as of 31 Mar 2016
Balance Sheet
51
* Adjusted under the conditions as stated in the terms and conditions of the warrants
DILUTION IMPACT
as of 31 Mar 2016
ESOP
BTS Group General Presentation Section 3: Financial Summary
40,808 54,883
26,002 10,285
31-Mar-15 31-Mar-16
Total current assets Total non-current assets
66,811 65,169
52,012 46,917
8,238 5,796
6,560 12,455
31-Mar-15 31-Mar-16Total current liabilities Total non-current liabilities
Total shareholders' equity
Cash
31 Mar 15: THB 10.18bn
31 Mar 16: THB 2.36bn
Current Investments
31 Mar 15: THB 4.77bn
31 Mar 16: THB 3.27bn
Long-Term Investments
31 Mar 15: THB 7.99bn
31 Mar 16: THB 9.56bn
Restricted Deposits
31 Mar 15: THB 1.15bn
31 Mar 16: THB 1.24bn
Gross Debt
31 Mar 15: THB 4.56bn
31 Mar 16: THB 9.28bn
Net Debt
31 Mar 15: THB (5.56)bn
31 Mar 16: THB 6.92bn
*****
Issued Ordinary Shares
31 Mar 15: 11,919.3mn
31 Mar 16: 11,929.3mn
61%
39% 16%
84%
19%
72%
9%
78%
10% 12%
66,811 65,169
ASSET BREAKDOWN (THB MN)
LIABILITIES AND EQUITY BREAKDOWN (THB MN)
prepared by Investor Relations department BTS Group Holdings PCL
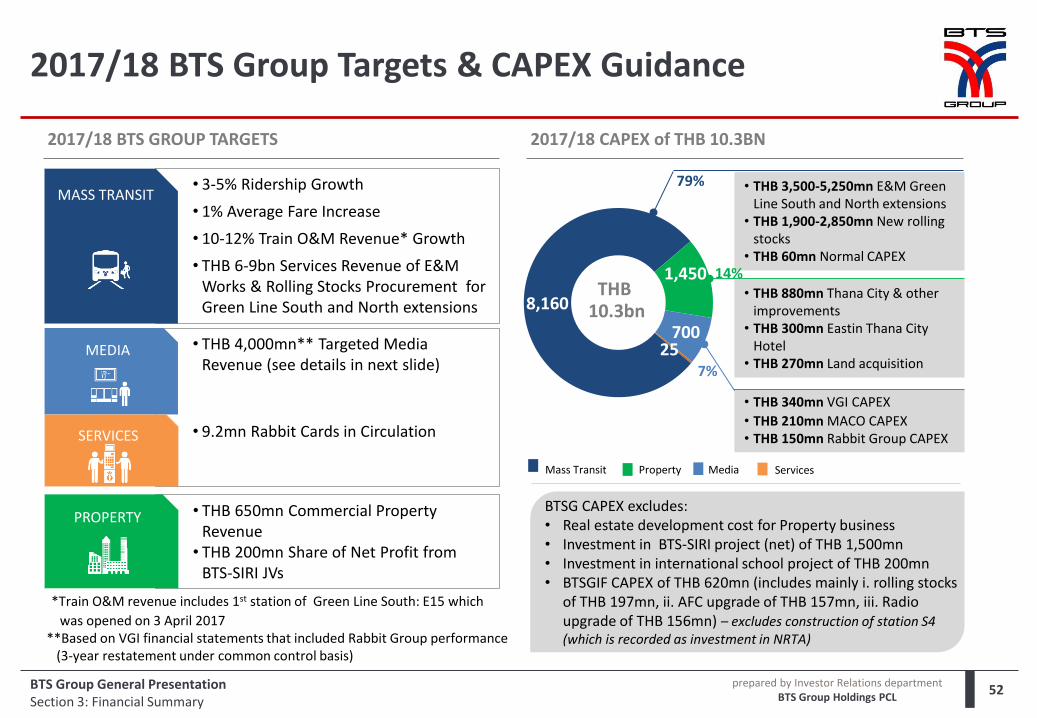
2017/18 BTS Group Targets & CAPEX Guidance
52 BTS Group General Presentation Section 3: Financial Summary
8,160
1,450
700 25
2017/18 CAPEX of THB 10.3BN
BTSG CAPEX excludes: • Real estate development cost for Property business • Investment in BTS-SIRI project (net) of THB 1,500mn • Investment in international school project of THB 200mn • BTSGIF CAPEX of THB 620mn (includes mainly i. rolling stocks
of THB 197mn, ii. AFC upgrade of THB 157mn, iii. Radio upgrade of THB 156mn) – excludes construction of station S4 (which is recorded as investment in NRTA)
2017/18 BTS GROUP TARGETS
• 3-5% Ridership Growth
• 1% Average Fare Increase
• 10-12% Train O&M Revenue* Growth
• THB 6-9bn Services Revenue of E&M Works & Rolling Stocks Procurement for Green Line South and North extensions
• THB 4,000mn** Targeted Media Revenue (see details in next slide)
MEDIA
• THB 650mn Commercial Property Revenue • THB 200mn Share of Net Profit from
BTS-SIRI JVs
PROPERTY
*Train O&M revenue includes 1st station of Green Line South: E15 which
was opened on 3 April 2017 **Based on VGI financial statements that included Rabbit Group performance (3-year restatement under common control basis)
MASS TRANSIT • THB 3,500-5,250mn E&M Green
Line South and North extensions • THB 1,900-2,850mn New rolling
stocks • THB 60mn Normal CAPEX
• THB 880mn Thana City & other improvements
• THB 300mn Eastin Thana City Hotel
• THB 270mn Land acquisition
• THB 340mn VGI CAPEX • THB 210mn MACO CAPEX • THB 150mn Rabbit Group CAPEX
Mass Transit Media Property Services
• 9.2mn Rabbit Cards in Circulation
SERVICES
79%
14%
7%
THB 10.3bn
prepared by Investor Relations department BTS Group Holdings PCL
Section 1 BTS Group in Brief
Section 2 Business Segment Profiles
Section 2.1 Mass Transit Business
Section 2.2 Media Business
Section 2.3 Property Business
Section 2.4 Services Business
Section 3 Financial Summary
Appendices Appendix 1: Key Terms of the Core Network Concession Agreement
Appendix 2: Future Funding Requirements (Mass Transit)
Appendix 3: BTS-W3
Appendix 4: BTS Group CAPEX History
Appendix 5: BTSC’s Quality Management System
Contents
53 BTS Group General Presentation
prepared by Investor Relations department BTS Group Holdings PCL
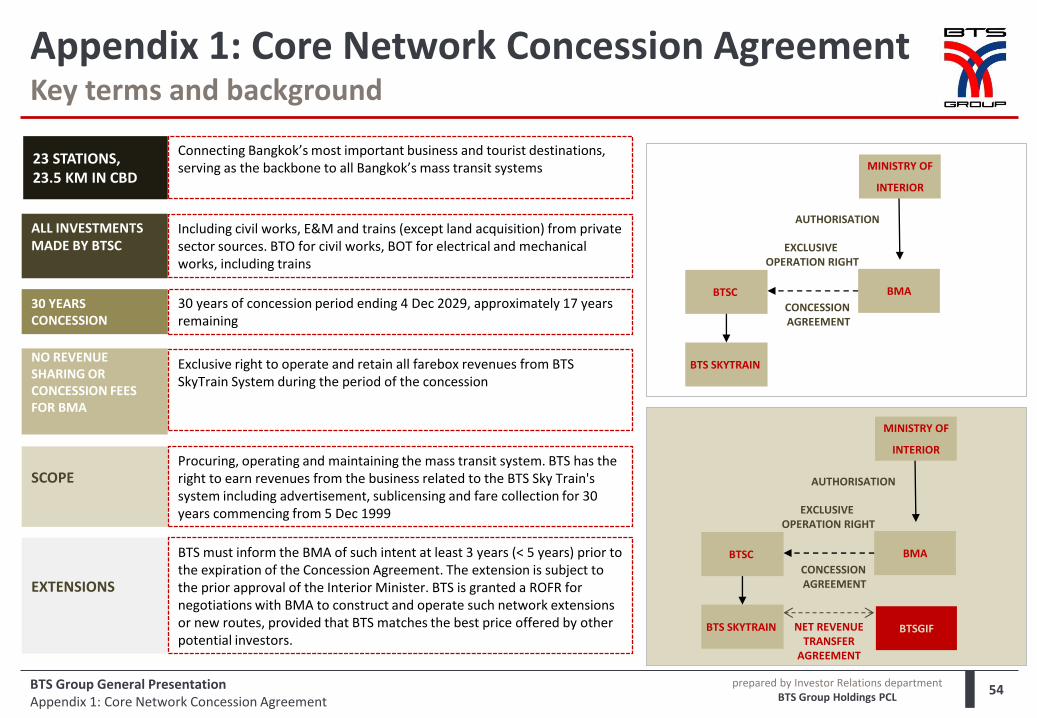
Appendix 1: Core Network Concession Agreement Key terms and background
54
BTS SKYTRAIN
BTSC BMA
EXCLUSIVE OPERATION RIGHT
CONCESSION AGREEMENT
MINISTRY OF
INTERIOR
AUTHORISATION
BTS SKYTRAIN
BTSC BMA
EXCLUSIVE OPERATION RIGHT
CONCESSION AGREEMENT
MINISTRY OF
INTERIOR
AUTHORISATION
BTSGIF NET REVENUE TRANSFER
AGREEMENT
23 STATIONS, 23.5 KM IN CBD
Connecting Bangkok’s most important business and tourist destinations, serving as the backbone to all Bangkok’s mass transit systems
ALL INVESTMENTS MADE BY BTSC
Including civil works, E&M and trains (except land acquisition) from private sector sources. BTO for civil works, BOT for electrical and mechanical works, including trains
30 YEARS CONCESSION
30 years of concession period ending 4 Dec 2029, approximately 17 years remaining
NO REVENUE SHARING OR CONCESSION FEES FOR BMA
Exclusive right to operate and retain all farebox revenues from BTS SkyTrain System during the period of the concession
SCOPE
Procuring, operating and maintaining the mass transit system. BTS has the right to earn revenues from the business related to the BTS Sky Train's system including advertisement, sublicensing and fare collection for 30 years commencing from 5 Dec 1999
EXTENSIONS
BTS must inform the BMA of such intent at least 3 years (< 5 years) prior to the expiration of the Concession Agreement. The extension is subject to the prior approval of the Interior Minister. BTS is granted a ROFR for negotiations with BMA to construct and operate such network extensions or new routes, provided that BTS matches the best price offered by other potential investors.
BTS Group General Presentation Appendix 1: Core Network Concession Agreement
prepared by Investor Relations department BTS Group Holdings PCL
17,338 18,285
35,623
8,598 10,760
20,045 18,189
8,616 11,750
77,958
3,572 4,940
2,096
10,608
Dark Green South Dark Green North Pink Yellow LRT Light Green Grey Total
Rolling Stock E&M Civil work
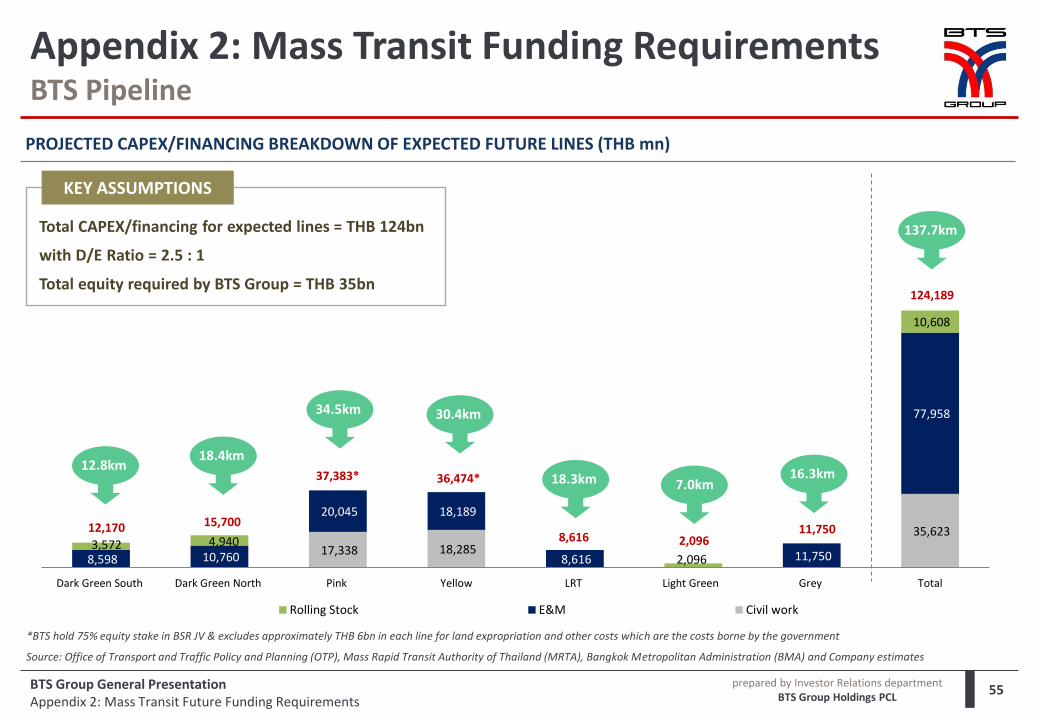
Appendix 2: Mass Transit Funding Requirements BTS Pipeline
55
PROJECTED CAPEX/FINANCING BREAKDOWN OF EXPECTED FUTURE LINES (THB mn)
KEY ASSUMPTIONS
Total CAPEX/financing for expected lines = THB 124bn
with D/E Ratio = 2.5 : 1
Total equity required by BTS Group = THB 35bn
Source: Office of Transport and Traffic Policy and Planning (OTP), Mass Rapid Transit Authority of Thailand (MRTA), Bangkok Metropolitan Administration (BMA) and Company estimates
124,189
36,474* 37,383* 12.8km
18.4km
34.5km 30.4km
7.0km 16.3km
137.7km
BTS Group General Presentation Appendix 2: Mass Transit Future Funding Requirements
18.3km
*BTS hold 75% equity stake in BSR JV & excludes approximately THB 6bn in each line for land expropriation and other costs which are the costs borne by the government
12,170 15,700 8,616 2,096
11,750
prepared by Investor Relations department BTS Group Holdings PCL
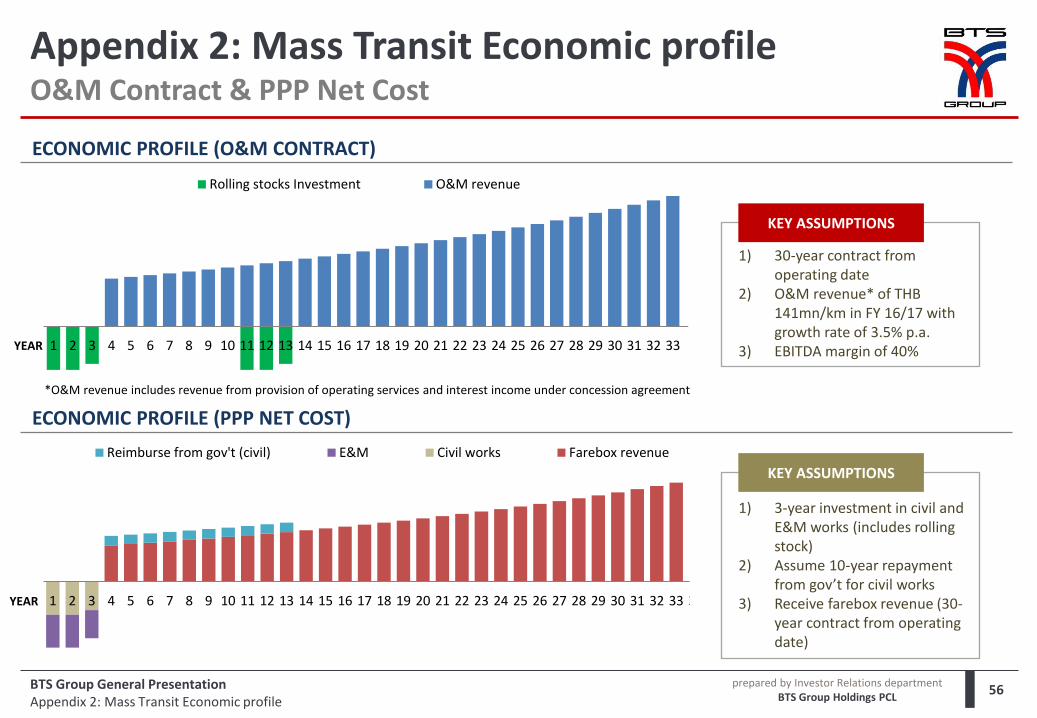
1 2 3 4 5 6 7 8 9 10 11 12 13 14 15 16 17 18 19 20 21 22 23 24 25 26 27 28 29 30 31 32 33 34
Reimburse from gov't (civil) E&M Civil works Farebox revenue
1 2 3 4 5 6 7 8 9 10 11 12 13 14 15 16 17 18 19 20 21 22 23 24 25 26 27 28 29 30 31 32 33
Rolling stocks Investment O&M revenue
Appendix 2: Mass Transit Economic profile O&M Contract & PPP Net Cost
56
ECONOMIC PROFILE (O&M CONTRACT)
ECONOMIC PROFILE (PPP NET COST)
KEY ASSUMPTIONS
KEY ASSUMPTIONS
1) 30-year contract from operating date
2) O&M revenue* of THB 141mn/km in FY 16/17 with growth rate of 3.5% p.a.
3) EBITDA margin of 40% YEAR
YEAR
1) 3-year investment in civil and E&M works (includes rolling stock)
2) Assume 10-year repayment from gov’t for civil works
3) Receive farebox revenue (30-year contract from operating date)
BTS Group General Presentation Appendix 2: Mass Transit Economic profile
*O&M revenue includes revenue from provision of operating services and interest income under concession agreement
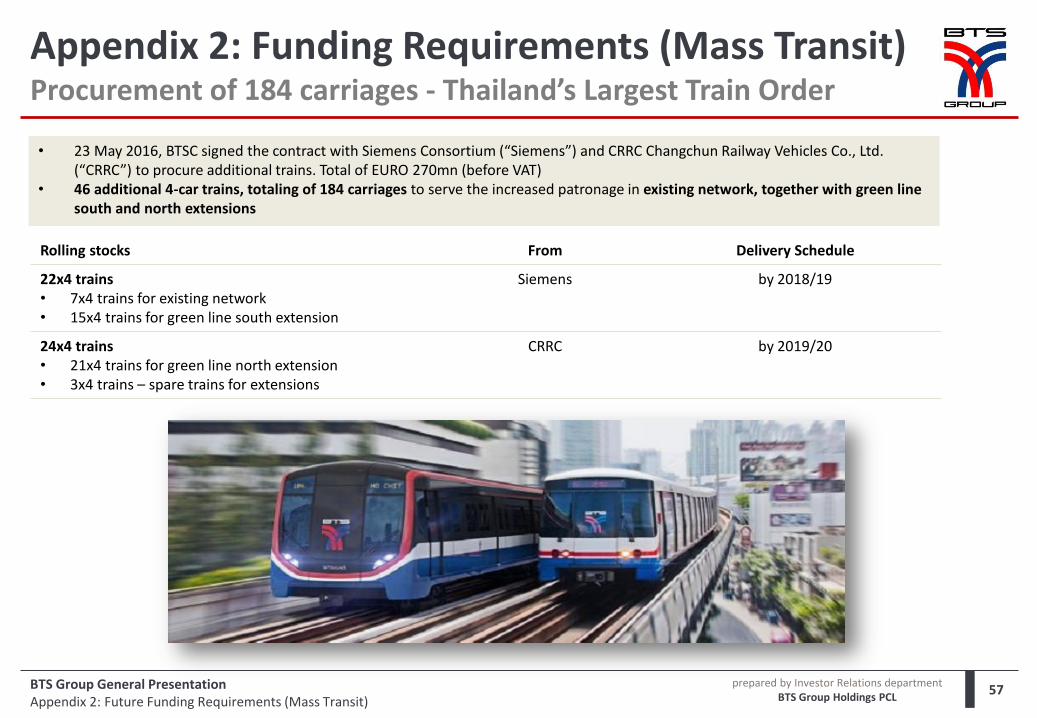
prepared by Investor Relations department BTS Group Holdings PCL
Appendix 2: Funding Requirements (Mass Transit) Procurement of 184 carriages - Thailand’s Largest Train Order
57 BTS Group General Presentation Appendix 2: Future Funding Requirements (Mass Transit)
• 23 May 2016, BTSC signed the contract with Siemens Consortium (“Siemens”) and CRRC Changchun Railway Vehicles Co., Ltd. (“CRRC”) to procure additional trains. Total of EURO 270mn (before VAT)
• 46 additional 4-car trains, totaling of 184 carriages to serve the increased patronage in existing network, together with green line south and north extensions
Rolling stocks From Delivery Schedule
22x4 trains • 7x4 trains for existing network • 15x4 trains for green line south extension
Siemens by 2018/19
24x4 trains • 21x4 trains for green line north extension • 3x4 trains – spare trains for extensions
CRRC by 2019/20
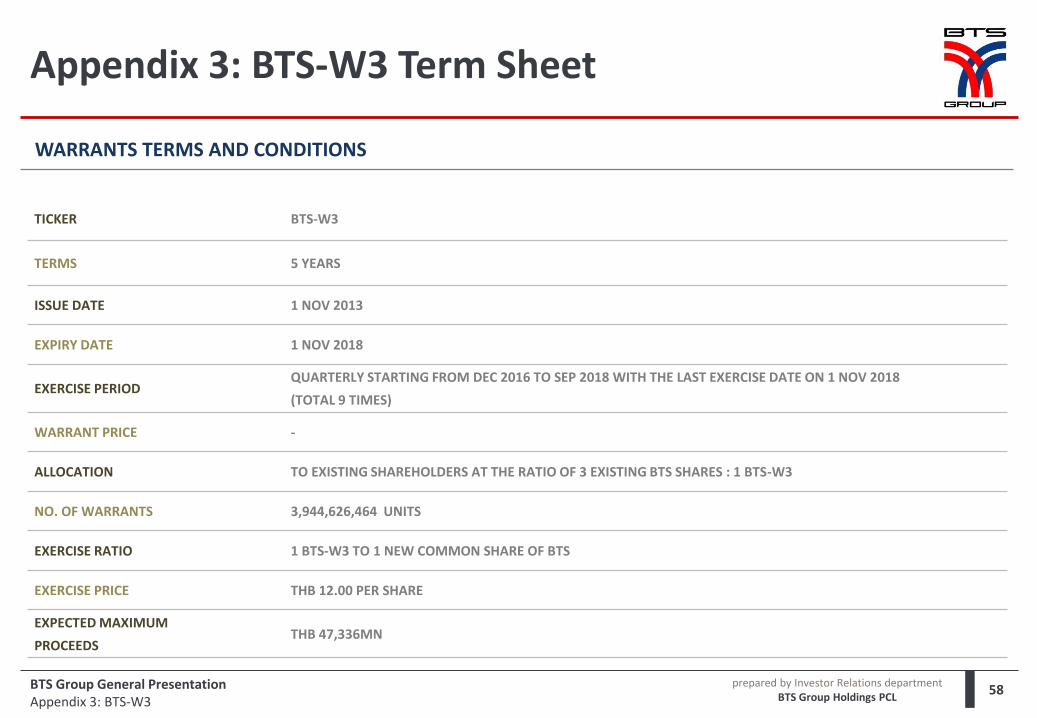
prepared by Investor Relations department BTS Group Holdings PCL
Appendix 3: BTS-W3 Term Sheet
58
TICKER BTS-W3
TERMS 5 YEARS
ISSUE DATE 1 NOV 2013
EXPIRY DATE 1 NOV 2018
EXERCISE PERIOD QUARTERLY STARTING FROM DEC 2016 TO SEP 2018 WITH THE LAST EXERCISE DATE ON 1 NOV 2018
(TOTAL 9 TIMES)
WARRANT PRICE -
ALLOCATION TO EXISTING SHAREHOLDERS AT THE RATIO OF 3 EXISTING BTS SHARES : 1 BTS-W3
NO. OF WARRANTS 3,944,626,464 UNITS
EXERCISE RATIO 1 BTS-W3 TO 1 NEW COMMON SHARE OF BTS
EXERCISE PRICE THB 12.00 PER SHARE
EXPECTED MAXIMUM
PROCEEDS THB 47,336MN
WARRANTS TERMS AND CONDITIONS
BTS Group General Presentation Appendix 3: BTS-W3
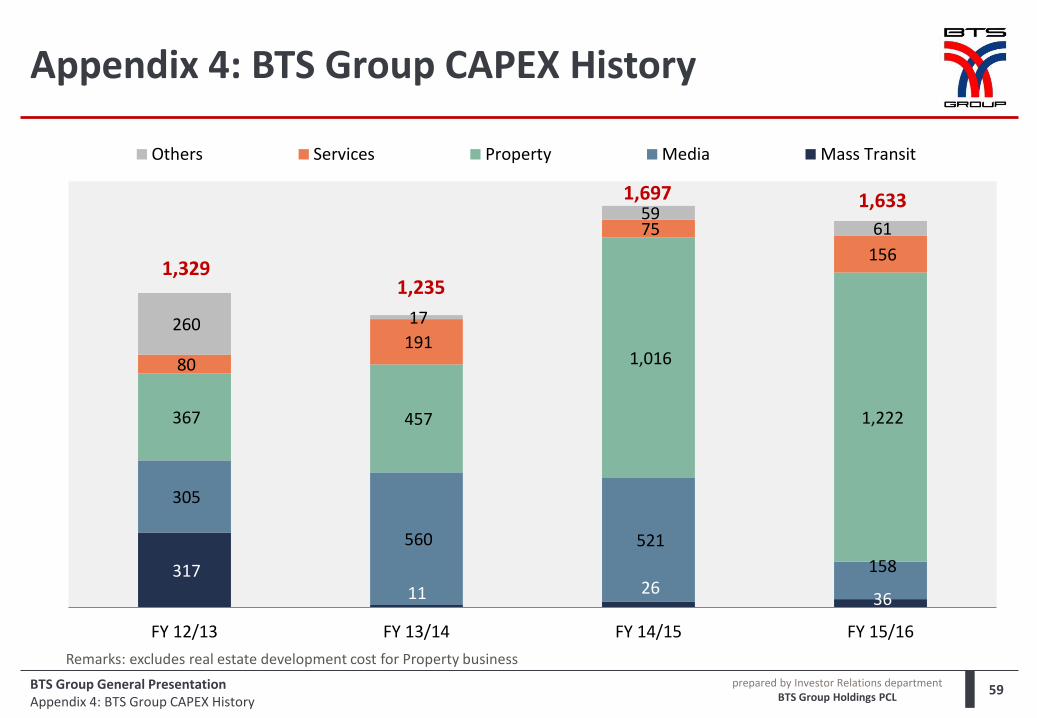
prepared by Investor Relations department BTS Group Holdings PCL
Appendix 4: BTS Group CAPEX History
59 BTS Group General Presentation Appendix 4: BTS Group CAPEX History
317 11 26
36
305
560 521
158
367 457
1,016
1,222
80 191
75
156
260 17
59 61
-
200
400
600
800
1,00 0
1,20 0
1,40 0
1,60 0
1,80 0
FY 12/13 FY 13/14 FY 14/15 FY 15/16
Others Services Property Media Mass Transit
1,329 1,235
1,697 1,633
Remarks: excludes real estate development cost for Property business
prepared by Investor Relations department BTS Group Holdings PCL
Appendix 5: BTSC’s Quality Management System
60
OCCUPATIONAL HEALTH AND SAFETY ZONE CERTIFICATE ACCREDITED BY BUREAU VERITAS CERTIFICATION (THAILAND) LTD. (BV).
OHSAS 18001 : 2007
QUALITY MANAGEMENT SYSTEMS CERTIFICATE ACCREDITED BY BUREAU VERITAS CERTIFICATION (THAILAND) LTD. (BV).
ISO 9001 : 2008
LLOYDS REGISTER RAIL’S BEST PRACTICE MODEL IMPLEMENTATION.
LLOYDS REGISTER RAIL
ISO 14001: 2004
ENVIRONMENTAL MANAGEMENT SYSTEMS CERTIFICATE ACCREDITED BY BUREAU VERITAS CERTIFICATION (THAILAND) LTD. (BV).
BTS Group General Presentation Appendix 5: BTSC’s Quality Management System