bubble - aem - aerospace engineering and mechanics · slit bubble reactor. t oev aluate the uid...
TRANSCRIPT

How Bubbly Mixtures Foam andFoam Control Using a Fluidized Bed
byJos�e Guiti�anz
Daniel Joseph*
August 1996, revised in Feb. 1997
zIntevep S.A. VZ
*University of MinnesotaAEM, 107 Akerman Hall, 110 Union Street
Minneapolis, MN 55455
ABSTRACT
In hydrocracking and other foaming reactors, the foam risesto the top because it has a higher gas fraction than the bubblymixture from which it comes. The high gas hold-up in foams isundesirable in chemical reactors because it strongly decreasesthe liquid residence time and in hydrocracking reactors alsopromotes the formation of coke. To study foams we built acold slit bubble reactor which when used with aqueous an-ionic surfactants gives rise to foam. This reactor reproducesthe foaming processes which are characteristic of the com-mercial system CANMET from Petrocanada. We discovereda critical condition for foaming; when the gas velocity exceedsa critical value which depends on the liquid velocity, a foaminterface appears at the top of the reactor, with foam aboveand bubbly mixture below. The interface is very sharp and itmoves down the reactor as the gas velocity is increased at aconstant liquid velocity. This is the way reactors foam, withthe bubbly mixture being consumed by foam.The foam may be destroyed by increasing the liquid velocity
backing up against the foaming threshold. The reactor par-titions into two phase, two phase ow with bubbly mixturebelow and foam above. The bubbly mixture is dispersed gasin water plus surfactant; the phase above is a foam throughwhich large gas bubbles rise. Constant state theories for thebubbly mixture, the foam and the position of the foam inter-face are derived and semiempirical correlations are presented.Foaming may be strongly suppressed by uidizing hy-
drophilic particles in the bubbly mixture below the foam.The suppression is achieved by increasing the liquid hold-up by bed expansion; by increasing the wetted area of solidsurface (walls and particles) and by decreasing the gashold-up by increasing the e�ective density of the liquid-solidmixture.
Industrial foaming reactors
Applications of foams and foaming are found in many in-dustries like the otation of minerals, enhanced oil recoverydrilling in oil reservoirs, insulation, construction and re�n-ing processes such as Vacuum distillation and Delay-Coker
reactors. However, foaming and defoaming are not yet wellunderstood. The modern theory of foams could be said tostart with [1973] study of Bikerman. A consolidation of theadvances in the study of foams and foaming is in the collec-tion edited by Prud'homme and Khan [1995]. Foams trapgas and are not wanted in many applications; Garrett [1993]has edited a collection of papers on defoaming. Our applica-tion area is to unwanted foaming in foaming bubble reactorsand the practical application of our study is the suppression offoaming. To achieve this goal we propose fundamental studiesof recent observations which we have made in foam suppres-sion studies in the slit bubble reactor described in section twobelow.
Pruden [1993] has reported 80v% gas hold-up in the reactorof the commercial demonstration plant used in the CANMETprocess for a wide range of gas velocities and reactor temper-atures. The overall gas hold-up values which were observedare consistent with a severe foaming condition in the reactorusing a typical commercial gas velocity. In the CANMETprocess, foam formation was detected in the commercial unitonly because of the higher gas velocities employed. Under typ-ical hydrocracking conditions using catalytic slurry reactors ofthe bubble column type and catalysts, foam may be present inthe reaction zone. Foaming can occur at temperatures higherthan 400�C which are typical in industrial reactors.
Figure 1: Diagram of the bubble column: height 170 cm, width 26cm and depth 1.3 cm. Flow lines are clearly visible through thethin Plexiglas column. The metal screen at the top of the columnwhich is used to hold solid particles in the reactor does not have amajor e�ect on the ow below.

Slit bubble reactor.
To evaluate the uid dynamics of a foaming bubble columnwith a continuous gas/liquid input, we constructed apparatusshown in Figure 1. Nine highly accurate pressure transducerswere installed. The output of each pressure transducer is inthe mV range and is ampli�ed to the 0-10V range. This signalis fed into a PC, where the signal is converted to pressure anda time average is constructed. The total and local averagegas hold-up in the column is calculated using the pressure ob-tained at di�erent times. Measurements were taken at a rateof 30 per second for a period of 3 minutes after reaching a sta-ble state. The time required for transients to decay dependson the operating conditions and the foaming capacity of thesurfactant mixtures. Steady states are recognized in foam-ing systems by the stabilization in the pressure values in thecolumn and by visual observation of the foam interface. Thetime required to reach steady state was between 30 min. and60 min. depending basically on the liquid and gas velocities.The super�cial gas velocity Ug and liquid velocity Ul are
prescribed data which we control in our bubble column. Fig-ure 1 shows the experimental equipment in the foaming mode.The total average gas fraction �g = 1 � Vl=V in steady owwas determined by direct measurement of the liquid volumeVl after the gas and liquid ows were stopped simultaneouslyand by a second method based on the pressure drop (�Pt)which is the sum of the static pressure drop (�Ps) and thepressure drop due to friction between two points separatedby a distance (�H). However, at gas and liquid velocitiesnormally employed in bubble columns, the pressure drop dueto the friction is relatively small and the local gas fractionbetween the two points is given by
�g = 1��Psg�l�H
(1)
The two methods agree when �H = L showing that thepressure drop due to friction is negligible. The variation ofthe total gas fraction with gas velocity, using foaming sys-tems, in the laboratory reactor in Figure 1 is in astonishingagreement with published data for the CANMET reactor(see Figure 6).
Part 1: Foam formation at an inter-face
When the super�cial velocity of the gas exceeds a criticalvalue which depends on the foaming properties of the liquidand its super�cial velocity, a foam/bubbly mixture interfaceappears at the top of the reactor as shown in Figures 1 and3. The interface is very sharp and it moves down the reactoras the gas velocity is increased at a constant liquid velocity.This is the way the reactor foams, with the bubbly mixturebeing consumed by foam. You can eliminate foam entirely byincreasing the liquid velocity beyond a threshold set by the
0
1
2
3
4
5
6
7
8
9
10
0 0.1 0.2 0.3 0.4 0.5 0.6
0.02WT%SDS / FOAMINESS= 62.9%0.04WT%SDS / FOAMINESS= 76.2%0.02WT%SDS+1WT%1-PENTANOL / FOAMINESS= 75.6%0.04WT%SDS/1WT%1-PENTANOL / FOAMINESS= 83.1%
LIQUID VELOCITY U [cm/s]l
GA
S V
EL
OC
ITY
U F
OR
lFO
AM
[cm
/s]
Figure 2: Plots of equation (2) giving Ug and Ul for the inceptionof foaming. The constants a and b in (2) depend on the propertiesof the surfactant solution.
ε + ε = 1gf lf
FoamPhase
f
ε = ε (1−f ) + ε fgbg gf
BubblingPhase
Gas Flow +Liquid Flow
1 - f
Figure 3: Foam regions in two phase foaming systems. f = h=H,where H is the total height of the reactor and h is the height ofthe foam.
gas velocity.
The interface de�nes a change of phase of a two-phase, two-phase ow; the bubbly mixture is a two phase ow of gas andsurfactant in water; the foam is also two phase ow of gasand surfactant in water but is better characterized as a foamthough which large gas bubbles rise. When characterized inthis way, gas bubbles are always the dispersed phase; surfac-tant in water is the continuous phase in the bubbly mixtureand the foam is continuous in the foamy mixture. The in-terface marks a phase change for the continuous phase fromsurfactant in water to foam.
The reader should maintain distinction between the foamwhich is a structure of uid with �lms and plateau bordersand foamy mixture in which large gas bubbles rise thoughthe foam. However, in the sequel we shall not always callattention to this distinction between foam and foam thoughwhich large gas bubbles rise.
2

U [cm
/s]g
Ul
Ul
Ul
Ul
Ul
Ul
GAS FRACTION (ε )g
Figure
4:
Gasfra
ction
asa
functio
nofgasvelo
city:
Wa-
ter/0.02wt%
SDS/1wt%
1-Pentanol.
U [cm
/s]g
FOAM FRACTION f
Ul
Ul
Ul
Ul
Figure
5:
Foam
fractio
nf
asafunctio
nofgasvelo
city:Wa-
ter/0.02wt%
SDS/1wt%
1-Pentanol.
Critic
alconditio
nfortheappearanceoffoam.
Thecritica
lconditio
nfortheappearance
offoam
canbe
approx
imated
bytheequatio
n
Ug=a+bU
l(2)
where
UgandUlare
super�
cialvelo
citiesandaandbem
pir-
icalconsta
nts
independentofthese
velo
cities(see
Figure
2).
IfUgisless
thanUgin
(2)foragiven
Ul ,there
will
beno
foam
intherea
ctor;therea
ctorwill
be�lled
tothetopwith
bubbly
mixture.
When
Ugrea
ches
thecritica
lvaluein
(2),
foamappearsatthetopoftherea
ctor.Thefoamissep
arated
from
thebubbly
mixture
byasharp
interfa
ce(see
Figure
3);
asUgisincrea
sedpast
thecritica
lvalue,
more
andmore
of
thebubbly
mixture
isconsumed
byfoam.
Figure4show
ssometypica
lresu
ltsgivingthetotalgasfra
c-tio
nin
therea
ctorasafunctio
nofthesuper�
cialgasvelo
cityUgfordi�eren
tliquidvelo
citiesUl .Foamingdoesnotoccu
rin
pureliquidswith
outsurfa
ctants.
Foamingalso
doesnotoccu
rin
foamingliquidswhen
theliquid
velo
cityislarger
thanthe
thresh
old
valuede�ned
by(2).
Thebotto
mcurvein
Figure
4is
foranon-fo
aminghighliquid
ow
situatio
n.Foaming
beginswhen
Uggoes
critical.
Thisoccu
rsforsm
aller
values
ofUgwhen
Ulis
low,atvalues
where
theupward
sloping
branches
bifu
rcate
from
thenon-fo
amingbranch.Consisten
twith
(2)is
thefact
thatthere
ismore
gasforagiven
Ug
when
Uldecrea
ses.Themaximum
gasfra
ctionforthisfoam
isslig
htly
above80%which
canbeconsid
eredatypica
lvalue.
Theincrea
sein
thetotalgasfra
ctionin
therea
ctordueto
foamingisshow
nin
Figure
4;thefoam
heig
htf=
h=H
isalso
anincrea
singfunctio
nofUgasshow
nin
Figure
5.
Figure
6show
sthecompariso
nbetw
eenthelaboratory
reacto
rwith
foamingsystem
sandtheresu
ltsofthecommer-
cialdem
onstra
tionrea
ctoroftheCANMETprocess
(Pruden
[1993]),
owned
by
Petro
canada,forthe
hydroconversio
nofheav
ycru
des
usin
gbubble
columnrea
ctors.
Thecold
laboratory
reacto
rrep
roduces
thegasfra
ctionbehaviorasa
functio
nofgasvelo
cityofsuch
commercia
lunit.
Fanet
al.
[1987]havenoted
thegashold-upin
coalliquifactio
nrea
ctors
canbesim
ulated
usin
gpentanol/water
system
s.
0
0.1
0.2
0.3
0.4
0.5
0.6
0.7
0.8
0.9 1
02
46
810
1214
16
U [cm
/s]
Water/0.04S
DS
/1wt%
1-P
entanol UL=
0.154CM
/SW
ater/0.02wt%
SD
S/1w
t%1-
Pentanol U
L= 0.103C
M/S
CA
NM
ET
PR
OC
ES
S /H
eavyC
rude
g
GAS FRACTION
Figure
6:
Compariso
nbetw
eengasfra
ction
inCANMET
pro-
cessand
cold
model
experim
entalresu
lts(Figure
1)
usin
gWater/
SDS/1-PentanolSystem
s.TheCANMET
hydrocra
cking
reacto
ris2meters
indiameter
with
acapacity
of800Ton/day
and
opera
tesatatem
pera
ture
grea
terthan400�C
.
Consta
ntsta
tetheory
Thesim
plest
possib
letheory
arises
from
assu
mingthatthe
bubblymixtureandthefoamareinconsta
ntsta
tes,with
con-
stantgasfra
ction(�gbin
thebubbly
mixture
and�gf
inthe
foam).
Thesuper�
cialvelo
citiesare
related
tothegasfra
c-tio
nsbyRich
ardson/Zakitypecorrela
tionswhich
are
com-
pleted
bylinearreg
ressionfro
mrea
ctordata.
Follow
ingWallis
[1969]weexpress
theslip
velo
cityinterm
softhegasfra
ction�gby
�g��l=Ug
�g�
Ul
(1��g )
=Ub1�(�g )
(3)
3

where Ub1 is the terminal velocity of a single bubble and�(�g) depends only on �g.The terminal velocity of a spherical bubble which rises
freely as a hard sphere in a liquid/surfactant has been cal-culated by Matsumoto and Morooka [1989] and is given by
Ub1Db�l�l
=Ga�
184=5 + (Ga=3)2=5�5=4 (4)
where Ga is the Galilei number (D3l �l(�l � �g)g=�
2l ). Linear
regression of our data using (4) gives �(�g)(1��g) = 1. Hencethe fraction in the bubbly mixture can be explicitly obtainedfrom (3) as
�gb =Ug
Ug + Ul +h �lGa
Db�l�184=5 + (Ga=3)2=5
�5=4i (5)
The computation of the bubble size Db in a bubble column israther complicated and is described in the appendix.To predict the gas fraction in the foam we use (3) again
written as
�g�l
=Ug
�gf
(1� �gf )
Ul=Ub1�(�gf )(1� �gf )
Ul+ 1 (6)
In the limiting case of very dry foams, the gas is trapped in thefoam; the water and gas move in lock step on �g=�l = 1; theterm Ub1�(�gf )(1 � �gf )=Ul in equation (6) is equal to zero.Regression analysis of our data shows that Ub1�(�gf )(1 ��gf )=Ul is constant for all foams. This is a surprising resultwhich implies that equation (6) can be simpli�ed to
Ug
�gf
(1� �gf )
Ul=�g�l
= (7)
The two equations (7) may be solved for
Ug =Ul�gf1� �gf
(7)1
where
�gf = 1�Ul(� 1)
�g � �l(7)2
showing that �gf and then Ug are determined by the slip ve-locity �g = �l in the foam and the super�cial velocity Ul. Wemay also replace Ug in (5) with (7)1; this shows that �gb alsois determined by �g � �l and Ul.The constant in this equation should be a function of
the foaminess of each foaming system. Some typical val-ues of are (7.4, 7.6, 6.5) for aqueous (0.04wt%SDS,0.04wt%SDS/1wt%1-Pentanol, 0.02wt%SDS/1wt%1-Pentanol) solutions. Relaxing our assumption of constantstates for the moment, we note that the gas in the foamis partitioned into a fast moving part which rises through
the foam and a trapped part which moves with the foam.Neglecting drainage, the foam velocity �f = �l. Then �g isapparently associated with fast rising large gas bubbles since�g = �l and the slip velocity �g � �l. may then also beregarded as the di�erence between the velocity of fast risinggas bubbles through the foam and the foam itself.
Phase change Interface
The two constant states are greatly di�erent; the gas frac-tion �g is much larger and the gas velocity �g = Ug=�g is muchsmaller in the foam than in the bubbly mixture. We �nd itremarkable that these two constant states are separated bya sharp interface shown in Figure 3 at the critical condition(2) and moves down the column as Ug increases. We do notpretend to understand the physics which gives rise to thisinterface and we have only an ad hoc theory to predict itsposition.The existence of two constant states with greatly di�erent
gas fractions separated by a sharp interface occurs in counter- ow bubble reactors and has been analyzed using a drift uxtheory (Wallis [1969]). This theory gives rise to two solutionsfor the gas fraction corresponding to observations with sys-tems that are not able to produce foam, but does not predictthe position of the interface.The physics of a counter ow bubble reactor with rising
bubbles and falling liquid is very di�erent than foaming re-actors because surfactants are not involved and the disconti-nuity in the gas fraction does not involve a change of phaseat a boundary separating two two-phase ows (bubbly mix-ture and foam). This latter transition involves morphologi-cal transformation analogous to phase change in crystallinesolids. Another way to think of the phase change from bub-bly mixture to foam is in analogy to evaporation with anequilibrium \temperature" Ug and \pressure" Ul satisfying avapor-liquid like phase change equation (2).We could say that the system allows two solutions, one
without foam, and the foaming solution which has a lowerenergy.To predict f , we looked at the mechanical energy dissipa-
tion, following Gidaspow's [1994] treatment of transient onedimensional particulate ow. In the constant state theory, allderivatives except dp=dx are put to zero. Since we found inexperiments that at the operating conditions normally usedin bubble columns, (moderate values Ug and Ul), the pressuredrop is balanced by the static pressure head, we can neglectthe gas wall friction and liquid wall friction. Therefore, theliquid momentum balance is given by
�(1� �g)dp
dx� (1� �g)�lg + �(�g � �l) = 0 (8)
and the gas momentum balance by
��gdp
dx� �g�gg � �(�g � �l) = 0 (9)
4

after eliminating dp=dx, we get
g(�l � �g) =�(�g � �l)
�g(1� �g): (10)
The friction factor parameter � can be related to the dragcoe�cient by the balance of buoyancy and drag
4
3��db2
�3
g(�l � �g) = ��db2
�2 12�l(�g � �l)
2CD (11)
where CD is the drag coe�cient. From (10) and (11) we �ndthat
� =3
4
�l�g(1� �g)CD(�g � �l)
db(12)
The mechanical energy equation for the gas/liquid mixturecan be obtained by multiplying the liquid momentum balance(8) by �l and dividing by (1 � �g), multiplying the gas mo-mentum balance (9) by �g and dividing by �g and adding bothequations. After writing
dp=dx = ��l(1� �g)g; (13)
the energy equation is given by
�lg(1� �g)(Ug + Ul)� �lgUl � �ggUg = �(�g � �l)2 (14)
where �gUg is much smaller than �lUl and may be neglected.Equation (13) indicates that the input power to the columnis dissipated by the friction associated with gas bubbles risingthrough the liquid.After substituting (12) into (14) we get
I = �lg(1� �g)(Ug + Ul)� �lgUl � �ggUg
= 34�l�g(1��g)CD(�g��l)
3
db= D
(15)
Equation (15) relates the power input per unit volume of col-umn (I) on the left to the power dissipated per unit volumeof column due to the friction between the phases (D) on theright. An expression for the bubble size in a foam has beendetermined by Haas [1967] using di�erent type of surfactants
d2b = �Ug
(1� �gf )(16)
where � is a constant function only of the foaming systememployed.To determine � it is necessary to obtain additional infor-
mation. We did visual measurements of the bubble size of thefoam using high speed �lming in two di�erent foaming sys-tems and we found that the foam bubble size is between 2mmand 4mm when 6cm/s < Ug < 11cm/s and 0.05cm/s < Ul <0.15cm/s. This gives rise to the average � values given inTable 1.When surfactants are present and foam appears we shall
assume that the ratio of foam fraction to bubbly mixture
System Gas Liquid Average Average �Velocity Velocity Foam from[cm/s] [cm/s] Bubble equation (16)
Diameter [cm/s][cm]
4.9 0.05 0.2Water/ 8.1 0.05 0.30.04wt% 6.0 0.1 0.3 9 �10�4
SDS 8.2 0.1 0.310.5 0.1 0.4
Water/ 4.9 0.154 0.20.04wt%SDS/ 6.0 0.154 0.2 20 �10�4
1wt%1-C5 8.2 0.154 0.3
Table 1: Bubble size and constant a from equation (16).
fraction is equal to its power dissipation ratio in each of thephases; in other words
f
1� f=
Dff
(Ib(1� f) + Iff)�Dff
= Energy dissipated in foamEnergy dissipated in bubbly mixture
(17)
where Ib is the power input per unit volume of the bubblephase If the power input per unit volume of foam (LHS ofequation 15), Df the power dissipated per unit volume offoam (RHS of equation 15 ). Equation (15) implies that thepower dissipated per unit volume of foam and the power dissi-pated per unit volume of bubbly mixture are equal. We don'tpropose (17) as a correct statement of physics; it is an ad hocassumption which is true for f = 0 and f = 1 and appears notto wander far from the truth for 0 < f < 1. After substituting(15) into (17) we �nd that
f =3CD�gf (1��gf )
4gdb
�Ug
�gf�
Ul1��gf
�3
�
�(1� �gb)(Ug + Ul)� Ul
�
(1� �gf )(Ug + Ul)� (1� �gb)(Ug + Ul)
(18)
where, following the discussion of (7), slip velocity in the foam
�g � �l =Ug
�gf�
Ul
(1� �gf )(19)
may also be regarded as the di�erence in the velocity of thelarge gas bubbles which rise through the foam and the foamitself. Equations (7) show that f=CD is a function of �g��l; Ul
and material parameters.
The drag coe�cient for a solid sphere moving through anunbounded liquid depends on the Reynolds number (see forexample Dallavalle [1948], Churchill [1988]), alone and is givenby empirical formulas with good accuracy. We shall assumethat the same formula
CD = (0:63 + 4:8Re�1=2f )2 (20)
5

holds for a bubble rising through foam when
Ref =(1� �gf )�l(�g � �l)db
�f(21)
where �f is the unknown viscosity of the foam. Equations(16) and (18), together with measured values of f , determinethe drag coe�cient CD ; then (20) and (21) determine Ref and�f . Equations (16)-(21) determine the foam viscosity in termsof Ul and the slip velocity, but the calculation illustrated inFigure 7 shows that �f is essentially independent of Ul.
Princen and Kiss [1989] derived an expression for the foamviscosity depends on the slip velocity and �gf . If we use thefoam of their analytic expression for �f and �t their constantsand exponents by nonlinear regression using our data for wa-ter /0.04% SDS we get
�f =0:8177�0:76gf
db _ +
60:08(�gf � 0:69)
[db _ ]2:96(22)
with a regression coe�cient of R2 = 0:98. Equation (22)can be compared with a similar equation in the abstractof the paper by Princen & Kiss [1989]. In their formuladb _ = �g � �l but �gf is assumed to be given and is notcomputed from dynamics.
0
0.05
0.1
0.15
0.2
0.25
0.3
0.35
0.4
0.45
0.5
0 1 2 3 4 5 6 7 8 9 10 11 12 13 14 15 16 17 18 19 20
Relative velocity[
Foam
Vis
cosi
ty in
poi
se
Relative velocity [cm/s]
Ul
= 0.1 cm/s
= 0.154 cm/s
= 0.26 cm/s
= 0.36 cm/s
= 0.51 cm/s
= 0.05 cm/s
µ f
Ul
Ul
Ul
Ul
Ul
Figure 7: Foam viscosity as determined by equation (21). Thederivation of this equation shows that in principle the foam viscos-ity depends on ow variable �g � �l and Ul, but this �gure showsthat �f can be well approximated by a function of the slip velocityalone; regression of the data gives �f = 8:0(�g � �l)
�2:151 with aregression coe�cient R2 = 0:9893.
Part 2. Foam control using a uidizedbed
1. Fluidization of particles in the bubbly mixture
Particles in batch may be uidized in the bubbly mixture,but not in the foam. Since the particles are loaded in batch,the initial solids fraction �p =
4n�3 a3=V , where n is the num-
ber of particles, a is the radius and V is the volume of thereactor, does not change once the solids are loaded into thereactor. The volume fractions (or hold-ups) of liquid �l andgas �g are also fractions relative to V; but these continuousvariables depend on input velocities Ul and Ug.
Since no particles or a very small number of particles enterthe foam, the e�ective concentration of particles is the ratio43�a
3n of solids to Vs which is the volume in the bubblymixture occupied by the slurry (see �gure 10).
2. Foam rheology and the foam barrier
The foam is an elastic network of �lms and plateau borderswhich maintains a locked grid structure as it moves slowly anduniformly through the bed. Large gas bubbles rise rapidlythrough the foam, but the foam itself does not circulate asan ordinary uid and particles which are driven into the foamare either trapped there or fall out, but they do not circulate.The trapped particles show that the foam has a yield stress;the slow motion of the locked grid shows that the foam yieldsat the walls and the ow can be associated with a viscosityand the fact that particles which fall out of the foam draft,kiss and chain as in a viscoelastic uid (�gure 1) rather thandraft, kiss and tumble as in a Newtonian uid shows thatthe falling particles see a viscoelastic uid (see Joseph et al.[1994] and [1996]).
Figure 8: Particles falling in the foam tend to chain as in viscoelas-tic uid.
6

The criterion (1) for foaming is not strongly a�ected bythe presence of particles; the mixture will foam when thegas velocity is high enough even in a �xed bed. The foamat top of the reactor acts as a barrier to further expansionof particles in the uidized bed and the creation of morefoam by increasing the gas input compresses the uidized bed.
3. Foam suppression with glass and plastic spheres
Prior literature (Garret [1993], Bikerman [1973],Prud'homme & Khan [1996]) on the use of particles todestroy foam describe e�ects of hydrophobic particles whichattack the foam. Fluidization of hydrophilic particles toincrease the liquid fraction (hold-up) under a foam barrierhas not been discussed before.We found that we could suppress foam by uidizing hy-
drophobic particles in the bubbly mixture. This suppressioncan be framed as a decrease in the gas fraction or an increasein the liquid fraction of the bubbly mixture. Such e�ects havebeen reported for gas bubbles rising in pure liquids which dontfoam but the decrease in the gas fraction in the pure liquidcase is at best 20% compared to the 75% reduction which canbe achieved in foaming systems.For a simple mixture the gas fraction in the reactor is a
linear combination of the gas fraction in each region.
�g = �gff + (h� f)�gb + �gs(1� h) (23)
where f = Xf=H; h = Xp=H; �gb is given by (5), �gf is givenby (7) and we propose that
�gs = �go�+ �gb(1��) (24)
where �go is the gas fraction in the packed bed formed fromall the particles in the slurry and � = Cs=Co is the ratio ofthe volume concentration of spheres Cs = 4
3�na3=Vs in the
expanded slurry to the concentration Co =43�na
2=Vo in thepacked bed. Here Vs is the volume of the fully expandedslurry under foam (�gures 9 and 10) and Vo is the volume ofthe packed bed. When Cs = Co; �gs = �go; when Cs tends tozero for a very expanded bed, �gs ! �gb. There is at presentno theory giving the volume fraction Cs of uidized spheresfully expanded under a foam barrier. A typical case givingthe foam fraction f as a function of Ug for a �xed Ul is shownin �gure 9 and in the explanatory cartoon shown in �gure 10.Most of the data points in the �gures below are for the fullyexpanded case h = f .The control variables entering into the description of the
e�ects on foam height of uidizing spheres of one size are thesize, density and initial solids fraction of spheres �p which isdetermined once and for all by the number of spheres whichare loaded into and remain in the reactor. We have alreadynoted that the e�ective concentration Cs of spheres in a fullyexpanded bed under the foam is determined by the dynamicsof the bed and cannot be given a-priori. At �rst, the solids
BUBBLYMIXTURE
SLURRY
FOAM
FO
AM
FR
AC
TIO
N F
= X
/H f
U [cm/s]g
H
X
X
f
p
no particles
with particles
Figure 9: E�ect of 532�m glass particles on foam formation in areactor of height H with Ul = 0:257cm/s. The uidized particlesin the slurry suppress the formation of foam even when the slurryis not expanded, Xf < Xp. For Ug > U�
g (� 7:5cm/s), the bed isfully expanded Xf = Xp and its further expansion for increasingUg appears to be inhibited by the foam.
in bubbly mixture expand in the usual way independent ofthe initial solids fraction. As the gas velocity is increased thebed expands more and the foam barrier falls until they touch.Then the bed is fully expanded under foam.
In section 5 we shall show that the gas fraction �g ina foaming reactor is decreased when (1) the initial solidsfraction �p of particles of �xed size and density is increased(�gures 11 & 12), (2) the size of particles at �xed �p anddensity is decreased (�gures 13 & 14)and (3) the density ofparticles of �xed size and concentration is decreased. Toexplain these trends we need �rst to discuss the mechanismsof foam suppression.
(a) (b) (c) (d)
Ug Ug Ug UgUl UlUl Ul
Ug
Figure 10: Particles in the bubbly mixture suppress foam evenwhen they are not fully expanded as in (a) and (b). In (c) and (d)the uidized bed and foam both expand against each other as thegas velocity is increased (cf. �gure 9).
7
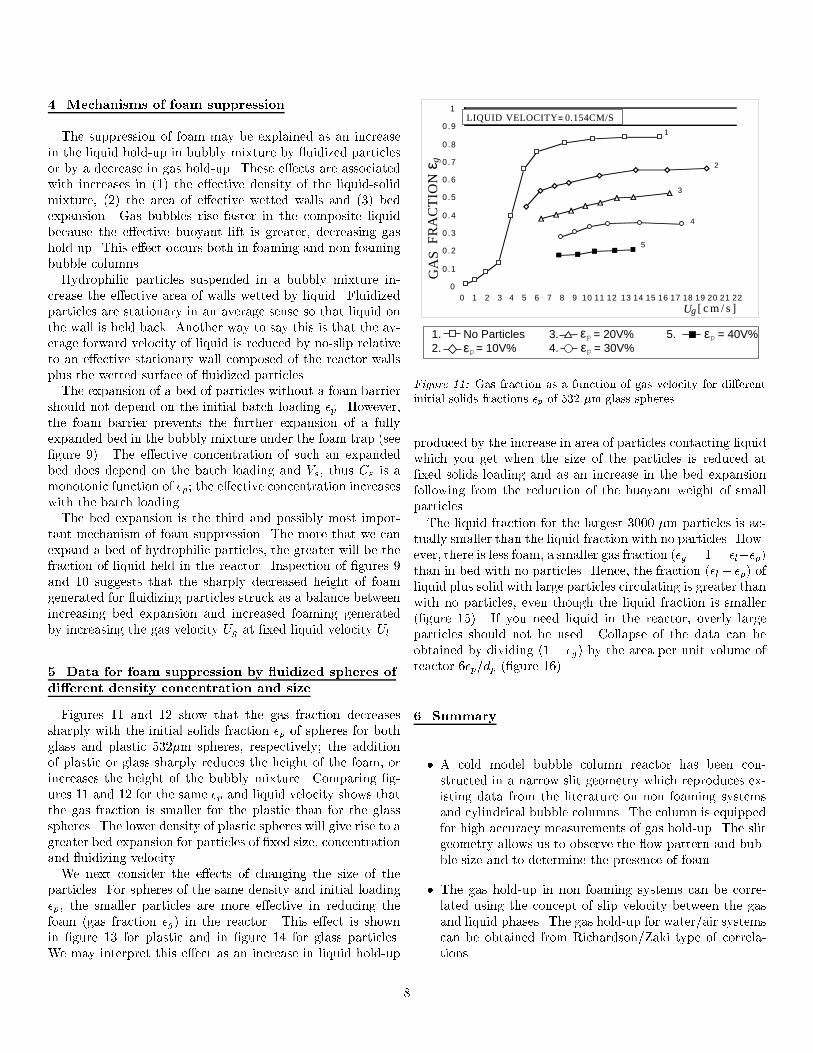
4. Mechanisms of foam suppression
The suppression of foam may be explained as an increasein the liquid hold-up in bubbly mixture by uidized particlesor by a decrease in gas hold-up. These e�ects are associatedwith increases in (1) the e�ective density of the liquid-solidmixture, (2) the area of e�ective wetted walls and (3) bedexpansion. Gas bubbles rise faster in the composite liquidbecause the e�ective buoyant lift is greater, decreasing gashold-up. This e�ect occurs both in foaming and non-foamingbubble columns.Hydrophilic particles suspended in a bubbly mixture in-
crease the e�ective area of walls wetted by liquid. Fluidizedparticles are stationary in an average sense so that liquid onthe wall is held back. Another way to say this is that the av-erage forward velocity of liquid is reduced by no-slip relativeto an e�ective stationary wall composed of the reactor wallsplus the wetted surface of uidized particles.The expansion of a bed of particles without a foam barrier
should not depend on the initial batch loading �p. However,the foam barrier prevents the further expansion of a fullyexpanded bed in the bubbly mixture under the foam trap (see�gure 9). The e�ective concentration of such an expandedbed does depend on the batch loading and Vs, thus Cs is amonotonic function of �p; the e�ective concentration increaseswith the batch loading.The bed expansion is the third and possibly most impor-
tant mechanism of foam suppression. The more that we canexpand a bed of hydrophilic particles, the greater will be thefraction of liquid held in the reactor. Inspection of �gures 9and 10 suggests that the sharply decreased height of foamgenerated for uidizing particles struck as a balance betweenincreasing bed expansion and increased foaming generatedby increasing the gas velocity Ug at �xed liquid velocity Ul.
5. Data for foam suppression by uidized spheres of
di�erent density concentration and size
Figures 11 and 12 show that the gas fraction decreasessharply with the initial solids fraction �p of spheres for bothglass and plastic 532�m spheres, respectively; the additionof plastic or glass sharply reduces the height of the foam, orincreases the height of the bubbly mixture. Comparing �g-ures 11 and 12 for the same �p and liquid velocity shows thatthe gas fraction is smaller for the plastic than for the glassspheres. The lower density of plastic spheres will give rise to agreater bed expansion for particles of �xed size, concentrationand uidizing velocity.We next consider the e�ects of changing the size of the
particles. For spheres of the same density and initial loading�p, the smaller particles are more e�ective in reducing thefoam (gas fraction �g) in the reactor. This e�ect is shownin �gure 13 for plastic and in �gure 14 for glass particles.We may interpret this e�ect as an increase in liquid hold-up
0
0.1
0.2
0.3
0.4
0.5
0.6
0.7
0.8
0.9
1
0 1 2 3 4 5 6 7 8 9[ c m / s ]
GA
S F
RA
CT
ION
εg
1
2
3
4
5
1. No Particles 3. = 20V% 5. = 40V%2. = 10V% 4. = 30V%εp
εpεp
εp
LIQUID VELOCITY = 0.154CM/S
10 11 12 13 14 15 16 17 18 19 20 21 22
Ug
Figure 11: Gas fraction as a function of gas velocity for di�erentinitial solids fractions �p of 532 �m glass spheres.
produced by the increase in area of particles contacting liquidwhich you get when the size of the particles is reduced at�xed solids loading and as an increase in the bed expansionfollowing from the reduction of the buoyant weight of smallparticles.
The liquid fraction for the largest 3000 �m particles is ac-tually smaller than the liquid fraction with no particles. How-ever, there is less foam, a smaller gas fraction (�g = 1 = �l��p)than in bed with no particles. Hence, the fraction (�l+ �p) ofliquid plus solid with large particles circulating is greater thanwith no particles, even though the liquid fraction is smaller(�gure 15). If you need liquid in the reactor, overly largeparticles should not be used. Collapse of the data can beobtained by dividing (1� �g) by the area per unit volume ofreactor 6�p=dp (�gure 16).
6. Summary
� A cold model bubble column reactor has been con-structed in a narrow slit geometry which reproduces ex-isting data from the literature on non foaming systemsand cylindrical bubble columns. The column is equippedfor high accuracy measurements of gas hold-up. The slitgeometry allows us to observe the ow pattern and bub-ble size and to determine the presence of foam.
� The gas hold-up in non foaming systems can be corre-lated using the concept of slip velocity between the gasand liquid phases. The gas hold-up for water/air systemscan be obtained from Richardson/Zaki type of correla-tions.
8

U = 0.154 cm/s - ε = 9.9V%l
U [cm/s]g
GA
S FR
AC
TIO
N ε
g
p U = 0.2567 cm/s - ε = 19.5V%lU = 0.4621 cm/s - ε = 19.5V%lU = 0.154 cm/s - ε = 29.2V%lU = 0.2567 cm/s - ε = 29.2V%l
U = 0.2567 cm/s - ε = 9.9V%lU = 0.4621 cm/s - ε = 9.9V%lU = 0.154 cm/s - ε = 19.5V%l
5.6.7.8.
5. 5.5.2.
3.4.
1.
p
pp
p
p
p
p
Figure 12: Gas fraction as a function of gas velocity for di�erentinitial solids fractions �p of 532 �m plastic spheres.
� When a mixture water/surfactant is employed in the bub-ble column, foam can be present depending on the inputparameters. Bubble and foam regimes are present at thesame time in the column; the foam regime above is sep-arated from the bubbling regime below by a very clearinterface that moves down sharply when the gas velocityis increased.
� One of the most important results is that the dynamicresponse of the slit bubble column is nearly the sameas in the large CANMET high temperature and pressurecommercial reactor (2m in diameter). This result suggestthat detailed studies of the characteristics of such bigreactors can be obtained from relatively inexpensive slitreactors. The CANMET process can be simulated usinga mixture Water/1-Pentanol/SDS.
� The total gas hold up in foaming systems can be pre-dicted using the slip velocity concept for each of thephases (foam and bubbly mixture) by applying Richard-son/Zaki type of correlations. The foam fraction is pre-dicted by an energy balance where the ratio of the volumeof foam to volume of bubbly mixture is given by the ratioof the energy dissipated in each of the phases. It is per-haps of interest that the foam height and other featuresof reactor respond are obtained from this energy balancein which thermodynamic correlations (temperature, in-terfacial energy, etc.) are totally neglected.
� The viscosity of the foam for a given foaming system isdetermined by the slip or relative velocity �g = �l = db _ and the foam gas hold up according to (22).
� Marked reduction in the gas hold-up (or foam height) of
0
0.1
0.2
0.3
0.4
0.5
0.6
0.7
0.8
0.9
1
0 1 2 3 4 5 6 7 8 9 10 11 12 13 14 15 16 17 18 19 20
U [cm/s]
1
23
4 5
6
1. No Particles 5. 9.9V% 532 m[area=11.2cm /cc]2. 10V% 1068 m[area=5.6cm /cc] 6. 19.5V% 532 m[area=16.9cm /cc]3. 20V% 1068 m[area=11.2cm /cc] 7. 29.2V% 532 m[area=32.9cm /cc]4. 30V% 1068 m[area=16.9cm /cc]
7
LIQUID VELOCITY = 0.154CM/S
µµµ
µµµ
2
2
2
2
2
2
g
GA
S F
RA
CT
ION
ε g
Figure 13: E�ect of particle size on the gas fraction for plasticparticles. The gas fraction decreases as the area of the particlesincrease, (size or number).
0
0.1
0.2
0.3
0.4
0.5
0.6
0.7
0.8
0.9
1
0 1 2 3 4 5 6 7 8 9 10 11 12 13 14 15 16 17 18 19 20
LIQUID VELOCITY = 0.154cm
1. No Particles 4. GLASS 730 m[area=16.4cm /cc]2. GLASS 3000 m[area=4.0cm /cc] 5. GLASS 532 m[area=22.6cm /cc]3. GLASS 1105 m[area=10.9cm /cc]
µµµ
µ
2
222
1
2
3 45
U [cm/s]
LIQUID VELOCITY = 0.154CM/S
g
GA
S F
RA
CT
ION
ε g
Figure 14: E�ect of the particle size on the gas fraction for glassparticles. The variation is monotonic in the size (�l + �s = 1� �g)increases with area. The largest particles have less gas but alsoless liquid placing a practical limitation.
up to 75% can be achieved in a foaming reactor by uidiz-ing hydrophilic particles in the bubbly mixture below thefoam. The gas hold-up is decreased when (1) the num-ber of particles of �xed size and density loaded in batch(the solids loading �p) is increased, (2) the size of parti-cles at �xed loading and density is decreased and (3) thedensity of particles of �xed size and loading is decreased.The decreases in gas hold-up can be associated with anincrease in the buoyant lift on bubble due to an increasein the e�ective density of the solid-liquid mixture, theincreased area of wetted walls of uidized particles andthe increases in bed expansion caused by lighter particlesand reduced particle size at �xed loading.
� The uidization of particles always increased the hold-up of solids plus liquid; if the particle size is not toolarge (�gure 16) the liquid hold-up itself is increased by
9

0
0.1
0.2
0.3
0.4
0.5
0.6
0.7
0.8
0.9
1
0 1 2 3 4 5 6 7 8 9 10 11 12 13 14 15 16 17 18 19 20
U [cm/s]
NO PARTICLESGLASS 532 MICRONS [AREA=22.6cm /cc]GLASS 730 MICRONS [AREA =16.4cm /cc]GLASS 1105 MICRONS [AREA=10.9cm /cc]GLASS 3000 MICRONS [AREA=4.0cm /cc]
g
LIQ
UID
FR
AC
TIO
N ε
l LIQUID VELOCITY = 0.154CM/S
222
2
Figure 15: E�ect of the particle size on the liquid fraction �l inthe whole reactor. The largest particles reduce the liquid fractionbelow the value for no particles; however �l+�g (3000 microns)> �l(no particles) so that the gas fraction �g is smaller. The greatestincrease in the liquid fraction is produced by the smaller particles(larger area).
00.030.060.090.120.150.180.210.240.270.3
0 1 2 3 4 5 6 7 8 9 10 11 12 13 14 15 16 17 18 19 20Ug [cm/s]
GLASS 532 MICRONS [AREA= 22.6cm /cc]GLASS 730 MICRONS[AREA= 16.4cm /cc]GLASS 1105 MICRONS [AREA= 10.9cm /cc]GLASS 3000 MICRONS [AREA= 4.0cm /cc]
LIQUID VELOCITY = 0.154cm/s
(ε +
ε )/
(6ε
/d )
ls
sp
22
22
Figure 16: Ratio between (�l + �g) and particles per unit volumeof reactor as a function of gas velocity.
uidizing particles.
� The height of foam decreases slightly in a fully expandedbed of particles under foam when the gas velocity is in-creased at a constant liquid velocity. This foam heightis struck as balance of the tendency to increase the bedexpansion by increasing the uidizing gas velocity and todecrease the expansion by greater production of foam.
The foam barrier which keeps hydrophilic particles in a re-actor and increases liquid hold-up has a certain technologicalpotential for enhanced liquid-solid contact in commercial re-actors (and forms the basis of a patent application presentlyunder consideration).The trends identi�ed here should be established in greater
quantitative detail. The possibility of generating increasedsolids hold-up in reactors with continuous rather than batchinjection of particles is strongly suggested by the resultsgiven here.
Acknowledgement. This work was supported by the NSF-CTS, the o�ce of basic energy sciences DOE, the U.S.
Army (Mathematics) under DA/DAAH04-95-0106 and In-tevep, S.A. A portion of the material presented here formsa part of the PhD. thesis of Jos�e Guitian in the Departmentof Aerospace Engineering and Mechanics (1996). We are in-debted to L.S. Fan for many suggestions.
References
[1] Bikerman, J. J. (1973). Foams. New York: Springer-Verlag.
[2] Dallavalle, J. M. (1948). Micrometrics, 2nd ed. Pitman,London.
[3] Davidson, J.F. and D. Harrison (1996). The Behavior ofa Continuity Bubbling Fluidized Bed. Chem. Eng. Sci.,21, 731-738.
[4] Deckwer, W.D. (1992) Bubble Column Reactors. NewYork. Wiley.
[5] Churchill W. (1988). Viscous Flows; The Practical Use
of Theory. Stoneham, Ma: Butterworth Publishers.
[6] Fan L. S., F. Bavarian, R. Gorowara and B. Kreischer(1989). Hydrodynamics of Gas-Liquid Fluidization underHigh Gas Hold up conditions. Powder Technology, 53,285-293.
[7] Garrett P. (1993) Defoaming. Theory and Industrial Ap-
plications. New York: Marcel Dekker, Inc
[8] Gidaspow D. (1994) Multiphase Flow and Fluidization:
Continuum and Kinetic Theory Descriptions. New York:Academic Press.
[9] Haas, P., and H. F. Johnson (1967) A model and ex-perimental results for drainage of solution between foambubbles. I & EC Fundamental, 6(2), 225-233.
[10] Joseph, D.D. and Feng, J. A note on the forces that moveparticles in a second-order uid, J. Non-Newtonian Fluid
Mech. 64 (1996) 299-302.
[11] Joseph, D.D., Liu, Y.J., Poletto, M. and Feng, J. Aggre-gation and dispersion of spheres settling in viscoelasticliquids. J Non-Newtonian Fluid Mech. 54 (1994) 45-86.
[12] Matsumoto T and Morooka S. (1989) Axial distributionof solid holdup in bubble column for gas-liquid systems.AICHE Journal, 35(10), 1701-1709.
[13] Princen H. and Kiss A.D. (1989) Rheology of foams andhighly concentrated emulsions IV., 128 (1) 176-187.
[14] Pruden B. B. (1993) The Canmet Hydrocracking Pro-cess: Recent Developments Proceedings of the ConferenceOil Sands Our Petroleum Future, 276-282. Edmonton,Alberta, Canada.
10

[15] Prud'homme R and Khan S. (1995) Foams. Theory, Mea-
surement, and Applications. New York: Marcel Dekker,Inc
[16] Wallis G., (1969) One Dimensional Two Phase Flow.
New York: Mc Graw Hill.
APPENDIX
Calculation of the bubble diameter db in equations (4) and(5) Deckwer [1992] argued that the bubble size in a bubblecolumn can be related to the energy density by a power law
Db = khEVl
imA.1
where k and the exponent m are function of the system. Theenergy dissipation density per unit volume of liquid term E=Vlhas to be evaluated in terms of the uid dynamic parameters.In concurrent up- ow operation of bubble columns the areacreated and liquid re-circulation is achieved by the turbulenceinduced by the gas ow. Gas enters at the bottom of the col-umn which is at a higher pressure and leaves the top at lowerpressure. The pressure di�erence between top and bottom isgiven the liquid head because of pressure losses due to frictionare negligible. Therefore, the amount of energy available inthe column E can be obtained from the gas and liquid phaseenergy balance
E = Qg�P A.2
where Qg is the total volumetric gas, �P is the pressure dif-ference between the bottom and top of the column.In a bubble column the pressure di�erence between the bot-
tom and the top of the column (height H and cross sectionarea A) can be calculated as follows:
�P = �l(1� �g)Hg A.3
Substituting equation (A.1) into 3.5.18 with Qg = AUg anddividing by the liquid volume in the column Vl = AH(1� �g),�nally an expression for the power dissipation in a bubblecolumn is obtained:
E
V= �lgUg A.4
Therefore, (A.1) can be written as Db = k(E=Vl)m =
k(�lgUg)m.
The �tting parameters k;m and n, in (A.1) were deter-mined in di�erent foaming systems by nonlinear regression.Table 2 gives the values of the �tting parameters k and m.
The �tting parameter n was n = �l for the three foaming sys-tems evaluated as has been reported by Davidson et al. [1966]a regression parameterR2 higher than 0.99, shows that a good�tting has been obtained in all the cases.
System Fitting Parameters RegressionParameter
k m R2
Water/0.04wt%SDS 20.255 -0.55147 0.997Water/0.02wt%SDS 1wt 34.057 -0.6429 0.993Water/0.04wt%SDS 38.778 -0.7148 0.997/1wt%1-Pentanol
Table 2: Fitting parameters of gas hold-up in the bubbly mix-ture from equation (A.1) and (5) for three foaming systemsevaluated.
11