budget priorities statement - acoss · budget priorities statement 2017 ... term effects of a...
TRANSCRIPT
1
Australian Council
of Social Service
Budget Priorities Statement
2017-18
February 2017
2
First published in 2017 by the Australian Council of Social Service Locked Bag 4777 Strawberry Hills, NSW, 2012 Australia Email: [email protected] Website: www.acoss.org.au ISSN: 1326 7124 ISBN: 978 0 85871 901 9 © Australian Council of Social Service This publication is copyright. Apart from fair dealing for the purpose of private study, research, criticism, or review, as permitted under the Copyright Act, no part may be reproduced by any process without written permission. Enquiries should be addressed to the Publications Officer, Australian Council of Social Service. Copies are available from the address above.
Front cover image © 2017 ACOSS publications, used under licence from Austockphoto
Who we are
The Australian Council of Social Service is a voice for the issues affecting low income and
disadvantaged people & the peak body for the community services sector in Australia.
Our vision is for a fair, inclusive and sustainable Australia where all individuals and communities can participate in and benefit from social and economic life.
What we do
ACOSS leads and supports initiatives within the community services and welfare sector and acts as
an independent non-party political voice.
By drawing on the direct experiences of people affected by poverty and inequality and the expertise
of its diverse member base, ACOSS develops and promotes socially and economically responsible
public policy and action by government, community and business.

3
Contents
Table of abbreviations 4
1 Overview 5
1.1 Budget strategy 5
1.2 Overview of recommendations 16
2 Raising adequate revenue for public needs 19
2.1 Taxing investment income fairly and consistently 19
2.2 Adequate, fair and sustainable retirement incomes 22
2.3 Sustainable funding for health, aged care and the NDIS 29
2.4 Strengthening the personal income tax system and curbing avoidance 35
2.5 Business taxes 38
2.6 Social taxes 40
2.7 Taxation of charities 45
3 Increasing employment and reducing poverty for people of working age ...
46
3.1 Alleviating poverty 46
3.2 Employment services 54
4 Reducing child poverty: family payments reform 61
4.1 A fairer reform agenda 63
5 Improving access to affordable housing 65
5.1 Affordable housing targets 67
5.2 Improving adequacy of existing funding agreements 67
5.3 Establishment of an Affordable Housing Growth Fund 68
5.4 Creation of a new affordable rental private investment scheme 68
5.5 Reform housing taxation 69
5.6 Increase of financial assistance to low income renters 70
5.7 Improve funding and policy response to homelessness services 72
6 Improving access and affordability of essential human services 74
6.1 Health 75
6.2 Early childhood education and care 80
6.3 Community Services 84
6.4 Aboriginal and Torres Strait Islander Budget Measures 87

4
Table of abbreviations
ATO Australian Taxation Office
ACCS Additional Child Care Subsidy
CCB Child Care Benefit
CCR Child Care Rebate
CCS Child Care Subsidy
CPI Consumer Price Index
CDEP Community Development Employment Programs
CDP Community Development Program
CGT Capital Gains Tax
ECEC Early Childhood Education and Care
EMSN Extended Medicare Safety Net
FTB Family Tax Benefit
GDP Gross Domestic Product
GFC Global Financial Crisis
JET Jobs Education and Training
IMF International Monetary Fund
LISTO Low Income Superannuation Tax Offset
OECD Organisation for Economic Cooperation and Development
PHI Private Health Insurance
PPL Paid Parental Leave
SAPTO Seniors and Pensioners Tax Offset
WET Wine Equalisation Tax
5
1 Overview
1.1 Budget strategy
Setting long term goals
The Federal Budget is much more than an accounting exercise. It is ultimately about people
and our communities, and the priorities and goals we set for our country.
The choices made in the budget tell us what the government of the day stands for and the
goals it wishes to pursue on our behalf.
Crucially, the Federal Budget pays for essential community services and support payments
that we all depend on at different times in our lives. Through a progressive personal income
tax system we all contribute according to our ability to pay. The contributions go into a pool
with company and other tax contributions, and enable us to fund the essential needs of a
healthy society. These span universal healthcare, education, disability and aged care
services, to the lifeline support for people who experience tough times through
unemployment or illness, as well as support for families or older members of our
community. This is the social contract that has served our nation well for generations,
ensuring social cohesion and paving the way for prosperity. By investing in our people and
communities we create a strong, prosperous and resilient society that can withstand any
shocks – both internal and external.
Much can be done in the Federal Budget to lay the foundations for our ongoing prosperity as
a nation. However, the goals need to be the right ones. We need the debate to move away
from whether the country’s credit rating is AAA or AA+, or whether the budget will return to
surplus in 2021 or 2022. Our budget goals must focus on our economic, social and
environmental development, including supporting employment growth and workforce skills,
strengthening public infrastructure, delivering the best education and health outcomes for
all, improving housing affordability and reducing homelessness.
The Federal Budget needs to reflect policies that bring the country together with these
shared goals, rather than dividing us. It needs to be based on values that choose love over
hate, care over disregard, community over self. This is where the energies of our
Government and Parliament should be directed.
In line with the Sustainable Development Goals, economic growth must be sustainable and
inclusive. It must balance and integrate social and environmental dimensions, if we are to
achieve ongoing prosperity.
At a time when private investment is weak, it is essential that government lift its contribution
to public infrastructure. This will improve efficiency and strengthen our economy, society,
and the natural environment in the long run. Both the OECD and International Monetary

6
Fund (IMF) have recommended that governments in wealthy countries including Australia
boost investments of this kind.1
This would be more cost effective and have a much larger short term impact on lifting
employment opportunities and productivity than the government’s proposed company
income tax cuts. In this submission we call for substantial new contributions to social and
affordable housing, as essential infrastructure, which would reduce poverty by improving
housing affordability for people paid the least, as well as boosting employment and
economic growth.
Policy makers across the world are increasingly aware that there is much more to social
and environmental wellbeing than Gross Domestic Product (GDP).
In Australia, as elsewhere, the public is weary of short term, opportunistic policy making.
The government should work with the community to set realistic but challenging long-term
goals including to strengthen productivity, reduce poverty, restore full employment, make
housing affordable, and reduce carbon pollution. It should use the Federal Budget as a tool
to achieve these aims. The United Nations’ ‘Sustainable Development Goals’ to which the
Australian Government, along with other nations are now committed, provide a possible
template to set long term goals for public policy.
1 IMF Deputy Managing Director Tao Zhang (2016), Meeting the Challenges of Growth and Infrastructure
Investment, Conference on Meeting Asia’s Rebalance and Growth Challenge, Sydney, Australia, December 2016.
Available: http://www.imf.org/en/news/articles/2016/12/01/sp120216-meeting-the-challenges-of-growth-
infrastructure-investmenthttp://www.imf.org/en/news/articles/2016/12/01/sp120216-meeting-the-challenges-
of-growth-infrastructure-investment; OECD (2016), Australia, economic forecast in Economic Outlook Vol. 2016
Issue 2, November 2016’. Available: http://www.oecd.org/economy/australia-economic-forecast-summary.htm
• Reduce at least by half the proportion of men, women and children of all ages living in
poverty in all its dimensions according to national definitions
• Achieve universal health coverage, including financial risk protection, access to
quality essential health-care services and access to safe, effective, quality and
affordable essential medicines and vaccines for all
• Ensure that all girls and boys have access to quality early childhood development,
care and pre-primary education
• Eliminate all forms of violence against all women and girls in the public and private
spheres, including trafficking and sexual and other types of exploitation
• Double the global rate of improvement in energy efficiency
• Full and productive employment and decent work for all women and men, including
for young people and persons with disabilities, and equal pay for work of equal value
• Progressively achieve and sustain income growth of the bottom 40 per cent of the
population at a rate higher than the national average
Some of the Sustainable Development Goals Australia has committed to achieve

7
Securing adequate revenue now and into the future
Commonwealth, State and Territory governments face major budget challenges. These are
not about whether the deficit is $40 billion or $35 billion next year. They are about the ability
of those governments to meet the community’s needs and expectations over the next few
decades; while building up a fiscal ‘buffer’ so that governments can stimulate and revive the
economy in the event of another global recession and keep public debt sustainable. A robust
revenue base is essential for providing the great supports and services like health, housing,
education and income support that are the bedrock of prosperity for all people and
communities in Australia. The main problem is that, as the sixth lowest taxing country
among 34 OECD nations, we do not have an adequate and sustainable revenue base.2
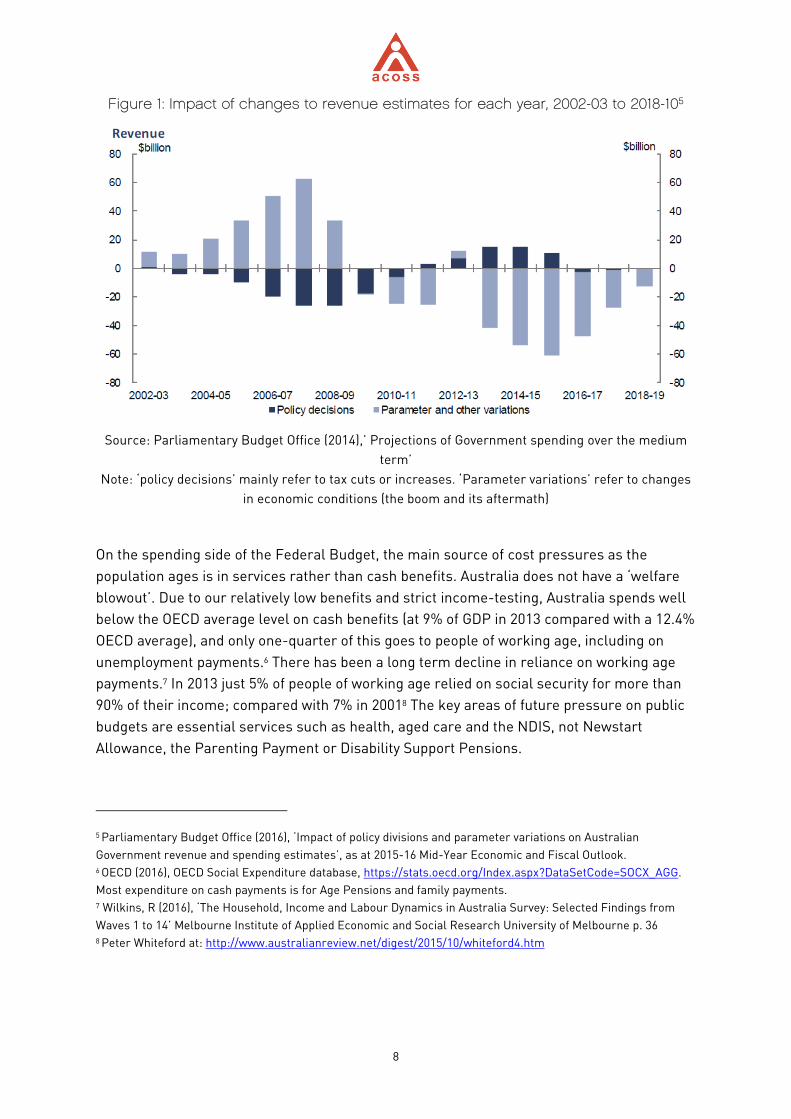
Over the eight years since the Global Financial Crisis (GFC) in 2008, public revenues have
repeatedly fallen below expectations, mainly due to declining company and personal income
tax revenues as the mining boom subsides (Figure 1). This should have been anticipated
when the boom was under way, but previous governments ‘spent’ the proceeds on eight
successive income tax cuts, unsustainable superannuation tax breaks, and poorly targeted
spending programs. If Commonwealth revenue had remained at the same level (as a share
of GDP) as it was before the 2000-01 tax cuts, the forecast budget deficit for 2016-17 would
be $3 billion rather than $37 billion (0.2% of GDP rather than 2.2%).3 Since the election of
this Federal Government there have been further tax cuts, including a personal income tax
cut for people with taxable incomes over $80,000, which has already cost the Federal Budget
about $4 billion over the forward estimates. The Government is now also proposing cuts to
the company tax rate at an estimated cost of $1.8 billion in 2019, rising to $14 billion in
2026.4
2 OECD (2014), Revenue Statistics. 3 Commonwealth general government revenue as a share of GDP fell from 25.9% in 2000-01 to 23.9% in 2006-07.
The underlying cash deficit for 2016-17 is estimated at 2.2% of GDP. Source: http://www.data.gov.au/ 4 Kouparitsas, M et al (2016), ‘Analysis of the long term effects of a company tax cut’, Treasury Working Paper
2016-02. Available:
http://www.treasury.gov.au/~/media/Treasury/Publications%20and%20Media/Publications/2016/TWP2/Downloa
ds/PDF/Treasury-Working-Paper-2016-02.ashx
8
Figure 1: Impact of changes to revenue estimates for each year, 2002-03 to 2018-105
Source: Parliamentary Budget Office (2014),’ Projections of Government spending over the medium
term’
Note: ‘policy decisions’ mainly refer to tax cuts or increases. ‘Parameter variations’ refer to changes
in economic conditions (the boom and its aftermath)
On the spending side of the Federal Budget, the main source of cost pressures as the
population ages is in services rather than cash benefits. Australia does not have a ‘welfare
blowout’. Due to our relatively low benefits and strict income-testing, Australia spends well
below the OECD average level on cash benefits (at 9% of GDP in 2013 compared with a 12.4%
OECD average), and only one-quarter of this goes to people of working age, including on
unemployment payments.6 There has been a long term decline in reliance on working age
payments.7 In 2013 just 5% of people of working age relied on social security for more than
90% of their income; compared with 7% in 20018 The key areas of future pressure on public
budgets are essential services such as health, aged care and the NDIS, not Newstart
Allowance, the Parenting Payment or Disability Support Pensions.
5 Parliamentary Budget Office (2016), ‘Impact of policy divisions and parameter variations on Australian
Government revenue and spending estimates’, as at 2015-16 Mid-Year Economic and Fiscal Outlook. 6 OECD (2016), OECD Social Expenditure database, https://stats.oecd.org/Index.aspx?DataSetCode=SOCX_AGG.
Most expenditure on cash payments is for Age Pensions and family payments. 7 Wilkins, R (2016), ‘The Household, Income and Labour Dynamics in Australia Survey: Selected Findings from
Waves 1 to 14’ Melbourne Institute of Applied Economic and Social Research University of Melbourne p. 36 8 Peter Whiteford at: http://www.australianreview.net/digest/2015/10/whiteford4.htm

9
Figure 2: Contribution of major programs to all growth in spending, including 2014
Budget changes (%) 2013-2023
Source: Parliamentary Budget Office (2014) Projections of Government spending over the medium term
Note: This was modelled prior to budget changes in 2015 and 2016, notably the tightening of the pension
assets test
The solution to these budget challenges is not to cut income support for people already
living on the brink, and below the poverty line, nor to shift the costs of services to users,
which hits people on low and modest incomes. This approach is neither fair nor sustainable
and the Parliament has repeatedly rejected it. The Federal Government should abandon the
proposed further cuts to income support that would adversely affect people on low and
moderate incomes, which have not yet passed the Parliament. These proposed cuts have
now been on the budget books for two years, undermining budget transparency [see box
below].
16
12
109
6
45
3 3 3 3 3
1 1 10.1
-0.1 -2
-4
-2
0
2
4
6
8
10
12
14
16
18
ND
IS
Ag
e p
en
sio
n
De
fen
ce
Ag
ed
ca
re
Me
dic
are
Ho
spit
als
Sch
oo
ls
Dis
ab
ilit
y S
up
po
rt P
en
sio
n
Pa
id P
are
nta
l Le
av
e
Ca
rer
inco
me
su
pp
ort
Ch
ild
ca
re
Fu
el
Ta
x C
red
its
Pri
va
te H
ea
lth
In
sura
nce
Hig
he
r e
du
cati
on
Ne
wst
art
Ph
arm
ace
uti
cal
Be
ne
fits
De
ve
lop
me
nt
Aid
Fa
mil
y T
ax B
en
efi
t
10
Instead, the government should identify the main areas of direct budget spending and tax
concessions that are either growing most strongly or are no longer ‘fit for purpose’ and
undertake long term budget planning to improve the cost effectiveness of those programs.
This was the approach agreed by business, union and community peak bodies at the
National Reform Summit in November 2015 [see box below]. For example, in health too
much public expenditure is devoted to acute care and too little to primary care and
prevention.
ACOSS has supported earlier savings measures where we have judged that expenditures
were too generous or poorly targeted. This submission advocates for more steps in this
direction. However, budget problems cannot be solved by ‘cutting waste’ alone. In most
areas of public spending, the ‘waste’ has already been removed after years of stringent
expenditure control.
Along with other harsh and inequitable measures, it is critical to remove the following
unlegislated budget cuts:
• Cutting Family Tax Benefit Part B for sole parents with children aged 17+ and
abolishing end of year supplements, without full offset measures ($2.7 billion over 4
years)
• Longer waiting periods and lower rates of payment for young people who are
unemployed, and extending the one week waiting period to more payments ($789
million)
• Freezing the free area for allowances which will reduce incomes and incentives for
those working part-time ($69 million)
• Abolishing the Pensioner Education Supplement and Education Entry Payment,
which will result in income losses of up to$35 pw for people studying to improve
their employment prospects, and tougher portability rules for pensioners travelling
overseas ($580 million)
• Higher Pharmaceutical Benefits Scheme co-payments ($722 million)
• Lower Parental leave payments for those with paid leave from employers ($491
million)
These cuts have now been inappropriately linked to funding the National Disability Insurance
Scheme (NDIS) in the current Omnibus Bill before the Lower House.
Unlegislated spending cuts should be abandoned

11
This is demonstrated by changes to family payments in recent years. At the start of the
decade, governments set out to reduce poorly targeted spending in this area. For example,
they tightened income tests and abolished the ‘Baby Bonus’ and ‘Schoolkids Bonus’ - both
fixed amounts going to households regardless of incomes. Then they went much further,
carving $7 billion from Family Tax Benefits since 2010.9 There is now little left to cut without
harsh impacts to people in the lower half of the family income distribution and pushing more
children into poverty. Further cuts to family payments, currently before Parliament in the
Omnibus Bill, would do exactly that.
Governments need a robust revenue base to fund essential services and support payments.
If we exclusively pursue cuts to budget deficits through cuts in spending, these measures
will reduce the services, supports and payments to people who are already struggling
financially. In the 2014 and 2015 budgets alone, over $15 billion (over four years) was cut
from vital community services including Aboriginal and Torres Strait Islander services,
community legal centres and refuges for victims of domestic violence.10 In addition, $80
billion is being cut from Commonwealth funding to states and territories for health and
9 Grattan Institute (2016), ‘Why every generation feels entitled’. The Conversation, Thursday 15 December 2016.
Available: https://theconversation.com/why-every-generation-feels-entitled-70405 10 ACOSS calculations
• Governments have a key role to play in delivering quality services, a social security
safety net and economic and social infrastructure essential for economic growth
• All expenditure programs, including direct and tax expenditures, should be subject to
rigorous evaluation to ensure efficiency and effectiveness over time
• Where major spending program redesign is undertaken, it should seek to improve
service quality and equitable access, not just efficiency
• Income support payments should be targeted to those who most need them and gaps
in the safety net closed, such as by improving the adequacy of income support for
unemployed people, affordable housing for people on the lowest incomes and services
to people with a disability
• People on low incomes or who are otherwise vulnerable should be protected from the
impacts of fiscal reform
We encourage the Government to build on these agreed foundations as it develops its fiscal
strategy for the next financial year and beyond.
SOURCE: ‘Statement from the National Reform Summit’, a joint statement endorsed by the Australian
Chamber of Commerce and Industry, the Australian Council of Trade Unions, the Australian Council of
Social Service, the Australian Industry Group, the Australian Youth Affairs Coalition, the Business Council
of Australia, COTA, and Seniors Australia, http://www.acoss.org.au/wp-
content/uploads/2015/08/National-Reform-Statement-full.pdf
National Reform Summit – fiscal policy principles
12
schools over the next decade. We advocate reversing these damaging cuts to essential
community services.
Australia faces a choice between ever-increasing reliance on user charges for essential
services (such as health, aged care and education) or raising tax revenues. For example,
while user charges for home care and nursing home accommodation are steadily rising,
only 16% of people over 64 years pay any income tax due, in large part, to superannuation
and other tax concessions.11 This is unsustainable.
Re-casting budget priorities
Budgets are about priorities. This government must prioritise a budget that is true to our
country’s stated values of fairness and equality. During the boom years, Commonwealth
expenditures rose, but too much of the extra spending was devoted to inefficient and poorly
targeted programs such as the Private Health Insurance rebate, superannuation and
housing tax concessions, the Seniors Supplement and the Baby Bonus. Critical problems
including unaffordable housing, unemployment and family payments well below poverty
levels, and chronic under-investment in mental and dental health, have been neglected for
decades and the impact is most strongly felt by people on the lowest incomes.
High housing costs are a major source of financial stress, especially for private tenants with
the lowest 20% of incomes, with four out of five paying more than 30% of their income in
rent. Housing costs are also the main cause of Australia’s dangerously high household debt
levels, since average house prices are now 4-5 times average annual household earnings.12
Australia has a severe shortfall of social and affordable housing, including a shortage of over
500,000 rental dwellings that are both affordable and available to the lowest income
households.13 While state and territory governments have a key role to play in boosting
housing supply, including through reform of urban planning and state taxes, the
Commonwealth cannot continue to take a back seat in housing policy. We advocate a multi-
pronged national affordable housing strategy including reform of housing taxation, direct
investment in affordable housing stock; incentives for private sector investment in
affordable housing; improved financial support to low-income renters; and secure and
adequate support for homelessness services.
Unemployment rose by half after the Global Financial Crisis and labour market conditions
are still weak. In November 2016 it was estimated that there were approximately ten people
11 Grattan Institute (2016) Op. Cit. 12 Ryan Fox and Richard Finlay (2012), ‘Dwelling prices and household income, Reserve Bank of Australia Bulletin,
December Quarter 2012’, available at: http://www.rba.gov.au/publications/bulletin/2012/dec/pdf/bu-1212-2.pdf. 13 National Housing Supply Council (2013): Housing supply and affordability issues 2012-13. Available:
http://rsss.anu.edu.au/sites/default/files/PeterWhiteford.pdf
13
looking for more paid work for every job available.14 Some groups are particularly affected,
including young people, older workers, people with disabilities, Aboriginal and Torres Strait
Islanders, people from culturally and linguistically diverse backgrounds and women
returning to paid work after caring for young children. A growing number of people
employed part time are finding it difficult to secure the working hours they need to earn a
decent living. Of particular concern is the entrenchment of long-term unemployment, with
over 70% of people receiving Newstart and Youth Allowances at a point in time having to rely
on income support for more than a year.
Unemployed people generally receive little help from employment services because these
are not funded to offer more than an occasional interview, help with a CV and job search
training and, at best, a few months of vocational training. Employment service funding
contracts and incentives discourage patient investment in people who are most
disadvantaged in the labour market. This is a false economy. Investment in well-designed
employment assistance, including wage subsidies and training, for people who are
unemployed long term or at risk, would ultimately pay for itself.
Those affected by the rise of unemployment must live on the lowest unemployment benefit
in the OECD15. At $38 a day for a single adult, the Newstart Allowance is well below the cost
of the essentials of life, making it much harder for people to search effectively for jobs. At
$65 a week, Rent Assistance for a single adult is a fraction of typical rents in major urban
centres, where most jobs are located. As a first step to ease the most severe poverty, we
propose a $54 a week increase in payments for single people who are unemployed or
studying fulltime. This is particularly urgent considering that the pension was increased in
2009 due to it being inadequate, without any rise in the lower unemployment and sole parent
payments.
Since the publication of its own ‘welfare review’ two years ago, the Federal Government has
flagged its intention to reform the system of payments for working age people. We urge the
government to take this opportunity to redesign a complex and inequitable payment
structure that leaves unemployed people and students on ‘allowance’ payments that are at
least $174 a week lower than the frugal pension rate, and entrenches poverty among people
relying on this payment. Past policies have moved whole cohorts of people onto this much
lower payment, who would previously have accessed at least the pension level of income
support, particularly single parents, people with disabilities and older people.
A core principle of social security reform is that payment levels are based on financial need.
One of this submission’s key proposals is the establishment of a Social Security Commission
to provide independent expert advice to government on the living costs and needs of people
14 Ratio includes both unemployed and underemployed and is derived by ACOSS from Australian Bureau of
Statistics, November 2016 data: ‘Job Vacancies Australia, Cat. 6354.0’, Table 1, and ‘Labour Force, Australia, Cat.
6202.0’, Table 22.
15 Whiteford, Peter ‘Adequacy of social security benefits for working age households: a comparative assessment’
Available: http://rsss.anu.edu.au/sites/default/files/PeterWhiteford.pdf

14
receiving social security payments and report regularly to the Parliament on the adequacy of
payments, their indexation, and income test arrangements.
The Social Security Commission should also assess the adequacy of family payments.
Urgent action should be taken in this budget to lift the level of the unemployment payment
and improve Family Tax Benefits for families on low incomes - especially sole parent
families - to reduce our shamefully high level of child poverty. In 2014, 731,300 (or one in six)
children were estimated to be living below the poverty line.16 Family payments should be
restructured so that they no longer decline as children grow older and their cost rises.
Payments for school age children should increase, and a supplement should be introduced
to assist sole parents with the extra costs of raising children alone.
Our key priorities in health are to improve the quality and accessibility of health services,
including oral and preventive health services, for people on low incomes. Additional
expenditure could be offset by redirecting wasteful expenditure in the health system
including by abolishing the Private Health Insurance Rebate and the Extended Medicare
Safety Net, which mainly benefit higher income earners using relatively expensive health
services. ACOSS is deeply concerned about the progressive undermining of schemes to
assist low income households with essential dental costs, including dental services for
adults with low incomes. We have called for many years for a robust system of supports with
dental health care costs for people with low incomes. This long standing ‘gap’ in public
health services must be filled.
Strengthening public revenue and reforming the tax system
The case for tax reform is compelling and ACOSS has worked actively with diverse
stakeholders, including business groups and with government to build momentum for
reform and to identify shared goals. We believe that reform must be structural and must
grow the revenue base fairly, steadily and efficiently. It must focus on major tax concessions
which have unintended or inequitable impacts including superannuation and housing
investment concessions.
We have consistently argued against reform proposals that greatly reduce the overall
progressivity of the tax system, such as raising the Goods and Services Tax to pay for income
tax cuts as a first resort. We welcomed the government’s abandonment of such proposals,
which would not have materially contributed to future economic growth. Similarly, we have
argued against ‘reform’ proposals that consist of little more than cuts in tax rates and
undermine the public revenue we need to meet essential health, education and social
services costs.
Tax reform can contribute to economic development as well as raise revenue, but the
benefits of simply cutting tax rates to encourage paid work, investment or saving are often
16 ACOSS / SPRC (2016), ‘Poverty in Australia Report 2016’. Available: http://www.acoss.org.au/wp-
content/uploads/2016/10/Poverty-in-Australia-2016.pdf

15
exaggerated. ACOSS opposed the personal income tax cut for people on taxable incomes of
over $80,000 for this reason, arguing that a greater priority was to reform the interaction of
the tax and transfer system for low paid and part time workers, particularly women. The
government’s proposed company income tax reductions would reduce future revenues by an
estimated $1.8 billion in 2019 rising to $14 billion in 2026, while the Treasury projects that it
will increase household spending power in approximately 20 years’ time by less than 0.7%: a
poor return for a costly investment.17 Further, there is no evidence to suggest that
concentrating company tax reductions on small rather than large companies would make
the economy more productive or that it would lead to more and better jobs.
The best approach to income and business tax reform is to remove tax concessions and
loopholes that are economically harmful as well as unfair, and use the savings to reduce tax
rates over time as well as meeting the community’s need for essential services and public
infrastructure. Many existing business tax concessions are biased towards some industries
and against others, while others lack a clear purpose. For example, fuel tax offsets for off-
road use disproportionately benefit the mining industry and the case for these tax offsets
rests on the assumption that the only purpose of fuel taxes is to pay for our roads. Yet these
taxes also play a part in reducing carbon pollution and funding government services. There
is also a risk that tax cuts for particular sectors such as ‘innovative’ firms will reward
investments that would have been made anyway and create new tax avoidance opportunities.
A good example of tax reform that would improve the efficiency of investment as well as
housing affordability is to reduce the ‘50% discount’ on taxes for capital gains (income from
assets such as housing) and reduce deductions for such investment (‘negative gearing’). This
would reduce speculative investment in rental properties chasing capital gains and remove
distortions in the tax treatment of investment income. Part of the proceeds could be used for
more effective incentives for new investment, especially in affordable housing and by
institutional investors. Curbs on ‘negative gearing’ would also help reduce household debt,
which is among the highest in the OECD and is a far greater economic risk than our below-
average public debt level.
Billions of dollars in public revenue are lost to international corporate tax avoidance
practices such as shifting debts and expenses to higher tax jurisdictions and profits to low-
tax jurisdictions or tax hideouts. We welcome the government’s recent steps to improve the
transparency of these cross-border transfers and share information with overseas tax
authorities. Given the seriousness and scale of this problem, more should be done. We
propose tightening the ‘thin capitalisation’ rules to curb artificial debt-shifting and new
requirements to publish information on the ‘beneficial ownership’ of companies and trusts.
At a minimum, the present requirement for the Australian Taxation Office (ATO) to publish
17 Kouparitsas, M et al (2016), Op.Cit. Discussed in ACOSS (2016), ‘Treasury Laws amendment (Enterprise tax
plan) Bill 2016, Submission to Senate Economics Legislation Committee’. Available: http://www.acoss.org.au/wp-
content/uploads/2016/09/ACOSS-submission-to-the-Treasury-Laws-amendment-Enterprise-tax-plan-Bill-
2016.pdf
16
information on the incomes and tax paid by public companies with over $100 million in
annual income should extend to private companies and trusts with the same income.
A note on costings
ACOSS is committed to presenting considered, evidence-based and responsible proposals to
government for budget reforms. Crucial to this process is our capacity to model impacts on
revenue and expenditures. As a result of cuts in federal funding, ACOSS no longer has
access to an up-to-date affordable modelling tool like Stinmod to run costings for our policy
proposals. Previously, ACOSS used the Stinmod interface developed by NATSEM, but this
has not been updated since 2013 when NATSEM lost federal funding. As such, costings in
this submission are based on data from 2012/13, with annual indexation. As a result, our
budget impact assessments are estimates.
Lack of public access to affordable modelling tools like Stinmod limits the capacity of policy
and advocacy organisations to develop comprehensive policy proposals, particularly budget
proposals. ACOSS understands that Treasury will be making its own model public at some
stage. It is important that government fund a user-friendly interface of its microsimulation
model that is accessible to organisations like ACOSS so that they can reliably model policy
proposals.
1.2 Overview of recommendations
We propose modest additional expenditures of the order of $8 billion in 2017-18 in key
priority areas, which will be substantially funded by savings measures worth an estimated
$9.7 billion, resulting in a net saving of $1.7 billion. In 2018-19, our budget proposals will
save $19.9 billion, achieving a net saving of $9.4 billion after delivering on our spending
proposals.
Importantly, the expenditure savings and reductions in poorly targeted tax breaks would
accumulate over time, making room in the budget for necessary future expenditures in such
areas as health, aged care and disability services as the population ages.
The budget deficit would be reduced by $9.4 billion in 2018-19 representing 0.5% of GDP,
almost halving $19 billion deficit for that year.18 More importantly, in future years the impact
of the savings measures would grow, helping offset necessary increases in the cost of
essential services including health, aged care and the NDIS.
Key expenditure and revenue proposals are summarised in the table below.
18 Weight D, Davidson P, Makeham-Kirchner A, Watt D, Bartsch I, Gobbett H (2016), ‘The 2016–17 Budget: a quick
guide’ Available: http://www.aph.gov.au/About_Parliament/Parliamentary_Departments/Parliamentary_Library/pubs/rp/rp1516/Q
uick_Guides/Budget1617

17
Table 1: Summary of recommendations
2017-18 2018-19
Cost ($m)
Saving ($m) Cost ($m) Saving ($m)
EXPENDITURE MEASURES
Increase of allowance payments for single people by $54 a week 1900 1950
Indexation of allowance payments to wages as well as prices 100 110
Replacement of working credit scheme with income bank 300 310
JobActive improvements 100 100
Reform family payments 1200 1240
Establishment of Affordable Housing Growth Fund
750 1000
Review of and increase to Commonwealth Rent Assistance
775 800
Effective preventive health mechanisms
150 154
Increased investment in affordable, accessible dental care 1200 1230
Removal of increased co-payments for PBS medications
450 540
Restoration of community service funding levels to pre 2014-15 Budget Levels
0 1886
Indexation of community services funding to wages
379 391
Extension of deductible gift recipient status
700 800
TOTALS 8004 0 10531 0
TAX AND SAVINGS MEASURES
Exemption of 50% of personal capital gains from Capital Gains Tax to be reduced from 50% to 25% over 10 years
0 500

18
2017-18 2018-19
Cost ($m)
Saving ($m) Cost ($m) Saving ($m)
Phase out tax concessions from the disposal of small business assets 150 300
Phase out deductions for personal investment expenses (‘negative gearing’) 150 300
Superannuation fund earnings and a new health and aged care services fund 0 1300
Medicare Levy changes 4000 4100
Tightening of age-based tax concessions 700 700
Curbing tax avoidance through private trusts 0 1500
Curbing tax avoidance through private companies 0 1200
Review of tax concessions 400 500
Curbing tax avoidance by companies operating internationally
0 500
Abolition of fuel tax credits for off-road use
0 2000
Abolition of immediate deduction for mining exploration
500 300
Sugar tax for sweetened drinks
0 500
Changes to alcohol excise 0 2300
Removal of Private Health Insurance Rebate (redirecting half the savings to public hospitals, community-based health services, dental health services and preventative health services.)
3400 3500
Abolition of Extended Medicare Safety Net
420
430
TOTALS 0 9720 0 19930
TOTAL COST $8,004 $10,531
TOTAL SAVINGS $9,720 $19,930
NET TOTAL (savings) $1,716 $9,399
Note: Table only includes recommendations with measures that are $100 million and over.
19
2 Raising adequate revenue for public needs Australia is the sixth lowest taxing country of 34 OECD countries, ahead of only Mexico,
Chile, the United States, Switzerland and Korea.19 In the year of the GFC, tax revenue fell by
2% of GDP. Eight years later, in 2015-16, it was 21.9%: 1.8% of GDP less than its pre-GFC
level of 23.7% of GDP.20 The main reason for this slow and halting revenue recovery is that
the mining boom has subsided. It has not been replaced by new drivers of economic growth.
In addition, eight successive tax cuts were offered during the boom years, and poorly
designed tax concessions (especially for superannuation) were expanded.
As indicated in the Overview, it is clear that both Federal and State tax revenues will have to
rise in future years to help restore public budgets and meet the cost of services for an
ageing population, including funding growing areas of priority expenditure such as the
National Disability Insurance Scheme and needs-based schools funding. This should be
done in a way that minimises any harm to equity or economic development. Income tax
bracket creep cannot do all the work to restore public revenue. On the other hand, we
cannot afford a repeat of the tax cuts that seriously eroded income tax revenues during the
2000s. Income taxes are the fairest way to raise public revenue and governments should
strengthen that tax base, not undermine it. This can be achieved by removing or reducing the
impact of the most poorly designed, inefficient and inequitable tax shelters.
Whenever the income tax base is narrowed by deliberate tax shelters or unintended
loopholes, this means that higher tax rates are required to raise the same amount of
revenue. There is a case for taxing investment income at lower rates than income from paid
work on economic efficiency grounds given that capital is more mobile and sensitive to tax
levels. It is vital, however, to ensure that taxes on different investment incomes are as
consistent as possible. Otherwise, the tax system will distort economic decision-making in
ways that are harmful to Australia’s economic development.
2.1 Taxing investment income fairly and consistently
One of the most harmful distortions in the tax treatment of investments is the 50% discount
on tax rates for capital gains received by individuals and trusts. Treasury estimates that the
lost revenue from this tax break costs $6 billion per annum.21 This encourages excessive
19 OECD, ‘Revenue Statistics, OECD Member Countries: Comparative Tables’. Available at:
https://stats.oecd.org/Index.aspx?DataSetCode=REV Data for 2013. 20 Morrison, Scott and Cormann, Mathias (2015): ‘Mid-Year Economic and Fiscal Outlook 2015-16’,
Commonwealth of Australia, Canberra. Available: http://www.budget.gov.au/2015-
16/content/myefo/download/MYEFO_2015-16_Final.pdf
21 Treasury (2016), ‘Tax Expenditures Statement 2015’, Commonwealth of Australia. Available:
http://www.treasury.gov.au/~/media/Treasury/Publications%20and%20Media/Publications/2016/Tax%20Expendi
tures%20Statement%202015/Downloads/PDF/2015_TES.ashx
20
speculative investment in property and other assets yielding capital gains and it is one of the
reasons for our inflated home prices. The concessional treatment of capital gains compared
with other investment income (such as interest and active business income) diverts
investment from other purposes as well as fuelling boom and bust cycles in the economy.
The concessional tax treatment of capital gains also overwhelmingly benefits the top 20% of
taxpayers, who receive two-thirds of all capital gains. We propose that this concession be
halved, so that three-quarters of capital gains are taxed.
The ‘Henry Report’22 recommended a common (lower) tax discount for most major forms of
investment income apart from superannuation and owner occupied housing. This would
increase tax rates on capital gains and reduce those applying to other investment incomes
such as bank interest and housing rents. This proposal has merit but is best introduced as
part of a wider reform of the tax system.
This tax distortion is exacerbated by the unlimited deductions for losses on investments in
property and other assets yielding capital gains such as shares, agricultural schemes, and
collectables. Australia is unusually generous in placing few restrictions on these deductions.
This has encouraged the practice of ‘negative gearing’ where investors (especially in
property) deliberately incur losses on their investment for a number of years to maximise
deductions against their other income. These deductions (including interest on loans) are
poorly matched with income from the investment, which mainly takes the form of capital
gains. The deductions are typically claimed against wages, which are taxed every year at the
individual’s marginal tax rate, but income from these investments mainly takes the form of
capital gains which are only taxed at half that rate, and often years later when the asset is
sold. The result is an even stronger tax bias in favour of debt-financed investment in
property shares and other assets.
Negative gearing is discussed further in Chapter 5 (Housing). Our proposal is to quarantine
deductions for expenses relating to passive investment in housing, shares, collectables and
similar assets purchased after 1 January 2017 to offset income received from those assets,
including capital gains realised on their subsequent sale. Assets acquired before that date
would be ‘grandfathered’ so that deductions can still be claimed under the present rules.
Part of the revenue saved would be devoted to a two-tier rental housing investment incentive
(tax offset) for the construction of new dwellings whose building costs fall below a (relatively
high) value. The incentive would be paid at a substantially higher rate (either as a tax offset
or direct payment) for the construction of new dwellings used to provide affordable housing
(where rents are held at least 20% below market rents). This incentive, unlike the existing
building depreciation allowance, would be available for a maximum of ten years following
construction. Consideration should be given to replacing the existing 2.5% ‘capital works
allowance’ for dwellings built after 1985 (which is poorly designed and applies for up to 40
22 Henry Review (2010), ‘Australia’s Future Tax System’ Commonwealth of Australia, Canberra. Available:
https://taxreview.treasury.gov.au/content/Content.aspx?doc=html/pubs_reports.htm

21
years after construction) with the new incentive, which would increase revenue savings from
the reform.
The new rental housing incentive would form part of a wider set of affordable housing
policies discussed in Chapter 5. Unlike negative gearing, they should strengthen investment
in new housing stock and could support institutional investment in rental housing. As part of
the broader affordable housing strategy in Chapter 5, targets should be set for the share of
housing attracting the incentive that is affordable. The impact of the incentive on rental
housing investment, especially affordable housing, should be reviewed within three years of
its implementation.
In addition to the 50% ‘discount’, the sale of certain small business assets attracts further
concessions: the 50% tax discount is doubled and there are exemptions for capital gains
held for over 15 years and those used for ‘retirement purposes.’ Together, these
concessions mean that many small business owners can avoid paying Capital Gains Tax
(CGT) altogether, an outcome that is inequitable and hard to justify.
The original purpose of the additional small business concessions was to enable small
business owners to use the sale of their business assets to fund their retirement. However
this is a risky approach to retirement saving and these special tax breaks encourage over-
investment in business assets as against other strategies to improve business profitability
and to save for retirement. Small business owners should be encouraged to save for their
retirement through superannuation rather than by avoiding tax on capital gains.
The integrity of CGT would also be strengthened by our recommendations to reduce
opportunities for the avoidance of CGT by shifting assets into self-managed superannuation
funds, discussed below.
Recommendation 1: Capital Gains Tax
The exemption of 50% of personal capital gains from Capital Gains Tax should be reduced
from 50% to 25%, phased in over ten years.
Saving: $0 ($500 million in 2018-19)
Recommendation 2: Small business Capital Gains Tax concessions
The following tax concessions for capital gains from the disposal of small business assets
should be phased out from 1 July 2017:
• the additional 50% discount for these capital gains;
• the exemption for gains on assets held for over 15 years; and
• the exemption for gains used for retirement purposes.
Saving: $150 million ($300 million 2018-19)
22
Recommendation 3: Deductions for personal investment expenses
(1) Income tax deductions for expenses (such as interest payments on debt) relating to
passive investments in assets yielding capital gains (such as housing, shares and
collectables) should be limited to income received from those assets, including
capital gains realised on subsequent sale. This should apply to all new investments
of this type entered into after 1 January 2018.
(2) Part of the revenue saved from this measure should be used to introduce a two-tier
rental housing investment incentive paid as an annual tax offset for a fixed period
(such as 10 years) in respect of new dwellings or improvements for residential rental
purposes, below a fixed construction cost. A higher rate would apply to dwellings
defined as ‘affordable rental housing’, as part of a wider package of incentives to
support investment in affordable housing.
Saving: $150 million ($300 million in 2018-19)
2.2 Adequate, fair and sustainable retirement incomes
The current set of superannuation and age-based tax concessions are not fit for purpose and
disproportionately benefit people on higher incomes. Along with the Age Pension and
essential services such as health and aged care, their purpose should be to enable people to
achieve an acceptable living standard in retirement. Instead, they have become a wealth and
estate management tool for higher income earners, who do not need additional public
support for their retirement, and are unlikely to rely on an Age Pension in any event. This is
undermining the personal income tax base for older people at a time when expenditures on
health and aged care for an ageing population are projected to increase strongly. At the
same time, tax incentives for contributions are skewed towards high income earners and
provide little or no benefit to people with low incomes.
Superannuation tax concessions are the largest component of tax expenditures, totalling
$30 billion in 2016-17, almost as much as the cost of the Age Pension.23
Far from alleviating budget pressures as the population ages, current superannuation tax
expenditure settings are contributing to our budget problems. In 2012, some 30% of the
value of superannuation tax breaks goes to the top 10% of income earners and only 20% are
received by the bottom 50% of income earners.24 Men in the top 10% of the wage distribution
receive more from government in superannuation tax exemptions than they would if they
received the full Age Pension.25 The Federal Government has taken some good reforms in
this area, and we warmly welcomed some of the major components of this package.
23 Australian Government (2016) ‘Budget Statement No 1’, Commonwealth of Australia. 24 Treasury (2013) ‘Highlights of Treasury paper presented to Superannuation Roundtable in April 2012’,
Commonwealth of Australia. 25 Ibid

23
However, this needs to be seen as a first stage of further reform that must remain a priority
for fixing the retirement income system, so that it can deliver security for the community,
particularly people on low and modest incomes, and for the long term.
Taxation of superannuation contributions
Tax concessions for superannuation contributions cost $16 billion, mainly due to the flat 15%
tax applied to employer contributions of up to $30,000-35,000 a year. This concessional tax
rate is inequitable, saving many high income earners over 30 cents in tax per dollar
contributed by their employers, while low income earners pay as much tax on their
superannuation as they do on their wages. Individuals can also contribute up to $180,000 a
year ‘after tax’ (e.g. voluntary employee contributions) and they can then take advantage of
the tax breaks for super fund earnings (discussed below). In addition, they can ‘bring
forward’ up to three times this amount in a single year. As a result, many high income
earners are able to use superannuation as a general wealth accumulation and bequest
planning device, since the amounts they can accumulate in their accounts are well above
what they need for a decent living standard in retirement.
We warmly welcomed four changes to the tax treatment of contributions announced by the
government in the 2016 budget, which make the system fairer than it is now:
(1) The restoration of a tax offset for contributions (now called ‘Low Income
Superannuation Tax Offset’ (LISTO)) for individuals earning less than $37,000 a year:
This ensures that individuals below the tax free threshold do not pay more tax on their
super than they would otherwise pay on their wages (an estimated 1,100,000 people
earn less than $20,000, of whom 60% are women).
(2) The reduction in the annual ‘cap’ for concessional contributions from $30,000-35,000 to
$25,000 (only the top 3% of super fund members contribute more than this).
(3) Extension of the existing 15% ‘surtax’ for contributions for high income earners to
individuals earning $250,000 to $300,000 (only the top 1% of wage earners are affected).
(4) Non-concessional contributions would be capped at $100,000 a year though the three
year ‘bring forward’ provision remains in place.
At the same time, three backward steps were taken, which will mainly benefit high income
earners:
(1) A new tax deduction for employee contributions, which would mainly benefit people on
the top tax rate.

24
(2) Extension of tax breaks for ‘catch up contributions’:
This would mainly benefit men with high incomes rather than women with low incomes,
since few people can afford to contribute over the proposed annual ‘cap’ of $25,000.26
(3) An increase in the rebate for ‘spouse contributions’ which again mainly benefits men on
high incomes, who can afford to contribute for their partner.
Together, these poorly targeted new concessions cost $1.5 billion.27
The government’s superannuation reforms help prevent low income earners from being
financially worse off if they invest in super, and curb the largest tax breaks for high income
earners. Yet they leave the flawed and complex structure of tax breaks for contributions
unchanged. These should be a simpler system in which contributions are taxed at the
employee’s marginal tax rate and an annual superannuation rebate is paid into
superannuation accounts. Tax would be deducted by employers from the contributions they
forward to superannuation funds and the rebate would be paid by the ATO into the fund at
the end of the tax year.
The rebate would be structured according to a ‘100-20-20’ formula: 100% rebate up to a low
level of annual contributions, plus a 20% rebate up to an annual concessional contributions
cap of $15,000. The purpose of the 100% (dollar for dollar) component of the proposed
rebate is to boost superannuation savings for people on very low incomes, especially women
in low paid part time jobs.
The purpose of the 20% rebate is to support compulsory saving for retirement and
encourage voluntary saving to achieve an acceptable standard of living in retirement, taking
account of Age Pension entitlements.
The proposed rebate would simplify the system and make tax support more visible to
encourage retirement saving. Although it would not be income-tested, it would greatly
improve equity in superannuation. Up to the annual cap, each dollar contributed would
attract the same tax concessions (100% and 20%) regardless of income level and the source
of the contribution. It is consistent with the superannuation reform proposals in the Henry
Report, except that it would not reduce employees’ current disposable incomes. It would
leave the majority of superannuation fund members better off in retirement, while curbing
concessions for high income earners.
The annual contributions cap would be adjusted to ensure that the replacement of existing
tax concessions for contributions with the new rebate is revenue neutral (so the $15,000
figure is illustrative).
26 The Grattan Institute estimates that only 51,000 women earning less than $79,000 a year make pre-tax
contributions of more than $25,000, compared to 153,000 men earning more than $79,000 a year (Grattan
Institute (2015), ‘Superannuation tax targeting’).
27 ACOSS (2016), ‘The Government’s superannuation reforms: How to ensure super works for all, not only the
well-off’. Available: http://www.acoss.org.au/wp-content/uploads/2017/01/acoss-brief-onGovernments-super-
policy16.pdf

25
To limit tax concessions for superannuation fund earnings and benefits for people
contributing large amounts to superannuation, the ‘non-concessional contributions cap’
should be reduced from three times the (now lower) concessional cap, and people should no
longer be allowed to accumulate the annual cap over a three year period. Higher
contributions caps for older workers and lifetime contribution caps may appear to be fair at
face value, but in overall terms they mainly benefit people on the highest incomes, who have
the greatest capacity to take advantage of these concessions. They are also contrary to the
purpose of superannuation which is to support long term saving, rather than ‘last minute’
contributions.
Recommendation 4: Superannuation contributions
(1) All tax concessions for superannuation contributions (including the 15% employer
contributions tax rate, deductions for contributions, and rebates for contributions by
low income earners and for spouses) should be replaced in a revenue neutral way by
a two-tier annual rebate paid into the fund, that is capped at a contribution level
sufficient to support (along with the Age Pension) an acceptable retirement income
for a typical worker.
(2) The rebate would be structured as follows:
- 100 cents per dollar contributed from any source up to $500 (indexed to movements
in average fulltime earnings), to support retirement saving by low paid part time
workers and replace the Low Income Superannuation Tax Offset;
- plus 20 cents per additional dollar contributed from any source up $15,000 (indexed
to movements in average fulltime earnings).
(3) The rebate should be reduced to the extent that an individual withdraws funds from
their superannuation account in the same year as they make a contribution, so that
only net additions to savings attract a tax concession.
(4) The annual ‘non-concessional contributions cap’ should be reduced to three times
the new concessional cap, and the ability to contribute up to three years’
contributions within the cap in a single year should be removed.
(5) The ‘catch up’ provisions for concessional contributions should be abolished.
Saving: revenue neutral
Encouraging later retirement
To keep the economy growing and fund essential services as the population ages, it is vital
that more mature-age people retire later, or retire gradually by working on a part time or
temporary basis after leaving their fulltime jobs. One way to encourage people to do so is to
raise the preservation age for access to superannuation from 55 years so that it eventually

26
meets the forecast Age Pension age of 67 years (with important exemptions for particular
groups).
A higher qualifying age for the Age Pension cannot be justified because this would mainly
impact on older people with the lowest incomes and the least choice over the timing of
retirement. This is because many older people have a disability, chronic illness or have to
care fulltime for a family member.
In contrast, a higher superannuation preservation age would mainly affect those who have
greater choice over the timing of retirement because they have substantial savings. It should
be kept in mind that those savings, and the tax concessions that support them, are intended
for retirement purposes rather than ‘early retirement’.
The preservation age should continue to rise beyond the legislated age of 60, at one year per
annum from 2025, until it reaches age 67 in 2032.
A higher preservation age is likely to have a substantial impact on the workforce
participation decisions of those who do have a choice to retire later (mainly people on higher
incomes). It would also send a strong signal to employers that people are generally expected
to continue paid work until at least 67 years.
It is important to emphasise that this reform would not begin to affect access to
superannuation until 2025, by which time we expect typical retirement ages will have
increased significantly. Nevertheless early access arrangements should be established for
individuals who have little choice but to retire sooner due to disabilities or caring roles.
Options include allowing access from age 60 (the preservation age that will apply when the
proposed reform commences in 2025) for people whose impairments or caring roles would
ordinarily qualify them for social security payments (Disability Support Pension or Carer
Payment) whether or not they actually receive those payments. Account should be also taken
of the lower life expectancy of Aboriginal and Torres Strait Islander peoples.
Alternately, withdrawals could be allowed earlier than the preservation age for any purpose
up to modest annual and lifetime limits. If implemented in conjunction with an increase in
the level of compulsory saving this should have no adverse impact on living standards in
retirement. In any event many people on low incomes have as much need to draw upon their
savings (for example due to unemployment, or to meet child rearing costs) during working
life as they do after retirement.
Recommendation 5: Superannuation preservation age
The preservation age should be progressively raised from 60 years (the present legislated
target) to 67 years by 2032, subject to the following exceptions:
(1) Allow continued access to superannuation from 60 years for individuals who are
unable to continue in paid work due to disabilities, poor health or caring roles. This
may include those whose impairments or caring roles would ordinarily qualify them

27
for certain social security payments (such as the Disability Support Pension or Carer
Payment)
(2) Alternately, if superannuation guarantee contributions are increased above 9.5%,
allow all superannuation fund members, after at least five years of saving, to
withdraw a modest proportion of their superannuation balance for any purpose,
within lifetime limits, before they reach the preservation age.
(3) In raising the preservation age, make allowance for the lower life expectancy of
Aboriginal and Torres Strait Islander peoples.
Saving: $0 ($0 in 2018-2019)28
Taxation of superannuation after retirement
Once a superannuation account begins paying a pension, the interest earnings of the fund
are no longer taxed (in the ‘accumulation phase’ they are taxed at 15%). Together with the
removal of taxes from superannuation benefits from 2007, this means that income from
superannuation is untaxed. As well as seriously eroding public revenue, this gives rise to tax
avoidance opportunities that have little or nothing to do with saving for retirement.
People can avoid paying tax on capital gains accrued through their working lives by keeping
assets in a self-managed superannuation fund until they reach the age of 60 and the fund
pays them a pension, at which point the fund’s earnings, including capital gains, are tax free.
In addition, using ‘transition to retirement’ pensions and by other means, individuals aged 55
years and over, older people can ‘churn’ their wages and investment income though their
superannuation accounts and reduce their effective tax rate on at least part of that income
to either zero or 15%. They can do so without actually saving more for retirement.
Individuals can readily avoid the existing 17% tax on superannuation assets passed to their
estate by shifting superannuation assets from concessional to non-concessional accounts.
In this way, superannuation has become an estate management tool as well as a tax
avoidance tool.
The government has adopted some very welcome measures to reduce the scope for tax
avoidance by high income and wealthy individuals by taking advantage of the excessively
generous tax treatment of superannuation after retirement:
• A $1.6 million limit on superannuation assets attracting the zero tax rate on fund
earnings in the ‘pension phase’ (only the top 1% of fund members have this much
wealth in superannuation).
28 The Productivity Commission estimated if the preservation was increased to 65 by 2043, workforce
participation among older workers would rise by around 2 percentage points in 2055 and revenue and
expenditure savings of the order of $7 billion would accrue in that year. See Productivity Commission (2015),
‘Superannuation policy for post-retirement’.
28
• A 15% tax on fund earnings in ‘Transition to Retirement’ accounts (this will help curb
the ‘churning’ strategies discussed above).
• Removal of the ‘refund’ of contributions tax after the death of a fund member.
These changes essentially reduce post-retirement tax concessions for a wealthy minority.
However, as with contributions taxes, they do not alter the flawed structure of taxation of
superannuation in the retirement ‘phase’.
The Henry Report recommended that fund earnings be taxed at the same rate in both
accumulation and retirement phases, though at less than 15%. Given the need to meet the
growing cost of health and aged care services as the population ages (discussed below), and
the fact that taxes on superannuation benefits have been abolished, there is a strong case
for applying the standard 15% tax rate to fund earnings in both phases.
This would greatly improve the integrity of the income tax system for older people. It would
also greatly simplify superannuation because there would no longer be any need to operate
separate ‘accumulation’ and ‘pension’ accounts. In addition, steps should be taken to ensure
that accrued capital gains from assets held in self-managed funds are properly taxed in
retirement, and that the 17% tax on superannuation assets passed on to a fund member’s
estate cannot be avoided. The purpose of superannuation is to improve retirement incomes,
not those of adult children.
The use of this churning strategy to avoid personal income should be curbed by subtracting
any benefit payments from annual contributions attracting tax concessions so that only net
contributions are taxed at the concessional rate.
Recommendation 6: Superannuation fund earnings post-retirement
(1) The 15% tax on fund earnings in the ‘accumulation’ phase should progressively be
extended to the ‘pension’ phase over a five-year period from July 2017 (with a 3%
increase each year).
(2) This tax should be offset by a 15% rebate (minus any imputation credits) for
taxpayers over the preservation age whose income (including Age Pension, earnings
and investment income) falls below that taxpayer’s tax free threshold (taking account
of the proposed adjustments to the Senior Australians and Pensioner’s Tax Offset
(SAPTO)). The rebate would be calculated each year by the ATO and deposited into a
superannuation fund chosen by the taxpayer.
(3) Ensure that capital gains accrued during working life are taxed appropriately when
assets held within self-managed superannuation funds are disposed, or on
retirement.
(4) Ensure that transfers from superannuation accounts to the estates of deceased fund
members (apart from spouses and dependent children) are taxed at the statutory
rate (17%).

29
(5) Revenue collected from these measures (which would rise substantially in later
years) should be earmarked (along with the Medicare Levy increase in
Recommendation 6 and changes to age –based tax concessions in Recommendation
7) for public expenditure on health, aged care and disability services.
Saving: $0 ($1,300 million in 2018-19)
2.3 Sustainable funding for health, aged care and the NDIS
As shown in the Overview, the main expenditure pressures on future public budgets are the
growing cost of health, aged care and disability services. This is a social gain not a fiscal
loss. As a wealthy country, it makes perfect sense to invest in services that enable us to lead
healthier lives, to respond to the needs of an older population and to end the social and
economic exclusion of people with disabilities.
To ensure that everyone benefits from improvements in health care and disability services,
and resources are used cost–effectively, these essential services should be publicly financed
and purchased, and offered to those who need them on a universal basis. This also
strengthens the social compact between citizens and government that essential services are
provided in return for the taxes we pay. The alternative – that ‘users pay’ and are helped to
do so with government subsidies – leads to ‘two-tier’ systems that disadvantage people with
low and modest incomes, the ‘capture’ of subsidies by relatively well-off individuals and
service providers, higher overall costs to government and poorer outcomes.
While there is scope to improve the cost effectiveness of health care funding and services
(including by abolishing the Private Health Insurance Rebate Extended Medicare Safety Net
as proposed in Chapter 6), it is clear that future governments will lack the revenue they need
to fund universal health, aged care and disability services. This goes to the heart of the
budget challenges faced by Commonwealth, State and Territory Governments today.
Recent ‘flashpoints’ include unresolved dispute between the Commonwealth and State and
Territory governments over the funding of health care, and the Government’s claim that the
National Disability Insurance Scheme (NDIS) is ‘under-funded’. The NDIS is a visionary
reform which, if implemented properly, will have far-reaching benefits for people with
disabilities, carers and society. As with other social needs identified in this submission that
have been neglected for years, guaranteeing decent services to people with disabilities and
their carers is a major public financial commitment.
There has been recent political debate over whether there is a $4 billion funding ‘gap’ for the
NDIS and whether social security payments for financially vulnerable people should be cut to
close it. This has caused distress to people with disabilities who rely on the NDIS as well as
the sole parents, unemployed people, people with disabilities, and families with low incomes
threatened with budget cuts. This is the wrong way to pay for major social reform.

30
A fair and sustainable solution must be found to fund essential health, aged care and
disability services, based on people’s ‘ability to pay’. While this problem cannot be solved in a
single budget, we propose that two steps be taken in this one:
• Strengthen the Medicare Levy
• Reform tax concessions for retired people that effectively exclude many people who
can afford to do so from the obligation of paying personal income tax.
Medicare Levy
The Medicare Levy has served Australia well as a funding source for essential health care
services even though it does not cover their full cost. In 2013 there was bipartisan
agreement, and broad public support, for an increase of 0.5% in the Medicare Levy (from
July 2014).
In order to address the revenue challenge we face to fund universal services, one option
debated is to increase the existing Medicare Levy by 0.5% to 2.5%. We conservatively
estimate this would raise $4 billion in 2017-18.29
Our preferred option, which would raise a similar amount, is to remove the exemption for
holders of private hospital insurance from the Medicare Levy high-income surcharge (which
increases the Levy by 1.0% to 1.5% for singles earning over $90,000 and families with
children earning over $180,000). This is a more progressive approach as it only affects
households that are very likely to have a capacity to pay. The removal of the exemption is
unlikely to have a significant impact on private health insurance cover among these
households since they are not income-constrained. In any event, as we argue in Chapter 6, a
reduction in private health insurance cover is unlikely to reduce the cost to governments of
public health care.
Estimates of the impact on public revenue and households at different incomes are given in
the table below.
29 Based on modelling of options to raise the Medicare Levy in 2016-17 undertaken by the Australian National University Centre for Social Research and Methods for ‘The Australian’ newspaper: ‘Nick Xenophon’s Medicare Levy plan.’ ‘The Australian’ 16/2/17. http://www.theaustralian.com.au/national-affairs/health/nick-xenophons-medicare-levy-plan-to-hit-families/news-story/79c98828faa2fa779604b73823a885c6. The revenue estimate is conservative since no account is taken of the impact of wage inflation or population growth from 2016 to 2017.

31
Table 2: Impact of Medicare Levy changes (in 2016-17)
Household
income group
Average
household
income
($)
Increase Medicare Levy by
0.5%
Remove surcharge
exemption *
Average
change in
annual
income ($)
Average
change in
annual
income (%)
Change in
annual
income for
average
earner ($)
Change in
annual
income for
average
earner (%)
top 20% 278,000 -1,300 -0.5%
-4,200
(singles &
families)
-1.5%
(singles &
families)
4th 20% 133,000 -353 -0.3%
-1,625
(singles only)
-1.25%
(singles only)
3rd 20% 86,000 -145 -0.2%
-900
(singles only)
-1.0%
(singles only)
2nd 20% 51,000 -63 -0.1% 0 0%
lowest 20% 24,000 -3 0% 0 0%
Revenue $4,000m $4,000m
Source: Australian National University Centre for Social Research and Methods and ACOSS calculations.
We have adjusted the average incomes for the income groups for inflation from 2013 to 2016.
* Surcharge of 1.0% to 1.5% applies to singles with incomes above $90,000 and couples or families with incomes
above $180,000, so the impact depends on family type as well as income. The estimated impacts shown here are
for families and single people with average earnings for each household income group (shown in the second
column) rounded to the nearest $10,000.30
Due to the high ‘tax free thresholds’ for the Medicare Levy, a 0.5% increase in the Levy
would be progressive, raising a higher share of income (0.5%) from the top 20% of
households than from the middle 20% (0.2%) and the lowest 20% (0%). The impact on a
middle-income family with two children ($145 a year) would be much less than the
Government’s proposal to abolish Family Tax Benefit supplements for families with incomes
below $80,000 (costing the same family $390 a year).31 A similar low-income family would
not be affected by the Medicare Levy increase but would lose $780 a year under the
30 Australian Taxation Office (2017), ‘Income thresholds and rates for the Medicare levy surcharge’ (webpage),
available at: https://www.ato.gov.au/individuals/medicare-levy/medicare-levy-surcharge/income-thresholds-
and-rates-for-the-medicare-levy-surcharge/
31 This takes account of the related proposal to increase Family Tax Benefit (Part A) payments by $10 per week
per child.

32
Government’s proposal. Unlike the Government’s proposal, a higher Medicare Levy would
raise revenue on the basis of ability to pay.
Our preferred option - to remove the exemption for holders of private hospital insurance
from the Medicare Levy high-income surcharge - would be highly progressive. Only families
in the top 20% of households earning over $180,000 would be affected, paying an extra 1.5%
of their income. Among single people without children, only those in the top three quintiles
would be affected and the impact would rise with income. A single person earning $90,000
would pay $900 a year more, a single person earning $130,000 would pay $1,625 more and a
single individual earning $280,000 would pay $4,200 more.
Many high income-earners affected by this proposal have already benefited from the recent
tax cut of up to $315 a year for individuals earning over $80,000 a year. Those with incomes
above $180,000 will also benefit from the removal of the 2% temporary budget repair levy,
which expires in July 2017.32 For example, the single person earning $280,000 in the
example above would save $2,315 from these two changes - reducing the overall cost of the
removal of their Medicare Levy surcharge exemption to $1,885 a year.
Age-based tax concessions
Retirement-related tax concessions are seriously undermining the personal income tax
base among older people. As the population ages, governments will face increasing and
legitimate demands on health and aged care services. However, only 16% of individuals over
the age of 64 pay any income tax, despite increases in the incomes of this age cohort from
employment, investments and superannuation (figure 3). This is not sustainable.
32 https://www.ato.gov.au/General/New-legislation/In-detail/Direct-taxes/Income-tax-for-
individuals/Temporary-Budget-Repair-levy/

33
Figure 3: Proportion of seniors paying personal income tax
Source: Grattan Institute (2016), The age of entitlement: age-based tax breaks
https://grattan.edu.au/wp-content/uploads/2016/11/879-Age-of-entitlement.pdf
Due to growth in user charges for aged care and the government’s 2014 budget decision to
cut the indexation of health funding for the States (reducing funding by $14 billion in a
decade’s time), older people are legitimately worried that health and aged care services may
not be available to them when they are needed. Australia faces a choice: should essential
health and aged care services be paid for through user charges or by raising funds through
the tax system based on people’s ability to pay?
Security in retirement is about much more than superannuation and the pension. The other
key pillars of a decent retirement are affordable housing (discussed in Chapter 5) and
affordable health and aged care. There is little point in accumulating substantial funds in
superannuation (supported by generous tax breaks) if a large share of this has to be spent
on user charges for essential services. This is not an appropriate purpose for
superannuation.
The fairest way to pay for the increasing cost of these services is through the personal
income tax system so that people of all ages contribute according to their ability to pay. This
requires major changes to age-based tax concessions:
1. reducing the generosity of tax breaks for superannuation post-retirement as
proposed in Recommendation 6 (especially by taxing fund earnings in the retirement
phase (but not benefits) at the same 15% rate as in the ‘accumulation phase’); and

34
2. restricting the Seniors and Pensioners Tax Offset (SAPTO) to pensioners and
reducing its generosity.
The revenue savings from these changes should be earmarked (though, as with the
Medicare Levy, not strictly hypothecated), to restore sustainable funding for health and aged
care services. The government should also give a commitment that essential health and
aged care services will be universally available to those who need them, and publicly funded.
The SAPTO is a tax rebate for pensioners and individuals of pension age who have too many
assets to qualify for the pension. The Treasury estimates its annual cost at $700 million.33 It
began as a rebate to prevent individuals receiving the maximum rate of pension (with private
income below the ‘free area’) from having to pay income tax. Over the years it has become a
general tax free threshold of $32,000 for singles and $58,000 for a couple over the pension
age 64 years, in addition to any tax free superannuation payments. This is 50% higher than
the effective tax free thresholds for people of working age, which is inequitable. It cannot be
justified on work incentive grounds since additional tax breaks for older workers are as
likely to encourage them to retire later because they can reach their retirement income
target sooner.
We propose that the SAPTO be replaced with a rebate for people eligible for pensions only,
which is sufficient to exempt the pension and private income within the ‘free area’ from
income tax, and no more.
In addition, the Medicare Levy ‘tax free’ threshold for older people should be adjusted to the
same level that applies to individuals under pension age.34
Recommendation 7: Strengthening the Medicare Levy
The exemption from the Medicare Levy high-income surcharge (applying to families earning
more than $180,000 and single individuals without children earning more than $90,000) who
take out private hospital insurance cover should be abolished from July 2017.
Saving: $4,000 million ($4,100 million in 2018-19)
Recommendation 8: Age-based tax concessions
(1) The SAPTO should be replaced by a tax offset for recipients of pension payments
designed to exempt the pension plus private income within the pension ‘free area’
from income tax, restricted to individuals entitled to a social security pension.
33 Treasury (2016), ‘Tax Expenditure Statement 2015’, Commonwealth of Australia, Canberra.
http://www.treasury.gov.au/~/media/Treasury/Publications%20and%20Media/Publications/2016/Tax%20Expendi
tures%20Statement%202015/Downloads/PDF/2015_TES.ashx 34 Grattan Institute (2016), ‘The age of entitlement: age-based tax breaks’ https://grattan.edu.au/wp-
content/uploads/2016/11/879-Age-of-entitlement.pdf
35
(2) The Medicare Levy exemption threshold for people over 64 years should also be
equal to the relevant pension plus the ‘free area’.
Revenue collected from these measures should be earmarked (along with the Medicare
Levy) for public expenditure on health and aged care services along with revenue from the
superannuation tax changes in Recommendation 6.
Saving: $700 million ($700 million in 2018-19)
2.4 Strengthening the personal income tax system and curbing
avoidance
Tax avoidance arrangements have proliferated over the last few decades due to the failure of
successive governments to remove shelters and loopholes from the income tax system. The
three most important of these are superannuation, the treatment of capital gains and
related deductions, and the inconsistent tax treatment of different entities especially private
trusts and companies. Reforms to reduce the damage done to the integrity of the tax system
by the first two of these tax shelters were discussed above, but if these changes are
implemented there is a risk that high income earners will turn to the remaining tax shelters,
especially private trusts and companies.
Private trusts (especially discretionary trusts) can be used to avoid income tax by splitting
income with a family member, delaying or avoiding payment of CGT, and by passing on the
benefits of investment tax breaks from the trust to its beneficiaries (unlike the tax treatment
of companies). Although the intention of the current tax policy is that any income that is not
taxed in the hands of beneficiaries is instead taxed in the hands of the trust, this is not
consistently applied. In addition, as ‘Operation Wickenby’ revealed, private trusts are often
used to evade tax by making transfers of assets more difficult to trace. Private trusts are
much more widely used than in the past both for investment and active business purposes.
The number of private trusts grew by 50% from 470,000 to 713,000 over the decade to 2012.35
A major reason for this is their use to avoid income tax.
The Review of Business Taxation (Ralph Review)36 recommended that private trusts be taxed
as companies to improve consistency in the tax treatment of different entities. This would
also curb tax avoidance through private trusts by imposing a 30% withholding tax on income
received by the trust, and by denying them the ‘flow through’ of tax preferences which
applies to trusts (but not companies). On the other hand, it would enable high income
35 Australian Taxation Office (2012): ‘Taxation Statistics, Commonwealth of Australia. (2012-13)’, Trusts, table 1.
Available: https://data.gov.au/dataset/taxation-statistics-2012-13/resource/79aeec03-7596-47f8-86db-
b02ca6496699
36 Review of Business Taxation (1999): ‘A Tax System Redesigned: More certain, equitable and durable’. Available:
http://www.rbt.treasury.gov.au/
36
earners to exploit the gap between the company tax rate and higher personal tax rates by
retaining income in the company, so this weakness in the tax treatment of private companies
would also have to be removed.
We propose that private trusts (both fixed and discretionary) be taxed as companies, subject
to exemptions along the lines recommended in the Ralph Review, including complying
superannuation funds and disability trusts.
The use of ‘cashbox companies’ to avoid personal income tax by retaining income in a private
company (where it is taxed at 30% rather than the owner’s marginal tax rate) should be
curbed by taxing retained earnings (minus a reinvestment allowance) in private companies
at the top marginal tax plus Medicare Levy. This tax treatment would also apply to private
trusts taxed as companies under the change proposed above. Where the owner of the private
company would ordinarily face a lower personal tax rate than 30%, they could distribute
company income to themselves in the form of dividends or higher wages.
This reform would be especially important if the company tax rate is lowered for small to
medium sized entities (mainly private companies) as the government proposes. This would
otherwise provide windfall gains to high income-earners using companies as business
vehicles.37
The use of private companies and trusts to avoid or evade tax is facilitated by a lack of
transparency in public reporting, especially regarding the ownership, control, income and
assets of private trusts. The ATO publishes tax information for public companies with income
exceeding $100 million and private companies with turnover exceeding $200 million. There
is no sound reason for the lower threshold for private companies, and the absence of public
data on high-income trusts is a glaring gap in our tax transparency regime.
The House of Representatives Taxation Committee recommended that the government give
Treasury an ongoing mandate to conduct prioritised reviews of tax expenditures and publish
the results.38 If the government subjected tax expenditures to the same rigorous budget
scrutiny as direct expenditures, it could save billions of dollars every year. Large tax
expenditures have risen by $22 billion in the last two years and now amount to 7.8% of
GDP.39
Revenue savings from the handful of major tax expenditures could save at least as much as
is achieved through regular reviews of a much larger number of smaller direct
expenditures. For these reasons, the OECD has suggested that tax expenditures that are
37 We understand the proposed company tax reductions would only apply to active businesses and not companies
used for passive investment purposes (such as investment in real estate where this is not carried out as an active
business); but it is not straightforward to distinguish between the two, so any corporate tax cut is also likely to
benefit many wealthy passive investors. 38 Standing Committee on Tax and Revenue (2015), ‘The Tax Expenditures Statement’, Nov 2015. Available:
http://www.aph.gov.au/Parliamentary_Business/Committees/House/Tax_and_Revenue/Tax_Expenditures/Repor
t 39 Ibid.

37
comparable with direct expenditures should be included within any public expenditure
‘ceilings’, and the following guidelines were developed under its auspices:
• ‘Under nominal or structural deficit or operating/current balance rules tax
expenditures should either be included in the total expenditure cap that is set every
year during budget preparation or in a special tax expenditure cap.’
• ‘All tax expenditures should be reviewed in the same way as regular expenditures in
the annual budget process. They should be reviewed by the financial staff of spending
ministers and the budget bureau in the same way as regular expenditures.’40
Tax expenditures that are poorly targeted or difficult to justify include:
• the SAPTO, discussed above;
• the Private Health Insurance (PHI) Rebate41; and
• ‘grandfathering’ arrangements for previous tax concessions for non-superannuation
termination payments and unused leave entitlements, apart from bone-fide
redundancy payments.
Recommendation 9: The use of private trusts to avoid personal income tax should be
curbed
(1) From 1 July 2018, private trusts (both discretionary and fixed) should be taxed as
companies. This would not apply to collective investment vehicles of certain
categories of excluded trusts including complying superannuation funds, disability
trusts, and trusts established pursuant to court orders.
(2) From July 2018, the ATO should extend its ‘corporate tax transparency’ data to
provide information on all business and investment entities (including companies,
trusts and partnerships) with annual total income over $100 million.
Saving: $0 ($1,500 million in 2018-19)
Recommendation 10: Private companies
From 1 July 2018, income retained in private companies, apart from a reinvestment allowance
comprising a fixed proportion of the assets of the company, should be taxed at the top
marginal rate of personal income tax plus Medicare Levy.
Saving: $1,200 million in 2018-19
40 OECD (2004) Best practice guidelines: off budget and tax expenditures. GOV/PGC/SBO(2004)6 at 4. 41 This rebate is mainly paid as a direct grant, though some claim it as a tax offset. Proposed changes to the
rebate are discussed further in Chapter 5.
38
Recommendation 11: Tax expenditures
(1) From 1 July 2015 the following tax concessions should be removed or tightened:
• The Private Health Insurance Rebate should be abolished 42
• ‘Grandfathering’ arrangements for previous tax concessions for non-superannuation
termination payments and unused leave (apart from bone-fide redundancy payments)
should be removed.
(2) The Government should identify those tax expenditures that have a similar character to
direct expenditures, attribute them to the relevant expenditure Departments, and include
them in an annual Expenditure Review process through a process of ‘envelope budgeting.’
Saving: $400 million ($500 million in 2017-18)
2.5 Business taxes
Tax rules that apply to business activities impact investment behaviour and the efficiency of
business models. As a general approach, business tax reform should aim to improve
economic efficiency and the productivity of investment. The current business tax system
distorts investment decisions in economically and environmentally harmful ways. Tax
reform should remove harmful distortions and support productive economic activities that
are likely to yield stable gains for investors, decent employment opportunities, and reduced
environmental harm. Taxation rules should also ensure that business activities that yield
profits are contributing fairly and efficiently to the collection of public revenue to meet public
needs.
This submission argues for the removal of business tax concessions that are no longer “fit
for purpose”. This requires scrutiny of the purpose of each concession and whether that
purpose remains important: Is that purpose being achieved, or has the concession
arrangement developed into a tax loophole with harmful effects?
Globally, it is now recognised that governments must collaborate to prevent harmful and
unfair tax avoidance and evasion by corporate and other business entities. The G20 countries
have set the standard that: “Profits should be taxed where the economic activities deriving
the profits are performed and where value is created.” The OECD argues that tax cheating by
multinational companies can “produce unintended and distortive effects on cross-border
trade and investment” and that “it distorts competition and investment within each country
by disadvantaging domestic players”.43 Further, multinational companies engaged in tax
avoidance “may profit from these opportunities and have unintended competitive advantages
42 The savings in direct expenses arising from this measure are costed in Chapter 4.
43 OECD, ‘Addressing Base Erosion and Profit Shifting’, OECD Publishing,
http://dx.doi.org/10.1787/9789264192744-en, 2013, p. 39.

39
compared with other businesses, such as small and medium sized enterprises, that operate
mostly at domestic level”.44
The Federal Government has implemented some welcome reforms to tackle corporate tax
base erosion and to prevent the shifting of profits offshore (called ‘base erosion and profit
shifting’). However, more needs to be done. Too many corporations operating profitably in
Australia pay little or no tax to contribute to the funding of public infrastructure and
services. Improving the financial transparency of multinational companies operating in
Australia would help change this behaviour. Transparency rules should extend to other legal
entities (especially private trusts) that are often created to avoid accountability. Further, the
‘thin capitalisation’ rules designed to prevent the shifting of debt to Australia to avoid tax
should be strengthened and the use of ‘tax havens’ or secrecy jurisdictions for this purpose
should be discouraged.
Many existing business tax concessions benefit particular industries - especially those that
are well established and influential - without meeting a clear public purpose. In doing so
they indirectly disadvantage other industries, including emerging sectors. For example, the
existing diesel fuel tax offset for off-road use, together with immediate deductions for
mining exploration costs, disproportionately benefit the mining industry. There is no
particular public benefit in special tax concessions for the mining industry over and above
other economic activity that contributes to economic growth and employment opportunities.
The original rationale for this tax offset was that the purpose of fuel excise was exclusively
to fund publicly-used roads. This rationale is questionable. Fuel taxation is a mechanism for
generating general government revenue. It also recognises the harmful effects on the
environment of burning fossil fuels.
Recommendation 12: International business tax avoidance
1. Base Erosion and Profit Shifting by companies operating internationally should be
curbed by making the following changes from July 2018:
(1) Tighten thin capitalisation rules so that allowable debt deductions are based
on a company’s global debt-equity ratio.
(2) Improve the transparency of reporting on business income and taxation flows
by requiring public disclosure of the ultimate beneficial ownership of
companies registered in Australia; requiring the ATO to publicly release ‘high
level reports’ under the OECD country-by-country reporting initiative in
regard to companies with turnover above $750 million; and requiring the ATO
to share information on the tax status of trusts and partnerships as well as
companies with other tax authorities pursuant to international agreements.
44 Ibid.

40
(3) Apply special withholding taxes on transfers of funds to ‘secrecy jurisdictions’
that do not provide effective information exchange pursuant to international
treaties.
Saving: $500 million in 2018-19
Recommendation 13: Fuel tax credits
Fuel tax credits for off-road use, except agriculture, should be abolished from July 2018.
Saving: $2,000 million in 2018-19
Recommendation 14: Deductions for mining exploration
The immediate deduction for mining exploration should be abolished from July 2017.
Saving: $500 million ($300 million in 2018-19)
2.6 Social taxes
As in other wealthy countries, the social, health, and economic costs of harmful addictions
are increasing in Australia, including the over-consumption of sugar (contributing to
growing rates of obesity and diabetes and other chronic illnesses), and binge drinking
(contributing to poor health outcomes, as well as domestic and community violence).
While these products are not necessarily harmful in themselves, over-use creates what
economists call ‘negative externalities’: they impose costs on the wider community including
immediate family and health services. Leaving decisions to consumers in markets where the
price does not reflect both the personal and social costs from consumption leads to over-
consumption, due in part to incentives for producers to encourage this, for example by
advertising sugary drinks to children.
Higher tax rates on harmful products (‘social taxes’ or ‘pigovian taxes’) are a key part of
effective strategies to reduce these social harms, though tax measures must be
accompanied by effective regulation, promotion, and support services.
The objective of these taxes is not to increase public revenues in the long term (since well-
designed social taxes reduce the consumption of harmful products) and do not necessarily
include reducing overall consumption of related products such as gambling or alcohol
(though in most cases that is a by-product of reform). The aim is to reduce consumption to
the extent that there is clear evidence that it is socially harmful, and the market price fails to
capture the full personal and social costs of harmful consumption
Social taxes should be embedded in comprehensive harm reduction strategies including
regulatory reforms and direct expenditures on relevant services (especially preventive

41
health care programs, which are chronically under-funded compared with acute care45). This
approach has been successfully used to reduce tobacco use, which is declining at all income
levels (though it is still much higher among low income earners) due to comprehensive
strategies pursued by governments to reduce tobacco addiction including through regulation
(advertising, plain packaging), health promotion and taxation.
Unlike tobacco excise, ‘social taxes’ applying to gambling, alcohol, and sugar are applied
inconsistently, leading to inequities and gaps in coverage.
Sugar tax
Australia has one of the highest rates of obesity in the OECD and both are increasing
(especially among children), triggering recent and future increases in the prevalence of
chronic illness such as diabetes.46 Obesity is rising dramatically in Australia: one in four
adults are estimated to be obese, up from one in ten in the early 1980s, and about 7 per cent
of children are obese. Excessive sugar consumption is linked to high levels of obesity and
associated health problems, and should be curbed. A good place to start is to discourage the
production and consumption of water-based drinks with added sugar, since these often have
a very high sugar content and have no nutritional value.47 A proposed tax on sweet beverages
in the UK (to commence in 2018) will apply to drinks with sugar content above 5g/100ml and
at a higher rate of up to 24p/litre for drinks with over 8g of sugar per 100ml. It is estimated
to raise £520m a year, earmarked for preventive health and fitness programs for children.
Soft drink manufacturers have already announced they intend to reduce the sugar content of
their products to bring them under the thresholds for higher taxation.48
45 Funding for preventive health care programs operated by non-government organisations was substantially cut
in the 2014 Federal Budget. 39 Combined rates of overweight and obesity were 63% in 2012, up from 56% in 1995 and 61% in 2007-8. There is
no national strategy to prevent increases in obesity and no national authority to lead this work since the
Australian National Preventive Health Agency was abolished in 2014. [PHAA (2016), ‘Policy-at-a-glance –
Prevention and Management of Overweight and Obesity in Australia Policy’] 47 See Obesity Policy Coalition http://www.opc.org.au/downloads/positionpapers/policy-brief-reduce-sugary-
drinks.pdf and http://www.opc.org.au/downloads/positionpapers/policy-brief-australian-tax-sugar-sweetened-
beverages.pdf 48 Mexico introduced a 10% tax on drinks with high sugar content in 2014. After a year, sales of sugary drinks
dropped by up to 12%. [WHO (2015), ‘Using price policies to promote healthier diets’.]
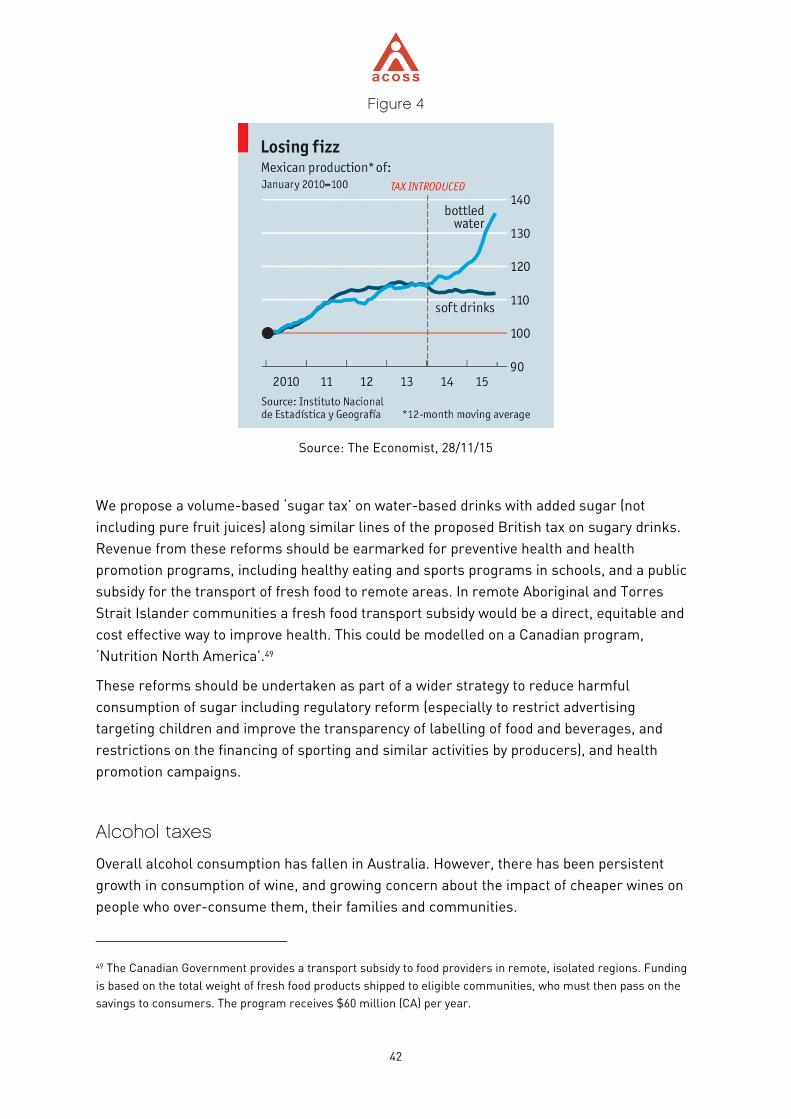
42
Figure 4
Source: The Economist, 28/11/15
We propose a volume-based ‘sugar tax’ on water-based drinks with added sugar (not
including pure fruit juices) along similar lines of the proposed British tax on sugary drinks.
Revenue from these reforms should be earmarked for preventive health and health
promotion programs, including healthy eating and sports programs in schools, and a public
subsidy for the transport of fresh food to remote areas. In remote Aboriginal and Torres
Strait Islander communities a fresh food transport subsidy would be a direct, equitable and
cost effective way to improve health. This could be modelled on a Canadian program,
‘Nutrition North America’.49
These reforms should be undertaken as part of a wider strategy to reduce harmful
consumption of sugar including regulatory reform (especially to restrict advertising
targeting children and improve the transparency of labelling of food and beverages, and
restrictions on the financing of sporting and similar activities by producers), and health
promotion campaigns.
Alcohol taxes
Overall alcohol consumption has fallen in Australia. However, there has been persistent
growth in consumption of wine, and growing concern about the impact of cheaper wines on
people who over-consume them, their families and communities.
49 The Canadian Government provides a transport subsidy to food providers in remote, isolated regions. Funding
is based on the total weight of fresh food products shipped to eligible communities, who must then pass on the
savings to consumers. The program receives $60 million (CA) per year.

43
Figure 6: Annual consumption of alcohol (litres of pure alcohol per capita), Australia
Source: FARE 2014, Submission on the ‘Rethink’ Tax Discussion Paper
The tax system treats different forms of alcohol inconsistently, in particular by taxing cheap
wines at lower rates than other drinks with lower levels of alcohol such as beer.
The Wine Equalisation Tax (WET) and WET Rebate should be abolished and wine and ciders
taxed at (two) uniform rates according to alcohol volumes that lies between the tax rate for
brewed full strength beer and spirits.50
Revenue from these reforms should be earmarked for preventive health programs,
including programs to prevent Foetal Alcohol Spectrum Disorders, and transitional support
for small wine-growers.
These reforms should be embedded in a wider strategy to reduce harmful consumption of
alcohol including regulatory reform (especially regarding advertising and financing of
sporting and similar activities by producers) and health promotion campaigns.
50 According to modelling by ACIL-Allen Consulting for FARE (ACIL-Allen Consulting 2015, ‘Alcohol tax reform
economic modelling’); a common volumetric tax rate for wine at $56.46 (half way between the full strength
draught beer rate of $33.16 and the spirits rate of $79.77) would raise $2.3B in annual revenue and reduce
overall alcohol consumption by 7.1% (mainly by raising the cost of cask wines). The Henry Report also proposed a
uniform volumetric tax.

44
We are aware that, in many cases the proposed changes to alcohol taxation and a sugar tax
would increase prices for people on low incomes, since taxes on consumption are generally
regressive.51 However, beyond this ‘first round effect’, the well-established health and
wellbeing effects of these measures directly benefit people’s economic security over the
long term, provided the higher taxes are well targeted and implemented as part of a
comprehensive harm reduction package. It is essential that revenues collected from these
reforms be earmarked for programs that help prevent and treat the social and health
impacts associated with these products. These programs should especially target, and
benefit, low income households.
Recommendation 15: A ‘sugar tax’ on sweetened drinks
(1) As part of a comprehensive strategy to reduce sugar consumption (especially
among children) where this is harmful to health, and to better incorporate
related health and social costs into its price; from 1 July 2018 a two-tier
volumetric ‘sugar tax’ should be introduced for water-based drinks with added
sugar (excluding pure fruit juices) at rates of 30 cents per litre for drinks with 5-
8 grams of added sugar per 100ml, and 40 cents per litre for those with over 8
grams of added sugar per 100ml.
(2) The revenue from this excise should be earmarked for expenditure on preventive
health care services, health promotion schemes focussing on healthy eating and
fitness, fitness programs for children and young people, and fresh food transport
subsidy for remote areas.
Saving: $500 million in 2018-19
Recommendation 16: Alcohol excise
(1) As part of a comprehensive strategy to reduce alcohol consumption where
this is harmful to health, and to better incorporate related health and social
costs into its price, from July 2018 the WET and WET Rebate should be
abolished, wine should be taxed at a uniform rate of $56 per litre of alcohol
content and ciders at $33 per litre.
(2) The revenue from this excise should be earmarked for expenditure on
preventive health care services, including prevention of foetal alcohol
syndrome.
Saving: $2,300 million in 2018-19
51 That is, they raise more revenue per dollar of income from low income households than higher income
households. For example, gambling expenditure is 1.15% of household expenditure for the lowest income
quintile, almost double the average for all households (0.66%). SACOSS (2016), ‘Losing the jackpot: South
Australia’s Gambling Taxes’. Available:
https://www.sacoss.org.au/sites/default/files/public/documents/Reports/Losing%20the%20Jackpot.pdf

45
2.7 Taxation of charities
This submission sets out in Chapter 6 a range of important recommendations to improve the
adequacy and effectiveness of community services in Australia. In addition, the tax treatment
of charities generally, including those involved in important ‘social benefit’ activities, needs
to be reformed. Currently, the tax treatment of charitable organisations is inequitable and
inconsistent. While some charities including ‘Public Benevolent Institutions’ attract gift
deductibility, others with similar public benefits and charitable purposes do not. For
example, charities which advocate policies to government to reduce homelessness do not
generally have gift deductibility while those that provide services directly to homeless people
do. Both serve an important charitable purpose: the provision of shelter for homeless
people.
Recommendation 17: Deductions for charitable gifts
Extend deductible gift recipient status to those charities whose dominant purpose is
altruistic and for the public benefit.
Costing: $700 million ($800 million in 2018-19)

46
3 Increasing employment and reducing poverty for
people of working age
3.1 Alleviating poverty
Spending on income support for people of working age (Youth Allowance, Newstart and
family payments) currently comprises about 31% of government spending on social security
payments. The proportion of people receiving a working age payment has declined
dramatically since the early 1990s, reflecting improved economic conditions and changes to
payment eligibility criteria. Access to various payments has been tightened over the past ten
years as governments moved to restrict spending on social security. The Age Pension age is
rising to 67 from 65 (and previously 60 for women) and qualification criteria for the Disability
Support Pension has been restricted. Parenting payments have been limited to parents
whose youngest child is under 8 (or under 6 if they are partnered), which has seen many sole
parents moved onto the lower-paid Newstart Allowance (discussed in further detail in
Chapter 4).
The upshot of these changes is that there is a growing number of people receiving lower rate
social security payments (mainly Newstart), which increases the likelihood they live in
poverty. At the same time, a larger proportion of people receiving Newstart have a partial
work capacity due to illness or disability or because they are primary carers of children.
These groups have more difficulty finding suitable employment and remain on
unemployment payments for extended periods of time.
Despite pension and allowance recipients facing similar costs of living, the gap between
allowance and pension payments has grown from less than $60 per week in 2008 to $174
per week today. This payment gap has grown because of the $30 per week increase in
pensions in 2009 (which was not extended to people receiving allowances or parenting
payments), and inferior indexation of allowances, which are only indexed to price
movements and not wages. Furthermore, Newstart has not been increased in real terms in
23 years when it rose by just $2.90 per week above the Consumer Price Index (CPI).
Lifting Allowance levels
The low level of allowances is a major contributor to poverty. The single rate of Newstart is
at least $109 per week below the poverty line.52 Youth Allowance is $158 per week below the
poverty line.53 The latest ACOSS Poverty Report found that allowance recipients are at
highest risk of living in poverty of all social security recipients.54 The latest Salvation Army
52 Defined as 50% of median income. 53 ACOSS, SPRC (2016), op cit, p. 28 54 Ibid.
47
National Economic & Social Impact survey found that people receiving Newstart had just $15
per day in disposable income left after paying for their housing. Eighty-six per cent of
respondents were unable to afford five or more essential items, which is described as
experiencing severe deprivation.55
Governments have justified the low rate of allowances by claiming they are a short term
payment and therefore are there to ‘tide people over’. However, 71% of people receiving
Newstart have received income support for 12 months or more. Further, the severity of
living on such low incomes cannot be justified for even short periods of time, given the chaos
that flows from even shorter periods of severe financial deprivation and the negative effects
on health and wellbeing and capacity to actively pursue paid work
ACOSS has called for many years for an increase to allowances for single people (including
Newstart and student payments) to reduce the most severe poverty and also the gap between
those payments and pensions. The Henry Report called for an increase to Newstart as have
the Business Council of Australia and KPMG, arguing that the low rate of payment presents a
barrier to employment.56
The low rate of allowances has contributed to an increase in the poverty rate among sole
parents, which rose from 26% in 2003/04 to 29% in 2013/14. This is because of the Welfare to
Work changes that moved sole parents from Parenting Payment Single onto Newstart
Allowance when their youngest child turns 8, seeing their income drop by $83 per week (as
at September 2016).
Budgets since 2014 have sought to cut income support payments to people on the lowest
incomes to achieve savings. There remain approximately $7 billion worth of unlegislated
social security cuts, including denying young people income support for five weeks, cutting
supplementary payments for education and training and reducing the incomes of sole parents
with teenage children by up to $65 per week.
In this budget, the government must abandon the approach to budget measures of cutting
the incomes of those with the least. Instead, it should focus on how to lift the incomes of the
three million people living in poverty, including 731,000 children. As a first step, it should
increase allowances by $54 per week (for single people), which would be the sole most
effective immediate measure to alleviating poverty in Australia.
55 The Salvation Army (2016) ‘National Economic and Social Impact Survey’ Key Findings:
http://www.salvationarmy.org.au/Global/Who%20we%20are/publications/2016/ESIS/ESIS_16_Key%20Findings.p
df pp. 5 & 9 56 KPMG (2016), A new reform agenda for Australia Available:
https://home.kpmg.com/au/en/home/insights/2016/12/reform-agenda-australia.html
48
Establishment of Social Security Commission & reformation of
working age payments
Increasing single allowances by $54 per week would bring the single allowance rates to
66.33% of their equivalent couple rate, in line with pension settings. In addition, base rates of
payment should be indexed to wage movements so that they do not fall behind community
living standards and the gap between pensions and allowances does not grow.
We propose that an independent Social Security Commission be established to advise
government on payment rates, means-testing perimeters and indexation arrangements. The
commission would consider spending on social security, the impact of employment
incentives, and would report regularly to the Parliament. ACOSS envisages that the
commission would play a key role in designing a system of payments in line with ACOSS’s
proposal for payment reform as outlined in its submission to the McClure Review: a base
rate of payments sufficient to meet basic living costs, supplemented by add-on payments
that cover the extra costs of individual’s circumstances (disability, children, job search,
etc).57
This kind of reform would remove arbitrary inequities between payments and ensure
payment rates reflect basic financial needs.
Reform of working credit: Income Bank
The income tests for Newstart and Youth Allowance (Other) are complex and inconsistent,
despite recipients being in similar circumstances. They act to reduce the adequacy of the
overall incomes of people in low paid employment, especially for people with intermittent
casual work. The complexity of the system also gives rise to overpayments and debts.
Newstart recipients may earn $52 per week before their allowance is reduced by between 50
and 60 cents in the dollar. A Youth Allowance recipient looking for paid work may earn up to
$71.50 per week before their payment is affected. As the income tests are quite harsh, most
people who get paid work have their allowance reduced. Where the person is undertaking
casual employment, they often need to give Centrelink an estimate of what their income may
be for the reporting fortnight, which leads to errors and inadvertent under- or
overpayments.
The recently introduced harsh and inaccurate Centrelink automated debt detection and
collection system reinforces the complexity imposed on people receiving an unemployment
payment who are in and out of casual paid work. In addition to it being difficult to accurately
report income from casual employment, there is a real risk that government will wrongly
57 ACOSS (2014), ‘Submission to Review of Australia’s Welfare System’
'http://www.acoss.org.au/images/uploads/ACOSS_welfare_review_submission_2014-FINAL.pdf

49
detect and calculate an overpayment if the person has undertaken any kind of employment
at all.58
To make reporting of income easier and increase the real incomes of people in low paid
casual work, ACOSS proposes that people receiving an unemployment payment have access
to an “income bank”, similar to that available to students or Age Pensioners. Both
allowances have a working credit system that operates, on the face of it, like an income
bank, but in reality is complicated and inconsistent with income test thresholds. For
Newstart Allowance, a working credit accrues by up to $48 per fortnight if earnings are less
than $48 per fortnight (which bears no relation to the income-free threshold of $52 per
week). The maximum amount of working credit a Newstart recipient may accrue is $1,000
and Youth Allowance (Other) is $3,500, which are relatively small amounts and take
extended periods of time without paid work to accrue under current policy settings.
An income bank of $4,000 for Newstart and Youth Allowance (Other) that accrues in full over
six months without work would ease transitions into employment and enable people who
secure on temporary or casual employment to increase their real incomes. It would be
easier to understand than the current working credit system and better enable people to
track how much they can earn before their payments reduce. It would also likely reduce the
incidence of debts arising because of estimated earnings that may naturally differ from their
actual earnings (as discussed above).
In the Mid-Year Economic and Fiscal Outlook, a $27.5 million income bank pilot was
announced to encourage Newstart and Youth Allowance (Other) recipients to do seasonal
agricultural work. The measure commences 1 July 2017 and will allow Newstart recipients
to earn $5,000 from seasonal horticultural work that is at least 120 kilometres away from
their usual place of residence without their payment being affected.
This pilot acknowledges the problems faced by people undertaking insecure seasonal or
casual work because of the potential loss of income support without the certainty of future
employment. ACOSS’s proposal, while not as generous, would extend this pilot to all
Newstart and Youth Allowance (Other) recipients regardless of the paid work they carry out,
in recognition that the problems for people regarding seasonal agricultural work apply to
short term, insecure, casual work generally.
Income management and the Cashless Debit Card
Despite successive reviews of income management finding that it has failed to address a
range of social issues it was stated to overcome,59 income management continues to operate
58 Knaus, Christopher (2017), ‘Centrelink staff told not to fix mistakes in debt notices – whistleblower’
https://www.theguardian.com/australia-news/2017/jan/19/centrelink-staff-told-not-to-fix-mistakes-in-debt-
notices-whistleblower 59 Bray, R; Gray, M; Hand, K and Katz, I (2014), ‘Evaluating New Income Management in the Northern Territory:
Final Evaluation Report’. Available:
50
in the Northern Territory and several regions around Australia. First introduced in the
Northern Territory in 2007, more than $1 billion has been spent on income management.
Governments have justified income management as a tool to address a range of issues from
alcohol abuse, to increasing employment. People subjected to income management have
between 50% and 70% of their income support payments restricted to a ‘Basics Card’, which
cannot be used to purchase alcohol, cigarettes, pornography or gambling products
(prohibited goods).
Most people under income management are compulsorily income managed (rather than
volunteering for the program). The latest review of compulsory income management found
this approach ineffective in addressing stated social problems because most people
subjected to it were not spending more than half of their income on prohibited goods. 60 It
also found that building capacity in communities (community development) is far more
important in addressing social issues and that this could not be achieved by ‘simply
imposing restraints’ like income management.61
In this context, ACOSS has also been critical of the introduction of 12 month trials of a
cashless debit card in Ceduna and Kununurra. These trials also impose restraints on
targeted communities by compulsorily restricting 80% of people’s income support payments
to a cashless card that cannot be used to purchase alcohol or gambling services. Unlike
income management which only applies to specific cohorts of income support recipients, the
cashless debit card applies to all recipients of working age payments who live in the trial
sites.
No evaluation framework has been made public for the cashless debit card, nor is there
information about how much is being spent on the trials. Spending on income management
varies between $2,000 and $13,000 per person and it is likely a similar amount is being
spent on individuals in Ceduna and Kununurra.
ACOSS calls for the cessation of compulsory income management and cashless debit cards
in light of the evidence they fail to address a range of social problems governments believe
they will address. Provisions can be made for people who wish to volunteer for the
programs. Opt-in schemes should be co-designed with communities and include wrap-
around supports such as drug and alcohol, financial counselling and social support services.
Community Development Programme (CDP)
CDP is the principal rural and remote employment program for people aged 18-49 receiving
a working age payment. People subject to CDP in these areas and who have a full time work
capacity must carry out 25 hours of designated activity, five days per week, for 46 weeks of
https://www.dss.gov.au/sites/default/files/documents/12_2014/evaluation_of_new_income_management_in_the
_northern_territory_full_repor.pdf p. 320 60 Ibid 61 Ibid. p. 321

51
the year. The obligation to participate commences immediately upon receiving an
unemployment payment. CDP obligations placed on people in rural and remote areas are far
more onerous than Work for the Dole which applies to other people on an unemployment
payment. Work for the Dole obligations commence following 12 months of receiving an
unemployment payment and require a person to participate in designated activities for
typically 15 hours per week, and for six months in every year. Most people compelled to
undertake CDP are Aboriginal or Torres Strait Islander people
A person must complete their CDP obligations to receive income support. Those participants
who are required to work 25 hours per week receive an hourly payment well below the
minimum wage, although they may be required to do work that is normally done by
employees, including in private businesses. This is unlike the former Community
Development Employment Program (CDEP) where participants were paid an award wage for
hours of work done. It also contrasts with the PaTH program, which provides both training
and an income supplement for periods of work experience. The inappropriate and harsh
requirements under CDP are contributing to an extraordinarily high rate of penalties
imposed on CDP participants. The number of penalties imposed on CDP participants in the
first year of the program (2015/16) was almost as high as those under jobactive (146,654
versus 207,633), despite the program being one-twentieth the size of jobactive.62
Most people are penalised under the No Show No Pay provision, where they lose ten per
cent of their income support payment for each day they do not attend their CDP activity
without a valid reason. While, technically, the for-profit and not-for-profit CDP providers
have the discretion to allow non-attendance – for example if they believe that a penalty may
be harmful or that another engagement strategy may be more effective – they are financially
penalised where they do this. Again, this is in contrast to the arrangements in jobactive and
Disability Employment Services where providers retain their discretion to choose the
approach that is best suited to the individual. Again, this contributes to both the burden of
penalties on participants and to the administrative burden on both providers and DHS. The
high failure rate confirms that there are serious systemic problems with the structure of
CDP and ACOSS is deeply concerned that large numbers of people already in poverty are
losing access to even meagre income support payments.
The majority of CDP participants who do access paid work only secure casual employment
(7,404 of 10,500).
Only 3,433 people who commenced employment have stayed employed for 26 weeks of more
(less than a third of all who have commenced work). Between 1 July 2015 and 29 October
62 Senate Finance and Public Administration Legislation Committee ‘Answers to questions on notice’
Supplementary Budget Estimates 2015 – 2016, Question 188,
http://www.aph.gov.au/Parliamentary_Business/Senate_Estimates/fapactte/estimates/sup1617/pmc/index

52
2016, just 1,765 people receiving a working age payment in CDP regions moved off and did
not return to income support.63
The Department of Prime Minister and Cabinet have acknowledged that “of the most
disadvantaged 1 percent of areas in the country, 95 per cent fall in parts of remote Australia
that are serviced by the CDP”.64 It also acknowledged that, ‘[e]ven if all jobs in remote
communities were filled by job seekers there would be a significant labour over supply.’ In
other words, more onerous obligations and excessive penalties are falling on our most
disadvantaged communities, despite the fact that people in these communities have few
opportunities to move into work.
In 2015, the then Aboriginal and Torres Strait Islander Social Justice Commissioner reported
concerns about the potentially discriminatory nature of the obligations imposed on income
support recipients under the CDP scheme. Indigenous organisations and leaders have called
for the scheme to be substantially overhauled, and for a new scheme to be established that
includes a commitment to providing waged work for remote Australians.
People receiving unemployment payments living in remote areas should not be subjected to
more onerous activity requirements compared with people under other employment
programs, particularly when lack of job opportunities is the key reason for unemployment.
The approach to employment programs in remote areas must be tailored to reflect the
unique conditions in these areas. Many people subjected to mutual obligation requirements
face multiple disadvantages without adequate access to appropriate assessment or
services. Any employment program must be designed with this in mind, ensuring that those
who lack service access are not further penalised by the employment services and income
support system.
In the short term, ACOSS recommends that the government:
• Reduce the current Work for the Dole requirements applied to CDP participants to a
level more closely aligned to requirements elsewhere;
• Provide local flexibility in the arrangement of days and hours of participation and
associated supervision and administrative arrangements; and
• Revise CDP contractual arrangements to allow providers to determine when to
recommend breaches based on community and individual circumstances without
penalty.
63 Senate Finance and Public Administration Legislation Committee (2016), ‘Answers to Questions on Notice –
Supplementary Budget Estimates 2016 – 2017 Prime Minister and Cabinet Portfolio, Question 202’
http://www.aph.gov.au/Parliamentary_Business/Senate_Estimates/fapactte/estimates/sup1617/pmc/index p.2.
64 Department of Prime Minister and Cabinet, 2016, ‘Submission to the Senate Finance and Public Administration
Legislation Committee Inquiry into the Social Security Legislation Amendment (Community Development
Program) Bill 2015’, p.3.
53
ACOSS also recommends that the government establish an inclusive, Indigenous-led review
process to redesign the CDP with a view to:
• Establishing a program framework that would give local communities greater
control over the design and implementation of employment services in their own
location;
• Providing positive rewards for engagement, rather than relying on punitive
measures;
• Focussing attention and resources on long term economic and social development
goals.
Any scheme should include a commitment to the establishment of additional, waged work
opportunities.
Recommendation 18: Increase Allowance payments for single people by $54 per week
(1) Allowance payments for single people should be increased by $54 per week from
March 2018, and benchmarked to 66.3% of the combined couple rate of Allowances (a
higher rate in the case of sole parents) as is the case for pension payments. This applies
to people on Newstart Allowance, Widow Allowance, Sickness Allowance, Special Benefit
and Crisis Payment.
(2) Allowance payments for single people on youth and student payments (Austudy
Payment, Abstudy Payment and Youth Allowance) who are either over 24 years of age or
18-24 years and living away from the parental home should also be increased by $54 per
week from March 2018 and benchmarking of those payments to 66.3% of the couple rate
should be phased in.
Costing: $1,900 million ($1,950 million in 2018-2019)
Recommendation 19: Index Allowance payments annually to movements in earnings
From July 2017, Allowance payments for people aged 17 to Age Pension age, and those over
pension age not eligible for an Age or Veteran’s Pension, should be indexed annually to
movements in wages as well as to movements in prices.
Costing: $100 million ($110 million in 2018-19)
Recommendation 20: Establish a Social Security Commission
A Social Security Commission should be established as a statutory authority to advise the
government and Parliament on a regular basis on the financial needs of people relying on
social security payments, appropriate relativities between them, and the budgetary costs and
implications for employment incentives of policy options to improve payment adequacy.
Costing: $5 million ($7 million in 2018-19)

54
Recommendation 21: Replace the working credit scheme with a $4,000 income bank
From 1 July 2017, replace the working credit scheme for Newstart and Youth Allowance
(Other) recipients with a $4,000 income bank that accrues from the day they start receiving
the allowance and would reach the full amount after six months (where the person has been
without work). The income bank should be indexed to the Consumer Price Index annually.
Costing: $300 million ($310 million in 2018-19)
Recommendation 22: Abolish compulsory income management and the cashless
welfare card trials
Compulsory income management and trials of the cashless welfare card should be
abolished in all states and territories. Transition arrangements should be put in place for
individuals and communities wishing to retain voluntary income management and cashless
card schemes. Opt-in schemes should be co-designed with communities and include wrap-
around supports such as drug and alcohol, financial counselling and social support services.
Saving: $95 million ($97 million in 2018-19)
Recommendation 23: Reform Community Development Programme
The Community Development Programme must be reformed to prevent further
disadvantage to communities, which has arisen, in part, because of the onerous
requirements it imposes on participants. Reform must be Indigenous-led, with a new
program co-designed with communities. There must be a focus on the delivery of waged
work, recognising the distinct lack of employment opportunities in remote areas.
Costing: revenue neutral
3.2 Employment services
At 5.7% in December 2016, unemployment remains stubbornly high. Further, over half a
million people - 70% of those receiving unemployment payments - have had to rely on
income support for more than 12 months and many face major barriers to work. Once
people are unemployed long term, their future job prospects diminish. Reducing prolonged
unemployment is the most important task for our employment services system and should
be a core focus of public investment and policy.
Australia under-invests in employment assistance. In 2014, the Australian Government
spent 0.26% of GDP, half the OECD average of 0.53% on active labour market programs.65
65 OECD Social expenditure database. Available: https://www.oecd.org/social/expenditure.htm

55
‘jobactive’ is the government’s main employment program. The government contracts
external profit and not-for-profit providers to assist unemployed people through job search
assistance and referral for work experience, training and other support. After years of
funding reductions in employment services, most unemployed people receive little more
than help to prepare a CV, assistance with job search, and regular interviews which are as
much about supervising compliance with benefit requirements as helping them find paid
work.
The reasons for this lie in the jobactive funding arrangements. Providers receive annual
service fees of $510 per annum to assist the most disadvantaged people (those in Stream C)
and a one-off up-front ‘Employment Fund’ credit of $1,200 to invest in work experience
training and other supports. Unlike the previous ‘Job Services Australia’ program, this fund
is not replenished on an annual basis once a person becomes unemployed long term, except
to fund ‘Work for the Dole’ places.
While on the face of it the Employment Fund targets substantial help for the most
disadvantaged unemployed people, in practice providers have been discouraged from using
it by administrative requirements and restrictions. When they have drawn from the fund, too
much of this money has been spent on low-intensity assistance such as very short training
courses and fares assistance. The Fund would be more cost effective if it was clearly
targeted towards high-intensity interventions such as work experience, training,
professional services and relocation assistance for more disadvantaged unemployed people
(especially those unemployed long term). Assistance with incidental costs such as fares
could be separately funded.
jobactive providers also receive payments for employment outcomes, but this generally
encourages them to concentrate on low-cost interventions that move people who are
already closer to paid work into jobs quickly, rather than patient investment in those with
significant barriers to employment. While higher outcome payments give providers more
scope (and incentive) to invest in people unemployed long term, a typical outcome payment
for an individual unemployed for 12 months in Stream ‘C’ who remains in employment for 6
months is $5,500. If an effective work experience, training or other intervention improves
this person’s job prospects by 10% (an above-average result), then a provider investing more
than $550 would not benefit financially. Yet a sustained 10% improvement in the job
prospects of people who are unemployed long term would greatly reduce unemployment
over time.
In 2016 approximately $250 million was spent on the Work for the Dole program. This is the
‘default’ program for people unemployed long term, which they are required to join for six
months of every year. Participation in work for benefits schemes has little impact on
people’s employment prospects. An evaluation of Work for the Dole in 2014 found that the
average impact of participation in the program on the probability of employment was just
56
two percentage points.66 An evaluation of the United Kingdom’s equivalent scheme,
‘Mandatory Work Activity’, found that participation had no statistically significant effect on
people’s employment prospects.67
The main drawback of work for benefits schemes is that the kind of work experience
participants receive is usually far removed from paid employment opportunities. If, on the
other hand, they were engaged in regular productive employment, then participants should
be paid the legal wage. It is not reasonable to require people to join a program that will not
improve their job prospects, especially where it involves working for less than the minimum
wage – as is the case for those required to work for benefits for 25 hours a week.
As discussed above, a harsher variant of Work for the Dole, the CDP is compulsory for
people living in remote areas, most of whom are from Aboriginal and Torres Strait Islander
communities. The CDP requires all adults between 18 and 49 who are receiving income
support to work for their benefits 5 days a week for 25 hours, for 11 months a year.
In the 2016 budget the government announced a new scheme for unemployed young people,
the ‘Youth Jobs PaTH’ program. This is being funded in large part by diverting funds from
Work for the Dole and the program shifts the emphasis to work experience in regular
employment settings. ACOSS welcomed these aspects of Youth Jobs PaTH but remains very
concerned about other aspects of the scheme. In addition to wage subsidies, which we
support, unemployed people will be referred to unpaid ‘internships’ of up to 12 weeks –
much longer than the existing four week unpaid ‘work experience’ scheme. The main
problem with the internships is that in order to benefit from the work experience and
maximise the chances that the host will keep them on as employees, the ‘interns’ will need
to engage in productive work for which they will not be paid for up to 12 weeks.68 Their
unemployment payment, together with the proposed $100 ‘incentive payment’, will be less
than the hourly minimum wage for working hours over 15 per week in most cases, yet the
internships may extend to 25 hours a week. There are also risks that young people may be
pressured to work longer hours; that existing employees may be displaced; and
occupational health and safety and insurance arrangements are inferior to those that apply
to regular aid employees.
ACOSS will not support the program unless these problems are resolved, including by:
• capping the number of hours in internships or increasing the ‘incentive’ payment to
ensure that the combination of income support and incentive payments provides the
equivalent of a minimum hourly wage or training wage (where accredited training is
provided);
66 Employment Department (2015), ‘Work for the Dole 2014-15 Evaluation Report’. Available:
https://docs.employment.gov.au/node/35376 67 Feargal McGuinness, House of Commons Library (2014): ‘Work Experience Schemes’, 27 June 2014. 68 ACOSS (2016), ‘Policy briefing: the Youth Jobs PaTH scheme’. Available: http://www.acoss.org.au/wp-
content/uploads/2016/05/ACOSS-policy-briefing_Youth-Jobs-PaTH-program_May-2016.pdf

57
• ensuring that ‘interns’ are mentored, and protections put in place to prevent
exploitation and ensure their health and safety are not compromised;
• ensuring that participation is genuinely voluntary, with the option to leave without
penalty at any stage;
• safeguards are put in place to prevent ‘churning’ of people through internships, and
displacement of existing workers; and
• provision of adequate financial assistance with the costs of participation (especially
travel) in the compulsory training component of the scheme.
Wage subsidies for temporary paid employment in regular paid work do not carry the same
risks as the proposed internships, and they are effective in giving people who have been
unemployed for prolonged periods valuable work experience, and employers the opportunity
to test whether they are suitable to fill vacancies. ACOSS welcomed the government’s
decisions in 2015 and 2016 to streamline the various wage subsidy schemes for different
population groups into a single program and to remove spending caps on that program.
Unfortunately, in the 2016 MYEFO the government backtracked on these commitments and
re-imposed caps on the scheme. This is shortsighted since well-designed wage subsidy
schemes are likely to pay for themselves through future savings in unemployment benefits.
To increase the flexibility of employment assistance for people who are disadvantaged in the
labour market, restrictions on access to vocational and other training through jobactive
should be removed. As long as support for training is restricted to preparation for a specific
job, opportunities for people whose skills are out of date to improve their employability are
arbitrarily restricted. Governments invest in vocational education and training because the
skills and qualifications obtained by students improve their career prospects and life
chances. People who are unemployed should not be denied those opportunities. Instead,
training should be better linked to employment by strengthening the role for employers in
the job services system.
A close working relationship between employment services providers, training organisations
and employers is essential to improve the employment prospects of people disadvantaged in
the labour market. As with the previous Job Services Australia system, jobactive throws up
hurdles to such cooperation. These include competition among individual providers (which
means that employers are often approached by many different providers when they would
prefer to establish a lasting relationship with one); the limited resources available to
providers to invest in the work required to establish these relationships in the first place (for
which they cannot use Employment Fund credits); and a reward structure that emphasises
quick outcomes.
In collaboration with the Business Council of Australia and the Australian Council of Trade
Unions, ACOSS identified these barriers to a partnership approach to employment services,
and advanced a set of recommendations to resolve them including:
58
• national and regional employment brokers;
• the establishment of local networks or boards of employers, training and
employment service providers;
• rewards for employment outcomes lasting one year; and
• allowing providers to use Employment Fund resources to finance the preparatory
work required to establish formal partnerships with employers.69
Many people who have been out of paid work for a long time and young people with limited
qualifications who are seeking paid work for the first time, would benefit from skills
assessment and career counselling, This would help them identify the occupations that suit
their skills and aspirations and the training and other support they need to secure
employment in this line of work. Previous programs such as the Jobs Education and Training
(JET) scheme and the Employment Preparation program for sole parents, carers and
mature age workers returning to paid work were relatively effective in identifying and
strengthening ‘latent skills’ and improving future employment prospects, at a modest cost
to the budget.70 These schemes offered career counselling, a fund for service providers to
invest in vocational training tailored to individual needs, and assistance to locate suitable
child care where needed.
Assistance of this kind is not widely available through jobactive because providers are not
resourced to offer it, and the abovementioned restrictions to investment in vocational
training. We propose that a new career transitions program be developed for administration
by jobactive providers or as a stand-alone scheme.
Recommendation 24: A career transitions program
(1) A career transitions scheme should be introduced either within or outside the
jobactive system, to offer career counselling, skills assessment, and access to
suitable training at an early stage of unemployment to the following people in receipt
of working age income support payments who are seeking to enter or return to paid
employment and have not had experience of paid work over the last 12 months:
• primary care-givers of children or people with disabilities and people who
recently relinquished the caring role (who would also be offered help to
secure alternative care);
• people of mature-age (50 years or over);
69 ACOSS, Business Council of Australia and Australian Council of Trade Unions, ‘Partnerships to secure jobs for
disadvantaged jobseekers’ Available: http://www.acoss.org.au/wp-
content/uploads/2017/01/Joint_Statement_Partnerships_to_Secure_Jobs_for_Disadvantaged_Jobseekers_FINA
L_30.6.2014.pdf 70 Department of Employment and Workplace Relations (2006), ‘Employment assistance, a net impact study’.

59
• young people (under 25 years) who have not completed Year 12 or equivalent
education and are not participating in the Transition to Work program.
(2) For those identified as significantly disadvantaged in the labour market, career
counselling should be integrated with other forms of assistance, including where
appropriate paid work experience in regular jobs.
(3) The impact of the scheme on employment and training outcomes should be
evaluated, for example by implementing it in stages and comparing results for
participants and non-participants from the same target groups.
Costing: $50 million ($70 million in 2018-19)
Recommendation 25: Improving the effectiveness of jobactive
(1) From July 2017, service fees for jobseekers who are unemployed for more than 12
months, or in Streams B or C, should be increased from $255 to $355 each six
months.
Costing: $50 million ($50 million in 2018-19).
(2) Funds earmarked for Work for the Dole (including for Work for the Dole
Coordinators) should be untied and reallocated into the Employment Fund to assist
individuals who are unemployed long term with work experience, training and other
assistance that improves their job prospects.
Saving: $250 million ($250 million in 2018-19).
(3) Credits should be made to the Employment Fund in respect of each jobseeker at the
commencement of 12 months and 24 months of unemployment, equivalent to those
made at the commencement of the unemployment spell, to assist with barriers to
employment and help finance ‘mutual obligation’ activities.
Costing: $300 million ($300 million in 2018-19)
(4) The Employment Fund should be divided into two parts:
a. an ‘investment fund’ for substantial investments in activities and services that
improve employment prospects (above and beyond assessment and job
search assistance), such as work experience, training, relocation assistance,
and professional services; and
b. an ‘incidental expenses’ fund for expenses faced by jobseekers and providers
(such as travel to interviews, work related clothing and equipment, and use of
interpreters) which is notionally distributed according to local need for these
services (for example, based on remoteness and English-language
proficiency).
(5) Employment Fund credits should be available for training whether or not this is
linked to a specific job, and for the purpose of establishing ‘demand-led’ schemes,
60
that is, a formal agreement with an employer to supply them with workers drawn
from people who are either unemployed long term or classified within Streams B or
C, and to mentor and train those workers for positions with the employer.
(6) The impact of the above changes should be evaluated, for example by comparing
employment outcomes for similar unemployed people who receive different forms of
assistance through the Employment Fund.
Total costing for this Recommendation: $100 million ($100 million in 2018-19)
61
4 Reducing child poverty: family payments reform The latest ACOSS Poverty in Australia report released in October 2016 found that there are
731,000 Australian children living in poverty, representing 17.4% of children under the age of
15. This figure has increased by two percentage points over the past ten years.71
This is despite Australia being one of the wealthiest countries in the world, experiencing 20
years of sustained economic growth. Children in sole parent families are at particularly high
risk of poverty: 40% of all children in poverty in Australia live in sole parent households.
The lack of any paid income in a family is the major cause of child poverty in Australia with
70% of all children in poverty living in households with no paid work.72 This is also the major
poverty risk among sole parent families.73 We can, and must, do better.
2017 marks 30 years since former Prime Minister Bob Hawke’s pledge to eliminate child
poverty. This anniversary provides a focus for reflection about our progress since then.
While the Hawke government failed to achieve its ultimate objective, it successfully reduced
child poverty in Australia by 30%. The family payments system was at the heart of this effort.
Gains were achieved through a package of reforms to family assistance, including
benchmarking payments to the costs of children and providing significant increases for low
income families. The linking of family payments to wage movements was a core part of this
policy package.
Since then, successive government decisions have eroded the adequacy of income supports
including the family payments system, particularly payments for sole parent families.
Key changes in the last decade include:
• The movement of sole parents with primary school aged children from Parenting
Payment Single to the lower Newstart Allowance (first under the 2006 ‘Welfare to
Work’ changes then in 2013 when the remaining grandfathered group transitioned).
In 2013, this moved 80,000 sole parents onto Newstart with a sole parent family with
two children losing $60 per week. The transition from pension to allowance
payments when the youngest child reaches eight years currently results in the loss
of $83 per week and puts single parents and their children at higher risk of poverty.
• The delinking of family payments and wage movements in 2009, with payments now
indexed only to prices. This has already reduced payments by approximately $20 per
week.
• The exclusion of Parenting Payment Single from the pension increase in 2009.
71 Op.Cit. 72 Peter Whiteford (2009),’ Family Joblessness in Australia’, A paper commissioned by the Social Inclusion Unit of
the Department of Prime Minister and Cabinet, p.4. 73 OECD (2011), ‘Families are Changing’, p. 40.

62
Poverty data shows an increase in poverty in single parent families over the last decade, with
an increase following the Welfare to Work changes in 2006 and the movement of the
‘grandfathered’ group of sole parents onto the Newstart Allowance in 2013. The other policy
change likely to influence poverty rates over time is the 2009 removal of wage indexation of
family payments, which are now only indexed to CPI, gradually eroding the value of
payments.
The latest proposals to cut family payments currently before the Senate would reduce
financial assistance to low income families. The changes would have the greatest impact on
sole parents with teenage children. A sole parent with two teenage children aged 13 and 15
would lose up to $20 per week. A sole parent with a teenager aged 17 will lose $65 per week.
The impact of the proposed changes on single parents is of most concern due to their
already high poverty rates and the barriers to labour force participation
The core purpose of Australia’s family payment system is to protect against child poverty, by
supplementing the incomes of parents on low or modest incomes. Family payments are
intended to cover the extra costs of children (e.g. food, housing, and clothing) but not the
additional costs of child care.
The Federal Government has already legislated further cuts to family payments. With
support from the Opposition, legislation was passed on 30 November 2015 to limit Family
Tax Benefit (FTB) Part B to couple families with children under 12 years of age, delivering
savings of $525 million over the forward estimates. This took effect on 1 July 2016. In
September 2016, further changes to family payments were legislated with support from the
Opposition, including removing the Part A supplement for families on incomes of more than
$80,000 pa (saving $1.6 billion/4 years), freezing indexation of FTB income thresholds (along
with Paid Parental Leave (PPL) thresholds, saving $331 million/4 years) and removing a
$1,000 per annum additional payment for families with new babies (saving $367 million/4
years).
The outstanding unlegislated cuts to family payments have been recently modified and are
now included in an Omnibus Bill, together with other social security cuts and proposed
reforms to childcare. The outstanding cuts to the family payment system are argued to be
necessary to pay for the additional costs of the proposed new childcare package and to fund
the NDIS (see Chapter 6). This is about applying inappropriate political pressure at the
expense of fairness.
Rapidly phasing out remaining end of year FTB Part A and B supplements (currently $726
per child per year for Part A and $354 per family for Part B) by reducing them in two steps
over two years.
1. Abolishing FTB Part B for single parents under 60 years of age at the beginning of
the calendar year their youngest child turns 17.
2. Increasing FTB Part A by $10 per week for each child up to age 19 years, which would
cost an additional $2.3 billion over the forward estimates.

63
These unlegislated cuts would deliver estimated further savings to government of
approximately $2.7 billion over the forward estimates, and result in severe cuts to payments
for low income families.
ACOSS has long advocated reform of the family payments system but is deeply concerned
that the proposed reforms will cause serious financial harm to many low income and
vulnerable families, including single parent families who have already experienced a
number of cuts to payments in the last decade and are at high risk of poverty. The remaining
unlegislated reforms do not have a legitimate policy objective. They will affect those on the
lowest incomes most, including single parent and low income couple households.
Analysis of the changes to family payments proposed shows that, if all of the changes come
into effect:
• A sole parent (under 60) with one child aged 17 years would lose roughly $3,400 per
year.
• Most families will be worse off due to the loss of supplements. The Part A
supplement is $730 per year per child and would be partly offset by the Part A
increase of $520 per annum (resulting in a loss of $210 per child per annum). The
Part B supplement is $354 per family. A dual income family with one primary school
aged child would be $210 a year or $4 a week worse off. A single income family with
a child in primary school would be $560 a year worse off, or $10 a week.
The proposed changes fail to address the major structural flaws in the family payments
system. They would mean that assistance decreases as children get older, despite children
becoming more expensive. They would do nothing to arrest the decline in the value of the
payments by reference to community living standards resulting from the decision by the
previous Labor government to reduce indexation to prices only. The small boost to Part A
($10 a week) would not offset the losses resulting from the withdrawal of the end of year
supplements and the cuts to Part B and would only be paid to about three-quarters of FTB
Part A recipients. ACOSS strongly opposes cuts to family payments for low income families,
as being a further regressive measure that will increase poverty rates among families which
already experience unacceptably high levels of poverty and deprivation.
4.1 A fairer reform agenda
ACOSS advocates the urgent need for reform of the family payments system to achieve the
following objectives:
1. to reduce child poverty in Australia and ensure all children have an acceptable
standard of living;
2. to provide a stable and adequate foundation for the family payment system into the
future, by benchmarking payments to the costs of children as they grow older, and
indexing them to movements in wages and not just to CPI;
3. to encourage paid workforce participation for those who have capacity to work by
removing barriers or disincentives.

64
The current family payments system is failing to deliver on its core purpose of protecting
families with children from poverty. In particular, the current system involves:
• The steady decline in the value of maximum payments compared with community
living standards (and compared with pension rates for adults), since indexation was
reduced from linking to wage movements down to CPI alone in 2009. This has already
resulted in more than $20 a fortnight reduction in the value of the payment.
• The lack of a clear rationale for the maximum rates of payment for children of
different ages and from different family types.
• Inadequate support for the costs of older children, who are much more expensive.
• Inadequate support for single parents with the extra costs of raising a child alone
(the Part B payment for single parents, which was originally intended to fulfil this
purpose, reduces once the youngest child turns five despite increasing household
costs).
The following set of recommendations is designed to address these problems, reduce child
poverty and support increased workforce participation.
Recommendation 26: Reform family payments to better target assistance and reduce
child poverty
The following changes are proposed as a package of reforms, in conjunction with proposals
to increase allowance payments (see Chapter 3) and establish a payments commission to
recommend payment benchmarks:
• Index family payments to wage movements as well as to CPI: Restore previous
benchmarking of maximum rates of family payments to pension rates, based on the
age of each child.
• Replace FTB Part B for single parent families with a Sole Parent Supplement: The supplement should be benchmarked to the costs of children of different ages and reflect the diseconomies of scale experienced by sole parents. As a starting point, the Supplement should be set at a level which brings sole parent families with children in the middle and teenage years at least up to the same income level as families with children under 8 (currently receiving Parenting Payment Single), in conjunction with increases in unemployment payments. On current figures, this would require a Supplement to the value of $114 per week for a sole parent family with one child in the middle years. For a sole parent with one primary school age child the proposed changes would result in a total income equal to 87% of the couple pension rate. The purpose of the supplement is to ensure that this relativity correctly reflects the extra costs of raising a child alone.
Costing: $1,200 million ($1,240 million in 2018-19)74
74 This is an estimate only. Detailed modelling is required to assess the budget impact of this proposal.
65
5 Improving access to affordable housing
In the last year, national reviews of federalism and tax reform, which presented
opportunities for review and reform of affordable housing policy settings and funding
arrangements, have been abandoned. The work of the Affordable Housing Working Group
continues and must enable consideration of affordable housing financing mechanisms, state
planning reforms and regulatory mechanisms. It is important that the Council of Australian
Governments (COAG) communique of December 2016, foreshadows consideration of housing
and homelessness issues in 2017. This has been a key and repeated recommendation of
ACOSS and peak bodies in the housing and homelessness spheres for many years.
A national affordable housing strategy should be developed in partnership with community,
industry and housing policy experts, in negotiation with state and territory governments and
the Opposition, and be underpinned by specific targets. The scope of the strategy should
extend to include:
• reform of housing taxation;
• direct investment in the growth of affordable housing stock and incentives for private
sector and institutional investment in affordable housing;
• an increase in financial support to low income renters; and
• sustained and adequate support for homelessness services.
ACOSS unequivocally rejects the view expressed by some that affordable housing is mainly a
state and territory government issue and is alarmed by recent reports that the Federal
Government may plan to withdraw from the National Affordable Housing Agreement (NAHA)
altogether. The Commonwealth has significant scope to influence the direction of housing
reforms through multiple fiscal, economic and social policy settings, and through its role in
COAG. Using these levers, there is scope for the Commonwealth to not only deliver
substantially increased affordable housing stock and to relieve rental stress, but to improve
rental standards and tenancy regulation across the country.
The 2016-17 Federal Budget failed to deliver new investment in affordable housing
programs or to reverse the cuts to the National Rental Affordability Scheme (in the 2014
budget) and the National Partnership Agreement on Homelessness. While homelessness
services and the people who rely on them received a welcome reprieve in December 2016
with the announcement of a further one year extension of the agreement with indexation,
this funding excludes the capital and research components previously funded and provides
no longer term certainty to services which have been in limbo since 2014.
The lack of policy attention and government investment in affordable housing and
homelessness is economically and socially dangerous.
High housing costs are the biggest source of financial stress in many households,
particularly those on low incomes. ABS data for 2013-14 show that 34% of lower income

66
households in private rental pay more than 30% of gross household income as rent with 11%
of these households having housing costs greater than 50% of their income. A further 10% of
households teeter on the edge of rental stress with housing costs consuming 25-30% of
income.75
ACOSS and SPRC’s latest Poverty in Australia report revealed that, when taking housing
costs into account, the vast majority of people living below the poverty line were in rental
housing in 2014 (60%), with most in private rental housing (44%) compared with 11% in
public housing (due to lower housing costs for public housing tenants). Only 16% of people
living below the poverty line were homeowners, with a slightly higher proportion being
mortgagees than outright owners.76
Home purchase prices continue to rise nationally, rising fastest in our two major cities
(Sydney and Melbourne), which between them house 40% of the population. Average
Australian house prices are approximately 4-5 times average annual household earnings.77
Australia has a shortfall of housing supply, estimated by the most recent reputable
assessment as over 500,000 rental dwellings that are both affordable and available to the
lowest income households.78
One result of these pressures is that many people become, or remain homeless due to a
lack of affordable housing. More than 105,000 people were counted as homeless on census
night in 2011, an increase from just over 89,000 in 2006.79 The latest Australian Institute of
Health and Welfare report on homelessness shows that 279,000 people sought help from
specialist homelessness services during 2015-16: up from nearly 256,000 in 2014-15 and a
33% increase since 2011.80 Notably, around 60% of clients identified housing affordability and
financial difficulties as a reason for seeking assistance, which has remained fairly steady for
the past 3 years.
75 Australian Bureau of Statistics (2015): ‘Housing Occupancy and Costs, 2013-14, Catalogue No. 4130.0, Table 15. 76 See ACOSS and SPRC (2016), ‘Poverty in Australia 2016’, at: http://www.acoss.org.au/wp-
content/uploads/2016/10/Poverty-in-Australia-2016.pdf 77 Ryan Fox and Richard Finlay (2012), ‘Dwelling prices and household income’, Reserve Bank of Australia
Bulletin, December Quarter 2012, available at: http://www.rba.gov.au/publications/bulletin/2012/dec/pdf/bu-
1212-2.pdf. 78 National Housing Supply Council (2013), ‘State of Supply Report 2012’. The actual figure is 539,000. The figure
of 539,000 is arrived at as follows: In 2009-10 there were 857,000 renter households in the bottom 40% of the
income distribution, and 1,256,000 dwellings rented at an affordable price for these households. However,
937,000 of these dwellings were rented by households in higher income groups, leaving only 319,000 available for
rent by low income households – a shortfall of 539,000. 79 Australian Bureau of Statistics (2011) ‘Estimating Homelessness 2011’, p5 80 Australian Institute of Health and Welfare (2016), ‘Specialist homelessness services 2015–16’ available at:
http://www.aihw.gov.au/homelessness/specialist-homelessness-services-2015-16/.
67
5.1 Affordable housing targets
To drive an affordable housing reform agenda, it is recommended that the Federal
Government adopt clear targets to increase the supply of affordable housing and reduce
homelessness as follows:
• halve homelessness by 2020 (to 50,000 people experiencing homelessness on any
given night and 125,000 persons requiring specialist homelessness services each
year);
• halve the shortfall in housing supply available and affordable to the bottom 40% of
household incomes by 2025; and
• meet the shortfall in housing supply available and affordable to the bottom 40% of
household by 2035, thereby ending homelessness caused by lack of housing.
At least 50% of new affordable housing stock should be allocated for those in the bottom
20% of household incomes. Affordable new housing stock should meet accessibility and
energy efficiency standards.
5.2 Improving adequacy of existing funding agreements
Housing programs are currently funded through the National Affordable Housing Agreement
(NAHA) and related Special Purpose and National Partnership payments. The National
Special Purpose Payment (SPP) (which delivers funding agreed under the NAHA) is the
major funding mechanism for affordable housing programs. The NAHA funding includes
funding for homelessness services (estimated at approximately $250 million) with the
balance spent on housing. The agreement is ongoing, with $1.3 billion allocated in 2017-18.
In our last budget submission, we suggested that the future of the NAHA or replacement
national agreement was likely to be determined by the current review of the federation. With
the abandonment of the formal federation review, the process for review and reform of the
NAHA is unclear, as is the scope for external stakeholder engagement in any redesign of the
agreement. The recent reports that the Federal Government may be planning to abandon its
commitments under the NAHA are alarming.
ACOSS has consistently advocated that a new NAHA was needed to ensure significantly
improved transparency and accountability, with more stringent reporting requirements
about outcomes. While the development of a future agreement may take some time, a
process for review and reform mapped out, with meaningful opportunities for community,
industry and academic experts to be actively involved in the process (i.e. such major reforms
should not just be negotiated behind closed COAG doors), steps must be taken in the interim
to improve accountability under current funding arrangements. ACOSS strongly opposes the
Federal Government withdrawing from the NAHA altogether.
Funding for Aboriginal and Torres Strait Islander housing is currently provided under the
National Partnership Agreement for Remote Indigenous Housing (NPARIH). This is a 10-year

68
agreement due to expire in 2018. The Agreement was designed to reduce overcrowding,
increase housing supply, improve the condition of existing housing and improve the
management of rental housing. A review of the agreement is currently underway.81 While
recognising the gains that have been achieved under NPARIH, it is vital that Commonwealth
Government leadership be maintained in this area while the severe housing affordability and
overcrowding challenges experienced by Aboriginal and Torres Strait Islander communities
persist. Therefore, we urge the Commonwealth, States and the Northern Territory to
negotiate adequate and sustainable funding arrangements extending beyond 2018 for
Aboriginal and Torres Strait Islander housing. This should extend beyond remote
communities, recognising the importance of Aboriginal community controlled housing in
regional and urban areas as well, and the linkages between safe and adequate housing in all
areas and broader ‘Closing the Gap’ objectives. Governments should provide certainty for
affected communities well in advance of the expiry of the current agreement.
5.3 Establishment of an Affordable Housing Growth Fund
To meet shortfalls identified by the National Housing Supply Council of at least 500,000
properties available and affordable to the bottom 40%82 will require an investment mix over
20 years of more than $150 billion. Governments cannot be expected to meet that target
alone but must develop incentives to attract it from institutional and other private sources.
The government should establish an Affordable Housing Growth Fund to increase the supply
of affordable housing through government investment. The fund should be strictly
designated for expanding the stock of affordable housing by providing direct capital
funding to State and Territory Governments. Program guidelines should enable housing
providers to draw on a range of financial and planning levers to deliver maximum
affordability and provide mixed tenure developments. Funding in the first year should be
delivered through a revived Social Housing National Partnership Payment to the states
and territories for capital funding of social housing stock, until future funding
arrangements are determined.
5.4 Creation of a new affordable rental private investment
scheme
The Federal Government has a vital role to play in unlocking private finance in affordable
rental housing at scale through the establishment of a national incentive and finance
scheme.
81 See ‘Remote Housing Review’ announced by the Minister for Indigenous Affairs on 18 November 2016. 82 National Housing Supply Council, Op.Cit.

69
With the discontinuation of the National Rental Affordability Scheme in the 2014-15 budget,
there is a significant gap in current policy and funding arrangements. It is imperative that
the funding gap that must be filled to support an ongoing pipeline of investment
opportunities – and enable annual targets to be realised - is acknowledged. In Chapter 2
ACOSS presents tax reform options to generate this funding.
The Affordable Housing Working Group has been investigating options for the design of such
a scheme and has recommended the establishment of a bond aggregator model at the
national level.
It is vital that such any financial incentive scheme be national in scope to ensure viability,
with State and Territory schemes unlikely to be able to achieve the scale required without
support from the Federal Government. Schemes should be designed to enable investors to
use a combination of different incentives to maximise growth in affordable housing stock.
Housing supply bonds have been successful overseas in financing affordable housing and
could play an important role in attracting new forms of private investment at scale in
Australia. The model proposed by the Australian Housing and Urban Research Institute
(AHURI) would involve a combination of government funding and private bond finance
indirectly subsidised through tax incentives and government guarantees.83 The costs of
establishing such a scheme here have been estimated at $25 million in the first year ($145
million over four years), which could raise approximately $2 billion in bonds and generate
more than 7200 new dwellings, in addition to the costs of setting up a housing finance
intermediary. While making a long term commitment, it may be desirable to stage the
development of such a model, with the establishment of the financial intermediary and a
modest bond issue, backed by a guarantee, used initially to promote market responses.
ACOSS welcomes the proposal to develop a bond aggregator model nationally but stresses
that the AHURI proposal requires government funding that can be generated by reform to
current tax concessions available for housing purposes.
5.5 Reform housing taxation
Tax concessions for housing purposes are, at least in theory, designed to improve housing
affordability. In practice, they often have the opposite effect, inflating home prices and rents
by encouraging over-investment in existing housing stock.
The tax benefits of ‘negative gearing’ are heavily skewed, providing ten and a half times the
benefits to the top 20% of households (around $3,800 a year) than they do to the lowest 20%
(around $364 a year).84 More recently, analysis by the Grattan Institute using 2016 taxation
data showed that the top 10% of income earners before rental deductions receive almost
83 AHURI (2014), ‘How might bond finance expand affordable housing in Australia?’ Issue 173, June 2014. 84 Yates, J. (2009),’Tax expenditures and housing’ AHURI, Melbourne.

70
50% of the tax benefits of negative gearing.85 Moreover, over 90% of investment in negatively
geared housing stock applies to existing properties, thereby inflating housing costs and
fuelling speculative booms in the housing market. This tax concession also skews
investment in housing towards individual investors (rather than institutions) and towards
investments yielding capital gains (rather than a stable rental income stream).
Deductions for expenses relating to passive investment in housing, shares, collectables and
similar assets purchased after 1 January 2018 should be quarantined to offset income
received from those assets, including capital gains realised on their subsequent sale. This is
a first step to improving housing market outcomes and reducing the fiscal and social cost of
this tax break. The proposed policy change would have a gradual impact on housing
investment, as it would not apply to assets purchased before budget night 2017.
As discussed in Chapter 2 which sets out ACOSS tax reform proposals, part of the revenue
savings from this change should be used to introduce a more effective incentive for new
investment in dwelling construction for rent. This investment incentive would be paid a lower
rate (in proportion to construction costs) for any new construction of a rental dwelling up to
a certain cost (to exclude luxury dwellings) and at a higher rate for new ‘affordable’ rental
dwellings, defined as housing where rents are held at least 20% below market values for up
to ten years. Both incentives would apply for up to ten years following construction. The
lower investment allowance would be paid as an annual tax offset while the higher one could
be paid either in that form or as a direct payment to the investor. Unlike ‘negative gearing’
concessions, these incentives would be available to institutional investors as well as
individuals, noting that the form of the incentive would need to be tailored to meet the needs
of institutional investors. They would apply regardless of the number of investment
dwellings constructed in each year.
In this way, the purpose of rental investment incentives would shift decisively from assisting
investors to avoid income tax by speculating in existing real property towards directly
encouraging new investment in affordable rental housing.
5.6 Increase of financial assistance to low income renters
Commonwealth Rent Assistance (CRA) provides important assistance to low income
residents of private housing but has failed to keep pace with steep rental inflation, leaving
many struggling to cope with high private rental costs.
Recent data show that most (79%) of Rent Assistance recipients are entitled to receive the
maximum rate of payment due to their rent levels, an increasing proportion of recipients due
to average rents paid by recipients increasing faster than the Consumer Price Index against
85 Grattan Institute (2016), ‘Hot property: negative gearing and capital gains tax reform’, April, p.15.
71
which Rent Assistance is indexed.86 Data also show that Rent Assistance payments do not
come close to achieving affordable rents for many households. For example, the latest
published data from the Australian Institute of Health and Welfare (AIHW) show that in 2013,
58% of young people and 45% of single people remained in rental stress even after receiving
CRA.87
A series of national inquiries have recommended significant reform to CRA, including the
Henry Review, the McClure Review and the National Commission of Audit.
The Henry Review recommended that the maximum rate of Rent Assistance should be
increased and the rent maximum indexed by movements in national rents, which could be
measured by an index of rents paid by income support recipients. It also recommended
changes to the targeting of assistance with eligibility based on rent paid and the income
support means test within the income support system, rather than on eligibility for another
payment (for example, Family Assistance).
The Reference Group on Welfare Reform recommended that the levels and indexation of
CRA be reviewed to ‘ensure it appropriately reflects the costs of rental housing to tenants’. A
redesign of CRA should not be attempted in the budget policy process in the absence of an
open and transparent review including meaningful engagement with key stakeholders. Such
a review should be undertaken as a matter of high priority in 2017. In the meantime, the
maximum rate of CRA should be increased by 30% to provide immediate relief to renters on
low incomes.
The National Commission of Audit (NCOA) report and the Reference Group on Welfare
Reform’s final report both flagged potential reform of CRA to extend eligibility to public
housing tenants and reform rent setting policies. The NCOA indicated support for the
replacement of direct Commonwealth Government investment in housing (including via the
NAHA and National Rental Affordability Scheme (NRAS)) with expanded eligibility for CRA.
While consideration should be given to reform of CRA it should not be a substitute for
Commonwealth investment in the growth of affordable housing stock, but as a complement
to supply side investment. A key issue to resolve is the impact of such reform on the
households affected, especially those in public housing whose disposable incomes would be
reduced sharply if such reform was revenue neutral. We note that due to the targeting of
access to public housing, public tenants are drawn from among the most deeply
disadvantaged groups in the community.
In projecting future expenditure on CRA, the Commonwealth should also take account of the
impacts of public housing transfers, with governments having agreed on a target of 35% of
social housing to be controlled by community housing providers (CHPs). If this target is met
in the next 4 years, it will increase the cost of CRA over the forward estimates by an
86 See Department of Social Services (2016), ‘Annual Report 2015-16’:
https://www.dss.gov.au/sites/default/files/documents/10_2016/dss_annual_report_2015-16.pdf 87 Australian Institute of Health and Welfare (2014), ‘Housing assistance in Australia 2014’. Cat. no. HOU 275.
Canberra: AIHW.

72
estimated $500 million.88 In addition to offering the high quality services for which CHPs are
recognised, such transfers will enable them to raise private finance for both modernising
retained social housing and, where appropriate, leveraging its land value and redevelopment
potential to create additional supply.
5.7 Improve funding and policy response to homelessness
services
Homelessness remains a serious social problem in Australia. Additional investment in
homelessness services under the previous government achieved a reduction in the number
of rough sleepers, but significant growth in the number of people living in overcrowded
dwellings, saw an increase in the rate of homelessness between the 2006 and 2011 Census
periods. The homelessness rate rose by 20% or more in New South Wales, Victoria,
Tasmania and the ACT.89
Homelessness services in Australia are funded through the NAHA (as noted above,
approximately $250 million is allocated to homelessness services) and the National
Partnership Agreement on Homelessness (NPAH). The NPAH was extended again in 2015
for a further 2 years to 2017 ‘while a comprehensive review is undertaken of
Commonwealth-State responsibilities’.90 As noted above, a further extension has just been
announced to 2018. While this is welcome, questions remain about the future adequacy and
security of funding. The rollover in 2014 reduced the quantum of funding by $44 million, by
discontinuing funding for capital and research. This reduction was carried over in the last
rollover. Until the current funding extension, the reduced amount was not indexed.
A future funding agreement should include an emphasis on the prevention of homelessness,
including through addressing early life trauma, and adequately fund effective supported
housing models and the capital costs of service interventions. Stable, long term funding for
research evaluation should also be secured in the negotiation of a future long term
agreement to enable the collection of baseline data and ongoing monitoring of impacts.
88 Calculation based on the transfer of a further 80,000 dwellings, using cost estimates in Pawson, H., Milligan, V.,
Wiesel, I. and Hulse, K. (2013), ‘Public housing transfers: past, present and prospective’, Final Report no. 215
AHURI Melbourne in Tables 7 and 8. 89 Australian Bureau of Statistics (2012), ‘Census of Population and Housing: Estimating homelessness, 2011’,
Catalogue No. 2049.0. 90 The Hon Scott Morrison MP, Media Release – ‘Coalition reverses Labor’s funding cuts on homelessness with a
$230 million commitment prioritizing victims of domestic violence’, 23 March 2015. Available:
http://www.formerministers.dss.gov.au/15931/coalition-reverses-labors-funding-cuts-on-homelessness-with-
230-million-commitment-prioritising-victims-of-domestic-violence/.

73
Recommendation 27: Establish a long term Affordable Housing Growth Fund
An Affordable Housing Growth Fund should be established with a commitment of $750
million in the first year, growing to $10 billion over 10 years.
Costing: $750 million ($1,000 million in 2018-2019)
Recommendation 28: Establish a housing finance intermediary to underpin a future
rental investment scheme
The government should establish the financial architecture to attract institutional
investment in affordable private rental stock at scale.
Costing: $20 million ($35 million in 2018-19)
Recommendation 29: Review Commonwealth Rent Assistance and increase the
maximum rate of CRA
CRA should be reviewed to ensure that it best meets the needs of people who are on low
incomes. As a first step, the maximum rate of CRA should be increased from 1 June 2017
by 30% (approximately $20 per week) for low income households currently receiving the
highest rate of CRA.
Costing: $775 million ($800 million in 2018-19)91
91 Calculated using Stinmod and indexed to growth in CRA expenditure (projected to be more than 3%), based on recent trends.
See DSS, (2016): op.cit.

74
6 Improving access and affordability of essential human services
Access to universal health, early childhood education and care, schools, employment
services (discussed above) and community services for people who are vulnerable,
disadvantaged or most at risk in our community are the essential underpinnings of
Australia’s social fabric. The provision of essential universal and targeted human services is
pivotal to the goals of inclusive growth and productivity, reducing inequality, and creating a
future in which everyone can live with dignity and have access to the opportunities needed to
lead a life they value.
Human services are currently inadequate and not meeting community needs. .
Recent Federal Budget have seen substantial cuts or exclusions to spending on essential
services. These include:92
• Cuts of $80 billion in allocations to the states and territories for health and schools
funding over 10 years (2014-15 budget) with only $4 billion to be restored in the four
years from 2015-16 and no commitments to school funding beyond the forward
estimates period.
• The 2016-17 budget froze the indexation of health Flexible Funds for a further two
years and reduced uncommitted funds provided (a cut of $182 million over 4 years).
• The 2016-17 budget also extended the pause on the indexation of the Medicare
Rebate until June 2020 (a cut of $302 million over 4 years). This affects all services
provided by GPs, medical specialists, and allied and other health practitioners and is
highly likely to reduce the affordability and accessibility of health services to those on
low incomes and escalate demands on hospitals.
• The implementation of significant and welcome increases in childcare expenditure
announced in the 2015-16 budget has been deferred due to the failure to pass the
family payment cuts which were inappropriately linked to the bill. Tighter activity
tests for parents will make quality early learning less accessible to children from low
income or poor families who would derive the greatest benefits.
• The 2014-15 budget cut $534 million from Indigenous programs under the
Indigenous Advancement Strategy (IAS). A 2016 Senate Inquiry and a Performance
Audit by the Australian National Audit Office (2017) were highly critical of the
tendering process used in the IAS.
• The 2014-15 budget cut $165 million over four years through pausing the indexation
of 112 administered programmes for three years. These include critical community
infrastructure such as Family Relationship Services, youth engagement strategies,
NGO Drug and Alcohol Services, mental health supports and Local Solution grants.
92 ACOSS (2016), ‘Budget Analysis 2016-17’ Available at: http://www.acoss.org.au/wp-content/uploads/2016/05/ACOSS-Budget-
Analysis-2016-17_FINAL_small.pdf
.

75
• The 2016-17 budget saw a 30% funding cut ($34.8 million between 2017-18 and 2019-
20) to not-for-profit community based legal services (CLCs) already struggling to
meet the growing demand from vulnerable and disadvantaged people including those
fleeing domestic and family violence. These cuts take effect on 1 July 2017.
The 2017-18 budget must establish an agenda for sustained investment in adequate and
effective human services, including preventive health measures and quality early learning
opportunities for our most vulnerable children. It must also provide the funding certainty
and funding growth required so that essential employment and other community services
can cater to human need as it presents.
6.1 Health
Investment in prevention
Health is one of the largest areas of expenditure growth in the Commonwealth budget.
Expenditure growth is largely due to the costs associated with preventable chronic diseases,
population ageing and health technology and the consequential increased spending on
health and other services, including aged care.93 Access to health services is also one the
highest concerns in the community. The ANU Election Study 2016 ranked Health and
Medicare as the most important ‘non-economic’ issue in Australia with 24% of participants
ranking it as their highest priority compared to 19% in 2013.94
While public health spending fell in many OECD countries after 2009 in efforts to consolidate
public budgets following the GFC, it has gradually been increasing in line with economic
growth since 2013.95 OECD projections anticipate an increase in average public health and
long term care expenditures from 6.2% to at least 8% of GDP from 2010 to 2030.96
The problem is that too much of our public health spend is directed towards tertiary or
hospital services, with inadequate investment in preventive health initiatives. We fail to
prevent a whole range of conditions (namely chronic disease) that significantly inhibit
people’s health and wellbeing while also placing an unsustainable burden on our health
system. Stronger investment in preventive health care and supporting people to adopt
healthier lifestyles would save significant future health care costs.97 For example, the
93 PC (2013), ‘Ageing Population Preparing for the Future’; AIHW (2014), ‘Australia’s Health 2014; Reform of the
Federation Issues Paper Number 3 Roles and Responsibilities in Health’ 94 Cameron and McAllister (2016), ‘Trends in Australian Political Opinion: Results from the Australian Election
Study 1987– 2016’, Australian National University. 95 OECD (2016), ‘Health Expenditure’ Available: http://www.oecd.org/els/health-systems/health-expenditure.htm 96 OECD (2013), ‘What Future for Health Spending?, OECD Economics Department Policy Notes, No. 19 June
2013’, available: http://www.oecd.org/economy/health-spending.pdf. 97 For a strong rationale for preventive services, see for example Australian Government (2010) Taking
preventative action: a response to ‘Australia: the healthiest country by 2020’, Commonwealth of Australia,
Canberra.
76
Victorian government estimates that savings of over $1 billion a year could be made by
better managing chronic illness to avoid hospital visits.
No wealthy OECD country has found the ‘magic bullet’ to stop the public health share of GDP
from rising. Federal Budget in health should be focused not on cutting expenditure, but on a
far better distribution of that expenditure, to ensure it achieves value for money in pursuing
strong health outcomes and in an effective, accessible and affordable health system.
Redirection of existing expenditure
The Private Health Insurance rebate (PHI) continues to be a good example of where current
expenditure does not achieve good public health outcomes. Despite being a significant
component of health expenditure, the PHI rebate has failed in its promise to take pressure
off public hospitals by increasing use of private health insurance. Abolition of the PHI rebate
could save $3.5 billion in expenditure, accounting for the $6.7 billion in foregone tax revenue
from the rebate currently and offsetting the predictable increase in demand for public
hospital services should the rebate be abolished.98 As the former Minister for Health the
Hon. Sussan Ley MP has acknowledged, there is widespread public unhappiness with the
value for money people receive from their current private health cover.99 Savings from the
abolition of the PHI rebate should be redirected into the public health system with full
transparency as to how these savings are spent.
ACOSS remains concerned by the lack of attention being paid to rising out-of-pocket costs
for healthcare consumers and the impact this has on access to services for people on low
incomes who are more likely to experience poor health. An independent review of the
Extended Medicare Safety Net (EMSN)100 showed that less than 4 per cent of EMSN benefits
go to the most socioeconomically disadvantaged 20 per cent of the population.101 This is
because they struggle to afford the gap fees that enable them to reach the EMSN
thresholds. While EMSN benefit caps were set on all consultations as part of the 2012-13
budget, ACOSS is concerned by the lack of public data to assess whether this has reduced
98 Grattan Institute (2013), ‘Balancing Budgets: tough choices we need’ Available:
http://grattan.edu.au/report/balancing-budgets-tough-choices-we-need/. 99 Responding to over 40,000 responses to the Government’s survey of community attitudes to private health
insurance in December, ‘40,000 Australians have their say on private health’, Media Release by the Hon. S. Ley, 5
December 2015. Available: http://www.health.gov.au/internet/ministers/publishing.nsf/Content/health-mediarel-
yr2015-ley151205.htm. 100 The EMSN provides an additional rebate for people who incur out-of-pocket costs for Medicare eligible out-of-
hospital services. Once the relevant annual threshold of out-of-pocket costs has been met, Medicare will pay for
80% of any future out-of-pocket costs for out-of-hospital Medicare services for the remainder of the calendar
year. From 1 January 2017 the annual EMSN thresholds are:
$656.30 for Commonwealth concession cardholders
$2,056.30 for all other singles and families [Department of Health (2016), Medicare Safety Net Arrangements, 1
January 2017, Australian Government). 101 CHERE (2011),’ Extended Medicare Safety Net Review of Capping Arrangements’, Centre for Health Economics
Research and Evaluation, University of Technology Sydney.
77
the costs (or reduced growth in costs) of specialist and allied health services and led to a
more equitable distribution of EMSN benefits across the income distribution.
More fundamental reform is needed including greater transparency for consumers on the
outpatient fees charged by specialists and out-of-pocket costs to patients. Greater price
transparency would place downward pressure on fees. There should also be improved
information on, and access to, public outpatient services.102 An option for reform of the
EMSN is extending bulk-billing incentives currently applied to GPs to specialists. The GP
incentives currently apply on the basis of age (children), geography (providing higher
incentives in rural areas) and concession card status. However, there are many other
criteria that could be used that could make patients and their providers (specialists, in this
case) eligible for such an incentive. It could work on the basis of income, presence of chronic
disease, or people who have reached a threshold in out-of-pocket costs (similar to the EMSN
and the original safety net).
Transparent and affordable healthcare
The Federal Government, in partnership with states and territories, has a fundamental
responsibility to ensure that health services across the continuum are available to the
people who need them and that particular at risk groups in the community are provided with
the services they need to live healthy and productive lives. Universal healthcare is the most
effective, efficient and equitable way to ensure the delivery of adequate health services to
the Australian public. ACOSS continues to argue strongly for universal coverage of essential
health services for the whole community and for measures to improve the accessibility of
those services for people and communities that are currently poorly served. As well as being
more effective in reducing the health burden of the country, this approach enables the
health system to respond to the needs of the community and works to eliminate current
health inequities. ACOSS believes that essential primary health care services should be
delivered through Medicare.
Federal funding of health services, including partnerships with the states and territories
should be:
• appropriate indexed; • evidence-based and adequate; and • focused on performance and improvement of health outcomes across the
community.
Health funding should also be transparent and there should be accountability within
agreements. This would help ensure communities are aware of the funding arrangements in
place and that health funding is being spent efficiently and effectively. Government and
taxpayer expenditure on health is significant and there needs to be an appropriate level of
102 Associate Professor Lesley Russell (2015), ‘Too high: specialist fees hit the sickest patients’, Sydney Morning
Herald, November 24. Available at: http://www.smh.com.au/comment/too-high-specialist-fees-hit-the-sickest-
patients-20151124-gl6ess.html

78
accountability and transparency within the health system. Healthcare services should be
respected as a community asset and vested interests should not be able to access public
funds to provide healthcare services without adequate accountability back to government
and the community.
Affordable oral health
Alongside basic, effective, community based health services, ACOSS has advocated strongly
for reform to ensure that low income households have access to affordable dental services.
ACOSS opposed the 2016 budget proposal to cut funding under the Child Dental Benefits
Schedule (which was recently overturned). However, ACOSS is very concerned that federal
funding for dental health care for people on low incomes is now at an unprecedented low of
$107 million, down from the $391 million originally committed in the 2013/14 budget.103 The
National Oral Health Alliance estimates that this could see up to 338,000 people lose access
to affordable dental care.104
The Australian Institute of Health and Welfare found that individuals already pay 60% of the
total spend on dental care through out-of-pocket costs.105 For people on low incomes, this is
unaffordable and many go without much needed dental treatment. Former Minister Ley has
acknowledged that 63,000 people are hospitalised each year for preventable and treatable
oral health conditions.106 The lack of public dental care not only incurs a cost in our broader
health system; it impacts on the ability of people who cannot get treatment to live their lives,
including eat well, work and be engaged in their communities.
Recommendation 30: Ongoing investment in effective preventive health mechanisms
Investment in preventive health programs should be increased through savings derived from
ineffective health expenditure, maintained on the basis of population growth and effectiveness
of programs.
Costing: $150 million ($154 million in 2018-19)
103 Treasury (2014), ‘Budget Paper No. 3’. Available: http://www.budget.gov.au/2013-
14/content/bp3/html/bp3_03_part_2b.htm 104 National Oral Health Alliance (2016), Two steps back and one step forward for dental care Media Release, 16
December. 105 AIHW: Chrisopoulos S, Harford JE & Ellershaw A (2016), ‘Oral health and dental care in Australia: key facts
and figures 2015’ Cat. no. DEN 229. Canberra: AIHW. Available:
http://www.aihw.gov.au/WorkArea/DownloadAsset.aspx?id=60129554609 p.vii 106 Ley, Sussan (2016), ‘Turnbull Government to double public dental investment’ Media Release, 23 April.
Available: http://www.health.gov.au/internet/ministers/publishing.nsf/Content/health-mediarel-yr2016-
ley23042016.htm

79
Recommendation 31: Remove the Private Health Insurance rebate from 1 July 2017
The rebate has not reduced pressure on public hospitals and should be removed, with half its
savings redirected to public hospitals, community based health services, preventive health
and public dental health services for people on low incomes.
Saving: $3,400 million ($3,500 million in 2018-19)107
Recommendation 32: Abolish the Extended Medicare Safety Net
The Extended Medicare Safety Net should be abolished due to its role in inflating prices, with
its savings redirected to public hospitals and community based services.
Saving: $420 million ($430 million in 2018-19)
Recommendation 33: Increase investment in affordable, accessible dental care for
children and adults
Ensure access to basic, preventive dental care through the public health system for children
and adults, funded through the redirection of savings from the abolition of the Private Health
Insurance rebate.
Costing: $1,200 million ($1,230 million in 2018-19)
Recommendation 34: Remove increased co-payments for PBS-subsidised medications
The savings forecast by the government through the introduction of this budget measure in
2014 should be reversed.
Costing: $450 million ($540 million in 2018-19)
107 Commonwealth of Australia (2016) ‘Budget Paper 1’ at 5-12. Available: http://www.budget.gov.au/2016-
17/content/bp1/download/bp1.pdf

80
6.2 Early childhood education and care
Evidence shows that a well-educated population is the key to Australia’s economic productivity
and social wellbeing. Access to high quality early childhood education and care plays a critical
role in children’s educational outcomes throughout formal schooling, including in areas such
as school attendance, completion rates, behavioural outcomes in class and interest and
motivation.108
National and international research is compelling on the benefits of investing time, effort and
resources in children’s early years, when their brains are developing rapidly. Early
developmental gains support the school readiness of children and their engagement with
education and employment in the years beyond. That said, the Australian Early Development
Census (2015) shows that in 2015, more than 1 in 5 children (22%) commencing school were
developmentally vulnerable on one or more domains and the proportion of children
developmentally vulnerable on two or more domains increased from 10.8 per cent in 2012 to
11.1 per cent in 2015. Of greatest concern to ACOSS is that over the period 2009 to 2015, the
gap between the proportion of developmentally vulnerable children in the most disadvantaged
areas, relative to the least disadvantaged areas, widened across all five developmental
domains.109 It is this data that makes investment in quality early opportunities for children
growing up in disadvantaged communities so pivotal. These children have the most to gain
from participation in quality early childhood education and care but will be denied these
critical opportunities through tightening of parental activity tests.
Despite these benefits, significant numbers of children and young people, particularly from
low income households and disadvantaged communities, are not currently accessing early
childhood education services. In addition to providing an important educational foundation for
children, access to affordable, flexible care for children strengthens women’s workforce
participation.
A package of early childhood education and care reforms formed a centrepiece of the 2015-
16 budget. The package was further revised in November 2015. In the 2016-17 budget, the
implementation of the package was deferred for one year to 2 July 2018. A revised bill, the
Family Assistance Legislation Amendment (Jobs for Families Child Care Package) Bill 2016
was introduced in September 2016, and a further revised package was recently presented to
Parliament as part of an Omnibus Bill.
The revised package will deliver additional investment of $3 billion over the forward
estimates. It includes the following elements:
108 Berlinski, S., Galliani, S. and Gertler, P. (2009), ‘The effect of pre-primary education on primary school
performance’. Journal of Public Economics, 93(1-2), 219-234; Queensland Department of Education, Training and
Employment (2013) ‘Evaluation of the Early Years Centre initiative – Summary Report’. 109 Department of Education and Training (2015), ‘Australian Early Development Census – National Report 2015’,
Commonwealth of Australia. Available at: http://www.aedc.gov.au/resources/detail/2015-aedc-national-report

81
• A new streamlined child care subsidy which will replace the Child Care Benefit
(CCB), Child Care Rebate (CCR) and JETCCFA from 1 July 2017 which will meet:
o 85% of the benchmarked costs of care for families under $65,700 per annum;
o 50% of the benchmarked costs of care for families on incomes of between
$170,000 and $250,000 tapering down to 20% of costs for families on more
than $340,000 per annum (with a fee cap of $10,000 for those on incomes
upwards of $185,000);
• A new requirement that parents participate in at least 4 hours of recognised activity
per week to be eligible for more than 12 hours per week of subsidy (down from
current eligibility for 24 hours per week without activity requirements). Some
exemptions apply (e.g. for grandparent carers);
• The creation of four activity tiers linked to parental activity, with those participating in
less than 4 hours per week of approved activity only eligible for subsidised care if
deemed to be low income, in which they are eligible for 12 hours of subsidy per week;
• The creation of three programs to provide additional assistance for disadvantaged or
special needs children, replacing existing programs. This includes the Additional
Child Care Subsidy, paid to families with children at risk of abuse or neglect, those in
temporary financial hardship, those on income support transitioning to work and
grandparent carers; and
• The replacement of the current Budget Based Funding program, which provides
block funding to Aboriginal, mobile and other children’s services with mainstream,
user pays models, with limited transitional support for affected services.
ACOSS welcomes increased investment in early childhood education and care, and supports
reform to simplify the child care payments system including moving to a single subsidy
payment. However, we strongly oppose the linking of child care funding to proposed cuts to
family payments and other social security payments targeted to people on low incomes.
ACOSS recommends that funding for child care investment be secured from general revenue.
For ACOSS’s alternative proposals for reform of family payments, see Chapter 4.
We have been unable to model the budget impacts of these proposed changes, in part because
of the very limited information released by the government about the distributional impacts of
its policy package and the respective costs of various components of the policy. We note that,
to date, modelling released by the government has been limited to cameos only, which have
included the interaction with family payment cuts. We urge the government to release detailed
modelling of the distributional impacts of its policy changes, including changes to the activity
test and the budget impact of various components of the package.
Under the current system, families are entitled to a minimum of 24 hours per week of
subsidised care and more than 24 hours if they are engaging in at least 15 hours per week of
approved activities. Under the proposed new rules, as noted above, families engaging in fewer
than 4 hours a week of approved activity will only be eligible for just 12 hours a week of
subsidised care, halving their entitlement. This shift to impose more stringent activity

82
requirements is at odds with moves in comparative countries to increase access to free
childcare for all children. For example, the UK government currently provides access to two
days free childcare for children aged 3+ years regardless of parental activity, with both major
parties pledging to increase access to at least 25 hours per week.
ACOSS recommends that all families should be able to access a minimum of two days of early
childhood education and care, regardless of activity level to ensure children in families without
paid work have access to sufficient quality care. Longer-term, we recommend that this form
one of a number of community service guarantees as part of a broader tax and federation
reform agenda.110
Effectively targeted fee assistance
ACOSS broadly supported the Productivity Commission’s model for structural reform of the
child care system which recommended that families on low incomes receive a higher
subsidy (85-90% of benchmarked costs for families under approximately $60,000) with a
linear taper down to a universal base subsidy of 20% -30% for higher income families (above
$250,000).111 The government’s revised child care package adopts an 85% subsidy rate or
families on less than $65,000 per year, but then adopts a two-step taper: to a 50% subsidy
for families on incomes of $170,000-$250,000, then down to 20% for families on more than
$340,000 per annum. The government’s package also increases the fee cap for high income
families, from $7,500 to $10,000 per annum. The relative generosity at the higher end has
increased the overall costs of the package, which the government is now seeking to pay for
through cuts to family payments. This has also made for a more complex system.
ACOSS believes that, beyond a universal base payment, the level of childcare subsidy should
be appropriately targeted to those who struggle with childcare costs. We recommend that
the maximum subsidy of 85% for families on low and moderate incomes be maintained
(under $65,000, as per the government’s proposal) but that the two-step taper be replaced
by a linear taper to a base rate of 30% for families on $250,000 per annum or above. We also
recommend the subsidy cap for higher income families be maintained at its current level
($7,500) and indexed,112 rather than increasing it to $10,000 as proposed in the government’s
package. Affected families should be able to adjust their subsidy rate to ensure they
maintain access to subsidy all year if they are likely to hit the cap.
These changes would ensure that resources are available to address the gaps in the child
care system for low income and developmentally vulnerable children.
110 See The COSS Network (2015), ‘Fit for purpose: a federation that guarantees the services people need’.
Available: http://acoss.wpengine.com/wp-content/uploads/2015/10/COSS-federation-framework_FINAL.pdf. 111 The Productivity Commission’s Final Report recommended 20% down from 30% in its Draft Report. 112 Indexation of the cap was frozen in 2011 for 3 years. Indexation should be to movements in child care prices.

83
Establishment of Aboriginal and Torres Strait Islander community
based program
The existing Budget Based Funding program would be abolished under the proposed
reforms. The program currently funds 303 services across Australia, most of which are
Aboriginal and Torres Strait Islander focused. From 1 July 2017, these services will have to
operate on the mainstream, fee-based, Childcare Subsidy. ACOSS is concerned about the
viability of this funding model for Aboriginal and Torres Strait Islander services and families.
We are also concerned that the reform package fails to deliver investment in the creation of
additional Aboriginal and Torres Strait Islander child care services, despite the Productivity
Commission report highlighting that an additional 15,000 early childhood education and care
(ECHC) places would be needed to close the gap in Aboriginal and Torres Strait Islander
children’s attendance.113
We support the Secretariat of National Aboriginal and Islander Child Care (SNAICC)’s
recommendation to establish an Aboriginal and Torres Strait Islander community based
program within the new Child Care Safety Net.
The government has been working with budget Based Program funded services, and has
recently given an undertaking to ensure that the work of Budget Based Funded services
continues, and to significantly change the way the Community Child Care Fund will operate,
to ensure funds reach services currently part of the Budget Based Funded programs. We
support measures that ensure that BBF services, including Aboriginal and Torres Strait
Islander programs, will not be required to transition to rely only on Child Care Subsidy and
Additional Child Care Subsidy funding. It is important that programs reaching children in
regional and remote areas (including playgroups, mobile services and outside school hours
care114) have a sustainable, stable and equitable funding model that reflects higher delivery
costs; have an integrated funded formula that provides services with the flexibility to
respond to child and family needs where a user pays model is insufficient; and provide top
up funding for operational costs to redress services’ income gap from the mainstream
subsidy and fees based on 3-year applications.
Ensure that low income families who are not in paid work are no
worse off
Under the proposed new childcare package, additional fee assistance will be available for
some parents on income support who are seeking to transition to work through the Additional
Child Care Subsidy which will replace the existing JETCCFA program. The impact of this
change on very low income families is difficult to determine. We repeat our call for the release
of detailed modelling of the distributional impacts of the proposed policy changes and seek
113 Productivity Commission, ‘Childcare and Early Childhood Learning’, Report No. 73, October 2014, p.525. 114 Secretariat of National Aboriginal and Islander Child Care (2016), The Jobs for Families Child Care Package: Unintended
consequences and policy alternatives for Aboriginal and Torres Strait Islander children, SNAICC, February.

84
assurances from government that affected low income families will not be worse off because
of the proposed changes, including single parent families who are beneficiaries of the current
scheme.
Recommendation 35: Redirect savings from tightening of income test and caps for higher
income households to address improve access for children in low income families
1) Replace the proposed three-tiered subsidy with a simpler and more sustainable two-
tiered model (a linear taper), with a maximum subsidy of 85% for families on less than
$65,700 tapering to a base subsidy of 30% for households on more than $250,000 per
annum.115
2) Reduce the subsidy cap for higher income households from $10,000 to $7,500 per
annum, and resume indexation.
3) Provide a minimum of two full days of subsidised early childhood education and care
per week for all families, regardless of activity. Activity requirements should apply only
to families seeking care for more than two days per week.116
4) Establish an Aboriginal and Torres Strait Islander community based program within
the new Child Care Safety Net, which provides children with 22.5 hours or three
sessions of ECEC per week and enables the provision of playgroups, mobile services
and outside school hours care in regional and remote communities.117
Costing: Revenue neutral118
6.3 Community Services
Community services designed to support people who are vulnerable, disadvantaged or at
risk demand adequate funding so that national social justice objectives including those to
reduce domestic and family violence can be realised. The funding climate for essential and
innovative community services since the 2014-15 budget has been one of chronic and
prolonged uncertainty. The combination of cuts, followed by partial reversals or freezes or
the ‘repackaging’ of funding allocations has wrought havoc in critical areas of social
115 The Productivity Commission estimated the cost of tapering to a base rate of 30% (instead of 20%) at
approximately $185 million per annum, compared to its alternative model, but these costs would be offset by the
removal of the proposed mid-tier 50% subsidy rate for families on $170,000-$250,000. See Productivity
Commission, Childcare an Early Childhood Learning, Inquiry Report Volume 2, No. 73, 2014 at Figure 16.15. 116 The Productivity Commission estimated the cost of removing the activity test altogether as more than $1
billion per year, while the cost of removing the test for those on Parenting Payment and increasing the minimum
weekly entitlement to 20 hours per week was estimated at approximately $250 million per annum. See
Productivity Commission (2014), Childcare and Early Childhood Learning, Inquiry Report Volume 2, No. 73, 2014
at Figure 16.15. 117 Estimated cost of $100 million per annum. 118 The new system is due to start on 2 July 2018. It is proposed that any additional costs not met by the changes
to income tests and subsidy rates would be covered through the redirection of savings committed through
previous cuts to the package from the 2015 MYEFO as well as the 12-month delay in implementation of the
scheme. Detailed modeling is required to assess the net impact of the changes.

85
infrastructure. Indexation has not been adequate to account for rises in wage costs.
Providers cannot plan for quality delivery and clarify service models let alone innovate, when
community sector workers are uncertain about their futures. While restoration of funding
cuts for services and sector development cannot unpack the damage felt by people who have
been unable to access essential services, staff who have lost their jobs or organisations with
long-established relationships and trust in communities with pronounced needs, it can mark
the beginning of a more certain future.
A broader suite of community services provides essential supports for people whose
economic, social and cultural rights and rights to fair hearings and fair trials are being
abrogated by poverty and budget cuts in the context of rising needs. This requires a new
approach to sustainable funding for community services which provides greater certainty
and responds to data on rising levels of demand. It also requires Australia to build a policy
framework to support social innovation. This has been a stunning oversight in the Federal
Government’s ‘innovation’ agenda and is essential if we are to build more effective ways of
working and to improve outcomes for those in greatest need.
The Federal Budget should make provision for, at a minimum, a restoration of the pre-
existing funding levels for community services, commencing from 1 July 2018, in order to
fund recommendations arising from a comprehensive and transparent mapping of service
needs in 2017. ACOSS seeks collaboration between the community sector and Australian
Government so that the sector can develop in a sustainable and inclusive way with funding
levels responsive to key datasets on service demand and unmet needs including the annual
ACOSS National Community Sector Survey, the annual Productivity Commission report on
Government Services and biennial report on Overcoming Indigenous Disadvantage.
Mapping is critical to determine where needs lie and how best to meet them. It must give
recognition to the value community sector providers deliver within a civil society spanning
service delivery, policy, advocacy and representation by and of people experiencing poverty
and inequality. Future service agreements and contracts should include provision for
reasonable compensation to providers for the costs imposed by changes in government
policy that affect the delivery of the contracted services. Common examples include changes
to eligibility rules, the scope of the service being provided, or reporting requirements. This
was recommended by the Productivity Commission in its Report on the contribution of the
not-for-profit sector (rec 8.1).119
The Australian Government’s National Innovation and Science agenda is squarely situated in
a space that focuses on supporting businesses, industry and research partners to take risks
and to commercialise promising discoveries. These are important national objectives but
ignore the importance of fostering innovation in the delivery of social services despite the
desperate need to generate more effective responses to increasingly complex and
interdependent needs that do not fit neatly into single funding silos. They instead require a
119 Productivity Commission (2010) Contribution of the not-for-profit sector. Available at:
http://www.pc.gov.au/inquiries/completed/not-for-profit

86
more holistic approach to understanding problems and new ways of collaborating and
approaching the ‘co-design’ challenge across people using services, service providers,
funding bodies and the research community.
ACOSS seeks a budget allocation of $3 million in 2017-18 so that these groups can work with
government to develop a social innovation framework. A genuine and synergistic dialogue is
required to:
• discuss new service models or ways of working that can drive improved outcomes for
individuals, families and communities in need;
• develop a shared understanding of social and public value and the savings which can
be generated through greater investment in effective early intervention and
prevention;
• determine priority areas and additional expenditure required to support community
service organisations of different sizes to engage in innovation, evaluation and
monitoring;
• analyse what social innovations have been enabled by, or could be enabled by,
investment from the Future Fund and social outcome funds developed
internationally; and
• consider what alternative funding models might look like and how we build the
capacity of the community sector and other stakeholders to drive the changes
demanded by intractable social problems in a way that is more responsive to
emerging needs and which creates new opportunities to build a more equal and
sustainable future.
Recommendation 36: Restore community service funding levels, including through the
Indigenous Advancement Strategy
Provision for restored funding levels to pre-2014-15 Federal Budget Levels, commencing
from 1 July 2018
Costing: $0 ($1,886 million in 2018-19)
Recommendation 37: Index community services funding to wage movements
Ensure funding for the delivery of community services is tied to the 2016 MYEFO Wage Price
Index.
Costing: $379 million ($391 million in 2018-19)

87
Recommendation 38: Direct representation of community services in mapping service
needs and competition policy reform
Ensure direct representation of non-profit community services in mapping service needs,
estimating the value these organisations add to civil society, and in ongoing dialogue on
competition policy reform including, but not limited to, the Productivity Commission Inquiry
into Human Services
Costing: revenue neutral
Recommendation 39: Develop a social innovation framework and funding model
Costing: $3 million
6.4 Aboriginal and Torres Strait Islander Budget Measures
For Aboriginal and Torres Strait Islander people, inequalities in key economic and social
outcomes remain as consistent and they are profound. There have been important
improvements between 2002 and 2014-15 in mortality rates for children and educational
participation and employment relative to non-Indigenous Australians. Yet in the same period
there was no progress on ‘closing the gap’ in rates of family and community violence.
Outcomes have worsened in areas spanning hospitalisations for self-harm (a 56% increase
in the decade to 2014-15) while the adult imprisonment rate increased 77 per cent between
2000 and 2015, and the juvenile detention rate for Aboriginal and Torres Strait Islander
young people is 24 times the rate for non-Indigenous youth. 120
ACOSS strongly supports the 2016 Redfern Statement and urges the Australian Government
to work with Aboriginal and Torres Strait Islander national organisations and leadership to
develop policy and budget measures. It is essential to support meaningful dialogue and
transformative action by the 45th Parliament on the priorities identified by Aboriginal and
Torres Strait Islander peak bodies in the Redfern Statement of June 2016. These issues span
engagement, health, justice, violence prevention, disability, children and families.
This Submission has set out the following recommendations regarding programs and
services that particularly affect Aboriginal and Torres Strait Islander communities: abolish
compulsory income management and the cashless welfare card trials (Chapter 3);
• reform the Community Development Program via Indigenous leadership and co-
design with communities with an emphasis on creating secure waged
employment (Chapter 3);
120 Productivity Commission (2016), ‘Overcoming Indigenous Disadvantage: Key Indicators 2016’. Available at:
http://www.pc.gov.au/research/ongoing/overcoming-indigenous-disadvantage/2016

88
• establish an Aboriginal and Torres Strait Islander community based program
within the new Child Care Safety Net (Section 5.2) including playgroups, mobile
services and outside school hours care in regional and remote communities; and
• conduct comprehensive mapping of need for community services for Aboriginal
and Torres Strait Islander communities, funded under both the Indigenous
Advancement Strategy and the Department of Social Services, and provision to
restore the funding cut from these services in the Federal Budget 2014/15
(above)
• negotiations between the Commonwealth, States and the Northern Territory for
adequate and sustainable funding arrangements extending beyond 2018 to
address overcrowding and increase the supply of Aboriginal community
controlled housing in remote, regional and urban areas (Chapter 6).
These measures are not comprehensive regarding addressing the social and economic
inequalities experienced by Aboriginal and Torres Strait Islander people. However, they are
important reforms identified by ACOSS in its priority policy areas. In addition, ACOSS argues
for funding to support institutional capacity so that the voices of Aboriginal and Torres Strait
Islander communities can be heard in policy processes and national decision-making. This is
pivotal if a cardinal referendum on constitutional recognition for Aboriginal and Torres Strait
Islander peoples is to occur in 2017.
Recommendation 40: Core funding for institutional capacity of Aboriginal and Torres
Strait Islander representation
Provide core funding for the institutional capacity of Aboriginal and Torres Strait Islander
representation in policy making and national decision-making
Costing: $3.5 million ($3.6 million in 2018-19)

89
Overview