budgeting for profit and cash: three steps for better...
TRANSCRIPT
2015 Ernest N. Morial Convention Center • New Orleans • Louisiana
Budgeting for Profit and Cash: Three Steps for Better Cash Flow
Sunday, Feb. 22, 2015
10:00 a.m. – 11:45 a.m.
Presented by
Steve Abercrombie and
Barbara Nuss, CPA
Profit Soup Tukwila, Wash.
American Rental Association 1900 19th St., Moline, IL 61265 800-334-2177 ARArental.org
© 2015 1
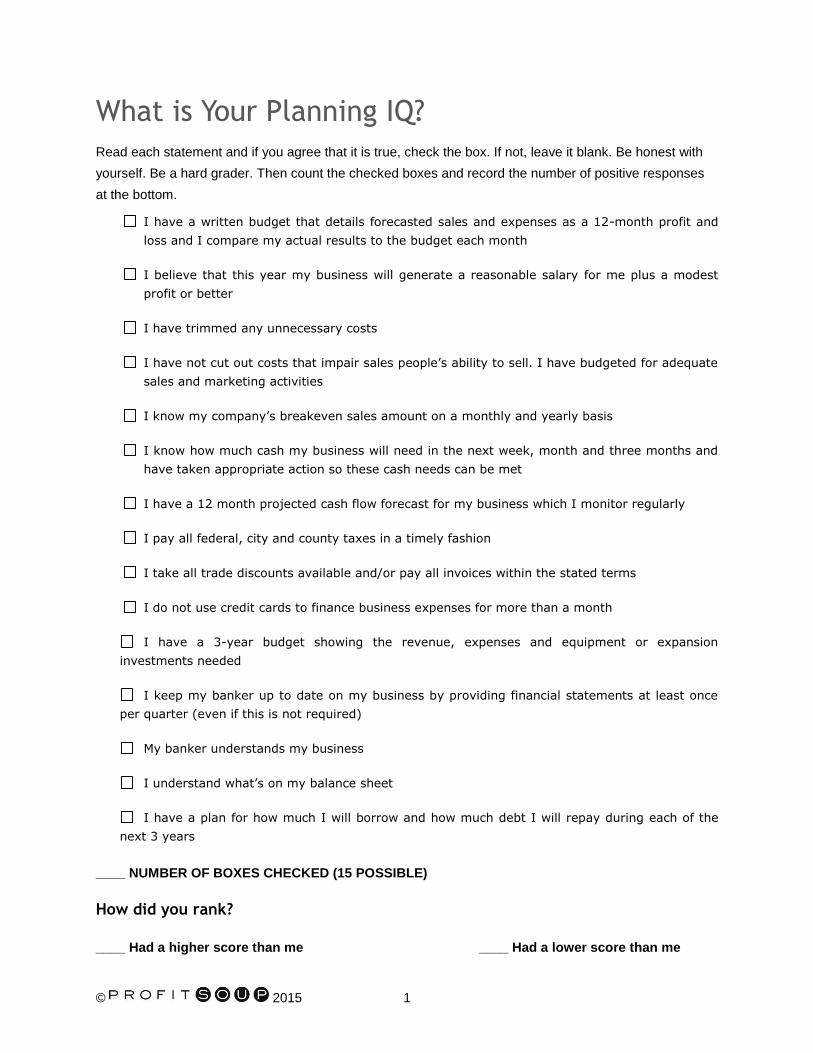
What is Your Planning IQ?
Read each statement and if you agree that it is true, check the box. If not, leave it blank. Be honest with
yourself. Be a hard grader. Then count the checked boxes and record the number of positive responses
at the bottom.
I have a written budget that details forecasted sales and expenses as a 12-month profit and
loss and I compare my actual results to the budget each month
I believe that this year my business will generate a reasonable salary for me plus a modest
profit or better
I have trimmed any unnecessary costs
I have not cut out costs that impair sales people’s ability to sell. I have budgeted for adequate
sales and marketing activities
I know my company’s breakeven sales amount on a monthly and yearly basis
I know how much cash my business will need in the next week, month and three months and
have taken appropriate action so these cash needs can be met
I have a 12 month projected cash flow forecast for my business which I monitor regularly
I pay all federal, city and county taxes in a timely fashion
I take all trade discounts available and/or pay all invoices within the stated terms
I do not use credit cards to finance business expenses for more than a month
I have a 3-year budget showing the revenue, expenses and equipment or expansion
investments needed
I keep my banker up to date on my business by providing financial statements at least once
per quarter (even if this is not required)
My banker understands my business
I understand what’s on my balance sheet
I have a plan for how much I will borrow and how much debt I will repay during each of the
next 3 years
____ NUMBER OF BOXES CHECKED (15 POSSIBLE)
How did you rank?
____ Had a higher score than me ____ Had a lower score than me
© 2015 2
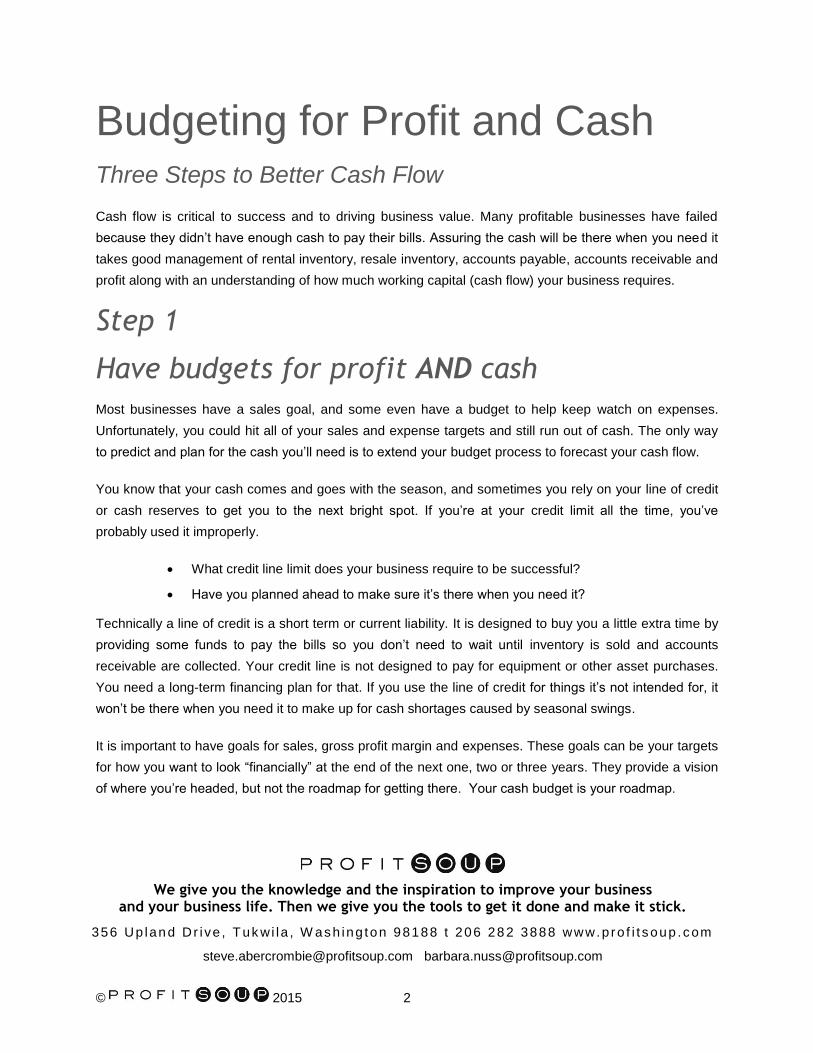
Budgeting for Profit and Cash Three Steps to Better Cash Flow
Cash flow is critical to success and to driving business value. Many profitable businesses have failed
because they didn’t have enough cash to pay their bills. Assuring the cash will be there when you need it
takes good management of rental inventory, resale inventory, accounts payable, accounts receivable and
profit along with an understanding of how much working capital (cash flow) your business requires.
Step 1
Have budgets for profit AND cash
Most businesses have a sales goal, and some even have a budget to help keep watch on expenses.
Unfortunately, you could hit all of your sales and expense targets and still run out of cash. The only way
to predict and plan for the cash you’ll need is to extend your budget process to forecast your cash flow.
You know that your cash comes and goes with the season, and sometimes you rely on your line of credit
or cash reserves to get you to the next bright spot. If you’re at your credit limit all the time, you’ve
probably used it improperly.
What credit line limit does your business require to be successful?
Have you planned ahead to make sure it’s there when you need it?
Technically a line of credit is a short term or current liability. It is designed to buy you a little extra time by
providing some funds to pay the bills so you don’t need to wait until inventory is sold and accounts
receivable are collected. Your credit line is not designed to pay for equipment or other asset purchases.
You need a long-term financing plan for that. If you use the line of credit for things it’s not intended for, it
won’t be there when you need it to make up for cash shortages caused by seasonal swings.
It is important to have goals for sales, gross profit margin and expenses. These goals can be your targets
for how you want to look “financially” at the end of the next one, two or three years. They provide a vision
of where you’re headed, but not the roadmap for getting there. Your cash budget is your roadmap.
We give you the knowledge and the inspiration to improve your business and your business life. Then we give you the tools to get it done and make it stick.
356 Up lan d Dr i ve , T uk wi la , W ash ing ton 98188 t 206 28 2 3888 www.p ro f i t soup .com
© 2015 3
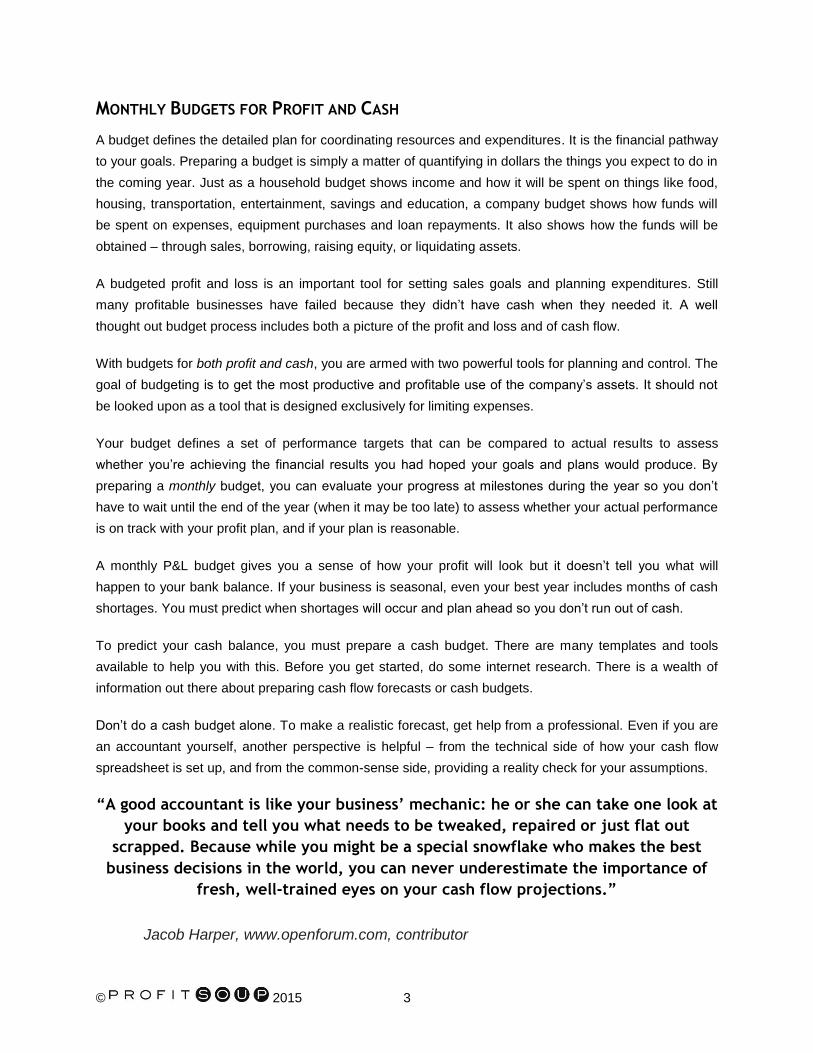
MONTHLY BUDGETS FOR PROFIT AND CASH
A budget defines the detailed plan for coordinating resources and expenditures. It is the financial pathway
to your goals. Preparing a budget is simply a matter of quantifying in dollars the things you expect to do in
the coming year. Just as a household budget shows income and how it will be spent on things like food,
housing, transportation, entertainment, savings and education, a company budget shows how funds will
be spent on expenses, equipment purchases and loan repayments. It also shows how the funds will be
obtained – through sales, borrowing, raising equity, or liquidating assets.
A budgeted profit and loss is an important tool for setting sales goals and planning expenditures. Still
many profitable businesses have failed because they didn’t have cash when they needed it. A well
thought out budget process includes both a picture of the profit and loss and of cash flow.
With budgets for both profit and cash, you are armed with two powerful tools for planning and control. The
goal of budgeting is to get the most productive and profitable use of the company’s assets. It should not
be looked upon as a tool that is designed exclusively for limiting expenses.
Your budget defines a set of performance targets that can be compared to actual results to assess
whether you’re achieving the financial results you had hoped your goals and plans would produce. By
preparing a monthly budget, you can evaluate your progress at milestones during the year so you don’t
have to wait until the end of the year (when it may be too late) to assess whether your actual performance
is on track with your profit plan, and if your plan is reasonable.
A monthly P&L budget gives you a sense of how your profit will look but it doesn’t tell you what will
happen to your bank balance. If your business is seasonal, even your best year includes months of cash
shortages. You must predict when shortages will occur and plan ahead so you don’t run out of cash.
To predict your cash balance, you must prepare a cash budget. There are many templates and tools
available to help you with this. Before you get started, do some internet research. There is a wealth of
information out there about preparing cash flow forecasts or cash budgets.
Don’t do a cash budget alone. To make a realistic forecast, get help from a professional. Even if you are
an accountant yourself, another perspective is helpful – from the technical side of how your cash flow
spreadsheet is set up, and from the common-sense side, providing a reality check for your assumptions.
“A good accountant is like your business’ mechanic: he or she can take one look at
your books and tell you what needs to be tweaked, repaired or just flat out
scrapped. Because while you might be a special snowflake who makes the best
business decisions in the world, you can never underestimate the importance of
fresh, well-trained eyes on your cash flow projections.”
Jacob Harper, www.openforum.com, contributor
© 2015 4
C&L Rentals Case Study
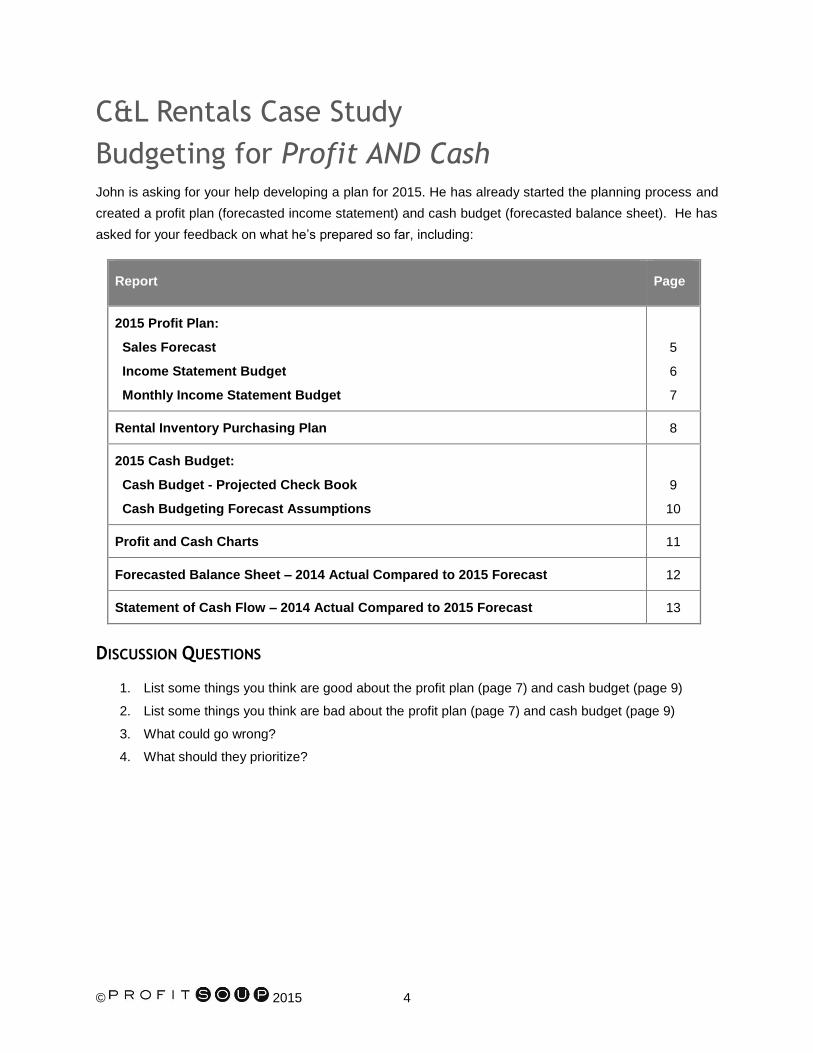
Budgeting for Profit AND Cash John is asking for your help developing a plan for 2015. He has already started the planning process and
created a profit plan (forecasted income statement) and cash budget (forecasted balance sheet). He has
asked for your feedback on what he’s prepared so far, including:
Report Page
2015 Profit Plan:
Sales Forecast
Income Statement Budget
Monthly Income Statement Budget
5
6
7
Rental Inventory Purchasing Plan 8
2015 Cash Budget:
Cash Budget - Projected Check Book
Cash Budgeting Forecast Assumptions
9
10
Profit and Cash Charts 11
Forecasted Balance Sheet – 2014 Actual Compared to 2015 Forecast 12
Statement of Cash Flow – 2014 Actual Compared to 2015 Forecast 13
DISCUSSION QUESTIONS
1. List some things you think are good about the profit plan (page 7) and cash budget (page 9)
2. List some things you think are bad about the profit plan (page 7) and cash budget (page 9)
3. What could go wrong?
4. What should they prioritize?
© 2015 5
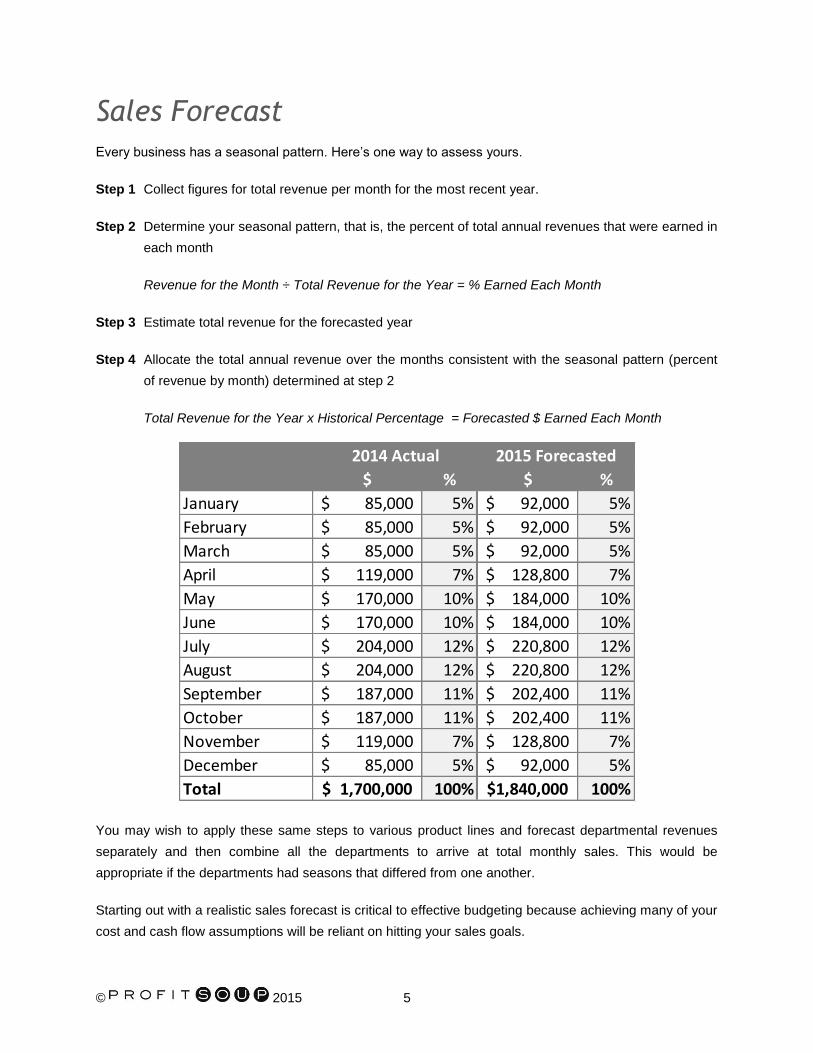
Sales Forecast
Every business has a seasonal pattern. Here’s one way to assess yours.
Step 1 Collect figures for total revenue per month for the most recent year.
Step 2 Determine your seasonal pattern, that is, the percent of total annual revenues that were earned in
each month
Revenue for the Month ÷ Total Revenue for the Year = % Earned Each Month
Step 3 Estimate total revenue for the forecasted year
Step 4 Allocate the total annual revenue over the months consistent with the seasonal pattern (percent
of revenue by month) determined at step 2
Total Revenue for the Year x Historical Percentage = Forecasted $ Earned Each Month
$ % $ %
January 85,000$ 5% 92,000$ 5%
February 85,000$ 5% 92,000$ 5%
March 85,000$ 5% 92,000$ 5%
April 119,000$ 7% 128,800$ 7%
May 170,000$ 10% 184,000$ 10%
June 170,000$ 10% 184,000$ 10%
July 204,000$ 12% 220,800$ 12%
August 204,000$ 12% 220,800$ 12%
September 187,000$ 11% 202,400$ 11%
October 187,000$ 11% 202,400$ 11%
November 119,000$ 7% 128,800$ 7%
December 85,000$ 5% 92,000$ 5%
Total 1,700,000$ 100% 1,840,000$ 100%
2014 Actual 2015 Forecasted
You may wish to apply these same steps to various product lines and forecast departmental revenues
separately and then combine all the departments to arrive at total monthly sales. This would be
appropriate if the departments had seasons that differed from one another.
Starting out with a realistic sales forecast is critical to effective budgeting because achieving many of your
cost and cash flow assumptions will be reliant on hitting your sales goals.
© 2015 6
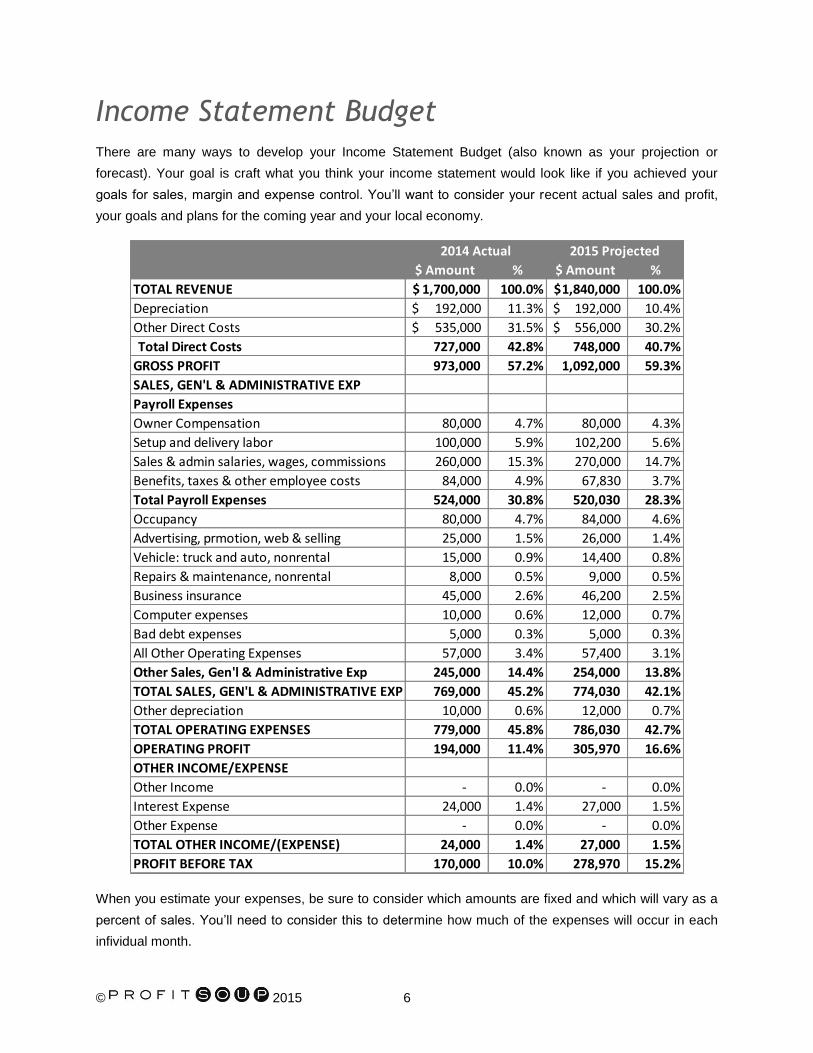
Income Statement Budget
There are many ways to develop your Income Statement Budget (also known as your projection or
forecast). Your goal is craft what you think your income statement would look like if you achieved your
goals for sales, margin and expense control. You’ll want to consider your recent actual sales and profit,
your goals and plans for the coming year and your local economy.
$ Amount % $ Amount %
TOTAL REVENUE 1,700,000$ 100.0% 1,840,000$ 100.0%
Depreciation 192,000$ 11.3% 192,000$ 10.4%
Other Direct Costs 535,000$ 31.5% 556,000$ 30.2%
Total Direct Costs 727,000 42.8% 748,000 40.7%
GROSS PROFIT 973,000 57.2% 1,092,000 59.3%
SALES, GEN'L & ADMINISTRATIVE EXP
Payroll Expenses
Owner Compensation 80,000 4.7% 80,000 4.3%
Setup and delivery labor 100,000 5.9% 102,200 5.6%
Sales & admin salaries, wages, commissions 260,000 15.3% 270,000 14.7%
Benefits, taxes & other employee costs 84,000 4.9% 67,830 3.7%
Total Payroll Expenses 524,000 30.8% 520,030 28.3%
Occupancy 80,000 4.7% 84,000 4.6%
Advertising, prmotion, web & selling 25,000 1.5% 26,000 1.4%
Vehicle: truck and auto, nonrental 15,000 0.9% 14,400 0.8%
Repairs & maintenance, nonrental 8,000 0.5% 9,000 0.5%
Business insurance 45,000 2.6% 46,200 2.5%
Computer expenses 10,000 0.6% 12,000 0.7%
Bad debt expenses 5,000 0.3% 5,000 0.3%
All Other Operating Expenses 57,000 3.4% 57,400 3.1%
Other Sales, Gen'l & Administrative Exp 245,000 14.4% 254,000 13.8%
TOTAL SALES, GEN'L & ADMINISTRATIVE EXP 769,000 45.2% 774,030 42.1%
Other depreciation 10,000 0.6% 12,000 0.7%
TOTAL OPERATING EXPENSES 779,000 45.8% 786,030 42.7%
OPERATING PROFIT 194,000 11.4% 305,970 16.6%
OTHER INCOME/EXPENSE
Other Income - 0.0% - 0.0%
Interest Expense 24,000 1.4% 27,000 1.5%
Other Expense - 0.0% - 0.0%
TOTAL OTHER INCOME/(EXPENSE) 24,000 1.4% 27,000 1.5%
PROFIT BEFORE TAX 170,000 10.0% 278,970 15.2%
2014 Actual 2015 Projected
When you estimate your expenses, be sure to consider which amounts are fixed and which will vary as a
percent of sales. You’ll need to consider this to determine how much of the expenses will occur in each
infividual month.
© 2015 7
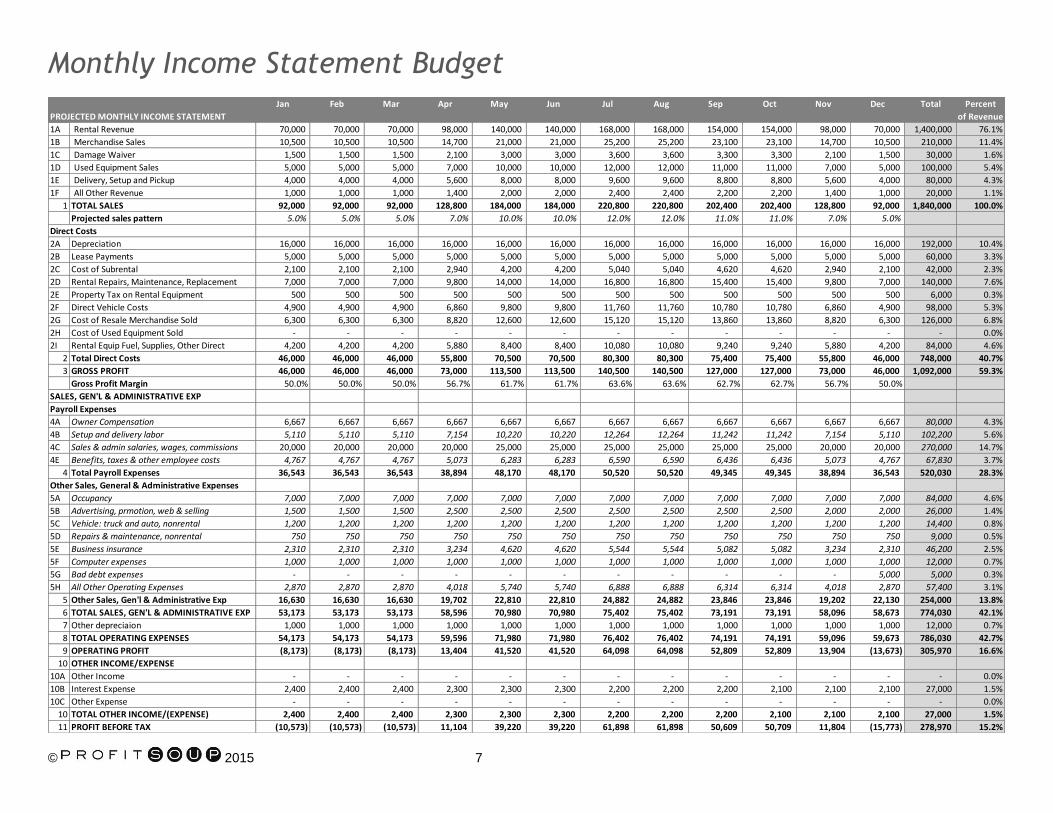
Monthly Income Statement Budget Jan Feb Mar Apr May Jun Jul Aug Sep Oct Nov Dec Total Percent
PROJECTED MONTHLY INCOME STATEMENT of Revenue
1A Rental Revenue 70,000 70,000 70,000 98,000 140,000 140,000 168,000 168,000 154,000 154,000 98,000 70,000 1,400,000 76.1%
1B Merchandise Sales 10,500 10,500 10,500 14,700 21,000 21,000 25,200 25,200 23,100 23,100 14,700 10,500 210,000 11.4%
1C Damage Waiver 1,500 1,500 1,500 2,100 3,000 3,000 3,600 3,600 3,300 3,300 2,100 1,500 30,000 1.6%
1D Used Equipment Sales 5,000 5,000 5,000 7,000 10,000 10,000 12,000 12,000 11,000 11,000 7,000 5,000 100,000 5.4%
1E Delivery, Setup and Pickup 4,000 4,000 4,000 5,600 8,000 8,000 9,600 9,600 8,800 8,800 5,600 4,000 80,000 4.3%
1F All Other Revenue 1,000 1,000 1,000 1,400 2,000 2,000 2,400 2,400 2,200 2,200 1,400 1,000 20,000 1.1%
1 TOTAL SALES 92,000 92,000 92,000 128,800 184,000 184,000 220,800 220,800 202,400 202,400 128,800 92,000 1,840,000 100.0%
Projected sales pattern 5.0% 5.0% 5.0% 7.0% 10.0% 10.0% 12.0% 12.0% 11.0% 11.0% 7.0% 5.0%
Direct Costs
2A Depreciation 16,000 16,000 16,000 16,000 16,000 16,000 16,000 16,000 16,000 16,000 16,000 16,000 192,000 10.4%
2B Lease Payments 5,000 5,000 5,000 5,000 5,000 5,000 5,000 5,000 5,000 5,000 5,000 5,000 60,000 3.3%
2C Cost of Subrental 2,100 2,100 2,100 2,940 4,200 4,200 5,040 5,040 4,620 4,620 2,940 2,100 42,000 2.3%
2D Rental Repairs, Maintenance, Replacement 7,000 7,000 7,000 9,800 14,000 14,000 16,800 16,800 15,400 15,400 9,800 7,000 140,000 7.6%
2E Property Tax on Rental Equipment 500 500 500 500 500 500 500 500 500 500 500 500 6,000 0.3%
2F Direct Vehicle Costs 4,900 4,900 4,900 6,860 9,800 9,800 11,760 11,760 10,780 10,780 6,860 4,900 98,000 5.3%
2G Cost of Resale Merchandise Sold 6,300 6,300 6,300 8,820 12,600 12,600 15,120 15,120 13,860 13,860 8,820 6,300 126,000 6.8%
2H Cost of Used Equipment Sold - - - - - - - - - - - - - 0.0%
2I Rental Equip Fuel, Supplies, Other Direct 4,200 4,200 4,200 5,880 8,400 8,400 10,080 10,080 9,240 9,240 5,880 4,200 84,000 4.6%
2 Total Direct Costs 46,000 46,000 46,000 55,800 70,500 70,500 80,300 80,300 75,400 75,400 55,800 46,000 748,000 40.7%
3 GROSS PROFIT 46,000 46,000 46,000 73,000 113,500 113,500 140,500 140,500 127,000 127,000 73,000 46,000 1,092,000 59.3%
Gross Profit Margin 50.0% 50.0% 50.0% 56.7% 61.7% 61.7% 63.6% 63.6% 62.7% 62.7% 56.7% 50.0%
SALES, GEN'L & ADMINISTRATIVE EXP
Payroll Expenses
4A Owner Compensation 6,667 6,667 6,667 6,667 6,667 6,667 6,667 6,667 6,667 6,667 6,667 6,667 80,000 4.3%
4B Setup and delivery labor 5,110 5,110 5,110 7,154 10,220 10,220 12,264 12,264 11,242 11,242 7,154 5,110 102,200 5.6%
4C Sales & admin salaries, wages, commissions 20,000 20,000 20,000 20,000 25,000 25,000 25,000 25,000 25,000 25,000 20,000 20,000 270,000 14.7%
4E Benefits, taxes & other employee costs 4,767 4,767 4,767 5,073 6,283 6,283 6,590 6,590 6,436 6,436 5,073 4,767 67,830 3.7%
4 Total Payroll Expenses 36,543 36,543 36,543 38,894 48,170 48,170 50,520 50,520 49,345 49,345 38,894 36,543 520,030 28.3%
Other Sales, General & Administrative Expenses
5A Occupancy 7,000 7,000 7,000 7,000 7,000 7,000 7,000 7,000 7,000 7,000 7,000 7,000 84,000 4.6%
5B Advertising, prmotion, web & selling 1,500 1,500 1,500 2,500 2,500 2,500 2,500 2,500 2,500 2,500 2,000 2,000 26,000 1.4%
5C Vehicle: truck and auto, nonrental 1,200 1,200 1,200 1,200 1,200 1,200 1,200 1,200 1,200 1,200 1,200 1,200 14,400 0.8%
5D Repairs & maintenance, nonrental 750 750 750 750 750 750 750 750 750 750 750 750 9,000 0.5%
5E Business insurance 2,310 2,310 2,310 3,234 4,620 4,620 5,544 5,544 5,082 5,082 3,234 2,310 46,200 2.5%
5F Computer expenses 1,000 1,000 1,000 1,000 1,000 1,000 1,000 1,000 1,000 1,000 1,000 1,000 12,000 0.7%
5G Bad debt expenses - - - - - - - - - - - 5,000 5,000 0.3%
5H All Other Operating Expenses 2,870 2,870 2,870 4,018 5,740 5,740 6,888 6,888 6,314 6,314 4,018 2,870 57,400 3.1%
5 Other Sales, Gen'l & Administrative Exp 16,630 16,630 16,630 19,702 22,810 22,810 24,882 24,882 23,846 23,846 19,202 22,130 254,000 13.8%
6 TOTAL SALES, GEN'L & ADMINISTRATIVE EXP 53,173 53,173 53,173 58,596 70,980 70,980 75,402 75,402 73,191 73,191 58,096 58,673 774,030 42.1%
7 Other depreciaion 1,000 1,000 1,000 1,000 1,000 1,000 1,000 1,000 1,000 1,000 1,000 1,000 12,000 0.7%
8 TOTAL OPERATING EXPENSES 54,173 54,173 54,173 59,596 71,980 71,980 76,402 76,402 74,191 74,191 59,096 59,673 786,030 42.7%
9 OPERATING PROFIT (8,173) (8,173) (8,173) 13,404 41,520 41,520 64,098 64,098 52,809 52,809 13,904 (13,673) 305,970 16.6%
10 OTHER INCOME/EXPENSE
10A Other Income - - - - - - - - - - - - - 0.0%
10B Interest Expense 2,400 2,400 2,400 2,300 2,300 2,300 2,200 2,200 2,200 2,100 2,100 2,100 27,000 1.5%
10C Other Expense - - - - - - - - - - - - - 0.0%
10 TOTAL OTHER INCOME/(EXPENSE) 2,400 2,400 2,400 2,300 2,300 2,300 2,200 2,200 2,200 2,100 2,100 2,100 27,000 1.5%
11 PROFIT BEFORE TAX (10,573) (10,573) (10,573) 11,104 39,220 39,220 61,898 61,898 50,609 50,709 11,804 (15,773) 278,970 15.2%
© 2015 8
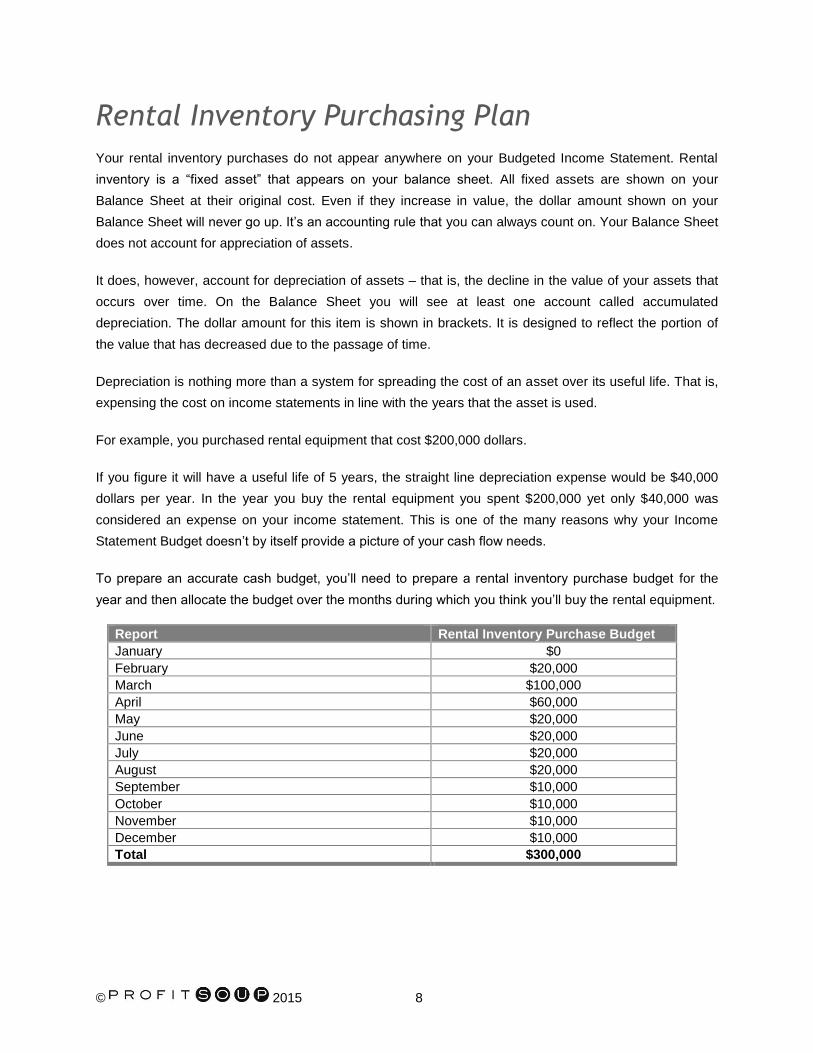
Rental Inventory Purchasing Plan
Your rental inventory purchases do not appear anywhere on your Budgeted Income Statement. Rental
inventory is a “fixed asset” that appears on your balance sheet. All fixed assets are shown on your
Balance Sheet at their original cost. Even if they increase in value, the dollar amount shown on your
Balance Sheet will never go up. It’s an accounting rule that you can always count on. Your Balance Sheet
does not account for appreciation of assets.
It does, however, account for depreciation of assets – that is, the decline in the value of your assets that
occurs over time. On the Balance Sheet you will see at least one account called accumulated
depreciation. The dollar amount for this item is shown in brackets. It is designed to reflect the portion of
the value that has decreased due to the passage of time.
Depreciation is nothing more than a system for spreading the cost of an asset over its useful life. That is,
expensing the cost on income statements in line with the years that the asset is used.
For example, you purchased rental equipment that cost $200,000 dollars.
If you figure it will have a useful life of 5 years, the straight line depreciation expense would be $40,000
dollars per year. In the year you buy the rental equipment you spent $200,000 yet only $40,000 was
considered an expense on your income statement. This is one of the many reasons why your Income
Statement Budget doesn’t by itself provide a picture of your cash flow needs.
To prepare an accurate cash budget, you’ll need to prepare a rental inventory purchase budget for the
year and then allocate the budget over the months during which you think you’ll buy the rental equipment.
Report Rental Inventory Purchase Budget
January $0
February $20,000
March $100,000
April $60,000
May $20,000
June $20,000
July $20,000
August $20,000
September $10,000
October $10,000
November $10,000
December $10,000
Total $300,000

© 2015 9
Cash Budget – Projected Check Book January February March April May June July August September October November December Total
CASH BUDGET
1 BEGINNING BANK ACCOUNT BALANCE 4,000$ 327 654 780 185 605 265 63 861 310 36,859 98,683 4,000
CASH INFLOWS
2 Cash Sales (35% of total sales) 32,200 32,200 32,200 45,080 64,400 64,400 77,280 77,280 70,840 70,840 45,080 32,200 644,000
3 Collection of 12/31 Accounts Receivable 190,000 70,000 70,000 50,000 0 0 0 0 0 0 0 0 0 190,000
4 Credit sales collected 59,800 59,800 59,800 83,720 119,600 119,600 143,520 143,520 131,560 131,560 1,052,480
5 Other Income 0 0 0 0 0 0 0 0 0 0 0 0 0
6 Long-Term Loan Proceeds (80% of Rental Purchases) 0 16,000 80,000 48,000 16,000 16,000 16,000 16,000 8,000 8,000 8,000 8,000 240,000
7 TOTAL CASH INFLOWS (lines 2 through 6) 102,200 118,200 222,000 152,880 140,200 164,120 212,880 212,880 222,360 222,360 184,640 171,760 2,126,480
CASH OUTFLOWS Jan 1 Bal
8a Payment on 12/31 Accounts Payable Balance 60,000 30,000 18,000 12,000 0 0 0 0 0 0 0 0 0 60,000
8b Current Year Retail Merchandise Purchases 0 0 6,700 6,700 6,700 9,380 13,400 13,400 16,080 16,080 14,740 14,740 117,920
8 Total Accounts Payable 30,000 18,000 18,700 6,700 6,700 9,380 13,400 13,400 16,080 16,080 14,740 14,740 177,920
9a Lease Payments 5,000 5,000 5,000 5,000 5,000 5,000 5,000 5,000 5,000 5,000 5,000 5,000 60,000
9b Cost of Subrental 2,100 2,100 2,100 2,940 4,200 4,200 5,040 5,040 4,620 4,620 2,940 2,100 42,000
9c Rental Repairs, Maintenance, Replacement 7,000 7,000 7,000 9,800 14,000 14,000 16,800 16,800 15,400 15,400 9,800 7,000 140,000
9d Property Tax on Rental Equipment 0 0 0 3,000 0 0 0 0 0 3,000 0 0 6,000
9e Direct Vehicle Costs 4,900 4,900 4,900 6,860 9,800 9,800 11,760 11,760 10,780 10,780 6,860 4,900 98,000
9f Rental Equip Fuel, Supplies, Other Direct 4,200 4,200 4,200 5,880 8,400 8,400 10,080 10,080 9,240 9,240 5,880 4,200 84,000
9 Direct Costs Paid 23,200 23,200 23,200 33,480 41,400 41,400 48,680 48,680 45,040 48,040 30,480 23,200 430,000
10 Payroll and Payroll Tax 36,543 36,543 36,543 38,894 48,170 48,170 50,520 50,520 49,345 49,345 38,894 36,543 520,030
11 Other Sales, General and Administrative Expenses 16,630 16,630 16,630 19,702 22,810 22,810 24,882 24,882 23,846 23,846 19,202 22,130 254,000
12 Interest Expense 2,400 2,400 2,400 2,300 2,300 2,300 2,200 2,200 2,200 2,100 2,100 2,100 27,000
13 Other Expense 0 0 0 0 0 0 0 0 0 0 0 0 0
14 Rental Inventory Purchased 0 20,000 100,000 60,000 20,000 20,000 20,000 20,000 10,000 10,000 10,000 10,000 300,000
15 Capital Purchases 0 0 0 0 0 0 0 0 0 0 0 0 0
16 Principal Payments on Long Term Debt 4,100 4,100 7,400 7,400 7,400 7,400 7,400 7,400 7,400 7,400 7,400 7,400 82,200
17 Owner Distribution for Income Tax Payment 0 0 0 0 0 0 0 0 0 0 0 0 0
18 Other Owner Distributions 0 0 0 0 0 0 0 0 0 0 0 0 0
19 TOTAL CASH OUTFLOWS (lines 8 through 18) 112,873 120,873 204,873 168,476 148,780 151,460 167,082 167,082 153,911 156,811 122,816 116,113 1,791,150
20 NET CASH FLOW (line 7 INFLOWS minus line 19 OUTFLOWS) (10,673) (2,673) 17,127 (15,596) (8,580) 12,660 45,798 45,798 68,449 65,549 61,824 55,647 335,330
21 BANK BALANCE BEFORE CREDIT LINE (line 1 plus line 20) (6,673) (2,346) 17,781 (14,815) (8,395) 13,265 46,063 45,861 69,310 65,859 98,683 154,330 339,330
22 Advance on Credit Line (in ,000s if overdrawn) 7,000 3,000 0 15,000 9,000 0 0 0 0 0 0 0 34,000
23 Repayment of Credit Line (in 000's if excess cash) 0 0 (17,000) 0 0 (13,000) (46,000) (45,000) (69,000) (29,000) 0 0 (219,000)
24 ENDING BANK ACCOUNT BALANCE (line 21+22-23) 327 654 780 185 605 265 63 861 310 36,859 98,683 154,330 154,330
Debt Tracking - informational only: Jan 1 Bal Dec 31 Balance
25 Tracking Cumulative Credit Line Balance 185,000 192,000 195,000 178,000 193,000 202,000 189,000 143,000 98,000 29,000 0 0 0 0
26 Tracking Balance of Long-term Debt 450,000 445,900 457,800 530,400 571,000 579,600 588,200 596,800 605,400 606,000 606,600 607,200 607,800 607,800
How does the check book compare to the P&L?
PROFIT PLAN January February March April May June July August September October November December Total
1 Total Revenue 92,000 92,000 92,000 128,800 184,000 184,000 220,800 220,800 202,400 202,400 128,800 92,000 1,840,000$
2 Direct Costs 45,500 45,500 45,500 58,300 70,000 70,000 79,800 79,800 74,900 77,900 55,300 45,500 748,000
3 Gross Profit 46,500 46,500 46,500 70,500 114,000 114,000 141,000 141,000 127,500 124,500 73,500 46,500 1,092,000
4 Sales, General and Administrative Expneses 54,173 54,173 54,173 59,596 71,980 71,980 76,402 76,402 74,191 74,191 59,096 59,673 786,030
5 Operating Profit (7,673) (7,673) (7,673) 10,904 42,020 42,020 64,598 64,598 53,309 50,309 14,404 (13,173) 305,970
6 Interest Expense 2,400 2,400 2,400 2,300 2,300 2,300 2,200 2,200 2,200 2,100 2,100 2,100 27,000
7 Profit Before Tax (10,073) (10,073) (10,073) 8,604 39,720 39,720 62,398 62,398 51,109 48,209 12,304 (15,273) 278,970$
© 2015 10
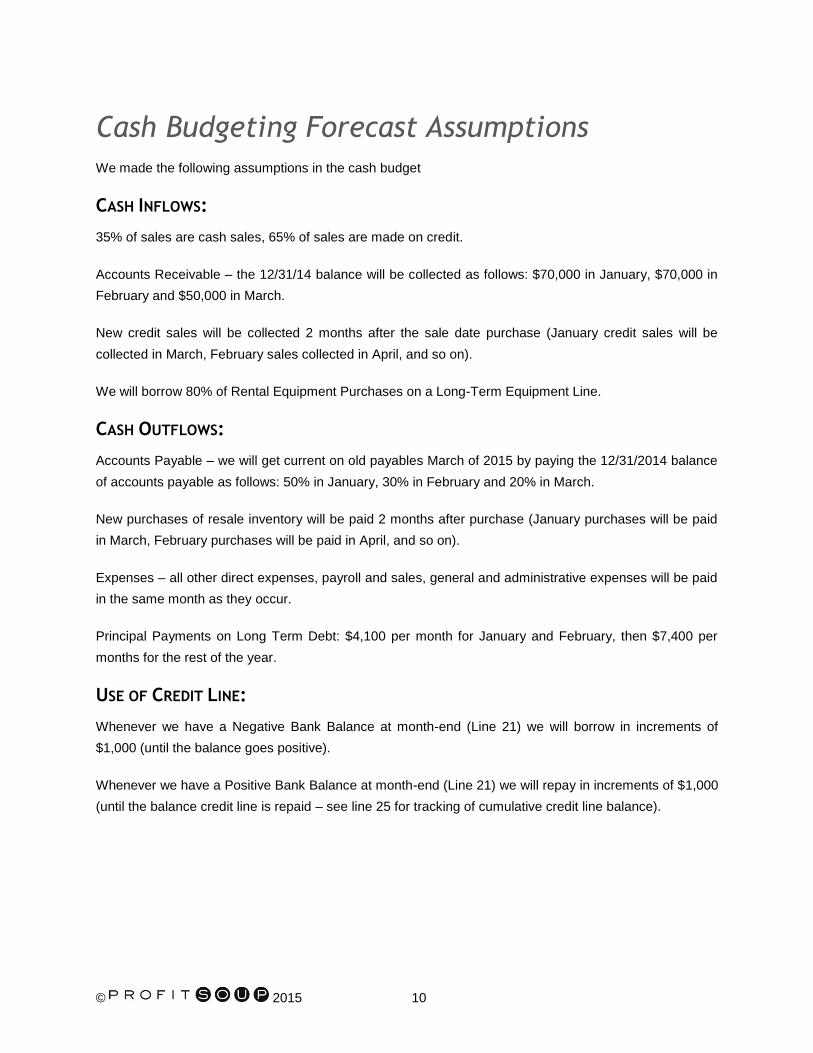
Cash Budgeting Forecast Assumptions
We made the following assumptions in the cash budget
CASH INFLOWS:
35% of sales are cash sales, 65% of sales are made on credit.
Accounts Receivable – the 12/31/14 balance will be collected as follows: $70,000 in January, $70,000 in
February and $50,000 in March.
New credit sales will be collected 2 months after the sale date purchase (January credit sales will be
collected in March, February sales collected in April, and so on).
We will borrow 80% of Rental Equipment Purchases on a Long-Term Equipment Line.
CASH OUTFLOWS:
Accounts Payable – we will get current on old payables March of 2015 by paying the 12/31/2014 balance
of accounts payable as follows: 50% in January, 30% in February and 20% in March.
New purchases of resale inventory will be paid 2 months after purchase (January purchases will be paid
in March, February purchases will be paid in April, and so on).
Expenses – all other direct expenses, payroll and sales, general and administrative expenses will be paid
in the same month as they occur.
Principal Payments on Long Term Debt: $4,100 per month for January and February, then $7,400 per
months for the rest of the year.
USE OF CREDIT LINE:
Whenever we have a Negative Bank Balance at month-end (Line 21) we will borrow in increments of
$1,000 (until the balance goes positive).
Whenever we have a Positive Bank Balance at month-end (Line 21) we will repay in increments of $1,000
(until the balance credit line is repaid – see line 25 for tracking of cumulative credit line balance).
© 2015 11
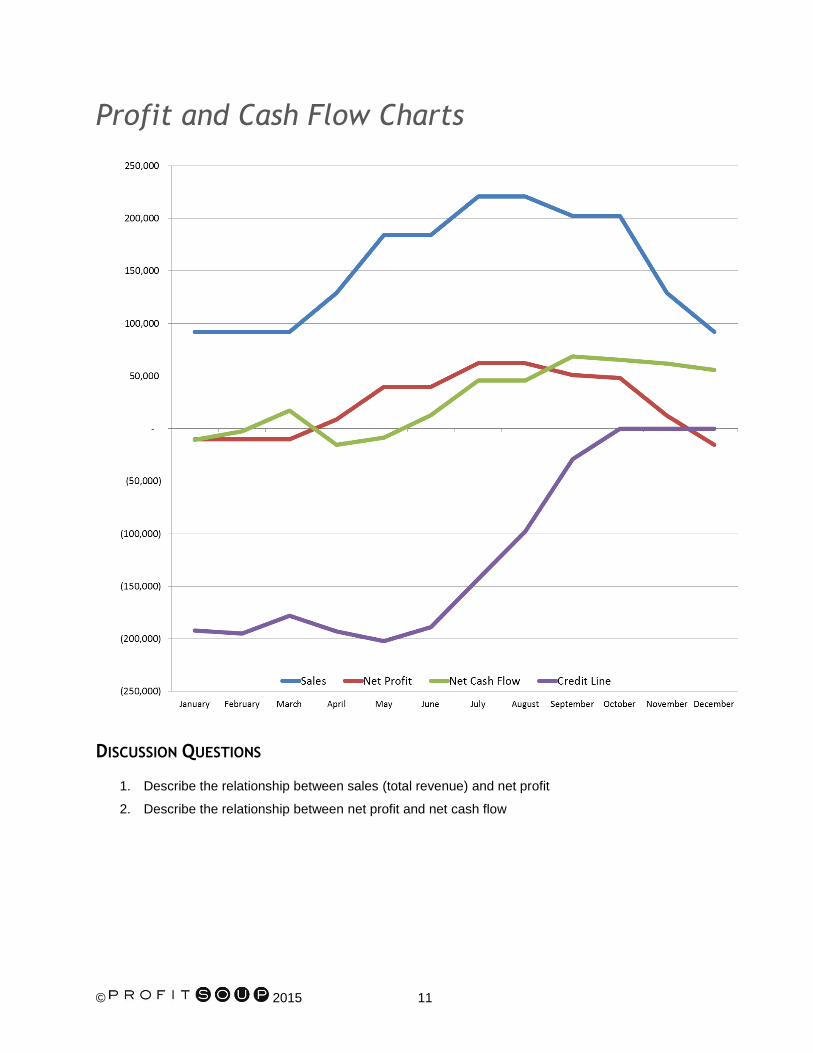
Profit and Cash Flow Charts
DISCUSSION QUESTIONS
1. Describe the relationship between sales (total revenue) and net profit
2. Describe the relationship between net profit and net cash flow
© 2015 12
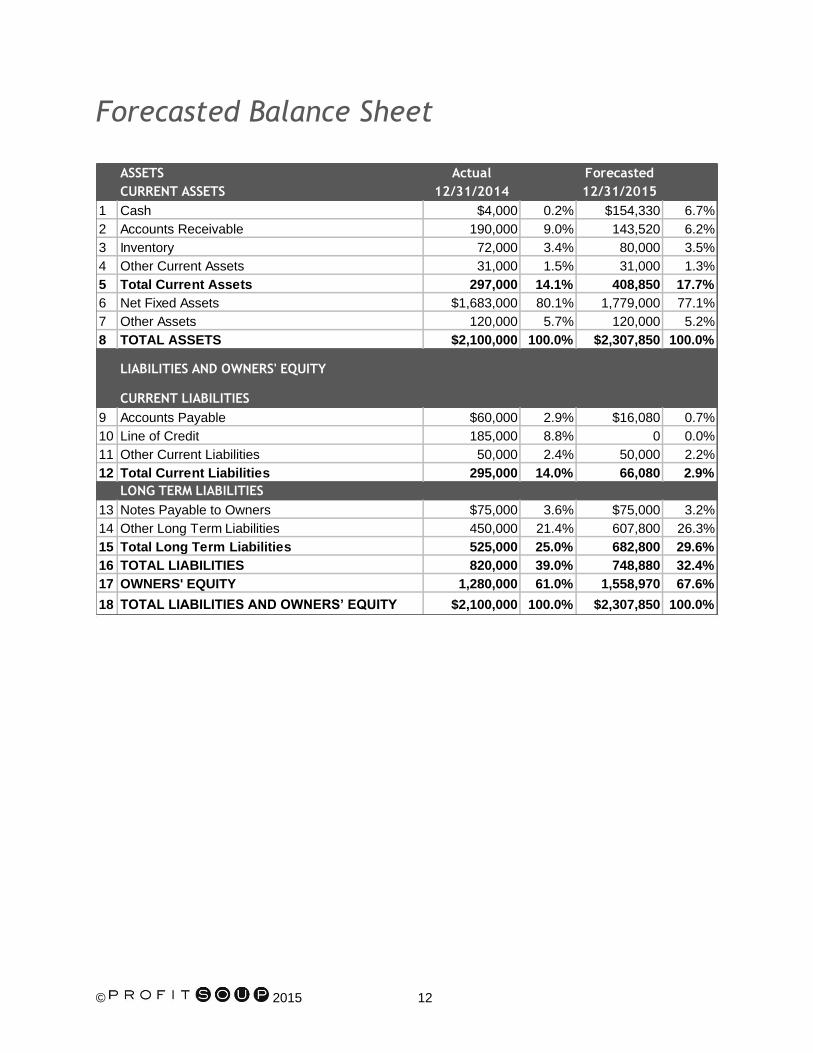
Forecasted Balance Sheet
ASSETS Actual Forecasted
CURRENT ASSETS 12/31/2014 12/31/2015
1 Cash $4,000 0.2% $154,330 6.7%
2 Accounts Receivable 190,000 9.0% 143,520 6.2%
3 Inventory 72,000 3.4% 80,000 3.5%
4 Other Current Assets 31,000 1.5% 31,000 1.3%
5 Total Current Assets 297,000 14.1% 408,850 17.7%
6 Net Fixed Assets $1,683,000 80.1% 1,779,000 77.1%
7 Other Assets 120,000 5.7% 120,000 5.2%
8 TOTAL ASSETS $2,100,000 100.0% $2,307,850 100.0%
LIABILITIES AND OWNERS' EQUITY
CURRENT LIABILITIES
9 Accounts Payable $60,000 2.9% $16,080 0.7%
10 Line of Credit 185,000 8.8% 0 0.0%
11 Other Current Liabilities 50,000 2.4% 50,000 2.2%
12 Total Current Liabilities 295,000 14.0% 66,080 2.9%
LONG TERM LIABILITIES
13 Notes Payable to Owners $75,000 3.6% $75,000 3.2%
14 Other Long Term Liabilities 450,000 21.4% 607,800 26.3%
15 Total Long Term Liabilities 525,000 25.0% 682,800 29.6%
16 TOTAL LIABILITIES 820,000 39.0% 748,880 32.4%
17 OWNERS' EQUITY 1,280,000 61.0% 1,558,970 67.6%
18 TOTAL LIABILITIES AND OWNERS’ EQUITY $2,100,000 100.0% $2,307,850 100.0%
© 2015 13
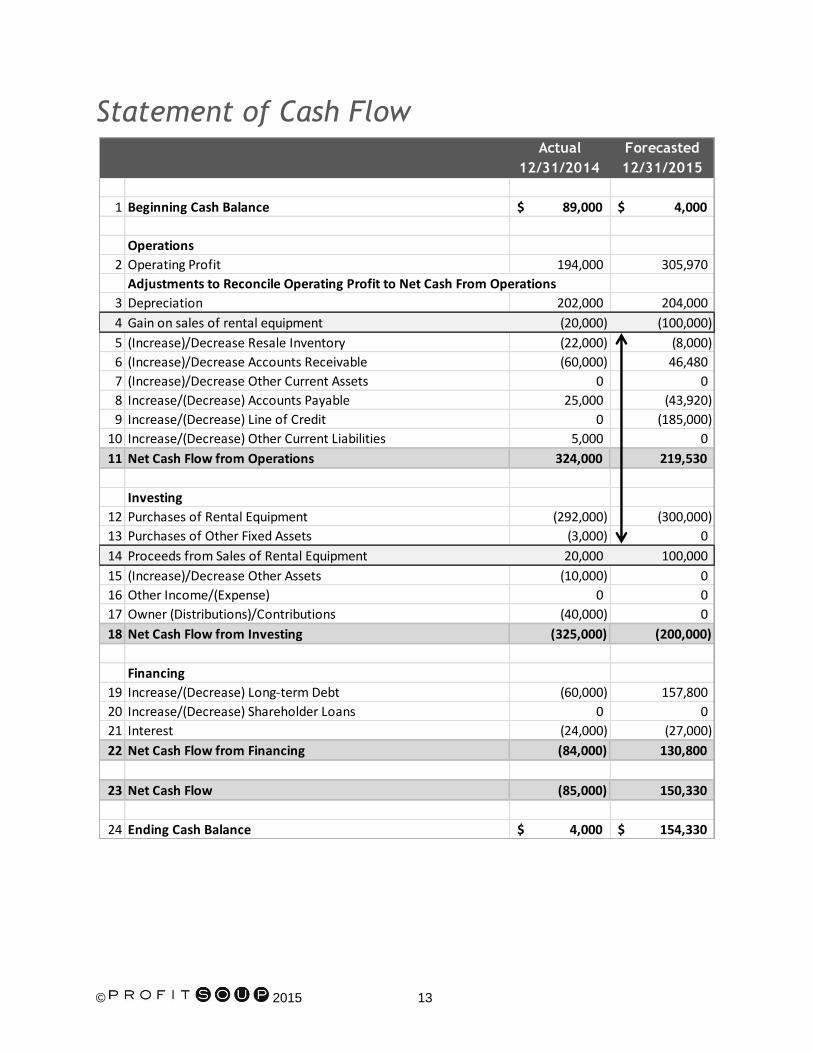
Statement of Cash Flow Actual Forecasted
12/31/2014 12/31/2015
1 Beginning Cash Balance 89,000$ 4,000$
Operations
2 Operating Profit 194,000 305,970
Adjustments to Reconcile Operating Profit to Net Cash From Operations
3 Depreciation 202,000 204,000
4 Gain on sales of rental equipment (20,000) (100,000)
5 (Increase)/Decrease Resale Inventory (22,000) (8,000)
6 (Increase)/Decrease Accounts Receivable (60,000) 46,480
7 (Increase)/Decrease Other Current Assets 0 0
8 Increase/(Decrease) Accounts Payable 25,000 (43,920)
9 Increase/(Decrease) Line of Credit 0 (185,000)
10 Increase/(Decrease) Other Current Liabilities 5,000 0
11 Net Cash Flow from Operations 324,000 219,530
Investing
12 Purchases of Rental Equipment (292,000) (300,000)
13 Purchases of Other Fixed Assets (3,000) 0
14 Proceeds from Sales of Rental Equipment 20,000 100,000
15 (Increase)/Decrease Other Assets (10,000) 0
16 Other Income/(Expense) 0 0
17 Owner (Distributions)/Contributions (40,000) 0
18 Net Cash Flow from Investing (325,000) (200,000)
Financing
19 Increase/(Decrease) Long-term Debt (60,000) 157,800
20 Increase/(Decrease) Shareholder Loans 0 0
21 Interest (24,000) (27,000)
22 Net Cash Flow from Financing (84,000) 130,800
23 Net Cash Flow (85,000) 150,330
24 Ending Cash Balance 4,000$ 154,330$
© 2015 14
Step 2
Know what financing you need and get it
To make sure you have adequate funding, you’ll need to predict how much money you’ll need, when
you’ll need it, how much of it you’ll need to borrow and how you’ll pay it back. This approach works a lot
better than asking your banker to raise your credit limit when you start having trouble staying current with
your bills. That is what happens when you don’t have a long-term plan.
By preparing a profit budget AND a cash budget, you can see cash shortfalls coming before they occur,
and you can demonstrate how your business will provide the funds needed to pay back loans. The beauty
of prediction tools is that while they are not exactly precise, they quickly capture the essence of the big
picture. Then if you don’t like the image, it’s not too late to change course.
Here are some tips for establishing a supportive relationship with your bank.
1. Educate your banker about your business and your industry. Use the ARA Cost of Doing
Business Report to show how you stack up against your peers, and to demonstrate that you have
your thumb on the pulse of your industry. Make sure your banker is well-informed and well-armed to
tell the story of your business in your absence.
2. Interview your bank. Your bank has an important and specific role to play on your business team.
Know what you expect from them, what skills and capacity they’ll need to do a good job for you, and
interview the candidates just as you would any important member of your team.
3. Don’t be afraid to talk about your challenges. In this economy, most businesses have seen sales
fall and many show losses. Turn a negative into a positive by describing how you’ve changed your
approach to sales, marketing and cost-control, and your vision for the future.
4. Prove that you’re more than a business owner. Your banker wants to know that you are an
attentive financial manager of your most important investment – your own company. Show that your
focus goes beyond today’s operations and profit to a strategy for long-term success and ROI.
5. Demonstrate your commitment to a complete relationship that can be profitable for the bank.
Your relationship brings a significant amount of incremental revenue to the bank. You can improve
your relationship by outlining the value that you bring beyond the interest and fees you pay on your
loan. Depository accounts, credit card processing, employee benefit banking, equipment leasing,
online banking, ACH processing, trust services, personal banking, wire transfers, etc.all provide
significant revenue. Show that your relationship is a valuable revenue contribution to your banker’s
portfolio, and cultivate the relationship continually – not just when you need a loan.
© 2015 15
6. Be sympathetic to what your banker is experiencing in the new regulatory environment. The
additional questions and information requirements related to your loan request are probably not your
banker’s fault. Like you, your banker is scrutinized in the lending process. By being sympathetic,
helpful and resourceful you can help your banker build a loan file that creates success.
7. Find a reason for optimism and share it. Be enthusiastic about your business and have a plan that
shows your pathway to success. Don’t expect others to be excited about your business if you aren’t.
Step 3
Keep a financial focus
MONITOR PROGRESS, GIVE FEEDBACK AND TAKE CORRECTIVE ACTION
As time goes by and you implement the plans, monitor whether you’re achieving your goals. If not, why
not? And more importantly, what will you do to get back on track?
Each month compare your actual results to your profit and cash budgets. Investigate variances to assess
whether your action plans are having the desired impact. Celebrate when things go well. Recognize and
reward individual and team successes.
Regular staff meetings and reports to team members help people to stay focused and motivated and also
support accountability. You can use team meetings to provide updates on progress against key goals,
celebrate successes and report on projects completed and underway. Having team members present to
their peers is also a great way to develop communication and leadership skills.
The pace and dynamics of business today can mean you will need to modify your plans and strategies
during the year in order to achieve your goal. Sometimes your financial goals will need to change mid-
year. However, before reducing your goal consider whether the goal can still be achieved if you work
harder, smarter or change your plan.
Want more financial focus? Use the ARA Rental Profitability Online Training Program
“This product offers absolutely amazing information. I have been around numbers for a long time, but I
find myself going back to the sections to listen to them again. This is by far one of the best programs ARA
has ever produced.”
John Bibbo Jr., CERP
Event Source
Cleveland
Regular member price: $149 for 15-month access.
Non-member price: $450 for 15-month access.

Notes: _____________________________________________________________
_____________________________________________________________
_____________________________________________________________
_____________________________________________________________
_____________________________________________________________
_____________________________________________________________
_____________________________________________________________
_____________________________________________________________
_____________________________________________________________
_____________________________________________________________
_____________________________________________________________
_____________________________________________________________
_____________________________________________________________
_____________________________________________________________
_____________________________________________________________
_____________________________________________________________
_____________________________________________________________
_____________________________________________________________
_____________________________________________________________
_____________________________________________________________

Get started on the road to a stronger and more profitable bottom line! Go to ARArental.org/go/RPP to learn more.
ARA member price is $149 and nonmember price is $450.
Improve your business and increase your profits!
ARArental.org
n Sharpen Your Financial Know-How. Get on track to financial success.
n Fire Up Your Financial Dashboards. Keep track of key business indicators.
n Maximize Your Profitability. Know where you stand, make adjustments and make more money.
SHOW SPECIAL
$99 Use promo code: RPP2015 Good through 3/31/2015 • Save $50
It’s the only way to see how you really compare, gather critical financial ratios
and learn how to improve your ranking and profitability. Watch your mail and email or stop at the ARA Store during The Rental Show in New Orleans for a survey.
2015Cost of Doing Business Report
n A FREE personalized Company Performance Report.
n A FREE Cost of Doing Business Report with on-demand customized reports.
n FREE industry benchmarking data, including key financial ratios.
Just complete your survey and receive:
Questions?
Call ARA Member Services at 800-334-2177.
It’s Easy, Confidential and will Boost Your Profits
Participate in the Cost of Doing Business Survey
You could win up
to $1,500, plus
prizes for your
state or provincial
association!
COMPARE YOURSELFWITH THE INDUSTRY