building national capacity for monitoring the economic
TRANSCRIPT

NotaterDocuments
2015/31•
Liv Hobbelstad Simpson and Bjørn Wold
Building national capacity for monitoring the economic development in an African country: The case of Malawi


Statistisk sentralbyrå • Statistics Norway Oslo–Kongsvinger
Notater/Documents 2015/31
Liv Hobbelstad Simpson and Bjørn Wold
Building national capacity for monitoring the economic development in an African country: The case of Malawi

Notater: I denne serien publiseres dokumentasjon, metodebeskrivelser, modell-beskrivelser og standarder.
© Statistisk sentralbyrå Ved bruk av materiale fra denne publikasjonen skal Statistisk sentralbyrå oppgis som kilde. Publisert august 2015. ISBN 978-82-537-9197-5 (elektronisk) Standardtegn i tabeller SymbolTall kan ikke forekomme .Oppgave mangler ..Oppgave mangler foreløpig …Tall kan ikke offentliggjøres :Null -Mindre enn 0,5 av den brukte enheten 0Mindre enn 0,05 av den brukte enheten 0,0Foreløpig tall *Brudd i den loddrette serien —Brudd i den vannrette serien |Desimaltegn ,

3
Preface In 2001 the National Statistical Office (NSO) and the National Economic Council (NEC) in Malawi asked for Norwegian support i.e. financial support from the Norwegian Embassy and technical support from Statistics Norway in building the national capacity to monitor the economic development in the country. With Norwegian support a system building on a chain of activities was established starting with basic economic statistics, through national accounts compilation to macro-economic modelling. This report summarises the experiences and some key lessons learnt from this work. The report has been written by Mrs Liv Hobbelstad Simpson who at the time the programme started was Head of the National Accounts Division in Statistics Norway together with Mr Bjørn Wold who headed the Division for Development Cooperation in Statistics Norway. Special thanks to Mrs Lizzie Chikoti and Mr Hector Kankuwe, both from the NSO as well as Mr Vebjørn Aalandslid from Statistics Norway, who all have given valuable advice to the report. The report has been financed under the framework agreement between Norad and Statistics Norway. Statistisk sentralbyrå, June 23 2015. Irene Tuveng
4
Abstract From the early 2000s and over the course of more than a decade Norway has supported the develop-ment of statistics and economic planning in Malawi on a number of subject areas. A main area was support to economic statistics and planning. This included cooperation on the three major steps. Eco-nomic statistics providing annual information for the large enterprises and establishments and monthly price indices served as the base. This base supplemented by balance of payment statistics allowed for the compilation of national accounts information in current and fixed prices. In the next step the na-tional accounts figures served as an input for the macro economic planning in the ministries. Support from Statistics Norway (SN) to the National Accounts Division in the National Statistical Office (NSO) has been one of the main pillars in this long term institutional cooperation. This report gives a detailed account of the development of the SN-NSO cooperation on National Accounts over these years. From the initial assessment it was clear that the national accounts work in NSO faced two major challenges, a need for technical development and a need to build and maintain sufficient staff capacity.
The technical challenge From the start of the project, it was clear that the existing system for compiling National Accounts for Malawi needed to be upgraded. The NSO in Zomba had for each year, first been compiling national accounts in a very simplified way from the production side in constant 1994 prices, with household consumption as a residual. Consumer price indices and price indices from external trade were used for the conversion of value added from constant 1994 prices to current prices. Production for own use and small enterprises were underestimated or not included. The Balance of Payment (BOP) was not ac-cording to the international standards, BPM5 from 1993. Statistics Norway had through its support to several countries, developed a National Accounts, Supply and Use (SUT) commodity flow approach with an Input/Output model fitting the UN International System of National Accounts 1993 requirements. This approach was presented by the Norwegian team, as an approach, which would fit the needs and priorities for Malawi NSO. The agreement between SN and the three Malawian institutions: the Department of Economic Affairs of the Ministry of Finance, the Ministry of Economic Planning and Development (now the Department of Economic Planning and Development (DEPD) under the Ministry of Finance, Economic Planning and Development ) and the National Statistical Office (NSO) was signed in 2003. The program for cooperation on economic statistics comprised basic economic statistics and national accounts imple-mented and managed by NSO and macroeconomic modelling managed by DEPD, implemented by DEPD and MoFEPD/FAD. With technical assistance from SN from 2004 and until 2013, NSO has completed two main revisions of their National Accounts. The first milestone from 2004 was to adopt UNs SNA 93 with Supply and Use Tables (SUTs) in the current national accounts compilation process. Important was to utilize all the detailed data sources already available. SN had National accounts Experts who could support the Norwegian application SNA-NT for compiling SUTs. Support was given by long- and short-term ad-visors for establishing an efficient production process and to provide practical training in the use of the application and evaluate the data and the results. Workshops for the statisticians in NSO, both from economic statistics and from the NA/BOP branch were organised to explain how economic statistics should be utilized for the National Accounts compilation. The NA-BOP Branch in NSO/Lilongwe had during this first period from 2004 between 5-7 statisticians with responsibilities and time for both Na-tional Accounts (NA) and Balance of Payments (BOP). The NA/SUT team utilized all economic sta-tistics and other relevant data sources to prepare input data in Excel worksheets for compiling the SUTs. The balancing of the different data sources in a systematic SUT framework, using the SNA-NT software, provided important quality checks on the statistical data and revealed serious unbalances between some of the products supplied and the same products used. The supply or the use of these products had to be corrected. Different analytical tables were utilised during the correction phase. The statisticians from the NA/BOP Branch established and balanced the SUTs in current prices, updated the SUTs, calculated the SUTs in previous years’ prices (volume estimates by the double deflation

5
technique). The SUTs were also converted to Symmetric Industry by industry Input-Output tables (SIOTs), the statistical databases for econometric models and economic planning. Serious problems with computers and virus infections were solved by the end of 2006 with a new desktop computer and a new laptop for the SUT work and an updated anti-virus program, financed by the Ministry of Finance. The main problem during the project period was the lack of balance between low basic salaries and relatively high field allowances in NSO (as in the rest of the Government service of Malawi). The work was also delayed because different bills were not paid, as for electricity, internet and for virus protection. With the extra commitment, motivation and financial resources created by the personal interest and extra funding from the Ministry of Finance and assistance from the Norwegian short-term advisors, the new National Accounts time series for 2002-2004 were finalized and published in 2007, in line with the agreed deadline. Comparisons between the old and new figures showed that the GDP in current prices were revised up by 38% compared with the last final GDP figure for the year 2004. At the launch of the new data, 27th March 2007, the then Finance Minister, Honourable Goodall Gondwe said that he had for a long time felt that the Malawi economy had been understated and that the new national accounts data gave a much better picture of the country’s economy. He also said that the introduction of the new national accounts follows the decision to change the methodology of getting GDP estimates from the “produc-tion approach” to compile more comprehensive Supply and Use Tables. In 2010, NA/SUTs tables for the whole period 2002 - 2007 and institutional sector accounts for the years 2006 and 2007 were completed. Preliminary NA-figures for the period 2008-2010 had also been compiled. The second milestone from 2010 was to adopt international recommendations (UN’s SNA 2008) rele-vant for the SUTs compilation, new international nomenclature for industries (ISIC Rev.4) and for products (Revised CPC ver.2). Important was also to utilize improved economic statistical data sources and the new estimates for non-observed economy such as collection of firewood and water and for “work in progress” for cattle and cultivated forest. The revision was carried out by first compiling the SUTs for 2008 and 2009, based on all data sources and in line with the new classifications and the SNA 2008 standards. It was necessary also to revise the backward years at an aggregated level to the year 2002 in order to link the revised level with the current figures to maintain consistent time series at an aggregated level. Comparisons between the old and new figures showed that the GDP in current prices was revised up by 22 % compared with the last final GDP figure for the year 2007. The final results (published in February 2015) was National Accounts with SUTs and GDP compiled in current and previous year’s prices for the years 2002-2010 according to UNs SNA 2008 and with nomenclature according to ISIC-Rev 4 and CPC ver 2. The annual SUTs have also given a flexible approach to compile IOTs for the years 2007 to 2010. At this stage the NA figures for the years 2002-2010 are much more reliable than before, and should serve as an important input to national economic policy development and as a consequence the Mala-wi Government should have a much better empirical basis for facing the IMF at their bi-annual visits and at present, four times a year for starting producing QNA.

6
The staff capacity challenge From the very start of the cooperation, the need for sufficient staff capacity was raised. NSO had far too few staff with reasonable experience in national accounts compilation. The need for more staff to be allocated to national accounts work was acknowledged at the annual meetings and NSO tried to build the commitment from the government for hiring enough staff. With the long term advisors from Statistics Norway, the project was in a position to arrange on the job training. But neither NSO or Sta-tistics Norway, nor the Norwegian Embassy were able to build the necessary commitment with gov-ernment to be allowed to hire the necessary staff. The national accounts section at NSO remained dependent upon the long term advisor not only to build the technical capacity, but even to fill the staff gap. Hence the sustainability of the system was seriously challenged in late 2012 when the support from the long term advisor from SN ended. It soon proved difficult to continue with annual updates of the SUTs without some technical assistance from SN. The main problem throughout the project was that the available resources for NA work have been limited and the number of persons assigned to NA has been critically low. In addition, the National Accounts team has also been responsible for several other important tasks.
The change in approach The NSO, together with SN, therefore decided in September 2013 to prepare for a change in the ap-proach to the National accounts compilation methodology. For the annual updates between the benchmark years, an Excel based compilation system compiling GDP by the production and the ex-penditure approach was introduced. This system will use the same data sources as for SNA-NT, but less detailed (on industries, products), with no detailed balancing of products. The last SUTs compiled for the year 2010 are the benchmark for the update to the following years. The SUTs should only be compiled in benchmark years, at least every five years. Although it had been decided to leave the an-nual SUTs and the SNA-NT approach, the basic competence in national accounts work gained by NSO during these years will constitute a foundation for working with the new system. It should however be stressed that this new approach makes NSO dependent upon technical coopera-tion every fifth year to compile an updated SUT.
National Accounts for Malawi compared to other countries in Africa During the year 2014 at least four countries in Africa rebased their GDP: The Nigerian Statistical Ser-vice rebased GDP which resulted in an approximate doubling in the size of its economy. The Uganda Bureau of Statistics rebased GDP by bringing forward the base year from 2002 to 2010 giving a 13 percent increase in GDP. The Kenya National Bureau of Statistics, rebased GDP for the year 2013, a 25.3 per cent increase in its GDP. The Tanzania National Bureau of Statistics rebased GDP for the year 2013, which resulted in a 27.8 per cent increase of GDP. Both Kenya and Tanzania linked their revision to the National Accounts through the production of SUTs. The UN Statistical Commission (UNSC) recommends that countries rebase their GDP every five years, on a regular basis, but very few countries are able to follow this recommendation. African economic offi-cials expect more countries to re-calculate the size of their economies and reveal very different figures. According to the AfDB, only 10 African countries out of 54 meet the international standard of using a base year for their GDP calculation that was 5 years ago or less. Another group of 19 countries use a base year that is at least a decade old and seven countries use base years that are more than 20 years old. It is expected that more countries will manage the revisions through the production of SUTs.
7
Contents Preface ..................................................................................................................................................... 3
Abstract ................................................................................................................................................... 4
1. History of National Accounts for Malawi ..................................................................................... 9 1.1. Central Statistical Office (CSO), Salisbury ................................................................................ 9 1.2. National Statistical Office (NSO), Zomba ................................................................................. 9
2. The years 2001-2003. The Program for Institutional Co-operation ........................................ 10 2.1. The initiation of the institutional Co-operation Project ............................................................ 10 2.2. The first missions ..................................................................................................................... 11 2.3. The signed agreement ............................................................................................................... 11
3. Phase 1. 2004-2007. Compiling NA Supply and Use Tables for the years 2002- 2004 ............ 11 3.1. Human resources ...................................................................................................................... 11 3.2. Methodology ............................................................................................................................ 12 3.3. The first milestone, Supply and Use Tables (SUTs) ................................................................ 12 3.4. Statistical data sources for the National Accounts compilation. .............................................. 14 3.5. Classification for SUTs: Industries, Type of final use, Products ............................................. 15 3.6. Hardware and software situation .............................................................................................. 15 3.7. The achievements ..................................................................................................................... 16 3.8. SUTs - A major development ................................................................................................... 17 3.9. Progress during the year 2006 .................................................................................................. 17 3.10. The current price SUT converted to previous year’s prices. .................................................... 17 3.11. New National Accounts figures for the years 2002-2004 - problems solved ........................... 18 3.12. Summary of the new GDP results for Malawi compared with the old figures ......................... 19 3.13. International Comparability ...................................................................................................... 20
4. Phase 2. 2007-2010 with update of NA-SUTs and Institutional sector accounts for the years 2005, 2006 and 2007 ...................................................................................................................... 22
4.1. National Accounts with SUTs for the years 2005 and 2006 .................................................... 22 4.2. Institutional sector accounts ..................................................................................................... 22 4.3. National Accounts with SUTs and Institutional sector accounts for the year 2007 ................. 23
5. Phase 3. National Accounts SUTs system according to the UN SNA 2008 requirements ...... 23 5.1. A new main revision of the National Accounts for Malawi for the years 2002-2010 .............. 23 5.2. The international classifications for industries, products and external trade statistics were
revised. The new classifications were: ..................................................................................... 24 5.3. New or improved statistical information: ................................................................................. 24 5.4. Establishing a new NA database for Malawian National Accounts version with the new
nomenclature; ISIC rev.4 and CPC ver. 2 ................................................................................ 25
6. A twinning project between Malawian institutions: the Ministry of Development, Planning and Cooperation and the National Statistical Office ................................................................. 28
7. Phase 4. Annual updates of the National Account figures from the base year 2010 at an aggregated level ............................................................................................................................. 29
7.1. The experiences with the annual SUTs compilation in NSO ................................................... 29 7.2. A new Excel Based Compilation System for the National Accounts of Malawi from 2014.... 29 7.3. An alternative option: ERETES National Accounts software .................................................. 30
8. Summed up: What has been the impact of the Programme? ................................................... 30 8.1. National Accounts according to UNs SNA 2008 ..................................................................... 30 8.2. Were the right modalities for support used and specifically did the LTA modality work
well? ......................................................................................................................................... 30 8.3. How could efficiency have been improved? Did we focus sufficiently on user contact with
ministries, academia, public at large? ....................................................................................... 31 8.4. Did SN introduce too advanced products? ............................................................................... 31

8
8.5. Was enough done to ensure proper staffing and remuneration? ............................................... 31 8.6. Documents ................................................................................................................................ 32
9. Implementation of the SNA 2008 in African countries ............................................................. 32 9.1. The African Group on National Accounts (AGNA) ................................................................ 32 9.2. The status of National Accounts for countries in Africa .......................................................... 33 9.3. Ghana moving from a low income country to middle income country .................................... 33 9.4. Nigeria, Uganda, Kenya and Tanzania changes to their National Accounts data in 2014 ...... 34
References ............................................................................................................................................. 36
Appendix 1. The years 2001-2013 ....................................................................................................... 37

9
1. History of National Accounts for Malawi
1.1. Central Statistical Office (CSO), Salisbury
National Accounts for Malawi (called Nyasaland from 1891 to 1964) was first calculated by Professor Phyllis Deane for the year 1938, and published in ”The Measurement of Colonial National Income” by Cambridge University Press, 1948 Miss Phyllis Deane spent the war years 1940-1945 as a research officer for the National Institute of Economic Research. After the war, she did a similar job for the Colonial Office, spending time in Ni-geria and what was then Northern Rhodesia and Nyasaland, She was working up from family income surveys and mining accounts to the first estimates of total national income. Later, from her desk in London, she produced the first national income accounts for Nigeria. Her first publication was about the measurement of colonial national incomes and colonial social accounts. Professor Phyllis Deane writes later: “The difficulties in the way of measuring the national income in Africa spring from two main sources. First, the concepts and experience from which the national in-come estimator usually derives his definitions and methods have for the most part, been developed in dealing with advanced industrial economies such as those of the United Kingdom or the United States. How far they are applicable to less advanced economies must be deduced from a series of practical tests. Second, data on which to base estimates are scarce”. Developed and developing countries follow the very early British National Accounts tradition, by compiling GDP by using the Income and Expenditure approaches, had no tradition for compiling Sup-ply and Use tables by the commodity flow method. Good administrative data as detailed government accounts and financial accounts were needed for calculating GDP by the Income approach, but these data were not available in many developing countries. From 1946, annual Nordic meetings were or-ganised in this field. According to Aukrust (1992), the Scandinavian countries had a fairly common view of the main controversial issues raised and discussed during the pioneer years of National Ac-counts. Norway and Denmark mainly adopted the same solutions in their systems. In both countries, National Accounts have detailed commodity flows around a core of I-O based methodology. From a methodological point of view, the most noteworthy contribution by Scandinavian national accountants has probably been their development of the commodity flow method with detailed balancing of supply of products and use of products.
1.2. National Statistical Office (NSO), Zomba
Following Independence in 1964, the task of preparing National Accounts for Malawi fell on the new-ly established National Statistical Office (NSO) in Zomba. Mr. Derek W. Blades from UK worked for the NSO office from 1964 to 1972, first as a statistician and finally as Director of Census and Statistics for the NSO Office. He prepared the first “National Accounts Report for Malawi, 1964-1967” with explanatory notes and improved national accounts figures, published in 1968. The first National Ac-counts Publication for Malawi, covering the years 1964-1970 was released in November 1972 and was followed by five other National Accounts publications. The last of these publications “Malawi Nation-al Accounts Report 1990-1994” was published by NSO, Zomba with series starting from 1990, using 1994 as base year. The young economist Ms. Anne Margrethe Martens worked with the National Accounts Division in Statistics Norway (SN) from 1958 until 1963 when she went to Africa as a national accounts expert in 1963. She worked in Africa until she retired many years later. She was for many years in Malawi, where she is still remembered. Mr. Charles Machinjili told Ms. L. H. Simpson that he got his knowledge about national accounts from Miss Martens. At the start of the project in 2004, the Official National Accounts for Malawi were mainly following UN’s System of National Accounts (SNA) from 1968.The annual National Accounts figures were first

10
compiled in constant 1994 prices with household consumption as a residual. Since 1998, no economic survey had been conducted by the NSO. The estimates for the previous three years were based on an excel worksheet known as MACSOL, which used producer production index, whose basis was only 74 companies. Consumer price indices and price indices from external trade were used to convert value added from constant 1994 prices to current prices. Production for own use and small enterprises were underesti-mated and in some cases not included. The current national accounts work was done in two rounds. After NSO had compiled the first version of the national accounts for the year, this preliminary version was compared with data from the other stakeholders as Ministry of Economic Planning and Development, the Reserve Bank and information being available in Ministry of Finance through extensive collaboration. After a meeting of the “Na-tional Accounts and BOP Technical Committee“, where the input from the other stakeholders was considered, NSO compiled and released the National Accounts estimates. The National Accounts figures were also published by the Reserve Bank of Malawi in their “Financial and Economic Review” and by the Ministry of Economic Planning and Development (MEPD) in the “Economic Report”. For Balance of Payments for Malawi, the version of the IMFs Balance of Payments and International Investment Position Manual (BOP), which was used, was not according to the BOP5 from 1993, as required by the international organizations. Some of the different sources used in the compilation had also low quality.
2. The years 2001-2003. The Program for Institutional Co-operation
2.1. The initiation of the institutional Co-operation Project
The renewed international focus on statistics with the Millennium Development Goals in the year 2000 changed the perspective of how to build national capacity in all national statistical offices in three ways. First, the focus on economic statistics and demography were enhanced to cover the need for a broader set of economic and social statistics. Second, the renewed acknowledgement of the need for statistics for policy decisions made donors more aware of the need for cooperation to increase the capacity, not only in production of statistics, but even in the use of statistics. Third, it made the need for a coordinated global effort more open and visible and hence led to the establishment of PARIS21 which was supposed to bridge the gap between the two main multilateral actors, the UN system and the Bretton Woods institutions. Statistics Norway assisted PARIS21 in their first regional workshop in Lusaka in 2000 with presenta-tions on methodological issues and facilitation of national cooperation between planning authorities and statistical offices. One of these countries was Malawi, and upon return the then National Econom-ic Council (NEC) and the National Statistical Office (NSO) prepared a document outlining "Possible areas for submission for funding Norwegian Support". This paper outlined several topics. In order for Malawi institutions to gain something from a program of institutional cooperation, it was decided to focus on areas where Statistics Norway had something to offer, i.e. an approach of interest to Malawi and the capacity for cooperation. Statistics Norway could offer some kind of cooperation, which might be useful for the National Economic Council and/or the National Statistical Office in Malawi, all topics where information was essential for designing efficient and equitable policy for development in any country, being Malawi, Norway or other. For a country like Malawi facing the challenge of increased global competition, democracy building and poverty reduction, Statistics Norway fully agreed on the statistical information needs addressed in the document.

11
2.2. The first missions
A team from the International Consulting Division, the Research Department and the National Ac-counts Division from Statistics Norway visited Malawi in December 2001. The methodology for com-piling National Accounts for Malawi needed to be upgraded, and Statistics Norway had long experi-ence giving technical advice and training in National Accounts to both developing countries and East European countries in transition. Through work by Statistics Norway in several countries, especially Zimbabwe, Jamaica, Norway and Eastern European countries, Statistics Norway had developed a Na-tional Accounts, Supply and Use and Input/output model fitting the SNA1993 requirements. This ap-proach was presented and seemed to fit the needs and priorities for Malawi NSO. Jointly a program for cooperation around a new National Accounts, Supply and Use and Input/output model in Malawi was prepared. Following this first visit to Malawi, a return fact finding mission to Norway by NSO and NEC was accomplished in March 2002. A mission from the International Consulting Division, the Research Department and the National Ac-counts Division from SN visited NSO, NEC and the Department for Economic Affairs in the Ministry of Finance in July 2002 in order to assist in the preparation of a project proposal to be submitted to NORAD, applying for financial support, including technical cooperation with SN and other Norwe-gian institutions. A document was prepared by NEC and NSO to address National Accounts. One pur-pose for SN was to provide technical advice and training to NSO on how to build a sustainable Na-tional Accounts system as a basis for economic and social policy planning. When the Institutional Cooperation with SN started, the NA office in Malawi was understaffed and suffered from scarce and unreliable data, and had outdated and undocumented methods. The office had only three skilled na-tional accounts officers.
2.3. The signed agreement
In June 2003 the agreement was signed for the institutional cooperation program between Statistics Norway and the 3 Malawian institutions: the Department of Economic Affairs of the Ministry of Fi-nance, the Ministry of Economic Planning and Development (now Department of Economic Planning and Development)) and the National Statistical Office (NSO). The program for cooperation on eco-nomic statistics comprised basic economic statistics and national accounts implemented and managed by NSO and macroeconomic modelling managed by DEPD, implemented by DEPD and MoF/FAD. The project proposal also covered a program for support to poverty and social sector statistics and planning to be implemented by NSO, NEC and MoF/EAD., managed by the two former, and based upon technical institutional cooperation with Norwegian institutions managed and headed by SN. The overall objective of the project was to contribute towards reduction of poverty and increasing the wel-fare of the population in Malawi by efficient fact-based policy planning. The specific objective of the project was to contribute to the overall objective by strengthening the national statistical system and by strengthening economic and social policy planning in a manner reflecting user needs. The program followed all steps from data collection as needed for National Accounts and poverty, growth and eco-nomic empowerment planning, through the National Accounts and use of statistics and National Ac-counts for policy and development planning including for MPRSP monitoring.
3. Phase 1. 2004-2007. Compiling NA Supply and Use Tables for the years 2002- 2004
3.1. Human resources
Malawi NSO has co-ordinated the national accounts and balance of payments work in NA-BOP branch, like the statistical offices in UK, Denmark and Norway. During Phase 1 from 2004 to 2007, NA-BOP Branch in NSO/Lilongwe had between 5-7 statisticians with responsibilities for National Accounts (NA) and for Balance of Payments (BOP). From the National Accounts Division in Statis-tics Norway, the first long term advisor (LTA) Mr. Nils Amdal was assigned to the NA-BOP branch

12
for a two year period starting from February 2004. During that period, a number of short-term mis-sions assisted the LTA. The short-term advisor (STA) Ms. Liv H Simpson visited NSO in 2004, 2005 and 2006. Several workshops were organised for the statisticians compiling the economic statis-tics and the statisticians in the NA/BOP branch for explaining how the economic statistics for Malawi would be used for the National Accounts compilation. The data requirements for developing and im-proving the National Accounts play an important role in further planning and development of econom-ic statistics for Malawi. Close cooperation between the statisticians compiling the economic statistics and those in the NA/BOP branch would be useful.
3.2. Methodology
The National Accounts should be the main instrument for observing the economy as a whole, the eco-nomic growth and the macroeconomic policy. International organisations, analysts and policy makers pay great attention to the evolution of GDP and to other National Accounts variables such as final consumption, capital investment, saving, etc. For international comparison, it is important to remem-ber that the quality of National Accounts is not the same in all countries. The National Accounts fig-ures are highly dependent on the quality of the statistical system that exists in a given country and the methodology used. The compilation of National Accounts requires special knowledge about the coun-try’s economy, training in the National Accounts compilation methodology and also knowledge about the coverage and quality of the different economic statistics available for the National Accounts com-pilation. Within the Institutional co-operation project between NSO and SN, the objective of the Na-tional Accounts project was to develop a complete new methodology for the compilation of the Na-tional Accounts for Malawi, following UN’s System of National Accounts 1993. SNA 1993 The UN’s System of National Accounts (SNA1993) consists of a coherent, consistent and integrated set of macroeconomic accounts; balance sheets and tables based on a set of internationally agreed con-cepts, definitions, classifications and accounting rules. The United Nations Statistical Commission adopted SNA 1993 during its 27th session in 1993 as the international standard for compilation of national accounts statistics and for the international reporting of comparable national accounting data. It is published jointly by the United Nations, the Commission of the European Communities, the International Monetary Fund, the Organisation for Economic Co-operation and Development and the World Bank. The System of National Accounts consists of an integrated set of macroeconomic accounts, balance sheets and tables based on internationally agreed concepts, definitions and classifications and account-ing rules. Together, these principles provide a comprehensive accounting framework within which economic data can be compiled and presented in a format that is designed for purposes of economic analysis, decision-taking and policy-making. For more details see: http://unstats.un.org/unsd/nationalaccount/sna1993.asp
3.3. The first milestone, Supply and Use Tables (SUTs)
The first milestone for the National Accounts project was to adopt UN’s SNA 93 with integrated, an-nual Supply and Use Tables (SUTs) in the current national accounts compilation process. According to SNA 1993, chapter XV, the Supply and Use tables (SUTs) should serve both statistical and analyti-cal purposes and should be fully integrated in the National Accounts system for a country. SUTs should represent an integral part of and check on the economic statistics and the National Accounts estimates produced for Malawi. SUTs also represent an important tool for volume estimates (the dou-ble deflation technique), giving balanced SUTs in both current year’s and previous year’s prices. SUTs should also be converted to Symmetric Input-Output tables (SIOT), industry by industry tables or product by product tables. SUTs and SIOT represent statistical databases for econometric models and economic planning. The SUTs were compiled by the commodity flow method, which is the best tool for checking the con-sistency between different statistical sources and estimates. Compiling SUTs by the commodity flow

13
method is an approach used for National Accounts compilation in several countries, where detailed information of the input structure of industries is missing or incomplete. According to the project plan, the first base year was the year 2002 and then following in current and previous year’s prices the years 2003 and 2004.
Figure 1. llustration of the commodity-flow method used for the National Accounts for Malawi for the years 2002- 2010
The first step: Supply Table:
Production accounts at producers’ prices were specified for:
Production for own final use, classified by industry codes and products codes
Market producers, classified by industry codes and products codes
Non-market producers, General government, classified by industry codes and products codes
Non-market producers, Non-profit institutions serving households (NPISHs), classified by industry codes and products codes.
Imports and import duties were specified for:
Import of goods and services, classified by product codes.
Import duties, excl. VAT, classified by products codes.
The second step: Use Table at purchasers’ prices, classified by products codes, specified for Interme-diate and Final use.
Intermediate Use of products (at purchasers’ prices) were specified for:
Market producers.
Production for own final use – no VAT, trade or transport margins for own final use.
Non-market producers - General government.
Non-market producers – NPISHs.
Final consumption (at purchasers’ prices), specified for:
Final consumption expenditure by households, using COICOP classification.
Final consumption expenditure of NPISHs, using COPNI classification.
Final consumption expenditure, collective consumption, using COFOG classification
Capital formation by type of industry and product.
Exports of goods and services. The third step: The estimated values of non-refundable VAT, trade and transport margins are deduct-ed from purchasers’ prices to compile the Use Table at producers’ prices.
Consumption
Import duties excl. VAT
Supply table
Total uses
Use table
Basic prices
Total supply
Imports
Capital formation
Production accounts
Purchasers' prices
Value added tax
Exports
Change in inventories
Producers' prices
Subsidies on products
Taxes on products excl. VAT
Production accounts
Subsidies on products
Taxes on products excl. VAT
Basic prices
Transport margins
Trade margins
Producers' prices

14
The fourth step: Confrontation of data sources - Balancing the Supply Table and Use Table at pro-ducers’ prices. The compilation and balancing of the National Accounts implied in Malawi that the National Ac-counts compilers were controlling, correcting and balancing the data, and in some cases, even heavily involved in the collection of data. The SUT’s framework enabled an efficient and consistent confron-tation of all the primary data sources. Based on judgement, the compilers had to balance the accounts by adjusting selected components based on criteria like quality, coverage, etc. Changes in inventories were calculated as the difference between supply and use of each product at producers’ prices, deter-mined as a residual variable allocated to change in inventories. The residuals had to be corrected to an acceptable level. Change of inventories for services had to be corrected on the supply or the use side and eliminated. The balanced SUTs showed how supply of products (goods and services) were origi-nating from domestic industries and imports, and how those supplies were allocated between various intermediate or final uses, including exports. Result: Total supply at producers’ prices equals Total use at producers’ prices. When the SUTs were balanced, the following types of checks were important: the total figures for production, intermediate consumption, GVA and GCF for the different industries; and the total figures for final consumption, product taxes, product subsidies, imports and exports. The fifth step: The Use Table at producers’ prices moved to purchasers’ prices Finally, the Use Table is compiled in purchasers’ prices. When balanced in full for a year, the SUTs were providing coherent, consistent and wholly integrated story for the year. The SUTs also represented an important tool for volume estimates (the double de-flation technique), giving balanced SUTs in both current year’s and previous year’s prices, see chapter 1.3.8. After the SUT for the first reference year 2002 had been established, the update to the following year was a much easier process. When SUT for the year 2002 and 2003 had been compiled, constant price figures for the SUT 2003 was calculated in the prices of the previous year.
3.4. Statistical data sources for the National Accounts compilation.
The reason for the decision to establish the first detailed national accounts for Malawi, follow-ing SNA 93 with annual SUTs from the year 2002, was to use all the detailed data sources which were available or should have been available in 2004. During the year 2004 the follow-ing data sources were available and used for the SUTs compilation:
Crop production estimates from Ministry of Agriculture,
Tobacco production and sales figures from Tobacco Control Commission,
Data from Tea Association of Malawi and Illovo Sugar Company,
Annual Economic Surveys (AES) for about 300 large enterprises,
For small sized industries, the data was estimated, based on a Medium Business Economic Survey MBES) from 1998. 20 000 medium scale companies were identified and classified by 9 activity groups. 10 companies within each of these 9 activity groups had been visited and some aggregates from their accounts collected. Estimates for medium and small-scale busi-nesses in Malawi for the year 2002 had to be based on this data.
Government accounts for the government budget years. o Information about the regulation for Sales tax, Excise tax and product taxes and prod-
uct subsidies for the year 2002 collected from Ministry of Finance.
Non-Governmental Organisations Surveys (Only for few NPISHs),
External trade statistics, the EUROTRACE application package, giving detailed information with value and quantity data for imports and exports of merchandise goods.

15
Since no appropriate price statistics were available for manufacturing products or for imported and exported products, unit value indices from the external trade statistics were used. The unit value indices were calculated based on selected data for homogeneous products in two suc-ceeding years.
The Balance of Payments (BoP) figures, compiled in the NA/BOP branch with some data for import and export of services,
The Integrated Household Survey (IHS) 97/98 was rich of details, but had not been utilised in the old National Accounts system. Information from the Integrated Household Survey (IHS) 2004 was delayed, but accessible before the new National Accounts for the years 2002 to 2004 were published in March 2007. The first estimate for household consumption for the year 2002 was based on IHS 2004, deflated with detailed consumer price indices and reduced with the growth of the population. Major corrections had to be done during the balancing process of this first estimate.
Consumer price indices
3.5. Classification for SUTs: Industries, Type of final use, Products
An industry and product classification, relevant for Malawi’s economy was established for the SUTs for Malawi in cooperation between the statistician in the NA-BOP Branch, the LTA and the STA. The following assessments were important: 1. Establishing a National Accounts Industry Classification relevant for Malawi, specifying around
100 industries related to ISIC Rev. 3.1 at an aggregated level. Since production for own use is important in the Malawian economy, the Industry classification was divided between: Production for own use and Market producers.
2. Establishing a National Accounts product classification relevant for Malawi, based on: Central Product Classification version 1 (CPC ver. 1) specifying around 400 products. Important food products in the Malawian economy were specified, also with a split between products sold to the market and products for own use. For products for own use, no trade margins should be added. Products as food aid were also given special product codes. Relevant specification of products was important to be able to allocate product taxes on petrol and product subsidies on seeds and fertilis-er.
By introducing a classification of products more detailed than the classification of industries, rectangu-lar tables were generated.
3.6. Hardware and software situation
The NSO had some experience using Excel spreadsheets. The introduction of the SNA93 with compi-lation of SUTs, using all data sources and detailed classifications for industries and products, required an efficient and partly automatic compilation methodology, as was introduced with the Norwegian SNA-NT application. The SNA-NT application is a client-server application for compiling the Nation-al Accounts, originally developed for SN, using Microsoft Visual C++ and Oracle. SNA-NT has been continuously maintained and is still in use in Slovenia, the Czech Republic, Slovakia and Hungary. SN has a new version developed on the framework of SAS, but based on the same methodology. Mr. Hans Kristian Langva had been responsible for developing the SNA-NT software for SN. He had also experience with use of the SNA-NT software for different international projects. Mr. Langva was engaged as short-term advisor, and during his first mission to NSO, Lilongwe in August 19. –September 2, 2005, he installed the Oracle relation database management system and the SNA-NT software on two computers in the NA division and gave technical advice and training. The SNA-NT software application enabled the National Accounts Branch to establish and balance the SUTs in current prices, update the SUTs, calculate the SUTs in previous years’ prices and derive In-dustry by Industry SIOTs. Excel tables were used to prepare the input data.

16
Mr. Langva writes in his report: “All the statisticians in the National Accounts branch should have an efficient desktop computer. The head of the branch, Ms. Lizzie Chikoti should have one laptop com-puter which also could be borrowed by other members of the branch when the need arise. The Nation-al Accounts unit should also have one LSD projector to be used together with the laptop for training and for evaluating of the results of the compilation of the national accounts.”
Documents The SUTs methodology and the SNA-NT Software introduced in Malawi are based on the following documents from Statistics Norway: Documents 2005/5 “National Accounts Supply and Use Tables in Current Prices”, Documents 2005/4 “National Accounts Supply and Use Tables in Constant Prices”, Documents 2005/6 “SNA-NT User’s Guide for Supply and Use Tables in current and constant prices”, Documents 2009/8 “Norwegian Methodology for Supply and Use Tables and Input Output Tables These Documents and shorter updated versions were presented at workshops and distributed to the NA branch in Malawi.
3.7. The achievements
The National Accounts/SUT team in NSO utilized all economic statistics at a detailed level and other available data sources to prepare input data as Excel worksheet for compiling the first Supply and Use Tables (SUTs) for 2002. The Norwegian LTA gave the National Accounts team theoretical lessons, and practical “hands on training“ in the compilation of National Accounts according to SNA 93 with SUTs using the SNA-NT software. They also received written documentation. The balancing of the different data sources in a systematic and well-documented SUTs framework, using the SNA-NT software application, provided important quality checks on the statistical data. Fur-thermore the balancing of the SUTs showed serious unbalance between the supply of many of the products and the use of the same products. During the balancing process, the unbalance had to be checked and the use corrected. The unbalance showed the weakness in the different data sources. Sev-eral rounds of corrections were required. Different analytical tables in Excel, produced automatically by SNA-NT software, were analysed during the correction phase. During the STAs short-term missions, several workshops were organised for the NA-BOP Branch. After the workshops and training sessions, the STA prepared examination test for evaluating the NA/SUTs group’s knowledge of compiling SUTs. To be able to evaluate the need for external training at national accounts courses, the members of the SUTs group were also requested to prepare CVs, following the template distributed to them. Serious problems and delays according to original plans occurred because the AES for 2002 was not finished before April 2005, the planned IHS2 was delayed to the year 2004 and the planned Agricul-ture census had not been financed. The previous Agriculture census was in 1992. Lack of data in sev-eral areas required estimation based on various indicators. Several revisions of the AES for all the years 2002, 2003 and 2004 required several corrections of the input data for the SUTs calculation. During the STA’s mission in August/September 2005, a detailed work plan and distribution of work was agreed upon where Mr. Alick Nyasulu (acting head), the team from the NA-BOP Branch, Ms. Ann Ansmiths (IMF technical adviser) and the LTA participated. New problems caused serious delay for the work plan shortly after the STA left in September 2005. Both Mr. Alick Nyasulu and other members of the team were away on different courses and on fieldwork.

17
3.8. SUTs - A major development
At the time, the development of the SUTs were considered a major achievement and the NSO in its communication with SN writes that1: “NSO is totally committed to the project and would ensure that at every stage adequate staff is working on the project activities. It is true that work on this project has delayed and this delay has been of concern even to us. Let me mention from the outset that there is need for a common understanding on the issues regarding National Accounts in Malawi. The new system that is being introduced (SUT) is a major development worth noting and requiring that every effort and resource be assigned to it. It should be recognized that NSO has been producing national accounts using the Production Approach Excel Worksheet and various estimates of growth and com-position of the economy come from these. The introduction of SUT will improve this process. I think we need to understand that we are in a transition period and NSO has still to satisfy demands from the two approaches”.
3.9. Progress during the year 2006
The goal during 2006 was a reliable national accounts system with SUTs for Malawi for the years 2002 to 2004 in both current and previous year’s prices. Two year time lag for the final national ac-counts 2004 would be satisfying according to international requirements. From January 2006 the pro-gress in the work was much better because the participation in field work had been reduced or partly stopped for the members of the national accounts /SUT team. The statisticians from NSO in Zomba responsible for the different statistics, continued with the fieldwork collecting data for the different statistics. The members of the national accounts /SUT team were being given remuneration (double salary). This had also increased their motivation. In January 2006, an updated version of SNA-NT software was installed and stable working routines were established with training of the project team. Short-term consultancies were carried out in 2006, following up the recommendations given in earlier reports from 2004 and 2005. The LTA and the STA were both assisting the National Accounts branch with analysing the preliminary partly balanced data for the year 2002 and giving advice how to correct the input data. They organised training sessions in NSO and gave recommendation for further work for finalising NA/SUTs for 2002. When the LTA Mr. Nils Amdal left in May 2006, preliminary SUTs for the year 2002 had been established indicating a large upwards revision of the GDP for the year 2002. In order to make sure that the national accounts project continued with final results in 2006 without serious problems, Ms. L. H. Simpson and Mr. H. K. Langva had support contracts to be able to follow up the work from home country, by e-mail, when needed. At the end of June 2006 the balanced SUTs for 2002 were accepted as preliminary. The SUTs for 2002 were finalised in September/October 2006 and the updating for the year 2003 in current prices started.
3.10. The current price SUT converted to previous year’s prices.
When the SUTs had been established and balanced for the first two years 2002 and 2003, the current year SUTs were converted to the previous year’s prices. The same procedure for compiling volume and price indicators were followed for the following years. For comparison over longer periods, the Laspeyres volume indices and the Paasche price indices are calculated first in relation to the previous year and then the chain indices are determined. Advantages of calculating price and volume measures within the SUTs framework:
The use of a SUTs calculation scheme supports the calculation of volume and price indices for transactions of goods and services in the National Accounts.
When price and volume measures are established in a SUTs accounting framework, they give volume indices and deflators of several variables and different levels of aggregation, interre-lated in a systematic way.
1 E-mail from the NSO project coordinator Jameson Ndawala, to Statistics Norway.

18
The main data sources for the volume measures for Malawi were price indices for agriculture products and consumer price indices. For domestic products from manufacturing and private services for do-mestic use, consumer price indices were used. For domestic products from manufacturing mainly to exports, unit value price indices were used. (Malawi had no producer price indices by then). For gov-ernment collective services, automatic compiled input price indices were used. Unit value indices for imports and exports were calculated at a detailed product level for selected homogeneous products, based on value and quantity data from the external trade statistics, based on EUROTRACE software. The main products to exports were tobacco, tea, sugar, cotton and later uranium. Tobacco exports dominate. For products like cars and computers, price indices from the exporting country were used. The deflation of the SUTs for the year 2003, lead to additional corrections of the current price SUTs for the year 2003. The IT-expert Mr. Langva returned for a short mission in November 2006, follow-ing up the practical training with the compilation of SUTs using SNA-NT software. He also developed a better IT-routine for transferring government data to the SUTs format. The updating and balancing of SUTs for the year 2004 could not start until all the required, delayed input data were final. Major problems were also arising in the autumn 2006 with computers and virus infections. The Ministry of Finance put a lot of pressure on NSO to get the revised national accounts data early in 2007, as input to the 2007-08 budgets.
3.11. New National Accounts figures for the years 2002-2004 - problems solved
The problems with computers and Virus infections were solved from 2007 with a new desktop com-puter and a new laptop for the SUT work and an updated Anti-virus program, financed by the Ministry of Finance. Oracle and the SNA-NT software on the new computer for the SUT team were installed with technical training for the constant price compilation. With extra efforts by the SUTs team in NSO and assistance from the Norwegian short-term advisors Ms Randi Hallen and Ms. Liv H. Simpson and later Mr. Steinar Todsen, the new National Accounts time series for 2002, 2003 and 2004 in current and previous year’s prices were finalized by the end of February 2007, in line with the agreed deadline. In March 2007, Malawi released revised National Accounts figures for the years 2002-2004 and pre-liminary aggregate figures for the years 2005 and 2006. Comparisons between the old and new esti-mates showed that GDP in current prices had been revised upward by 38.0 per cent in 2004 and by 37.4 and 37.7 per cent in the two subsequent years. The main reasons for this revision were the intro-duction of better quality estimates for small and medium-sized businesses, and new data for Non-profit institutions serving households (NPISHs).
On 6th March 2007, National Accounts tables with the new figures for 2002-2004 were made availa-ble to the Ministry of Economic Planning and Development (MEPD), only for use as data input for the new macro-economic model. During March the same year the new time series for 2002-2004 also with preliminary estimates for 2005 and 2006 were presented to the Secretary to the Treasury and later to the Minister of Finance and to the National Accounts and BOP Technical Committee. Finally, the new National Accounts for the years 2002-2004 together with preliminary figures for the years 2005 and 2006 were launched to the public on 27thMarch 2007 at a large workshop in Lilongwe, chaired by the Commissioner of Statistics, Charles Machinjili. At the launch of the new data, the Fi-nance Minister, Honourable Goodall Gondwe said that he had for a long time felt that the country’s economy had been understated and that the new national accounts data gave a much better picture of the country’s economy. He also said that the introduction of the new national accounts followed the decision to change the methodology of getting GDP estimates from the “production approach” to compile more comprehensive “Supply and Use Tables”. Goodall Gondwe was again appointed as Minister of Finance from June 2014.

19
3.12. Summary of the new GDP results for Malawi compared with the old figures
Comparison between the old and new estimates showed that the level of GDP in current prices was revised up by about 38 per cent for the year 2004, see Table 1. The main reasons for the upward revi-sion were improved coverage of medium and small-scale businesses, new data for the Non-profit insti-tutions serving households (NPISH), and better estimates for production for own use.
Table 1. GDP Market prices, 2002-2006, Billion Kwacha, current prices
2002 2003 2004 2005* 2006*
New estimates 204.4 236.2 285.9 338.0 430.3
Previous estimates 148.4 171.9 207.2 245.9 313.8
Revision, per cent 37.7 37.4 38.0 37.5 37.1
Source: National Statistical Office. Malawi The figures for 2005 and 2006 were preliminary estimates based on the old growth rates and price indices. Final national accounts figures for 2005 were planned to be compiled during the year 2007. Table 2 shows the revisions in value added by activity in current prices in 2004. The old national ac-counts data for Malawi were compiled in 1994-prices. In order to calculate the current price values, the appropriate CPI and price indices for external trade were used for various activities. This means that the revisions by activity were approximate.
Table 2. GDP by activity, the year 2004, billion Kwacha, current prices. New and previous estimates New
estimatesPrevious
estimatesRevision
billion Kwacha Per cent
%Agriculture 90,6 70,6 20,0 28,4
Small-scale 66,6 55,0 11,6 21,0
Large-scale 24,0 15,5 8,4 54,3
Mining and Quarrying 3,2 2,8 0,4 15,4
Manufacturing 26,1 20,7 5,5 26,4
Electricity and Water 5,0 2,6 2,4 89,9
Construction 11,2 5,0 6,2 123,3
Ownership of Dwellings 11,8 2,7 9,1 343,1
Distribution 43,8 38,6 5,2 13,5
Transport and Communication 15,7 9,6 6,1 63,1
Financial and Professional Services 21,9 16,3 5,6 34,5
Private Social and Community Services 26,6 3,9 22,7 578,4
Producers of Government Services 17,8 15,9 2,0 12,4
Unallocable Finance Charges (FISIM) -14,4 -7,2 -7,2 100,9
GDP at Basic Prices 259,3 181,5 77,9 42,9
Taxes on production, customs duties 26,5 25,7 0,8 53,2
GDP at Market Prices 285,9 207,2 78,7 38,0
Source: National Statistical Office. Malawi

20
Table 3. GDP by activity, million Kwacha and change in per cent. New GDP estimates from the revision published in 2007
Current prices Million kwacha Volume change % Price change % 2002 2003 2004 2003 2004 2003 2004
Agriculture 70535 77939 90581 3,9 2,8 6,4 13,0 Small-scale 51928 59721 66628 9,1 -1,5 5,4 13,2 Large-scale 18608 18218 23953 -10,8 16,9 9,7 12,4 Mining and Quarrying 1704 2686 3225 35,1 18,9 16,7 1,0 Manufacturing 20340 25857 26146 16,9 3,0 8,7 -1,8 Electricity and Water 3475 3773 5010 3,0 13,4 5,5 17,0 Construction 8673 9947 11214 1,1 3,0 13,4 9,5 Ownership of Dwellings 10010 11141 11773 2,7 2,4 8,4 3,2 Distribution 31701 33328 43797 2,3 11,4 2,7 18,0 Transport and Communication 12202 14282 15674 6,4 2,2 10,0 7,3 Financial and Professional Services 17357 19157 21923 2,2 5,8 8,0 8,2 Private Social and Community Services 16000 21083 26580 7,8 12,5 22,2 12,1 Producers of Government Services 11104 13328 17839 4,3 4,0 15,1 28,7 Unallocable Finance Charges (FISIM) -8062 -11053 -14427 30,0 18,2 5,5 10,4 GDP at Basic Prices 195039 221467 259334 4,3 4,9 8,8 11,6 Taxes on production, customs duties 9343 14773 26536 34,4 12,7 17,6 59,3 GDP at Market Prices 204382 236240 285870 5,7 5,4 9,3 14,8
Source: National Statistical Office, Malawi.
Table 3 shows the importance of Agriculture, in particular small-scale agriculture. Agricultural pro-duction is very dependent on rainfall, and the availability of inputs such as fertilizer. This is also im-portant for the Household consumption figures shown in the next Table 4. Table 4. GDP by expenditure, million Kwacha and change in per cent. New estimates Current prices Volume change % Price
change % 2002 2003 2004 2003 2004 2003 2004
Final consumption exp. Of HH and NPISHs 181181 208128 256154 2,4 4,6 12,2 17,6
Household final consumption expenditure 163929 187887 230931 2,9 4,0 11,4 18,2
NPISH final consumption expenditure 17252 20241 25223 -2,3 10,7 20,1 12,5
Government final consumption expenditure 17507 20544 29773 6,0 22,2 10,7 18,6
Gross fixed capital formation 27637 33403 46376 16,2 27,1 4,0 9,3
Dwellings 3112 3181 3343 -10,3 -8,6 14,0 15,0
Other buildings and construction 5168 6674 7347 8,6 -5,3 19,0 16,3
Transport Equipment 7197 9940 13402 33,3 17,1 3,6 15,1
Machinery 12160 13608 22145 16,2 57,7 -3,7 3,2
Changes in Inventories 5345 7003 5695 19,7 -29,9 9,5 16,0
Exports of goods and services 42517 63068 71353 37,0 4,2 8,3 8,6
Exports of goods 32102 52841 58014 53,0 1,8 7,6 7,8
Exports of services 10415 10227 13339 -12,1 16,5 11,8 11,9
Imports of Goods and Services 69805 95904 123480 21,5 11,4 13,1 15,5
Imports of Goods 58901 84164 111148 26,5 13,9 12,9 16,0
Imports of Services 10904 11740 12332 -5,8 -5,9 14,3 11,6
GDP at Market Prices 204382 236240 285870 5,7 5,4 9,3 14,8
Source: National Statistical Office, Malawi
Table 4 shows GDP by expenditure at a more detailed level than before for Malawi. The table illus-trates that in this low income economy, Household final consumption expenditure represents a very large share of the gross domestic product (80%).
3.13. International Comparability
Figures 2 and 3 show GNI per capita for Malawi and the neighbouring countries. The two figures give different results. According to Figure 1, which shows data adjusted for differences in the price levels, with 37.5 percentages upward revision of GDP and GNI for Malawi, GNI per capita for Malawi lies between Tanzania and Zambia?

21
Figure 2. GNI per capita 2005, PPP International dollars
Source: World Bank and own calculations
Figure 3. GNI per capita 2005, Atlas method US dollars
Source: World Bank and own calculations
According to Figure 3, which shows data based on market exchange rates, Malawi was still between Burundi and Mozambique, even after the upward revision. Differences in compilation methods be-tween countries in Africa will affect the international comparability of national accounts statistics. For Malawi underestimation of parts of the economy gave a very low GDP and GNI. This can also be the case for many other developing countries. The Malawi National Accounts Report 2002-2005 (http://www.nsomalawi.mw/) gives details on the concepts, sources, and methods used.

22
4. Phase 2. 2007-2010 with update of NA-SUTs and Institutional sector accounts for the years 2005, 2006 and 2007
4.1. National Accounts with SUTs for the years 2005 and 2006
From the National Accounts Division in Statistics Norway, Mr. Steinar Todsen was appointed as long term advisor in the NA-BOP Branch from July 2007 to March 2009. The National Accounts Report for NA figures for the years 2002-2004 and preliminary NA figures for 2005-2006 had been finalised, and could be published when the final comments from the Commissioner would be incor-porated into the report . The next step was to get quotations for printing. The LTA followed this up and a PDF version of the report was made available for download on the NSO web site. During the year 2007, compilation of National Accounts with SUTs for the year 2005 was a priority for the NA-BOP Branch in NSO. The SUTs and the SIOTs for 2005 were produced at a detailed lev-el and aggregated to the level required for international reporting. In 2008, NSO moved to new and better offices in Lilongwe, but it took time before the phone lines were connected and the PC net-work was in operation. Initially, the Internet connection was only on one PC. At that time NSO was conducting a National Agriculture Census and Livestock (NACAL). The plan was that the results from the NACAL should in first quarter of 2008 give more complete data for the agriculture sector, but the new data were delayed. During a workshop in Salima in December 2008, work started on the input to the 2006 SUTs. Due to delays of important source statistics (AES 2006 and NACAL), the work on the 2006 SUTs was delayed, compared to the plans made earlier in 2008. Ms. Irene Tuveng started as long term advisor for 2 years from July 2007. Very important for the quality of the National Accounts was her project for building up a comprehensive system for compil-ing the Annual Economic Survey for large enterprises, starting from AES 2007.
4.2. Institutional sector accounts
The next milestones for the National Accounts were:
Production and generation of income accounts for the institutional sectors, with a direct link between the sector accounts and the SUTs to ensure consistency between these two parts of the national accounting system.
A full set of sector accounts for general government.
The National Accounts rest of the world account, fully consistent with the IMF's BOP system.
Table 5. From the data specified for the SUTs, the following parts of accounts for the Institutional sectors accounts could be set up:
Institutional sectors.
Government units, including social security funds
Financial corpora-tion Private and public
Non-financial corporations Private and public
House-holds
NPIs serving households (NPISHs)
The rest of the world
I. Production Accounts Generation of Income Accounts
Production Intermediate Consumption Value added Operating surplus
Residuals: Value added Gross operating surplus
Residuals: Value added Gross operating surplus /Gross mixed income
Residuals: Value added Gross operating surplus
Import Export Export Sur-plus
II. Income accounts Need more data Need more data Need more data Need more data Need more data
III. Capital account Gross fixed capi-tal formation
Gross fixed capital formation
Gross fixed capital formation Gross fixed capital formation
During this period, the NSO held discussions with the Reserve Bank of Malawi situated in Blantyre on delivery of data for the financial sector. The data for banks were collected by NSO. When the LTA was leaving at the end of March 2009, the NA/SUTs tables for the period 2002-2006 were ready and the first institutional sector accounts for 2006 were also established.

23
4.3. National Accounts with SUTs and Institutional sector accounts for the year 2007
From the National Accounts Division in Statistics Norway, Ms. Ann Kristin Brændvang started as long term advisor in the NA-BOP Branch from January 2010 until March 2012. During this period Ms. L. H. Simpson had two short term missions to NSO, Malawi. By November 2010, SUTs for the year 2007 had been completed. Preliminary NA-figures for the period 2008-2010 based on the latest SUTs (2007) had been compiled and the institutional sector accounts for the year 2007 had also been computed.
5. Phase 3. National Accounts SUTs system according to the UN SNA 2008 requirements
Table 6. The key SNA 2008 implementation milestones
Implementation Milestones Complementary data systems SNA-related data and development
Pre-SNA phases
Basic data on production, turnover, consumption, exports and imports. Consumer and producer price indices. Balance of payments, goods and service account, Monetary survey statistics.
Milestone 1 Basic indicators of gross domes-tic product (GDP) Final expenditures on GDP current and constant prices GDP by industry at current and constant prices
Supply and Use Table worksheets Balance of payments: current, capital and financial accounts Government finance statistics (GFS) transaction accounts
Milestone 2-4 are covering further development of the National Accounts
The SNA 2008 implementation milestones were prepared and presented by the UN Inter-Secretariat Working Group on National Accounts at the 42nd session of the United Nations Statistical Commission (UNSC) in 2011. Milestone 1 focuses on basic GDP indicators, final expenditures on GDP and by industry in current and constant prices. Supply and Use Table worksheets are essential elements in the complementary data system.
5.1. A new main revision of the National Accounts for Malawi for the years 2002-2010
Introduction of 2008 SNA, new international nomenclature for industries, products and international trade from the year 2009 called for a new main revision of the National Accounts for Malawi. With several new or improved statistical data sources, a revision looked a feasible, but still demanding pos-sibility.
For the SUTs compilation, the following changes for implementing the 2008 SNA methodology were introduced:
FISIM (financial intermediation service indirectly measured) treated as an indirect measure of the value of financial intermediation provided, but for which finance institutions do not charge explicitly. FISIM was recorded as output from banks and from imports. The use of FISIM was recorded as intermediate and final consumption and as export.
Repairs and installations of industrial machinery were classified as a separate industry.
Improved estimates for non-observed economy such as collection of firewood and water.
Improved estimates for “work in progress” for cattle and cultivated forest.
24
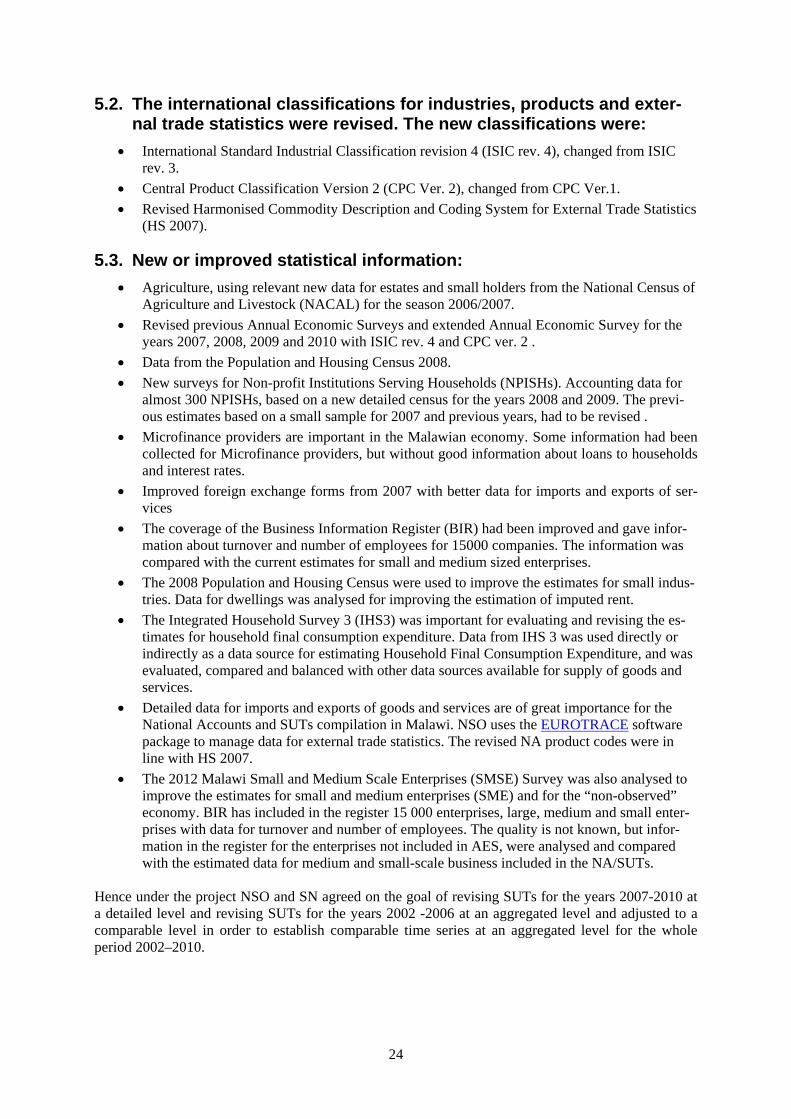
5.2. The international classifications for industries, products and exter-nal trade statistics were revised. The new classifications were:
International Standard Industrial Classification revision 4 (ISIC rev. 4), changed from ISIC rev. 3.
Central Product Classification Version 2 (CPC Ver. 2), changed from CPC Ver.1.
Revised Harmonised Commodity Description and Coding System for External Trade Statistics (HS 2007).
5.3. New or improved statistical information:
Agriculture, using relevant new data for estates and small holders from the National Census of Agriculture and Livestock (NACAL) for the season 2006/2007.
Revised previous Annual Economic Surveys and extended Annual Economic Survey for the years 2007, 2008, 2009 and 2010 with ISIC rev. 4 and CPC ver. 2 .
Data from the Population and Housing Census 2008.
New surveys for Non-profit Institutions Serving Households (NPISHs). Accounting data for almost 300 NPISHs, based on a new detailed census for the years 2008 and 2009. The previ-ous estimates based on a small sample for 2007 and previous years, had to be revised .
Microfinance providers are important in the Malawian economy. Some information had been collected for Microfinance providers, but without good information about loans to households and interest rates.
Improved foreign exchange forms from 2007 with better data for imports and exports of ser-vices
The coverage of the Business Information Register (BIR) had been improved and gave infor-mation about turnover and number of employees for 15000 companies. The information was compared with the current estimates for small and medium sized enterprises.
The 2008 Population and Housing Census were used to improve the estimates for small indus-tries. Data for dwellings was analysed for improving the estimation of imputed rent.
The Integrated Household Survey 3 (IHS3) was important for evaluating and revising the es-timates for household final consumption expenditure. Data from IHS 3 was used directly or indirectly as a data source for estimating Household Final Consumption Expenditure, and was evaluated, compared and balanced with other data sources available for supply of goods and services.
Detailed data for imports and exports of goods and services are of great importance for the National Accounts and SUTs compilation in Malawi. NSO uses the EUROTRACE software package to manage data for external trade statistics. The revised NA product codes were in line with HS 2007.
The 2012 Malawi Small and Medium Scale Enterprises (SMSE) Survey was also analysed to improve the estimates for small and medium enterprises (SME) and for the “non-observed” economy. BIR has included in the register 15 000 enterprises, large, medium and small enter-prises with data for turnover and number of employees. The quality is not known, but infor-mation in the register for the enterprises not included in AES, were analysed and compared with the estimated data for medium and small-scale business included in the NA/SUTs.
Hence under the project NSO and SN agreed on the goal of revising SUTs for the years 2007-2010 at a detailed level and revising SUTs for the years 2002 -2006 at an aggregated level and adjusted to a comparable level in order to establish comparable time series at an aggregated level for the whole period 2002–2010.

25
5.4. Establishing a new NA database for Malawian National Accounts version with the new nomenclature; ISIC rev.4 and CPC ver. 2
The first step in the revision was to review and update the classification codes for the SUTs. For up-dating the activities from ISIC rev.3.1 to ISIC rev.4, a link between the Malawi NA code list for ac-tivities and ISIC rev.4 was established. A correspondence table between the pre-revised and the re-vised code list was updated. The classification of products in the Malawian national accounts was also revised. A revised correspondence between the CPC ver.1 and CPC rev.2 and the NA products was established. Based on the experience with the compiled SUTs for the years 2004-2007, the range of products was reduced. The reason was the lack of detailed data sources. The revision was carried out by first compiling the SUTs for 2008 and 2009, based on new available data sources and in line with the new classifications and standards. Chaining new data from 2007 onwards with old time series from 2002 to 2007 The first step when revising the NA time series for 2002-2007, was to encode the current SUTs in line with the revised classifications for activities and products. An automatic method within the SNA-NT software application was used and reduced the required manual work, whereby manual errors were reduced. The next step was to revise the reclassified time series in line with the SUTs for 2008 and 2009. When new data and classifications for 2008 and 2009 were incorporated, it was necessary to revise the backward years to 2002 in order to link the revised level with the current figures to maintain consistent time series. One of the hiccups for progress of the work was the small group of permanent staff in the National Accounts division and that they had many commitments. This issue was discussed with the manage-ment of NSO. Despite support for the need for additional staff, no extra staff joined the NA team dur-ing this period. The extensive use of memory sticks implied an enormous risk for spreading the viruses. The first step to prevent the problems was to install and update antivirus software. When the new IT-system was installed in October 2011 the problem was solved. The new system was a mini-version of the Zomba IT system. In March 2012 there was still a range of unsolved problems for the 2007 and 2008 SUTs. In this peri-od the SUTs for 2007 and 2008 were balanced and finished in current prices. The revised NA data for 2007 showed an upward revision of 22 per cent in GDP compared to the 2007 SUTs before the revi-sion. The compilation of SUTs in previous year’s prices was not possible due to lack of finalised price indices. Hence, the following tasks remained to be solved by NSO after March 2012:
Compilation of the time series back to 2002 for aggregates, including the IOT, covering 2002-2008
Finalisation of the 2009 SUTs in current prices and prices of the previous year. In order to handle these issues, study visits, training and missions were arranged: During a study visit from the National Accounts branch in NSO to Oslo in October 2012, the encoding from old product codes to new product codes were discussed and improved. Training was arranged in different aspects of the SNA-NT software:
1. Analysing the situation of the 2009 SUTs accounts and the changes in stocks for services. 2. Showing how change in stocks for services could be redistributed by the RAS program.

26
The expected complete AES for the year 2010 was seriously delayed and this led to the delay in updat-ing to the year 2010. The STA Mr. Steinar Todsen went on a mission to Malawi for two weeks in June 2013. The main objectives of the mission were to verify the quality of the compilation and balancing of the SUT 2010 and assist in solving any particular challenges related to this work. The STA worked with the NA and BoP team in NSO Lilongwe, to compile the National Accounts for the year 2010, and the aggregated time series back to 2002. The terms of reference were based on the assumptions that the SUTs 2010 were close to completion from NSO prior to the mission and that no new major inconsistencies for the years 2007-2009 were revealed when aggregated time series were constructed. Unfortunately, these assumptions were not fully realized. The STA worked with the NSO on Excel files for aggregating and chaining of the new data from 2007 onwards, and for linking the new data with the old time series from 2002 to 2007. He also worked on balancing of the SUTs 2010. He discussed the figures for 2007-2009 with the NA team. They identi-fied some adjustments that should be made before the figures were ready for publication. Finalizing the new 2007-2010 data required more time than was available during the mission. The following tasks had to be solved by the National Accounts Branch after the STA mission in June 2013:
Making final adjustments to SUTs for 2007-2009
Finalising balancing of current price SUTs 2010
Finalising the price file and deflate SUTs 2010 – i.e. SUTs 2010 compiled in previous years pric-es.
Compiling the IOT for the years 2007 to 2010.
Compiling tables for publishing the revised time series, based on the Excel files developed during the mission.
It took some time before the National Accounts Branch was able to compile the final National Ac-counts for the years 2007-2010 because they also had other obligations. In February 2015 NSO pub-lished on NSO Website the following detailed final national accounts tables for the years 2002-2010: GDP by Activity in Current Prices, (MK' Million) 2002 – 2011 , and 2012, 2013 previous figures Value Added, Chained 2010 Prices (Million Kwacha), Volume Growth Rates (%) GDP by Expenditure in Current Prices, (MK' Million) 2002 - 2010 GDP by Expenditure in Constant 2010 Prices, (MK' Million) 2002 - 2010 GDP Growth Rates In Percent from Previous Years 2002-2010 They have also published a complete set of the previous national accounts tables on the NSO Website. GDP by Activity In Current Prices In MK' Million Year 2002-2007 GDP by Expenditure In Current Prices. Mill MK Year 2002 - 2007 GDP by Expenditure In Constant 2007 Prices. Mill MK Year 2002-2007 GDP by Activity In 2007 Constant Prices In MK' Million

27
Table 7 Overview of the revisions
GDP. National currency 2002 2003 2004 2005 2006 2007 2008 2009 2010 2011 Not
SUTs
1. Previous estimates GDP 148,4 171,9 207,2 245,9* 313,8*
2. Malawi National Accounts Main revision in 2007 with NA/SUTs for 2002-2004
204.4 236.2 285.9 338,0* 430,3*
Revision, per cent +37,7 +37,4 +38,0 +37,5* +37,1*
3. NSO Website, October 2014 NA/SUTs updated to 2007
204.3 236.2 285.9 326.2 423.9 510.5 601,2* 653,2* 813,9* 925,5*
4. Malawi National Accounts Main revision according to SNA2008 with NA/SUTs for 2002-2010
268.1 312,7 378,6 432,9 543,8 620,4 747,7 874,0, 1047,3 1252,8
Revision, per cent + 31 % +32 % +32% +36% +28% +22% +24% 34% +29% 35%
Figure 4. Gross domestic product

28
Table 8. GDP by activity, billion Kwacha, current prices. New and previous estimates for the year 2007
New estimates for the year 2007
Previous estimates for the year 2007
A Agriculture 170686 147966
B Mining and Quarrying 4647 5804
C Manufacturing 86544 53006
D+E Electricity, gas and water 6913 8299
F Construction 14019 16044
G Wholesale and retail trade Distribution 91031 99577
H Transportation and storage 14432 18651
I Accommodation and food service activities 8664 10342
J Information and communication 17306 13970
K Financial and insurance activities 16179 30473
Less FISIM -8062
L Real estate activities 50218 24731
M+N Professional , scientific and technical activities 2242 7791
O Public administration and defence 18977 12991
P Education 13632 9004
Q Human health and social work activities 18047 18199
R+S+T+U Other services, nec. 25081 8973
Sum of all industries 558616 468246
Plus; Taxes less Subsidies on products 61805 42293
Gross Domestic Product by expenditure 620422 510539
Source: National Statistical Office.
The revision of GDP for the year 2007 was up 22 % with a large revision for Agriculture, Manufacturing,
6. A twinning project between Malawian institutions: the Minis-try of Development, Planning and Cooperation and the Na-tional Statistical Office
The SUTs offer a flexible approach to compile Industry by Industry IOTs in current prices and in vol-ume terms. The SNA-NT methodology for transformation to SIOTs is based on the main assumption that each of the detailed products has its own specific sales structure, ‘the fixed product sales struc-ture”. The twinning project aimed at building a macroeconomic model to assist the Government in macroe-conomic planning and management. The close link between the two projects made the transition from a simple aggregated model to a more complex and disaggregated model easier. Apart from providing new insight into the economy, it also created a close link between the model builders and users and the producers of the statistical inputs to the model. This, in effect, acts as a quality assurance system bringing along important feedbacks to further improve the statistics. Once the disaggregated model was implemented it became apparent that the new methodology was a huge improvement. Choosing the type of model to build clearly depends upon what it is going to be used for. Malawi has a long history of undergoing IMF programs, one of the design criteria to make it useful was to be able to analyse such programs. Another criterion was for the model to be useful in formulating the national budgets, an area in which it has already proved helpful, for example, estimating the fiscal position and any related financing needs, and to keep track of the revenue effects from tax policies. The debate whether to go for large scale models or to keep them small and simple is a recurrent theme. When the model project was on the drawing-board, a ‘large’ model was adopted due to the fact that there was a need for IOTs to form the core of the model.

29
The IOTs derived from the SUTs were used to create the core of the macroeconomic model. Further-more, the IOTs for 2002-2010 made up the bulk of the data for the model. For each year, the IOTs in current and previous years’ prices were used to create constant price value time series by chain-linking. The I-O coefficients used in the model were estimated from the latest version of the IOTs which also defined the base year of the model’s dataset. The data in the SUTs were aggregated into 26 domestic industries, of which, 15 industries import goods and services. Also defined were the prices of intermediate inputs and all the 35 final use components. One particular useful design was the separa-tion of household’s production for own use and what was sold to the market.
7. Phase 4. Annual updates of the National Account figures from the base year 2010 at an aggregated level
7.1. The experiences with the annual SUTs compilation in NSO
It was important to complete the main revision with national accounts data for the years 2002-2010. The national accounts with SUTs and GDP were then compiled according to UN SNA 2008 with no-menclature according to the updated ISIC and CPC. Realising the benefits that SUTs provide, National Accounts require both good source data, time and knowledge for the compilation process (which in-volves checking and adjusting the source data). The 4 countries in Eastern Europe still using the Nor-wegian SNA-NT software have mainly good statistical data as required by EU and more human re-sources. For Malawi detailed time series based on SUTs in current and previous year’s prices, have been com-piled for the years up to and including 2010. By continuing with the SUTs compilation until the year 2010, it was possible to use all the improved detailed data sources. The National Accounts for the year 2010 should be a reliable base year for the next 5 years. In hindsight, compiling detailed annual SUTs every year proved to be too challenging for the NSO without the substantial support from outside with its current limited number of staff, resource and funding base. The resources available for National Accounts work in NSO have become very limited, and the National Accounts team is also responsible for several other important tasks, like surveys, preliminary estimates etc. In addition, important users of National Accounts data, like the IMF, AF-RITAC and the Reserve Bank are more interested in preliminary estimates and quarterly national ac-counts data rather than the final annual estimates published with a lag of more than 2 years. Based on this, it was concluded that annual SUTs compilation was not a technically and financially sustainable approach for NSO. The SUTs approach will instead be reserved for benchmark years, with the period between each benchmark around five years.
7.2. A new Excel Based Compilation System for the National Accounts of Malawi from 2014
Hence, NSO decided in September 2013 to prepare for a change in the approach to the National Ac-counts compilation methodology in Malawi. SUTs should only be compiled in benchmark years. An Excel based compilation system compiling GDP by the production and the expenditure approach has been introduced by Jan Redeby and Steinar Todsen. The last SUTs compiled for the year 2010 is the benchmark for the update to the following years. The new Excel based system includes three modules:
A: GDP compiled by the production approach
B: GDP compiled by the expenditure approach
C: The rest of the world accounts (may be added when A and B are done)

30
The input data to the new system are prepared as Excel tables, similar to the input data to the SUTs. The industries are more aggregated and the product data are not needed or are needed but much more aggregated.
7.3. An alternative option: ERETES National Accounts software
ERETES is an information system used for the elaboration of National Accounts according to the SNA. It is used in around 30 countries all over the world. Main programs concerning implementation are carried out in Africa and Latin America, funded by amongst others France, UNDP, etc. Eurostat is engaged in the transfer of knowledge to the community of users. In particular, 4 regular regional workshops are organised. Furthermore, the ERETES users group is established to define mid-term orientations. In line with the Luxembourg Recommendations suggesting using a common tool for the production of National Accounts, Eurostat continues its support to ERETES. The tasks during 2009-2012 included upgrading ERETES to 2008 SNA (including the balance sheet and the production of long time series), informal sector and quarterly national accounts, as well as regional or national workshops. ERETES operates from a database with the basic economic data around which different technical tools (commodity flows, branch accounts, matrices from whom to whom, summary tables) or organi-zational (follow-up of work, note pad, online help) allows coordinated and consistent teamwork. It reconciliates the data and allows calculation of GDP according to the 3 traditional approaches (pro-duction, expenditures, income). ERETES is available in English, French and Spanish. The monitoring of the ERETES software is ensured by a Directors' Committee, consisting of the French national sta-tistical institute INSEE and the copyright co-owners Eurostat and the French Ministry of Foreign Affairs.
8. Summed up: What has been the impact of the Programme?
8.1. National Accounts according to UNs SNA 2008
With technical assistance from Statistics Norway from 2004 until 2013, NSO has completed two main revisions of their National Accounts. The final result is National Accounts with Supply and Use Ta-bles and GDP compiled in current and previous years prices for the years 2002 -2010 according to UNs SNA 2008. The annual SUTs have also given a flexible approach to compile Industry by Industry SIOTs in current prices and in volume terms (previous year’s prices). The staff of the National Ac-counts and Balance of Payment Branch participated in different workshops and training sessions or-ganised by the Norwegian long and short–term advisors. Workshops were also organised for providers of economic statistics together with the national accounts compilers.
8.2. Were the right modalities for support used and specifically did the LTA modality work well?
The National Accounts for Malawi were until the revised National Accounts figures for the years 2002- 2004 were published in March 2007, compiled in 1994 prices with household consumption as a residual. GDP was converted to current price by appropriate consumer price indices and price indices from external trade. This preliminary version was compared with data from the other stakeholders as Ministry of Economic Planning and Development, the Reserve Bank and information being available in Ministry of Finance through extensive collaboration. After a meeting of the National Accounts and BOP Technical Com-mittee where the input from the other stakeholders were considered, NSO compiled and released final National Accounts estimates. Production for own use and small enterprises had been underestimated or were not included. Without the three long term advisors it would not have been feasible to give the required training for establishing the National Accounts system according to UN SNA1993 and later updated to SNA2008 with annual SUTs and IOTs

31
The cooperation between NSO, Malawi and Statistics Norway has improved the quality of the annual national accounts by integrating Supply and Use tables (SUT) and Input-Output matrix (IO) in the current national accounts compilation process. A reliable and timely national accounts system should be an important database for the monitoring of Malawi’s economy. Important for the cooperation pro-ject was to improve the methodology by introducing the last standard of National Accounts, SNA2008, and utilize all the detailed data sources. Another purpose was to provide technical support to establish an efficient production process and also to provide practical training in the use of the Norwegian application SNA-NT for compiling annual SUT fully integrated in the annual national accounts system of Malawi. The backbone of the project for developing a new macroeconomic model was the national accounts figures with integrated Supply and Use tables together with an Input - Output matrix. To be able to improve the national accounts compilation and the timelines, more timely and reliable economic statis-tics ought to be produced and for the next phase of the institutional project, improvements of the core economics data should be addressed. With rapidly changing and developing economies, impact of globalisation, increasing rate of change of technology and its impact, new products and new industries, etc., it is recommended that the production of new SUTs should reflect an annual benchmarking pro-cess. When Malawi is unable to compile SUTs every year, it is recommended that National Accounts should be benchmarked through the compilation of SUTs, at least every five years.
8.3. How could efficiency have been improved? Did we focus sufficiently on user contact with ministries, academia, public at large?
When the project started in 2004 and later, the LTA together with the NA branch had contact and meetings with users and different Ministries. If the new Statistics Act from 18 May 2013 had been approved earlier, it might have given NSO earlier access to data in various Ministries. “The passing of the new Statistics Act by the Malawi Parliament on 18th May 23, 2013 enhances NSO’s authority to coordinate and manage the National Statistical System. The Act establishes and empowers the NSS to raise public awareness about the importance and role of statistical information; collect, process, analyse and disseminate quality statistical data and information in a coordinated and timely manner; promote the use of best practices and international standards in statistical production, management and dissemination; promote the use of statistical information, particularly for evidence-based policy design, monitoring and evaluation and decision making; and build sustainable capacity for the production and use of statistical information in Malawi”.
8.4. Did SN introduce too advanced products?
SN had developed a software SNA-NT based on earlier projects in Zimbabwe and Jamaica. The SNA-NT was further developed and used in SN and also given to and used by 4 East European countries. The SNA-NT was free and SN had national accounts experts who could support the software in Ma-lawi. With the Norwegian SUTs methodology, it was possible to evaluate and utilise all available eco-nomic statistics and other relevant data, balance the different data sources and compile reliable figures in current prices and volume estimates in previous year’s prices. Important was also that SNA-NT software had an efficient routine for converting from SUTs to IOT. One alternative might have been the software ERETES, based on a different French inspired National Accounts methodology. But in 2004 ERETES was only used in French speaking countries and re-quired support from EUROSTAT or INSEE.
8.5. Was enough done to ensure proper staffing and remuneration?
The main problem during the project period has been the economy and the low salaries in NSO Mala-wi. The work was often delayed because different bills were not paid, as for electricity, internet and for virus protection. In 2006 the National Accounts team had double salaries, but that could not con-

32
tinue. The little group of permanent staff in the National Accounts division had also many other com-mitments than compiling the annual SUTs. Was the scope of the cooperation adequate? A partly separate problem was the inefficiency in the total remuneration with low salaries and quite decent field work allowance which tempted the NA staff to give high priority to field work. During a period of two years, the staff were paid a bonus that doubled their salary based upon approval from the Norwegian Embassy and a special allocation from the Minister of Finance to ensure a fast track pro-duction of the first revised national accounts figures. This proved a success, but NSO was not allowed to sustain this arrangement. There were also other problems due to the budget system, such as lack of funds for recurrent expendi-tures such as electricity bills, updating virus protection etc. Hence NSO faced returning virus infec-tions on the computers and several rounds of data problems. Combined with two break-ins and PCs being stolen and the lack of proper routines for backup of data, this caused a huge challenge in the Lilongwe office in 2010.
8.6. Documents
The work was based on the following documents published from Statistics Norway (SN): Documents 2005/5 “National Accounts Supply and Use Tables in Current prices” and Documents 2005/4 National Accounts, Supply and Use Tables in Constant prices”, from June 2005. These documents were distrib-uted to the NA office and used as background for presentations at seminars and workshops. Docu-ments 2005/6 The SNA-NT User’s Guide was also available in the office. Shorter copies of this doc-umentation were also distributed since the published documentation from SN was rather complicated, lengthy and detailed. The current version of the SUT methodology and the SNA-NT Software is based on “Documents 2009/8. “Norwegian Methodology for Supply and Use Tables and Input Tables, published by Statistics Norway in June 2009. From 2010, the work on preparing a shorter Handbook was given a strong emphasis. The then LTA, Ms Ann Kristin Brændvang started organising “The Malawi National Accounts Handbook”. Different chapters were written by the different statisticians in the NA/BOP branch. Initially the focus was on getting the work done. The Handbook gave documentation of the methodology and data sources used for compiling National Accounts with SUTs and Balance of Payment for the years 2002 -2010. The Handbook also had a short explanation of the SNA-NT methodology, based on Statistics Norway. Documents 2009/8. “Norwegian Methodology for Supply and Use Tables and Input Output Tables, by Liv Hobbelstad Simpson and SNA-NT User’s Guide, updated in December 2012, by Hans Kristian Langva. The Malawi National Accounts Handbook proved to be a useful tool since staff with experience had been reduced. The Handbook was finalised by the NSO staff in January 2015.
9. Implementation of the SNA 2008 in African countries
9.1. The African Group on National Accounts (AGNA)
The African Development Bank (AfDB), the African Union (AU) and the UN Economic Commission for Africa (UNECA) have established a new group called the African Group on National Accounts (AGNA) to foster the implementation of the SNA 2008 in African countries. The main driver is to enable African countries develop the capacity reflecting policies, strategies, resources and infrastruc-ture to compile statistics for monitoring and evaluation of the Millennium Development Goals. The AGNA has prepared a ‘Draft African Strategy for the Implementation of the SNA 2008. The imple-mentation of the SNA 2008 is being followed up and supported by a range of training, workshops,

33
seminars and regional meetings. Similar approaches have been pursued in the other regions around the world to aid the continual development of economic statistics and improve the comparability of key aggregates. Expert group meeting on Supply and Use Table was held 2 -6 June 2014 in Port Louis , Mauritius. The purpose of the meeting was to (i) share and discuss African countries’ experience and best practices in compiling SUTs; and (ii) to finalize the chapters of UNECA. “Handbook on Supply and Use Table, Compilation, Application and Practice relevant to Africa” (Planned to be published in 2015-2016).
9.2. The status of National Accounts for countries in Africa
The Report “In-Depth Situational Analysis of the Reliability of Economic Statistics in Africa: GDP Measurement” was published in February/March 2014 and gives a detailed description of the state of play in African economic statistics. 51 countries have taken part in the second, more detailed, survey and this report gives a more complete overview of national accounts in Africa. More than half of Afri-can countries are using either Supply and Use Tables (SUTs) or computer models such as ERETES to underpin their GDP estimates. Computer models and SUTs do not guarantee accuracy but they do ensure that the available data are being efficiently exploited. The sources and methods used by African countries are similar to those of the developed countries. The only difference is that developed coun-tries can draw on a much greater supply of basic data from both administrative sources and statistical surveys. By contrast, African countries are data-poor. In particular they lack reliable data from statisti-cal surveys of households, enterprises and agriculture. Such surveys are carried out so infrequently that when the new results become available the rough estimates that have had to be made since the previous survey need to be substantially revised. And these large revisions cast doubt on the validity of African statistics as a whole. African statisticians are now well aware of the need to include value added by informal/non-observed enterprises in their GDP although four countries reported that they do not yet include the informal sector in their GDP estimates. Among the countries that cover informal activities it is clear that many are under-estimating the contribution of the informal sector to total GDP and sizeable increases in GDP levels can be expected as these countries improve the coverage of the informal sector. Multi-phase surveys – combined “Household-Enterprise” surveys - are the preferred method of measuring the output and value added of the informal sector. So far 30 countries have car-ried out at least one multi-phase survey of the informal sector since 2000. Furthermore, if the Statisti-cal Business Register is defective – because it includes enterprises that are no longer trading, excludes newly created enterprises, or contains incorrect data on enterprise size or kind of activity – it will not provide a proper frame for censuses or sample surveys of enterprises. Many countries have problems in maintaining a comprehensive, up to data Statistical Business Register.
9.3. Ghana moving from a low income country to middle income country
In 2010, the Ghana Statistical Service (GSS) announced a revision to its GDP estimates for 2006 of over 60 per cent and published revised series for the five years, 2006-2010. In view of the large size of the revision and the international media attention that it attracted, the Statistics Department of the Af-rican Development Bank (AfDB) arranged for three National Accounts experts from Morocco, Nigeria and South Africa to visit GSS to carry out a Peer Review of Ghana’s National Accounts. The Review took place in March 2013 and their report explains the sources of the revisions, the new information on which it was based, and the lessons learnt for the future. A consultant, for Ghana in 2007 with 2004 as the reference year, developed the SUTs. The SUTs for 2004 cover 147 Industries, (currently the compilation level of Ghana’s National Accounts) and 175 products. Regarding the revisions, the main findings of the Review team can be summarised based on particularly, the large upward revisions were made for: Trade, repair of vehicles and household goods, hotel and restaurants (+282%) Transport, storage and communication (+186%); and Finance, insurance, real estate and business services (+167 %).
The revised GDP series is closer to SNA 1993, although FISIM is not being distributed to consumers. Adoption of the other new features of the SNA 1993 could not account for more than 1-2 % of the

34
60% upward revision. The revision was largely due to the use of VAT-based records which are now being provided to the GSS every quarter. This means that the revision only affected the formal sector. GVA for the Forestry industry now includes illegal logging, whilst water fetching was not included. GVA for NPISHs is excluded from the GDP. Full coverage of the informal sector is not currently in-cluded in Ghana’s GDP. When, and if, information becomes available, to allow GSS to include GVA by informal producers, a further substantial upward revision is probable. The Review team made sug-gestions for further improvement of Ghana’s GDP: GSS should use the VAT based records available to establish a new Business Register and try to un-dertake the following surveys:
Integrated business survey (one is tentatively scheduled for 2015). Census or large scale survey of agriculture. Mixed household enterprise survey. Survey of construction, of service activities and domestic trade.
9.4. Nigeria, Uganda, Kenya and Tanzania changes to their National Accounts data in 2014
In 2014, a number of African countries made significant revisions to their estimates of GDP. In the case of Nigeria and Uganda, the revisions were mainly driven by the rebasing and benchmarking of the National Accounts:
Nigeria - the latest rebasing and re-benchmarking exercise of Nigeria’s National Accounts esti-mates was concluded by the National Bureau of Statistics in July 2014. The statistical exercise resulted in a revision to the nominal and real GDP estimates as well as growth rates of GDP for the period 2010 to 2014, as the base year (the reference year for computation) was moved from 1990 to 2010. Prior to this rebasing project, Nigeria had not rebased since 1990. The rebasing of the GDP estimates resulted in an approximate doubling in the size of its economy, around 90 per cent.
Uganda - following a major statistical revision, GDP was roughly $25bn at the end of the fiscal year 2013-14, about 13 per cent more than previously thought. The change was made by bring-ing forward the base year for calculations from 2002 to 2010, when the structure of the econo-my was very different and rapidly growing industries such as banking and mobile telephony were much smaller in size.
Kenya - the rebasing of GDP estimates resulted in a 25 per cent increase in its GDP. The incre-ment was generally the product of revaluations of real estate, agriculture, manufacturing, and fi-nancial and insurance services. According to the Kenya National Bureau of Statistics, Kenya’s “rebased” GDP for 2013 is now estimated at a nominal $55.2 billion, compared to $44.1 billion before the revision. This boost in GDP made Kenya the ninth-largest economy in Africa and classified it as a middle-income country, since its GNI per capita, $1,160, has surpassed the cur-rent World Bank threshold of $1,036 to qualify. For instance, public expenditure as a percentage of GDP will now be significantly lower in the Kenyan case. The National Accounts were linked to the compilation of the SUTs and took account of all types of data sources (surveys, censuses, and administrative) to the extent that the SUTs included an extensive and comprehensive range of economic data that provided a big improvement on the previous estimates.
Tanzania - the rebasing of GDP estimates resulted in a 27.8 per cent increase in its GDP and linked to the production of SUTs. The largest increases in terms of the levels were observed for: Other Social and Personal Services (232%), Education (194%) and Water Supply (158%). The largest decreases in terms of level changes were observed for: Electricity and Gas (31%), Hotel and Restaurants (14%), and taxes on Products (27.0%).

35
African economic officials expect more countries to re-calculate the size of their economics and reveal very different figures. According to the AfDB only 10 African countries out of 54 meet the interna-tional standard of using a base year for their GDP calculation that was 5 years ago or less. Another group of 19 countries use a base year that is at least a decade old and seven countries – including large countries like as Sudan – use base years that are more than 20 years old. There are some key commod-ity-rich countries like the Democratic Republic of Congo and Equatorial Guinea that use base years from the 1980s. Through these changes, it is expected that more countries will manage the revisions through the production of SUTs. Ref . African_Statistical_Journal_Vol.17_-_01_2015

36
References NSO Website http://www.nsomalawi.mw/ Quick linkwith detailed final national accounts tables by activity for the years 2002-2011 and by expenditure for the years 2002 – 2010. Also tables for previ-ous periods. NSO Website http://www.nsomalawi.mw/ The Malawi National Accounts Report 2002-2005, with concepts, sources and methods used for the first revision for the years 2002-2004 and the NA tables published in March 2007. NSO Website http://www.nsomalawi.mw/ The Malawi National Accounts Handbook, January 2015, gives details on the concepts, statistical data and methods used for the revision of NA for the years 2002 -2010, 50 pages with text and complete list of industries and products. Statistics Norway, Documents 2005/ 5 “National Accounts Supply and Use Tables in Current Prices”, by Liv Hobbelstad Simpson. (Different preliminary versions distributed to NSO in Malawi) Statistics Norway Documents 2005/ 4, “National Accounts Supply and Use Tables in Constant Pric-es”, by Liv Hobbelstad Simpson. (Different preliminary versions distributed to NSO in Malawi) Statistics Norway Documents 2005/6, “SNA-NT User’s Guide for Supply and Use Tables in current and constant prices”, by Steinar Todsen . Last updated December 2012, by Hans Kristian Langva Statistics Norway. Documents 2009/8, “Norwegian Methodology for Supply and Use Tables and Input Output Tables by Liv Hobbelstad Simpson. (Different later versions distributed to NSO in Malawi) IARIW Conference in South Africa 2012. “National Accounts for Malawi. The Effect on GDP of Inte-grating Supply and Use Tables in the National Accounts and the Requirements for Periodically. Main Revisions”, NSO Malawi Survey on Non-profit Institutions Serving Households 2011 NSO Annual Economic Survey Report. 2007-2009, September 2012. NSO Strategy for the implementation of the 2008 SYSTEM of National Accounts and supporting eco-nomic statistics, 2013-2017. First draft from January 2013. NSO Master Plan. 2013. 60 pages about different statistics. Only chapter 1.1.2.3 about National accounts African Statistical Journal, Volume 17, December 2014: Special edition on economic statistics, Volume17. Statistics Norway. History of National Accounts in Norway. From free research to statistics regulated by law, by Erling Joar Fløttum, Tore Halvorsen, Liv Hobbelstad Simpson and Tor Skoglund. African Development Bank (AfDB): The Statistical Capacity Building Division of the Statistics De-partment, in the Office of the Chief Economist at the “Situational Analysis of the Reliability of Eco-nomic Statistics in Africa: Special Focus on GDP Measurement”. June, 2013. African Development Bank (AfDB): “Peer review of National Accounts. The case of Ghana” B Kiregyera & Ajayi O: “Are African Statistics Really as bad as they are being portrayed in some international circles? A Brief for Senior African Policy Makers, Data Users and African Statistical Development Partners”, October, 2013. Morten Jerven 2013: “Poor Numbers” Cornell University Press. EUROSTAT: “Guide to Statistics in European Commission Development Co-operation Version 2, D11. National accounts, Economic accounts, Non Observed economy”

37
Appendix 1. The years 2001-2013
1.1. A program for institutional cooperation. The first missions from Statistics Norway 1. The first fact finding mission from Statistics Norway to Malawi in December 2001:
Mr. Bjørn K. Wold, Head, International Consulting Division; Mr. Ådne Cappelen, Director of Research; Ms. Liv Hobbelstad Simpson, Head of Division for National Accounts and Mr. Stein Opdahl, Advisor, International Consulting Division visited Malawi in December 2001.
2. A return fact finding to Norway by NSO an NEC in March 2002. 3. A mission by Statistics Norway in July 2002 to assist in writing the project proposal:
Mr. Bjørn K. Wold, Head International Consulting Division, Mr. Nils Amdal, Advisor, Na-tional Accounts Division, Mr. Robin Choudhry, Advisor, Research Department, and Mr. Stein Opdahl, Advisor, International Consulting Division visited NSO, NEC and the Department for Economic Affairs in Ministry of Finance in July 2002 in order to assist in the preparation of a project proposal to be submitted to NORAD, applying financial support, including technical cooperation with Statistics Norway and other Norwegian institutions.
1.2. Human resources in NSO and in Statistics Norway (SN)
Phase 1. From 2002 The National Statistical Office (NSO) of Malawi Headquarters is located in Zomba. The Commissioner was Mr. Charles Machinjili, The Deputy Commissioner was Ms. Mercy Kanyuka, The Assistant Commissioner was Mr. Jameson Ndawala. Head of Economic Statistics Division The Principal Statistician for Economic Statistics was Mr. Shelton Kanyanda The Chief Statistician for the National Accounts and Balance of Payments (NA-BOP) Branch was Ms. Lizzie Chikoti. The NA-BOP Branch was transferred from Zomba to the capital Lilongwe in 2002. From 2004 the NA-BOP Branch in NSO/Lilongwe had between 5-7 statisticians with responsibilities for National Accounts (NA) and for Balance of Payments (BOP) : Ms. Lizzie Chikoti Chief statistician, NA and BOP. Supervising NA activities, Agriculture, Dwellings. Mr. Alick Nyasulu Agriculture, Preliminary NA Mr. Hector Kankuwe BOP, Imports, Exports, Unit value price indices Mr. Philemon Siwinda Government accounts, NPISH Mr. Timothy M’manga IT-coordinator for input data, administrating SNA-NT, Household consump-tion Mr. Joseph Chimseu Phiri Production accounts, Capital formation, back up as IT-coordinator, Mr. Titus Nkhoma Production accounts, (From May 06) back up as IT-coordinator From the National Accounts Division in Statistics Norway (SN), national accounts experts had long/and or short term missions to the NA/BOP branch in Lilongwe._ Mr. Nils Amdal was assigned to the NA-BOP branch for a two year period starting from February 2004 to April 2006. During that period the Long Term Advisor (LTA) was assisted by a number of short term missions. The short term advisor (STA) Ms. Liv H Simpson had short term missions to NSO, Malawi in March and September 2004, in August/September 2005 and in March 2006. Ms. Randi Hallen and Ms. Liv H Simpson had missions in June and September 2006 and in January 2007. The IT expert Mr. Hans Kristian Langva had short missions in 2005, 2006 and January 2007.

38
Phase 2. 2007 to 2009 From the National Accounts Division in Statistics Norway, Mr. Steinar Todsen was appointed as long term advisor in the NA-BOP Branch from July 2007 to March 2009. Both the IT expert Mr. H. K. Langva and the STA Ms. L H. Simpson had 2 short term missions to NSO, Malawi in Phase 2.
Phase 3. 2010 to 2014 From the National Accounts Division in Statistics Norway, Ms. Ann-Kristin Brændvang was appoint-ed as long term advisor in the NA-BOP Branch from January 2010 to December 2011. Both the IT expert Mr. H. K. Langva and the STA Ms. L H. Simpson had 2 short term missions to the National Accounts Section in NSO, Malawi in Phase 3. Mrs. Lizzie Chikoti, Mr. Timothy Mmanga and Mr. Jonathan Mkungudza from NSO, National accounts section undertook a study visit to Statistics Norway in November, 2012. Main topics were: Finalizing the 2008 and the 2009 SUT and the 2008 and 2009 IOT, Finalize the document on the “Malawi National Accounts Handbook, sources and methods”. Train Mr. Mkungudza on the use of SNA-NT Mr. Steinar Todsen went on a final mission to Malawi for the SUTs balancing for the year 2010 for two weeks in June 2013. Mrs. Mercy Kanyuka was appointed as the new Commissioner after the Commissioner, Mr. Charles Machinjili retired in January 2014. Mrs Lizzie Chikoti was appointed as the Assistant Commissioner responsible for Economic Statistics and moved to Zomba towards end of March 2014 Mr Kelvin Saukila took over from Mrs Lizzie Chikoti to head the NSO Regional Office in Lilongwe. Mr. Jameson Ndawala was appointed as the Deputy Commissioner Mr. Hector Kankuwe was appointed as the new Chief Statistician for the NA/BOP division in NSO The National Accounts Section had in 2013-2014 only 2 statisticians working with NA: Mr. Timothy Mmanga and Mr. Jonathan Mkungudza. Mr. Philemon Siwinda had retired An Excel based compilation system compiling GDP by the production and the expenditure approach were introduced by Jan Redeby and Steinar Todsen. The last SUTs compiled for the year 2010 is the benchmark for the update to the following years. Missions to Malawi and study visits to Norway after 2013 are for the new system
NSO Strategic plan 2013-17 Prior to the development of the NSS Strategic Plan 2013-17, the NSS implemented the first
Strategic Plan which ran from 2008 to 2012. The implementation of the NSS SP 2008-12 reg-istered some achievements. These include:
Increased awareness and utilization of statistics through dissemination of statistics using the NSO Website and MASEDA database.
Enhanced human resource capacity across the NSS through filling of some of the posts at jun-ior and senior management and sending some statistical staff for further training
Establishment of the National Steering Committee to improve coordination of the NSS. Conduct of Donor Coordination Meetings and designation of Lead Donor Passing of the National Statistics Act 2013.
UN System of National Accounts. 1993 SNA.
UN System of National Accounts. 2008 SNA.
UN Handbook on Supply, Use and Input-Output Tables with extensions and applications, to be published in 2015.
UNECA. “Handbook on Supply and Use Table, Compilation, Application and Practice rele-vant to Africa”, Delayed, might be published in 2015-2016.

39
Acronyms ASYCUDA Automated System for Customs Data AES Annual Economic Survey BoP Balance of Payments COFOG Classification of Functions of Government COICOP Classification of Individual Consumption by Purpose COPNI Classification of the Purposes of the Non-profit Institutions CPC UNs Central Product Classification CPI Consumer Price Index GDP Gross Domestic Product FISIM Financial Intermediation Services Indirectly Measured HS Harmonized System Codes of Tariff Nomenclature IHS Integrated Household Survey ISIC UNs International Standard Industrial Classification of All Economic Activities IMF International Monetary Fund KAU Kind of Activity Units MOAFS Ministry of Agriculture and Food Security MGDS Malawi Growth and Development Strategy MoF Ministry of Finance MRA Malawi Revenue Authority MTEF Medium Term Expenditure Framework NA/BOP National Accounts and Balance of Payments NGO Non-Governmental Organization NPISH Non Profit Institutions Serving Households NSO National Statistical Office RBM Reserve Bank of Malawi SN Statistics Norway SUTs Supply and Use Tables VAT Value Added Tax WMS Welfare Monitoring Survey SNA1993 System of National Accounts, 1993 SNA2008 System of National Accounts, 2008

40
Acronyms ASYCUDA Automated System for Customs Data AES Annual Economic Survey BoP Balance of Payments COFOG Classification of Functions of Government COICOP Classification of Individual Consumption by Purpose COPNI Classification of the Purposes of the Non-profit Institutions CPC UNs Central Product Classification CPI Consumer Price Index GDP Gross Domestic Product FISIM Financial Intermediation Services Indirectly Measured HS Harmonized System Codes of Tariff Nomenclature IHS Integrated Household Survey ISIC UNs International Standard Industrial Classification of All Economic Activities IMF International Monetary Fund KAU Kind of Activity Units MOAFS Ministry of Agriculture and Food Security MGDS Malawi Growth and Development Strategy MoF Ministry of Finance MRA Malawi Revenue Authority MTEF Medium Term Expenditure Framework NA/BOP National Accounts and Balance of Payments NGO Non-Governmental Organization NPISH Non Profit Institutions Serving Households NSO National Statistical Office RBM Reserve Bank of Malawi SN Statistics Norway SUTs Supply and Use Tables VAT Value Added Tax WMS Welfare Monitoring Survey SNA1993 System of National Accounts, 1993 SNA2008 System of National Accounts, 2008

Statistics Norway
Postal address:PO Box 8131 DeptNO-0033 Oslo
Offi ce address:Akersveien 26, OsloOterveien 23, Kongsvinger
E-mail: [email protected]: www.ssb.noTelephone: + 47 62 88 50 00
ISBN 978-82-537-9197-5 (elektronisk)
Design: Siri Boquist