building on free primary education, primary and secondary education in
TRANSCRIPT

Africa Region Human DevelopmentWorking Paper Series No. 101
Primary and SecondaryEducation in LesothoA Country Status Reportfor Education

Copyright © December 2005Human Development SectorAfrica RegionThe World Bank
The views expressed herein are those of theauthors and do not necessarily reflect theopinions or policies of the World Bank orany of its affiliated organizations.
Cover design by The Word Express, Inc.Typography by The Word Express, Inc.Cover photo: Henk Meijerink, Group 5 – Netherlands

III
Table of Contents
Foreword ..................................................................................................................................... xi
Acknowledgments ........................................................................................................................xv
Executive Summary ...................................................................................................................... 1
Chapter 1: Demographic and Macroeconomic Setting ............................................................... 11
Chapter 2: Overview of the Education Sector: Historical and Comparative Perspectives ........... 23
Chapter 3: Patterns of Spending on Education ........................................................................... 47
Chapter 4: Disparities in Enrollments, Student Flow, and Benefit Incidenceof Public Spending .................................................................................................... 83
Chapter 5: Service Delivery and Learning Outcomes in Primary andSecondary Education .............................................................................................. 105
Annexes .................................................................................................................................... 139Annex 1.1: Lesotho Country Profile ....................................................................................... 141Annex 1.2: Lesotho’s Zones and Districts ............................................................................... 145Annex 2.1: Primary Syllabus in Lesotho Standards 1 through Standard 7 (1997) ................... 147Annex 3.1: Summary of Primary School Feeding Programs in Lesotho................................... 149Annex 3.2: Summary of Bursary Programs in Lesotho ........................................................... 155Annex 3.3: Subvention for Government Secondary Schools ................................................... 161Annex 4.1: Incidence of orphanhood among children below 15 years,
Lesotho and other African countries circa 2000 ................................................... 163Annex 4.2: Distribution of new entrants in Standard 1 by age in the school census,
Lesotho 1999–2003 ............................................................................................. 165Annex 4.3: Means of variables in the logit model of nonparticipation to school .................... 167Annex 4.4: Promotion, repetition and dropping out rates by grade, Lesotho 2000................. 169Annex 5.1: Primary teacher qualifications by school type (2003) ........................................... 173Annex 5.2: Secondary teacher qualifications by school type (2003)........................................ 175Annex 5.3: Average years of experience for current teachers .................................................. 177Annex 5.4: Randomness of Teacher Deployment ................................................................... 179Annex 5.5: Evolution of Teacher-Student Ratio from 1998 to 2003 ....................................... 189Annex 5.6: Mean and standard error of students test scores by subject and
country in the 2000–2003 SACMEQ survey ........................................................ 193

IV Primary and Secondary Education in Lesotho
References ................................................................................................................................. 195
TablesTable 1.1: Population by Location, Gender, Age, and District (2002) .....................................13Table 1.2: Literacy Rate ..........................................................................................................13Table 1.4: Prevalence of HIV/AIDS among Education Sector Staff ..........................................14Table 1.5: Trends in GDP and GNP since 1998 in Lesotho (in maloti) ...................................17Table 1.6: GNI Per Capita in 2003 (in US$) ...........................................................................17Table 1.7: Central Government Budgetary Operations (% of GDP)........................................18Table 1.8: Education Sector Expenditures (1998/99 to 2004/05) ............................................19Table 1.9: Sector-Specific GDP Contributions, 1980/81–2002/03 ...........................................21Table 1.10: Composition of Employment and GDP, 1999 ........................................................21Table 2.1: Duration of Compulsory, Primary and Secondary Education .................................24Table 2.2: MOET Organizational Chart .................................................................................27Table 2.3: Evolution of Enrollment by Level of Education in Lesotho ....................................30Table 2.4: GER and NER in Lesotho Compared with Other Selected Countries
and Regions ...........................................................................................................34Table 2.5: Grade-Specific Enrollment Rates in Lesotho...........................................................37Table 2.6: Overall Survival Rates ............................................................................................37Table 2.7: Cohort Survival Rates (1999 and 2004) .................................................................39Table 2.8: Intercycle Transition Rates .....................................................................................41Table 2.9: Repetition Rate by Grade and Education Cycle ......................................................41Table 2.10: Efficiency of Student Flow in Primary Education in Lesotho, 2003 ........................42Table 3.1: Comparing MOET Budgets with Actual Education Expenditures ..........................50Table 3.2: Programs of Expenditure in MOET .......................................................................51Table 3.3: MOET and NMDS Recurrent and Capital Expenditures .......................................55Table 3.4: Actual Education Recurrent Expenditures by Program 1998–2005 ........................57Table 3.5: Distribution of Government Recurrent Expenditure on Education .........................59Table 3.6: Evolution of Recurrent Budget for Central Administration ....................................60Table 3.7: MOET Staffing and Salary Bill ...............................................................................61Table 3.8: Details of Primary Recurrent Expenditures in 2003/04 ..........................................61Table 3.9: Regional Averages for Teacher Wages, Pupil-Teacher Ratio, and
% of Recurrent Spending on Inputs other than Teachers ........................................63Table 3.10: Teacher Pay Scale ...................................................................................................63Table 3.11: Comparing Salaries of Primary Teachers with those of other Public
and Private Employees ...........................................................................................64Table 3.12: Details of Secondary Recurrent Expenditure in 2003/04 ........................................66Table 3.13: Secondary Average Teacher Pay and Official Pay Scale 2004..................................67Table 3.14: Subventions to Higher Institutions in 2003/04 .......................................................69Table 3.15: Government Recurrent Expenditure Per Student ....................................................72Table 3.16: Public Expenditures Per Student as % of GDP Per Capita in 2001 .........................73Table 3.17: Average Fees for Meals and Lodging at Secondary Level ........................................79Table 3.18: Average Secondary “Other” Fees by Grade ............................................................79Table 4.1: Grade-Specific Enrollment Rate by District in
Primary Cycle, 2003...............................................................................................86Table 4.2: Grade-Specific Enrollment Rate by District in Secondary Cycle .............................87

Table of Contents V
Table 4.3: Children Between 6 and 14 Years Old Who Have Never Been to School,Lesotho 2000 and 2002 .........................................................................................88
Table 4.4: Children Who Have Never Been to School by Age and Income Groups,Lesotho 2000–2002 ...............................................................................................89
Table 4.5: Probability of Having Never Been to School Among Children Aged 6–14,Lesotho 2000–2002 ...............................................................................................91
Table 4.6: Distribution of Children by Distance to Nearest Primary School,Lesotho 2002 .........................................................................................................93
Table 4.7: Estimates of the Probability of Having Never Been to School,Lesotho 2002 .........................................................................................................95
Table 4.8: Promotion, Repetition, and Dropout Rates During Two ConsecutiveYears in a Cohort of Children Enrolled in Primary Education in 1999,Lesotho 2000 .........................................................................................................97
Table 4.9: Estimated Probabilities of Advancing, Repeating, and Dropping out ina Cohort of Children Aged 6 to14, Lesotho 2000 ..................................................99
Table 4.10: Incidence of Public Expenditure on Education by Income Quintile ......................102Table 5.1: Distribution of Primary and Secondary Schools by Location and
Management Type in 2003 ...................................................................................106Table 5.2: Average Size of Primary Schools ...........................................................................108Table 5.3: Average Size of Secondary Schools 2003 ..............................................................108Table 5.4: Percentage of Schools Using Multigrade Teaching ................................................109Table 5.5: Proportion of Multigrade Teachers by Number of Grades Taught ........................109Table 5.6: Proportion of Schools Offering an Incomplete Cycle of Instruction......................110Table 5.7: Average Number of Pupils Per Primary Classroom...............................................111Table 5.8: Average Number of Pupils per Secondary Classroom ...........................................112Table 5.9: Proportion of Primary Pupils with no Seat or Desk ..............................................113Table 5.10: Average Number of Books Per Primary Pupil .......................................................114Table 5.11: Percent Distribution of Households by Time to Reach Nearest Primary
and Secondary School 2002 .................................................................................115Table 5.12: Primary Teacher Qualifications and Level of Education, 2003 .............................116Table 5.13: Secondary Teacher Qualifications ........................................................................118Table 5.14: Primary Teachers: Gender and Location ...............................................................118Table 5.15: Attrition of Primary Teachers, 2004 .....................................................................120Table 5.16: Prevalence of HIV/Aids among Education Sector Staff .........................................120Table 5.17: Percentage of Teachers who are Unqualified ........................................................123Table 5.18: Theoretical Average Teaching Load Per Day, Based On
Pupil-Classroom Ratio .........................................................................................124Table 5.19: Primary School Leaving Examination Results, Lesotho 1999 and 2003 ...............128Table 5.20: Disparities in Primary School Leaving Examination Results,
Lesotho 1999 and 2003 .......................................................................................129Table 5.21: Sample Characteristics of Pupils and Schools, Lesotho 2003 ................................131Table 5.22: Correlates of PSLE Results, Lesotho 2003............................................................132
FiguresFigure 1.1: Lesotho Total and School-Age Population ..............................................................12Figure 1.2: GDP Growth Rates in Lesotho, 1980–2003 ...........................................................16

VI Primary and Secondary Education in Lesotho
Figure 2.1: Education System in Lesotho..................................................................................25Figure 2.2: Primary and Secondary Schools by Ownership (2004) ...........................................29Figure 2.3: Lesotho Primary Enrollment 1998 to 2003 ............................................................33Figure 2.4: Gross and Net Enrollment Rates in Primary and Secondary Education ..................34Figure 2.5: Primary Entry Age in 2000 and 2002 .....................................................................35Figure 2.6: Survival Rates in Primary and Secondary Education ..............................................38Figure 2.7: Cohort Survival Rate to Grade 5 in Selected Countries (2001) ...............................38Figure 2.8: Intercycle Transition Rates from 1994 to 2004 ......................................................40Figure 3.1: Flow of Funds ........................................................................................................52Figure 3.2: Lesotho Education Sector Expenditure (1998/99–2004/05) ....................................54Figure 3.3: Share of Lesotho’s Budgets Devoted to Education ..................................................56Figure 3.4: % of GDP Spent on Education in 2001 in Selected Countries
and Regions ...........................................................................................................57Figure 3.5: Total Expenditures on Education by Program 1998 to 2005. .................................58Figure 3.6: Educational Development and Public Spending as % of GDP ................................71Figure 3.7: Proportion of Schools Charging Fees for Standard 1 ..............................................74Figure 3.8: % of Schools Charging Registration Fees by Type ..................................................74Figure 3.9: % of Schools Charging Book Fees for Standard 1 by Type .....................................75Figure 3.10: % of Schools Charging Other Fees by Type ...........................................................75Figure 3.11: Average Fees by Standard 1999 to 2003 (among the schools still charging) ...........76Figure 3.12: Average Registration Fees among Schools that Charged such Fees in 2003 ............77Figure 3.13: Average Book Fees among Schools that Charged Book Fees in 2003 ......................77Figure 3.14: Average Other Fees among Schools that Charged Other Fees in 2003 ....................78Figure 4.1: Primary Enrollment Ratios by Gender ....................................................................84Figure 4.2: Secondary Enrollment Ratios by Gender (Forms A through E) ...............................84Figure 4.3: Grade-Specific Enrollment Rates in Primary/Secondary Education, 1999 ...............85Figure 4.4: Grade-Specific Enrollment Rates in Primary/Secondary Education, 2003 ...............85Figure 4.5: Benefit Incidence Analysis by Income Quintiles ....................................................101Figure 5.1: Number of Primary Schools and Classrooms .......................................................107Figure 5.2: Primary Teachers: Number and Qualification ......................................................117
Secondary Teachers: Number and Qualification ...................................................117Figure 5.3: Primary Teachers and Gender 1999–2003 ............................................................119Figure 5.4: Secondary Teachers and Gender 1999–2003 ........................................................119Figure 5.5: Relationship Between Numbers of Teachers and Students in
Primary School, 2003 ...........................................................................................123Figure 5.6: Country differences in reading and mathematics achievement ..............................127
Annex FiguresFigure 1: Relationship between Number of Teachers and Students in
Mountain Areas, 2003 .........................................................................................179Figure 2: Relationship between Number of Teachers and Students in
Lowlands, 2003 ...................................................................................................180Figure 3: Relationship between Number of Teachers and Students in
Senqu River, 2003 ................................................................................................180Figure 4: Relationship between Number of Teachers and Students in
Foothill, 2003 ......................................................................................................181

Table of Contents VII
Figure 5: Relationship between Number of Teachers and Students inGovernment schools 2003 ....................................................................................184
Figure 6: Relationship between Number of Teachers and Students inCommunity Schools, 2003 ...................................................................................184
Figure 7: Relationship between Number of Teachers and Students in SchoolsGoverned by Lesotho Evangelical Church, 2003 ..................................................185
Figure 8: Relationship between Number of Teachers and Students inSchools Governed by Roman Catholic Church, 2003...........................................185
Figure 9: Relationship between Number of Teachers and Students inSchools Governed by Anglican Church of Lesotho, 2003 .....................................186
Figure 10: Relationship between Number of Teachers and Students inSchools Governed by African Methodist Church, 2003........................................186
Figure 11: Relationship between Number of Teachers and Students inSchools Governed by Private Schools and Other Schools, 2003 ...........................187
BoxesBox 2.1: Free Primary Education in Lesotho ........................................................................31Box 3.1: Repayment of Loan Bursaries from the NMDS ......................................................70


IX
ABBREVIATIONS AND ACRONYMS
ACL Anglican Church of LesothoACL Anglican Church of LesothoAGOA African Growth Opportunity ActAIDS Acquired Immune Deficiency
SyndromeAME African Methodist EpiscopalBED Bachelor of Arts in EducationBOS Bureau of StatisticsCEO Chief Education OfficerCOSC Cambridge Overseas School
CertificateCWIQ Core Welfare Indicators
QuestionnaireDEP Diploma in Education (Primary)DES Diploma in Education
(Secondary)DPE Diploma in Primary EducationDRCs District Resource CenterDRT District Resource TeachersDTE Diploma in Technological
EducationDTEP Distance Teacher Education
ProgramECCD Early Childhood Care and
DevelopmentECOL Examination Council of LesothoEFA Education For AllEMIS Educational Management
Information SystemFDI Foreign Direct InvestmentFPE Free Primary EducationFTI Fast Track InitiativeGDP Gross Domestic ProductGER Gross Enrolment RatioGNI Gross National IncomeGNP Gross National ProductGOL Government of LesothoGSER Grade Specific Enrolment RateHIV Human Immunodeficiency VirusHQ Headquarters
IDA International DevelopmentAssociation
IDM Institute for DevelopmentManagement
IIPE International Institute ofEducational Planning
IMF International Monetary FundJC Junior CertificateLCE Lesotho College of EducationLDTC Lesotho Distance Teaching
CenterLEC Lesotho Evangelical ChurchLHWP Lesotho Highlands Water ProjectLP Lerotholi PolytechnicMAED Masters in EducationMDGs Millennium Development GoalsMEFMI Macroeconomic and Financial
Management InstituteMICS Multiple Indicator Cluster
SurveyMOET Ministry of Education and
TrainingMOFDP Ministry of Finance and
Development PlanningMTEF Medium-Term Expenditure
FrameworkNCDC National Curriculum
Development CenterNFE Non-Formal EducationNMDS National Manpower
Development SecretariatNTTC National Teacher Training
CollegeNUL National University of LesothoPIEP Primary In-Service Education
ProgramPRGF Poverty Reduction and Growth
FacilityPRS Poverty Reduction StrategyPSCU Project Support and

X Primary and Secondary Education in Lesotho
Coordination UnitPSLE Primary School Leaving
ExaminationPTC Primary Teachers’ CertificateRCM Roman Catholic ChurchRSA Republic of South AfricaSACMEQ Southern African Consortium on
Measuring Education QualitySACU Southern African Customs UnionSADC Southern African Development
CommunitySSA Sub-Saharan AfricaSSRFU School Supply Reliance Feeding
Unit
SSU School Supply UnitTSD Teaching Service DepartmentTTI Thaba-Tseka Training InstituteTVD Technical and Vocational
DepartmentTVET Technical and Vocational
Education and TrainingUN United NationsUNESCO United Nations Educational
Scientific and CulturalOrganization
USA United States of AmericaWFP World Food Program
CURRENCY EQUIVALENTS(Exchange Rate Effective May, 2005)Currency Unit = Maloti
Maloti 6.1 = US$1US$1 = 1.35 SDR
FISCAL YEARApril 1 – March 31

XI
his Country Status Report on the edu-cation sector in the Kingdom ofLesotho is one of a series of reportssponsored by the World Bank in coun-tries in Sub-Saharan Africa. Each re-
port is researched by a team from the relevantministries, the World Bank, and other develop-ment partners. The immediate objective is toform a solid analytic foundation to informpolicy makers in the education sector. Morebroadly, the publication of the report providesa stimulus for an informed national debate onthe education system.
Such debate is particularly appropriate at thistime, as governments and the international com-munity increasingly see education playing a cen-tral role in development. In a global economy,competitiveness depends heavily on skills. Thegrowth of both domestic employment and in-ward investment depend on the availability of alabor force with appropriate skills. Educationand skills development, in turn, are among thekey investments which governments can maketo increase competitiveness and grow theeconomy. There is well documented evidencethat investments in education produce attrac-tive returns. But the value of education goes farbeyond its economic importance. Education isa significant health intervention, and one of the
Foreword
most effective weapons in the fight against HIV/AIDS. Education also contributes to social de-velopment, allows the spread of new ideas, andsupports the development of an open and demo-cratic society. The Kingdom of Lesotho has aparticularly long tradition of valuing education.As a small country with limited natural re-sources, it has relied on the skills of its peopleas a source of income. More recently, the gov-ernment of Lesotho has identified education asa central component of its development plans.
In recognition of the importance of educa-tion in determining the life-chances of youngpeople, the global community has adopted anambitious goal to ensure that all children havethe benefit of a good primary education by 2015.This goal has mobilized national and interna-tional resources. Throughout Africa, newschools have been constructed, more teachershave been employed, and user charges for pri-mary education are being dropped. These effortshave resulted in significant increases in enroll-ment. Throughout Africa, there are now morechildren in school than ever before. But muchremains to be done. As education systems ex-pand, a series of challenges are emerging.
• The first is the challenge of coverage, or“reaching the hard to reach”. As participa-
T

XII Primary and Secondary Education in Lesotho
tion in education has increased, most of theeasy to reach children have already been en-rolled. One implication of this success is thatmore of the remaining children will be in thecategories that are difficult and more expen-sive to serve. These include children in remoterural areas, ethnic and linguistic minorities,nomads, and orphans.
• The second is the challenge of quality. Edu-cation is of little value unless the quality issufficient to ensure real learning. Unfortu-nately, maintaining quality at a time of rapidexpansion is a formidable task. In many Af-rican countries rapid growth in numbers hashighlighted shortages of skilled teachers andlimited capacity in inspection, support andmanagement systems. In some cases, South-ern and Eastern Africa Consortium for Moni-toring Educational Quality (SACMEQ) testsshow that the quality of education is actuallyfalling.
• The third is the challenge of equality. Lesothois one of the few countries where girls’ par-ticipation is higher than boys’. But there re-main significant inequalities in other areas.Rural and poor families have lower partici-pation in education. Even more important isthat in Lesotho as in many low-income coun-tries, conditions of schooling differ widelyacross localities and the result is to create dis-parities in learning outcomes which typicallyput children from poor, rural families at adisadvantage with regard to access to furthereducation and well-paying jobs.
• Secondary education presents a fourth chal-lenge. Traditionally, participation in second-ary education has been limited to a relativelysmall proportion of the population. Expan-sion of participation in primary education andthe increasing demands of the labor marketboth provide pressures for expansion of thesecondary sub-sector.
These challenges would be onerous in anycountry, but African countries must face themwith limited resources. The government of
Lesotho already devotes a very high proportion(roughly a quarter) of its national budget to edu-cation, making it unlikely that further increasesin budget can be found. This suggests thatLesotho must seek to improve the efficiency ofits education system, to provide its people withbetter value for their expenditure.
This Country Status Report aims to helpLesotho meet these challenges. As a report, ithas a number of noteworthy features. It goesbeyond the basic indicators of enrollment andretention that are used in monitoring systems,and offers a deeper insight into how the systemis performing. In doing this it follows a struc-ture developed by the World Bank which allowseasy comparisons between countries. It is basedprimarily on existing data, mostly from minis-try sources and from the household data sur-veys. Other sources, where available, are usedto corroborate its findings.
Also noteworthy is the process by which aCountry Status Report is prepared. In interna-tional development, it is increasingly importantthat governments and donors work together tocoordinate their efforts. An important step inthe process of coordination is the developmentof an agreed analysis of the situation, and ashared identification of the issues. With this inmind, a Country Status Report is conceived as ajoint work, shared by the government and thedonors. The report is developed with govern-ment and donor cooperation, and should notbe seen as an external evaluation of the system,but rather as a shared analysis of the sector.
The aim of the Country Status Report is toinform policy making. As such, the report of-fers data, and an analysis of the difficulties, is-sues and key areas for action. It does not, how-ever, provide solutions. Formulating appropri-ate policy responses comes as a subsequent step,and must be developed more slowly, to allowsufficient time for thorough consultation withthe stakeholders in education, if the proposedsolutions are to work effectively.
I hope and expect that this document willmake a timely and useful contribution to ongo-

Foreword XIII
ing discussions on and planning for the educa-tion system by the government and its develop-ment partners. It is published at an opportunetime, when the target date of 2015 is near enoughto impose pressing demands, and yet far enoughaway to allow policies to have an impact.
The report offers a valuable and comprehen-sive resource for anyone interested in educationin Lesotho. It is, however, a snapshot of the sys-
tem at a particular time. If the report serves itspurpose in supporting policy development, it willrapidly become dated, and so I look forward torevisions and updates in the years ahead.
Yaw Ansu,Sector Director, Human Development,
Africa Region, World Bank


XV
his report is a product of joint part-nership between the Ministry of Edu-cation and Training and the WorldBank. It is a stock-taking study of edu-cation in Lesotho with particular fo-
cus on primary and secondary education.Lesotho’s Second Education Sector DevelopmentProject is currently in its second phase of imple-mentation. Further, the government’sFree Primary Education policy which started in1999 to gradually abolish fees is to be rolledout completely in 2006. It was felt that such astudy would provide timely input for policy dia-logue regarding the post-FPE and the next phaseof the education sector’s development inLesotho.
The work was led on the Lesotho side by Mrs.Ntsebe Kokome Principle Secretary for Educa-tion and Mr. Taole J. Masoabi, Director of Plan-ning. Dr. Kinandu Muragu, Project Coordina-tor, provided summary description of govern-ment budget process and implementation ofMTEF within the education sector; Mr.Paramente Phamotse provided inputs and feed-back related to primary education; Ms. GladysMoeketsi, Director of Human Resources, pro-vided information related to MOET staffing andsalaries; Mrs. Liteboho Maqalika-Lerotholi,Chief Inspector Secondary, and Mr. S’khulumi
Ntsoaole (the former supervisor of governmentschools who is now inspector for school man-agement) provided inputs on subventions forgovernment secondary schools; Ms. MphoMorojele, Senior Research Officer, provided in-puts to school census and related calculationson enrollment ratios and facilitated overall datacollection; Mrs. Liako Selokoma-Mofo providedsummary descriptive comparison of variousbursary and feeding programs (with supportfrom Mrs. Mamohau Mochebelele, ScholarshipOfficer) and assisted in the collection of NMDSrelated data; Mrs. Lerato ‘Matiisetso Molekoand Mr. Haleokoe Jopo assisted in the collec-tion of data from LCE, LP, and NUL and fur-ther supported the analysis of MOET status offunds. Mrs. Lerato further assisted in the analy-sis of JC and COSC results and developed theacronym list for the report. Mrs. PuseletsoNtiisa-Letuka, Financial Controller of PSCU,provided assistance in the collection of status offunds and analysis of financial data related toFPE and subventions.
On the World Bank side, the work is led byXiaoyan Liang, Senior Education Specialist(AFTH1), under the overall guidance of Jee-pengTan, Lead Economist, and Dzingai B.Mutumbuka, Sector Manager for AFTH1. Mr.Gerard Lassibille, Consultant, provided key in-
Acknowledgments
T

XVI Primary and Secondary Education in Lesotho
puts on the determinants of coverage, studentflow, and learning outcomes, analysis of servicedelivery using school census, and provided over-all guidance on the report. Without Mr.Lassibille, it would not be possible to completethis report. Mr. Keiichi Ogawa, consultant, sup-plied information related to the benefit incidenceanalysis, grade-specific enrollment ratios, effi-ciency of education spending, and analysis ofteaching allocation by school and by district. Mr.Aidan Mulkeen, Senior Education Specialist,AFTH1, is another important member of theteam. He provided inputs on the teacher andteacher management section and also contrib-uted to the Executive Summary.
Many people outside the Ministry of Educa-tion also helped by sharing with the team dataand documents that would otherwise have beeninaccessible. They include Mr Karabo KennethMabote, Director of NMDS and MrsMasuthang Mapitso Financial Controller ofNMDS, Mr. Mafa Sejanamane, Vice Chancel-lor of the National University of Lesotho (NUL)and Mr. Matsobane Putsoa, Bursar of NUL, Mr.John N. Oliphant, Deputy Director AcademicAffairs and Dr. James Urwick, Director Aca-demic Planning, Research and Consultancy ofLesotho College of Education. The Bureau ofStatistics was also helpful in answering questions
related to household survey and population pro-jections.
This report shares a similar structure and con-tent with other education country status reports.It draws particularly from the recently completedreport for Ethiopia, which was published in 2005as a World Bank country study under the title“Education in Ethiopia: Strengthening the Foun-dation for Sustainable Progress.”
The report has benefited from detailed feed-back from Paud Murphy, Don Hamilton. Peerreviewers include Lianqin Wang and HarryPatrinos provided very constructive comments.Very useful comments were also received fromMs. Preeti Arora especially on the earlier con-ceptual framework. The draft report was firstpresented to the Senior Staff of the Ministry ofEducation and Training and then reviewed byAFTH1 internally on June 6, 2005 and by theLesotho Country Team on June 21, 2005. Feed-back from these events has helped to removefactual inaccuracies and improve our under-standing of the report’s findings.
The report was financed by the Governmentof Lesotho through contributions in staff time,the World Bank and the Government of Nor-way through a grant channeled via the Norwe-gian Education Trust Fund to support educa-tional development in Africa.

Introduction
The Kingdom of Lesotho is a small mountaincountry of 1.8 million people, landlocked bySouth Africa with very limited natural resources.It experienced relatively fast economic growthin the 1990s, driven partly by the Lesotho High-lands Water Project, and the growth of foreigninvestment in the garments industry. Overalleconomic growth in the last two decades, how-ever, has been sluggish and impact on povertyreduction has been limited. By 2003, GNI percapita was about US$550 and approximately48% of total population live below US$1 perday. Lesotho further faces serious economic chal-lenges. The high HIV infection rate (29%) ishaving an impact on growth and poverty. Thegarments industry is declining following changesin the international terms of trade. Retrench-ment of Basotho workers from the mining in-dustry in South Africa is reducing income fromremittances and increasing unemployment. Inaddition, the strength of the Rand is reducingthe competitiveness of exports.
The government of Lesotho, with technicalassistance from the World Bank, is beginning toadopt a broad-based, pro-poor growth and em-ployment strategy focusing on high value com-mercial agricultural production and processing
and higher value manufacturing exports (diver-sified away from low grade garments) (CountryEconomic Memorandum, World Bank, 2005).To improve the productivity of its abundant butlow skilled labor, the GOL, primarily throughits Ministry of Education and Training, needsto improve the delivery and outcomes of the edu-cation and training sector. Given the limitednatural resources available, future economicgrowth is likely to depend heavily on humancapital development.
The government of Lesotho recognizes theimportance of education for the future of thecountry. Education and training is identified asa national priority in the recent Poverty Reduc-tion Strategy Paper (PRSP). Further, as a signa-tory to the Millennium Development Goals(MDG), the government aspires to achieve100% primary education completion and gen-der equity in primary and secondary educationby 2015. The government has also set its ownambitious goals to improve the quality of edu-cation at all levels.
This report provides an analysis of the edu-cation sector up to 2003/04 (and, on some di-mensions, up to 2004/05). The report is aimedat Lesotho’s policymakers and managers in theeducation sector. Therefore, the report is delib-erately diagnostic in orientation, and aims to
Executive Summary

2 Primary and Secondary Education in Lesotho
assist in building a shared understanding of theeducation sector. The report is focused mainlyon the primary and secondary sub-sectors, whichconstitute the bulk of the system. Within thesesub-sectors, the emphasis is on those aspectsmost relevant in the PRSP context; costs, finance,and service delivery and their impact on school-ing outcomes, especially among the poor, or-phans, and other disadvantaged population.
The report does not consider in detail techni-cal and vocational training and education(TVET), higher education, or non-formal edu-cation. These are excluded for reasons of timeand availability of data, and should be exam-ined in separate studies.
Overview and Progress in theEducation Sector
Formal education in Lesotho follows a 7–3–2–4 structure with 7 years of primary, 3 years ofjunior secondary, 2 years of senior secondary,and 4 years of tertiary education. There is alsoa parallel technical vocational education andtraining (TVET) sector which offer certificate(primary + 3 years) and diploma (senior second-ary + 2 or 3 years of TVET) programs in TVET.
For historical reasons, the majority of schools(90%) in Lesotho are owned by churches, in-cluding Roman Catholic Mission (RCM),Lesotho Evangelic Church (LEC), AnglicanChurch of Lesotho (ACL) and African Method-ist Episcopal (AME). Church schools are underthe management of their respective church au-thorities, but teacher salaries are paid by thegovernment. There are a much smaller number,less than 10% of schools which are fully gov-ernment owned, and also small numbers of trueprivate schools, funded entirely from fee income.
The Ministry of Education and Training(MOET) is responsible for the management andregulation of education in Lesotho and is headedby a minister (assisted by an assistant minister).The principal secretary is the ministry’s admin-istrative head and chief accounting officer. Un-
like other civil servants, PSs in Lesotho are on atwo-year contract. He or she is assisted at theexecutive level by a staff of officers and direc-tors. Almost all the decisions concerning educa-tion in Lesotho are made at the central office,despite the government’s efforts to implementits decentralization policy. This is particularlytrue with regard to financial matters.
During the last decade and a half, Lesothomade progress on most quantitative measuresof coverage. The Free Primary Education policyintroduced in the beginning of 2000 was themost significant policy intervention adoptedduring this time period. Total primary enroll-ment increased from about 350,000 in 1990 to430,000 in 2003/04, more than a 20% increase.Gross and net enrollment ratios in the primaryeducation cycle (127% and 85%, respectively)now compare favorably with the regional aver-ages. In terms of student flow, gross entry rateinto Standard 1 increased from 105% in 1998–99 to 120% in 2003/04. A higher proportion of6 year-olds are now entering grade 1 on time.About 65% of each entering cohort of first-grad-ers in 2003/04 was expected to reach the lastprimary grade of Standard 7, up from 56% in1998–99.
Secondary and tertiary education has beenexpanding even more rapidly. Between 1990 and2004, lower secondary enrollment increased by83%, while upper secondary enrollment in-creased by 155%. Tertiary enrollment increasedfrom less than 2000 students in 1990 to almost10,000 students enrolled in both Basotho andRSA tertiary institutions.
Remaining Challenges in AchievingQuality Education for All
Despite the progress outlined above, there re-main serious challenges in coverage, studentflow, quality, and equity:
Coverage. There remains about 15% of the pri-mary school age population who are still out-

Executive Summary 3
side of the school system. Further, overall ac-cess to secondary and tertiary levels of educa-tion remains limited. Enrollment rates at thesecondary level (GER of 35% and NER of 23%,respectively) lag behind most of its neighbor-ing countries which have achieved more than50% of secondary GER. Only about 2% of the18–25 year olds are enrolled in tertiary institu-tions. One simple index of value for money ineducation is a ratio of the coverage to expendi-ture. The lower the ratio is, the less value formoney. The ratio for Lesotho is 1:8 which ismuch lower than that for neighboring countriessuch as Botswana (4:2), Mauritius (8:3), SouthAfrica (4:7), and Zimbabwe (3:3). This meansthat with such a high level of public investmentin education (Lesotho spends about 12% of itsGDP on education), the overall coverage of theeducation system could have been higher inLesotho.
Student flow indicators could be better too. Rep-etition and dropout are causing serious wastageof resources. On average, 20% of primary stu-dents are repeaters and this figure is 10% in sec-ondary education. The efficiency rate in 2003 wasonly 57% due to both repetition and dropout.
The most concerning is the low quality ofeducation. International comparisons placeLesotho in a very unfavorable situation. Between2000 and 2003, the Southern Africa Consortiumfor Monitoring Educational Quality (SACMEQ)conducted a study under the auspices of the In-ternational Institute for Educational Planning(IIEP) in 14 English-speaking African countries.In it, Standard 6 pupils in Lesotho achieved verypoor results compared to their counterparts.According to the SACMEQ data, the perfor-mance of Lesotho students falls well below theaverage, with scores of 451 on reading, and 447on mathematics. The average score was 500.
Disparities in service delivery and educationaloutcomes. A serious challenge is the distributionof service delivery. Schools in mountain areas andthe Senqu River Valley tend to be more crowded,
and have higher student to teacher ratios andhigher proportions of unqualified and less experi-enced teachers, compared to those in the lowlandsand foothills. Multigrade schools, primarlylocated in rural mountain areas tend to be lesswell-endowed in terms of facilities and teachers.
In terms of educational outcomes, Basothochildren who live in rural poor households andwhose parents are less educated, are less likelyto attend school and more likely to repeat anddrop-out. Boys in Lesotho are less likely to at-tend school and more likely to repeat and drop-out than girls. All else being equal, children inQuthing and Qacha’s Neck were less likely toattend school; children in Maseru were morelikely to do so. While status as an orphan didnot affect the likelihood that a child would at-tend school, it did increase their likelihood ofdropping out (5 percentage points difference).Further, children who are in more crowded class-rooms and who are in multigrade classroomstend to perform worse in the Primary SchoolLeaving Exam (PSLE). Children in the elite“community”primary schools tend to have thehighest PSLE scores.
Patterns of Spending on Education
Government spending on education is extremelyhigh by international standards, at 12% of GDP(compared to world average of 4%). This fig-ure includes all allocations to the Ministry ofEducation and Training (MOET) and the bur-saries under the National Manpower Develop-ment Secretariat. However Lesotho does notseem to be getting good value for this expendi-ture, as indicated by the challenges above.
One important reason why the value formoney appears poor is that education expendi-ture in Lesotho is weighted strongly towardshigher education, where cost per student ishigher, and participation is lower. This weight-ing towards higher education is actually increas-ing. Although nominal expenditure on primaryand secondary education has increased since the

4 Primary and Secondary Education in Lesotho
introduction of FPE, their combined share ofeducation spending fell from 59% in 1998/99to only 54% in 2004/05, while the share ofspending on higher education rose from 30%to 38.7%. In per pupil terms, in the financialyear 2003/04 for example, the government ofLesotho every year spends about M747 (aboutUS$100) on each primary student, M2,093(about US$300) on each secondary student, andmore than M36,000 (about US$5000) on eachuniversity student.
One of the implications of this weighting ofexpenditure is that public funding for educa-tion benefits richer families disproportionately.At the level of primary education, governmentsubsidies are reasonably equally distributedamong various income groups. At the second-ary level, the poorest 20% of households re-ceive only 12% of public spending, while therichest 20% receives 31% of public spending.The magnitude of the disparity is even largerfor higher education. The poorest 20% of house-holds receive only 7% of government spending,while the richest 20% receive 47% of govern-ment subsidies.
Further, the current pattern of spendingwithin primary and secondary education mayneed to be reviewed to ensure maximumachievement of educational goals. Within pri-mary education, the two major drivers of costsin the primary sector are teacher salary and theschool feeding program. The average primaryteacher salary in Lesotho is more than 5 timesthe GDP per capita, considerably higher thanthe average teacher cost in Anglophone Africancountries of 4.3 times GDP per capita. The av-erage primary teacher pay, including allowances,is 1.5 times the average for public and privatesector non-teachers with similar educationalqualifications. The primary pupil to teacher ra-tio of 47:1 is reasonable compared to those inother countries.
At the secondary level, the very high averageteacher salary (more than 10 times GDP percapita) combined with the low student to teacherratio (about 23) means that the total teacher
wage bill consumes almost 90% of the total sec-ondary recurrent budget. The other significantcost items are secondary bursaries andsubventions to government secondary schools.It is important that these programs be examinedvery carefully to ensure that the MOET can tar-get the right population, get the most value forits money, and ensure equity among all schools.At the very minimum, schools receiving govern-ment subventions should account appropriatelyfor the funds they receive, not just in financialterms but also in terms of student learning re-sults. And transparent criteria are needed fordetermining subventions. Another area thatneeds close monitoring is the provision of lowersecondary textbooks. The Ministry of Educationand Training recently decided to include bothcore and non-core textbooks in the new text-book rental program. This may result in exces-sive payment requirements and may render theprogram unsustainable in the long run.
A third dimension is the manner with whichthe public expenditures are managed in educa-tion. Within the MOET, public expenditures oneducation are centrally managed. All teachersare paid directly by the Teacher Service Depart-ment, except for those in a few private schoolsthat truly are separate from the government. Thecentral government provides other school ne-cessities including textbooks and stationery,meals, and even maintenance to primary schoolsfor those grades covered by FPE (all grades willbe covered by 2006). However, this centralizedmanagement leads to great inefficiency in thedelivery of these services. It also forces inspec-tors to spend their time overseeing and signingvarious kinds of paperwork instead of monitor-ing teaching and learning in the classrooms. Atboth the primary and secondary level, MOET isalso providing grants and subventions to gov-ernment and community schools for specialprojects. Plans exist to channel funds directly toschools to cover school maintenance and mayeven include some discretionary funds at theschool level. However, the lack of strong finan-cial management and accountability remains a

Executive Summary 5
constraint. Improvement in these areas will becrucial to improved efficiency.
In short, the current distribution, patterns ofcosts and financing of education, and the man-agement of education are indeed affecting cur-rent levels of provision and quality and also con-straining further development of the system in-cluding secondary and higher education. There-fore, Lesotho needs to consider education re-forms to improve its performance, particularlybecause of the following two reasons:
• Public spending on education is already highand may not increase in the future. Given themacroeconomic conditions which seem topredict an even less optimistic picture thanthat of the 1990s, it is likely that the govern-ment will exercise more fiscal restraint in theyears immediately ahead, with non-interestrecurrent expenditure projected to decrease.In this environment, increases in the real re-sources devoted to the Ministry of Educationand Training from the government budget cancome only at the expense of other sectors.
• Better schooling outcomes are crucial to thecountry’s efforts to increase economic diver-sification and growth prospects.
Teacher Qualification, Employment,Management, and Utilization
By regional standards, primary and secondaryteachers in Lesotho are relatively well educated,and the majority has completed secondaryschool. Teaching is an attractive profession inLesotho. However, the supply of trained teach-ers (having a teaching certificate or diploma) hasnot been adequate, and an increasing propor-tion of teachers are untrained. The current strat-egy is to train these teachers in-service, using adistance education program.
The incidence of HIV infection among teach-ers appears high, and is forecast to rise. Teacherdeaths already account for the loss of 1% ofteachers annually. Measures to strengthen the
HIV awareness components in teacher educa-tion courses may be beneficial.
Local school management committees select theteachers to be employed. This system serves ruralareas relatively well. However, the administra-tion of the system is complex and could be sim-plified. Teacher selection is inequitable, and ru-ral areas have fewer of the qualified and better-educated teachers. Although there is an incen-tive payment to encourage teachers to work inremote schools, this is not seen as effective. Con-sideration should be given to ways to improvethe assignment of teachers to rural areas. Onepossible action is to reorganize the classificationof schools, to ensure that the incentive is onlypaid in genuinely remote schools. Considerationshould also be given to non-financial incentives,including accelerated promotion (which has longterm financial implications), or even a require-ment that newly qualified teachers work in ru-ral areas for a period.
Teacher utilization is restricted by a shortageof classrooms in some schools, which may en-courage teachers to reduce their working hours.This issue merits further examination, and mayexplain why classrooms seem to play a signifi-cant role in educational outcomes.
Multigrade teaching is widely practiced, par-ticularly in mountain areas. As further expan-sion of primary education is likely to be insparsely populated areas, the use of multigradeteaching is likely to play an increasing role. De-spite the reliance on multigrade teaching, it ispoorly supported in curriculum documents andin teacher training. Better preparation of teach-ers for multigrade teaching could do much toincrease the quality of learning in multigradeclassrooms.
Areas for Policy Development
The data and analysis presented above providea rather comprehensive picture of the primaryand secondary education systems in Lesotho,and form the basis of policy development for a

6 Primary and Secondary Education in Lesotho
post-FPE era. To help conceptualize and catego-rize various areas of policy development for theeducation sector in Lesotho, these issues are di-vided into structural policies and arrangementsfor system management.
Issues Pertaining to Structural and OverallPolicy Development
Overall Level of Spending and itsDistribution Across Levels of Education
Since the overall level of education spending asa proportion of GDP is unlikely to increase, ef-forts must be made to ensure that the distribu-tion of education spending across levels of edu-cation is equitable (hopefully progressive) interms of equalizing the playing field for the poorand the rich, efficient and effective in terms ofachieving policy objectives. Current distributionof education recurrent spending (37% on pri-mary, 20% on secondary, and 36% on highereducation) strongly favors the tertiary sector,especially given the much smaller student en-rollment in tertiary.
The proportion of expenditure on primaryeducation is low by international standards. TheEducation for All Indicative Framework recom-mends devoting 55% of total education recur-rent spending to primary education in order toachieve goals of universal primary completionand gender equity in education. This suggeststhat Lesotho should review the balance of ex-penditure between the sub-sectors.
One of the factors in the high expenditure ontertiary education is the bursary program ad-ministered by the National Manpower Devel-opment Secretariat. This accounts for more thanhalf of the total expenditure on tertiary educa-tion. Some increases in efficiency could be madeby strengthening the management of the NMDS,and increasing its loan recovery rate. More fun-damentally, a national dialogue on the futurerole and functions of the National ManpowerDevelopment Secretariat should be organized,with a goal to clarifying its mission.
Structure of Coverage Across Levelsof Education
Lesotho has made the seven years of primaryeducation free (the last grade of Standard 6 willbe free in 2006) and has recently recommendedto the Parliament that primary education shouldbe compulsory. However, it is not clear whetherthe government will also abolish the fees forlower secondary and start implementing the 10-year basic education. The intention has beenannounced before but it was never imple-mented. At the same time, the expectation thatlower secondary education may become free isalready circulating among the public. It is im-portant that the Government of Lesotho care-fully assesses the fiscal, pedagogical, and ad-ministrative implication of such a move beforecommitting itself.
Structure of Spending Per StudentAcross Levels
The current structure of public education spend-ing per student is heavily skewed towards ter-tiary education. The US$5000 per tertiary stu-dent subsidy is constraining the government’sability to increase the expenditure for primaryand secondary students. It is important for thegovernment, at the macro level, to set the ceil-ings for per student expenditure and further toprovide guidelines on the proportion of expen-ditures for non-teacher teaching and learningrelated areas. At the primary and secondary lev-els especially, it may be possible for Lesotho tomove from an input-based education financingmodel towards capitation grants based on stu-dent enrollment and accompanied by strength-ened accountability at the school level.
Pupil-Teacher Ratios and Implicationsfor Organization of Service Delivery
Despite the introduction of Free Primary Edu-cation, the government of Lesotho has managedto maintain the primary pupil-teacher ratio at

Executive Summary 7
about 45:47 which seems to be reasonable com-pared to other countries. However, there is awide variation in the number of teachers forschools enrolling a similar number of pupils. Forinstance, there are between 100 and 750 pupilsfor 10 teachers at the school level; similarly,schools enrolling 500 pupils may have teachersnumbering between 6 and 18. This wide rangesuggests inequitable distribution of primaryteachers. Average pupil-teacher ratios tend to behigher in rural mountain areas where the prac-tice of multigrade teaching is more pervasive.Close monitoring of the teacher allocation, de-velopment of incentives for rural teachers, andsupport structure for multigrade teaching willbe critical to ensure quality education in ruralareas.
At the secondary level, however, there are in-dications that existing secondary schools maynot be utilized to their full potential due to thelow student teacher ratio and student classroomratio (as compared to primary education). Theinitial focus of secondary expansion should beimproving the existing system.
Teacher Recruitment Standardsand Pay Policy
Cost of teachers will inevitably increase if thecurrent recruitment standards and pay policyremain the same. Although a full 30% of pri-mary teachers are considered “unqualified,” theoverall formal qualification of Lesotho’s teach-ers (at least 12 years of general education) ishigh compared to that in other developing coun-tries. International evidence has shown very littledirect relationship between teachers’ formalqualification and student learning outcomes,beyond a minimum qualification around 10–12years of schooling. At the same time, the highcost of teacher salaries constrains the govern-ment in its effort to improve coverage. The Gov-ernment intends to upgrade all primary teach-ers to Diploma degree holders. Such upgradingwill result in an increase of 60% in wages forteachers. It may be advisable for the government
to review its teacher recruitments standards andpay policy.
School Construction Standards
Despite the Government’s effort to constructmore primary classrooms in recent years,Lesotho still suffers from an overall primaryclassroom shortage. The national average pu-pil-classroom ratio is about 7:1. In mountainand Senqu River areas, however, this ratio couldbe more than 8:0. The shortage of classroomscreates the necessity for multigrade teaching inthese areas and further causes teachers to beutilized in a less than optimum way. Thus, con-struction of primary classrooms will remain apriority in the near future.
Standards for school construction representanother area of concern. School construction iscostly and of high quality in Lesotho. An aver-age 7-classroom school with associated facili-ties currently costs about M2 million, about US$300,000. The costs can rise even higher in re-mote areas where delivery of materials is diffi-cult and the harsh terrain attracts only local con-tractors. Beyond issues related to Lesotho beinga small and not very attractive market and thestrong rand, the standards for school construc-tion should be reviewed with the objective ofbringing primary schools closer to the commu-nities while at the same time reducing the costsand enhancing community ownership. The gov-ernment has already begun to accept that it ispossible to build a 4-classroom school in areaswhere the population is sparse. Further, the gov-ernment is also piloting community-based pri-mary construction in three districts. It must takefurther steps to reach the goal of bringing schoolscloser to the communities. Priority should alsobe given to provision of chairs and desks forexisting schools including church schools.
Reducing Primary Repetition
Efforts should be made to reduce primary rep-etition. Evidence from other countries suggests

8 Primary and Secondary Education in Lesotho
that repetition has little impact on educationaloutcomes, and may increase the dropout rate.Reducing repetition would decrease the grossenrollment ratio, reduce overcrowding in lowerclasses, and increase overall efficiency.
The above areas for policy development pro-vide rather general guidelines. It is importantfor the government to develop a simulation sothat the potential tradeoffs can be evaluated andpolicies developed and fed into the annual ac-tion plans and budgets.
Issues Pertaining to the Arrangements forSystem Management:
Another set of very important findings arisingfrom the report are that the post-FPE policiesneed to pay more attention to improving themanagerial efficiency to ensure equitable dis-tribution of human and financial resourcesacross schools and to ensure targeting of assis-tance to vulnerable groups to reduce social dis-parities.
Preparing for Increased Decentralizationof Decision-Making to Schools (e.g.strengthened financial management andaccountability)
Despite the heavy investment in education bythe government of Lesotho, most of the inputsflowing to schools are in kind, rather than incash. Indeed, the introduction of FPE furtherreduced the schools’ autonomy in raising andspending funds. While this may have ensuredshort-term guarantee of some minimum services,the system is rather inefficient and in the longterm this may damage school-level managementcapacity which has proven to be key to ultimatelearning outcomes.
Strengthening accountability for results is dif-ficult in education because many individuals areinvolved and the outcomes are typically multi-dimensional. Yet appropriate use of informationcan help improve performance by ensuring thatresources are at least reaching schools.
Report cards for school districts and otherhigher levels of aggregation can also providesimilar comparative information. The availabil-ity of such information may be expected to im-prove conditions in schools in two ways: by cre-ating incentives for under endowed schools toseek redress; and by pinpointing specific schoolsin the system that warrants the attention of thosein charge. In Lesotho, as in other countries, theuse of information on student achievement foraccountability purposes remains at an earlystage. The country has already established abaseline, and this can be built on as part of thebroader effort to mobilize appropriate informa-tion for better management.
Strategic Placing of New Constructionto Relieve Shortage of Classrooms andProvision of School Desks and Chairs
It should be emphasized that an important find-ing of this report is that accessibility to schoolswas a major determinant of participation: 30%of rural children who never attended school livedat least 60 minutes away from a primary school.Among the other school characteristics, only thephysical condition of the school—indexed by thepercentage of pupils with neither seat nor desk -had significant impact on attendance. In fact,providing 10% more seats and desks could im-prove attendance rates by 28%. Since FPE, thegovernment of Lesotho has focused primarilyon construction, equipping, and furnishing newgovernment schools. The strategic location ofsuch schools is critical to ensuring education forall. Further, the government may consider reno-vating existing church schools which are strate-gically located and providing desks and chairsto the church schools as well.
Clarifying Governance Structure at SchoolLevel for Increased Focus on Results
By law, primary schools in Lesotho are managedby School Management Committees. For churchschools, each management committee can be re-

Executive Summary 9
sponsible for a maximum of eight schools be-longing to the same proprietor. In an effort toencourage parents and community members tobecome involved in the management of churchschools, the Education Act of 1995 also intro-duced School Advisory Committees in churchschools. The role of these committees is to ad-vise the management committee on all mattersrelated to education in the relevant school. Les-sons learned from the implementation of SchoolManagement Committees and School AdvisoryCommittees indicate that these two committeesoverlap substantially in membership as well asin the role they play, thus creating confusion andpotential lack of accountability at the schoollevel. Recent review of the Education Act hasalready recommended the consolidation of thetwo committees into one. The recommendationhas to be endorsed and the Act should be re-vised before implementation can begin.
Supervision and Teacher Support,Particularly Regarding MultigradeTeaching
Beyond resource mobilization at the school level,pedagogical management (administrative man-agement and institutional structure of account-ability), is to be considered a major ingredientof any policy to improve the quality of educa-tional services. The outcomes of interest are thechildren’s schooling careers—as reflected in en-try, survival, and repetition rates—and theirlearning achievement. In both domains, goodresults will require teachers and school direc-tors to manage the pedagogical process effec-tively. Indeed, the analysis in this report showsthat only a very small proportion of the varia-tion in student achievement (5.5%) can be ex-plained by child, school, and teacher character-istics. More emphasis should be placed on sup-port and supervision of classroom level teach-ing and learning. This will be particularly im-portant to the schools currently practicing mul-tigrade teaching and not receiving any supportin this area.
Targeting the Vulnerable Groups
Fifteen percent of primary school age childrenin Lesotho are not yet enrolled in schools. Inalmost every measure of educational outcome,the remote rural and mountain areas are moredisadvantaged than other areas. Orphans aremore disadvantaged than non-orphans especiallyin repetition and dropout measures. The defini-tion of existing “hardship” areas may have tobe refined to capture the true hardship areas. Itis important that for every new or existing policy,special consideration be made so that childrenand students in true hardship areas are not be-ing left behind. These could include demand-side incentives for households to send their chil-dren to school.
The Education Sector Strategic Plan(2005–2015)
During the course of developing this Report, theMinistry of Education and Training finalized itsEducation Sector Strategic Plan (ESSP) for 2005–2015 and submitted the ESSP to the EducationDevelopment Partners in Lesotho for assessmenttowards Fast Track Initiative Endorsement. Thegoals and strategies outlined in the ESSP arelargely in line with the National Poverty Reduc-tion Strategy Paper and the Education Millen-nium Development Goals. The Partners submit-ted the endorsement on June 29, 2005, with thefollowing assessment to the Basic Educationchapter of the ESSP:
• Strengths– Interventions for improving quality (e.g.
continuing and professional developmentof teachers in literacy, numeracy, scienceand life skills)
– Comprehensive strategies to improve ac-cess and equity for Orphans and Vulner-able Children (OVC) and disadvantagedchildren
– Priorities clearly articulated

10 Primary and Secondary Education in Lesotho
– Partnerships formed with other ministriese.g. Health and Social Welfare
• Concerns– Lack of clarity regarding the policy on ba-
sic education– Lack of a clear teacher replacement strat-
egy in the context of HIV/AIDS– Data and analysis gaps (OVC, Special Edu-
cation needs, the data (2004) collected us-ing the new Education Geographic Infor-mation System still needs to be verifiedagainst the 2005 data )
– Focus on access provision has to be bal-anced with improved quality
– Sub-sectoral linkages are not adequatelyaddressed in the objectives and strategiese.g. lifelong learning and primary educa-tion
It is clear that the ESSP policies and strate-gies could be re-worked in light of the findingsand the suggested areas for policy developmentfrom this report. In particular, the ESSP is silenton the issues including the high tertiary expen-diture and NMDS reform, reviewing teacherrecruitment standards and pay policy, construc-tion standards, support for multigrade teaching,and specific strategies to reduce primary waste.The Ministry regards the ESSP as a “living docu-ment” and has expressed willingness to workwith the partners to develop annual work plans.Dissemination of this report and the subsequentdevelopment of an education financing modelto simulate various policy tradeoffs and fiscalimplications will support the Ministry’s effortto develop annual work plans which are linkedwith its annual budgets.

11
his chapter sets the stage for subse-quent chapters. It describes the demo-graphic and macroeconomic condi-tions in Lesotho, which have a directimpact on, or are closely linked with,
the development of the education sector. It alsopoints out key patterns and trends in govern-ment finance, including overall allocations ofpublic spending on education.
As a small country with limited natural re-sources, Lesotho faces serious challenges to itsoverall development. Primarily because theLesotho Highland Water Project (LHWP) ex-ported water and electricity to South Africa, si-multaneously creating employment opportuni-ties in the construction sector, the 1990s wit-nessed an impressive average GDP growth ofabout 7%. The political upheaval in 1998, how-ever, took a huge toll on the nation’s economy,but peace and economic recovery ensued soonafter the election in 2000. Further, the favor-able trade conditions in textile exports attractedforeign investors, and, exports of garments madein Lesotho boosted the economy and broughtthe real GDP growth back to about 3% to 4%per annum over the past couple of years. How-ever, significant challenges are looming on thehorizon, including the significant loss of growthdue to the high HIV/AIDS prevalence rate
(29%), the uncertainty concerning the terms oftrade for the textile industry, the strong randwhich reduces the competitiveness of Lesotho’sexports, and the reduction in numbers of mi-grant Basotho miners working in South Africawhich lowered national remittances and in-creased both unemployment and social unrestin Lesotho. The economic benefits from theLesotho Highland Water Project also seem tobe leveling off.
Education and skills development is an inte-gral part of Lesotho’s overall strategy for futureeconomic development and poverty reduction.Its public expenditure on education is alreadyvery high. More than 30% of total governmentexpenditure goes to the education sector. Totaleducation expenditure amounts to almost 12%of GDP, extremely high compared to the worldaverage of 4% to 6%. This level of expenditureis unlikely to increase further especially whenthe future prospect for economic growth is un-certain. Yet the high expectations and demandsput on the education sector are increasing. Someof these demands are explicitly stated in thegovernment’s most recent Poverty ReductionStrategy Paper and in the recently finalized Edu-cation Sector Strategic Plan (2005–2015).Among them are achieving equitable universalprimary education, improving the quality of the
Demographic and Macroeconomic Setting
CHAPTER 1
T

12 Primary and Secondary Education in Lesotho
education system at all levels and training suffi-cient workers with skills relevant to the country’seconomy. The challenge for the managers of theeducation system is how to use existing and ad-ditional resources to deliver education serviceseffectively and thereby fulfill these expectations.
A. Demographic Profile
The Kingdom of Lesotho is a mountainous land-locked country, entirely surrounded by the Re-public of South Africa (RSA). More than 99%of Lesotho’s population is ethnically Basotho;other ethnic groups include Europeans andAsians. The country’s population is 80% Chris-tian, with a majority Roman Catholic. Othersare Moslems, Hindus, and followers of indig-enous beliefs. Sesotho and English are the offi-cial languages; Zulu and Xhosa are among theother languages spoken.
The last census for Lesotho was carried out in1996. It established that the country’s popula-
tion was 1.67 million. The latest population pro-jections are based on the 1996 census but withrevised mortality rates due to HIV/AIDS. Theyestablished that the population in Lesotho in2004 is about 1.8 million. Figure 1.1 depicts theactual evolution of the population since 1996.
The annual rate of population growth is de-creasing. It increased from 2.3% between 1966and 1976 to 2.6 % between 1976 and 1986.However, between 1986 and 1996, the popula-tion growth rate declined to 2.1% primarily dueto the impact of HIV/AIDS. Further, between1996 and 2015 it is projected to be less than1%. As in many developing countries, youngpeople make up a sizable share of the popula-tion, as Figure 1.1 shows. For example, childrenof primary school age (6 to 12 years old) ac-counted for almost 19% of the total populationin 2004. The population of primary school-agechildren is also projected to decline slightly, from336,000 in 2004 to about 332,000 in 2008.However, it is projected that recovery will startin 2008.
Figure 1.1Lesotho Total and School-Age Population
Source: Survey Data. Missing data for one LGA (Ojoo) in 1999
0
200000
400000
600000
800000
1000000
1200000
1400000
1600000
1800000
2000000
1996 1998 2000 2002 2004 2006 2008 2010 2012 2014
Total Population
Ages 6-12

Demographic and Macroeconomic Setting 13
Table 1.1 summarizes basic characteristics ofLesotho’s population by administrative district interms of location, gender, and age. Data are fromthe latest household survey: the Core Welfare In-dicator Questionnaire, administered in 2002.More than three quarters of Lesotho’s people re-side in rural areas, and less than one quarter inurban areas. Interestingly, more than half of thepopulation (54%) is female, compared to 45.6%male. This is most likely due to the Basotho tradi-tion of men working in South Africa.
Lesotho has a relatively young population,with 32.4% of its population below age 15, andanother 64.3% between 15 and 64.
The Basotho territory can be divided into fourgeographic/ecological regions: mountains, low-
lands, the Senqu River Valley, and foothills. Foradministrative purposes, the Basotho territoryis divided into 10 districts: Butha Buthe, Leribe,Berea, Maseru, Mafeteng, Mohale’s Hoek,Quthing, Qacha’s Neck, Mokhotlong, andThaba Tseka. Each district is headed by a dis-trict secretary. The definition of zones and theirrelationship with the districts is provided in theAnnex 1.2 to this chapter.
Table 1.1also indicates that the Maseru Dis-trict, which includes the capitol of Lesotho, ishome to more than 38% of the total popula-tion. The second most populated district isQacha’s Neck, home to 13.3% of the totalBasotho population. The remaining 49% of thepopulation are scattered among the remainingeight districts.
At almost 82%, the literacy rate in Lesotho ishigh compared to the average of 64% for Sub-Saharan African countries. The literacy rate ishigher among women: almost 90% of women areconsidered literate as compared to only 73% ofmen. The literacy rate is improving generation bygeneration. While only 58% of those 60 years oldand older are literate, almost 90% of the 25–29year olds are literate, as shown in Table 1.2
Incidence of Poverty
The incidence of poverty increased in Lesothobetween 1986/87 and 1994/95. Approximately58% of the population was poor in both sur-
Table 1.1Population by Location, Gender, Age, and District(2002)
Weighted percentage
Rural 76.5
Urban 23.5
Gender
Male 45.6
Female 54.4
Age
< 15 32.4
15–64 64.3
65+ 3.3
District
Butha Buthe 8.1
Leribe 7.7
Berea 3.6
Maseru 38.1
Mafeteng 5.6
Mohale Hoek 3.9
Quthing 3
Qacha’s Neck 13.3
Mokhotlong 8.6
Thaba Tseka 8.1
Table 1.2Literacy Rate
Male Female Total
Total 73.2 89.6 81.815–24 80.5 96.3 88.625–29 82.1 95.7 89.130–39 77.2 95 86.240–49 71 88.3 80.450–59 63.5 87.5 75.960+ 44.6 66.9 58.1
Source: CWIQ 2002

14 Primary and Secondary Education in Lesotho
veys, but the percentage of households that weredenoted as ultra-poor increased from 35% to39%. The poverty mapping exercise conductedin the 1990s seems to confirm this worseningtrend, despite the economic growth. In Lesotho,the Gini coefficient, which is widely used tomeasure inequality, actually increased from 0.6to 0.66 in the period between 1986 and 1995.This is another example of how growth alone isnot sufficient to reduce poverty.
However, no recent poverty analysis has beenconducted. A household budget survey, currentlybeing conducted, should provide an update tothe poverty profile in Lesotho.
Additional vital statistics for Lesotho includ-ing the progress toward achieving the Millen-nium Development Goals can be found in An-nex 1.1. Serious challenges remain for Lesothoto achieve poverty reduction of 50%, primarynet enrollment of 100%, primary completionof 100%, and complete gender parity by 2015.The health indicators are worse than those foreducation. Hence the journey to achieve healthMDGs will be more difficult. For example,within the 12 years from 1990 to 2002, progressto reduce under-5 mortality has been very slow,dropping from 148 per 1000 in 1990 to 132 in
2002. The goal is to reduce the under-5 mortal-ity by two thirds.
HIV/AIDS and Orphanhood
Since Lesotho’s first case of AIDS in 1986, preva-lence rates among adults aged 15 to 49 haveskyrocketed from approximately 4% in 1993to 29% in 2004. This is the fourth highest preva-lence rate in the world, following Botswana(38.8 %); Zimbabwe (33.7 %); and Swaziland(33.4 %).
The high rate of HIV infection has had anenormous impact on Lesotho’s demographics.In 1986 life expectancy in Lesotho was 55 yearsand the expectation was that it would rise to 60years by 2001. As a result of HIV/AIDS, how-ever, recent estimates of life expectancy havedropped to below 37 years and are projected todrop further.
The impact of the HIV/AIDS epidemic on theeducation sector is significant. In 2003, theMOET carried out a campaign of voluntary test-ing and counseling for all its headquarters staffand teachers in seven districts; of the teachersand administrators who opted for testing, 22%were found to be HIV positive (see Table 1.4).
Table 1.4Prevalence of HIV/AIDS among Education Sector Staff
Total # Tested Negative Positiveof Staff Male Female Male Female Male Female Total
HQ 90 260 58 226 32 34 66Mohale’s Hoek 1041 65 211 53 177 12 34 46Thaba-Tseka 684 166 302 141 259 25 43 68Berea 1053 112 185 94 139 18 46 64Maseru 2810 94 266 33 170 61 96 157Mafeteng 1427 11 52 8 45 3 7 10Leribe 2150 18 57 16 51 2 6 8Quthing 782 13 52 9 39 4 13 17Total tested 1954Prevalence 0.22
Source: MOET

Demographic and Macroeconomic Setting 15
It is reasonable to expect that the overall preva-lence rate among non-volunteers would behigher. Indeed, the government’s 2003 impactassessment study estimated that nearly 30% ofteachers were affected by HIV/AIDS in 2003,with that percentage expected to increase. Thistranslates into a death rate of approximately 1%of teachers annually.
Furthermore, based on the 2002 Core Wel-fare Indicator Questionnaire survey, the num-ber of orphans in Lesotho is estimated to bearound 100,000, almost one third of the totalprimary school-age population. The educationsector faces the serious challenge of bringingthese children into school and retaining them inthe system.
The government of Lesotho was initially slowto recognize the scale of the HIV/AIDS crisis,and so far its efforts to combat the spread of thedisease have met with limited success. In 1999,the government finalized its Strategic Plan onHIV/AIDS, a program that would address theeducation, prevention, counseling, and treatmentneeds of the populace. In late 2003, the govern-ment announced that it was forming a new Na-tional AIDS Commission to coordinate society-wide anti-AIDS activities. Also in 2003 it hosteda SADC Extraordinary Summit on HIV/AIDS.Most importantly, line ministries are requiredto spend about 2 percent of their recurrent bud-gets on HIV/AIDS related activities. In the Min-istry of Education and Training, an HIV/AIDScoordination unit was established in 2003 whichis staffed with one full-time coordinator and twocounselors. The unit developed an HIV/AIDSAction Plan focusing on voluntary testing, coun-seling, and treatment for all education sectorstaff.
B. Macroeconomic Trends
Lesotho’s economy is strongly connected to thatof its neighbor, the Republic of South Africa. Itscurrency, the maloti, is pegged to the South Af-rican rand. For most countries, the key indica-
tor of economic performance is the Gross Do-mestic Product (GDP); for Lesotho, however, itis the Gross National Income or Product (GNIor GNP), which represents the real economicsituation. There is usually a gap between GDPand GNI because of the remittances that migrantBasotho workers in South Africa send back toLesotho.
Lesotho’s economy is based on the water andelectricity it sells to South Africa, along withmanufacturing, agriculture, livestock, and earn-ings both from the Southern African CustomsUnion (SACU), and from laborers employed inSouth Africa. Lesotho also exports diamonds,wool, and mohair. The majority of householdssubsist on farming or migrant labor, primarilyminers who work in South Africa for 3 to 9months each year. The western lowlands formthe main agricultural zone. Almost half thepopulation earns some income through cropcultivation or animal husbandry, with over halfthe country’s income coming from the agricul-tural sector.
Figure 1.2 traces Lesotho’s real GDP growthrate and GNI per capita. It is clear that the linedepicting real GDP growth rate experiencessome fluctuation. Over the past decade,Lesotho’s real GDP growth has been relativelyhigh, averaging 4%. High GDP growth rates inthe late 1980s to early 1990s were primarily dueto the Lesotho Highland Water Project (LHWP),which started in 1987 as a collaboration betweenLesotho and the RSA. The project has contrib-uted to Lesotho’s economy in two ways. First, itgenerated a massive demand for construction,which led to the creation of employment in theconstruction industry and thus contributed tothe economic growth1 in Lesotho. Second, theproject enabled Lesotho to generate electricityon its own and at the same time, export waterto the RSA. Once the first phase of the project
1 Among the construction projects were a 185-meterhigh dam, a 45 kilometer transfer tunnel, and hy-dropower stations (Redeby and Makume 2001).

16 Primary and Secondary Education in Lesotho
was completed, LHWP made a smaller contri-bution to GDP growth. Although the secondphase of the LHWP was carried out during thelate 1990s and the early years of the 2000s, itscontribution to GDP has been minimal.
The negative GDP growth registered in 1998was primarily due to the political unrest thatresulted in massive destruction of infrastructure,especially in the Maseru area. In the late 1990s,Lesotho’s economy was further weakened byreductions in the amount of Basotho laborneeded in the South African mines. The totalnumber of Basotho miners working in SouthAfrica was almost 96,000 in 1997, but by 2002,had dropped to 62,000, according to an IMFreport.
The GDP has been recovering steadily since1999, primarily due to the boom in the textileindustry. Lesotho has taken advantage of theAfrican Growth and Opportunity Act (AGOA)to become the Sub-Saharan region’s largest ex-porter of garments to the US. Exports totaledover $320 million in 2002. Employment reached
over 50,000, marking the first time that manu-facturing sector workers outnumbered govern-ment employees. Asian investors own most ofthe factories.
However, in late 2004, Lesotho again beganto experience a significant downturn in eco-nomic performance driven largely by uncertaintyin the textile sector due to several factors: un-certainty as to whether the US Congress wouldextend the AGOA, removal of textile quotasunder the Multifibre Agreement on Textiles andClothing, and the weak US dollar against therand which made garments from Lesotho lesscompetitive compared to those from Asia.
These events provide the context in which toconsider the country’s GNI, GDP, and GNP. Thereal GNI per capita has declined from $720 in1997 to $470 in 2002, as seen in Figure 1.2.Table 1.5 lists Lesotho’s gross domestic productand gross national product at current prices.These figures indicate the magnitude of Lesotho’seconomy and the actual gap between GDP andGNI. On average, the GNI has been over 23
Figure 1.2GDP Growth Rates in Lesotho, 1980–2003
Source: IMF Country Report (2004)
-6
-4
-2
0
2
4
6
8
10
12
1993 1994 1995 1996 1997 1998 1999 2000 2001 2002
GDP
grow
th ra
te
-400
-200
0
200
400
600
800
GNI p
er c
apita
GDP growth rate
GNI per capita

Demographic and Macroeconomic Setting 17
percent higher than the GDP. However, the gaphas been diminishing recently as the interna-tional gold price has dropped and the numberof migrant laborers has decreased dramatically,from 127,400 in 1990 to 62,200 in 2002.
Table 1.6 compares Lesotho’s GNI per capita(using the atlas method) with those of its neigh-bors and with averages for the world and forSub-Saharan Africa in 2003. It is clear thatLesotho’s GNI per capita, though higher thanMozambique’s, lags significantly behind thoseof Swaziland and South Africa. Because of itslow GNI per capita, Lesotho is classified by theWorld Bank as a lower-income country, one thatstill qualifies for loans under IDA terms.
In short, there have been ups and downs inLesotho’s economic performance during the lastdecade and a half. Overall growth rate has beensluggish and real GNI per capita has in fact de-
clined as compared to the level in 1997. Fur-ther, the impact on poverty reduction has beenlimited (World Bank, Country Economic Memo-randum (CEM): Growth and Employment Op-tions Study, 2005). Several ominous develop-ments in the early 2000s may lead to an evenless optimistic picture for development in thenear future. These factors include the high HIV/AIDS rate, uncertainty in the textile industry,the leveling off of benefits resulting from theLHWP, the retrenchment of miners from SouthAfrica, and the strong rand against the maloti,which made Lesotho’s export prices less attrac-tive. The challenge for the GOL, as reflected inits Poverty Reduction Strategy, is to ensure strongand sustainable growth with poverty reduction.
The World Bank CEM projected that majorpoverty reduction in medium term for Lesothowill require much higher real growth (5–6%)
Table 1.5Trends in GDP and GNP since 1998 in Lesotho (in maloti)
1998 1999 2000 2001 2002 2003 2004
Gross Domestic Product at current prices 4920.7 5564.9 5963.7 6564.8 7370 8143.8 8851.4Gross National Product at current prices 6305.4 7057.4 7486 8071.1 9067.7 10017.2 10938Population (millions) 1.71 1.73 1.74 1.76 1.78 1.79 1.81GDP per capita (current maloti) 2878 3217 3427 3730 4140 4550 4890GNP per capita (current maloti) 3687 4079 4302 4586 5094 5596 6043
Source: Statistical Report, No. 6, 2003 National Accounts 1980–2003, Bureau of Statistics, Ministry of Finance andDevelopment Planning
Table 1.6GNI Per Capita in 2003 (in US$)
Sub-Saharan WorldLesotho South Africa Swaziland Mozambique Africa (excl. S.A.) Average
GNI per capita 590 2780 1350 210 490 5500
Source: World Development Indicators 2004
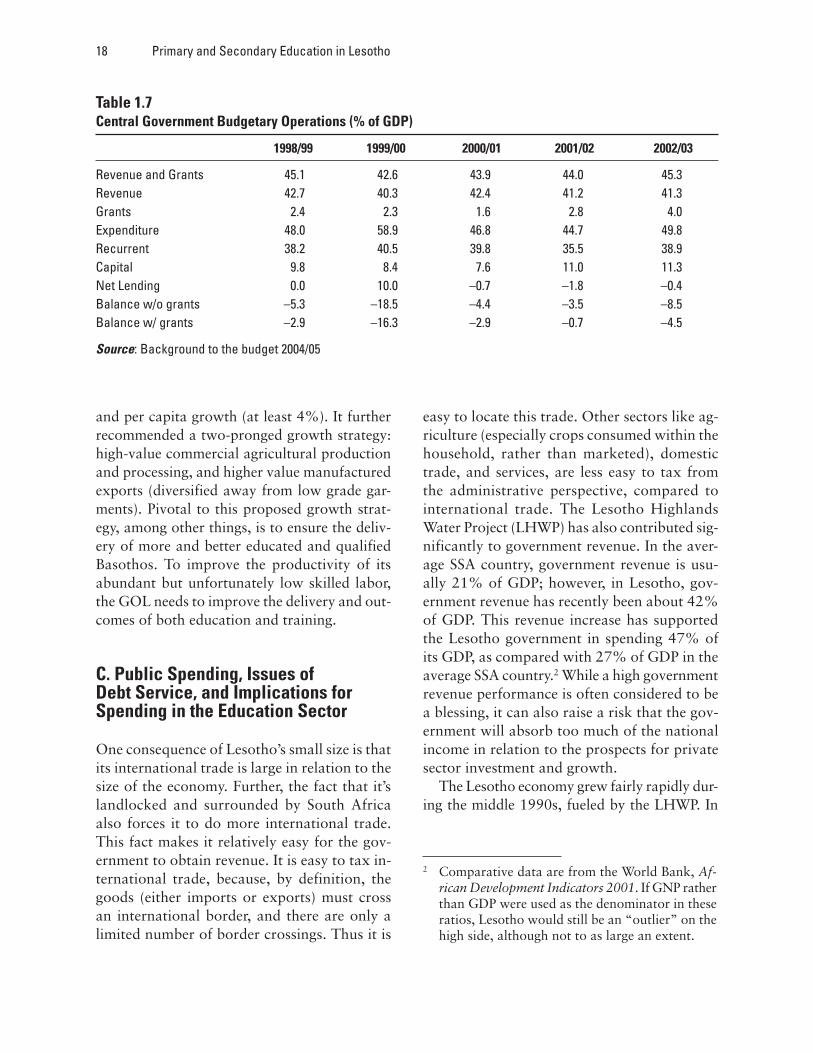
18 Primary and Secondary Education in Lesotho
and per capita growth (at least 4%). It furtherrecommended a two-pronged growth strategy:high-value commercial agricultural productionand processing, and higher value manufacturedexports (diversified away from low grade gar-ments). Pivotal to this proposed growth strat-egy, among other things, is to ensure the deliv-ery of more and better educated and qualifiedBasothos. To improve the productivity of itsabundant but unfortunately low skilled labor,the GOL needs to improve the delivery and out-comes of both education and training.
C. Public Spending, Issues ofDebt Service, and Implications forSpending in the Education Sector
One consequence of Lesotho’s small size is thatits international trade is large in relation to thesize of the economy. Further, the fact that it’slandlocked and surrounded by South Africaalso forces it to do more international trade.This fact makes it relatively easy for the gov-ernment to obtain revenue. It is easy to tax in-ternational trade, because, by definition, thegoods (either imports or exports) must crossan international border, and there are only alimited number of border crossings. Thus it is
easy to locate this trade. Other sectors like ag-riculture (especially crops consumed within thehousehold, rather than marketed), domestictrade, and services, are less easy to tax fromthe administrative perspective, compared tointernational trade. The Lesotho HighlandsWater Project (LHWP) has also contributed sig-nificantly to government revenue. In the aver-age SSA country, government revenue is usu-ally 21% of GDP; however, in Lesotho, gov-ernment revenue has recently been about 42%of GDP. This revenue increase has supportedthe Lesotho government in spending 47% ofits GDP, as compared with 27% of GDP in theaverage SSA country.2 While a high governmentrevenue performance is often considered to bea blessing, it can also raise a risk that the gov-ernment will absorb too much of the nationalincome in relation to the prospects for privatesector investment and growth.
The Lesotho economy grew fairly rapidly dur-ing the middle 1990s, fueled by the LHWP. In
Table 1.7Central Government Budgetary Operations (% of GDP)
1998/99 1999/00 2000/01 2001/02 2002/03
Revenue and Grants 45.1 42.6 43.9 44.0 45.3Revenue 42.7 40.3 42.4 41.2 41.3Grants 2.4 2.3 1.6 2.8 4.0Expenditure 48.0 58.9 46.8 44.7 49.8Recurrent 38.2 40.5 39.8 35.5 38.9Capital 9.8 8.4 7.6 11.0 11.3Net Lending 0.0 10.0 –0.7 –1.8 –0.4Balance w/o grants –5.3 –18.5 –4.4 –3.5 –8.5Balance w/ grants –2.9 –16.3 –2.9 –0.7 –4.5
Source: Background to the budget 2004/05
2 Comparative data are from the World Bank, Af-rican Development Indicators 2001. If GNP ratherthan GDP were used as the denominator in theseratios, Lesotho would still be an “outlier” on thehigh side, although not to as large an extent.

Demographic and Macroeconomic Setting 19
1998, however, real GDP fell, inflation acceler-ated to 9 percent, the balance of payments weak-ened, and the government’s fiscal deficit (asshown in Table 1.7) ballooned to unsustainablelevels.
To correct the situation, in 2000 the govern-ment began to implement an economic program
supported by the International Monetary Fund(IMF). Initially this was a “staff-monitored pro-gram” that did not draw upon IMF resources.Then, in early 2001, the IMF board approvedaccess to IMF resources under the Poverty Re-duction and Growth Facility (PRGF), a programthat aims to reduce inflation, strengthen the
Table 1.8Education Sector Expenditures (1998/99 to 2004/05)
Actual Actual Actual Actual Actual Actual Actual
1998/99 1999/00 2000/01 2001/02 2002/03 2003/04 2004/05Actual Actual Actual Actual Actual Actual Actual
MOET Education – Recurrent 488 507 579 679 738 647 737
MOET Education – Capital 119 25 32 109 162 98 166
NMDS 65.2 77.2 80.5 120 177 217 270
Total Education Sector 672 609 692 908 1077 962 1173
GOL – Recurrent 1943 2319 2404 2312 2857 2533 3199
Of which: interest 129 183 258 203 220 216 156
Of which: non-interest Recurrent 1814 2136 2146 2109 2637 2690 3043
GOL – Capital, 496 480 554 626 802 635 756
GOL – Total, excluding interest 2310 2616 2700 2735 3439 2952 3799
Gross Domestic Product 4921 5565 5964 6565 7370 8144 8851.4
Gross National Income 6305 7057 7486 8071 9068 10017 10938
1998/99 1999/00 2000/01 2001/02 2002/03 2003/04 2004/05
MOET Recurrent /GOL Recur., excl. interest 26.9% 23.7% 27.0% 32.2% 28.0% 24.1% 24.2%
Education Total Recur./ GOL Recur., excl. interests 30.5% 27.4% 30.7% 37.9% 34.7% 32.1% 33.1%
MOET Capital /GOL Capital 24.0% 5.2% 5.8% 17.4% 20.2% 15.5% 21.9%
Education Total/GOL Total, excl.interest 29.1% 23.3% 25.6% 33.2% 31.3% 32.6% 30.9%
Ed. Total/GDP 13.7% 10.9% 11.6% 13.8% 14.6% 11.8% 13.2%
Ed. Total/GNP 10.7% 8.6% 9.2% 11.3% 11.9% 9.6% 10.7%

20 Primary and Secondary Education in Lesotho
balance of payments, and achieve an economicgrowth rate of at least 4 percent annually.
The government intends to limit its budgetdeficit to levels that can be financed by externalgrants and concessional loans. It plans to imple-ment a broad, long-term public sector reformprogram, which includes improving budgetingand expenditure control as well as civil servicereform.
Implications for Spendingon the Education Sector
When considering education sector budgets andexpenditures, it is important to note that inLesotho the education sector includes not onlythe entire Ministry of Education and Training,but also a small department called the NationalManpower Development Secretariat (NMDS)within the Ministry of Finance and DevelopmentPlanning. The NMDS administers bursaries andstudent loans for both secondary and tertiarystudents. Over the past few years, total budgetsfor NMDS have been more than 20% of thetotal budget of the Ministry of Education andTraining.
Over the past few years, the average recur-rent expenditure on the education sector (includ-ing both MOET and NMDS) constituted morethan 30% of total government expenditure ex-cluding interest. Aggregating both recurrent andcapital expenditures, education sector expendi-tures still amount to an average of more than25% of total government expenditures over thelast five years or so, equivalent to an amountbetween 11% and over 14% of total GDP.
However, given the above macroeconomicconditions which seem to predict an even lessoptimistic picture than that of the 1990s, it islikely that the government will exercise more fis-cal restraint in the years immediately ahead, withnon-interest recurrent expenditure projected todecrease. In this environment, increases in thereal resources devoted to the Ministry of Educa-tion and Training from the government budgetcan come only at the expense of other sectors.
On the other hand, the government has setan ambitious agenda of expanding enrollmentand improving quality in primary education,which will require considerable funds. In themacroeconomic environment of fiscal restraint,it will be necessary to examine the allocation ofresources within the education sector, to explorewhether efficiency can be improved in some ar-eas, or whether the financial burden on the gov-ernment can be reduced through cost-sharingreforms.
D. Economic Structureand000 Employment Patterns
There are three types of economic sectors inLesotho. The primary economic sector includescrops and livestock. The secondary economicsector includes manufacturing including textiles,construction, LHWP construction, electricityand water. And the tertiary economic sector in-cludes wholesale and retail trade, public admin-istration and education. In the year 2002/03, theprimary economic sector contributed 13.7 % ofGDP, while the secondary and tertiary economicsectors contributed 42.0 % and 34.4 %, respec-tively. As seen in Table 1.9, the share providedby agriculture declined significantly from 20.9%in the early 1980s to 13.7% in 2002/03. On theother hand, the growth of the secondary sectorhas been overwhelming: from only 22.6% ofGDP in the early 1980s, it rose to 42.0% in2002/03.
Employment Patterns
One of the most critical socio-economic situa-tions in Lesotho is the large disparity in incomeamong economic sectors. As seen in Table 1.9,the country’s economy is led by the secondaryand tertiary sectors, which each account forabout 41% of the GDP, with the remaining17.4% of the GDP being generated by the pri-mary sector—which accounts for 72.8 % of theBasothos who are employed. On the other hand,

Demographic and Macroeconomic Setting 21
as Table 1.10 shows, only 8.8% and 18.3% ofBasothos work in the secondary and tertiarysectors, respectively. In rural areas, 83% of thepopulation engages in the strictly low-yieldingprimary sector; the majority is subsistence farm-ers. On the other hand, 21% and 52% of theurban population engage in the secondary andtertiary sectors, respectively.
Unemployment
The most important aspect of employment pat-terns in Lesotho is the high unemployment rate,which is directly linked to poverty. It is estimatedthat 27.1% of the population is either unem-ployed or underemployed. Several factors con-tribute to high unemployment in Lesotho.
The first major factor is the lack of employ-ment opportunities. Of those who answered the2002 Core Welfare Indicators Questionnaire(CWIQ), 23.0% and 3.7%, respectively, said
they were unemployed or underemployed, withsome regional variations. The highest rate,33.0%, was reported in Quthing District (a ru-ral and mountainous area) and the lowest,16.5%, in Mefeteng District (rural but non-mountainous). Of those who reported beingunemployed, 95.7% reported that no work wasavailable.
Another factor contributing to high unem-ployment is the changing economic environmentin Lesotho. Because demand for miners is drop-ping significantly and construction throughLHWP is slowing down, many of those whoonce worked in the RSA gold mines and forLHWP are now unemployed. Even though thedemand for labor in the manufacturing sector isgrowing, these former miners and constructionworkers often lack the skills needed to work inmanufacturing.
A third reason for the high unemployment islow levels of investment from both local and
Table 1.9Sector-Specific GDP Contributions, 1980/81–2002/03
80/81–86/87 87/88–97/98 1998/99 1999/00 2000/01 2001/02 2002/03
Primary 20.9 16.8 15.9 15.6 15.2 14.4 13.7Secondary 22.6 31.4 35.6 38 39.9 40.5 42.0Tertiary 43.4 37.0 38.6 37 35.6 35 34.4Indirect taxes 13.1 14.8 9.9 9.4 9.3 10.1 9.9TOTAL 100.0 100.0 100.0 100.0 100.0 100.0 100.0
Source: Lesotho Growth Option Study (2003) World Bank.
Table 1.10Composition of Employment and GDP, 1999
GDP Contribution Composition of EmploymentSector Million US$ % share Total Urban Rural
Primary 143.8 17.4% 72.8% 27.1% 83.0%Secondary 339.3 41.1% 8.8% 20.8% 6.2%Tertiary 341.6 41.4% 18.3% 52.1% 10.8%Total 824.7 100.0% 100.0% 100.0% 100.0%
Source: Employment data from BOS (1999), and GDP data from Central Bank of Lesotho (2003).

22 Primary and Secondary Education in Lesotho
foreign investors in sub-sectors other than tex-tiles. For geographical reasons, Lesotho is gen-erally not a very attractive country for foreigndirect investment (FDI) although the LHWPgenerated some FDI from the RSA in the early1990s. After LHWP, nearly 90% of FDI goes tothe textile industry. The nation needs to developa more diversified economic profile by creatingother industries to attract FDI.
A compounding factor is the seeming lack ofrelevant skills among the Basotho labor force. Itis conceivable that if people have solid basic skillsin literacy, numeracy, and communication, if theyare willing to be retrained, if the training is af-fordable and relevant, and if they have a suffi-cient degree of entrepreneurship, then more andmore jobs will be created either by the Basothosthemselves or by increased foreign investment.Indeed, the government of Lesotho clearly rec-ognizes the importance of the education and train-ing sector. It identified education as a priority inits recent Poverty Reduction and Strategy Paper.The very high allocation of government expen-diture to education also attests to this.
This situation points to the purpose of thisreport: to determine how the Basotho nation,through its Ministry of Education and Trainingand other relevant agencies, can develop andimplement proper policies and other instrumentsto produce a better educated and better trainedBasotho labor force. Unfortunately, a lack ofrelevant data prevents this report from provid-ing a full analysis of the linkages between theeducation and training and labor market out-comes including both the local and regional la-bor markets. For now, this report will assumethat education and skills development is an in-tegral part of Lesotho’s overall strategy for eco-nomic growth and poverty reduction.
E. Chapter Summary
The government of Lesotho, through its Minis-try of Education and Training, attaches highvalue to education. Education is one of the na-
tional priorities identified in the recent PovertyReduction Strategy Paper. The government hassigned the MDGs which aim to achieve 100%primary education completion and gender eq-uity in primary and secondary education by2015. Further, the government has set ambitiousgoals to improve the quality of education at alllevels. Consistent with its rhetoric, public ex-penditure on education amounts to more than30% of total government expenditure (exclud-ing interest payments) and nearly 12% of itsGDP in 2003.
The high rates of HIV/AIDS have profoundlyaffected the demographic profile in Lesotho: thepopulation growth rate is declining because offalling fertility rates and life expectancy. HIV/AIDS has also made orphans of many school-age children. The government’s 2003 impactassessment estimated that nearly 30% of teach-ers were affected by HIV/AIDS and that figureis expected to increase. In this situation, the gov-ernment will need to put more effort into train-ing teachers in order to achieve national goalssuch as EFA and FPE. Educating orphans andother disadvantaged children also places a seri-ous burden on the already over-stretched edu-cation sector.
From the macroeconomic perspective, theLesotho Highland Water Project (LHWP) con-tributed significantly to government revenue,allowing the country to enjoy a relatively highrate of economic growth over the past 10 years.On the other hand, in the late 1990s, theeconomy was weakened by the reduced need forlabor in the South African mines. In this macro-economic context, the government has allocateda large share of public expenditure to educa-tion, quite appropriately for education and skillsdevelopment; however, the government is ex-pected to exercise fiscal restraint in the years tocome. In order to achieve the national and in-ternational goals (EFA, MDGs, and FPE), thechallenge for Lesotho is to seek cost-effectiveways to allocate public resources within the edu-cation sector and to explore areas where effi-ciency can be improved.

23
n this chapter we provide an overviewof the educational system in Lesotho.In particular, we trace the expansion ofenrollment at different levels of educa-tion, taking a historical perspective.
We examine the system’s coverage, compare itwith that of other countries, and discuss key in-dicators of student flow with a special focus onfour indicators: rates of entry to first grade,grade-specific enrollment rates, cohort survivalrates, and repetition rates in primary and sec-ondary education.
A. Education Structure
Lesotho’s education system is divided into threelevels: 1) seven-year primary education (Stan-dards 1 to 7); 2) five-year secondary educationconsisting of a three-year lower level (Forms Ato C) and two-year upper level (Forms D andE); and 3) tertiary education, which takes amaximum of four years to complete. Lesothohas yet to define legally the required durationof compulsory education. Compared with otherregions outside of Africa, Lesotho has more yearsof primary education (Table 2.1).
The official school age for primary educationis between 6 and 12 years. Completing primary
education is marked by passage of the PrimarySchool Leaving Examination (PSLE), whichmeasures students’ basic knowledge of science,social studies, English, mathematics and Sesotho,at the end of the seven-year primary cycle. Fol-lowing primary education, secondary educationconsists of two levels: the three-year junior sec-ondary education level which is completed byobtaining the Junior Certificate (JC), and thetwo-year senior secondary education level whichis completed upon attainment of the CambridgeOverseas School Certificate (COSC). The seniorsecondary course of study (Forms D and E) isequivalent to the British “O” level education.
Tertiary education (also called post-COSC)includes technical and vocational education(TVET), teacher training, and university educa-tion. In actual fact, the TVET in Lesotho offersa mixture of certificate and diploma programscatering to both post-JC and post-COSC stu-dents. Lesotho has only one true tertiary levelTVET institution, the Lerotholic Polytechnic,which offers both certificate and diplomacourses. The other TVET institutions offermostly certificate programs for post-JC studentsand even some for post-PSLE students.
The Lesotho College of Education (LCE) of-fers teacher training courses for primary and sec-ondary school teachers, with a Diploma in Edu-
Overview of the Education Sector:Historical and Comparative Perspectives
CHAPTER 2
I

24 Primary and Secondary Education in Lesotho
cation (Primary) (DEP) for non-certified teachers,a Diploma in Primary Education (DPE) for certi-fied teachers, a Diploma in Education (Second-ary) (DES), and a Diploma in Technology Educa-tion (DTE). In January 2002, the LCE began of-fering a Distance Teacher Education Program(DTEP) for primary teachers who wished to im-prove their teaching qualifications while continu-ing to work. The LCE does not yet offer any de-gree courses for teachers. The National Univer-sity of Lesotho (NUL) also offers a Bachelor ofEducation degree which caters to undergraduatesaspiring to be secondary school teachers.
Various undergraduate and post-graduatedegree programs are offered by universities.There is only one comprehensive public univer-sity in Lesotho, the National University ofLesotho, which offers programs leading to sub-degree programs (certificates and diplomas),undergraduate degrees in agriculture, education,humanities, law, social sciences and the naturalsciences, and postgraduate programs. Thereseems to be a tradition for Basotho COSC gradu-ates to enter tertiary institutions in the Republic
of South Africa. Over the last few years, on av-erage, more than 20% of the new tertiary stu-dent population has entered programs in RSAand other institutions overseas.
Last, but not least, is Lesotho’s system of pre-school education. The Early Childhood Care andDevelopment (ECCD) institutes offer pre-pri-mary schooling for children aged 3 to 5 years.All the center-based ECCD facilities are privatelyowned. The Ministry of Education and Train-ing (MOET) has started piloting a home-basedECCD approach that relies primarily on volun-teers for the care of children although trainingis provided by the MOET.
Lesotho’s entire education system is depictedin Figure 2.1.
B. Education Governance andManagement
Because Lesotho was a British protectorate un-til 1966, it inherited the British system of edu-cation. Its official languages are both Sesotho
Table 2.1Duration of Compulsory, Primary and Secondary Education
Duration of compulsory schooling Duration of primary Duration of secondary
Lesotho 7.* 7 5NeighborsSouth Africa 9. 7 5Botswana 10. 7 5Swaziland 7. 7 5Namibia 10. 7 5Mozambique 7. 7 5Other RegionsEast Asia & Pacific 6Europe & Central Asia 4Latin America & Caribbean 6Middle East & North Africa 6South Asia 5Sub-Saharan Africa 6
Source: EdStats, World Bank* Lesotho recently announced that primary education is compulsory.

Overview of the Education Sector: Historical and Comparative Perspectives 25
and English but English is currently used inschools as the compulsory language of instruc-tion beyond primary Standard 3. While the Con-stitution of Lesotho is the fundamental law thatlays out the legal foundation for providing edu-cation at all levels in Lesotho, the Education Actof 1995 and the Local Government Act consti-tute another important legal framework thatgoverns the management of education. Further,several laws have been enacted to guide policyand practice at different levels of education.Different legislation exists for primary and sec-ondary education, technical and vocational edu-cation, and higher education.
Legal Context
The Education Act No. 10 of 1995 (amendedin 1996) was enacted to regulate the provision
of primary and secondary education. Becauseeducation was established by missionaries inLesotho in 1883, the majority of primary schoolfacilities in the country are still church-owned,even though the government pays the majorityof teacher salaries and other recurrent fees. Animportant achievement of the 1995 EducationAct was identifying the three main entities re-sponsible for education in Lesotho: a) the gov-ernment; b) community; and c) churches. TheEducation Act also requires that communitiesand parents be represented in school manage-ment or advisory committees.
The Education Act is currently under reviewto ensure that it addresses issues stressed in anumber of other international programs—Edu-cation for All, the Convention on the Rights ofa Child, and the Millennium DevelopmentGoals—as well as several national priorities:Lesotho constitutional provision of free andcompulsory education, its Local GovernmentAct, the National Vision 2020 and the PovertyReduction Strategy Paper. The latter has the goalof reducing and eradicating poverty by provid-ing basic education for all. As a result of thisreview, the Education Act will also regulate andset quality standards, and will foster broadersocial participation in the management of edu-cation, at both the school and district level, bydevolving more powers to local managementstructures.
Lesotho recently passed a Local GovernmentAct which stipulates that the districts will func-tion as “coordinating and administrative” bod-ies responsible to the Ministry of Local Govern-ment. The government also developed a Strate-gic Plan for Decentralization which has yet tobe reviewed and implemented. The general im-pression, however, is that the districts have yetto be made fully aware of its tenets and implica-tions: they have not yet been given separate bud-get lines, nor have the line ministries reallystarted to decentralize their functions. Localgovernment elections were conducted on April30, 2005. Results have been announced andcouncils are being established.
Figure 2.1Education System in Lesotho
Source: MOET
Age0
1
2
3
4
5
6
7
8
9
10
11
12
13
14
15
16
17
18
19
20
21
22
23
1
2
3
1
2
3
4
5
6
7
A
B
C
D
E NUL LCE
TVET
TVET
TVET
1
2
3
1
2
3
4
1
2
3
1
2
3
1
2
3
4
Primary
Secondary
FPE
ECCD
PSLEJC
COSC

26 Primary and Secondary Education in Lesotho
Several other laws have an impact on the man-agement of education services. In 2002, the Min-ister of Education established the Teaching Ser-vice Regulations which guide teacher manage-ment and support, under the provisions of theEducation Act and the Teachers’ Pensions Act.
The Lesotho Technical and Vocational Train-ing Act of 1984 governs programs for the de-velopment of technical and industrial skills.Under this act, Technical and Vocational Edu-cation and Training (TVET) are the responsibil-ity of the Minister of Education and Training,acting on the advice of the Technical and Voca-tional Training Advisory Board on all mattersrelating to TVET. The law is also under reviewto provide for greater participation of the pri-vate sector in skills development, sustainable fi-nancing of skills development, and a more au-tonomous management structure.
The Higher Education Act, enacted in 2004,addresses the provision of higher education inLesotho. The act seeks to a) regulate higher edu-cation through the establishment and registra-tion of both public and private institutions; b)establish a council on higher education, whosemain functions are accreditation and qualityassurance of higher education institutions; andc) provide guidelines on the governance andfunding of public institutions. The Higher Edu-cation Council, established by this act, is pri-marily advisory and still in a nascent form; itseffectiveness has not been established.
A bill for the governance and functions of theExamination Council of Lesotho (ECOL) hasbeen developed and is currently under review.In 2002, ECOL became a semi-autonomousagency from the MOET. The primary functionsof the ECOL are, according to the draft ECOLbill:
To arrange and control assessment for pri-mary and secondary schools and suchother bodies as the Minister may direct;and award certificates to persons who sat-isfy the Council that they have attainedan appropriate standard in assessment or
other tests of knowledge or ability or haveperformed other prescribed exercises in amanner regarded as satisfactory. It is ex-pected that the Act, once passed, will pro-vide a legal basis for the continuation ofthe Examinations Council of Lesotho,providing for its administration and con-trol and related matters.
Organization of Education Management
The Ministry of Education and Training(MOET) is responsible for the management,provision and regulation of education in Lesothoand is headed by a minister (assisted by an as-sistant minister). The principal secretary, whois the ministry’s administrative head and chiefaccounting officer, is assisted at the executivelevel by a staff of officers and directors. Theyinclude a deputy principal secretary; five chiefeducation officers responsible for primary edu-cation, secondary education, teaching service,curriculum services, and tertiary education; adirector of education planning, a director oftechnical and vocational education, and the sec-retary general of the National Commission forUNESCO. These senior managers head depart-ments composed of programs which form op-erational units of sector at the headquarters level.
Almost all the decisions concerning educationin Lesotho are made at the central office, de-spite the government’s efforts to implement itsdecentralization policy. This is particularly truewith regard to financial matters.
At the district level, education managementis housed within District Resource Centers(DRCs) which are headed by senior educationofficers. The DRCs are a separate structure fromthe District Office that houses the district secre-tary. Several educational departments have beendecentralized and relocated in the districts. Theseinclude the Teacher Services Department, theLesotho College of Education, the NationalCurriculum Development Center, and officesoverseeing early childhood education and non-

Overview of the Education Sector: Historical and Comparative Perspectives 27
formal education. The district education offic-ers have no real decision-making power espe-cially on matters related to finances and person-nel; approval must be sought from the centraloffice on every recurrent expenditure.
Primary Schools
All primary schools are headed by principals andsometimes assisted by deputies. According to the1995 Education Act, a School ManagementCommittee approved by the Minister of Educa-tion manages the school affairs. Each manage-ment committee consists of the following mem-
bers elected from various School Advisory Com-mittees: a) two members elected by representa-tives of the proprietor; b) three members electedby representatives of parents; c) one teacherelected by representatives of teachers; d) the prin-cipal elected by the principals of the schools;and e) one representative of chiefs under whosejurisdiction the eight schools which belong toone proprietor fall. This management commit-tee supervises the schools for which it has beenconstituted.
The majority of primary and secondaryschools in Lesotho are owned by churches ofvarious denominations. For church schools, each
Table 2.2MOET Organizational Chart
Source: Lesotho MOET.
MinisterMinistry of Education & Training
Assistant Minister
Principal Secretary
Examinations Council of Lesotho
TVT Advisory Board
UNESCO Commission
National Curriculum Committee
Teaching Service Commission
Deputy Principal Secretary
Administration
Finance
Human Resources
Council on Higher Education
CEO Primary
A
PIEP
SSRFU
FPE
FieldInsp.
CEO Secondary
Central Inspectorate
Special Education
GovernmentSchools
Secondary SchoolsAdvisoryServices
CEO TeachingService
TSD
TSC
CEO Tertiary
LP
LCE
TTI
NUL
IDM
CEO Curriculum
NCDC
LDTC
SSU
NFE
ECOL
DirectorPlanning
EMIS
PSCU
PlanningSection
IT
DirectorTVT
TVETProviders
TVD

28 Primary and Secondary Education in Lesotho
management committee can be responsible fora maximum of eight schools belonging to thesame proprietor. In an effort to encourage par-ents and community members to become in-volved in the management of church schools,the Education Act of 1995 also introducedSchool Advisory Committees in church schools.The role of these committees is to advise themanagement committee on all matters relatedto education in the relevant school. This com-mittee consists of the following members ap-pointed by the proprietor: a) two representativesof the proprietor; b) one representative of theteachers; c) four members of the communityserved by the school who are elected by parentsof that school’s pupils; d) a chief of the areawhere the school is situated; and e) the princi-pal of the relevant school. The appointment ofmembers of the Advisory School Committee issubject to the approval of the minister.
However, lessons learned from the implemen-tation of School Management Committees andSchool Advisory Committees indicate that thesetwo committees overlap substantially in mem-bership as well as in the role they play, thus cre-ating confusion and potential lack of account-ability at the school level. Recent review of theEducation Act has already recommended theconsolidation of the two committees into one.The recommendation has to be endorsed andthe Act should be revised before implementa-tion can begin.
Secondary Schools
Secondary schools are headed by principals,most of who are usually assisted by deputies.The 1995 Education Act stipulates that a schoolboard appointed by the proprietor (in the caseof church schools) and approved by the Minis-ter of Education manages every post-primaryschool. The member’s appointment to the boardis subject to the minister’s approval. The boardshould consist of: a) two representatives of theproprietor; b) three members of the communityserved by the school, who are elected by par-
ents of children in that school; c) one represen-tative of the teachers; d) a chief of the area wherethe school is situated; and e) the principal of therelevant school who serves as secretary of theboard. The board is responsible for managingthe school, and for running it properly and effi-ciently.
National Curriculum Committee
The National Curriculum Committee reviewsthe curriculum for primary and secondaryschools and advises the minister through theprincipal secretary. The primary members of thiscommittee are: a) the chief education officersfor secondary education and curriculum man-agement); b) the chief inspectors at headquar-ters and in the field services; c) the dean of theFaculty of Education of the National Universityof Lesotho; d) the directors of the National Cur-riculum Department Center, the Institute of Edu-cation, the Lesotho College of Education andthe Department of Technical and VocationalTraining; and e) the registrar of the NationalExaminations Council. Other members may beappointed or elected.
The current primary and secondary curricu-lum used in Lesotho schools are from the 1997NCDC publication. Details of the curriculumand syllabus are attached in Annex 2.1.
Lesotho Teaching Service
The 1995 Education Act states that no personcan be employed as a teacher or can teach inany school without being registered with theTeaching Services Department (TSD); similarly,no proprietor can allow a person to teach un-less they have registered with the TSD. Thepower to appoint a teacher and to promote,demote, transfer, discipline or remove teachersfrom their positions is vested in the TeachingService Commission (TSC); however, this doesnot apply to a teacher whose salary is not paidby the government.
The current MOET management structure,

Overview of the Education Sector: Historical and Comparative Perspectives 29
and in particular the central office, is under re-view, with the goal of bringing it more in line withthe Public Sector Improvement and Reform Pro-gram, whose main thrust is promoting profession-alism in public service. It remains a priority todecentralize management and services in educa-tion and training to improve service delivery.
C. Private and Public Partnership:The Role of Church/CommunityBased Schools
Primary and secondary schools in Lesotho fallinto four main categories: church-owned, gov-ernment, community, and private. Amongchurch-owned schools are those affiliated withthe Roman Catholic Mission (RCM), theLesotho Evangelical Church (LEC) ACL andAME. The distinction between government andcommunity schools lies in whether or not thegovernment provided infrastructure, to helpbuild the school. However, there is some vague-
ness in the definition of community school, sincecommunity can mean an entire community lo-cated in a certain geographic area or an elitegroup of community members. This vaguenesshas created situations where the very eliteMaseru English Medium School, for example,is considered a community school. The few “pri-vate schools” are either international or wereestablished by private entities.
Lesotho’s macro economy discussed in Chap-ter 1 has had important implications for its edu-cation system. Shortly after their arrival in 1833,missionaries established schools in Lesotho; thevarious churches have continued to dominateschool ownership since then. A school census in2004 indicated that, out of a total of 1476 pri-mary schools (both registered and unregistered),only 126 schools were government schools. Simi-larly, of over 264 secondary schools in the coun-try, only 31 were entirely under governmentmanagement. Figure 2.2 illustrates the owner-ship pattern for both primary and secondaryschools as of 2004.
Figure 2.2Primary and Secondary Schools by Ownership (2004)
Source: MOET
0ACL AME Community Government Govt and
CommunityLEC Others Private RCM
100
200
300
400
500
600Primary School
Secondary School

30 Primary and Secondary Education in Lesotho
It is noteworthy that despite these ownershippatterns, the government pays for teachers inall church-owned, community, and governmentschools, following agreements on staffing. Alleducation personnel are under government pur-view through MOET: they are recruited throughthe Teaching Service and are obliged to followthe government’s rules and regulations. Besidespaying teachers’ salaries, under the FPE, thegovernment subsidizes school fees, and providessome teaching and learning materials.
However, the government does not pay forteachers or provide any other forms of assistancefor private schools. Further, any school inLesotho that can find the resources is free toemploy additional teachers.
Thus, both the government and the churcheshave generally assumed that all schools are pub-lic schools, an understanding that remains in ef-fect as long as cordial relationships continuebetween the government and the church. How-ever, friction has arisen in a few instances when
the government wanted to make improvementsor changes that did not favor the church. There-fore, especially since independence in 1966, thegovernment has gradually been establishing itsown schools.
A public-private partnership, similar to thatbetween the government and church organiza-tions, exists in the Technical and VocationalEducation and Training (TVET) sector. Pre-vo-cational training is offered in secondary highschools, while vocational training is availableat the post-junior and senior secondary schoollevels in Technical Training Institutes (TTIs). Ofthe eight TTIs, six are church or privately-ownedand two publicly-owned. These schools providevocational training in traditional skill areas (e.g.commercial, electrical, woodwork, bricklaying,etc.); no formal records of the employment suc-cess of their graduates are kept. The salaries ofinstructors in public and private TTIs are paidby the MOET with limited in-kind support inthe form of equipment and supplies from do-
Table 2.3Evolution of Enrollment by Level of Education in Lesotho
General Secondary Higher EducationECCD Primary Lower Upper TVET LCE NUL RSA & Others
1990 — 351,652 37,600 8,701 1,560 572 1,3601991 — 361,144 37,653 8,919 1,600 540 1,4211992 — 362,657 42,024 9,871 1,590 615 1,6121993 — 354,275 45,217 10,095 1,575 644 1,7981994 — 366,569 50,664 10,951 1,697 651 1,8661995 33,059 378,011 53,086 13,368 1,623 704 2,0011996 — 374,628 53,104 14,350 1,571 807 2,0541997 35,124 368,895 49,518 15,957 1,589 866 2,1471998 36,079 369,515 49,390 15,872 1,509 948 2,2421999 — 364,951 55,996 16,441 1,722 925 2,5272000 30,540 410,745 55,241 17,751 1,859 970 2,8442001 34,507 415,007 58,036 19,883 1,939 999 3,2662002 41,469 418,668 60,841 20,289 1,859 1,751 4,1952003 — 429,720 62,489 20,615 1,837 1,739 — 2000*2004 — 428,727 68,696 22,214 1745 2326 7153
* rough estimate from NMDS

Overview of the Education Sector: Historical and Comparative Perspectives 31
nors like GTZ. Fees charged to students and theirparents cover other costs. This public-privatepartnership has allowed an expanded access toskills development beyond what the public sec-tor could provide alone.
Turning to higher education, Lesotho’ssector is small. The only public university,the National University, enrolls more than60% of tertiary students. About 20% ofthe total tertiary enrollment is in theLesotho College of Education and the re-maining 20% or so attend private institu-tions in Lesotho, South Africa, and otherinstitutions overseas.
D. Overview of Enrollment Trends
Table 2.3 presents the overall school enrollmentpattern in Lesotho. As of 2003, the educationsystem enrolled more than 41,000 children inECCD centers, almost 429,000 primary stu-dents, 82,000 secondary students, 1,800 studentsin TVET institutions, and a total of almost 6,000
students at the Lesotho College of Education andthe National University of Lesotho. Another2,000 or so tertiary students were enrolled ininstitutions in the Republic of South Africa andother countries. In total, about 0.6 million wereenrolled in various educational institutions, outof a total population of 1.8 million.
Enrollment at all levels of education has in-creased steadily over the last decade althoughthe rate of increase varies by level of education.Comparing 2004 with 1990, primary enrollmentincreased by 21%, lower secondary enrollmentby 83%, and upper secondary enrollment by155%. Higher education (at both LCE andNUL) more than doubled. The slowest growthwas seen in the technical and vocational educa-tion sector which increased by only 17%. In fact,the TVET sector has been experiencing somedecline over the last few years.
Primary enrollment was expanding until1995, when it started to decline. Many believethat the decline was due to poverty and increasedschool fees. This trend reversed in 2000 whenthe government introduced Free Primary Edu-cation (Box 2.1).
Box 2.1
Free Primary Education in Lesotho
Education in Lesotho only became free in 2000 when the government started to implement theFree Primary Education Policy which abolished school fees for one grade a year starting in2000 until 2006 when all the primary grades would be free.
The notion of introducing universal primary education dates back to the National EducationDialogue of 1978. While the affordability of such a venture was the main hindrance, Lesotho,as a member of the United Nations, subscribes to the objectives of Education for All as es-poused at the Jomtien Conference in 1990. Lesotho went further to ratify the UN Conventionon the Rights of the Child in 1990, thereby pledging to make primary education compulsoryand free to all. Section 28-b of the Constitution of Lesotho (1993) affirms the intention toadopt free primary education, stating that “primary education is compulsory and available toall.” In 1999, the Education for All Assessment study revealed drastic declines in the net enroll-ment as a result of deepening poverty; this compelled the prime minister to announce on April24th, 1999 that the government intended to introduce Free Primary Education beginning inJanuary 2000.
(continued on next page)

32 Primary and Secondary Education in Lesotho
As a central provision of the FPE, fees forprimary Standard 1 were abolished in 2000. TheFPE was then expanded to Standards 1 and 2 in2001, and to Standards 1, 2 and 3 in 2002; by2004, students in Standards 1 through 5 wereenjoying its benefits. When we compare enroll-ment in primary education before and after theimplementation of FPE, we find that the num-ber has increased significantly. As seen in Table2.3, the enrollment in primary education was365,000 in 1999 but it increased to 429,000 in2003, an increase of nearly 20% over 4 years.
Because its implementation is occurring inphases, the impact of the FPE seems to be pro-ducing an interesting pattern. Figure 2.3 belowillustrates the fluctuation of enrollment in the
primary grades since 1998. Clear spikes in en-rollment are associated with the cohort whichentered P1 in 2000. There were 120,000 newentrants into Grade 1 that year, creating a hugespike in the enrollment pattern. However, theenrollment for Standard 2 and to some extentStandard 3 in 2000 actually declined in abso-lute terms. Anecdotal evidence suggests thatsome parents whose children were about to en-ter Standard 2 held them back in Standard 1 sothat they could continue to enjoy the benefits ofFPE. In 2001, the spike occurred in Standard 2,in 2002 in Standard 3 and so forth, until 2004when Standard 5 enrollment began to spike.Evidently, the huge cohort of students who en-tered Standard 1 in 2000 is slowly passing
Box 2.1 (continued)
Preparations for its implementation began soon after the announcement. Government offi-cials visited Malawi and Uganda, which have recently introduced similar programs. In thesecountries, the programs cover tuition and fees, textbooks, examination fees, and school meals,and extended to all primary grades from the beginning. This resulted in a huge influx of pupilswhich proved difficult to handle. Therefore Lesotho’s implementation of the FPE started outwith only one grade, with plans to increase the coverage by one grade per year.
In addition to abolishing fees, under the FPE program the Lesotho government also helpsschools pay for textbooks, paper supplies, meals, and maintenance. One provision in the MOETcircular declaring free primary education was that the government would not pay any moneydirectly to schools. Therefore textbooks and other supplies are procured centrally and distrib-uted to schools. Food is provided either through existing program like the World Food Pro-gram or through a catering system: schools contract with local caterers who are paid directlyby the ministry at about M2 per student per day. School maintenance is also managed and paidcentrally at a nominal allocation of M5 per student directly to contractors.
Unfortunately, to date, the school maintenance component of the FPE has not been managedsuccessfully, due to a combination of factors. These include budget constraints, the burden ofsigning vouchers, and individual schools’ inability to account for funds received. Moreover, themaintenance expenditure categories are so rigidly set that individual school needs can not bemet. In the 2005 budget, MOET introduced a primary school development grant for all gov-ernment and community schools which will provide approximately M11,500 with broad guide-lines on school development. There is also a proposal for the MOET to allocate some budget-ary resources for school maintenance directly to schools as well, though it has not yet beenapproved or implemented. Even the simple step of disbursing the school development budget togovernment and community schools will require a considerable amount of training for schoolcommittee members so they can develop proper accounting procedures.
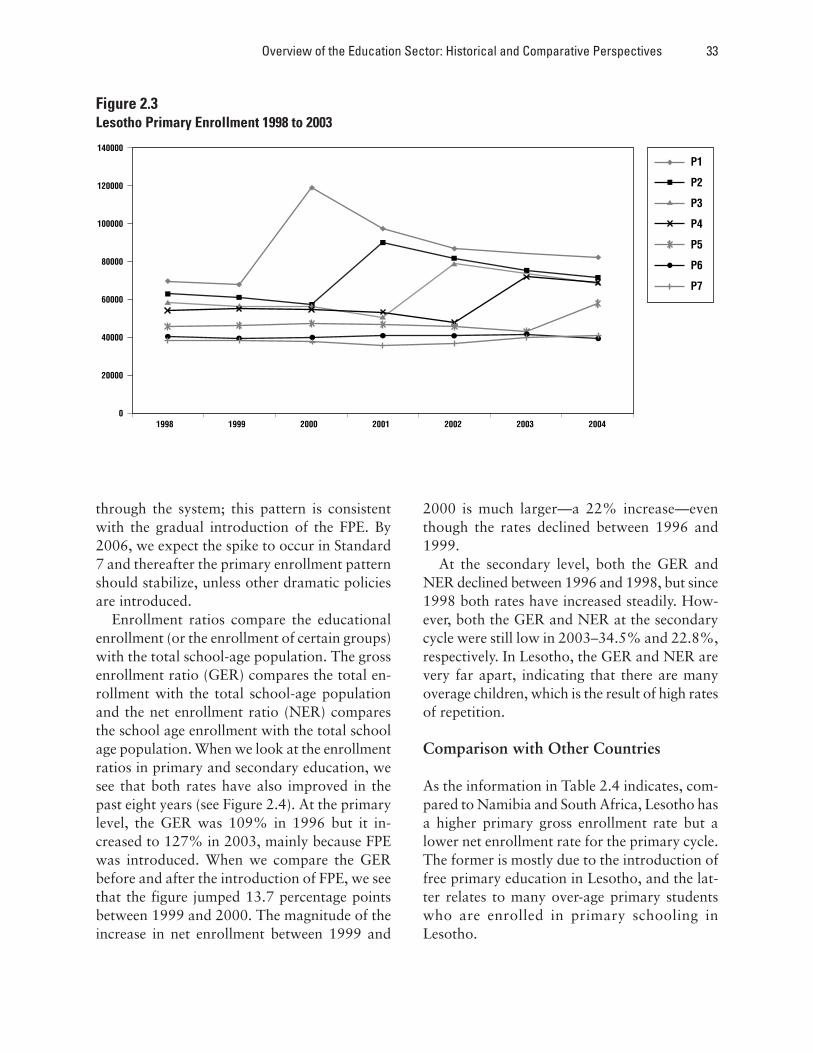
Overview of the Education Sector: Historical and Comparative Perspectives 33
through the system; this pattern is consistentwith the gradual introduction of the FPE. By2006, we expect the spike to occur in Standard7 and thereafter the primary enrollment patternshould stabilize, unless other dramatic policiesare introduced.
Enrollment ratios compare the educationalenrollment (or the enrollment of certain groups)with the total school-age population. The grossenrollment ratio (GER) compares the total en-rollment with the total school-age populationand the net enrollment ratio (NER) comparesthe school age enrollment with the total schoolage population. When we look at the enrollmentratios in primary and secondary education, wesee that both rates have also improved in thepast eight years (see Figure 2.4). At the primarylevel, the GER was 109% in 1996 but it in-creased to 127% in 2003, mainly because FPEwas introduced. When we compare the GERbefore and after the introduction of FPE, we seethat the figure jumped 13.7 percentage pointsbetween 1999 and 2000. The magnitude of theincrease in net enrollment between 1999 and
2000 is much larger—a 22% increase—eventhough the rates declined between 1996 and1999.
At the secondary level, both the GER andNER declined between 1996 and 1998, but since1998 both rates have increased steadily. How-ever, both the GER and NER at the secondarycycle were still low in 2003–34.5% and 22.8%,respectively. In Lesotho, the GER and NER arevery far apart, indicating that there are manyoverage children, which is the result of high ratesof repetition.
Comparison with Other Countries
As the information in Table 2.4 indicates, com-pared to Namibia and South Africa, Lesotho hasa higher primary gross enrollment rate but alower net enrollment rate for the primary cycle.The former is mostly due to the introduction offree primary education in Lesotho, and the lat-ter relates to many over-age primary studentswho are enrolled in primary schooling inLesotho.
Figure 2.3Lesotho Primary Enrollment 1998 to 2003
0
20000
40000
60000
80000
100000
120000
140000
1998 1999 2000 2001 2002 2003 2004
P1
P2
P3
P4
P5
P6
P7

34 Primary and Secondary Education in Lesotho
Figure 2.4Gross and Net Enrollment Rates in Primary and Secondary Education
Source: Education Statistics and Projected Population by the WB
Table 2.4GER and NER in Lesotho Compared with Other Selected Countries and Regions
Primary SecondaryGER NER GER NER
Selected Countries 2003Botswana 108.3 84.3 93.1 69.6Lesotho 127.4 85.0 34.5 22.8Namibia 114.9 89.1 67.3 48.3S. Africa 111.4 88.9 87.3 57.2Swaziland 118.0 — 52.2 —
Groups (excluding high income countries) 2001
East Asia & Pacific 111.4 92.2 66.4Europe & Central Asia 103.2 88.7Latin Amer. & Carib. 128.7 94.4 89.4 65.1Middle East & North Africa 96.3 83.3 70.3 54.4South Asia 94.8 81.8 48Sub-Saharan Africa 86.8
Source: World Bank (2004)
0
Perc
enta
ge
Primary GER
Primary NER
Secondary GER
Secondary NER
20
40
60
80
100
120
140
1996 1997 1998 1999 2000 2001 2002 2003

Overview of the Education Sector: Historical and Comparative Perspectives 35
Student Flow Profiles in Primary andSecondary Schools
In this section, we examine student flow pro-files in primary and secondary school by ana-lyzing the grade-specific enrollment rates, co-hort survival rates, and repetition rates. Sourcesof data include the schools census, the MultipleIndicator Cluster Survey (MICS) 2000, and theCore Welfare Indicator Questionnaire (CWIQ2002).
Grade-Specific Enrollment Rates
The grade-specific enrollment rate (GSER) mea-sures the proportion of children in each agegroup who are enrolled in a specific grade. It isestimated by dividing the number of non-repeat-ers enrolled in a specific grade by the popula-tion in the age group for that grade. For instance,the GSER in Grade 3 is estimated by dividingthe number of non-repeaters in Grade 3 by thetotal population of 8-year-olds. The GSER for
Grade 1 is also called the intake or entry rate.The primary entry rate in Lesotho has in-
creased significantly since FPE was introducedin 2000. As indicated in Table 2.5, the entry ratein 1999, the year before FPE was started, was105% percent; that rate doubled in size in 2000(200%). Since then, the entry rate has stabilizedsomewhat at 142% in 2001, 124% in 2002, and121% in 2003. These figures are persuasive in-dicators that the government’s FPE policy is suc-cessful in attracting out-of-school children (re-gardless of age) to its schools.
Further, the FPE appears to have a positiveimpact on the age of entry. Based on data fromthe MICS 2000 and CWIQ 2002, only 13% ofthe new entrants in 2000 were 6 years old (theofficial primary school entry age) as comparedwith more than 42% in 2002. There was alsoa reduction in the proportion of new entrantswho were over 10 years of age, from 30% in2000 to only 8.8% in 2002. Figure 2.5 illus-trates this shift in entry age between 2000 and2002.
Figure 2.5Primary Entry Age in 2000 and 2002
(continued on next page)Source: 2002 CWIQ
Distribution of new entrants in grade 1 by age, Lesotho 2000
Age
5
10
15
20
25
30
6 7 8 9 10 11 12 13 14+
Boys
Girls
Both gender
0
%

36 Primary and Secondary Education in Lesotho
The grade-specific enrollment rate (GSER) hasalso increased year by year in the other earlyprimary grades (2, 3 and 4), as Table 2.5 shows.For instance, the GSER for Grade 4 was 77%in 2002 and increased to 125% percent in 2003.On the other hand, the improvement at the up-per primary grades (5, 6, and 7) has been mini-mal. Since FPE will gradually extend its cover-age to all levels of the primary cycle, we canexpect to see improvements in the grade-specificenrollment over the next few years.
The GSER at Grade 7 increased slightly from64% in 1999 to 69% in 2003. These rates com-pare favorably with the recent average of 58%for low-income countries around 2000, espe-cially considering that Lesotho’s primary cyclecontains 7 years, compared with 5 or 6 years inother countries.
At the secondary level, the GSER has im-proved steadily over the past five years. AsTable 2.5 shows, the GSER in Grade A (firstyear of secondary education) was 42% in 1999and increased to 49% in 2003. The survivalrate for the first level of secondary education
(Grades A and B) was up to 35% in 2003, from33% in 1999. The completion rate for the sec-ond secondary level (Grades C-E) also im-proved slightly, from 14% in 1999 to 17% in2003.
Cohort Survival Rates
While the grade-specific enrollment rates mea-sure the proportion of children in each age groupwho attend school, cohort survival rates referto the schooling career of a particular cohortthat had already entered the education system.More specifically, this ratio indicates theshare of entrants to a given cycle of educationwho eventually reach a subsequent grade. In the7–3–2 structure of Lesotho’s primary and sec-ondary education system, the relevant survivalrates are between Grades 1 and 7, betweenForms A and C, and between Forms D and E.In order to make comparisons with other coun-tries, we also calculated the survival rate betweenGrades 1 and 5. For the purpose of this report,we used two methods of estimation for survival
Figure 2.5 (continued)
Source: 2002 CWIQ
Age6 7 8 9 10 11 12 13 14+
Boys
Girls
Both gender
0
%
5
10
15
20
25
30
35
40
45
50Distribution of new entrants in grade 1 by age, Lesotho 2002
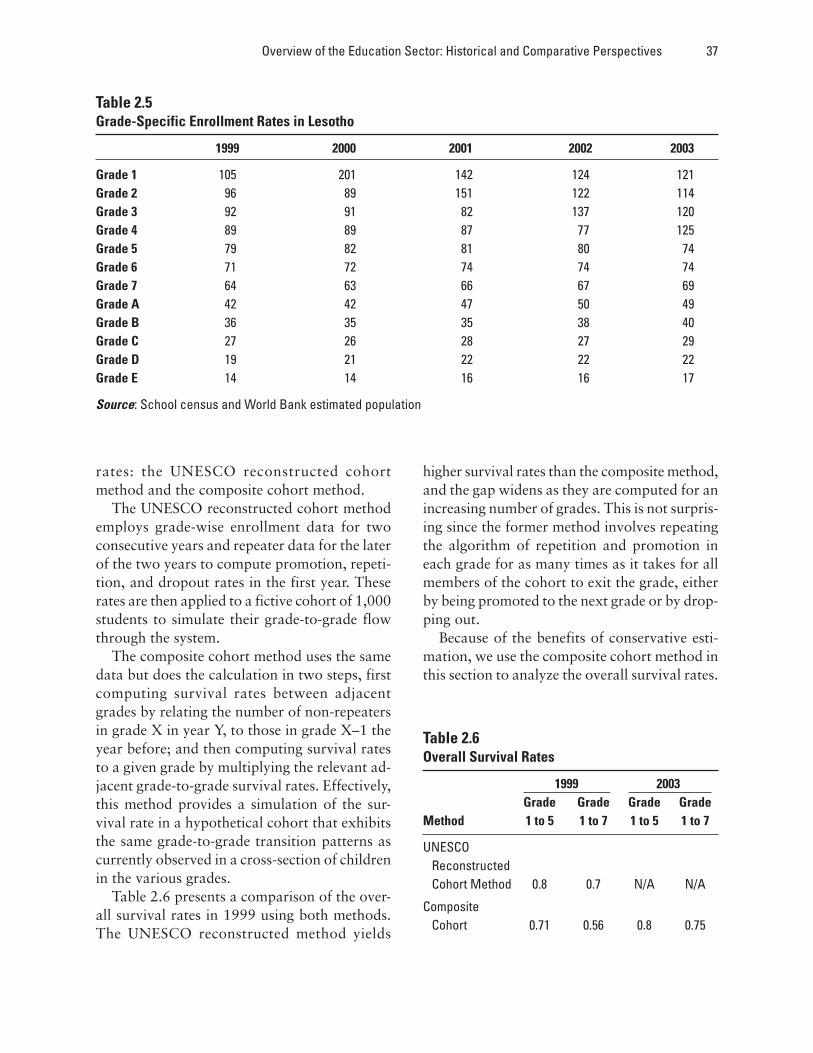
Overview of the Education Sector: Historical and Comparative Perspectives 37
rates: the UNESCO reconstructed cohortmethod and the composite cohort method.
The UNESCO reconstructed cohort methodemploys grade-wise enrollment data for twoconsecutive years and repeater data for the laterof the two years to compute promotion, repeti-tion, and dropout rates in the first year. Theserates are then applied to a fictive cohort of 1,000students to simulate their grade-to-grade flowthrough the system.
The composite cohort method uses the samedata but does the calculation in two steps, firstcomputing survival rates between adjacentgrades by relating the number of non-repeatersin grade X in year Y, to those in grade X–1 theyear before; and then computing survival ratesto a given grade by multiplying the relevant ad-jacent grade-to-grade survival rates. Effectively,this method provides a simulation of the sur-vival rate in a hypothetical cohort that exhibitsthe same grade-to-grade transition patterns ascurrently observed in a cross-section of childrenin the various grades.
Table 2.6 presents a comparison of the over-all survival rates in 1999 using both methods.The UNESCO reconstructed method yields
higher survival rates than the composite method,and the gap widens as they are computed for anincreasing number of grades. This is not surpris-ing since the former method involves repeatingthe algorithm of repetition and promotion ineach grade for as many times as it takes for allmembers of the cohort to exit the grade, eitherby being promoted to the next grade or by drop-ping out.
Because of the benefits of conservative esti-mation, we use the composite cohort method inthis section to analyze the overall survival rates.
Table 2.5Grade-Specific Enrollment Rates in Lesotho
1999 2000 2001 2002 2003
Grade 1 105 201 142 124 121Grade 2 96 89 151 122 114Grade 3 92 91 82 137 120Grade 4 89 89 87 77 125Grade 5 79 82 81 80 74Grade 6 71 72 74 74 74Grade 7 64 63 66 67 69Grade A 42 42 47 50 49Grade B 36 35 35 38 40Grade C 27 26 28 27 29Grade D 19 21 22 22 22Grade E 14 14 16 16 17
Source: School census and World Bank estimated population
Table 2.6Overall Survival Rates
1999 2003Grade Grade Grade Grade
Method 1 to 5 1 to 7 1 to 5 1 to 7
UNESCO Reconstructed Cohort Method 0.8 0.7 N/A N/A
Composite Cohort 0.71 0.56 0.8 0.75

38 Primary and Secondary Education in Lesotho
In Chapter 4 we will examine the equity issue,and will use the results from the UNESCO re-constructed cohort method, which allows us toestimate survival rates by gender, poverty andorphan status.
Panel 1 in Figure 2.6 shows the primary sur-vival rates to Standard 5 and to Standard 7,
using the composite cohort method. Panel 2shows the secondary survival rates. It is ex-pected that, as the students move from gradeto grade, the survival rates will decline. There-fore, the survival rate to Standard 7 is alwayssmaller than that to Standard 5. Comparingthe rates in 1999 with those of 2003, we real-
Figure 2.6Survival Rates in Primary and Secondary Education
0.40
0.50
0.60
0.70
0.80
0.90
1.00
1994 1995 1996 1997 1998 1999 2000 2001 2002 2003 2004
Primary to Standard 5
Primary to Standard 7
0.40
0.50
0.60
0.70
0.80
0.90
1.00
1994 1995 1996 1997 1998 1999 2000 2001 2002 2003 2004
Lower sec. from A to C
Upper Sec. from D to E

Overview of the Education Sector: Historical and Comparative Perspectives 39
ize that survival rates have improved (despitea dip in 2001), though the increases are rathermodest. This is indeed very reassuring. FPEseems to have a small but positive impact onthe cohort survival rates. In 2004, a few yearsinto the implementation of the FPE, 80% ofthe children who entered Standard 1 surviveduntil at least Standard 5; 75% survived untilStandard 7.
In secondary education, survival rates havebeen rather flat over the past 10 years. And thesurvival rate from Form A to Form C has al-ways been below the survival rate from Form Dto Form E, though the two rates were very closeto each other in 2004: 75% of the students whoentered Form A survived until Form C and 80%of those who entered Form D survived untilForm E, as compared with 71% and 56% in1999 respectively.
It is worthwhile to note, however, that if wedisregard the selection points at Grade 7 andForm C and consider Grades 1 to 12 as a con-tinuous system, we find that by the end of FormE, due to repetition and dropouts, only 29% of
the original cohort who had entered primaryGrade 1 had survived to 2004 (see Table 2.7).
Figure 2.7 provides a cross-national compara-tive perspective. Lesotho’s cohort survival rate
Table 2.7Cohort Survival Rates (1999 and 2004)
1999 2004Primary
Standard 1 1.00 1.00Standard 2 0.89 0.94Standard 3 0.83 0.95Standard 4 0.79 0.94Standard 5 0.71 0.80Standard 6 0.64 0.78Standard 7 0.56 0.75
Secondary
Form A 0.37 0.57Form B 0.31 0.51Form C 0.24 0.43Form D 0.18 0.36Form E 0.14 0.29
Figure 2.7Cohort Survival Rate to Grade 5 in Selected Countries (2001)
Source: EdStats, World Bank
0.3 0.4 0.5 0.6 0.7 0.8 0.9 1
Mozambique
Uganda
Low-income Average
Lesotho
Swaziland
Zambia
South Africa
Botswana
Namibia

40 Primary and Secondary Education in Lesotho
to Grade 6 (71%) is higher than the average of67% for low-income countries worldwide.However, when compared with the neighbor-ing countries of South Africa, Namibia,Swaziland and Botswana, Lesotho’s cohort sur-vival rate to Grade 5 is clearly the lowest.
Intercycle Transition Rates
Intercycle transition rates are survival rates thatmeasure students’ movement from the finalgrade of one cycle or level of education to thefirst grade of the next cycle or level. Because oftesting requirements, movement to the nextlevel of education is not automatic. Therefore,these rates exhibit different patterns from othergrade-to-grade survival rates and are usuallyanalyzed separately. Here we investigate theintercycle transition rates from Standard 7 tothe lower secondary Form A, and from FormC to Form D.
Figure 2.8 below illustrates these two transi-tion rates from 1994 until 2004. Despite the fluc-tuations, both rates show an increasing trend
since 1996. The transition rate from Standard 7to Form A ranges from 60% to about 75%. Thetransition rate from Form C to Form D is higheron average, ranging from 72% to about 83%.
Comparing the Lesotho inter-cycle transitionrates in 1999 and 2003 with those of other coun-tries (figures from 2001; see Table 2.8), we seethat the Lesotho rates compare favorably withthose of some Sub-Saharan African (SSA) coun-tries such as Mozambique, Uganda, and Zam-bia. However, Lesotho’s transition rate fromprimary to lower secondary is low when com-pared with some its neighbors, including SouthAfrica, Swaziland, Namibia, and Botswana,where that rate has exceeded 80%.
Repetition
The pattern of repetition is also an importantmeasure of student flow in Lesotho. When a stu-dent repeats a grade, it increases the probabilityof their dropping out, by signaling to the par-ents that their child is not progressing academi-cally. It also reduces the efficiency of student flow
Figure 2.8Intercycle Transition Rates from 1994 to 2004
1994 1995 1996 1997 1998 1999 2000 2001 2002 2003 20040.5
0.55
0.6
0.65
0.7
0.75
0.8
0.85
0.9
Gr 7 to A
Form C to Form D

Overview of the Education Sector: Historical and Comparative Perspectives 41
in that a repeater costs at least twice as muchper grade attained as a non-repeater, while yield-
ing only modest gains, if any, in terms of stu-dent learning.
In Lesotho, where there is no policy of auto-matic promotion, the repetition rate is relativelyhigh in the primary cycle (see Table 2.9). Defin-ing the repetition rate as the number of repeat-ers in Year 2 over total enrollment in Year 1, theaverage repetition rates in primary educationhave hovered around 20% over the past fiveyears. The rate at the primary cycle has wors-ened slightly in recent years because of high rep-etition rates in Standards 1 and 2.
Repetition rates in the secondary cycle, rang-ing from 7.5% to 11.7% in the lower forms andfrom about 7% to 14% in the upper forms, aremuch lower than those in the primary cycle.However, the rate has also increased in the pastfive years. In junior secondary education, theaverage repetition rate was 8.8% in 1999 butrose to 11% in 2003. At the upper secondarylevel, the average repetition rate rose from 7.2%in 1999 to 8.4% in 2003.
Table 2.8Intercycle Transition Rates
Primary Lower Sec.to Lower Sec. to Senior Sec.
Lesotho1999 0.65 0.762003 0.72 0.81
Selected SSACountries (2001)Botswana 0.94Mozambique 0.59Namibia 0.93South Africa 0.94Swaziland 0.89Uganda 0.42Zambia 0.5
Source: MOET and World Bank EdStats
Table 2.9Repetition Rate by Grade and Education Cycle
Cycle Grade 1999 2000 2001 2002 2003
1 23.6 30 23.4 27.1 292 22.9 21.9 28.5 25.1 25.4
Primary 3 20.3 20 18.5 25.5 19.7Cycle 4 21.2 20.4 20.3 19.7 25.4
5 16.8 15.8 15.7 14.7 16.46 12.1 12.4 12 12.6 12.97 19.9 17.4 11.3 11.9 19
Average 19.5 19.7 18.5 19.5 21.1
Junior A 7.5 7.9 8.5 8.8 10.3Secondary B 9.7 10.2 8.9 10.9 11.7
Average 8.8 8.9 9.8 9.8 10.6
Upper C 9.3 7.4 7.5 7.5 7.3Secondary D 8.2 10.3 12 12 13.9Cycle E 4.1 3.7 4.4 3.9 3.9
Average 7.2 7.1 8 7.8 8.4
Source: School census and projected population

42 Primary and Secondary Education in Lesotho
Overall Student Flow Efficiency
What do these patterns of cohort survival andrepetition imply regarding the efficiency of stu-dent flow? This question can be answered bycomparing two pieces of information: the re-sources that the system currently uses to pro-duce its graduates, and the resources that a sys-tem operating without drop-outs or repetitionwould need to produce the same number ofgraduates. The ratio between these two figuresprovides a measure of the system’s student flowefficiency. The index can be further divided intotwo separate rates: one associated solely withdropout rates and the other with grade repeti-tion.
Table 2.10 summarizes the calculation of thetotal efficiency ratio. Using the year 2003 as anexample, we see that, given the 2003 rates ofcohort survival and repetition and calculatingfor a starting cohort of 1000 students, the re-
sources spent in Grade 1 would amount to 1710pupil-years (1000/(1–0.42)). In Grade 2, only905 students would be left, so the resources spentwould be 1393 pupil-years (905/ (1–0.35)). Con-tinuing in this manner to Grade 7, the cumula-tive resources spent would amount to 8055 pu-pil years (1730+1393+1157+1189+948+824+835). Given that only 835 students wouldreach Grade 7, the resources needed to producethem, without drop-out and repetition, wouldequal 4585 pupil years (835*7). Thus consider-ing both sources of waste (repetition and drop-out), the system currently operates only 0.57 (=4585/8055) times as efficiently as a system inwhich no one drops out or repeats a grade. Ifwe conduct this calculation using repetition
Table 2.10Efficiency of Student Flow in Primary Education in Lesotho, 2003On 1000 pupils entering Grade 1
1999 2003Reach Repetition Pupils Years Reach Repetition Pupils YearsGrade Rate3 Invested Grade Rate Invested
Gr 1 1000 0.31 1456 1000 0.42 1710Gr 2 892 0.30 1275 905 0.35 1393Gr 3 833 0.26 1121 885 0.23 1157Gr 4 790 0.27 1079 802 0.33 1189Gr 5 707 0.20 886 765 0.19 948Gr 6 637 0.14 739 702 0.15 824Gr 7 561 0.24 739 655 0.22 835Total 5420 7294 5714 8055Pupil years needed without repetition and dropout 3927 4585Efficiency ratioDue to repetition 0.74 0.71Due to dropout 0.72 0.80Total efficiency ratio 0.54 0.57
3 Repetition rate here is defined as the number ofrepeaters in one particular year over the NON-REPEATERS in the previous year.

Overview of the Education Sector: Historical and Comparative Perspectives 43
alone and ignoring the drop-out rate, the effi-ciency ratio is 71%. If we consider dropoutalone, the efficiency rate is 80%.
Comparing the efficiency ratios of 1999 withthose of 2003, we see a small improvement inthe overall efficiency ratio from 54% in 1999to 57% in 2003. However, the efficiency ratehas worsened with respect to repetition. An edu-cation system that operates with a 57% rate ofefficiency in 2003 is fairly inefficient. In Lesotho,students repeating grades seem to put a heavierburden on the system than do those who dropout. Overall, an educational system operatingat a 57% efficiency rate is not using its resourceseffectively.
F. Policy Perspectives on GradeRepetition and Dropout in PrimaryEducation
Although no specific study has related Lesotho’sprimary repetition rate with both quantitativeand qualitative dimensions of its educationaloutcomes, ample evidence suggests that repeti-tion has no discernable impact on the quality ofeducation. Indeed, a recent study by Mingat andSosale (2003) examined the relationship betweengrade repetition, student learning, and survivalof students in primary education from an inter-national perspective. Using micro-level data andinternational comparative macro-level interna-tional data for comparison, the authors demon-strated that grade repetition has no positive im-pact on student learning or on the quality ofeducation in general. However, grade repetitionwas shown to have a substantial negative im-pact on the quantity dimensions (number of stu-dents enrolled) through both direct and indirecteffects.
The direct effect is easy to understand, as re-peaters use twice the amount of resources. Alesser known indirect effect is also worth con-sidering: repetition is associated with a higherdrop-out rate before the end of the primary cycle.This effect is larger for girls than boys especially
in countries where girls tend to marry quiteyoung. With no positive impact on the qualityside, and a substantial negative impact on thequantity side, Mingat and Sosale see no justifi-cation for using grade repetition as a policy in-strument. While reducing the repetition ratewould not have a negative overall impact on thequality, it would reduce waste in resources andwould improve equity since it would help to di-minish the gap between girls and boys in theirprimary completion rate.
G. Chapter Summary
The education system in Lesotho is heavily in-fluenced by the British system. Its official lan-guages are both Sesotho and English, althoughEnglish is currently used in schools as the me-dium of instruction beyond Standard 3. Thestructure of education follows a 7–3–2–4 pat-tern, with 7 years of primary education, 3 yearsof junior secondary, 2 years of senior second-ary, and 4 years of higher education. Lesotho’seducation structure is similar to that of its neigh-bors including South Africa, Botswana,Swaziland, Namibia, and even Mozambique.However, unlike its neighbors, Lesotho has notyet legally defined the duration of compulsoryschooling.
Since schools were established by missionar-ies, the majority of primary schools in the coun-try are church-owned. However, despite theownership pattern, all education personnel (ex-cept for those hired by private schools) fall un-der the purview of the government through theMinistry of Education and Training and areobliged to follow the government’s rules andregulations.. The Education Act of 1995 stipu-lates a tripartite government, church, and com-munity management style for education inLesotho.
Education is managed by a central office inMaseru, along with 10 district offices, andschool-level management committees. Despitethe government’s efforts at decentralization, the

44 Primary and Secondary Education in Lesotho
management of education is still very central-ized, particularly in the area of finances.
Enrollment at all levels showed an increasingtrend until the mid-1990s when it started todecline due to rising poverty and rising fees. Thegovernment introduced FPE as an explicit strat-egy to reverse this declining trend. The FPE hasimproved access to schooling, especially in pri-mary education. Total primary enrollment in2003/04 was 1.2 times that in 1990. Gross andnet enrollment ratios in the primary cycle (127%and 85%) compare favorably with the regionalaverages, although those at the secondary levelare lagging behind (35% and 23%).
However, the internal efficiency in the primaryand secondary cycles has shown only slight im-provement. In terms of student flow, the primaryentry rate was about 120% in 2003, comparedwith 105% in 1998–99 before the introductionof FPE. About 65% of each entering cohort offirst-graders in 2003/04 was expected to reachthe last primary grade of Standard 7, up from56% in 1998/99.
While these trends are positive, there is noroom for complacency if the country is toachieve the Millennium Development Goal ofuniversal primary school completion by 2015.Repetition and, to a lesser degree, drop-out cre-ate waste in the system and result in a low over-all efficiency rate of 57% for primary educa-tion. Reaching the last 15% of the primaryschool-age population and retaining them inschool until the last primary grade may proveto be much more difficult, particularly in amountainous country like Lesotho. The govern-ment needs to enact decisive policies to attractall children to school and to reduce repetitionand drop-out rates.
H. Areas for Policy Development
The analysis and summary in this chapter pointto a number of areas where the government maycontemplate further policy development. Theseinclude:
1. Structure of Coverage Across Levels of Edu-cation. Lesotho has made the seven years ofprimary education free (the last grade of Stan-dard 6 will be free in 2006) and has recentlyrecommended to the Parliament that primaryeducation should be compulsory. However,it is not clear whether the Government willalso abolish the fees for lower secondary andstart implementing the 10-year basic educa-tion. The intention has been announced be-fore but it was never implemented. At thesame time, the expectation that lower second-ary education may become free is already cir-culating among the public. It is important thatthe government of Lesotho carefully assessesthe fiscal, pedagogical, and administrativeimplication of such a move before commit-ting itself.
2. Clarifying Governance Structure at SchoolLevel for Increased Focus on Results. By law,primary schools in Lesotho are managed bySchool Management Committees. For churchschools, each management committee can beresponsible for a maximum of eight schoolsbelonging to the same proprietor. In an effortto encourage parents and community mem-bers to become involved in the managementof church schools, the Education Act of 1995also introduced School Advisory Committeesin church schools. The role of these commit-tees is to advise the management committeeon all matters related to education in the rel-evant school. Lessons learned from the imple-mentation of School Management Commit-tee and School Advisory Committee indicatethat these two committees overlap substan-tially in membership as well as in the role theyplay, thus creating confusion and potentiallack of accountability at the school level. Re-cent review of the Education Act has alreadyrecommended the consolidation of the twocommittees into one. The recommendationhas to be endorsed and the Act should be re-vised before implementation can begin.
3. Reducing Primary Repetition. Efforts shouldbe made to reduce primary repetition. Evi-

Overview of the Education Sector: Historical and Comparative Perspectives 45
dence from other countries suggests that rep-etition has little impact on educational out-comes, and may increase dropout. Reducingrepetition would decrease the gross enroll-ment ratio, reduce overcrowding in lowerclasses, and increase overall efficiency.
4. Identifying and Targeting the VulnerableGroups. Fifteen percent of primary school-age children still remain outside of the for-
mal school system. Most of these students livein rural, mountain areas and are from poorfamily backgrounds. It is important that forevery new or existing policy, special consid-erations be made so that children and studentsin true hardship areas are not being left be-hind. These could include demand-side incen-tives for households to send their children toschool.


47
s Lesotho strives to universalize pri-mary school completion, further ex-tend even universal basic education,and foster the growth of other levelsand types of education and training,
financing requirements are expected to grow.The purpose of this chapter is to documentthe current pattern of education spending toprovide insights into the financial challengesthese goals pose. First, however, the govern-ment budgeting process is described, to pro-vide necessary context. Because recurrentspending is so central to the functioning of thesystem, the chapter focuses on this componentof education expenditures. The discussion ex-amines the aggregate levels and trends inspending as well as the evolution of its func-tional composition. It presents an in-depthanalysis of education expenditures in 2003–04, the most recent year for which the desireddata were available at the time of data analy-sis. Finally, it documents the volume and na-ture of household spending on education.Cross-country data are used, when availableand appropriate, to provide an added perspec-tive on the patterns of education spending inLesotho.
A. Budget Process, the Program ofExpenditures, and the Flow of Funds
The National MTEF Process
The government of Lesotho undertook a majorrevision of its budgetary approach for the fi-nancial year 2005/06 by introducing the Me-dium Term Expenditure Framework. Up to thistime the current budgeting system in Lesothowas based on line-item incremental budgetingwhich focused exclusively on the allocation ofexpenditure with no linkage to service deliveryoutputs. Over the years this approach had im-plications for the accountability and transpar-ency of public management. Communicationand coordination between the Ministry of Fi-nance and Development Planning (MOFDP)and other sector ministries has been weak, andsome policy priorities were not achieved. Plan-ning appeared to take place in isolation fromthe budgeting process and no mechanism wasin place to ensure that policy objectives wereprioritized. Together with a lack of information,this situation makes it difficult to ensure thatappropriate trade-offs are made between com-peting needs. In addition, the current financialmanagement systems have failed to produce theinformation required to monitor and evaluate
Patterns of Spending on Education
CHAPTER 3
A

48 Primary and Secondary Education in Lesotho
the actual spending on existing programs andprojects.
The government plans to address these issuesby adopting the MTEF approach as the basisfor its annual planning and budget process. Thisapproach will involve the preparation of an in-tegrated annual plan and budget covering threefinancial years. It will be an iterative top-downand bottom-up process which will secure explicitpolitical endorsements on the recommended re-source allocations. The objective of adopting theMTEF approach is to improve the quality ofpublic expenditure management through fourmechanisms:
• Ensure aggregate fiscal discipline by setting arealistic and achievable resource envelope.
• Allocate resources in accordance with na-tional development objectives by identifyingsectoral and intra-sectoral priorities.
• Improve operational efficiency in the imple-mentation of all recurrent programs.
• Improve projects by setting targets and moni-toring performance.
The Lesotho government’s financial year runsfrom April 1 to March 31. The MOFDP issuesa call circular in October and requires the lineministries to submit budgets in December. Thecircular outlines the government’s policy frame-work and the ceilings for both recurrent andcapital expenditures. Under the MTEF, the cir-cular will provide ceilings for three consecutivefinancial years starting from 2005/06. A gov-ernment-wide capital ceiling was also estab-lished, but this was not allocated by the minis-try. Also, new forms and guidance are now in-cluded as part of the circular.
The MTEF is expected to make it easier forministries not only to set their priorities, but tohave access to objective estimates of the resourceenvelope. Under the previous budget system, thecall circular produced by the MFDP did set bud-getary ceilings, but the chief accounting officersappeared not to feel bound by these ceilings.Instead of reworking their priorities to fit within
the available resources, the spending ministriestended to insist that the Ministry of Finance in-crease the aggregate ceiling. Ministries tendedto set artificially high budgets and the budgetprocess was a “game” of overestimation betweenthe ministries and the MOFDP.
However, for 2005/2006, line ministries seemnot to have assimilated the MTEF principles asintended. For 2005/2006, the initial bids againexceed the cabinet’s recurrent budget ceilings.For example, according to a recent World Bankmission, in 2005/06, total initial ministry bidsexceeded the cabinet recurrent budget ceilingsby 19% for year one (budget year), 15% foryear two, and 14% for year three. Of the 27ministries submitting bids, 25 exceeded theirceiling. The average (unweighted) bid was 28%above ceiling. Initial ministry capital bids (whichhad no ceilings) exceeded the aggregate capitalceiling by 157% in year one (budget year), 173%in year two, and 51% in year three.
The National BudgetDevelopment Process
The MTEF annual budget cycle consists of sixstages.4
1. Set the resource envelope and secure cabinetapproval for the indicative medium-term fis-cal strategy.
2. Conduct policy reviews to determine the op-timal sectoral allocations to recurrent pro-grams and capital projects and to prepare in-dicative cost estimates.
3. Prepare detailed expenditure ceilings withinthe aggregate resource envelope.
4. Secure cabinet approval and issue the call cir-cular.
5. Prepare detailed estimate submissions, andwork out agreements with line ministries.
6. Finalize the draft budget and secure legisla-tive approval.
4 Medium-Term Expenditure Framework Sensitiza-tion Action Plan (MOFDP—Unpublished)

Patterns of Spending on Education 49
Budget Implementation
The new MTEF system recognizes the challengesinherent in the existing system. According to astudy by MEFMI (2003)5 the current system isnot well geared towards ensuring effective bud-get implementation. Budgets are released everyquarter to the line ministries through the issue ofwarrants (in the case of recurrent expenditures)or requests to incur expenditure (in the case ofcapital expenditures). The released warrants arenot in any way linked to the overall implementa-tion plans of the ministries but still represent onequarter of the overall budget. Ministries are al-lowed to spend only in line with the released war-rants, which are controlled in most cases througha manual process called vote books. Paymentsto the government for goods and services are cen-tralized and handled by the MOFDP. MEFMI(2003) correctly notes that this process createssome budgetary gaps of either real or apparentunder/over expenditure. Since budgets are ap-proved by Parliament, over-expenditure by anyone voter is not allowed. However, the so-calledvirement process allows line ministries to moveexpenditure items from one category to anotheras long as they are within the overall envelope.Virements, however, still require MOFDP ap-proval.
Budget System in the Education Sector:The MTEF and its Implementation
The education sector has been preparing anMTEF-based budget each year since 2002. TheMOET is now in its third year of implementingthe MTEF in its budget process. This frame-work has enabled the ministry to project itsfunding requirements for the next three years.Under this process, the ministry’s programs havebeen reprioritized to ensure that they matchboth the National Vision and the areas identi-fied under the national Poverty Reduction Strat-egy (PRS). Further, the MOET has recently ap-proved its first Education Sector Strategic Planfor 2005 to 2015. It is hoped that the budget
will be more closely linked with the educationsectoral goals.
Until this year (2005/06), the actual imple-mentation of the MTEF budget in education hasbeen hampered by the absence of a nationalMTEF. Up till now, the MOFDP considered theeducation MTEF to be “for information only.”Nevertheless, within MOET, an inspection ofthe relationship between budgeted and actualexpenditure shows that recurrent budget and re-current expenditure have been very close com-pared to the situation in other countries. Exceptfor the financial year 2002/03 when the recur-rent MOET budget was overspent by 5%, therecurrent budget is usually under spent by be-tween 4% and 11% of total budget. In the lastcomplete financial year of 2003/04, the MOETunder spent by 11%—equivalent to 85 millionmaloti!
There is less consistency in the relationshipbetween capital budgets and expenditures overthe same time period. In 1998/99 the capitalbudget was overspent by 175%. In 1999/2000and 2000/2001, however, it was under-spent by71% and 55% respectively. Capacity then re-covered in financial year 2001/02 when the capi-tal budget was under spent by only 21%. Thenation’s capacity to execute capital projects isclosely related to the capacity of the EducationPlanning Unit and the Project Coordination andSupport Unit within the MOET.
In this report, “actual expenditure” refers tothe end of the year (March) Status of Funds asrecorded by the MOET votebook, rather thanthe budget estimates, because of the recurringvariances described above.
Programs of Expenditure in Education
The programs of expenditure provide impor-tant insights into Lesotho’s education systemand its administration. To improve the clarity
5 Report on the Implementation of a Medium-TermExpenditure Framework (MTEF) in Lesotho

50 Primary and Secondary Education in Lesotho
of its budget presentation and to tie expendi-tures with program implementation, the MOETcarried out an exercise in 2002 and developeda new program and sub-program structure.Compared to the old budget programs, the newones are more closely linked to the structure ofthe newly approved Education Sector StrategicPlan, which includes policy targets under eachsection. The main programs of expenditure nowinclude administration, basic education (includ-ing the primary and junior secondary grades),secondary education, technical and vocational,teacher education, higher education and spe-cial education. Table 3.2 also lists the subpro-grams.
As indicated earlier, the national MTEF wasinstituted only in 2005/2006. Because expendi-ture classifications had been improved in MOETbut remained static at MOFDP, recurrent ex-penditures had to be recorded using the MoFDPcategories, a process that impacts negatively onbudget monitoring and reporting. Subventionsto institutions, for example, are not treated con-sistently when the MOFDP releases the budget.This in turn makes it difficult to aggregate edu-cational expenditures by subsector. This prob-lem has been minimized in 2005/06 although ithas not been resolved for the capital budgetwhere some misclassification and misdescriptionis still being observed.
In Lesotho, the MOET budget and expendi-ture do not represent total budget and expen-
diture on education, because the National Man-power Development Secretariat (NMDS) oper-ates a bursary program under the Ministry ofFinance and Development. Two acts establishedthis program in 1978: the National ManpowerDevelopment Council Act and the Loan Bur-sary Act. A National Manpower Development(MND) Secretariat was established to managethe affairs of NMDS. To date, NMDS is in-volved in the administration of both tertiaryand post-primary bursaries with an increasingannual budget. In 2004/05, it was allocatedM270 million, more than 34% of MOET’s to-tal budget. Consequently, the discussion of edu-cation sector budgets and expenditures in thisreport also includes the budgets and expendi-tures for NMDS. When the discussion appliesonly to the MOET budget and expenditures,the qualifier MOET will be used to avoid con-fusion.
Flow of Funds
Figure 3.1 attempts to capture the flow of fundsin the education sector, particularly in primaryeducation. The MOFDP approves the budgetand releases funds quarterly to the MOET. Re-current primary expenditures include teachersalaries, administration of education in centraland district offices, textbooks and other mate-rials, meals, maintenance, and the primarysector’s share of curriculum and examinations.
Table 3.1Comparing MOET Budgets with Actual Education Expenditures(Not including NMDS)
1998/99 1999/00 2000/01 2001/02 2002/03 2003/04 2004/05
Recurrent Budget 439 462.2 601.2 514.8 700.8 742.3 787Recurrent Actual Expenditure 423.4 427.7 579 489.1 738 657.9 737Recurrent Variance –0.04 –0.07 –0.04 –0.05 0.05 –0.11 –0.06
Capital Budget 43 88 71 139 90.1 98.6 166Capital Actual Expenditure 119 25 32 109 162 98 166Capital Variance 1.75 –0.71 –0.55 –0.21 –79.8 0.61 0

Patterns of Spending on Education 51
Table 3.2Programs of Expenditure in MOET
Programs Subprograms
01- Administration CentralDistrictHIV/AIDS Coordination
02- Basic Education AdministrationPrimary Teachers’ SalariesBursariesFree Primary EducationSchool Self-Reliance & FeedingSubvention to GOL Primary School
03- Secondary Education AdministrationPost-Primary Teachers’ SalariesLesotho High SchoolSubvention to Other SchoolsBursariesSecondary Education Support Materials
04- TVET Administration (TVD)Lerotholi PolytechnicThaba-Tseka Tech. Institute
05- Teacher Edu. Support & Sup Administration (teacher service)Teaching Service CommissionTeacher Service DepartmentLesotho College of EducationDistance Teacher Education ProgramSchool-Based Support and Advisory Services
06- Higher Education AdministrationInstitute of Development ManagementNational University of LesothoCouncil on Higher EducationMachabeng College
07- Curricu. Assess. & Edu. Supply AdministrationCurriculum DevelopmentExamination Council of LesothoSchool Supply
08- Plan. Monitor. & Evaluation Primary InspectorateCentral InspectorateProject Support and CoordinationEducation Plan Policy & Research
09- Special Programs Special EducationNational Commission for UNESCOLifelong LearningEarly Childhood Care&Development

52 Primary and Secondary Education in Lesotho
Almost all of these items are provided in kindto primary schools in a variety of ways.
• Primary teachers (except for those hired andpaid directly by schools) are centrally man-aged by the Teaching Service Department,which issues salary payments directly to theteachers.
• Administration of primary education includesthe Chief Education Officer Primary and histeam of inspectors. It also includes the devel-opment and administration of primary cur-riculum and examinations. These paymentsare made directly from the Human ResourceDepartment.
• The MOET procures textbooks and otherteaching and learning materials centrally,stores them in the School Supply Unit ware-house, and distributes them to schoolsthrough the district offices.
• School meals are currently provided by bothMOET and WFP. WFP covers schools in themountain areas and lowlands for non-FPEgrades. WFP has its own system for adminis-tering and distributing meals to schools. TheMOET covers school meals for lowland pri-mary FPE students by paying local caterersdirectly, M2 per student per day.
• School maintenance was also managed andpaid centrally at a nominal allocation of M5
Figure 3.1Flow of Funds
Ministry ofFinance &
DevelopmentPlanning
ParentsFees for non-FPE students
Teacher ServiceDepartment
10 District Education
Admin
Ministry ofEducation
and Training(MOET)
Local Caterers
DevelopmentPartners
and NGOs
Contractors
School supplyunit
EducationFacility
Unit
School SelfReliance Food Unit
FieldInspectorate
MOET otherDepartments
In Cash
Primary schoolteachers
In Kind
salaries
subventions to government schools
Bursaries for needy students (non-FPE)
Textbooks and stationery
school feeding
construction and Maintenance
teaching services
"Illegal fees for FPE students
1,355 Primary Schools
Inspection & advisory services

Patterns of Spending on Education 53
per student per day directly to contractors.Unfortunately, to date, the school mainte-nance component of the FPE has not beenmanaged successfully for a combination ofreasons. In addition to budget constraints, theMOET central office is overburdened withsigning vouchers, the maintenance expendi-ture categories are too rigid to allow for indi-vidual school needs, and many schools arenot able to account for the government fundsthey receive.
• Inspection and advisory services are providedby the Field Inspectorate and an arm of Dis-trict Resource Teachers (DRT).
Given this combination of factors, most ofthe inputs directed to schools have been pro-vided in kind. Direct cash transfers to schoolsare rare. In fact, one provision in the MOETcircular describing the FPE policy was that thegovernment would not pay any money directlyto schools (as described in Chapter 2 of this re-port). However, experience from the last fewyears of FPE implementation seems to indicatethat because the non-teaching inputs to schoolsare now provided and managed centrally, theworkload has increased for the inspectors andresource teachers whose job had been reducedto approving procurement of vendors, contrac-tors and other paperwork. Now they have con-siderably less time to monitor the actual teach-ing and learning in schools.
An exception to this ruling that the gov-ernment will not pay any money directly toschools is the grant or subvention to govern-ment primary schools for special projects.Government primary schools indeed receivesubventions from the MOET in the form ofcash grants. It is not clear, however, how theamounts of these subventions were determined,and whether and how these schools accountedfor them. In 2002/03, a total of nine govern-ment primary schools in Lesotho receivedsubventions of varying amounts (from Maloti10,000 for xxx to M105,000 for Maseru En-glish Medium).
Schools further receive fees from students forvarious items including registration, books, andother fees. As of 2005, schools are still allowedto charge such fees to students who are enrolledin the non-FPE Standards including Standard 6and Standard 7. As if to complicate the picturefurther, a preliminary analysis based on schoolcensus data seems to indicate that about 3% ofall primary schools—including government andcommunity schools—are in practice still charg-ing so called “illegal fees” for the grades alreadycovered by FPE. This will be discussed in moredetail below in the section on private educationexpenditure.
The analysis in this section demonstrates thatindeed, schools have very little revenue raisingauthority since the FPE, possibly have negativelong term impact on school capacity and effi-ciency. The MOET is fully aware of this situa-tion. Starting this year (2004/05), all schoolsunder FPE are supposed to have receive a utili-ties allowance instead of the centralized main-tenance arrangement. Further, the MOET is in-terested in transferring a small amount of dis-cretionary funds directly to all government andcommunity schools (a total of 150). This situa-tion is reflected in the FY05-06 budget alloca-tion which includes an amount of M11,500 forevery such school.
However, the MOET is greatly concerned thatthe schools lack strong financial management.For instance, in the case of the utility allowancein 2004/05, few schools met the government re-quirement to submit their financial reports fromthe previous year before they could be given thismoney. This indicates the crucial need tostrengthen financial management and account-ability at the school level.
Recent work on public expenditure trackingstudies indicates that the GOL’s concern is le-gitimate. There are enormous variations in thedegree to which public funds intended forschools or health clinics actually reach them(Kushnarova, Inna. 2005). However the samestudy also concludes that even in the same coun-try, results can vary substantially under pro-

54 Primary and Secondary Education in Lesotho
grams with different designs. Leakage is not aninevitable feature of public expenditures. Forexample, in Uganda, in the early 1990s, only13% of student capitation grants were reaching
the schools. By 2001, after a prolonged periodof media coverage, that percentage increased to82%.
Figure 3.2Lesotho Education Sector Expenditure (1998/99–2004/05)
0
200
400
600
800
1000
1200
1400
1998/99Actual
1999/00Actual
2000/01Actual
2001/02Actual
2002/03Actual
2003/04Actual
2004/05Budget
MOET Education - Recurrent
MOET Education - Capital
NMDS
Total Education Sector
62%
84%
43%
59%
13%
82%
90%
51%
20%
Ghana: non-wage transfers to primary schools (1997/98)
Ghana: non-wage transfers to health clinics (1998)
Madagascar: fixed per-school grant (2002/03)
Papua New Guinea: education subsidy (2001)
Tanzania: non-wage transfers to primary schools (1999)
Tanzania: non-wage transfers to health clinics (1999)
Uganda: per-student capitation grant (1991-1995)
Uganda: per-student capitation grant (2001)
Zambia: fixed per-school grant
Education
Health% GDP Spent on Education in 2001

Patterns of Spending on Education 55
B. Public Spending: Aggregate Trendsand Distribution Across Levels
National Aggregate Trends
In Lesotho, overall government expenditure oneducation is high, consistent with the fact thateducation is a priority area identified in the re-cent Poverty Reduction Strategy Paper. Table 3.3displays the relevant expenditure data. In nomi-nal terms, both the MOET recurrent and NMDSexpenditures show an increasing trend. MOET
recurrent expenditure increased from M488million in 1998/99 to more than M782 millionin 2004/05. At the same time, actual expendi-ture by the NMDS rose from M65 million in1998/99 to M270 million in 2004/05, more thana 400% increase.
Lesotho’s capital expenditures for educationexperience more fluctuation. The total capitalexpenditure on education was M119 million in1998/99, but it fell to only M25 million the fol-lowing year and rose again in 2001/02 to M109million. This fluctuation reflects the capacity of
Table 3.3MOET and NMDS Recurrent and Capital Expenditures(current prices millions of Maloti) (1998/99–2004/05)
Actual Actual Actual Actual Actual Actual Actual
1998/99 1999/00 2000/01 2001/02 2002/03 2003/04 2004/05Actual Actual Actual Actual Actual Actual Actual
MOET Education – Recurrent 488 507 579 679 738 647 737
MOET Education – Capital 119 25 32 109 162 98 166
NMDS 65.2 77.2 80.5 120 177 217 270
Total Education Sector 672 609 692 908 1077 962 1173
GOL – Recurrent 1943 2319 2404 2312 2857 2533 3199
Of which: interest 129 183 258 203 220 216 156
Of which: non-interest Recurrent 1814 2136 2146 2109 2637 2690 3043
GOL – Capital 496 480 554 626 802 635 756
GOL – Total, excluding interest 2310 2616 2700 2735 3439 2952 3799
Gross Domestic Product 4921 5565 5964 6565 7370 8144 8851.4
Gross National Income 6305 7057 7486 8071 9068 10017 10938
1998/99 1999/00 2000/01 2001/02 2002/03 2003/04 2004/05
MOET Recurrent /GOL Recur., excl. interest 26.9% 23.7% 27.0% 32.2% 28.0% 24.1% 24.2%
Education Total Recur./GOL Recur., excl. interests 30.5% 27.4% 30.7% 37.9% 34.7% 32.1% 33.1%
MOET Capital /GOL Capital 24.0% 5.2% 5.8% 17.4% 20.2% 15.5% 21.9%
Education Total/GOL Total, excl.interest 29.1% 23.3% 25.6% 33.2% 31.3% 32.6% 30.9%
Ed. Total/GDP 13.7% 10.9% 11.6% 13.8% 14.6% 11.8% 13.2%
Ed. Total/GNP 10.7% 8.6% 9.2% 11.3% 11.9% 9.6% 10.7%

56 Primary and Secondary Education in Lesotho
the executing units more than the availability offinances.
Over the past few years, the average recur-rent expenditure on the education sector (includ-ing both MOET and NMDS) constituted morethan 30% of total government expenditure ex-cluding interest. Aggregating both recurrent andcapital expenditures, the total still amounts toan average of more than 25% over the last 5years or so, equivalent to between 11% and 14%of total GDP.
Lesotho spends a higher proportion of itsnational budget on education than any othernation. In 2001, worldwide, countries spent anaverage of about 4% of total GDP on educa-tion; the figure for Lesotho was over 11%, asFigure 3.4 shows.
Trends in the FunctionalComposition of Spending
This section assesses government recurrent edu-cation expenditure by function and level of edu-cation. While Lesotho spends about 11% to
14% of its GDP on the educational sector as awhole, the majority goes to recurrent expendi-tures, which are the focus of this analysis.
Several features characterize the composi-tion of recurrent public spending in Lesothoand its evolution since the financial year 1998–1999. Comparing expenditures by category, it’sclear that, at the aggregate level, a larger per-centage has been spent on primary education(90% increase) and higher education subsectors(more than 400% increase) (see Figure 3.5.).On the other hand, the expenditure on sec-ondary education has been very modest. Spend-ing on the other categories seems to have re-mained stable.
The technical and vocational (TVET)subsector which includes the Thaba-Tseka Tech-nical Institute (TTI) and Lerotholi Polytechnic(LP) has suffered a reduction in overall nominalexpenditures, from a high of M31.1 million in2000/01 to only M15 million the following year.The reduction was primarily due to reducedNMDS expenditures on bursaries for TVET stu-dents.
Figure 3.3Share of Lesotho’s Budgets Devoted to Education
0.0%
5.0%
10.0%
15.0%
20.0%
25.0%
30.0%
35.0%
40.0%
1998/99 1999/00 2000/01 2001/02 2002/03
MOET Recur./GoL Recur., excl. interest
Ed. Total Recur./GoL Recur., excl. interest
MOET Capital/GoL Capital
Ed. Total/GoL Total, excl. interest

Patterns of Spending on Education 57
Figure 3.4% of GDP Spent on Education in 2001 in Selected Countries and Regions
Table 3.4Actual Education Recurrent Expenditures by Program 1998–2005(current prices in millions of Maloti, and including NMDS)
1998/99 1999/00 2000/01 2001/02 2002/03 2003/04 2004/05
Govt. Recur. Expend. on Education 497.6 518.4 597.5 609.07 918.7 874.49 1006.7Of which:ECCD 0.8 0.8 0.5 0.5 0.8 0.4 0.7Primary 189.9 187.2 221.3 202.7 426.8 321.2 376.8Secondary 104.4 113.0 126.3 135.5 143.8 173.9 189.8TVET 24.2 25.9 31.1 15.0 17.5 21.7 23.2NFE 3.9 3.5 3.5 3.0 3.6 4.4 3.9LCE 12.4 13.1 15.7 16.4 16.7 18.2 21.5Higher Education 143.7 151.2 154.0 222.5 280.5 319.0 375.4 of which NUL 106.6 114.5 123.1 150.0 165.6 179.3 202.0Administration and other 10.4 10.4 6.7 13.5 29.0 15.7 15.4Share 1.00 1.00 1.00 1.00 1.00 1.00 1.00 of whichECCD 0.00 0.00 0.00 0.00 0.00 0.00 0.00Primary 0.38 0.36 0.37 0.33 0.46 0.37 0.37Secondary 0.21 0.22 0.21 0.22 0.16 0.20 0.19
(continued on next page)
% GDP Spent on Education in 2001
0
2
4
6
8
10
12
Leso
tho
Botswan
a
Mozambiq
ue
South
Africa
Swazilan
d
Ugand
a
East
Asia&Pac
ific
Europ
e&Cen
tral A
sia
Latin
America
&Caribb
ean
Middle
East&
North A
frica
South
Asia
Sub-Sah
aran A
frica

58 Primary and Secondary Education in Lesotho
By 2004/05, the cumulative effect of thesetrends had produced a noticeable shift in theshare of recurrent public spending by level of edu-cation. The combined share of primary and sec-ondary education fell from 59% in 1998/99 to56% in 2004/05, while the share spent on highereducation rose from 30% to 38.7%. The sharespent on teacher education and administrationremained about constant. On the other hand, theshare spent on technical and vocational educa-
tion declined from 5.6% to 2.3% in 2004/05,primarily because bursaries for TVET studentswere reduced. The share for non-formal educa-tion also declined from almost 1% to only 0.4%.
Table 3.5 shows the total recurrent expendi-tures by category in Lesotho and the four otherSADC (South African Development Commu-nity) countries. Compared to the other coun-tries, Lesotho allocates the smallest percentageto its primary subsector. Since primary educa-
Table 3.4 (continued)Actual Education Recurrent Expenditures by Program 1998–2005(current prices in millions of Maloti, and including NMDS)
1998/99 1999/00 2000/01 2001/02 2002/03 2003/04 2004/05
TVET 0.05 0.05 0.05 0.02 0.02 0.02 0.02NFE 0.01 0.01 0.01 0.00 0.00 0.00 0.00LCE 0.02 0.03 0.03 0.03 0.02 0.02 0.02Higher Education 0.29 0.29 0.26 0.37 0.31 0.36 0.37 of which NUL 0.21 0.22 0.21 0.25 0.18 0.20 0.20Administration and other 0.02 0.02 0.01 0.02 0.03 0.02 0.02
Source: MOET End of the Year Status of Funds for relevant years.
Figure 3.5Total Expenditures on Education by Program 1998 to 2005.
0
50
100
150
200
250
300
350
400
450
1998/99 1999/00 2000/01 2001/02 2002/03 2003/04 2004/05
ECCD
Primary
Secondary
TVET
NFE
NTTC
Higher Education
Administration and other

Patterns of Spending on Education 59
tion in Lesotho consists of 7 years, and it is verydifficult to achieve the MDGs target of a 100%completion rate by 2015, the nation would ben-efit by spending more of its public resources onthe primary subsector. The EFA FTI’s indicativeframework suggests that the government shouldallocate about 55% of recurrent spending toprimary education if that sector consists of 7years of schooling. Thus, the government mayneed to consider a greater financial commitmentto the FPE in order to achieve the MDGs targetby 2015.
It must be noted that the primary subsectorreceives 49% of MOET’s total recurrent expen-ditures, and the secondary subsector receives24%, for a total of nearly 70% of MOET re-current expenditures. This figure is similar tothose of other countries in the region. These fig-ures do not include the NMDS, however, itsadministrative presence under the Ministry ofFinance and Development Planning rather than
Education and Training complicates both thesector spending pattern and its monitoring.
C. A Closer Look at RecurrentExpenditure on Education in 2003/04
This section focuses more closely on the allo-cation of recurrent public spending in 2003/04across economic categories and subsectors, es-pecially within central administration, primary,secondary, and higher education. Within pri-mary and secondary education, we analyze theshare of total recurrent budgets spent on teachersalaries as compared to other inputs.
Central Administration
The Ministry of Education and Training hasmaintained a relatively stable management struc-ture, even as the system has expanded. This iscommendable given that many countries tend
Table 3.5Distribution of Government Recurrent Expenditure on Education
By level, in Lesotho and other Low-Income SADC Countries(percent of total)
LesothoActual Mozambique Zambia Tanzania Malawi 4-country2003/04 1998 1999 1999 1999/00 Average
Years of Primary 7 6 6 6 6 6.2
Primary 37 47 54 62 60 56
Secondary 20 22 10 7 10 12
Vocational 2 6 — — — —
Tertiary 36 17 18 26 19 20
Other 5 8 18 5 11 11
TOTAL 100 100 100 100 100 100
Notes: Tertiary in Lesotho does not include Teacher Training College or Lerotholi Polytechnic. In Zambia, whereanother ministry is responsible for TVE, the data are for Ministry of Education only. In Tanzania and Malawi, TVEexpenditures are counted under secondary and tertiary.Sources: The percent distributions for other countries are from data made available to the World Bank by nationalauthorities. Public Expenditure Review V1. 2002

60 Primary and Secondary Education in Lesotho
to expand central administration as their pro-grams expand. During the period from 1998 to2004, actual expenditure on administration (in-cluding district education offices) has been main-tained at about 13 million to 16 million malotiin nominal terms. In terms of share of total edu-cation budget, administration consumes between1% and 3% of total recurrent expenditure.
A few features distinguish the pattern of ex-penditures on administration. First, the totalstaff salary bill remained rather stable. In 2004,MOET employed about 646 officials, includ-ing those at both the headquarters and districtoffices.
Transport consumes the largest share of thetotal administration budget: about double thetotal for staffing, although the allocation fortransport was cut sharply in financial year 2003/04. It is not clear if the high transportation costswere due to the geography of Lesotho or someother reasons. It is suspected that the central-ized vehicle operations have much to do with it.It will be interesting to examine whether thiscut affected service delivery. A third noticeablefeature is that, starting in 2003/04, HIV/AIDSwas introduced as a new program under centraladministration in response to the government’scall for every line ministry to devote 1% to 2%of its recurrent budget to HIV/AIDS programs.
Primary Education
At 36%, primary recurrent expenditures con-stituted the largest share of the total recurrentexpenditures on education in 2003/04. Table 3.8details the allocation of the primary budgetwithin subprograms. Among the categories forprimary education expenditures are teacher sala-ries, school feeding, teaching and learning ma-terials, teacher support, development of primarycurriculum and examinations, salaries (basiceducation administration and inspectors), trans-port, and other operational costs.
Table 3.8 also shows details on the share ofeach expenditure item. The largest item withinthe primary subsector is teacher salaries: 66%of total primary expenditure in 2003/04. Theremaining 34% was spent on other inputs, in-cluding school feeding at 25%. Only 3% of to-tal primary recurrent was spent on teaching andlearning materials (not including capital expen-ditures).
Primary Teacher Salaries
The total bill for teacher salaries in a given yearis determined by two factors: the pupil: teacherratio (PTR) and the average teacher pay. Overthe past few years, the PTR in Lesotho has been
Table 3.6Evolution of Recurrent Budget for Central Administration
Central Administration
1998/99 1999/00 2000/01 2001/02 2002/03 (Feb) 2003/04 2004/05 (Feb)
Salaries 2.4 2.6 3.1 2.6
Transport 8.7 8.9 4.8 7.1
Maintenance and operating 1.1 16.0* 1.2 1.2
Office equip & furni. 0.3 0.3 0.7 0.2
HIV/AIDS 4.9 1.1
Special, UNESCO, others 0.6 0.9 1.3 1.4
Total 13.2 28.7 16.0 13.5* Maloti 15 million was vired to Agriculture for famine relief that year.

Patterns of Spending on Education 61
Table 3.7MOET Staffing and Salary Bill
Summary Inpost Budget Salary ACActual Salary Variance
Administration 83 211,021 194246 10645Basic Education Admin 1 3045 3045S.s.r.f.u. 28 70864 65800 5254Secondary Ed. Admin 2 16205 16205T.v.e.t. 26 116647 116647T.t.s.t.c. 38 99150 108775 9625T.s.d. 86 170622 157928.5 12693.5T.s.c. 8 47196 48996 900P.i.e.p. 7 17743 17743Higher Ed. Admin 2 7520 7520Curr. Serv. Supply 1 9391 9391N.c.d.c. 58 207325 207325S.s.u. 60 118027 114471 3556Field Inspectorate 87 314023 319799 5775Central Inspectorate 37 126180 126180Planning Unit 9 46010 46310 300Special Education 11 39631 39631L.d.t.c. 75 227824 220364 7460E.c.c.d. 17 47820 48645 825Unescom 10 27044 27044Grand Total 646 1,923,288 1896065.5 57033.5
Table 3.8Details of Primary Recurrent Expenditures in 2003/04
Primary Education 2003/04
Basic Education Administration 0.4
Primary Teacher Salaries 212.2
Free Primary Education
Transport 0.9
Materials 8.9
Upkeep of Institutions (school feeding) 79.2
School Self Reliance Feeding Unit
Salaries 0.8
Transport 0.3
Other running costs 0.6
School Supply Unit
Salaries 1.3
(continued on next page)

62 Primary and Secondary Education in Lesotho
kept rather stable, at 44:1 to 47:1 despite theintroduction of FPE in 1999. As of 2003, theprimary PTR was about 46.2, slightly higherthan the average for Anglophone African coun-tries (42) but much higher than the average forAsia, Latin America, and Eastern and CentralAsia (see Table 3.9).
Turning to average teacher pay, the total wagebill for 2003/04 (including allowances) was212.2 million maloti. The school census reporteda total of 9,294 teachers in 2003, making theaverage annual teacher salary in 2003, of 22832maloti, which is about 5 times the GDP percapita. Compared to the regional averages shownin Table 3.9, this figure is very high, indicatingthat teachers are being paid relatively well.
The official primary teacher pay scale (seeTable 3.10) includes many teacher categories and16 grades, with each grade including up to 6points. Teachers move up one point each year;when they reach the highest point within their
grade, they must be promoted before they canbe given a further salary increase. The officialpay scale seems to be compatible with the ag-gregate average teacher pay, which is obtainedby dividing the total teacher wage bill by thenumber of teachers.
A further analysis compared the pay of pri-mary teachers with that of their non-teachingcounterparts in the public, parastatal, and pri-vate sectors. Using the 1999 Labor Force Sur-vey, we selected only female teachers, as veryfew male teachers were included in the survey.From this subsample, we calculated the(weighted) average of monthly earnings (includ-ing allowances) for primary teachers as well asprivate and public sector workers not workingas teachers. We compared the earnings of teach-ers and non-teachers with those of workers whohave secondary education (Form D and FormE) and the diploma/A level certificate only, be-cause the other groups contained too few data
Table 3.8 (continued)Details of Primary Recurrent Expenditures in 2003/04
Primary Education 2003/04
Transport 0.3
Other Operational Costs 0.4
Field Inspectorate
Salaries 3.5
Transport 0.5
Other Running Costs 2.4
Share of Teacher Service & Support 3.3
Share of Curriculum and Exam 7.7
TOTAL 322.7
% spent on teacher salaries 0.66% spent on school feeding 0.25% spent on teaching/learning materials 0.03% of spent on admin and staffing (non-teacher) 0.02% spent on curriculum and exams 0.02% spent on transport, communications, etc. 0.02% spent on teacher support 0.01

Patterns of Spending on Education 63
points. This calculation showed that the aver-age monthly earnings of Lesotho’s primaryschool teachers in 1999 were 1.5 times morethan the average earnings of public and privatesector workers. To break this down by level ofeducation: among those who have a secondaryeducation, primary teachers are paid twice as
much as their counterparts in the public andprivate sectors. For those primary teachers whohave a diploma/A level, their average pay is simi-lar to that of other equally educated workers inthe private and public sectors.
Table 3.9Regional Averages for Teacher Wages, Pupil-Teacher Ratio, and % of Recurrent Spending on Inputsother than Teachers.
Percentage ofRecurrent spending
Number Average Pupil–Teacher on Inputs otherCountry/Region of Countries Teacher Wagea/ Ratio b/ than Teachers c/
Lesotho (2003)Standards 1–7 1 5.02 46.2 346
Regional Averages, circa 2000Francophone Africa 20 4.4 51.0 26.8Anglophone Africa 13 4.3 41.6 20.2South & East Asia 10 2.4 36.5 23.4Latin America 4 4.3 33.6 18.5Eastern Europe &Central Asia 5 1.2 18.2 31.3
Source: Ethiopia CSR.
6 Including 25% for school feeding
Table 3.10Teacher Pay Scale
Average Teacher Pay Total Teacher Pay/# of Teachers 22832
Official Pay Scale Minimum Maximum
Unqualified Grades 1–5 9576 13980
Qualified Grades A-E 14988 21840
Experienced Grades F 22476 26688
Senior Teacher Grade G 26482 32640
Deputy Head Teacher Grade I 33624 39936
Head Teacher Grade J 40728 43212
District Resource Teacher Grade K 44508 46992
Senior District Resource Teacher Grace L 48396 52620
GDP Per Capita 4550
Ratio of Pay over GDP Per Capita 5.02
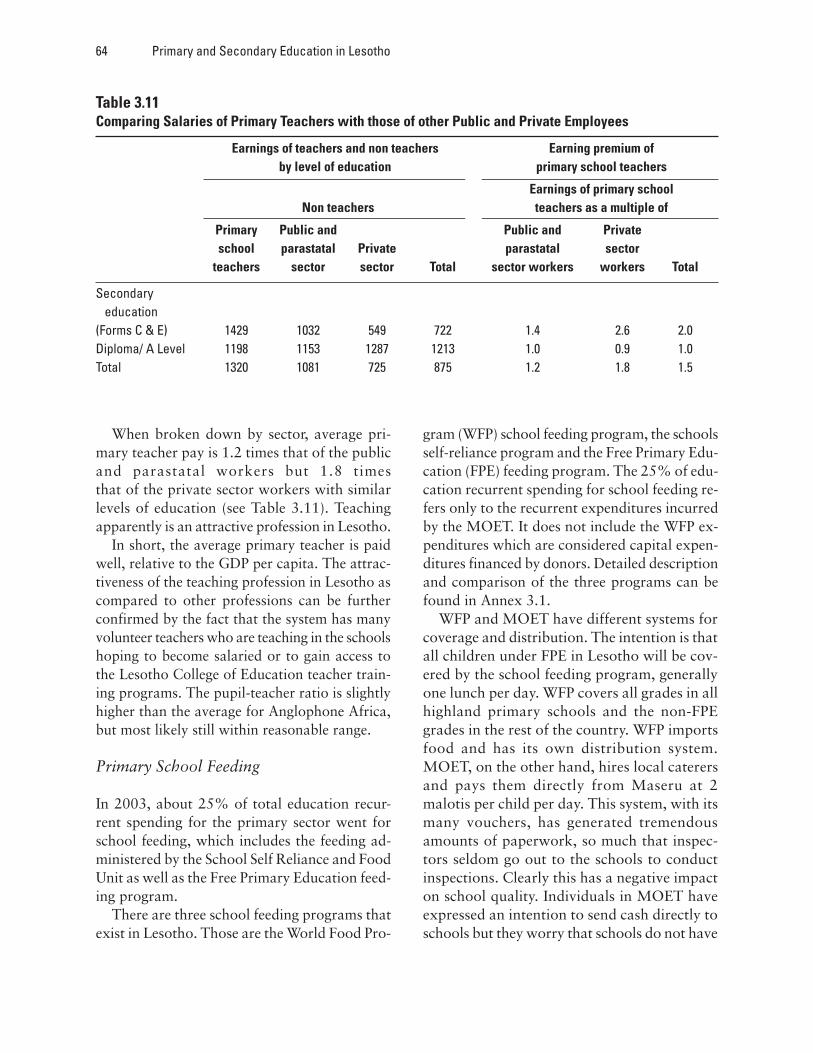
64 Primary and Secondary Education in Lesotho
When broken down by sector, average pri-mary teacher pay is 1.2 times that of the publicand parastatal workers but 1.8 timesthat of the private sector workers with similarlevels of education (see Table 3.11). Teachingapparently is an attractive profession in Lesotho.
In short, the average primary teacher is paidwell, relative to the GDP per capita. The attrac-tiveness of the teaching profession in Lesotho ascompared to other professions can be furtherconfirmed by the fact that the system has manyvolunteer teachers who are teaching in the schoolshoping to become salaried or to gain access tothe Lesotho College of Education teacher train-ing programs. The pupil-teacher ratio is slightlyhigher than the average for Anglophone Africa,but most likely still within reasonable range.
Primary School Feeding
In 2003, about 25% of total education recur-rent spending for the primary sector went forschool feeding, which includes the feeding ad-ministered by the School Self Reliance and FoodUnit as well as the Free Primary Education feed-ing program.
There are three school feeding programs thatexist in Lesotho. Those are the World Food Pro-
gram (WFP) school feeding program, the schoolsself-reliance program and the Free Primary Edu-cation (FPE) feeding program. The 25% of edu-cation recurrent spending for school feeding re-fers only to the recurrent expenditures incurredby the MOET. It does not include the WFP ex-penditures which are considered capital expen-ditures financed by donors. Detailed descriptionand comparison of the three programs can befound in Annex 3.1.
WFP and MOET have different systems forcoverage and distribution. The intention is thatall children under FPE in Lesotho will be cov-ered by the school feeding program, generallyone lunch per day. WFP covers all grades in allhighland primary schools and the non-FPEgrades in the rest of the country. WFP importsfood and has its own distribution system.MOET, on the other hand, hires local caterersand pays them directly from Maseru at 2malotis per child per day. This system, with itsmany vouchers, has generated tremendousamounts of paperwork, so much that inspec-tors seldom go out to the schools to conductinspections. Clearly this has a negative impacton school quality. Individuals in MOET haveexpressed an intention to send cash directly toschools but they worry that schools do not have
Table 3.11Comparing Salaries of Primary Teachers with those of other Public and Private Employees
Earnings of teachers and non teachers Earning premium ofby level of education primary school teachers
Earnings of primary schoolNon teachers teachers as a multiple of
Primary Public and Public and Privateschool parastatal Private parastatal sector
teachers sector sector Total sector workers workers Total
Secondary education(Forms C & E) 1429 1032 549 722 1.4 2.6 2.0Diploma/ A Level 1198 1153 1287 1213 1.0 0.9 1.0Total 1320 1081 725 875 1.2 1.8 1.5

Patterns of Spending on Education 65
the ability to keep accounts of such publicfunds.
Food supplies are insecure in many areas ofLesotho, and many children get no other mealthan the one provided in school. Therefore,school feeding is a crucial support. Still, the de-partment would benefit by examining variousadministration and distribution systems to de-velop one that is cost-effective and does not di-vert inspectors from their vital tasks of inspect-ing schools and providing advice.
Primary Teaching and Learning Materials
In the financial year 2003/04, only 3% of totalprimary recurrent expenditures was on teach-ing and learning materials, namely the textbooksfor pupils, teacher guides, and other stationaryitems. Prior to the FPE, Lesotho used to operatea relatively efficient textbook rental program forprimary education. Fortunately for the country,at the time of post FPE, there still remains inschool a stock of textbooks. An average primarystudent in Lesotho has access to about 5.7 text-books. The 3% recurrent is spent mainly to pro-cure stationery and to replenish some textbooks.
However, most of these books were procuredin the mid-1990s. Since then, there was somerevision to the primary curriculum. Annex XXdetails the primary curriculum and syllabus asof 1997. The National Curriculum DevelopmentCenter, in collaboration with the ExaminationCouncil, is developing an integrated curriculumand assessment framework. As the current stockof textbooks will need to be replaced soon, it isimportant that the MOET finalizes the curricu-lum and assessment policy and that the MOETshould have a revised curriculum which is moreintegrated and cost-effective, with clear specifi-cations of the core package to be financed bythe government.
Secondary Education
The term “secondary education” still causessome confusion in Lesotho. In terms of the pro-
grams on which funds are spent, the term “sec-ondary education” includes expenditures onboth junior secondary and high schools. How-ever, in terms of rhetoric and the newly approvedMOET Education Sector Strategic Plan (ESSP),it appears that “secondary education” shouldonly refer to senior secondary (Forms D & E),with the lower secondary (Forms A, B, and C)subsumed as part of “basic education.” Thisconfusion continues because the curriculum,teaching assignments, and general administra-tion make it hard to separate junior secondaryeducation from senior secondary. In this report,the term secondary education includes both jun-ior and senior secondary education.
In 2003/04, recurrent expenditures on second-ary schools constituted 20% of the total educa-tion recurrent expenditure. Table 3.12 detailsthe allocation of the secondary budget withinsubprograms. Expenditures on secondary edu-cation include teacher salaries, teacher support,development and administration of secondarycurriculum and examinations, salaries for ad-ministrators and inspectors, transport, and otherrunning costs.
As is true for primary, the largest expendi-ture item within the secondary sector is teachersalaries: 87% of total secondary expenditure in2003/04. The second largest item is bursariesfor needy children administered by NMDSwhich constituted 7% of total secondary expen-diture.
Secondary Teacher Salaries
As is true for primary teachers, the secondaryteacher wage bill is determined by the pupil-teacher ratio (PTR) and the average teacher pay.In Lesotho, the secondary PTR is much lowerthan in primary schools. Over the last few yearsit has been kept fairly stable at between 22.8:1and 26:1; it was 26:1 in 2003. Compared toother countries, this ratio is quite comfortableand hence expensive.
Secondary teachers in Lesotho earn very de-cent wages (see Table 3.13) compared to the

66 Primary and Secondary Education in Lesotho
level of GDP per capita. The average pay in 2004was 47,496 maloti, equivalent to more than 10times the GDP per capita for that year. Withthis in mind, the government needs to remainmindful about the fiscal implications of second-ary expansion. Most likely, it will have to pro-vide for short-term expansion by increasing thepupil-teacher ratio and by controlling averagewage growth so that teacher salaries will growat a lower rate than GDP. It is reasonable toassume that these two actions will allow thecountry to reasonably accommodate the FPEinflux. Nevertheless, a detailed education sec-tor financing model should be developed andpolicy simulations on various input indicatorsand their relation to outputs should be under-taken.
Secondary Bursary Programs
The government administers a total of threebursary programs. Two are managed by theMOET and the other by the Ministry of Healthand Social Welfare through the National Man-power Development Secretariat. Of the twoMOET bursary programs, one is financed jointlyby the World Bank and targets orphans andneedy children in primary and lower secondarygrades. The other is financed by the Global Fundand targets orphans at the senior secondarygrades Form D and Form E. The program un-der the Ministry of Health and Social Welfarehas provided bursaries for needy primary andsecondary students. A detailed description andcomparison of the three programs can be foundin Annex 3.2.
Table 3.12Details of Secondary Recurrent Expenditure in 2003/04
Secondary Education 2003/04
Secondary AdministrationSalaries 0Other Overhead 0.7Secondary Teacher Salaries 150.8Subvention to Lesotho High School 2.3Subvention to Other Schools 2.7Secondary InspectorateSalaries 1.06Transport 0.19Other 0.77Share of Teacher Service & Support 1.27Share of Curriculum and Exams 1.46NMDS (postprimary exclu.TVET) 13.00
TOTAL 174.23
% spent on teacher salaries 0.87% spent on NMDS bursaries 0.07% spent on subventions 0.03% spent on non-teacher staff 0.01% spent on teacher support 0.01% spent on curriculum & exams 0.01% spent on transport, communication, and other 0.01

Patterns of Spending on Education 67
Since the two MOET programs are consid-ered capital projects, they are not included inthe above analysis of secondary recurrent ex-penditures. The 7% of expenditures on bursaryrefers only to the bursary program by the Min-istry of Social Welfare through the NMDS. How-ever, the MOET has decided to allocate an an-nual allocation of M5 million to M7 million forbursaries for needy children as part of the on-going MOET program starting from financialyear 2005/06.
The existence of these various bursary pro-grams has created much confusion amongschools and parents. In 2002, the Ministry ofHealth and Social Welfare and NMDS stoppedcovering new students, both primary and sec-ondary. Assistance is now offered only to thosewho had been covered earlier, and the individualsocial worker has discretion to choose who isincluded. In some cases bursaries also coveruniforms. The programs pay all fees for each
covered student, directly to the school. Total feespaid per child were kept at M300 for primaryand M3,000 for secondary. Because it lackedthe human resources and transport facilities todo so, the Ministry of Health and Social Wel-fare rarely monitored its program at the schoollevel, but instead used each student’s End-of-YearPerformance Report to renew the bursaries eachyear.
Given Lesotho’s situation of high poverty andincreasing numbers of orphans, the bursary pro-gram is likely to continue. However, it is criticalthat the various bursary programs be consoli-dated to reduce inefficiency. It is also crucial toexamine the current targeting criteria, theamount of bursary provided, and the chain ofadministration. In the future it may be possiblefor Lesotho to consider bursary programs thatcould offset the opportunity costs of attendingschool and bring pecuniary benefits directly tothe household. To understand how various pro-
Table 3.13Secondary Average Teacher Pay and Official Pay Scale 2004
Average Teacher Pay Total Teacher Pay/# of Teachers 47496
Official Pay Scale Minimum Maximum
Non Graduate Teacher Grade A 22476 23269STTC&Equivalent Grade B 24072 24072DIP.Ed. (1st prof.) Grade C 24924 26688Non Graduate Senior Teacher Grade E 33624 46992Degree Grade F 48396 48396Degree+ PTC Grade G 49848 51348BA Ed. Equiv., Degree+STC/Dip., BA+PGCE Grade H 54204 59220MAED., BED, 2nd Prof. Grade I 60984 62508Head of Department Grade J 60984 65676Deputy Headmaster (sec) Grade K 67320 72492Headmaster (sec) Grade L 72492 78072Resource Teacher Grade M 74304 80016Headmaster (high) Grade N 80016 84072Educational Secretary Grade O 86172 90528GDP Per Capita 4550Ratio of Pay over GDP Per Capita 10.44

68 Primary and Secondary Education in Lesotho
grams may work, it will be important to startpiloting some optimistic programs and monitorthe results carefully.
Secondary Teaching and LearningMaterials
MOET’s recurrent budget does not provide forany teaching and learning materials for second-ary education. However, with support from theWorld Bank (for the stock), in 2003 MOETstarted a junior secondary core textbook rentalprogram. Starting from the financial year 2005/06, MOET has included in its recurrent budgetcontinuous support for this program, at M7 mil-lion per year. However, instead of limiting theprogram only to the four core subjects, the gov-ernment has decided to cover both core and non-core subjects. This decision endangers theprogram’s financial sustainability. A curriculumreview is urgent to prevent it from becomingtoo expensive.
Subventions to Secondary Schools
Subventions to government schools consumeabout 3% of total recurrent spending on sec-ondary education. Though it is not a very sig-nificant component, it carries significant policyimplications. While government secondaryschools also charged school fees in a mannerthey determine themselves, the government,through the Ministry of Education, found it nec-essary to provide them with small amounts ofcash to begin and maintain farming projects,raising poultry, pigs, garden produce, etc. Byaround 1995, the first four government second-ary schools were receiving subventions ofM10,000 each. To monitor the use of funds,including subventions, in these schools, theMOET appointed auditors to conduct annualaudits of the individual schools’ books. The au-ditors they were paid by schools. Since then, theamount of subvention has been increased. Nowall government schools are allocated a pre-de-termined subvention that is claimed each quar-
ter and is only released after the school has pre-sented a clearly written report on how it spentthe previous allocation.
A few exceptional subventions should benoted. Lesotho High School started as a depart-ment of the MOET and has remained so; in2003/04 it received a large sum of about 2.3million maloti. Another exception is theMachabeng High School, now Machabeng Col-lege, established to educate the children of in-ternational diplomats assigned to Lesotho. It hasbeen administered differently from the othersecondary schools, with its subvention deter-mined by the cabinet in recent years. The amountof the annual subventions given to other gov-ernment secondary schools varies fromM100,000 to M170,000. No clear record showshow the original subvention figures were calcu-lated, but recent increases have resulted fromhigher levels of demand for funding whenschools had special projects which, though jus-tifiable, could not be met by their annual sub-vention allocation.
These subventions to schools must be closelymonitored. Despite sporadic auditing in the past,schools are not accounting for the funds prop-erly. Nor are they held accountable in terms ofacademic results. MOET must establish clearexpectations for the schools that receivesubventions. Further, the history of thesubventions to various schools reveals an equityissue, which is detailed further in Annex 3.2.
Moreover, the MOET recurrent budget hasnot treated subventions consistently over thepast few years. Sometimes subventions are in-serted under the central administration andsometimes they are included under correspond-ing programs such as basic or secondary educa-tion. This makes it very difficult to conduct anyinvestigation into subventions, including the onefor this report. In the future, subventions forthe primary sector must be included in the ba-sic education program; those for secondary mustbe included in the secondary program; and thosefor tertiary institutions must be included withhigher education.

Patterns of Spending on Education 69
Higher Education
The definition of higher education in Lesotho isstill vague, particularly in the case of LesothoCollege of Education (LCE) and Lerotholi Poly-technic (LP). LCE is sometimes referred to asbeing in the teacher education sector and LP issometimes referred to as belonging in the tech-nical and vocational education sector.
Recurrent expenditures on higher educationaccounted for 36% of total recurrent expendi-tures on education in 2003/04—excluding LCE(under teacher education) and LP (underTVET). If higher education is defined to includeall post-secondary institutions, thus includingLCE and LP, the tertiary sector will absorb afull 40% of the education budget! In this sec-tion, we include LCE and LP as part of thehigher education sector.
Government support for higher educationinstitutions is given in the form of subventionsto autonomous higher institutions. The Na-tional University of Lesotho, along with LCEand LP, are Lesotho’s three largest institutionsof higher education. Table 3.14 details the al-location of the higher education budget by in-stitution.
We observed that in 2003, NMDS tertiarybursaries constituted the largest component un-der higher education recurrent expenditure(57%). In fact this proportion increased furtherin 2004/05. This trend is a cause for concern.Even though this bursary is supposed to be a“loan bursary,” its recovery rate is so low that
it is essentially a grant. See Box 3.1 for detailson loan recovery.
As mentioned earlier, the fact that NMDS isadministratively under the MOFDP has made itvery difficult for MOET to monitor, but it isstill part of the education sector expenditure.Moreover, the amounts of the bursaries are sohigh that in actual practice they have almostreplaced private fees for tertiary students. A veryhigh proportion (check %) of tertiary studentsin Lesotho (including Basotho students study-ing in South Africa) receive the scholarship andas long as he or she passes exams at the end ofschool year, the scholarship is renewed automati-cally. For example, 5,247 students in NUL wereprovided with NMDS scholarships out of a to-tal of about 7,000 students.
This is highly inequitable considering the situ-ation in the other sectors. For example, pupilsat secondary schools pay an average of overM2000 annually for food, lodging, and otherfees. And we know that, overall, those who areable to pass the Cambridge Overseas SchoolCertificate exams and proceed to higher educa-tion tend to be children from better-off house-holds who are more likely to be able to affordeducation. And of course graduates of highereducation institutions will be able to enjoy bet-ter working conditions and better pay in thefuture.
The government is currently introducing pri-ority fields for consideration of scholarships tostudy in South Africa. These include generalpostgraduate studies, along with health sciences,engineering, building technology, informationtechnology, and tourism. It is also consideringstrengthening the recovery of certain bursaries(as loans) from the graduates. These are certainlypositive steps forward. However, more drasticactions need to be taken to transform the ad-ministration of NMDS and the allocation of ter-tiary bursaries. Many countries have moved to-wards continuing to provide need-based schol-arships while also introducing a tertiary programfor loans that will be repaid. The challenge is tomake sure that we improve cost recovery in
Table 3.14Subventions to Higher Institutions in 2003/04
2003/04Higher Education (Millions of Maloti)
IDM 1.92NUL 117Lesotho College of Education 17LP 14.55NMDS Tertiary Bursaries 201.3

70 Primary and Secondary Education in Lesotho
higher education where we know there will beprivate returns, while at the same time not jeop-ardizing opportunities for children who are ablebut who are poor.
D. Education Spending andEducation Outcomes
To assess the efficiency of public resource us-age, we examined public spending on educationas a percentage of GDP linked with educationaloutcomes. Educational outcomes (based on aneducational development index) are measuredusing the average school life expectancy (theaverage expected number of years of formaleducation). Specifically, school life expectancyis calculated as the sum of age-specific enroll-ment rates for primary, secondary and tertiaryeducation. This analysis is exemplified inUNESCO’s Statistics, Education Indicators:Technical Guidelines and is also inherent in theWorld Bank’s country status reports for otherAfrican countries.
The educational development index [EDI] inLesotho is estimated at 19, a relatively low fig-
ure by international standards. The EDI is 57 inSouth Korea, 43 in Malaysia, 36 in Argentinaand Tunisia, 34 in Chile, and 30 in Brazil.Among Lesotho’s neighboring countries, the es-timated EDI is 28 in Botswana and South Af-rica, 33 in Mauritius, and 23 in Zimbabwe.
To get a sense of how efficiently resources areused to provide educational coverage, we cancontrast this EDI with the amount of resourcesthe country mobilizes for the sector. Total spend-ing on education in Lesotho was 12% of GNPin 2003. A very straightforward way to assessefficiency is to calculate the ratio of coverage(EDI) to spending; the figure obtained forLesotho is 1.6 (19/12). Compared to its neigh-bors, Lesotho’s level of efficiency on this mea-sure is quite low: this statistic is 4.2 in Botswana,8.3 in Mauritius, 4.7 in South Africa, and 3.3 inZimbabwe. From a wider international perspec-tive, Lesotho’s level of efficiency is much lowerthan those of South Korea (15.2), Malaysia (8.0),Argentina (13.7), Chile (11.3), and Brazil (9.0).
A second way to assess a country’s level ofefficiency in using resources for educational cov-erage is to plot a graph, placing the EDI on theY axis and education expenditure (measured as
Box 3.1
Repayment of Loan Bursaries from the NMDS
A June 2000 audit conducted by the office of the Auditor General found that the NationalManpower Development Secretariat (NMDS) does not keep a list of students who finish theirstudies in either Lesotho or the Republic of South Africa. Therefore it loses track of its borrow-ers. Nor do the students/borrowers always inform the NMDS when they find employment.NMDS started to rectify this situation by contacting the ministries’ personnel sections to collectlists of their employees. But this approach is not systematic and does not ensure effective collec-tion of the loans. Furthermore, the NMDS makes no effort to locate those who work in thesemi-state bodies or the private sector, or abroad, to get them to pay. As a result, most of thosewho repay their loans are those working for the government. Between 1995 and 1998, it wasfound that NMDS sometimes was not aware of how much it should expect to recover per yearand when it recovered only 10% of the expected amount.
Source: Office of the Auditor General: Performance Audit Report on the Structures and Systems forPayment and Repayment of Loan Bursaries in Lesotho and the Republic of South Africa.

Patterns of Spending on Education 71
a share of GDP) on the X axis. Figure 3.5 showsthe location of selected Sub-Saharan Africancountries on these two dimensions. It is inter-esting to examine where Lesotho stands in thisfigure: the middle right corner.
This cross-national comparison also showsthat Lesotho uses public resources inefficiently.Lesotho spent 12% of its public expenditure oneducation as a percentage of its GNP and itsindex of educational development is estimatedas 19. The dot representing Lesotho is far fromthe curve that represents the ideal. This freehandenvelope curve links the most efficient publicresource users among the selected countries. Themost efficient countries are those whose cover-age is maximum given what they spend.
E. Public Spending Per Student byLevel and Type of Education
Using the information on total public expendi-tures on education and student enrollment, it ispossible to calculate government recurrent ex-penditure per pupil for each level of education,
and to track its evolution since 1998. Table 3.15displays per-student government recurrent expen-diture, ratios of expenditures to GDP per capita,and ratios to primary expenditure per pupil.
Primary expenditure per student rose nomi-nally from M514 in 1998/99 to M879 in 2004/05, despite a decline when FPE was first imple-mented and the enrollment suddenly increased.However, as a proportion of GDP per capita,the level of public expenditure per primary stu-dent remained fairly constant at about 17% ofGDP per capita in 2004. It is commendable thatthe government of Lesotho has managed tomaintain its level of investment in primary edu-cation to keep up with the increased enrollmentand economic growth.
Secondary expenditure per student also rosenominally during the period, though at a slowerrate. It increased nominally from 1600 to 1993maloti per student. As a proportion of GDP percapita, however, secondary recurrent expendi-ture per student actually declined from 56% in1998/99 to only 41% in 2004/05.
Compared to other levels, expenditure perTVET student experienced more fluctuation.
Source: World Bank (Namibia Education Report, 2004)
Figure 3.6Educational Development and Public Spending as % of GDP
0
50
100
150
200
250
300
350
400
450
0.00 2.00 4.00 6.00 8.00 10.00
Lesotho
12.00
Public Ed Expenditure as % of GDP
Educ
atio
nal D
evel
opm
ent I
ndex
Freehand envelope curve: the further under the curve, the less efficient the country's education system

72 Primary and Secondary Education in Lesotho
There was a substantial decrease in 2001/02 and2002/03 because NMDS bursaries for TVETstudents were reduced. As a share of GDP percapita, investment in TVET per student declinedfrom 5.6 to 2.6 times GDP per capita.
Public expenditures per student for those atthe Lesotho College of Education and the Na-tional University declined nominally during thesame period, due primarily to increases in en-rollment. In 1998/99, it cost the governmentMaloti 13,080 every year to educate one stu-dent at LCE. By 2004/05, the cost declined toMaloti 9243 per student. The annual figures perstudent for the NUL dropped substantially: from
Maloti 47,547 in 1998/99, to about Maloti28,240 in 2004/05. In terms of share of the GDPper capita, expenditure per LCE student declinedfrom 4.6 times to 1.9 times GDP per capita, andper NUL student, expenditure declined frommore than 16 times to about 6 times GDP percapita.
However, when compared to other levels, thegovernment still spends far less per student inprimary education, indicating an enormous im-balance in its financial support. In 1998/99, com-pared to one primary school student, the gov-ernment spent three times as much on a second-ary school student, about 31 times as much on
Table 3.15Government Recurrent Expenditure Per Student
1998/99 1999/00 2000/01 2001/02 2002/03 2003/04 2004/05
Public Recurrent Exp. Per Student (Maloti)
Primary 514 513 539 488 1,019 747 879
Secondary 1,600 1,560 1,731 1,739 1,773 2,093 2,088
TVET 16,037 15,041 16,729 7,720 9,419 11,807 13,307
LCE 13,080 14,162 16,186 16,416 9,520 10,483 9,243
NUL 47,547 45,311 43,284 45,928 39,478 N/A 28,240
Students at SA Universities/Technical 36,523
Ratio to GDP Per Capita
Primary 0.18 0.16 0.16 0.13 0.25 0.16 0.18
Secondary 0.56 0.48 0.50 0.47 0.43 0.46 0.43
TVET 5.57 4.68 4.88 2.07 2.27 2.60 2.72
LCE 4.55 4.40 4.72 4.40 2.30 2.30 1.89
NUL 16.52 14.09 12.63 12.31 9.53 N/A 5.77
Students at SA Universities/Technical 8.03
Ratio to Expenditure Per Primary Student
Primary 1 1 1 1 1 1 1
Secondary 3 3 3 4 2 3 2
TVET 31 29 31 16 9 16 15
LCE 25 28 30 34 9 14 11
NUL 93 88 80 94 39 N/A 32
Students at SA Universities/Technical 49

Patterns of Spending on Education 73
a TVET student, 25 times as much on a LCEstudent, and 94 times as much on an NUL stu-dent.
The situation has improved slightly since then.By 2004/05, compared to a primary student, thegovernment spent twice as much on a studentin secondary school, and the multipliers for thetertiary level also fell: 15 times as much for theTVET student, 11 for one in LCE, and 35 forone in NUL.
How does Lesotho compare to other coun-tries and regions in terms of public expenditureper student by level? While Lesotho’s level ofexpenditure per primary student is not that dif-ferent from educational systems in other neigh-boring countries and even other world regions,its levels of expenditure for secondary and ter-tiary are very high compared to other countries.As Table 3.16 shows, in 2001, the governmentspent more than 12 times the GDP per capitafor every student enrolled in the National Uni-versity, compared to only 56% of the GDP inSouth Africa, 88% in Botswana, and about 2.5times GDP in both Swaziland and Kenya.
F. Private Expenditures on Education
In this section, we examine the level of privateexpenditure that Lesotho households incur forprimary schooling and how this level has evolvedover time, especially after FPE was introducedin 1999. The information used for analysiscomes from the annual school census. Many
types of fees must be considered, including reg-istration fees, book fees, and fees for uniforms,meals, buildings, exams, and salaries for privateteachers who are hired and paid by schools.
Primary Education
The most important finding from the fee analy-sis is the dramatic reduction in the proportionof schools charging fees since Free Primary Edu-cation was introduced. FPE abolished school feesfor Standard 1 in 2000. At that time, an addi-tional class was added each year, so that in 2001no fees were charged in Standards 1 and 2; in2002, none in Standards 1, 2, and 3; and in2003, none in Standards 1, 2, 3, and 4. In 1999,almost half of the schools in Lesotho were charg-ing registration fees for Standard 1, and morethan 90% were charging for textbooks and otheritems. By 2003, only 3.3% of schools (includ-ing private schools) were still charging registra-tion fees, with 2.3% charging book fees, and11% charging other fees.
A second, related finding is surprising: al-though FPE stipulates that all fees charged toprimary students should be abolished and nochildren should be denied schooling because ofinability to pay, a fraction of schools still chargefees. These include government, community, andchurch-owned schools (see Figure 3.7). The situ-ation seems to be the worst in the so-called“community” schools.
As of 2003, a total of 3.3% of schools con-tinued to charge registration fees for Standard1. This included about 24% of community
Table 3.16Public Expenditures Per Student as % of GDP Per Capita in 2001
South East Asia & Latin America SouthLesotho Africa Botswana Swaziland Kenya Pacific & Caribbean Asia
Primary 13 14.3 6 10.4 0.9 5.7 13.1 8.7
Secondary 47 18.3 5.5 29.7 2.2 10.4 10.4
Tertiary 1200 56.8 88.6 253.2 256.7 44.9 60.4

74 Primary and Secondary Education in Lesotho
schools and 5% of government schools, asshown in Figure 3.8. Church-owned schools,on the other hand, seem to be abiding moreclosely by the FPE rules: under 2% were stillcharging a registration fee. Indeed, the African
Methodist Episcopal Church has abolished reg-istration fees in all its schools. Of course, weexpected to see 100% of private schools con-tinue to charge fees before and after FPE wasimplemented.
Figure 3.7Proportion of Schools Charging Fees for Standard 1
Figure 3.8% of Schools Charging Registration Fees by Type
0
20
40
60
80
100
120
1999 2000 2001 2002 2003
Registration
Books
Other
0.0%
10.0%
20.0%
30.0%
40.0%
50.0%
60.0%
70.0%
80.0%
90.0%
100.0%
1999 2000 2001 2002 2003
Government
Community
Lesotho EvangelicalChurch
Roman CatholicChurch
Anglican Church ofLesotho
African MethodistEpiscopal Church
Others
Private
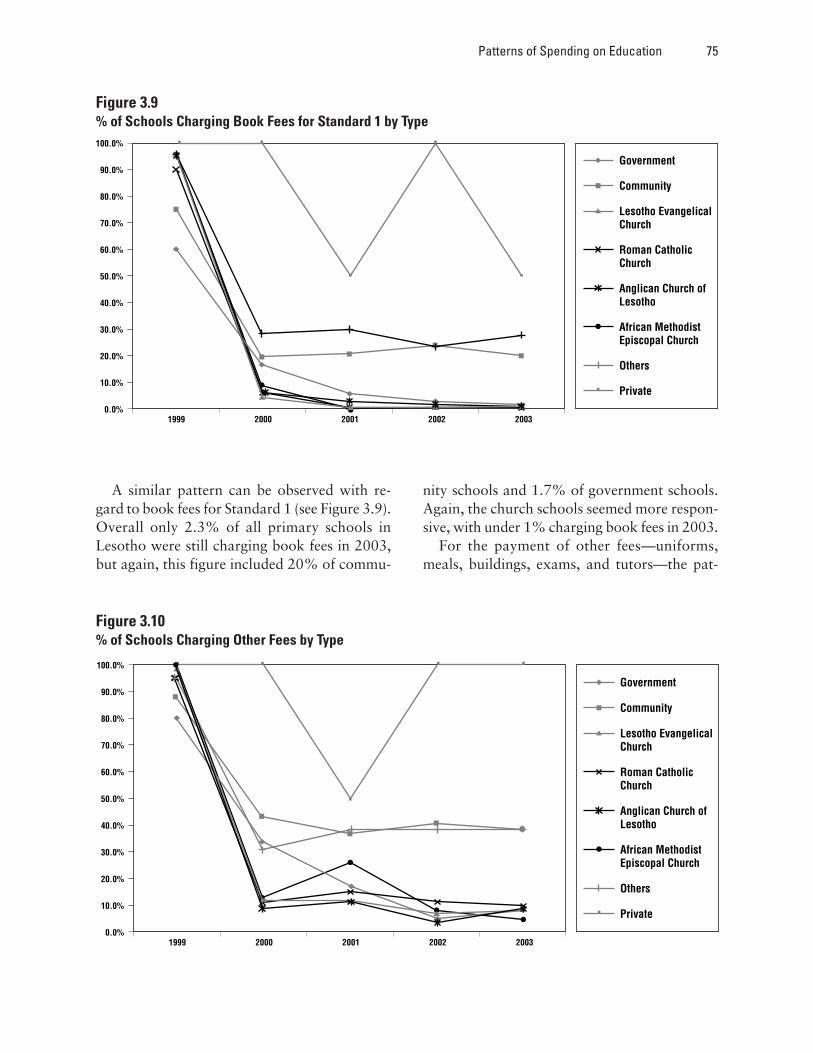
Patterns of Spending on Education 75
A similar pattern can be observed with re-gard to book fees for Standard 1 (see Figure 3.9).Overall only 2.3% of all primary schools inLesotho were still charging book fees in 2003,but again, this figure included 20% of commu-
nity schools and 1.7% of government schools.Again, the church schools seemed more respon-sive, with under 1% charging book fees in 2003.
For the payment of other fees—uniforms,meals, buildings, exams, and tutors—the pat-
Figure 3.9% of Schools Charging Book Fees for Standard 1 by Type
Figure 3.10% of Schools Charging Other Fees by Type
0.0%
10.0%
20.0%
30.0%
40.0%
50.0%
60.0%
70.0%
80.0%
90.0%
100.0%
1999 2000 2001 2002 2003
Government
Community
Lesotho EvangelicalChurch
Roman CatholicChurch
Anglican Church ofLesotho
African MethodistEpiscopal Church
Others
Private
0.0%
10.0%
20.0%
30.0%
40.0%
50.0%
60.0%
70.0%
80.0%
90.0%
100.0%
1999 2000 2001 2002 2003
Government
Community
Lesotho EvangelicalChurch
Roman CatholicChurch
Anglican Church ofLesotho
African MethodistEpiscopal Church
Others
Private

76 Primary and Secondary Education in Lesotho
tern is slightly different. Overall about 10% ofall primary schools in Lesotho were continuingto charge “other fees” after FPE, with the situa-tion again the worst in community schools. Al-most 40% of community schools and 8% ofgovernment schools continued to charge otherfees after FPE was implemented, along withabout 10% of Roman Catholic schools, 8% ofEvangelical Church schools, and 4% of AfricanMethodist Episcopal Church schools.
Average Amount of Fees
Among those schools that do still charge vari-ous fees, the amounts charged in each gradeexhibit a very interesting pattern in the contextof FPE. As the FPE was rolled out to a particu-lar grade, the proportion of schools charging feesdeclined sharply. Among those schools that con-tinue to charge fees, however, the average totalfees charged per student increased for that par-ticular grade. For example, in 2000 when feesfor Standard 1 were supposed to be abolished,average fees for Standard 1 increased fromMaloti 119 to 340, and jumped further to more
than 1000 Maloti in 2001. The most strikingsituation occurred in 2002 when the fees forStandard 3 were supposed to be abolished, butaverage fees for Standard 3 jumped to overMaloti 1000!
Further, starting from 2003, the fees for Stan-dards 1, 2, and 3 started to fall to betweenMaloti 400 and 500, still much higher than inpre-FPE times. Compared to the GNI per capitaof US $550 in 2002, families who had to payfees for their children in Standards 1, 2, or 3were paying an average of 15% of their totalhousehold income for each child. And the bur-den is heavier for poorer households.
These data present a puzzle: why is a higherproportion of government and communityschools charging fees, compared to churchschools? Furthermore, among the schools thatcontinue to charge fees since FPE, why do thecommunity and government schools charge sub-stantially higher fees than the church-owned oreven the private schools?
To estimate the total primary fee revenue as ashare of total public spending on primary edu-cation, we can aggregate the total private expen-
Figure 3.11Average Fees by Standard 1999 to 2003 (among the schools still charging)
1999 2000 2001 2002 20030
200
400
600
800
1000
1200
Standard 1
Standard 2
Standard 3
Standard 4
Standard 5
Standard 6
Standard 7

Patterns of Spending on Education 77
diture on primary education among those schoolsthat continue to charge various fees. The aggre-gate amount for 2003 is Maloti 44.3 million.For 2003, total primary recurrent spending wasMaloti 312.2 million and total recurrent expen-
diture on education was Maloti 874.5million.Comparing the maloti 44.3 million to these fig-ures, we conclude that private expenditures ac-count for about 13.7% of total primary spend-ing and 5% of total education spending.
Figure 3.12Average Registration Fees among Schools that Charged such Fees in 2003
Figure 3.13Average Book Fees among Schools that Charged Book Fees in 2003
0
50
100
150
200
250
300
350
400
Standard 1 Standard 2 Standard 3 Standard 4 Standard 5 Standard 6 Standard 7
Government
Community
Lesotho EvangelicalChurch
Roman CatholicChurch
Anglican Church ofLesotho
African MethodistEpiscopal Church
Others
Private
Standard 1 Standard 2 Standard 3 Standard 4 Standard 5 Standard 6 Standard 7
Government
Community
Lesotho EvangelicalChurch
Roman CatholicChurch
Anglican Church ofLesotho
African MethodistEpiscopal Church
Others
0
50
100
150
200
250
300

78 Primary and Secondary Education in Lesotho
Secondary Education
Nearly every secondary school in Lesothocharges some fees. At Lesotho High School, feesflow back into the government as revenue; oth-erwise secondary schools retain the fee revenueand use it at the school level. About two yearsago, the MOET attempted to introduce someregulations by commissioning a study “ratio-nalizing secondary school fees.” But the attemptfailed. Fees charged in secondary schools con-stitute a significant obstacle to secondary cov-erage.
Fees in secondary education can be catego-rized into meals, lodging, and other. Other feesinclude registration fees, government tuition,sports, library, and other categories of tuition,textbooks, uniforms, and maintenance andbuilding funds. Almost three quarters of Lesothosecondary schools charge meal fees. Though theyvary by school management type, the averagemeals fee nationwide is between 500 maloti and600 maloti per student per year (see Table 3.17).About one third of Basotho secondary schoolsare boarding schools which charge lodging fees.
The average lodging fees are the same for allgrades but vary according to school managementtype. On average, Roman Catholic schoolscharge the highest lodging fees at M1095, whileLEC schools tend to charge the lowest at onlyM338.
In addition, almost all schools charge otherfees in amounts that vary both by grade and byschool management type, but average between773 maloti and 999 maloti (see Table 3.18).They seem to be highest in community and pri-vate schools, and lowest in LEC schools.
As was true for primary fees, we can estimatetotal secondary fee revenue as a share of totalpublic spending on secondary education by ag-gregating the total private expenditure on sec-ondary education. The obtained aggregateamount for 2003 is Maloti 118.6 million (meals,Maloti 33.8 million; lodging, Maloti 7.8 mil-lion; and other, Maloti 77 million). When werelate this figure to the total secondary recur-rent spending of Maloti 173.9 million and totalrecurrent expenditure of Maloti 874.5 million,we conclude that private expenditures accountfor about 68% of total secondary spending and
Figure 3.14Average Other Fees among Schools that Charged Other Fees in 2003
Standard 1 Standard 2 Standard 3 Standard 4 Standard 5 Standard 6 Standard 7
Government
Community
Lesotho EvangelicalChurch
Roman CatholicChurch
Anglican Church ofLesotho
African MethodistEpiscopal Church
Others
Private
0
500
1000
1500
2000
2500
3000
3500
4000

Patterns of Spending on Education 79
13.5% of total education spending, two figuresthat are very significant.
G. Chapter Summary
The government is starting to implement a three-year Medium Term Budget and ExpenditureFramework in an attempt to link its prioritieswith budgets and expenditures in a way thatimproves predictability for all sectors. In prac-tice, however, the relationship between the Pov-
erty Reduction Strategy priorities and budgetallocations needs to be much improved.
Lesotho’s government spends an average of12% of its GDP on the education sector, includ-ing the allocations to both MOET and NMDS.Though this level of expenditure is very highcompared to other countries, it has not resultedin corresponding results in outcome. A verystraightforward way to assess efficiency is tocalculate the ratio between coverage (the indexof educational development) and spending; thefigure obtained for Lesotho is 1.6 (19/12). Com-
Table 3.17Average Fees for Meals and Lodging at Secondary Level
2003 School Meals Lodging# of Schools Amount # of Schools Amount
Government 5 310 0
Community 4 404 1 730
Lesotho Evangelical Church 63 530 11 338
Roman Catholic Church 64 756 15 1095
Anglican Church of Lesotho 24 400 4 531
African Methodist Episcopal Church 1 200
Others 8 762 2 350
Total 169 597 33 718
Table 3.18Average Secondary “Other” Fees by Grade
Form A Form B Form C Form D Form E
Government 1010 923 883 1081 918
Community 1337 1295 1335 1930 2025
LEC 709 677 678 748 754
RCM 951 791 717 991 1071
ACL 883 811 787 905 924
AME 844 828 836 850 850
Others 1184 1101 1061 1361 1266
Private 1415 1230 1230
Total 896 806 773 974 999

80 Primary and Secondary Education in Lesotho
pared to neighboring countries, Lesotho’s levelof efficiency is quite low: the comparable fig-ures are 4.2 in Botswana, 8.3 in Mauritius, 4.7in South Africa, and 3.3 in Zimbabwe. From aninternational perspective, Lesotho’s level of ef-ficiency is very low compared to South Korea(15.2), Malaysia (8.0), Argentina (13.7), Chile(11.3), and Brazil (9.0).
What is very worrisome is that Lesotho’s dis-tribution of expenditures by level of educationgreatly favors higher education. Although nomi-nal expenditures for primary and secondary edu-cation have increased substantially since FPE wasintroduced, the combined share of expenditureson primary and secondary education actuallyfell from 59% in 1998/99 to only 54% in 2004/05. Meanwhile, the share for higher educationrose from 30% to 38.7%. Since a substantialproportion of the expenditures on higher edu-cation went for bursaries, which are adminis-tered by the Ministry of Finance and Develop-ment Planning rather than MOET, it is difficultto monitor the total expenditures on higher edu-cation and no one is really accountable for theexpensive higher education.
In per pupil terms, far less is still spent oneach primary student than on those at higherlevels, indicating an enormous skew in thegovernment’s financial support. In 1998/99,compared to a primary student, the governmentspent three times as much on a secondary schoolstudent; about 31 times as much on a TVETstudent; 25 times as much on a LCE student,and 94 times as much on an NUL student. Thesituation has improved slightly since then. By2004/05, again taking the primary student asthe unit, the multiples are 2 times as much for asecondary school student; 15 for TVET; 11 forLCE, and 35 for NUL.
The major cost drivers at the primary levelare teacher salaries which average five times theGDP per capita, and the school feeding pro-gram. The average cost for a teacher inAnglophone countries is 4.3 times the GDP percapita, compared to 5 in Lesotho. The nation’sprimary level pupil-teacher ratio of 47:1 is rea-
sonable compared to those in other countries.The average primary teacher pay, including al-lowances, is 1.5 times the average for otherpublic and private employees with similar edu-cational qualifications.
For secondary education, the very high aver-age teacher salary combined with the low pu-pil-teacher ratio means that the total teacherwage bill consumes almost 90% of the total sec-ondary recurrent budget. The other significantcost items are secondary bursaries andsubventions to government secondary schools.It is important that these programs be exam-ined very carefully to ensure that the MOETtargets the right population, gets the most valuefor its money, and ensures equity among allschools. At the very minimum, schools receiv-ing government subventions should accountproperly for the funds, not just in financial termsbut also in terms of student learning results.Transparent criteria for determining subventionsare also needed. The provision of lower second-ary textbooks also needs to be closely monitored:the government recently changed its policy onthe textbook rental program to include core andnon-core subjects, an expensive change that maymake the program unsustainable in the long run.
Within the MOET, public expenditures oneducation are centrally managed. All teachers arepaid directly by the Teacher Service Department,except for a few true private schools. In primaryeducation for those grades covered by FPE (allgrades will be covered by 2006), other schoolinputs including textbooks and stationery, schoolmeals, and even school maintenance are procuredcentrally. This leads to great inefficiency in thedelivery of these services and also forces inspec-tors to spend valuable time doing paperwork in-stead of monitoring the teaching and learning inthe classrooms. At both the primary and second-ary level, the MOET is also providing grants andsubventions to government and communityschools for special projects. The government in-tends to channel funds directly to schools tocover school maintenance and may even includesome discretionary expenditure at the school

Patterns of Spending on Education 81
level. However, the ministry’s lack of strong fi-nancial management and accountability remainsa constraint. Improvement in school-level man-agement will be key to improved efficiency inthe sector and should be a priority.
An interesting finding related to private ex-penditure on education is that compliance withFPE is neither automatic nor complete. On av-erage, 3% of primary schools continue tocharge registration fees, 2% continue to chargebook fees, and 10% continue to charge otherfees in FPE grades. The compliance is pooreramong community schools. Also interesting isthe finding that among the schools that con-tinue to charge them, fees increased during thefirst two years of FPE implementation.
Even after implementation, total primary feerevenue represents a significant share of totalpublic spending on primary education. We esti-mated the amount by aggregating the total pri-vate expenditure on primary education amongschools which continue to charge various fees;for 2003 the figure is Maloti 44.3 million. Whenwe relate this figure to total primary recurrentspending of Maloti 312.2 million and total edu-cation recurrent of Maloti 874.5 million, weconclude that private expenditures account forabout 13.7% of total primary spending and 5%of total education spending.
In contrast, Lesotho’s secondary schools areallowed to charge many kinds of fees. Almostthree quarters of them charge meals fees whichaverage between 500 maloti and 600 Maloti perstudent per year. The nation’s boarding schools,about a third of the secondary schools, chargelodging fees that average M718 annually. Theother fees charged by secondary schools varyboth by grade and by school type, but averagebetween 773 and 999 maloti, and seem to behighest in community and private schools andlowest in LEC schools.
Private expenditures are very significant at thesecondary level. Comparing the total of Maloti118.6 million to total secondary recurrent spend-ing of Maloti 173.9 million and total educationrecurrent of Maloti 874.5million, we see that
private expenditures account for about 68% oftotal secondary spending and 13.5% of totaleducation spending.
Unfortunately data is not available on theprivate expenditure for higher education stu-dents, although private expenditures may beminimal given that a high proportion of studentsenjoy full scholarships from NMDS.
H. Areas for FurtherPolicy Development
The following areas can be considered forfurther policy development from the aboveanalysis.
1. Lesotho must reduce its overall expenditureon higher education. It must begin with a dia-logue on NMDS and monitor its expendituresas part of the overall spending on education.
2. GOL must make efforts to clarify the mis-sion and objectives of NMDS, strengthen itsmanagement, and increase loan recovery rate.
3. The salary structure for teachers should bereviewed, especially that of secondary teach-ers. Salaries for lower secondary teachersshould be brought more in line with those ofprimary teachers, especially in the context ofbasic education.
4. Financing of non-salary expenditures in pri-mary education could be reviewed so that thegovernment moves from primarily input-based financing to capitation grants withstrengthened school-level management andaccountability.
5. The various bursary and school feeding pro-grams must be harmonized to make themmore efficient and cost-effective.
6. Capacity building at the school level is cru-cial, and would be in line with thegovernment’s overall decentralization. It isconceivable that MOET could start transfer-ring funds directly to those schools that havesome minimum capacity, but they need clearguidelines. Another issue is transparency in

82 Primary and Secondary Education in Lesotho
the use of school fees and other funding toschools: the ministry must establish a strongfinancial management system with strict regu-lations and enforcement agencies. Specialauditors should be put in place to monitorthe use of funds and advise the ministry regu-larly.
7. The financing of secondary education mustbe discussed in a public forum. There is roomto increase the pupil-teacher ratio from 26:1to 30:1. Fees at secondary schools constitutethe largest constraint to enrollment. The min-istry must develop a clear and sustainablepolicy on fees. By making better use of bothfees and subventions in government schools,the ministry could move toward rationaliz-
ing school fees in Lesotho in general. Equityand accountability should be the ultimateconcern for public spending on secondaryeducation.
8. A thorough review of the curriculum is an-other priority. This is important both for theprovision of teachers and textbooks under thetextbook rental program.
9. Finally, it is necessary to distinguish betweenschools that are truly public and private, andto establish a clear and separate strategy forthe financing of the two types of schools atboth the primary and secondary levels. Forexample, if the government indeed starts thecapitation grant, should it be provided to pri-vate schools as well, and if so, how much?
83
hapter 2 briefly documents the perfor-mance of Lesotho’s education systemin aggregate terms, without distin-guishing outcomes across differentpopulation groups. The purpose of this
chapter is to focus on disparities in education,particularly as they pertain to these issues: theparticipation of primary school age children inschool and student flow patterns throughout theprimary cycle including promotion, repetitionand dropout. For each of these topics, we firstaddress descriptive questions: in which segmentsof society are children less likely to attendschool? How have disparities in school atten-dance evolved since the implementation of FreePrimary Education (FPE)? And, how does theperformance of Lesotho’s educational system ap-pear in comparisons cross-nationally and overtime? Following that discussion, we focus onthose factors that determine children’s schoolparticipation and progression through the schoolsystem, using a framework which includes bothdemand and supply-side factors. Finally, we alsoanalyze the disparity in access to public spend-ing among the five income groups by using ben-efit incidence analysis.
We use the following data sources in investi-gating these issues: the 2000 Multiple IndicatorCluster Survey (MICS); and the 2002 Core Wel-
fare Indicators Questionnaire (CWIQ). These arethe most up-to-date household and educationaldata available for Lesotho. Although they dosuffer from some inevitable gaps, on the whole,they are of reasonable quality and provide thecrucial documentation on educational trends thatare needed for educational policy development.
A. Disparities in Enrollment Ratios
By Gender
The concept of “gender equity” takes on a newmeaning in Lesotho. In most other developingcountries, boys usually have higher enrollmentratios than girls. However, in Lesotho, the en-rollment ratio, regardless of how it is measured,is higher for girls than boys in both primary andsecondary schools. Figures 4.1 and 4.2 illustratethis gender gap in gross enrollment and net en-rollment ratios for both primary and secondaryschools between 1996 and 2003. Enrollmentratios of boys lag consistently behind those ofgirls. However, the gap seems to have narrowedsince 1999. Since the gross enrollment ratios aremeasured by dividing the actual enrollment overthe primary school age population (ages 6-12),it is possible that they exceed 100% sometimes.
Disparities in Enrollments, Student Flow,and Benefit Incidence of Public Spending
CHAPTER 4
C

84 Primary and Secondary Education in Lesotho
Figures 4.3 and 4.4 illustrate the grade-spe-cific enrollment ratios by gender for 1999 and2003, respectively. The grade-specific enroll-ment ratios (GSER) are measured by dividingthe total enrollment of a specific grade by thepopulation of children of that age. For example,
the GSER for Standard 1 would be derived bydividing the total Standard 1 enrollment by thepopulation of age 6. Again, it is possible for theGSERs to exceed 100%. For Lesotho, the over-all trend of grade-specific enrollment in gradesStandard 1 through Form E is a declining one.
Figure 4.1Primary Enrollment Ratios by Gender
Figure 4.2Secondary Enrollment Ratios by Gender (Forms A through E)
0.00
0.20
0.40
0.60
0.80
1.00
1.20
1.40
1996 1997 1998 1999 2000 2001 2002 2003
GER Male
GER Female
NER Male
NER Female
NER Male
NER Female
GER Male
GER Female
0
5
10
15
20
25
30
35
40
45
1996 1997 1998 1999 2000 2001 2002 2003 2004

Disparities in Enrollments, Student Flow, and Benefit Incidence of Public Spending 85
Girls are enrolled at higher rates at all gradesthan are boys.
This trend reflects the reality that boys tendto drop out of school, especially after complet-
ing Standard 3, in order to engage in herding athome. Formerly, the economy of Lesotho wasdependent on remittances from migrant work-ers in the gold mines of the Republic of South
Figure 4.3Grade-Specific Enrollment Rates in Primary/Secondary Education, 1999
Figure 4.4Grade-Specific Enrollment Rates in Primary/Secondary Education, 2003
Source: School census and projected population
Source: School census and projected population
Male
Female
Total
0
20
40
60
80
100
120
1 2 3 4 5 6 7 A B C D E
Grade
Perc
enta
ge
Male
Female
Total
01 2 3 4 5 6 7 A B C D E
Grade
Perc
enta
ge
20
40
60
80
100
120
140

86 Primary and Secondary Education in Lesotho
Africa. This was the most remunerative workfor boys. Since work in gold mines did not re-quire much education, boys were expected toengage in herding until they were old enough towork in the gold mines.
Comparing the grade-specific enrollments of1999 and 2003, we see that the GSERs for Stan-dards 1 to 4 are substantially higher in 2003 thanthose of 1999, most likely as a result of the in-troduction of Free Primary Education (FPE) in2000. During the same time period, grade-spe-cific enrollment has not improved from Standard5 to Form E, which is not yet supported by FPE.
By District
Table 4.1 presents the grade-specific enrollmentrates (GSER) of the primary school cycle by dis-trict in 2003.7 While comparing by district pro-vides important insights to the disparity, it shouldbe noted that using the district as the geographi-cal unit attenuates variations within districts,which may be quite significant, as will be notedin Chapter 5.
The overall trend shows that the GSER ex-ceeded 100% in the first four grades; however,
the GSER declined in Standard s 5, 6 and 7.Further, regional disparities in GSER are clearlyvisible: by the end of the primary cycle the GSERwas around 80% in the districts of Maseru andButha Buthe, but much lower in Thaba Tseka(53%) and Quthing (54%).
When we examine the GSER in the second-ary cycle by district (Table 4.2), the magnitudeof the disparity is much larger than that of pri-mary education. The GSER in the entry gradeof the secondary cycle (Form A) was around60% in the districts of Butha-Buthe, Leribe, andMaseru. However, it was much lower in moun-tainous areas such as Thaba-Tseka (20%) andMokhotling (35%). The GSER in all districtsdeclined continuously from the beginning to theend of the secondary cycle, where it hovered atonly around 20%. By the final grade (Form E),the GSERs in Butha-Buthe (22%) and Maseru(22%) were among the two highest recorded;
7 School-aged population by district is estimated bythe author. As soon as the revised projection atthe district level is available, the district level analy-sis will be updated.
Table 4.1Grade-Specific Enrollment Rate by District in Primary Cycle, 2003
G1 G2 G3 G4 G5 G6 G7
Butha Buthe 112 120 137 145 89 84 76
Leribe 112 106 115 123 77 76 73
Berea 107 104 117 122 70 72 66
Maseru 122 113 123 131 83 84 80
Mafeteng 118 114 115 122 70 71 69
Mohale’s Hoek 126 118 122 128 74 68 68
Quthing 122 112 111 119 62 63 54
Qacha’s Neck 138 135 128 128 74 72 68
Mokhotlong 152 126 126 118 71 73 63
Thaba Tseka 146 125 117 109 61 64 53
Source: School census and World Bank projected population

Disparities in Enrollments, Student Flow, and Benefit Incidence of Public Spending 87
the GSERs in Form E in districts likeMokhotlong (9%) and Thaba-Tseka (4% per-cent) were extremely low.
B. Non-Participation AmongPrimary School Age Children
Another measure of school participation is theproportion of children who have never attendedschool. This section gives an overview of the riskof non-participation in schooling among 6–14year-old children. After discussing the incidenceof non-participation and its trend over time, wefocus on the demand and supply-side factorswhich may influence the probability of neverattending school.
The empirical evidence discussed below isbased on data from the 2000 MICS, the 2002CWIQ and the 2000 primary school census.Each of these surveys contributes distinctivekinds of information. In addition to the dataabout school registration, the MICS providesdetailed information on the grades children areattending in two consecutive school years. TheCWIQ contains less complete information about
school attendance; however it has the advan-tage of supplying information on the distanceto the nearest primary school. By comparing thesame indicators for 2000 and 2002 we were ableto better understand the impact of FPE on theseindicators.
Socio-economic Disparities overthe 2000–2002 Period
Table 4.3 summarizes the socio-economic dis-parities in school participation for children be-tween the ages of 6–14 over the period of 2000–2002. We begin by examining the state ofchildren’s school participation in 2002 and thendiscuss the trends over time.
In 2002, 10% of the children in Lesotho aged6–14 had never attended school. This overallpercentage masks wide gender differences:while13% of boys in this age group did not at-tend school, only 7% percent of girls did not.An even more striking disparity exists betweendistricts. For example, 20% of the children inQuthing and Taba Tseka never attended schoolas compared to only 5% in Leribe and around7% in Berea and Maseru.
Table 4.2Grade-Specific Enrollment Rate by District in Secondary Cycle
A B C D E
Butha-Buthe 62 51 35 30 22
Leribe 57 48 33 27 18
Berea 39 32 24 17 13
Maseru 62 50 38 29 23
Mafeteng 52 42 32 23 18
Mohale’s Hoek 38 29 21 17 13
Quthing 39 33 21 17 12
Qacha’s Neck 53 42 34 22 17
Mokhotlong 35 32 21 16 9
Thaba-Tseka 20 18 11 6 4
Source: School census and World Bank projected population

88 Primary and Secondary Education in Lesotho
Socioeconomic differences reflected in schoolattendance are also large. The gap in the schoolparticipation rate in 2002 was around 10 per-centage points between children from the poor-est income quintile and those who belong to therichest families. Although the prevalence of or-
phanhood is large in Lesotho—16% of childrenbelow the age of 15 have lost one or both par-ents (see Annex 4.1)—results in Table 4.5 indi-cate that orphanhood did not prevent childrenfrom going to school. In 2000, the latest yearfor which information on orphans is available,
Table 4.3Children Between 6 and 14 Years Old Who Have Never Been to School, Lesotho 2000 and 2002 (Percentage)
Differences with Respect to the2000 2002 Difference Lowest Value in Each Category
(1) (2) (2)–(1) 2000 2002
Lesotho 10.6 10.1 –0.5 — —
Gender
Boys 13.6 13.3 –0.3 6.0* 6.3*
Girls 7.6 7.0 –0.6 0 0Income group
Poorest 20.4 17.4 –3.0* 15.8* 10.8*
Second 13.3 12.5 –0.8 8.7* 5.9*
Middle 9.5 8.3 –1.2 4.9* 1.7*
Fourth 5.8 5.4 –0.4 1.2 –1.2
Richest 4.6 6.6 2.0* 0.0 0.0
Area
Urban 6.8 5.1 –1.7* 0 0
Rural 11.5 11.4 –0.1 4.7* 6.3*
District
Butha Buthe 6.3 7.8 1.5 11.8* 4.1*
Leribe 6.6 5.2 –1.4 11.5* 6.7*
Berea 8.3 7.0 –1.3 9.8* 4.9*
Maseru 9.9 7.5 –2.4* 8.2* 4.4*
Mafeteng 8.4 8.2 –0.2 9.7* 3.7*
Mohale Hoek 11.6 14.5 2.9* 6.5* –2.6*
Quthing 16.6 20.0 3.4* 1.5 –8.1*
Qacha’s Nek 10.5 12.9 2.4* 7.6* –1.0
Mokhotlong 18.1 11.9 –6.2* 0.0 0.0
Thaba Tseka 17.5 19.1 1.6 0.6 –7.2*
* = difference statistically significant at 5%.
Source: Author’s calculation based on the 2000 MICS survey and the 2002 CWIQ survey

Disparities in Enrollments, Student Flow, and Benefit Incidence of Public Spending 89
10.6% of children who had lost at least oneparent had never attended school as comparedwith10.4% of children with both parents alive.The difference is negligible and not significantstatistically.
Did the implementation of the FPE in 2000help reduce the socioeconomic disparities inschooling investments and attract out-of-schoolchildren to school? Although it is probably tooearly to answer this question conclusively, re-viewing the patterns of school participation overthe period 2000–2002 provides some insights.
As Table 4.3 illustrates, the percentage ofpupils who never attended school remained prac-tically unchanged during the first three years ofthe implementation of the FPE. Over this pe-riod, neither boys’ nor girls’ participation ratesin school made significant progress. However,there was progress in narrowing the attendancedisparity between the poor and the rich. Theproportion of children from 20% of the poor-est families who had never attended school de-creased significantly from 20% to only 17%,while interestingly, the proportion of childrenfrom the top of the income distribution appears
to have deteriorated (non-participation rate in-creased from 4.6% to 6.6% during the sametime period).
In this regard, several points are noteworthy.Among the very poor, the increase in the schoolparticipation rate was evident among the oldestchildren more than the youngest. As shown inTable 4.4, in 2000, 15.5% of children aged 9 to14 from the poorest income quintile had neverattended school in 2000; this figure was 11% in2002. For children younger than 9 years, how-ever, these percentages remained practically un-changed at 29% to 30% at both time points. Bycontrast, the youngest children in other socio-economic brackets gained more than the oldest,except for those belonging to the richestquintiles. As a result, the age of new entrantsinto Standard 1 decreased significantly over the2000–2002 period, from 8.6% to 7.3% on av-erage.8 While the decrease benefited the rich
Table 4.4Children Who Have Never Been to School by Age and Income Groups, Lesotho 2000–2002 (Percentage)
Age of New Entrants in2000 2002 Standard 1 (in years)6–8 9–14 6–8 9–14 Decrease
years years Total years years Total 2000 2002 (%)
Income Group
Poorest 29.6 15.5 20.4 28.7 10.7 17.4 9.1 7.6 16.5
Second 23.6 8.6 13.3 19.6 8.9 12.5 8.8 7.2 18.2
Middle 18.6 5.7 9.5 16.1 4.6 8.3 8.7 7.3 16.1
Fourth 11.9 3.2 5.8 13.6 2.1 5.4 8.5 7.1 16.5
Richest 8.1 2.9 4.6 16.0 1.5 6.6 8 7 12.5
Total 18.2 7.0 10.6 19.0 5.7 10.1 8.6 7.3 15.1
Source: Author’s calculation based on the 2000 MICS survey and the 2002 CWIQ survey.
8 School census data also confirm that the age ofnew entrants in Standard 1 has diminished since2000; see Annex 4.2.

90 Primary and Secondary Education in Lesotho
more than the poor, the age of new entrants inStandard 1 among the children in 20% of thepoorest households decreased in a non-negligibleproportion too, from 9.1 years old to 7.6 yearsold over the same period.
With regard to geographical disparities,Table 4.3 shows that the proportion of chil-dren from urban areas who have never attendedschool decreased significantly from 2000 to2002, albeit modestly. In the same period, theparticipation rate of children in rural areas re-mained unchanged at about 11%. While theschool attendance situation in Maseru andMokhotlong districts improved in 2002 (by2.4% and 6.2% respectively), attendance inMohale Hoek, Quthing and Qacha’s Neck ap-peared to worsen (by 2.9%, 3.4% and 2.4 %,respectively).
The Determinants of School Participation
This section addresses the probability of neverattending school for 6–14 year old children inLesotho, using multivariate survival analysis. Afirst set of regression models attempts to explainthe school participation in 2000 and 2002 byadjusting the probability of never attendingschool using child and household characteris-tics and location, including the distance fromthe nearest primary school. In a second type ofspecification, we include school quality variablesamong the determinants of school participation.Due to inconsistencies in the data, we evaluatedthe impact of school quality for the year 2002only, by merging the 2002 CWIQ survey withthe corresponding school census. Because match-ing these two datasets is somewhat problematic,our results in this model are only speculative, aswe explain in more detail below.
The Probability of Having Never Beento School as a Function ofDemand-side Factors.
In estimating these probabilities, we used thewhole sample of children aged 6–14. We also
calculated the probabilities for 3 subgroups:children aged 6–8, 9–12 and 13–14. The regres-sion models follow a logit specification. The re-sults for 2000 and 2002 are presented in Table4.5 in terms of the marginal effects of the vari-ables. Sample means are reported in Annex 4.3.
These analyses yield interesting findings onschool attendance in Lesotho. The results showthat, holding all other variables constant, boyswere less likely to attend school than girls. Thegender gap, estimated at 4.9 percentage pointsin 2000, decreased slightly over time and in 2002was estimated to be 4.6 percentage points. Asdiscussed earlier, orphans did not have a signifi-cant risk of non-participation in school as com-pared with non-orphans.
The education of the head of the householdproved to be a significant predictor of children’sschool attendance. Holding all other variablesconstant, the children whose father/mother hada primary-school education showed a probabil-ity of attending school that was 3.8 percentagepoints higher than children living with an illit-erate household head. The effect was even morepronounced—4.7 percentage points—for chil-dren living with a household head who had asecondary school diploma or higher. It is espe-cially noteworthy that the education level of achild’s mother or father appears to affect thechild’s school participation rate at a very earlyage. As summarized in Table 4.5, the educationlevel of the household head played a central rolewhen children were 6–8 years old by reducingtheir non-participation rate by up to 12 percent-age points.9
Regarding household income, results showthat children from poor families were more likelynot to attend school. This result is consistentwith the evidence presented earlier. It is impor-tant to note, however, that the effect of povertyon attendance appears to be diminishing overtime. The non-participation gap between chil-dren from the bottom and the top quintiles of
9 In 2002.

Disparities in Enrollments, Student Flow, and Benefit Incidence of Public Spending 91
Tabl
e 4.
5Pr
obab
ility
of H
avin
g N
ever
Bee
n to
Sch
ool A
mon
g Ch
ildre
n A
ged
6–14
, Les
otho
200
0–20
02 a
Mar
gina
l effe
cts
2000
2002
Who
le6–
89–
1213
–14
Who
le6–
89–
1213
–14
Sam
ple
yea
rsye
ars
year
sSa
mpl
eye
ars
year
sye
ars
Child
Cha
ract
eris
tics
Age
–0.0
17**
*–0
.095
***
–0.0
06**
–0.0
03–0
.018
***
–0.1
11**
*–0
.005
*0.
003
Boy
(Girl
)0.
049**
*0.
052**
*0.
040**
*0.
065**
*0.
046**
*0.
051**
*0.
026**
*0.
053**
*
Orph
anho
od S
tatu
s (b
oth
pare
nts
aliv
e)M
othe
r aliv
e-fa
ther
dea
d0.
014
–0.0
070.
022
0.01
3—
——
—Fa
ther
aliv
e-m
othe
r dea
d–0
.015
–0.0
28–0
.001
–0.0
27*
——
——
Both
par
ents
dea
d0.
012
–0.0
500.
034
–0.0
03—
——
—H
ouse
hold
Hea
d Ch
arac
teri
stic
sM
ale
(fem
ale)
–0.0
16–0
.024
–0.0
25**
0.00
7–0
.002
–0.0
270.
012*
0.00
3Ag
e (in
yea
rs)
0.00
1***
0.00
2***
0.00
0*0.
000
0.00
1**0.
001*
0.00
00.
000
Educ
atio
n (n
o sc
hool
ing)
Prim
ary
educ
atio
n–0
.034
***
–0.0
36**
–0.0
38**
*–0
.020
*–0
.038
***
–0.0
91**
*–0
.015
**–0
.013
*
Seco
ndar
y or
hig
her e
duca
tion
–0.0
47**
*–0
.073
***
–0.0
40**
*–0
.024
**–0
.047
***
–0.1
17**
*–0
.026
***
–0.0
03H
ouse
hold
Inco
me
Gro
up (p
oore
st)
Seco
nd–0
.027
***
–0.0
40**
–0.0
20**
*–0
.016
**–0
.011
–0.0
35–0
.003
–0.0
05M
iddl
e–0
.039
***
–0.0
56**
–0.0
32**
*–0
.018
**–0
.024
***
–0.0
43*
–0.0
15**
–0.0
07Fo
urth
–0.0
59**
*–0
.099
***
–0.0
44**
*–0
.030
***
–0.0
38**
*–0
.069
***
–0.0
27**
*–0
.008
Rich
est
–0.0
67**
*–0
.126
***
–0.0
38**
*–0
.042
***
–0.0
21*
0.00
6–0
.030
***
–0.0
21*
Hou
seho
ld C
ompo
sitio
nM
embe
rs le
ss th
an 6
yea
rs o
ld (%
)–0
.012
–0.0
52–0
.003
0.03
80.
084**
*–0
.088
0.03
10.
027
Mem
bers
mor
e th
an 1
4 ye
ars
old
(%)
–0.0
63**
*–0
.231
***
–0.0
320.
013
0.06
7***
–0.0
640.
009
0.02
9D
ista
nce
to N
eare
st P
rim
ary
Scho
ol(<
15 m
inut
es)
15–2
9 m
inut
es—
——
—0.
004
0.01
10.
003
0.00
430
–44
min
utes
——
——
0.02
9**0.
075**
0.00
90.
011
(cont
inue
d on
nex
t pag
e )

92 Primary and Secondary Education in Lesotho
Tabl
e 4.
5 (co
ntin
ued)
Prob
abili
ty o
f hav
ing
neve
r bee
n to
sch
ool a
mon
g ch
ildre
n ag
ed 6
–14,
Les
otho
200
0–20
02 a
Mar
gina
l effe
cts
2000
2002
Who
le6–
89–
1213
–14
Who
le6–
89–
1213
–14
sam
ple
yea
rsye
ars
year
ssa
mpl
eye
ars
year
sye
ars
45–5
9 m
inut
es—
——
—0.
032**
0.09
0**0.
011
0.01
4>
59 m
inut
es—
——
—0.
048**
*0.
079**
0.03
4**0.
028
Livi
ng in
Rur
al A
rea
(urb
an)
–0.0
050.
004
–0.0
170.
005
0.02
8***
0.08
0***
–0.0
010.
020**
Dis
tric
t (B
utha
-But
he)
Lerib
e–0
.005
0.00
30.
002
–0.0
30**
–0.0
10–0
.025
–0.0
25**
*–0
.004
Bere
a0.
012
0.03
60.
017
–0.0
24*
–0.0
03–0
.012
–0.0
16–0
.024
***
Mas
eru
0.04
7*0.
138*
0.00
9–0
.009
–0.0
05–0
.017
–0.0
16–0
.002
Maf
eten
g0.
016
–0.0
010.
053
–0.0
28**
0.00
0–0
.054
0.03
6–0
.003
Moh
ale
Hoek
0.03
40.
040
0.05
1–0
.016
0.04
9*0.
068
0.02
60.
015
Quth
ing
0.10
7***
0.16
7**0.
083*
0.04
20.
098**
*0.
144**
0.07
2*0.
004
Qach
a’s
Nec
k0.
027
0.07
00.
018
–0.0
170.
059**
0.07
50.
050
0.01
8M
okho
tlong
0.04
70.
085
0.04
5–0
.002
0.02
40.
016
0.01
70.
025
Thab
a Ts
eka
0.04
80.
041
0.06
6–0
.004
0.04
3*0.
027
0.03
40.
038
Num
ber o
f Obs
erva
tions
6,89
32,
178
3,12
61,
589
5,55
31,
765
2,41
01,
378
Pseu
do R
?0.
138
0.13
50,
134
0,16
90.
170
0.14
10.
175
0.22
9
a / Log
it m
odel
with
sta
ndar
d er
rors
adj
uste
d fo
r clu
ster
ing.
Dum
my
varia
bles
with
the
omitt
ed c
ateg
ory
indi
cate
d in
par
enth
eses
. Mar
gina
l effe
cts
are
com
pute
dat
the
sam
ple
mea
n fo
r con
tinuo
us v
aria
bles
; for
dum
my
varia
bles
, the
pro
babi
lity
deriv
ativ
es in
dica
te th
e ch
ange
in p
roba
bilit
y as
the
varia
ble
is c
hang
ed fr
om0
to 1
, whi
le h
oldi
ng a
ll ot
her v
aria
bles
at t
heir
mea
ns.
* = si
gnifi
cant
at 1
0%; **
= si
gnifi
cant
at 5
%; *
**=s
igni
fican
t at 1
%.
Sour
ce: A
utho
r’s c
alcu
latio
n ba
sed
on th
e 20
00 M
ISC
Surv
ey a
nd th
e 20
02 C
WIQ
Sur
vey .

Disparities in Enrollments, Student Flow, and Benefit Incidence of Public Spending 93
Table 4.6Distribution of Children by Distance to Nearest Primary School, Lesotho 2002(Percentage)
>30 minutes<15 15–29 30–44 45–59 >59
minutes minutes minutes minutes minutes Total Total
Area
Urban 25.3 34.9 23.9 7.6 8.4 39.8 100.0
Rural 19.2 21.4 23.0 12.9 23.5 59.4 100.0
Total 20.8 24.9 23.2 11.5 19.7 54.4 100.0
Currently Enrolled
Urban 25.8 35.3 23.5 7.8 7.7 38.9 100.0
Rural 20.0 22.1 22.9 12.4 22.7 57.9 100.0
Total 21.6 25.8 23.0 11.1 18.4 52.5 100.0
Have Never Been to school
Urban 24.7 19.2 24.7 6.9 24.7 56.2 100.0
Rural 13.2 17.6 23.8 15.2 30.2 69.2 100.0
Total 14.5 17.8 23.9 14.2 29.6 67.7 100.0
District
Butha Buthe 28.6 25.8 24.9 9.8 10.9 45.6 100.0
Leribe 17.9 27.4 22.9 10.1 21.7 54.7 100.0
Berea 17.6 24.1 24.9 13.4 20.0 58.3 100.0
Maseru 22.8 25.0 17.0 9.7 25.6 52.2 100.0
Mafeteng 21.0 19.1 22.0 16.1 21.8 59.9 100.0
Mohale Hoek 8.1 23.5 32.4 8.5 27.5 68.4 100.0
Quthing 9.0 27.9 24.2 18.0 20.9 63.1 100.0
Qacha’s Nek 31.6 24.8 23.6 9.7 10.2 43.5 100.0
Mokhotlong 32.3 28.0 19.8 8.4 11.6 39.8 100.0
Thaba Tseka 17.4 22.7 20.7 11.9 27.4 59.9 100.0
Total 20.8 24.9 23.2 11.5 19.7 54.4 100.0
Source: author’s calculation based on the 2002 CWIQ Survey
the income distribution was estimated at 6.7percentage points in 2000, but dropped to 2.1percentage points in 2002.
Accessibility to school is a major determinantof school participation. In Lesotho, in 2002,54% of children of primary school age lived at
least 30 minutes from a school (see Table 4.6).In rural areas, the percentage of children living30 minutes or more from a school rises to around60% on average. It is noteworthy that 30% ofrural children who never attended school livedat least 60 minutes away from a primary school.

94 Primary and Secondary Education in Lesotho
Regression results in Table 4.5 also confirmthat distance had a significant impact onchildren’s school participation rate. Reducingthe time needed to reach school from one hourto less than 15 minutes reduced the probabil-ity of never attending school by 3 percentagepoints on average and by 9 percentage pointsfor children in the 6–8 age group. Reducingthe distance to school by building more schoolsmakes it more attractive for families to sendtheir children to school at a younger age andprobably reduces the probability that childrenwill drop out.
The Impact of School SupplyCharacteristics on School Attendance
In this section, we examine the impact of schoolcharacteristics on the probability of never hav-ing attended school. The data are from the 2002CWIQ survey and the 2002 primary school cen-sus. These datasets were matched on the basisof the enumeration area codes. The 2002 CWIQincludes 255 enumeration areas. Unfortunatelyhowever, for many primary schools in the cen-sus, enumeration area codes are unknown or in-correct. Using only the accurate enumerationcodes made it possible to merge the two datasetsfor 122 enumeration areas. After excluding ar-eas with no school (because we were not abso-lutely sure that these areas had no school) wewere left with a total of 2096 children aged 6–14 in 90 enumeration areas.
Table 4.7 shows the results of the calculationsconducted on the whole sample of children aswell as on the sub-samples of children livingwithin 30 minutes of a primary school and thoseliving farther away. We estimated a logit speci-fication with demand-side variables identical tothose considered in the previous section.10 Thesupply-side variables include the averages of thefollowing variables estimated at the enumera-tion area level: the percentage of pupils with noseat and no desk (which is a proxy indexing thephysical condition of the school), the percent-age of unqualified teachers, the pupil-teacher
ratio, and the percentage of schools offering anincomplete cycle of instruction.
Focusing only on the impact of the supply-side variables, the results in Table 4.7 show thatamong the school characteristics included in themodel, only the percentage of pupils with noseat and no desk is significant. According to ourresults, living in an area where schools are inbad physical condition significantly discouragesfamilies from sending their children to school.The effect of this factor is quite important inthe household decision of whether or not to senda child to school, when differences across house-holds are held constant. Improving the physicalconditions of the schools by 10% increases theschool participation rate up to 28%. It is note-worthy that this factor matters more to familiesthan other factors including the teacher’s quali-fications, pupil-teacher ratio, or the incomplete-ness of the cycle of instruction offered by schoolsin the neighborhood. Interestingly, using distanceto school as a predictor in a regression model,we found that the physical conditions of theschools have a significant negative impact onthe participation rate of the children who liveclose to the school. For those children living far-ther away, the distance itself is the barrier toschool attendance; factors such as schoolphysical condition, teacher qualifications, or thepupil-teacher ratio become secondary.
C. Transition of Children Throughand Out of School
In this section we examine the movement ofchildren through or out of school and the de-terminants of that movement. The data for theseanalyses come from the 2000 MICS survey per-taining to those students who registered inschool in 1999. Because the MICS survey gives
10 Location of the household is excluded becausemost of the enumeration areas included in thesample pertain to rural areas.

Disparities in Enrollments, Student Flow, and Benefit Incidence of Public Spending 95
Table 4.7Estimates of the Probability of Having Never Been to School, Lesotho 2002 — Children 6–14 years olda—With School Characteristics—
Distance to nearest primary schoolLess or equal More than
Whole Sample to 30 minutes 30 minutesSample Marginal Sample Marginal Sample MarginalAverage Effect Average Effect Average Effect
Child Characteristics
Age (in years) 10.12 –0.019*** 10.11 –0.015*** 10.13 –0.022***
Boy (girl) 50.1 0.067*** 51.7 0.026*** 48.3 0.116***
Household Head Characteristics
Male (female) 67.3 0.003 66.0 0.000 68.7 0.008
Age (in years) 50.4 0.001*** 49.4 0.001*** 51.5 0.001
Education (no schooling)
Primary education 55.1 –0.024** 53.8 –0.001 56.5 –0.048**
Secondary or higher education 11.0 –0.052*** 15.4 –0.029*** 6.0 –0.079***
Household Income Group (poorest)
Second 24.5 –0.009 23.5 –0.022* 25.6 0.028
Middle 20.8 –0.025* 22.1 –0.008 19.3 –0.036
Fourth 14.4 –0.057*** 15.5 –0.032*** 13.2 –0.069***
Richest 8.7 –0.031* 12.9 –0.018 4.0 –0.076**
Household Composition
Members less than 6 years old (%) 15.7 0.056 15.6 0.083* 15.7 –0.043
Members more than 14 years old (%) 54.4 0.106*** 54.2 0.070* 54.5 0.105
District (Butha-Buthe)
Leribe 8.0 –0.021 6.8 0.011 9.3 –0.059
Berea 6.1 –0.002 7.5 0.064 4.4 –0.084***
Maseru 7.8 –0.045** 9.7 –0.009 5.6 –0.092
Mafeteng 7.2 0.024 8.8 0.005 5.4 0.046
Mohale Hoek 9.7 0.057 5.5 0.081 14.5 0.011
Quthing 5.3 0.137* 4.4 0.057 6.4 0.120
Qacha’s Nek 16.8 0.086* 18.5 0.118** 14.8 0.020
(continued on next page)
information on the students’ schooling statusin two consecutive years (1999 and 2000), it ispossible to identify whether children enrolledin 1999 drop out, advance, or repeat in 2000.
After presenting descriptive information onchildren’s movement through school, we exam-ine the correlation of dropping out, repetitionand promotion. Because enumeration area

96 Primary and Secondary Education in Lesotho
Table 4.7 (continued)Estimates of the Probability of Having Never Been to School, Lesotho 2002 — Children 6–14 years olda—With School Characteristics—
Distance to nearest primary schoolLess or equal More than
Whole Sample to 30 minutes 30 minutesSample Marginal Sample Marginal Sample MarginalAverage Effect Average Effect Average Effect
Mokhotlong 13.8 0.026 18.4 0.021 8.6 0.076
Thaba Tseka 19.6 0.040 13.0 0.060 27.2 0.031
Distance to Nearest Primary School (<15 minutes)
15–29 minutes 24.0 0.021 — — — —
30–44 minutes 21.7 0.041* — — — —
45–59 minutes 9.0 0.043 — — — —
>= 60 minutes 15.9 0.072*** — — — —
Quality of Education in the EA (average over schools)
Pupils with no seat and no desk (%) 36.9 0.028* 33.5 0.044*** 40.7 0.015
Unqualified teachers (%) b 35.3 0.020 32.5 0.003 38.5 0.032
Pupils-Teacher ratio 52.27 0.000 51.81 0.000 52.80 0.000
Schools with incomplete cycle of instruction (%) c 20.7 –0.002 0.16 –0.019 26.4 0.026
Average dependent variable (%) 12.7 — 9.1 — 16.9 —
Number of observations 2,096 — 1,119 — 977 —
Pseudo R? — 0.195 — 0.234 — 0.194
a/ Logit model with standard errors adjusted for clustering. Dummy variables with the omitted category indicated inparentheses. Marginal effects are computed at the sample mean for continuous variables; for dummy variables, theprobability derivatives indicate the change in probability as the variable is changed from 0 to 1, while holding all othervariables at their means.b/ Percentage of teachers with Primary School Education, Junior Certificate and Cambridge Overseas SchoolCertificatec/ Percentage of primary schools in the enumeration not offering the full 7 grades of primary schooling*= significant at 10%; **= significant at 5%; *=significant at 1%
Source: Author’s calculations based on the 2002 CWIQ survey and the 2002 primary school census
codes are not fully documented in the MICSsurvey, matching this survey with the schoolcensus was problematic and we could not ana-lyze the impact of school quality on school out-
comes. For this reason, we focused in theseanalyses only on the impact of the demand-sidefactors on the three school participation out-comes.

Disparities in Enrollments, Student Flow, and Benefit Incidence of Public Spending 97
Table 4.8Promotion, Repetition, and Dropout Rates During Two Consecutive Years in a Cohort of Children Enrolledin Primary Education in 1999, Lesotho 2000 (Percentage)
Advance Repeat Drop Out
Whole Sample 83.5 10.7 5.8
Grade in Previous Year
Standard 1 69.2 25.1 5.8
Standard 2 88.9 7.2 4.0
Standard 3 87.2 7.1 5.8
Standard 4 92.0 4.3 3.7
Standard 5 91.7 5.5 2.8
Standard 6 85.1 5.4 9.5
Standard 7 69.2 10.0 20.8
Gender
Boys 82.5 11.9 5.7
Girls 84.5 9.5 6.0
Income group
Poorest 82.1 10.4 7.5
Second 80.3 9.3 10.4
Middle 83.0 10.7 6.2
Fourth 82.8 12.8 4.4
Richest 88.4 9.6 2.0
Orphanhood Statusa
Both parents alive 84.4 12.5 3.2
Mother alive, father dead 86.3 10.2 3.5
Father alive, mother dead 82.9 11.4 5.7
Both parents dead 84.5 7.1 8.3
Area
Urban 88.2 8.0 3.9
Rural 82.3 11.3 6.3
(continued on next page)
Disparities in Student Flow Patterns
Table 4.8 presents an overview of Lesotho’s stu-dent flow profile through the seven-year primarycycle for those children who were registered in1999. Overall, 84% of the 6–14 years olds en-
rolled in primary education advanced to the nextgrade, 11% repeated and 6% dropped out.However, these averages hide a more nuancedstory. Grade repetition occurred most frequentlyin the first grade where fully 25% of the chil-dren repeated the year and 6% dropped out.

98 Primary and Secondary Education in Lesotho
Sixty-nine percent of first grade students movedon to Standard 2. After Standard 1, repetitionand drop-out rates were generally much smaller.However a large proportion of pupils—10%—left school at the end of Standard 6. Among thosechildren enrolled in Standard 7, around 70%continued their secondary education, 21%dropped out and 10% repeated.
When comparing boys and girls, repetitionappears to be more frequent among boys thangirls. On average, 12% of boys repeated as com-pared with 9.5% of girls. However, girls seemto be more likely to drop out than boys espe-cially at the end of Standard 6 and Standard 7.On average, only slightly more girls than boysdropped out (5.7% as compared to 6%). How-ever, in Standard s 6 and 7, the differences be-tween genders are quite striking: 7% of boysdrop out of school at the end of Standard 6 com-pared with 11% of girls; 23% of girls leave theeducation system at the end of Standard 7 com-pared with 18% of boys.11
The effects of socio-economic status on drop-out rates are pronounced, particularly at thebeginning and end of primary education. Re-
sults reported in Annex Table A3 show, for ex-ample, that 10% of the children from the poor-est families drop out of school at the end of Stan-dard 1 compared with less than 1% of thosefrom the richest households. Even more dramati-cally, while 11% of the children from the rich-est group left school at the end of Standard 7,more than 45% of the children from the poor-est families left the education system at this stage.
Orphans are more at risk for dropping out ofschool than non-orphans. The differences areparticularly obvious at the beginning of the pri-mary cycle. For example, 13% of the childrenwho have lost both parents dropped out at theend of Standard 1 as compared with 5% for non-orphans.12
Not surprisingly, geographic location is alsoan important factor in drop-out rates. As find-ings in Table 4.8 indicate, students in rural ar-eas are particularly prone to drop out or repeatcompared with their urban counterparts. Simi-
District
Butha Buthe 88.2 3.8 8.0Leribe 81.6 13.4 5.1Berea 83.3 9.6 7.2Maseru 84.5 9.6 5.9Mafeteng 82.1 13.2 4.7Mohale Hoek 84.4 10.0 5.6Quthing 81.3 10.9 7.7Qacha’s Neck 84.2 10.3 5.4Mokhotlong 86.2 10.1 3.7Thaba Tseka 81.9 13.5 4.6
a/ Among children aged 6–14.Source: Author’s calculation based on the 2000 MISC Survey
Table 4.8 (continued)Promotion, repetition, and dropout rates during two consecutive years in a cohort of children enrolled inprimary education in 1999, Lesotho 2000 (percentage)
Advance Repeat Drop out
11 See Annex 4.4.12 See Annex 4.4.

Disparities in Enrollments, Student Flow, and Benefit Incidence of Public Spending 99
lar differences are found across districts in thepatterns of student flow. While the repetitionrate is low among students in Butha-Buthe (lessthan 4%), it varies between 10% and 14% inothers. On average, drop-out rates vary between4% and 8% depending on the district; the low-est are seen in Mokhotlong, Thaba Tseka andMafeteng.
Regression Estimates of The Correlationof Student Flow Patterns
Table 4.9 shows the adjustment of the threeschool outcomes using a multinomial logit speci-fication. Because the regressions use a sampleof children who registered for school in the pre-vious year as described in the section above, these
Table 4.9Estimated Probabilities of Advancing, Repeating, and Dropping out in a Cohort of Children Aged 6 to14,Lesotho 2000a
Marginal Effectsc
Sample Averageb Advance Repeat Drop out
Child Characteristics
Age (in years) 11.2 0.016*** –0.020*** 0.004***
Boy (girl) 47.5 –0.026*** 0.025* 0.001
Orphanhood status (both parents alive)
Mother alive, father dead 13.5 0.005 –0.005 –0.001
Father alive, mother dead 2.9 0.008 –0.015 0.007
Both parents dead 2.0 –0.014 –0.022 0.036*
Grade
Standard 2 21.9 0.097*** –0.081*** –0.015***
Standard 3 17.9 0.076*** –0.066*** –0.010***
Standard 4 13.9 0.096*** –0.078*** –0.017***
Standard 5 9.9 0.086*** –0.066*** –0.020***
Standard 6 5.5 0.048*** –0.031** –0.017***
Standard 7 1.5 –0.071 0.075 –0.005
Household Head Characteristics
Male (female) 72.7 –0.009 0.003 0.006
Age (in years) 51.0 0.000 0.000 0.000
Education (no schooling)
Primary education 61.7 0.022** –0.038*** –0.008**
Secondary or higher education 17.3 0.028* –0.017* –0.011*
Household Income Group (poorest)
Second 18.4 0.005 –0.003 –0.002
Middle 21.9 0.001 0.002 –0.003
(continued on next page)

100 Primary and Secondary Education in Lesotho
regressions are endogenously selected and arenot free from selectivity bias. As in the previoussection, the three dependent variables are relatedto child and household characteristics, and arecontrolled for the grade where the student wasenrolled in the previous year.
Many of the results summarized in Table 4.9confirm the patterns found in the cross-tabula-tions presented earlier. Significant differences didexist across gender:—with the effect of all othervariables held constant, boys were more proneto repeat than girls. After controlling for gradelevel, older students were significantly morelikely to repeat or drop out than younger stu-dents. While double orphans (i.e., children who
have lost both parents) and non-orphans had asimilar likelihood of attending school, orphanshad a higher probability of dropping out. Thedifferential rate of dropping out between or-phans and non-orphans is around 4 percentagepoints.
The education level of the head of a child’shousehold had a strong effect on child outcomes.Compared to the children with household headswith primary education, children coming fromhouseholds where the household head was illit-erate were much more likely to repeat andslightly more likely to drop out compared withchildren from households where the householdhead had a primary school education. House-
Table 4.9Estimated probabilities of advancing, repeating, and dropping out in a cohort of children aged 6 to14,Lesotho 2000a
Marginal effectsc
Sample averageb Advance Repeat Drop out
Fourth 23.3 –0.017 0.029* –0.012***
Richest 23.6 0.025 0.004 –0.028***
Household Composition
Members less than 6 years old (%) 10.6 –0.032 0.010 0.023
Members more than 14 years old (%) 51.9 0.058 –0.042 –0.015
Living in rural area (urban area) 79.6 –0.033*** 0.041*** –0.008
Advance 88.7 — — —
Repeat 9.4 — — —
Drop out 1.9 — — —
Number of observations 3,617 — — —
Pseudo R? — 0.123
a/ Probability of being in the indicated schooling status in 2000 among those enrolled in 1999. Multinomial logit modelwith standard errors adjusted for clustering. Dummy variables with the omitted category indicated in parentheses.b/ Sample means of dummies variables expressed in percentage.c/ Marginal effects are computed at the sample mean for continuous variables; for dummy variables, the probabilityderivatives indicate the change in probability as the variable is changed from 0 to 1, while holding all other variablesat their means.*= significant at 10%; **= significant at 5%; ***=significant at 1%.
Source: Author’s calculation based on the 2000 MISC Survey

Disparities in Enrollments, Student Flow, and Benefit Incidence of Public Spending 101
hold income made a difference too, but onlybetween children from the richest 40% of house-holds and the rest of the population: the chancesof dropping out were 3 percentage points loweramong children from the most privileged back-grounds compared with those in the rest of thedistribution. Location of the residence was alsoa significant factor: as compared with urbanchildren, rural children were less likely (by 3.3percentage points) to advance in school andmore likely to repeat a grade (by about 4 per-centage points).
E. Incidence of Public Spendingby Income Group
Does Lesotho use its public resources for edu-cation to assist the poor? We used a benefit-in-cidence analysis to investigate how much disad-vantaged groups of the society benefit from pub-lic spending on education. In this study, the ben-efit-incidence analysis was conducted using the2002 Core Welfare Indicator Questionnaire(CWIQ) data. Because there is no available in-
formation on household income, a socioeco-nomic index was created based on the eight pov-erty-indicating questions to measure the house-hold economic level.13 The evidence shows that,overall, public spending on education and train-ing in Lesotho is substantially skewed in favorof the rich. Nearly 35% of public educationexpenditures are spent on the richest 20% ofthe population, while only 13% are spent onthe poorest quintile. The second and third poor-est quintiles receive 14% and 17% respectively,of the public education expenditures, while thesecond richest quintile receives 23% of publicspending. Clearly, the poor are not receivingadequate benefits from the government.
Figure 4.5 shows how public funds are allo-cated to different income groups by level of edu-
13 The socio-economics indicator to define the in-come quintile was created based on the mix ofeight poverty predicting questionnaires. For ex-ample, how often in the last year did you haveproblems satisfying the food needs of the house-hold? Does the household own a heater?
Figure 4.5Benefit Incidence Analysis by Income Quintiles
Source: CWIQ estimated by author
0.1
0.2
0.3
0.4
0.5
0.6
0.7
0.8
0.9
1
Primary
Secondary
Tertiary
0
Poorest Richest

102 Primary and Secondary Education in Lesotho
cation. Government subsidies are almost equallydistributed among the five different incomegroups at the primary level. However, at the sec-ondary level, the poorest 20% of householdsreceive only 12% of public spending, while therichest 20% receive 31% of public allocations.The disparity is even larger for tertiary educa-tion. The two poorest quintiles receive only 7%and 8% respectively, of government spending,while the two richest quintiles receive 47% and24% respectively, of government subsidies. It isclear, then, that nearly 50% of the tertiary edu-cation subsidies go to the richest 20% of house-holds.
When we compare the incidence of publicspending with other Anglophone African coun-tries, it is obvious that public spending on edu-cation in Lesotho is more regressive. For in-stance, Kenya, Namibia, and Malawi have eachspent 17% (16% in Malawi) of their total pub-lic education budget on the poorest quintilepopulations—this is 4 percentage points higherthan the spending in Lesotho. Similarly, in Kenyaand Malawi, the richest 20% of households re-ceive 21% and 25% respectively, of the totalpublic education subsidies while in Lesotho therichest 20% receives 33% of education fund-ing. In primary education in particular, while
Lesotho distributes public subsidies equally toeach income quintile, Kenya provides extra fund-ing to the poorest quintile (22%) while the rich-est 20% receives only 15% of government sub-sidies.
F. Chapter Summary
The bivariate and multivariate analyses reportedon in this chapter indicate patterns in schoolparticipation and student flow in Lesotho’s edu-cational system which may provide directionsfor future educational policies.
Attracting students to school and keepingthem in school throughout the primary cycleremained a priority for Lesotho in 2003. Asshown in this report, up to 20% of primaryschool-age children never attended school insome districts despite the implementation of FPE.Controlling for all other factors, boys were lesslikely to attend school than girls. The head ofhousehold’s level of education had a positiveimpact on children’s school participation. Chil-dren whose father or mother had a primaryschool education were more likely, by 3.8 per-centage points on average, to attend school thanchildren with illiterate parents. More impor-
Table 4.10Incidence of Public Expenditure on Education by Income Quintile
All Education Primary Level Only
Poorest Quintile Richest Quintile Poorest Quintile Richest Quintile
Lesotho (2002) 13 33 20 20
Kenya (1992) 17 21 22 15
Madagascar (1993/94) 8 41 17 14
Malawi (1995) 16 25 20 16
Namibia (2003) 17 27 17 16
S. Africa (1994) 14 35 19 28
Tanzania (1993/94) 14 37 19 18
Uganda (1992/93) 13 32 19 18
Source: Lesotho – CWIQ 2002; Namibia; Deon (2003)

Disparities in Enrollments, Student Flow, and Benefit Incidence of Public Spending 103
tantly, this effect was strongest (12 percentagepoints) for children 6 to 8 years old.
Poverty, location, and constraints in theschool supply played an important role in ex-plaining these patterns. Children from poorfamilies were less likely to attend school com-pared with those from better-off families. All elsebeing equal, children in Quthing and Qacha’sNeck were less likely to attend school; childrenin Maseru were more likely to do so.
Accessibility to schools was a major determi-nant of participation: 30% of rural children whonever attended school lived at least 60 minutesaway from a primary school. Among the otherschool characteristics, only the physical condi-tion of the school—indexed by the percentageof pupils with neither seat nor desk—had sig-nificant impact on attendance. In fact, provid-ing 10% more seats and desks could improveattendance rates by 28%. This variable is moreimportant than teacher qualifications, pupil-teacher ratio or the completeness of the educa-tion cycle offered, variables which are not sig-nificant predictors of school attendance. Indeed,for children who live close to the school, theimpact is paramount. For children living fartheraway, the physical condition of the school hadno effect on attendance. However, improvingboth the accessibility to schools and the physi-cal conditions of existing schools (i.e., the avail-ability of desks and chairs) could significantlyincrease children’s participation rate and theirprogression through primary education. Theimpact of such measures could be more effec-tive in improving school participation thanequipping existing schools with better qualifiedteachers.
In terms of student flow as measured by theprobability of promotion, repetition, and drop-out, up to 10% of those who attended schooldropped out at the end of Standard 1 and 25%repeated this year of study. All else being equal,boys were more likely to repeat than girls. Whilestatus as an orphan did not affect the likelihoodthat a child would attend school, it did increasetheir likelihood of dropping out (5 percentage
point difference).Older pupils were also morelikely to repeat or drop out. Again, the house-hold head’s level of education was an importantfactor. Children with less educated parents weremore likely to repeat or drop out. Poverty alsoplayed a major role. Children from poorerhouseholds were more likely to repeat and dropout than children from wealthier households. Adisparity between rural and urban areas wasapparent too. Controlling for all other factors,rural children are less likely to be promoted by3 percentage points, but more likely to repeatby 4 percentage points, as compared with theirurban counterparts.
Comparison of results of the 2000 and 2002analyses indicate that, overall, the introductionof the FPE did not significantly reduce the pro-portion of children who never attended school.However, some progress was made in reducingthe disparity among the poor and the rich. Thegap between poor and rich children in schoolattendance decreased from 6.7 percentagepoints to 2.1 percentage points in 2002: the ef-fect of poverty on attendance is diminishing overtime. Moreover, the gender gap has decreasedslightly over time. Unfortunately, the 2002 datado not contain information on student flow.Therefore, trends in student flow before andafter the FPE could not be established using thistype of analysis. However, the analyses of stu-dent flow in Chapter 2 did indicate that repeti-tion and dropout may have been reduced andoverall efficiency improved since the FPE wasimplemented.
We used benefit incidence analysis to ana-lyze the equity of education expenditures. Pub-lic spending on education in Lesotho benefitsthe rich disproportionately. Governmentsworldwide are expected to reduce educationalinequities among their citizens by targeting pub-lic funds so that they provide extra benefit tothe poor. However, government subsidies forprimary education in Lesotho are generallyequally distributed among the five different in-come groups. Further, at the secondary level,the poorest 20% of households receive only

104 Primary and Secondary Education in Lesotho
12% of public spending, while the richest 20%receives 31% of public spending. The magni-tude of the disparity is even larger for tertiaryeducation. The two poorest quintiles receiveonly 7% and 8% respectively, of governmentspending, while the two richest quintiles receive47% and 24% of government subsidies, respec-tively. Clearly, nearly 50% of the tertiary edu-cation subsidies go to the richest 20% of house-holds.
G. Areas for FurtherPolicy Development
A few general policy directions can arise fromthe findings in this section. Overall, in conjunc-tion with the findings on education spending inChapter 3, the GOL must make a conscious ef-fort to target the public spending on educationdisproportionately more toward the poor anddisadvantaged group. One of the important rolesa democratic government must play is to redis-tribute society incomes. The government mustmake sure that the poorest 20% of the popula-tion receives overall more than 20% of totalspending on education. The most effective wayof achieving that is to increase the share of edu-cation spending on primary and secondary andreduce the share which goes to higher educa-
tion, as very few of the poor actually proceed tohigher education at all.
More specifically, a combination of demand-side and supply-side interventions must be de-vised to ensure 100% participation and comple-tion of primary education in Lesotho. We learnedfrom the analysis that boys from poor rural ar-eas and those who live in Quthing and Qacha’sNek appear to have the lowest school attendancerate. Further, they are more likely to dropout.The implications of such findings should be care-fully discussed and incorporated into the MOETongoing programs such as the bursary programs.Further the MOET should start piloting vari-ous programs target to the heads of householdsto bring these children to school. Orphans, also,though having similar attendance rates as non-orphans, are proven to be more likely to repeatand dropout.
On the supply side, it is clear that bringingschools closer to the communities remains a highpriority still for the GOL, bearing in mind thatas the distance to schools is reduced, the overallcost and unit cost will rise. It is important thatMOET has a clear policy and support for smalland multigrade schools. Further, equipping theschools with sufficient desks and chairs alsomakes a significant impact on student partici-pation. Thus, it is important that these itemsare provided to schools in an efficient way.

105
his chapter presents an overview of thenetwork of primary and secondaryschools and its characteristics, anddocuments the supply of services as re-flected in urban-rural and regional dif-
ferences in facilities, in provision of textbooks,in staffing patterns, and in teacher allocationacross schools. It also documents the disparityin service delivery between multigrade andmonograde schools. Whenever data is available,it also compares the service delivery before andafter the implementation of Free Primary Edu-cation (FPE). Further, it provides a detailedanalysis of student learning outcomes with par-ticular emphasis on primary education.
A. Overview of the Network of Schools
As of 2004, Lesotho had a network of 1480primary schools and 257 secondary schoolsspread all over the country. In this section weprovide an overview of the institutional com-position of the system, its growth over time, andthe instructional services the schools offer. Sincethe 2004 data has not yet been finalized, we willdraw on data from years up to 2003 for detailedanalysis. Due to this data limitation, less detailedinformation is available for secondary schoolsthan for primary schools.
As briefly explained in Chapter 2, the systemat both the primary and secondary levels is com-posed predominately of church schools, withabout 87% of all primary schools owned byvarious denominations. As of 2003, 37.6% ofprimary schools were Roman Catholic, 35.5%were LEC schools, and another 13% were ACLschools. The remaining 12.3% are secularschools, with roughly 4% each being govern-ment schools, community schools, and privateand other schools. The situation is similar at thesecondary level where close to 90% of the sec-ondary schools were owned and managed bythe churches in 2003.
As mentioned in Chapter 1, the Basotho ter-ritory can be divided into four ecological regions:mountains, lowlands, the Senqu River Valley,and foothills; 40% of primary schools are lo-cated in mountain areas and 36% in lowlands.Government, LEC, and Roman Catholic pri-mary schools are more likely to be in mountainareas (more than 40%) compared to the com-munity and other schools, which are most likelyto be in lower areas. The Senqu River Valleyhas few primary schools, a total of only 45.
The distribution of secondary schools isskewed much more in favor of the lowlands area,where 64% of all secondary schools are located.By comparison, 17% are located in the moun-tain areas, 16% in the foothills, and 3% in the
Service Delivery and Learning Outcomesin Primary and Secondary Education
CHAPTER 5
T

106 Primary and Secondary Education in Lesotho
Senqu River Valley. The Roman Catholic Churchruns 35% of the nation’s secondary schools andLEC runs another 30%.
B. Growth of the System
The Basotho school system has grown over time.With the government’s commitment to propa-gate education, the number of primary schoolsand classrooms has risen steadily since 1974 (seeFigure 5.1), and particularly over the last fewyears. Since 1999, both the number of primaryschools and the average school size has beengrowing. The number of primary schools grewby 7% between 1999 and 2003, largely becausenew government and community primary
schools were set up. In 1999, there were only 5non-denominational government and 40 com-munity primary schools. By 2003, these num-bers had grown to 61 and 55 respectively. In-deed, information from the 2004 school censusindicates that there are now 126 government andalmost 70 community primary schools.
The numbers of secondary schools is alsogrowing steadily but less quickly; 20 were setup and registered between 1999 and 2004, alongwith another 23 unregistered secondary schools.
This growth is a direct result of a consciousgovernment effort and policy, starting in 1999,to increase primary and secondary enrollmentby establishing new non-denominational gov-ernment and community schools. Before 1999,the government, with support from other part-
Table 5.1Distribution of Primary and Secondary Schools by Location and Management Type in 2003
Primary Government Community LEC RCM ACL AME Other Private Total
Number of Schools 61 55 481 509 176 24 47 2 1.355
Percentage 4.5 4.1 35.5 37.6 13.0 1.8 3.5 0.2 100.0
Distribution of Schools by Location (%)
Mountains 42.6 10.9 41.0 47.0 35.2 33.3 17.0 50.0 40.4
Lowlands 39.3 74.6 33.9 28.1 39.2 58.3 66.0 50.0 35.9
Senqu River Valley 4.9 0.0 3.5 3.9 2.8 0.0 0.0 0.0 3.3
Foothills 6.6 14.6 21.6 21.0 22.7 8.3 14.9 0.0 20.1
Unknown 6.6 0.0 0.0 0.0 0.0 0.0 2.1 0.0 0.4
Total 100.0 100.0 100.0 100.0 100.0 100.0 100.0 100.0 100.0
Secondary Government Community LEC RCM ACL AME Other Private Total
Number of Schools 21 12 68 78 29 5 8 2 223
Percentage 9 5 30 35 13 2 4 1 100
Distribution of Schools by Location (%)
Mountains 14 8 19 22 14 0 0 50 17
Lowlands 76 75 59 54 76 100 88 50 64
Senqu River Valley 5 0 6 3 0 0 0 0 3
Foothills 5 17 16 22 10 0 13 0 16
Total 100 100 100 100 100 100 100 100 100

Service Delivery and Learning Outcomes in Primary and Secondary Education 107
ners including the IDA, was also providing ad-ditional classrooms to church-owned schools.Indeed the balancing of power between the gov-ernment and church-based organizations is cru-cial to recent policy making in the educationsector. The Education Act stipulates a tripartitemanagement of Basotho schools: though schoolsmay be owned by church organizations or com-munities, the government pays for all the teach-ers (though schools may hire additional privateteachers using their own funds). Tension hasgrown between the church and the government.The government feels the churches are not asresponsive as they could be and are not suffi-ciently accountable for educational outcomes.
The average school size appears to be increas-ing in Lesotho for both primary and secondaryschools (see Table 5.2). As of 2003, an averageLesotho primary school had about 317 students.The government (and private) schools seem tobe smaller on average than the community andchurch schools. Interestingly, even though aver-age school size is increasing, the size of the aver-age government school actually decreased from307 in 1999 to 218 in 2003. On the other hand,
all other types of primary schools have grownlarger over the same time period.
The average school size for secondary schoolsalso increased slightly, from about 338 in 1999to 365 in 2003. As shown in Table 5.3, second-ary schools in the mountain areas tend to be thesmallest, averaging 253 students. By agency, thecommunity schools tend to be the smallest.Therefore, the community schools located in themountain areas are the smallest, with an aver-age enrollment of 91 students, raising the issueof how efficient such small schools can be.
C. Selected Characteristics of Schools
In this section, we discuss in detail the provi-sion of educational services as defined by theprevalence of multigrade teaching, the extentof “incomplete” schools, average class size,availability of desks and chairs, average num-ber of books per pupil, distance to school, andstaffing (non-teacher) patterns. Teachers andteacher management will be discussed in Sec-tion D. Whenever possible, we compare multi-
Figure 5.1Number of Primary Schools and Classrooms
0
200
400
600
800
1000
1200
1400
75 77 79 81 83 85 87 89 91 93 95 97 99 1
0
2000
4000
6000
8000
10000
Schools
Classrooms

108 Primary and Secondary Education in Lesotho
grade schools with monograde schools in termsof the equity of various inputs. More informa-tion is available for primary than for secondaryschools.
Multigrade Teaching
The majority of primary schools in Lesotho usemulti-grade teaching for at least some grades
(Table 5.4). Nationally, 62.4% of all primaryschools practice multigrade teaching. The pro-portion is highest among government and AMEschools where more than 70% of schools usemultigrade. As might be expected, multigradeis most common in remote areas, which mayhave the greatest difficulty in attracting trainedteachers. Eighty-five percent of mountainschools and 69% of Senqu River schools prac-
Table 5.2Average Size of Primary Schools
1999 2000 2001 2002 2003
Average Average Average Average AverageSchool School School School School
Schools Size Schools Size Schools Size Schools Size Schools Size
Government 5 307 6 322 18 169 39 194 61 218
Community 40 280 46 281 49 281 54 295 55 326
LEC 478 291 479 328 480 330 481 328 481 330
RCM 508 283 508 318 508 318 509 313 509 316
ACL 176 300 176 333 176 333 176 329 176 333
AME 23 192 23 216 23 215 24 222 24 227
Others 42 278 42 311 47 309 47 306 47 311
Private 1 57 1 50 2 136 2 146 2 245
Total 1.273 287 1.281 320 1.303 318 1.332 314 1.355 317
Table 5.3Average Size of Secondary Schools 2003
Agency Foothills Lowlands Mountain Senqu River Valley Total
ACL 332 419 183 0 377
AME 0 363 0 0 363
Community 65 343 91 0 281
Government 98 516 231 97 420
LEC 300 368 202 576 337
Other 171 389 0 0 361
Private 0 293 508 0 364
RCM 378 412 303 525 383
Total 317 403 253 443 364

Service Delivery and Learning Outcomes in Primary and Secondary Education 109
tice multigrade, as compared to 49% of foothillschools and 43% of lowland schools.
This is consistent with the government’s policythat the number of classrooms constructed isdetermined by the school-age population in thecatchment area. The Education Facility Unit inthe MOET has standard designs for 4-classroomand 7-classroom schools to cater to the varyingpopulations. Indeed, this policy is also encour-aged by the development partners as a cost-ef-fective strategy for school construction. Thesmaller school size allows schools to be locatedcloser to remote communities, which is particu-larly important in view of the impact of distanceon attendance.
Multigrade teaching is also found in someincomplete schools (schools which teach Grade1-6). Some incomplete schools offer an “illegal”
Grade 7, in response to parent dislike of incom-plete schools. Where an unauthorized Grade 7is added, this is almost always done using a mul-tigrade approach.
In most of the cases where multigrade is prac-ticed, the teacher teaches 2 grades at the sametime (Table 5.5). However, 21% of multigradeteachers teach 3 grades, and over 9% teach 4 ormore grades.
Despite the widespread use of multigradeteaching, there is little support or training pro-vided for multigrade teachers. The MOETcommissioned a study on multigrade teachingin primary schools in November 2004(Moshapane, 2004). This study reported that:
• There was no official policy on multigradeteaching and very little support is provided.
Table 5.4Percentage of Schools Using Multigrade Teaching
Government Community LEC RCM ACL AME Other Private Total
Mountains 73.1% 100.0% 85.8% 86.6% 83.9% 100.0% 62.5% 100.0% 85.4%
Lowlands 66.7% 61.0% 39.3% 34.3% 40.6% 57.1% 64.5% 100.0% 43.4%
Senqu River Valley 100.0% 64.7% 65.0% 80.0% 68.9%
Foothills 75.0% 50.0% 51.9% 43.9% 52.5% 50.0% 42.9% 48.9%
Unknown 50.0% 100.0% 60.0%
Total 70.5% 63.6% 62.0% 62.1% 59.7% 70.8% 61.7% 100.0% 62.4%
Table 5.5Proportion of Multigrade Teachers by Number of Grades Taught
Government Community LEC RCM ACL AME Other Private Total
2 grades 70.0 54.9 71.6 70.4 72.9 68.3 66.7 62.5 69.9
3 grades 13.0 23.8 21.6 21.1 23.5 14.6 14.8 37.5 21.0
4 grades 11.0 8.2 3.2 5.5 2.0 9.8 9.9 0.0 4.9
5 grades 2.0 1.6 1.1 0.8 0.8 2.4 6.2 0.0 1.3
6 grades 0.0 2.5 1.1 0.8 0.0 2.4 0.0 0.0 0.9
7 grades 4.0 9.0 1.4 1.5 0.8 2.4 2.5 0.0 2.0
Total 100.0 100.0 100.0 100.0 100.0 100.0 100.0 100.0 100.0

110 Primary and Secondary Education in Lesotho
• The National Curriculum Development Cen-ter had no provision for multigrade teachingin the development of curriculum materials.
• The Lesotho College of Education does nottrain teachers for multigrade teaching.
• Professional support to teachers did not dis-tinguish between multigrade and mono-gradeteaching.
This means that multigrade teachers also relyon the support from District Resource Teacherswho help the teams with record keeping, pro-grams of work, lesson plans, time-tables, andschool administration. Some multigrade schoolsin remote areas are also assisted by the PeaceCorp Volunteers from the USA in an ad hoc way.
“Incomplete Schools”
The primary school cycle in Lesotho is sevenyears, but various constraints keep schools frombeing able to offer the complete cycle. Because
they are trying to keep up with the government’sgeneral commitment to improve the delivery ofeducational services, a rising percentage of pri-mary schools are offering the full seven yearsof schooling; this percentage has risen from35% in 1974 to 78% in 2002. However, as of2003, more than 20% of schools nationwidestill were not offering the entire seven years ofinstruction.
As Table 5.6 reveals, there are strong regionaldisparities in this situation. While only 9% ofschools in the lowlands are still offering incom-plete cycles, over a third of those in the moun-tain areas do so (35%), followed by the SenquRiver Valley (22%). These disparities also ex-tend to type of school: 75% of governmentschools do not offer complete cycles, thoughmost offer up to the fourth grade. The majorityof community schools (27% incomplete) andchurch schools (below 20% incomplete) offerclasses through sixth grade. All private schoolsoffer the complete cycle.
Table 5.6Proportion of Schools Offering an Incomplete Cycle of Instruction
Schools OfferingIncomplete Cycleof Instruction Government Community LEC RCM ACL AME Other Private Total
Mountains 73.1% 66.7% 36.5% 31.8% 29.0% 12.5% 37.5% 0.0% 35.3%
Lowlands 70.8% 17.1% 5.5% 2.1% 8.7% 7.1% 6.5% 0.0% 9.3%
Senqu River Valley 100.0% 5.9% 20.0% 40.0% 22.2%
Foothills 75.0% 50.0% 10.6% 11.2% 15.0% 50.0% 0.0% 13.6%
Unknown 100.0% 0.0% 80.0%
Total 75.4% 27.3% 19.3% 18.7% 18.2% 12.5% 10.6% 0.0% 21.3%
Distribution of Schools According to Highest Grade Offered
Grade 3 4.9 0.0 0.2 0.0 0.0 0.0 2.1 0.0 0.4
Grade 4 60.7 9.1 1.5 1.6 1.1 0.0 2.1 0.0 4.4
Grade 5 3.3 5.5 2.7 3.5 4.0 4.2 4.3 0.0 3.4
Grade 6 6.6 12.7 15.0 13.6 13.1 8.3 2.1 0.0 13.1
Grade 7 24.6 72.7 80.7 81.3 81.8 87.5 89.4 100.0 78.7
Total 100.0 100.0 100.0 100.0 100.0 100.0 100.0 100.0 100.0

Service Delivery and Learning Outcomes in Primary and Secondary Education 111
This situation may have evolved because ofthe government’s policy of constructing a num-ber of classrooms that is consistent with thenumber of school-age children in the catchmentarea. The Education Facility Unit in the MOEThas standard designs for 4-classroom and 7-classroom schools to cater to the variations inpopulation. Indeed, development partners alsoendorse this policy as being more cost-effec-tive. The smaller school size allows additionalclassrooms to be added in the future and tobring education closer to the remote commu-nities.
Students Per Classroom orAverage Class Size
The number of students per classroom providesanother important indicator for evaluatingschool and learning characteristics. Overall, de-spite the government’s recent efforts to buildclassrooms, the average number of pupils perprimary classroom remains too high, at 71. Table5.7 also reveals a large disparity across the re-gions. Schools in the mountain and Senqu RiverValley zones are most crowded, with an aver-age of more than 80 students per classroom as
Table 5.7Average Number of Pupils Per Primary Classroom
Pupils Per Classroom Government Community LEC RCM ACL AME Other Private Total
All schools
Mountains 53 107 83 84 84 72 75 21 82
Lowlands 41 51 65 59 68 52 55 31 60
Senqu River Valley 167 69 81 60 80
Foothills 39 44 68 78 59 60 54 69
Unknown 42 76 49
Total 52 57 73 75 71 59 59 26 71
Schools with multigrade teaching
Mountains 45 107 84 86 88 72 82 21 84
Lowlands 34 51 56 62 64 43 55 31 56
Senqu River Valley 167 60 74 67 77
Foothills 44 38 67 80 46 87 51 67
Unknown 37 76 50
Total 50 60 74 80 72 59 60 26 73
Schools with monograde teaching
Mountains 71 72 76 64 63 73
Lowlands 54 52 70 57 70 64 55 64
Senqu River Valley 87 93 40 86
Foothills 22 49 69 76 75 33 56 72
Unknown 48 48
Total 57 52 71 68 70 60 56 68

112 Primary and Secondary Education in Lesotho
compared to 69 in the foothills and only 60 inthe lowlands.
Private schools have the lowest pupil per class-room ratio, at only 26. Among the other types,government schools fare the best with about 52pupils per classroom (except for the governmentschools in the Senqu River Valley which aver-age 167 pupils per classroom). The morecrowded classrooms can also be found in theRCM, LEC and ACL schools which averagemore than 70 pupils per classroom.
Comparing multigrade with monogradeschools, on average the multigrade schools havemore crowded classrooms (73 vs. 68). Asshown in Table 5.7, multigrade schools inmountain areas and monograde schools in theSenqu River Valley have the most crowdedclassrooms (86 and 84 per classroom, respec-tively).
At the secondary level, the national averageclass size is a very reasonable 40 students. How-ever, secondary schools located in the mountainareas tend to have fewer students per classroom(average 37). Community schools located in thefoothills and mountain areas have the lowestclass sizes, at about 22 or 23, indicating thatthe capacity of some secondary schools may beunderutilized (see Table 5.8)
Percentage of Students withoutSeats and Desks
Another challenge to the delivery of adequateeducation is the widespread lack of seats anddesks for students (see Table 5.9). In 2003,32.6% of pupils in primary schools had neithera seat nor a desk. This situation is particularlysevere in the mountain areas where it is true ofalmost half the students (46.5%), as comparedto 32.8% in the Senqu River Valley, 28% in thefoothills, and only 20% in the lowlands.
Looking at types of schools, the AME schoolstend to have the highest proportion of studentswith no seat or desk (40%) and the governmentschools have the lowest proportion, at 28%.Comparing multigrade and monograde schools,we find a huge a disparity in the provision ofdesks and seats: 40.7% of pupils in multigradeschools have neither seats nor desks, comparedto only 19.3% in monograde schools.
Number of Books Per Primary Pupil
In the past, Lesotho implemented a relativelysuccessful primary textbook rental program. Ineffect, however, the introduction of FPE abol-ished this scheme since FPE promises to provide
Table 5.8Average Number of Pupils per Secondary Classroom
Agency Foothills Lowlands Mountain Senqu River Valley Total
ACL 40 40 30 0 39
AME 0 35 0 0 35
Community 22 39 23 0 38
Government 25 41 41 64 41
LEC 43 41 42 52 42
Other 21 39 0 0 37
Private 0 37 46 0 40
RCM 37 39 35 44 38
Total 38 40 37 50 40

Service Delivery and Learning Outcomes in Primary and Secondary Education 113
free textbooks and stationery for classroomwork as part of the package. Overall, comparedto other developing countries where several chil-dren tend to share one textbook, the provisionof textbooks looks very good in Lesotho andthe situation has improved since FPE was intro-duced. In 1999 the average pupil had 4.9 books;this number rose to 5.7 in 2003.
Evaluating schools by management type, thegovernment, community, and private schoolsaverage fewer books per pupil (3.6, 4.7, and 3.7)compared to church-owned schools which aver-age more than 5 books per pupil (see Table 5.10).
At the secondary level, the availability ofbooks has also improved markedly since 1999,when it was only 0.2 per student, to 1.9 in 2004.Obviously, 2004 saw a significant increase, asthe government introduced a textbook rentalprogram for lower secondary students. Withsupport from the World Bank, the program pro-vides for a stock of core textbooks. The rentalfee, set at M220 per packet of books, was meantto allow schools to replenish their book sup-plies and to cater to increased enrollment. Ac-cording to the consultancy report, the programis expected to be self-sustainable. However, the
Table 5.9Proportion of Primary Pupils with no Seat or Desk
Pupils with no Seat or Desk (%)
Government Community LEC RCM ACL AME Other Private Total
All schools
Mountain 41.6% 51.0% 44.2% 46.5% 55.0% 62.2% 40.5% 0.0% 46.5%
Lowlands 13.3% 23.0% 19.3% 18.0% 20.0% 33.4% 28.1% 0.0% 20.0%
Senqu River Valley 66.7% 29.6% 25.9% 51.1% 32.8%
Foothills 25.0% 47.9% 26.2% 26.9% 31.4% 0.0% 38.3% 28.0%
Unknown 2.5% 0.0% 2.0%
Total 28.0% 29.7% 31.4% 33.6% 35.8% 40.2% 31.1% 0.0% 32.6%
Schools with multigrade teaching
Mountain 46.0% 51.0% 47.2% 50.2% 60.2% 62.2% 48.3% 0.0% 50.1%
Lowlands 12.6% 23.9% 24.6% 28.9% 27.9% 39.3% 27.0% 0.0% 25.7%
Senqu River Valley 66.7% 30.9% 34.5% 57.3% 39.3%
Foothills 0.0% 61.0% 29.0% 33.7% 38.7% 0.0% 42.9% 32.6%
Unknown 5.1% 0.0% 3.4%
Total 29.9% 32.8% 38.5% 43.8% 47.2% 47.8% 31.4% 0.0% 40.7%
Schools with monograde teaching
Mountain 29.6% 25.7% 22.3% 28.4% 27.6% 25.1%
Lowlands 14.7% 21.5% 16.0% 12.4% 14.6% 25.6% 30.1% 15.6%
Senqu River Valley 27.3% 9.9% 26.4% 18.5%
Foothills 100.0% 34.7% 23.2% 21.6% 23.4% 0.0% 34.9% 23.6%
Unknown 0.0% 0.0%
Total 23.6% 24.1% 19.8% 16.8% 19.1% 21.9% 30.7% 19.3%

114 Primary and Secondary Education in Lesotho
unit cost of textbooks did not fall as much asexpected, because Lesotho’s relatively smallmarket for textbooks prevents it from attract-ing a sufficient number of publishers to bid.Furthermore, instead of focusing on the coretextbooks for lower secondary, the governmentdecided to include all the subjects in the rentalprogram, resulting in about 14 core textbooksand another 3 to 5 non-core books. The situa-tion must be carefully monitored and the pro-gram reworked if necessary.
Distance to Schools
Table 5.11 shows the average walking distanceto the nearest primary and secondary school
for each district. According to the findings fromthe 2002 CWIQ, nearly 60% of primary schoolstudents in rural areas take more than 30 min-utes to get to school, compared to 40% of ur-ban primary students. The situation is consid-erably more difficult at the secondary level:about 85% of rural students take longer than ahalf hour to get to school, and nearly 60% needover an hour. On the other hand, 14% of theurban secondary students say it takes them overan hour.
Schools in the districts of Qucha’s Neck,Butha-Buthe, Leribe, and Maseru recorded rela-tively short distances from households to thenearest schools. On the other hand, in Mohale’sHoek, Thaba-Tseka, Brea, Quthing, andMafeteng, more than 20% of households are
Table 5.10Average Number of Books Per Primary Pupil
1999 2000 2001 2002 2003 2004
Primary
Government 3.7 8.1 3.2 3.1 3.6
Community 3.6 4.7 4.7 4.0 4.7
LEC 5.0 5.1 5.3 5.7 6.1
RCM 4.9 5.3 5.0 5.7 5.8
ACL 5.5 5.5 4.9 5.6 5.4
AME 3.4 5.6 3.7 4.7 5.9
Others 4.8 5.8 4.8 5.0 4.7
Private 0.0 6.6 0.0 0.5 3.7
Total 4.9 5.2 5.0 5.5 5.7
Secondary
Government 0.1 0.1 0.2 0.2 2.1 1.9
Community 0.2 0.1 0.9 0.3 0.2 2.0
LEC 0.2 0.2 1.9 0.9 1.4 1.9
RCM 0.2 0.2 1.5 0.4 1.1 2.1
ACL 0.2 0.2 2.1 1.1 1.4 2.2
AME 0.2 0.2 0.1 0.1 0.1 0.1
Other 0.2 0.2 2.9 0.2 0.2 0.5
Private 0.5 0.5 4.1 0.2 0.1 1.0
Total 0.2 0.2 1.6 0.6 1.2 1.9

Service Delivery and Learning Outcomes in Primary and Secondary Education 115
located over an hour’s walk from the nearestprimary school.
Staffing Pattern (non-teacher)
As described in Chapter 2, the education sys-tem is managed by the Ministry of Educationand Training (MOET) at the central, district,and school levels. At the central level, MOET isheaded by a minister (assisted by an assistantminister). The principal secretary, who is theministry’s administrative head and chief account-ing officer, is assisted at the executive level by astaff that includes the deputy principal secretary;five chief education officers responsible for pri-mary, secondary, teaching service, curriculumservices, and tertiary education; the directors ofeducation planning and technical and vocationaleducation; and the secretary general of the na-tional commission for UNESCO.
At the district level, education managementis housed within district resource centers whichare headed by senior education officers. In aneffort to decentralize, several educational de-partments now operate in the districts. Theseinclude the field inspectorate, the Teacher Ser-vice Department, the Lesotho College of Edu-cation, the National Curriculum DevelopmentCenter, and services in early childhood educa-tion and non-formal education. District resourceteachers (DRTs) and senior resource teachers(SRTs) are responsible for providing school-levelsupport. The DRTs and SRTs were appointedin the mid 1980s as part of a larger project, buthave since been mainstreamed into the ministry’sactivities. A DRT or SRT is a support person,usually a former principal of a primary school,appointed to look after a small number of iso-lated rural schools. Not all schools have a re-source teacher assigned, as the number is lim-
Table 5.11Percent Distribution of Households by Time (in minutes)to Reach Nearest Primary and Secondary School 2002
Primary Secondary
(minutes) 15< 15–29 30–59 60+ 15< 15–29 30–59 60+
Districts
Butha-Buthe 23.3 32.9 32.1 11.7 11.9 23 33.2 31.8
Leribe 20.8 27 33.4 18.8 14 19.2 29 37.8
Berea 16.2 19.7 39.9 24.2 5.7 9.9 35.7 48.8
Maseru 20 31.9 31.5 16.6 9.2 22.3 35.1 33.4
Mafeteng 18 21.8 39.2 21.1 5.7 9.6 22.4 62.4
Mohale’s Hoek 11.2 22.1 37.5 29.1 2.9 9.2 18.1 69.8
Quthing 8.3 27.4 41.2 23.1 3.2 11.6 35.9 49.3
Qacha’s Nek 35.5 28.5 28.8 7.3 13 23.8 26.4 36.8
Mokhotlong 35 26.7 26 12.2 7.3 16.1 26.4 50.3
Thaba-Tseka 21 21 31.1 27 9.8 13.7 17.6 58.9
Rural 18.3 22.9 34.7 24.1 5.4 10.8 25.2 58.6
Urban 25.4 35.5 31.8 7.2 16.7 31.3 38.3 13.7
Source: CWIQ 2002

116 Primary and Secondary Education in Lesotho
ited, and the aim is to support the most remoteschools.
Chapter 3, on education spending, docu-mented that less than 5% of total educationspending goes to administration, including bothcentral and district levels. However, the DRTsand the SRTs continued to be counted as teach-ers, rather than administrators. Lesotho has atotal of about 85 resource teachers.
At the school level, administrative staff ac-count for a very small share of governmentspending on education. In fact, while all primaryschools are headed by principals—sometimesassisted by deputies—the principals and theirdeputies continue to share teaching with otherteachers and they continue to be categorized asteachers. In most schools the principal teachesone class. The ministry guidelines state that theprincipal should teach unless the school has morethan 800 pupils.
D. Teachers and Teacher Management
In this section, we will focus on teacher andteacher management issues. Teachers are thesingle most important item of public spendingon education. They are the main resource thatschools, particularly at the lower levels, have attheir disposal to organize the delivery of educa-
tion services, and they are the front-line work-ers with direct responsibility for managing teach-ing and learning processes in the classroom. Thusthe profiles of teachers, and of their deploymentin the system across schools, are highly perti-nent aspects of the education system.
Primary Teachers
Lesotho has a teaching force of 9,294 primaryteachers (2003 data), of whom approximatelyone third are untrained. The expansion of thesystem following the introduction of FPE hasresulted in a shortage of teachers, and the num-ber of untrained primary teachers has increasedrapidly, rising from 1,809 in 1999 to 3,035 by2003. Teachers are considered untrained if theydo not have a formal qualification in teaching.However, many of the untrained teachers dohave a secondary education and a CambridgeOverseas School Certificate (COSC). Indeed inLesotho, almost 90% of primary teachers (Table5.12) have at least a COSC qualification whichis equivalent to more than 12 years of formaleducation. And yet, more than 30% are still con-sidered “unqualified” because of the lack ofteaching qualification.
Across school types, the distribution of teacherqualifications remains similar and a majority ofteachers have at least a COSC. However, it is
Table 5.12Primary Teacher Qualifications and Level of Education, 2003
Teacher Qualifications % of Primary Teachers
Primary school (7 years of formal education) 0.4
Junior Certificate (10 years of formal education) 11.1
COSC (12 years of formal education) 21.1
COSC and pre-service training 36.0
COSC and in-service training 24.0
Higher education and pre-service training 0.2
Higher education and in-service training 0.8
Unknown 6.5

Service Delivery and Learning Outcomes in Primary and Secondary Education 117
worth noting that there are no unqualified teach-ers in the private schools. Government schoolshave the highest proportion of unqualified teach-ers since more than 51% of their teachers do
not have teaching-specific certificates (See Ap-pendix 5.1). This may reflect the recent increasein the number of government schools, coincid-ing with the shortage of qualified teachers.
Figure 5.2Primary Teachers: Number and Qualification
Source: MOET
Figure 5.2Secondary Teachers: Number and Qualification
Source: MOET
0
2000
4000
6000
8000
10000
1999 2000 2001 2002 2003
Degree
Certificate
Unqualified
0
500
1000
1500
2000
2500
3000
3500
4000
1999 2000 2001 2002 2003
Qualified
Unqualified

118 Primary and Secondary Education in Lesotho
Comparing teachers in multigrade classroomswith those in mongrade classrooms, 43% ofmultigrade teachers are unqualified, comparedwith 29% of mono-grade teachers. Further,among unqualified teachers, a higher propor-tion of the multigrade teachers have junior cer-tificates or below qualifications (15% versus10%). See Appendix 5.1.
An unusual feature of the system is the pres-ence of “volunteer” teachers in some schools.These volunteer teachers, who typically leaveschool at a young age, and who cannot find ajob, volunteer to teach in the local schools inthe hopes of getting employed if a vacancy arises.
Secondary Teachers
Lesotho has 3,470 secondary teachers (2003data). Although there are some unqualified sec-ondary teachers, the proportion has been de-creasing slowly in recent years, and in 2003 only11% of secondary teachers were unqualified.
Table 5.13 indicates that over 50% of sec-ondary teachers in Lesotho are graduates, and4% hold masters degrees. Many of the non-graduate teachers have a diploma or advancedcertificate (14%), while others hold either a Sec-ondary Teachers Certificate or Secondary Tech-nical Teachers Certificate (19%). However thereremain teachers with only a COSC (8%) or otherschool-level qualifications.
Table 5.14Primary Teachers: Gender and Location
% Female Teachers
Foothills 79
Lowlands 83
Mountain 71
Senqu River Valley 74
Total 79
Table 5.13Secondary Teacher Qualifications
% of Secondary Teachers
Masters Degree 4
Bachelors Degree 50
Diploma 13
Advanced Certificates 1
Secondary Teachers Certificate 17
Secondary Technical Teachers Certificate 2
Teachers Certificate 1
Cambridge Overseas School Certificate 8
Joint Matriculation Board Certificate 0
Primary Teachers Certificate 1
Other Certificates 1
COSC & JC Plus In-Service Education 0
Associate of the College of Preceptors 3
Unknown 1

Service Delivery and Learning Outcomes in Primary and Secondary Education 119
Teacher Gender
Most of the primary teachers are female. Over-all, almost 80% of teachers are female. In moun-tain areas there are slightly more male teachers,but even there, females account for more than
70% of the teacher population. Gender is morebalanced for secondary teachers where only 55%of secondary teachers are female and 45% aremale. For both primary and secondary teach-ers, the gender balance has remained fairly con-stant over recent years.
Figure 5.4Secondary Teachers and Gender 1999–2003
Figure 5.3Primary Teachers and Gender 1999–2003.
1999 2000 2001 2002 2003
0
1000
2000
3000
4000
5000
6000
7000
8000
Males
Females
1999 2000 2001 2002 2003
0
Males
Females
Figure 5.4: Secondary Teachers and Gender 1999-2003
500
1000
1500
2000

120 Primary and Secondary Education in Lesotho
Teacher Attrition
Primary teaching is a relatively stable professionin Lesotho. Many teachers remain in the serviceuntil retirement age. Retirement is compulsoryat 65, but some teachers even request extensionsof service after that date. Current teachers havean average of 14.2 years of teaching service,which, given the recent expansion of the num-ber of teachers, is an indication of the stabilityof the profession. Female teachers have, on av-erage, 2.5 years more service than males.
In 2004, 380 teachers left the profession(Table 5.15), making an attrition rate of 3%.Attrition can be divided into three main causes.Teachers reaching retirement accounted for 27%of attrition. A further 39% was attributed toteacher resignation before retirement, possiblymoving to other employment. And death ac-counted for 31%.
HIV/AIDS and the Teaching Force
The HIV/AIDS epidemic has a significant im-pact on the teaching force. Lesotho has an esti-mated HIV prevalence rate of 29% (World BankEdstats, 2003). Some indication of teacher-spe-cific infection rates are provided by a 2003 cam-
paign of voluntary testing and counseling car-ried out by MOET. Voluntary testing was of-fered to headquarters staff and teachers in sevendistricts. Only 6% of the staff was tested, butthe results showed that 22% of them were HIVpositive. Infection rates were higher amongmales than females and higher in Maseru thanin other districts.
The infection rate is expected to increase inthe coming years. The impact of this high infec-tion rate can be seen directly in teacher attri-tion. Teacher deaths, many of which are attrib-utable to HIV, amount to 1% of the total teacherforce each year. In addition, HIV is responsiblefor increased teacher illness and loss of produc-tivity in the system.
Table 5.16Prevalence of HIV/Aids among Education Sector Staff
Tested % HIV Positive
Location Total # of Staff Male Female Male Female
HQ 90 260 35.6 13.1
Mohale’s Hoek 1,041 65 211 18.5 16.1
Thaba-Tseka 684 166 302 15.1 14.2
Berea 1,053 112 185 16.1 24.9
Maseru 2,810 94 266 64.9 36.1
Mafeteng 1,427 11 52 27.3 13.5
Leribe 2,150 18 57 11.1 10.5
Quthing 782 13 52 30.8 25.0
Total 9,947 569 1,385 27.6 20.1
Table 5.15Attrition of Primary Teachers, 2004
Cause Number % of a Attrition
Retirement 104 27
Death 117 31
Dismissal 10 3
Resignation 149 39
Total 380

Service Delivery and Learning Outcomes in Primary and Secondary Education 121
Teacher Training
The main source of qualified primary teachersis the Lesotho College of Education (LCE). LCEoperates a full time, three year course for schoolleavers known as the Diploma in Education,Primary (DEP). This is intended to have 250 stu-dents per year, but because of limited capacityat LCE, it has not reached that number. In 2004there were 183 graduates.
At present the pre-service course is not train-ing enough new primary teachers each year toreplace the numbers lost through attrition. Thisis creating a shortage of qualified primaryteachers, which is likely to be exacerbated byreductions in the pupil-teacher ratio. As a re-sult, increasing numbers of untrained teachershave been recruited. In addition to the pre-ser-vice course, LCE offers two programs aimedat providing training for unqualified primaryteachers:
1. Diploma in Primary Education (DPE) is a 2year full time course for teachers with someexperience, usually unqualified teachers, orteachers with lower level qualifications. Lastyear there were 60 graduates from this course.
2. In January 2002, the LCE started to offer theDistance Teacher Education Program (DTEP).This is a part time course for in-service teach-ers. It is offered by distance education, usinga mix of residential sessions, meetings withtutors in locations around the country, andtext materials. In its first year the programtook in 500 teachers. A further 100 teacherswith COSC started at the beginning of year2. This pattern has been continuing since, withunqualified teachers starting at year 1 andothers joining at year 2. As the course is fairlynew, the first graduates will not emerge until2006. There has been some dropout, but atpresent, there are 536 in year 3, from the 600taken in. Although the academic requirementsfor entry were lower than for the conventionalcourse, the curriculum was designed to par-allel the full time course.
The government policy is to require all pri-mary teachers to have at least COSC plus pre-or in-service training in Diploma of Educationprograms. The old primary teaching certificateprograms are being phased out both in pre-ser-vice as well as in in-service programs. The up-grading of unqualified teachers is currently be-ing provided by programs at the Lesotho Col-lege of Education in its pre and in-service pro-grams. An important consideration is that onceteachers move from unqualified to qualifiedteachers, their annual salary automatically in-creases by more than 60%, raising questions onthe cost and the fiscal sustainability of schoolexpansion.
Secondary teachers are trained in two insti-tutions. Lesotho College of Education providesa Diploma in Education (Secondary) (DES), anda Diploma in Technology Education (DTE).The National University of Lesotho (NUL) of-fers a Bachelor of Education degree which ca-ters to undergraduates aspiring to be second-ary school teachers. (need information on # ofgraduates).
Teacher Deployment and Allocation
Teacher deployment is based on local hiring ofteachers. The Ministry “grants” teachers toschools in response to school population andbudget considerations. Once the school isgranted a post, the school management commit-tee can select the teacher. When the teacher isidentified, the papers are sent to the TeacherService Commission for approval.
This local hiring system has a number of im-plications. First, teachers apply directly toschools where they would be willing to work.There is therefore no pattern of teachers refus-ing postings—individuals unwilling to work ina particular area do not apply for posts in thatarea. Second, the ability to select teachers lo-cally makes it more likely that local people willbe appointed, and encourages the volunteerteachers, who may be more likely to get a postif they are known in the school.

122 Primary and Secondary Education in Lesotho
On the other hand, the local hiring system isopen to local influence. The ministry percep-tion is that, although posts are advertised, manyschools have a person in mind before they be-gin the selection process. In some cases this re-sults in a local person being appointed in pref-erence to an outsider. There have even been casesof qualified teachers being rejected by commu-nities wishing to hire a local unqualified teacher.In schools where there are volunteer teachers,there may be expectations of getting a paid po-sition when one becomes available. In somecases where these expectations have not beensatisfied, there have been tensions within thecommunity. Further, strong local control mayalso cause uneven deployment within schools.Teachers in powerful positions may be assignedto the smallest classes, leaving the largest classesto the least experienced teachers.
In addition, the local recruitment systemmakes the rational distribution of teachers dif-ficult, for a number of reasons:
• First, the process of appointing a teacher isfairly long, and involves different parts of theministry, church authorities and local man-agement committees. Inefficiency, poor com-munication and bureaucratic delays mean thatsome schools do not take up the posts grantedto them, or that there may be long delays be-fore a teacher is in place.
• Second, the ministry finds it difficult to trans-fer teachers from schools where numbers arefalling. The construction of new schools inrural areas is causing a fall in numbers in someof the older schools. In addition, in some casesschools were built quite close to each other(often schools of different religious denomi-nations) and now that these accept studentsof any denomination they compete for stu-dents. Where a school is perceived to be ofpoor quality, parents may move their childrento nearby schools, or withdraw them alto-gether, causing falling enrolment in someschools. School authorities are reluctant toallow a teacher to be transferred out of a
school. In particular, church authorities maybe sensitive about erosion of their schools andresist teacher transfer.
As Sesotho is the first language for the ma-jority of the population, language is not nor-mally a constraint on teacher deployment. How-ever, a small number of the population doesspeak minority languages, and finding compe-tent teachers for them also presents challenges.
To encourage teachers to locate in rural areas,there is a hardship allowance paid as a flat fee of275M per month. This is generally acknowledgedto be too small to encourage the more highlyqualified teachers to locate in remote areas. As itis a flat fee, it is proportionally more significantfor the lowest paid teachers. The hardship al-lowance is determined by very general classifica-tions of schools. Teachers in remote schools inthe lowlands do not receive the allowance, whileteachers in town in mountain districts do.
Overall, analysis of the school census confirmsthat, across about 1,355 primary schools thatexisted in 2003, there is a general correlationbetween enrollment size and the number ofteachers (R2 = 81.8%), but there is also a widevariation in the number of teachers for schoolsenrolling a similar number of pupils (Figure 5.5).For instance, there are between 100 and 750pupils for 10 teachers at the school level; simi-larly, schools enrolling 500 pupils may haveteachers numbering between 6 and 18. This widerange suggests inequitable distribution of pri-mary teachers. The random of teacher alloca-tion can be indicated by a randomness measurewhich is equal to 100 minus the R-square, whichis about 18 in Lesotho.
Analysis of teacher deployment by region in-dicates that the relationship between pupil andteacher numbers is weakest in the mountain ar-eas (See appendix 5.4).
Rural Teachers
There are particular problems in rural areas.Lesotho has some very mountainous areas where
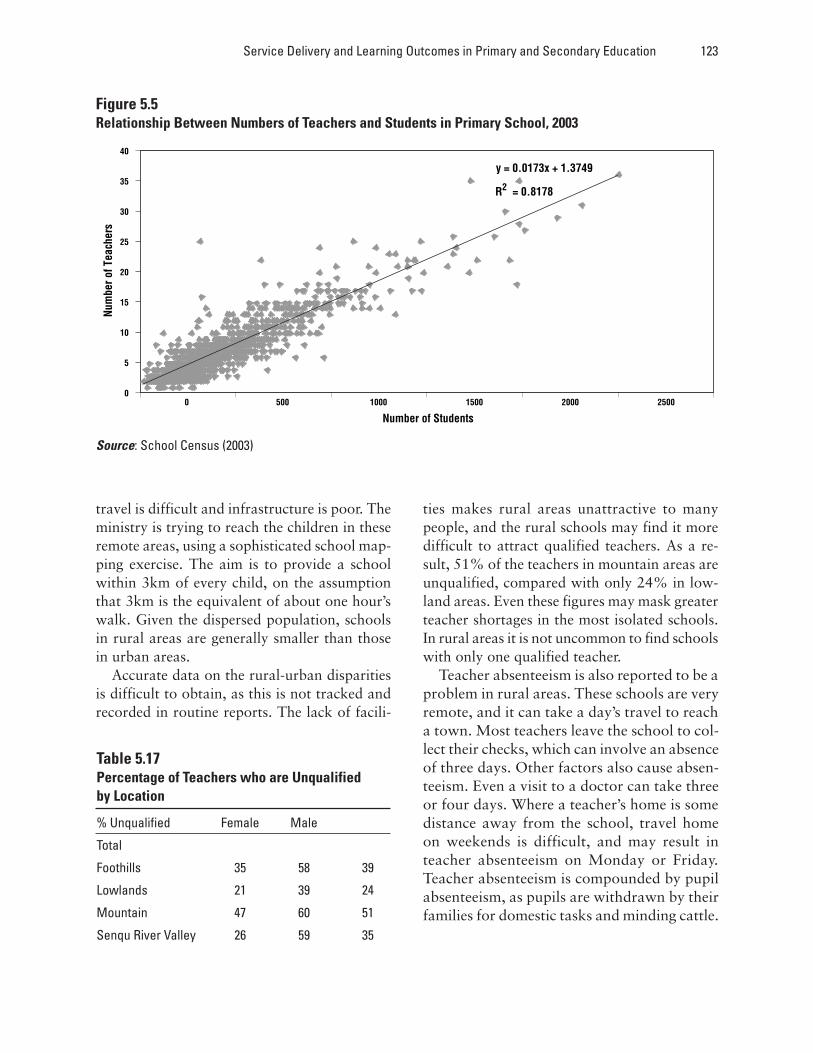
Service Delivery and Learning Outcomes in Primary and Secondary Education 123
travel is difficult and infrastructure is poor. Theministry is trying to reach the children in theseremote areas, using a sophisticated school map-ping exercise. The aim is to provide a schoolwithin 3km of every child, on the assumptionthat 3km is the equivalent of about one hour’swalk. Given the dispersed population, schoolsin rural areas are generally smaller than thosein urban areas.
Accurate data on the rural-urban disparitiesis difficult to obtain, as this is not tracked andrecorded in routine reports. The lack of facili-
ties makes rural areas unattractive to manypeople, and the rural schools may find it moredifficult to attract qualified teachers. As a re-sult, 51% of the teachers in mountain areas areunqualified, compared with only 24% in low-land areas. Even these figures may mask greaterteacher shortages in the most isolated schools.In rural areas it is not uncommon to find schoolswith only one qualified teacher.
Teacher absenteeism is also reported to be aproblem in rural areas. These schools are veryremote, and it can take a day’s travel to reacha town. Most teachers leave the school to col-lect their checks, which can involve an absenceof three days. Other factors also cause absen-teeism. Even a visit to a doctor can take threeor four days. Where a teacher’s home is somedistance away from the school, travel homeon weekends is difficult, and may result inteacher absenteeism on Monday or Friday.Teacher absenteeism is compounded by pupilabsenteeism, as pupils are withdrawn by theirfamilies for domestic tasks and minding cattle.
Figure 5.5Relationship Between Numbers of Teachers and Students in Primary School, 2003
Source: School Census (2003)
Table 5.17Percentage of Teachers who are Unqualifiedby Location
% Unqualified Female Male
Total
Foothills 35 58 39
Lowlands 21 39 24
Mountain 47 60 51
Senqu River Valley 26 59 35
0
y = 0.0173x + 1.3749
R2 = 0.8178
0 500 1000 1500 2000 2500
Number of Students
5
10
15
20
25
30
35
40
Num
ber o
f Tea
cher
s

124 Primary and Secondary Education in Lesotho
Teacher Utilization
All primary teachers have the same official work-ing hours. Schools work from 8am to 2:30pm,with some local variations. All teachers aretrained to teach the entire curriculum withoutsubject specialization. Within some schools theremay be subject specialization arrangements, atthe discretion of the management. In mostschools the principal also teaches a class. Theministry guidelines require that the principalshould teach unless the school has more than800 pupils. Multi-shift teaching is not practiced,although mentioned in the original plan for FPE.The ministry guidelines suggest that the quali-fied teachers be assigned to the lowest grades,but this is not always followed in practice.
Impact of Classroom Shortage
While the official working hours involve 6.5hours of teaching per day for each teacher, thismay be considerably reduced in some schools.In many schools there are more teachers thanclassrooms. Nationally the average pupil-teacherratio is 4:7, while the average pupil-classroomratio is 7:1. As there is not provision for multi-shift teaching, it is likely that the real teaching
hours are reduced, as teachers share the time inthe available classrooms.
An indicator of the scale of teacher under-utilization caused by classroom shortage can becalculated from the relationship between pupil-teacher ratio and pupil-classroom ratio. If teach-ers share the available classroom time, then thenational average workload is really 4.3 hoursper day instead of the official 6.5 hours ((46/71) * 6.5=4.2 hours).
The under-utilization of teachers resultingfrom classroom shortage is greatest in moun-tain areas. Using the theoretical teaching loadcalculation, teachers teach only 3.9 hours perday in mountain areas, compared with 4.8 hoursin lowlands.
Teacher Management—Quality Assurance
There are a series of measures in place to man-age teachers and ensure educational quality.These include, school principals, school man-agement structures, a school inspection service,and a network of District Resource Teacherswho provide support to rural schools.
Inspection
The school inspection service is organized at twolevels: a central inspection service with 14 staff,and a district level inspection staff with an in-tended staff of 5 inspectors in each district (50in total). An external review of the inspectoratein 2002 revealed that the level of actual inspec-tions was low. The central inspectorate had com-pleted no inspections in 2001 and only 15 in2000. The district level inspectorate had an ac-tual staff of 39 (78% of the intended level), giv-ing a ratio of 26 schools per inspector. However,it had performed only 74 inspections in 2001.
Inspections were limited by lack of transport,and by the involvement of inspectors in otheractivities, such as serving on curriculum reviewpanels. Further, the report raised questions aboutthe expertise of the inspectors, and their abilityto provide valuable feedback to schools. The
Table 5.18Theoretical Average Teaching Load Per Day,Based On Pupil-Classroom Ratio
Teaching Load Total
Mountains 3.9
Lowlands 4.8
Senqu River Valley 3.8
Foothills 4.5
Unknown 5.5
Total 4.2
Note: Average daily teaching load is calculated basedon (pupil-teacher ratio-pupil: classroom ratio, multiplied by official hours of instruction per day)

Service Delivery and Learning Outcomes in Primary and Secondary Education 125
report concluded that the inspectorate was“most unlikely to be contributing in any way tothe quality of education provided in Lesotho’sschools” (Multiserve, 2002, Review of theSchools Inspectorates of the Kingdom ofLesotho).
Support
Support is provided to some rural schoolsthrough a network of support staff known asDistrict Resource Teachers (DRT). Eighty DRTswere recruited in 1988 as part of a project sup-ported by USAID. Each was assigned to a clus-ter of between 7 and 16 schools, and chargedwith providing pedagogical support and in-ser-vice training for teachers.
The DRTs were well trained for their role andhad good credibility, as many were previouslyhead teachers. In general, visits by DRTs werewelcome at schools. However, delays in reim-bursement of travel costs (of up to 2 years) andother management issues lowered morale in theteam, and restricted school visits.
An evaluation of the program in 2002 notedthat the results were “most disappointing” andthe schools served by DRTs showed little gainin performance. Moreover, the DRTs served onlya limited number of schools. While initially ithad been the intention that they would move todifferent clusters after a period, many DRTsstayed working with the same schools from1988. The report recommended transformingthe DRT system into an education advisory ser-vice (Multiserve, 2002).14
School Principals
Immediate daily supervision of teachers is theresponsibility of the school principals. Most pri-mary school principals teach a class as well ascarrying administrative responsibilities. Theministry guidelines are that the principal shouldteach unless the school has more than 800 pu-pils. Principals are required to have a qualifica-tion in school leadership, but in rural schools,
many of the principals do not have this qualifi-cation and so serve as acting principals, some-times for long periods.
The role of school principals in supervisionof other teachers is unclear. Where the principalteaches a full timetable, monitoring of otherteachers may be limited to monitoring teacherattendance. More proactive principals may of-fer guidance and support, particularly to un-trained teachers.
School head teachers or principals are selectedby the school management committees. The pro-cess of selection is not always transparent. Whilethis process may ensure a good relationship be-tween the principal and the community, it mayalso limit the principal’s ability to take disciplin-ary action against teachers who are from thecommunity.
Local School Management
Primary schools have local management com-mittees. These serve to increase the involvementof the local community in the school. The com-mittees have considerable power. They select theteachers to be appointed, and select the schoolprincipal.
The details of the structure vary slightly withschool type. In government schools there is oneSchool Management Committee for each school.This committee is comprised of eight people, in-cluding two representatives of the ministry, threerepresentatives of parents, one teacher represen-tative, the principal and a representative of thetraditional leader/chief.
In church schools, the School ManagementCommittee is usually responsible for a clusterof up to eight schools belonging to the samechurch. Each individual school has a School
14 Multiserve, Newth, Ash and Whalley, David(2002). Evaluation of the Primary In-service Edu-cation Programme (PIEP) of the Kingdom ofLesotho, Report to the Ministry of Education andTraining.

126 Primary and Secondary Education in Lesotho
Advisory Committee, which provides advice tothe School Management Committee, but thedecision making power resides with the SchoolManagement Committee.
Post-primary schools have a School Boardappointed by the proprietor (in the case ofchurch schools) and approved by the Ministerof Education. The School Board consists of: a)two representatives of the proprietor; b) threemembers of the community served by the school,who are elected by parents of pupils admittedin that school; c) one representative of teachers;d) a chief of the area where the school is situ-ated; and e) one principal of the relevant schoolwho is the secretary of the School Board.
Teacher Discipline
In the case of teacher absenteeism or misbehav-ior, a complaint from a principal of a churchschool would be passed in sequence to the man-agement committee, the church authorities, theministry and the inspectorate, before any actionwould be taken. Where the misbehaving teacheris popular or well connected locally (as may eas-ily happen given the local hiring system), theprincipal and management committee may bereluctant to take action, causing even greaterdelays before the difficulty comes to the atten-tion of the ministry. The number of teachers dis-missed for misbehavior is very small, totalingonly 10 teachers (of 9,000) in 2004.
In short, schools are managed by a schoolprincipal, who reports to a local managementcommittee or school board. There are two sys-tem-level quality assurance services. The schoolinspectorate, is intended to inspect schools, buthas limited ability in practice, and has been criti-cized for both the number and quality of inspec-tions. The District Resource Teachers are in-tended as a support service for rural schools.They serve a limited number of rural schools,and although they provide pedagogical support,their impact on teaching quality has yet to bedemonstrated. The limited number of inspec-tions means that, for a teacher not served by a
DRT, the chances of having any support or ob-servation from outside the school are small. Ineffect, the system relies on school principals tomonitor and support their teachers. It is unclearto what extent they are prepared for, or fulfill,that role.
E. Student Learning Outcomes inPrimary Schools in Lesotho
The above sections in this chapter detail the ser-vice delivery and its disparities across the coun-try and across various types of schools. In thissection, we try to relate the school inputs to thechildren’s learning outcomes.
In Lesotho, as in many other poor countries,primary education absorbs a major share ofpublic resources. In such a context, how muchstudents learn and how efficiently resources aretransformed into learning outcomes become keyissues.
After documenting student achievement froma cross-national perspective, we address theseissues by using data from the Primary SchoolLeaving Exam that Grade 7 pupils must com-plete to graduate. Based on this information, wegive an overview of the national examinationresults, compare the performance of primaryeducation in Lesotho over time, and examine thecorrelation of student learning in this country.
International Comparisons
With regard to student learning, internationalcomparisons place Lesotho in a very unfavor-able situation. Between 2000 and 2003, theSouthern Africa Consortium for MonitoringEducational Quality (SACMEQ) conducted astudy under the auspices of the InternationalInstitute for Educational Planning (IIPE) in 14English-speaking African countries. In it, Stan-dard 6 pupils in Lesotho achieved very poor re-sults compared to their counterparts.
Figure 5.6 below presents the means for thereading and mathematics test scores of pupils in

Service Delivery and Learning Outcomes in Primary and Secondary Education 127
each country included in the survey. In this fig-ure, test scores are standardized around a meanequal to 500.15 According to the SACMEQ data,the performance of Lesotho students falls wellbelow the average, with scores of 451 on read-ing, and 447 on mathematics. Compared toSeychelles, one of the highest-performing coun-tries in the sample, students from Lesotho hadan absolute disadvantage of around 40 pointsin both subjects, followed only by Malawi,Namibia and Zambia.
Trends and Disparities in StudentAchievement: An Analysis of the PrimarySchool Leaving Exam (PSLE) Results
In this section we present empirical evidence onthe performance of the students who took the1999 and 2003 PSLE16. In both years, studentstook the examination on five subjects: English,Sesotho, mathematics, science and social stud-ies. Here, however, we focus mainly on students’overall performance by considering the simpleaverage of their raw scores in each subject. Put
Figure 5.6Country differences in reading and mathematics achievement
Source: SACMEQ II data
15 See Annex 5.6 for scores by countries.16 The Primary School Leaving Exam (PSLE) is a
national test. It is administered by the Lesotho Ex-amination Council and marked centrally inMaseru. Its scores are criteria based, rather thannom-based. It is true that no systematic informa-tion is availiable regarding the quality of the PSLEover the years. This Report holds that thecomparision of PSLE results before and after FPEstill provides important insights, though readersare cautioned not to make too much out of thecomparison. Further, several reports in the litera-ture which compare the PSLE results across time,including the following:
IBE, The EFA 2000 assessment: Lesotho countryreport in “http://www2.unesco.org/wef/countryreports/lesotho/rapport_2.html”
PSLE 2003, Administrative Report, ExaminationCouncil of Lesotho, Maseru 2005
Muster (Multi-Site Teacher Education ResearchProject), Lesotho, Discussion Paper 8, Centrefor International Education, University of Sus-sex, 2000, in “www.sussex.ec.uk/usie/muster/pdf/mpd_8_11_02.pdf”
400
440
480
520
560
600
Botswana Kenya Lesotho Malawi Mauritus Mozambique Namibia Seychelles SouthAfrica
Swaziland Tanzania Uganda Zambia Zanzibar
Reading
Mathematics

128 Primary and Secondary Education in Lesotho
another way, this overall performance indicatorcorresponds to the average percentage of cor-rect answers for the five subjects and varies be-tween 0 and 100.
Table 5.19 summarizes the data on the PSLEresults for 1999 and 2003. During this period,the students’ overall performance remained prac-tically unchanged: in 1999, Grade 7 studentsscored 49.4% on average for the five subjectsincluded in the examination, compared with50.7% in 2003. However, these averages maskwide differences between subjects: where theirperformance on English, Sesotho and science fellby up to 8% over time, they got better results inmathematics and social studies compared with1999, increasing their scores in these two sub-jects by 9 and 11 percentage points respectively.
Looking more closely at the distribution ofperformance between students, several featuresbecome clear. First, the variance in scores hasincreased slightly over time, implying that stu-
dents’ performances became more heteroge-neous. Second, a large proportion of the stu-dents are failing to meet the curriculum objec-tives. According to Table 5.24, 50% of pupilsanswered less than half of the test questions cor-rectly in 2003. The best students achieved mod-est scores in absolute terms: around 65% onaverage in 2003 and 62% in 1999.
Table 5.20 contains some relevant informa-tion on social disparities in learning for the twoyears under consideration. It shows that boysand girls achieved very similar results on aver-age, with a modest rising trend over time, andolder students did less well. For example, thosewho registered to take PSLE at age 12 in 2003scored 11 percentage points higher than thosewho registered at age 17. When the data is dis-aggregated by district it shows that students inButha-Buthe, Maseru, and Leribe outperformtheir peers. Students attending communityschools in 2003 obtained noticeably higher
Table 5.19Primary School Leaving Examination Results, Lesotho 1999 and 2003
1999 2003
Average Standard Deviation Average Standard Deviation
Number of students who sat for PSLE 37,856 — 40,146 —
Scores by Subject
English 45.6 12.3 43.3 15.2
Sesotho 69.5 9.0 61.2 10.6
Mathematics 43.7 12.8 53.1 13.2
Science 47.3 12.4 43.6 11.8
Social studies 41.1 11.3 52.2 13.6
Average 49.4 9.4 50.7 10.5
Average Score by Quartiles of Score
Worst students 38.4 5.8 37.7 5.2
2 46.5 1.7 47.1 2.0
3 52.3 1.7 54.3 2.3
Best students 61.6 4.9 65.0 5.2
Source: Author’s calculations based on the 1999 and 2003 PSLE data.

Service Delivery and Learning Outcomes in Primary and Secondary Education 129
Table 5.20Disparities in Primary School Leaving Examination Results, Lesotho 1999 and 2003
1999 2003Number of Standard Number of StandardCandidates Average Deviation Candidates Average Deviation
Gender
Girl 21,628 49.2 9.2 22,417 50.6 10.3
Boy 16,059 49.7 9.6 16,541 50.8 10.8
Age
12 yrs 2,946 54.7 9.6 2,812 57.5 10.8
13 yrs 6,155 52.0 9.0 6,517 54.7 10.3
14 yrs 7,722 50.1 8.6 7,601 52.0 9.6
15 yrs 7,459 48.8 8.7 8,438 49.7 9.7
16 yrs 5,751 47.3 8.7 5,815 48.4 9.8
17 yrs 3,778 46.4 8.9 3940 46.8 9.9
Location
Mountains 7,085 47.7 8.6 7,978 48.3 10.0
Lowlands 21,595 50.4 9.5 22,327 52.0 10.7
Senq River Valley 1,092 48.2 8.7 1,041 49.2 9.9
Foothills 8,084 48.6 9.6 8,299 49.6 10.0
District
Thaba Tseka 1,680 50.7 8.8 2,102 49.0 10.9
Butha-Buthe 2,284 51.5 8.9 2,510 53.1 9.7
Leribe 6,865 49.2 9.2 6,950 51.2 10.9
Berea 5,421 49.7 9.6 5,315 50.7 10.4
Maseru 8,475 50.4 9.7 8,990 52.0 11.0
Mafeteng 4,653 47.8 9.2 4,696 48.9 9.8
Mohale’s Hoek 3,300 50.4 9.8 3,707 50.8 10.5
Quthing 2,199 47.2 8.9 2,126 49.1 9.2
Qacha’s Nek 1,546 47.8 8.5 1,556 48.8 9.8
Mokhotlong 1,433 47.3 8.3 1,699 48.3 9.7
Owner
Anglican Church of Lesotho 5,625 49.8 9.5 5992 49.9 10.0
African Methodist Episcopal Church 255 46.1 7.4 490 48.5 9.8
Community 1,030 55.0 12.1 1,638 58.1 11.8
Government 119 61.3 8.0 416 50.8 12.0
Lesotho Evangelical Church 14,267 49.1 9.0 14,534 50.3 10.1
Roman Catholic Church 15,146 48.8 9.1 15,018 49.7 10.3
Other 1,351 53.9 10.5 1,520 58.7 10.7
Source: Author’s calculations based on the 1999 and 2003 PSLE data

130 Primary and Secondary Education in Lesotho
scores compared to their counterparts, and were8 percentage points above the average amongstudents in schools run by the Roman CatholicChurch and the Lesotho Evangelical Church,which enroll more students. It is noteworthy thatthe achievement gaps between these varioustypes of schools increased by around 6 percent-age points between 1999 and 2003.
Correlates of Learning
What factors explain the disparities capturedin the broad-brush picture above? We addressthis issue by merging individual data from the2003 PSLE with the 2003 school census. In or-der to evaluate the impact of individual teachercharacteristics on student performance, we fo-cus only on the students who enrolled in schoolsthat have only one teacher in Grade 7. Doingso reduces the sample size to 14,997 candidateswho were enrolled in 521 schools out of thetotal of 971 schools that had Grade 7 in 2003.Because of data limitations, the students enrolledin government schools are excluded from theanalysis.
Following common practice in the econom-ics of education, students’ performance is mod-eled as a function of three factors: students’ per-sonal characteristics; the conditions in schoolsand classrooms, including teacher characteris-tics; and the type of school attended. It shouldbe noted that the data we use have several short-comings for the analysis attempted here. First,they do not provide information on the pupils’socioeconomic backgrounds. Second, becausestudents are not tested at the beginning of theschool year, it is not possible to model the deter-minants of learning as a dynamic process overthe course of a school year.
Table 5.21 displays the variables employedin the analysis and presents the summary statis-tics for our dataset, with means and standarddeviations. Overall, students gave an average of49% correct answers for the five subjects, whichis very close to the results reported at the na-tional level.
Turning to student and teacher characteris-tics, 40% of the candidates are boys, and bothboys and girls who sit for the PSLE are 15 yearsold on average. Of the teachers, 62% are fe-male, with about 16 years of professional expe-rience. The sample teacher characteristics areconsistent with the average teachers in Lesothoas reported above.
Regarding classroom characteristics, 15% ofthe teachers are teaching multi-grade classes, and28 students are in the average Grade 7 class-room. School conditions are measured as thepercentage of pupils who have no desk or seat:on average 28% of the 521 schools in thesample. Finally, the great majority of theseschools are run by churches—Roman Catholic,Evangelical, or Anglican—with only 3% com-munity schools. Their geographical distributionis reasonably similar to that of the nation’s pri-mary schools.
We now turn to the regression analysis of thecorrelates of the 2003 PLSE results. Table 5.22reports ordinary least squares estimates of theyear-end test scores in two different ways: withand without using school inputs as separate re-gressors. The comparison of the two ways al-lows us to understand the additional impact ofschool inputs on student learning.
The results reported in Table 5.22 indicatethat student characteristics alone (age and gen-der) explain a very small part of the performancevariation in the sample (around 1%). Addingclass- and school-level variables increases theexplanatory power of the model by 4.5 percent-age points. This result suggests that schoolinginputs matter somewhat more than other per-sonal characteristics in explaining variation inthe PSLE results. However, the overall impactof these factors is apparently limited.
With regard to influences on students’progress in learning, the regression results in-dicate that, with everything else kept the same,older students perform significantly worse. Forexample, pupils who participated in PSLE atage 12 have a score about 0.6 higher than thoseaged 15.

Service Delivery and Learning Outcomes in Primary and Secondary Education 131
Table 5.21Sample Characteristics of Pupils and Schools, Lesotho 2003
Mean Standard Deviation
Average scorea 48.9 10.1
Student Characteristics
Age (in years) 15.4 4.9
Boy (%) 40.4 49.1
Teacher Characteristicsb
Female (%) 62.2 48.5
Length of service (in years) 16.1 10.4
Qualification (%)
Primary education or JC 7.2 25.9
Secondary education
COSC 16.7 37.3
Secondary education with pre-service training 41.7 49.4
Secondary education with in-service training 29.7 45.7
Classrooms Characteristics b
Pupils in Grade 7 28.0 14.8
Multi-grade teaching in Grade 7 (%) 15.4 36.1
School characteristics b
Pupils with no seat no desk (%) 27.6 32.9
Type of school (%)
Community schools 3.2 17.7
Lesotho Evangelical Church 36.9 48.3
Roman Catholic Church 41.4 49.3
Anglican Church of Lesotho 13.6 34.3
African Methodist Episcopal Church 1.3 11.5
Other 3.6 18.8
Location (%)
Mountains 37.4 46.3
Lowlands 34.9 47.7
Senqu River Valley 3.1 17.3
Foothills 24.6 43.1
Number of Students 14,997 —
Number of Teachers/Schools 521 —
a/ Average scores on the following five subjects: English, Sesotho, Mathematics, Science, Social Studies.b/ Sample means and standard deviations correspond to the sample distribution at the school level.
Source: Author’ calculations based on the 2003 PSLE data and the 2003 primary school census

132 Primary and Secondary Education in Lesotho
Table 5.22Correlates of PSLE Results, Lesotho 2003a
Excluding School Including SchoolInputs as Regressors Inputs as Regressors
Coefficient t Coefficient t
Student Characteristics
Age (in years) –0.224 8.12 –0.191 7.57
Boy (girl) 0.436 2.56 0.244 1.46
Teacher Characteristics
Female (male) — — 0.520 2.91
Length of service (in years) — — –0.051 5.66
Qualification (primary education or JC)
COSC — — 1.092 3.17
Secondary education with pre-service training — — 1.608 5.80
Secondary education with in-service training — — 2.446 8.57
Classrooms Characteristics
Pupils in Grade 7 — — –0.092 –5.53
Pupils in Grade 7 (square) — — 0.001 6.24
Multi-grade teaching (mono-grade teaching) — — –2.247 –7.61
School Characteristics
% Pupils with no seat no desk — — 0.414 1.46
Type of School (Community Schools)
Lesotho Evangelical Church — — –3.935 –7.41
Roman Catholic Church — — –4.374 –8.20
Anglican Church of Lesotho — — –3.789 –6.82
African Methodist Episcopal Church — — –5.869 –7.22
Others — — 1.828 2.64
Location (Mountains)
Lowlands — — 1.253 5.96
Senqu River Valley — — 0.811 1.66
Foothills — — 1.471 6.76
Intercept 52.206 123.4 55.269 68.22
Number of Students 14,997 — 14,997 —
Number of Teachers/Schools 521 — 521 —
R_ 0.012 — 0.053 —
a/ Regressions with robust standard errors; dummy variables with the omitted category indicated in parentheses.
Source: Author’s calculations based on the 2003 PSLE data and the 2003 primary school census

Service Delivery and Learning Outcomes in Primary and Secondary Education 133
Contrary to what one might expect, teacherswith more years of experience tend to be lesseffective; that is, their students score less wellon the exam. One possible explanation for thisfinding is that without continuous in-serviceteacher training, the senior teachers may notkeep up with changes in the curriculum and thusare less effective than their younger colleagues.The results also suggest that teachers with aCOSC are significantly more effective thanteachers with a primary education diploma or aJunior Certificate. The amount of teachers’ pre-and in-service training has a positive and sig-nificant impact on student performance. How-ever, pre-service training adds less value than in-service training. One possible explanation is thatexisting pre-service training programs are lesseffective in preparing teachers. This findingprobably indicates some scope for improving thedesign of these programs.
With regard to classroom characteristics, theresults in Table 5.27 indicate that class size hasa significant negative effect on student perfor-mance. One possible reason may be that teach-ers do not adapt their pedagogy in response tothe size of the class they teach. A second class-room characteristic is multi-grade teaching: con-trolling for all other factors, in Grade 7 it seemsto negatively and significantly influence exami-nation results on the PSLE. Therefore, the waythat teachers handle multi-grade teaching is akey issue in improving the performance of pri-mary education. Given that multigrade teach-ing is practiced by a high proportion of unquali-fied teachers, and that little support is provided,it is not surprising that pupils from multigradeclasses perform significantly less well in the(PSLE).
Focusing now on school characteristics, wenote that, all else being the same, students incommunity schools perform significantly betterthan their counterparts. Schools run by the Af-rican Methodist Episcopal Church and the Ro-man Catholic Church are among the less effi-cient schools in Lesotho, with performancesaround 5 points lower than those of commu-
nity school students.17 The finding that commu-nity schools are more efficient underlines theimportance of community ownership in schoolfunctioning—a finding that is consistent withexperience and expectations throughout the de-veloping world.
F. Policy Perspectiveson Service Delivery
Lesotho faces several challenges in managing itsdelivery of educational services. The analysispresented in this chapter highlights two issuesthat warrant special attention. The first is thestructural policies, particularly those pertainingto standards for teacher recruitment and deploy-ment, and teacher salaries and school construc-tion that help define the tangible characteristicsof the supply of services. The second has to dowith management weaknesses in the system thatshow up in the poor allocation of human andfinancial resources across schools, and appar-ently also in the schools’ disparate effectivenessin using their resources to deliver learning out-comes. Adding further complexity, the majorityof schools are run by church organizations. Be-low we discuss policy options pertaining to theseissues, drawing on international experience foran added perspective.
Setting Appropriate Standards for TeacherRecruitment and Deployment, TeacherRemuneration, and School Construction
In Lesotho, as in other countries, these stan-dards create a network of schools with somekey commonalities. While they are intendedto help schools function well, the opposite effectmay in fact occur when budget constraints areignored in the choice of standards. If standardsexceed what the country can afford, schools
17 This gap is equivalent to one standard deviationfrom the mean.

134 Primary and Secondary Education in Lesotho
may meet requirements in the areas explicitlyspecified, but do so through cutbacks elsewherethat eventually compromise their ability to pro-vide effective services. That this has indeed hap-pened in the Lesotho system can be seen fromtwo key findings: the shortage of “qualified”primary teachers, especially in rural mountainareas; and the shortage of classrooms, espe-cially in the mountain areas and the SenquRiver Valley.
These areas have responded to the situationby introducing volunteer teachers or unquali-fied teachers to relieve the teacher shortage, andencouraged the emergence and growth of lower-cost alternatives, like tents, to serve as class-rooms for remote rural populations. Multigradeteaching is also a common reality in these schoolsbut schools receive neither policy guidance norpractical pedagogical support in this practice.
While Lesotho’s system for hiring teacherslocally is considered to be a good model formaintaining a stable supply of teachers for re-mote areas, its disadvantages are also clear.These include the tendency for rural teachers tohave lower average qualifications and less ex-perience and the difficulty in re-deploying teach-ers once they are involved with a particular typeof school management, especially a church.
This report is the first to point out that thehigh level of teacher remuneration in both pri-mary and secondary education potentially posesa fiscal risk to the government of Lesotho. Al-though a full 30% of primary teachers are con-sidered “unqualified,” the overall formal quali-fication of Lesotho’s teachers (at least 12 yearsof general education) is high compared to thatin other developing countries. International evi-dence has shown very little direct relationshipbetween teachers’ formal qualification and stu-dent learning outcomes. At the same time, thehigh cost of teacher salaries constrains the gov-ernment in its effort to improve coverage.
Standards for school construction representanother area of concern. School construction iscostly and of high quality in Lesotho. An aver-age 7-classroom school with associated facili-
ties currently costs about M2 million, about US$300,000. The costs can rise even higher in re-mote areas where delivery of materials is diffi-cult and the harsh terrain attracts only localcontractors. However, it seems obvious that thegovernment will find it hard to improve accessto primary schools for remote populations if itmaintains such high standards. The governmenthas already begun to accept that it is possible tobuild a 4-classroom school in areas where thepopulation is sparse. It must take further stepsto reach the goal of bringing schools closer tothe communities.
Improving the whole system will require asystematic review of national recruitment anddeployment, teacher remuneration, and con-struction standards. Such a review can be facili-tated by using simulation models to test the im-pact of alternative options.
Taking Advantage of DecentralizationBased on Lessons from InternationalExperience
Apart from the system-wide structural issuesmentioned above, managerial weakness is alsoresponsible for the disparity in service deliveryacross the nation. Here two major challengesloom large: improving discipline in the alloca-tion of resources across schools, so that humanand financial resources are effectively channeledto the front lines (i.e., the school); and reducingthe disconnect between resources and learningoutcomes.
Despite the government’s heavy investment ineducation, most of the inputs flowing to schoolsare in kind, rather than in cash. Indeed, the in-troduction of FPE further reduced the schools’autonomy to raise and spend funds. While thismay have guaranteed the delivery of some mini-mum services in the short term, in the long termthis may damage the school-level managementcapacity which has proven key to ultimate learn-ing outcomes.
Although the process of decentralization is atan early stage, and roles, responsibilities, and

Service Delivery and Learning Outcomes in Primary and Secondary Education 135
governance frameworks are still being definedand refined, Lesotho might well note the accu-mulated experience of other countries that arefurther along in education decentralization.Winkler and Gershberg (2003, p. X) distill thefollowing lessons based mostly on experiencesin Latin America and Eastern Europe:
• Efficiency and effectiveness are most likely toimprove under decentralization when serviceproviders—schools, local governments, orregional governments—are held accountablefor results.
• Accountability requires clear delineation ofauthority and responsibility and understand-able information on results (both educationaland financial).
• Decentralization of real decision makingpower to schools or school councils can sig-nificantly increase parental participation inthe school, and high levels of parental andcommunity participation are associated withimproved school performance.
• Decentralization of education to sub-nationalgovernments does not in and of itself em-power parents and improve school perfor-mance. Further decentralization to schools(school councils or school boards) or localcommunities does empower parents and canimprove school performance.
• For decentralization to schools to be success-ful, principals must acquire new skills inleadership and management—financial, withteachers, and with the community.
• The design of financial transfers to sub-na-tional governments or schools has powerfuleffects on both efficiency and equity.
• Decentralization requires that national and/or regional ministries of education be restruc-tured; failure to restructure ministries is a se-rious obstacle to realizing the benefits of de-centralization.
• The decentralization of teacher managementis critical to creating accountability and re-alizing the potential benefits of decentrali-zation.
• National education ministries frequently re-sist decentralization on the grounds that sub-national governments, communities, and/orschools lack the capacity to manage educa-tion. In practice, this is seldom true.
• Real decentralization is a long, evolutionaryprocess.
Bearing this last point in mind, it is clear thatdecentralization in Lesotho will also take timeto produce the expected results. While not allaspects of other countries’ experiences are ap-plicable—or indeed, even useful—the conceptsare highly relevant and the lessons from inter-national experience can already be incorporatedto cultivate the key characteristics and behaviorpatterns that characterize high-performance sys-tems: clarity of mission, roles, and responsibili-ties; effective empowerment of relevant individu-als; greater parent participation in schools; and,above all, an emphasis on accountability for re-sults.
Mobilizing and Using Information toEnhance Accountability for Results
Strengthening accountability for results is dif-ficult in education because many individuals areinvolved and the outcomes are typically multi-dimensional. Yet appropriate use of informa-tion can help improve performance by ensur-ing that resources are at least reaching schools.In Uganda a large-scale public disseminationof information on grants for education gaveschools and parents the information theyneeded to monitor the grants. Over just sixyears, the leakage of funds fell from 80% to20%, and schools were able to use the resourcesthey now had available to purchase textbooksand other pedagogical inputs (World Bank2004a). Information flow can of course bechanneled in other ways too. Report cards suchas those used in Parana State in Brazil are aninteresting example (Servilla and Winkler2003). They provide schools with informationthat compares indicators for the school (e.g.,

136 Primary and Secondary Education in Lesotho
pupil-teacher ratios, examination results, andparent feedback) with reference averages at thenational and relevant subnational levels. Re-port cards for school districts and other higherlevels of aggregation can also provide similarcomparative information.
The availability of such information may beexpected to improve conditions in schools in twoways: by creating incentives for underendowedschools to seek redress; and by pinpointing spe-cific schools in the system that warrant the at-tention of those in charge. In Lesotho, as in othercountries, the use of information on studentachievement for accountability purposes remainsat an early stage. The country has already es-tablished a baseline, and this can be built on aspart of the broader effort to mobilize appropri-ate information for better management.
G. Chapter Summary
The analysis in this chapter demonstrates thatnationwide, the government of Lesotho has im-proved service delivery or at least managed tomaintain it. Despite the FPE, Lesotho has man-aged to expand its primary teaching force inkeeping with the expansion of enrollment withFPE even though the average school size in-creased somewhat from an average of 287 to317 in 2003. Although the proportion of “un-qualified” teachers seems to have increased,89% of all primary teachers possess qualifica-tions of COSC or above, equivalent to more than12 years of formal education. The average num-ber of books per primary pupil increased from4.7 in 2009 to 5.7 in 2003, and the percentageof primary schools that offer the full 7 years ofschooling rose from 35% in 1974 to 78% in2002.
However, physical constraints in classroomsand facilities still present major challenges. De-spite the government’s recent efforts to constructclassrooms, the average number of students perprimary classroom remains at 71, which is high.In addition, 32.6% of primary pupils still do
not have seats or desks. And 70% of all pri-mary schools practice multigrade teaching.
A serious concern is the distribution of ser-vice delivery. Schools in mountain areas and theSenqu River Valley tend to be more crowded,and have higher student to teacher ratios andhigher proportions of unqualified and less ex-perienced teachers, compared to those in thelowlands and foothills. Multigrade schoolswhich are mostly located in rural mountain ar-eas tend to be less well endowed in terms of fa-cilities and teachers.
In terms of teachers, by regional standards,primary teachers in Lesotho are relatively welleducated, and the majority have completed sec-ondary school. However, the supply of trainedteachers has not been adequate, and an increas-ing proportion of teachers are untrained. Thecurrent strategy is to train these teachers in-ser-vice, using a distance education program.
The incidence of HIV infection among teach-ers appears high, and is forecast to rise. Teacherdeaths already account for the loss of 1% ofteachers annually. Measures to strengthen theHIV awareness components in teacher educa-tion courses may be beneficial.
The teacher deployment system allows localschool management committees to select theteachers that are employed. This system servesrural areas relatively well. However, the admin-istration of the system is complex and could besimplified. Teacher deployment is inequitable,and rural areas have fewer of the qualified andbetter-educated teachers. Although there is anincentive payment to encourage teachers to workin remote schools, this is not seen as effective.Consideration should be given to ways to im-prove the deployment of teachers to rural areas.One possible action is to reorganize the classifi-cation of schools to ensure that the incentive isonly paid in genuinely remote schools. Consid-eration should also be given to non-financialincentives, including accelerated promotion(which has long term financial implications), oreven a requirement that newly qualified teach-ers work in rural areas for a period.

Service Delivery and Learning Outcomes in Primary and Secondary Education 137
Teacher utilization is restricted by a shortageof classrooms in some schools, which may en-courage teachers to reduce their working hours.This issue merits further examination, and mayexplain why classrooms seem to play a signifi-cant role in educational outcomes.
Multigrade teaching is widely practiced, par-ticularly in mountain areas. As further expan-sion of primary education is likely to be insparsely populated areas, the use of multigradeis likely to play an increasing role. Despite thereliance on multigrade teaching, it is poorly sup-ported in curriculum documents and in teachertraining. Better preparation of teachers for mul-tigrade teaching could do much to increase thequality of learning in multigrade classrooms.
In terms of learning outcomes, Basotho stu-dents exhibit poor reading and math skills, asreflected in the results of the SACMEQ study.The overall score on the national PSLE remainedunchanged since 1999; despite increases in mathand social studies, scores fell in English, Sesotho,and science. While student age and gender ex-plain a very small part of the performance varia-tion (1%), we found that class and school vari-ables explains another 5.5%. Holding all otherfactors constant, older students perform less wellthan younger ones. Teachers with longer expe-rience tend to be less effective, and those whohave a COSC are significantly more effectivethan those with a primary education diplomaor JC. Pre-service and in-service training bothhave a significant impact on student perfor-mance, but in-service has a larger impact. Largeclasses have a significant negative effect on stu-dent performance, as does multigrade teachingin Grade 7.
Interestingly, keeping all other factors con-stant, we find that community schools are moreefficient than other types, perhaps underlining
the importance of community ownership. Thisfinding is consistent with experience and expec-tations throughout the developing world. InLesotho, however, community schools includesome English-medium schools and an eliteAmerican International school, so these charac-teristics may skew the overall results.
These findings suggest that room for improve-ment does exist. On one hand, increasing thecomparative effectiveness of pre-service train-ing could significantly boost student perfor-mance. Similar gains could probably be obtainedby improving the implementation of multi-gradeteaching. Our results found poorer performancewhen schools combine several levels of instruc-tion in the same classroom. On the other hand,we found that, keeping all other factors con-stant, community schools are significantly moreefficient than their counterparts. Thus it is cru-cial to understand how these schools managethe educational process in order to transfer theirexperience to other existing schools, and to in-crease community participation in managing thesystem.
Finally, as noted in Chapter 3, which analyzedpatterns of educational spending, service deliv-ery in Lesotho’s educational system is rathercentralized. While the centralized system has tosome degree ensured that services are provided,it is not yet ensuring equity in either the distri-bution of human and financial resources, or inthe delivery of educational results.
Some lessons about decentralization and us-ing information to enhance accountability forresults were introduced to provide some policydirections to the MOET. It is time for some ele-ments of service delivery to be further decen-tralized to the school level. At the same time,schools should be held accountable, both finan-cially and for their educational results.


139
Annexes


141
Lesotho Country Profile
ANNEX 1.1
Lesotho Country Profile
Click on the indicator to view a definition 1990 1995 2001 2002
1 Eradicate extreme poverty and hunger 2015 target = halve 1990 $1 a day poverty and malnutrition rates
Population below $1 a day (%) .. 36.4 .. ..
Poverty gap at $1 a day (%) .. 19.0 .. ..
Percentage share of income or consumption held by poorest 20% .. 1.5 .. ..
Prevalence of child malnutrition (% of children under 5) 15.8 21.4 17.8 ..
Population below minimum level of dietary energy consumption (%) 27.0 26.0 25.0 ..
2 Achieve universal primary education 2015 target = net enrollment to 100
Net primary enrollment ratio (% of relevant age group) 72.8 70.5 84.4 ..
Percentage of cohort reaching grade 5 (%) 70.6 63.1 66.8 ..
Youth literacy rate (% ages 15–24) 87.2 89.0 90.5 ..
3 Promote gender equality 2005 target = education ratio to 100
Ratio of girls to boys in primary and secondary education (%) 125.6 117.5 105.0 ..
Ratio of young literate females to males (% ages 15–24) 125.8 122.1 119.1 ..
Share of women employed in the nonagricultural sector (%) 40.4 .. .. ..
Proportion of seats held by women in national parliament (%) .. 5.0 .. ..
(continued on next page)

142 Primary and Secondary Education in Lesotho
4 Reduce child mortality 2015 target = reduce 1990 under 5 mortality by two-thirds
Under 5 mortality rate (per 1,000) 148.0 140.0 133.0 132.0
Infant mortality rate (per 1,000 live births) 102.0 97.0 92.0 91.0
Immunization, measles (% of children under 12 months) 80.0 83.0 70.0 70.0
5 Improve maternal health 2015 target = reduce 1990 maternal mortality by three-fourths
Maternal mortality ratio (modeled estimate, per 100,000 live births) .. .. 550.0 ..
Births attended by skilled health staff (% of total) .. 49.6 59.8 ..
6 Combat HIV/AIDS, malaria and other diseases 2015 target = halt, and begin to reverse, AIDS, etc.
Prevalence of HIV, female (% ages 15–24) .. .. 38.1 ..
Contraceptive prevalence rate (% of women ages 15–49) 23.2 .. .. ..
Number of children orphaned by HIV/AIDS .. .. 73,000.0 ..
Incidence of tuberculosis (per 100,000 people) .. .. 655.0 725.5
Tuberculosis cases detected under DOTS (%) .. 47.0 64.0 60.9
7 Ensure environmental sustainability 2015 target = various (see notes)
Forest area (% of total land area) 0.5 .. 0.5 ..
Nationally protected areas (% of total land area) .. 0.3 0.2 0.2
GDP per unit of energy use (PPP $ per kg oil equivalent) .. .. .. ..
CO2 emissions (metric tons per capita) .. .. .. ..
Access to an improved water source (% of population) .. .. 78.0 ..
Access to improved sanitation (% of population) .. .. 49.0 ..
Access to secure tenure (% of population) .. .. .. ..
8 Develop a Global Partnership for Development 2015 target = various (see notes)
Youth unemployment rate (% of total labor force ages 15–24) .. 47.4 .. ..
Fixed line and mobile telephones (per 1,000 people) 7.2 8.8 36.3 55.7
Personal computers (per 1,000 people) .. .. .. ..
General indicators
Population 1.6 million 1.7 million 1.8 million 1.8 million
Gross national income ($) 1.0 billion 1.3 billion 1.1 billion 972.6 million
GNI per capita ($) 650.0 800.0 600.0 550.0
Adult literacy rate (% of people ages 15 and over) 78.0 80.9 81.4 ..
Total fertility rate (births per woman) 5.1 4.9 4.5 4.3
Lesotho Country Profile
Click on the indicator to view a definition 1990 1995 2001 2002
(continued on next page)
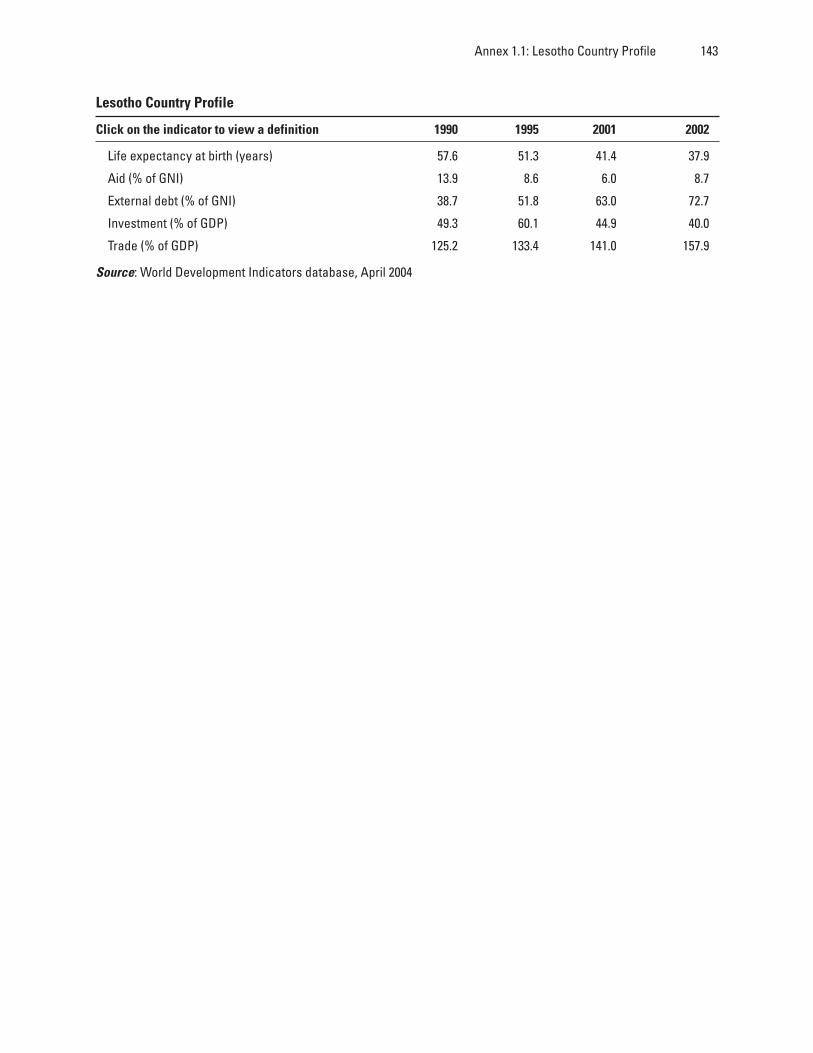
Annex 1.1: Lesotho Country Profile 143
Life expectancy at birth (years) 57.6 51.3 41.4 37.9
Aid (% of GNI) 13.9 8.6 6.0 8.7
External debt (% of GNI) 38.7 51.8 63.0 72.7
Investment (% of GDP) 49.3 60.1 44.9 40.0
Trade (% of GDP) 125.2 133.4 141.0 157.9
Source: World Development Indicators database, April 2004
Lesotho Country Profile
Click on the indicator to view a definition 1990 1995 2001 2002


145
Ecological Regions of Lesotho
Variations in geomorphology and topogra-phy, including micro-climatological influ-ences, have a significant impact on the ecol-ogy of a region. Based on these factorsLesotho has four distinct ecological zones:the lowlands, the foothills, the Senqu RiverValley, and the highlands.
The country consists of a high-altitudeplateau, which intrudes from the westernparts of the country at an altitude of roughly1,500m, forming a narrow strip known asthe lowlands. The altitude then increasesthrough the foothills to an elevation of 2,000–2,300m, and then finally rises to the high-lands. The highlands extend to the easternescarpment where substantial areas have al-titudes of over 3,000m.
The Lowlands: The lowlands cover the westernpart of the country and occupy about 5,200 km2,or 17% of the total surface area. At some points,this narrow strip of land extends just 10 km in-land from the border; in other places it is 60 km
wide, and lies between 1,400 m and 1,800 m.The northern and central lowlands have largedeposits of rich volcanic soils; the southern orborder lowlands have poor soils and low rain-fall. In the foothills, on the other hand, the landis very fertile and very productive agriculturally.
The Foothills: In the foothills, on the other hand,the land is very fertile and very productive agri-culturally. The foothills are defined as the areabetween the lowlands and the highlands; at 15%of the total land area, they occupy an estimated4, 600 km2 which lies between 1,800 and2,000m above sea level.
The Senqu River Valle: This narrow strip of landflanks the banks of the Senqu River and pen-etrates deep into the highlands, reaching lowerparts of the river’s main tributaries. This regioncovers 9% of the total surface area. The valley’ssoils vary from rich to very poor, making thisthe country’s least productive region.
The Highlands: The largest ecological area, theMaluti Mountains, cover 18,047 km2of the
Lesotho’s Zones and Districts From the Southern Africa Humanitarian and
Disaster GIS Library and Lesotho Meteorological Services.http://www.sahims.net/gis/Gis%20Input/lesotho_gis.asp
http://www.lesmet.org.ls/
ANNEX 1.2

146 Primary and Secondary Education in Lesotho
Drakensberg range. This region is extensivelydissected by the headwaters of the Senqu Riverand its tributaries which drain in a north-southdirection; together with an extensive networkof mountain wetlands, they form an importantsegment of the Southern African region’s wa-
ter resources. The drainage pattern of the high-lands region has produced deep river valleys,gorges, and gullies that, in general, make hu-man life very difficult. The highlands regionforms the main livestock grazing area in thecountry.

147
he responsibility for curriculum devel-opment lies within the National Cur-riculum Development Center(NCDC). The current curriculum andsyllabus used was officially published
in 1997. Based on the published 1997 PrimarySyllabus, the curriculum aims for primary edu-cation in Lesotho are:
At the completion of seven years of primaryeducation, pupils should:
1. Have acquired communication skills of lis-tening, speaking, reading, and writing inSesotho and English and numeracy skills ofcounting, adding, subtracting, multiplyingand dividing.
2. Communicate effectively in all learning situ-ations and in everyday life
3. Have acquired survival and self-relianceskills to improve their living
4. Have developed creative skills in arts andentrepreneurial skills for personal develop-ment in their daily lives
5. know their natural and technological envi-ronment
6. Be able to demonstrate awareness and ap-preciation of interdependence existing be-tween man and his environment
7. Be able to initiate and participate con-sciously in activities aimed at managing andimproving the environment, health andstandard of living
8. Understand and appreciate their culture9. Have developed positive attitude and aes-
thetic awareness towards cultural heritageand humanity
10. Be able to demonstrate awareness and ap-preciate cultures of other people
11. Have acquired scientific and technologicalconcepts and prinviples for further learn-ing and everyday living
12. Have developed and be able to apply scien-tific and technological methods in learning,solving problems and improving health andstandards of living
13. Have acquired knowledge and understand-ing of the civil human rights
14. Be able to utilize the acquired knowledgeof their civil and human rights as well astheir obligations and responsibilities for ef-fective participation in their society
15. have developed awareness and appreciationof various religious beliefs
16. Be able to react positively to scientific, tech-nological and socioeconomic situationswhich contribute to expected change ofbehaviour.
Primary Syllabus in Lesotho Standards 1through Standard 7 (1997)
ANNEX 2.1
T

148 Primary and Secondary Education in Lesotho
Lesotho primary school calendar:
Primary and secondary schools in Lesotho hastwo semesters: One from January to June andthe other from July to December.
Language Policy.
The policy states that in Standards 1 to 3,Sesotho should be used as a medium and at Stan-dards higher than 3, English would be used as amedium of sinstruction.
Standard 1 Standard 2 Standard 3 Standards 4 & 5 Standards 6 & 7
Periods/ Periods/ Periods/ Periods/ Periods/ Periods/ Periods/ Periods/ Periods/ Periods/Subject week week week week week week week week week week
Sesotho 6 192 6 192 6 192 6 192/156 6 192/156
English 9 288 9 288 8 256 6 192/156 6 192/156
Mathematics 6 192 6 192 6 192 6 192/156 6 192/156
Science 5 160 5 160 4 128 4 128/104 4 128/104
Agriculture 3 96 3 96 3 96 3 96/78 3 96/78
Home Economics 3 96 3 96 3 96 3 96/78 3 96/78
Health/P.E. 2 64 2 64 3 96 3 96/78 3 96/78
Social Studies 2 64 2 64 3 96 4 128/104 4 128/104
Religious Ed. 1 32 1 32 2 64 1 32/26 1 32/26
Fine Arts 2 64 2 64 2 64 2 64/52 2 64/52
One period is ?? minutes

149
School Feeding Programmes
Introduction
his summary provides an insight aboutprimary school feeding in Lesotho. Itis informed by the two studies thatwere carried out by Roy Carr-Hill,Molapi Sebatane and Martin Caraher
in 2002 on the Evaluation of the Feeding Schemein Lesotho and the School Feeding Baseline Sur-vey that was carried out by Dikokole Maqutu,Maletela Tuoane and Veronique Sainte-Luce in2003. Other information was acquired from in-terviews with SSRFU and WFP. The summarytakes account of the three school feedingprogrammes that exist in Lesotho. Those are theWorld Food Programme (WFP) schools feedingprogramme, the schools self-reliance programmeand the Free Primary Education (FPE) feedingprogramme.
School Feeding in Lesotho
Primary school feeding in Lesotho started in1961 with assistance from Save the Children’sFund in the 10 schools in the lowlands. WFPtook over in 1965 covering all the schools in
the lowlands, highlands and foothills. The ob-jectives of WFP feeding programme was to alle-viate short-term hunger, to improve concentra-tion span and to increase attendance of primaryschool children. WFP started phasing out itsassistance to schools in the lowlands in 1990/91 assisting schools in the highlands and foot-hills. It was substituted with self-reliance project.With the self-reliance project, schools were givensmall-scale agricultural inputs in order to pro-mote self-sufficiency and to promote what wascalled “education for production.” The thirdschool feeding programme was that which camewith the government of Lesotho’s introductionof Free Primary Education in 2000. It wasphased in annually and by grade. It currentlycovers standards 1–6 in 2005. With the FPE feed-ing the aim was to increase enrolment and toalleviate poverty. However, the two main feed-ing programmes are the WFP and the FPE feed-ing programme. The self-reliance programme iscomplimentary to the two programmes becauseit runs concurrently with those in schools whereit exists. Another complimentary project is theSecure the Child (STC) project initiated byCARE Lesotho-South Africa. It is also of a self-reliance nature.
Summary of Primary SchoolFeeding Programs in Lesotho
By Liako Selokoma
ANNEX 3.1
T

150 Primary and Secondary Education in Lesotho
WFP Feeding Programme
WFP currently implements a feeding projectcalled “Support to Free Primary Education,”which started in March 2004 and will end inDecember 2007. This project has replaced theprevious projects; the Country Programme10151 that served the highlands and the Re-gional EMOP 10200 that responded to the foodshortage crisis in the lowlands and foothills.Support to Free Primary Education feedingproject covers 1325 primary schools, which in-cludes all the classes that are not covered by FPEin the lowlands and foothills.
Distribution of food is done in collaborationwith the Food Management Unit and the Min-istry of Education and Training quarterly. Inorder to improve its operations, WFP establisheda School Feeding Unit, where it increased itsstaffing to monitor implementation of theproject, to provide training to teachers, cooksand feeding managers on issues around hygiene,nutrition, food storage and report writing. Inaddition, the project also provides support toparents and communities who take part in theimprovement of infrastructure facilities such askitchens, storerooms and latrines as well as start-ing up the gardens in schools.
Free Primary EducationFeeding Programme
The Ministry of Education and Training(MOET) covers the following fees; book rentalfee, stationery, feeding and maintenance underFPE. Through the FPE feeding scheme food isbrought into the schools by private caterers whoare contracted to prepare and serve meals to thepupils. They are paid M2.00 per child per day.The meals consist of a morning snack of softporridge during the morning hours and the mainmeal in the afternoon. The scheme does notcover all the schools in the highlands that arecatered for by WFP schools feeding programme,but pays wages to cooks for preparing and serv-ing meals to children in the WFP schools at a
rate of 70 cents per child per day in thoseschools.
Self-Reliance Programme
The self-reliance programme started when WFPfeeding was faced out in the lowlands. Recently,about 20 schools, 5 from each district ofMokhotlong, Thaba-Tseka, Qacha’s Nek andQuthing were piloted with the self-reliance feed-ing running concurrently with the WFP feeding.Under the programme, schools were providedwith agricultural inputs such as poultry that wereprovided at point of lay and seeds, so that schoolscould start their own agricultural production tofeed the children and sell the remainder of theproduce for sustainability of the project. Imple-mentation of the programme is such that chil-dren produce food themselves and schools in-vite parents to assist in the production of foodin order to promote community participation.
The self-reliance programme used to serve onemain meal between 1100hrs and 1300hrs, withthe suggested menus for different days given ina manual. This feeding programme however,failed in many respects that included lack of closemonitoring of the programme by SSRFU offic-ers and no financial accountability by Principalsfor the agricultural produce that was sold out.Schools under the programme were then forcedto buy local food rather than produce it. It wasdue to these problems that the self-reliance ele-ment was based on the fact that local producewas being used as per prescribed menus. Par-ents were also required to contribute some feed-ing fee in order to fund feeding in the self-reli-ant schools.
A guide is also given to schools on the selec-tion criteria for caterers and cooks, which rec-ognizes unemployed women as priority. TheSchools Self Reliance and Feeding Unit Districtofficers monitor the programme, although thisis not done regularly due to shortage of staff.
The self reliance project is overshadowed byFPE feeding and the WFP feeding. One wouldthink of a problem being that food is brought

Annex 3.1: Summary of Primary School Feeding Programs in Lesotho 151
into the schools either by caters under the FPEfeeding or by WFP and schools do not under-stand the need to push their own production tosustain feeding. Even if schools do not produceon their own, they would still get food from FPEand WFP.
The Secure the Child project which was initi-ated by CARE Lesotho-South Africa operatesin 21 schools in the districts of Mokhotlong andMohale’s Hoek. It is in the form of a self-reli-ance project. Its overall objective is to promotesustainable food safety nets for orphans andvulnerable children that protect and uphold theirbasic right to food. CARE Lesotho-South Af-rica is executes STC with WFP, MOET, GROWand Rural Self Help Development Association(RSDA). According to the project document, twolocal NGOs, GROW and RSDA are implement-ing STC under a sub grant arrangement. GROWcovers 9 schools in Mokhotlong while RSDAcovers 12 schools in Mohale’s Hoek. MOETimplements STC at national level and houses theSTC offices within the ministry.
CARE Lesotho-South Africa funds the projectfor starting up gardens in schools for produc-
tion. It provides schools with agricultural inputs.Parents are invited to work and are paid withfood for the work they have done by WFP.
The table below summarizes the operationsof the feeding programmes in Lesotho showingthe objectives, types of food provided, cost, im-pact and problems of the programmes.
Reaction to the recommendations
In order to address some of the recommenda-tions which have been made by the studies;
• MOET is going to develop the School Healthpolicy to address issues around hygiene andsanitation.
• Pit latrines and borehole water supplies arebeing built in new schools and in some exist-ing schools.
• WFP has increased in staff in order to regu-larize its monitoring of the school feeding.
• The use of fuel-saving stoves is being pilotedin about 30 schools. This aims at improvingfood preparation and reducing by 50% fuelwood consumption in schools.
Current Operations of the school feeding programmes in Lesotho
Free Primary Education(FPE) FEEDING World Food Programme Self-Reliance Projects Secure the Child Project
Objectives:
• To increase enrol-ment.
• To alleviate poverty.
• To provide nutritionalsupport to children.
• Provide meals in themorning hours toimprove children’sconcentration inclass.
• To overcome short-term hunger.
• To encourage self-sufficiency.
• To encourageeducation for produc-tion.
• To develop 21 schoolsgardens in Mohale’sHoek and Mokhotlongthat are worstaffected by food crisisand insecurity.
• Improve awareness inLesotho of the rightsof children and thedevelopment ofappropriate safetynets that promotesustainable foodsecurity.
(continued on next page)

152 Primary and Secondary Education in Lesotho
Current Operations of the school feeding programmes in Lesotho (continued)
Free Primary Education(FPE) FEEDING World Food Programme Self-Reliance Projects Secure the Child Project
Distribution:
Local caterers are hiredto provide stipulatedmeals. Caterers are paidM2.00/child/day.
Distributed by FMU at thebeginning of every quarter,two weeks before schoolsre-open. Cooks are paidM0.70 in the highlandsincluding Std 7 cooks inthe lowlands and foothills.Cooks buy sugar, salt andfuel, repayment of whichis covered in the M0.70.
Agricultural inputs aredistributed to schools, sothat they could start theirown production.
Agricultural inputs aredistributed to schools, sothat they could start theirown production.
Types of food provided:
Every day: Children aregiven mid-morning snackin the form of porridge.
Mon: Mealie pap andmoroho (green leafyvegetables).
Tue: Bread with soup(bean or peas soup).
Wed: Mealie pap, morohoand boiled egg.
Thurs: Samp and beans.
Fri: Mealie pap and boiledmilk.
Note: This kind of food isprovided to classes thatare under FPE coverage inthe lowlands and foothillsonly. For Std 7 pupils, themenu is that of WFP.
Maize meal, pulse (peasand beans), cooking oil.
Non-food materials arealso provided in con-junction with GTZ: pots,plates, cutlery (servingspoons), buckets fuel-saving stoves (inselected pilot schools),construction of kitchensand stores.
Seeds and poultry areprovided
Seeds are provided.
Cost:
M101,213,907 (actualexpenditure for FY 04/05).
The total cost of theproject is:
$14,452,294.
The cost was M2,000,000in 2002. The project wasexpected to be sustain-able afterwards. Noallocations of the capitalnature are given for theself-reliance project. Therecurrent budget isavailable.
Funds held and dis-bursed directly fromCARE -Lesotho-SouthAfrica.
(continued on next page)

Annex 3.1: Summary of Primary School Feeding Programs in Lesotho 153
Current Operations of the school feeding programmes in Lesotho (continued)
Free Primary Education(FPE) FEEDING World Food Programme Self-Reliance Projects Secure the Child Project
Impact:
Positive
• Alleviate poverty.
Negative
• Promotes depen-dency syndrome.
Positive
• Improvement inchildren’s diet.
• Increased atten-dance.
• Increased communityparticipation includingparents.
• Facilitates productiveactivities.
Negative
• Promotes depen-dency syndrome.
Positive
• Encouraged self-sufficiency and self-reliance.
Negative
• Does not address theimmediate problem ofpoverty.
Positive
Encouraged self-sufficiency and self-reliance.
Problems
• Payment of catererstakes a long time toprocess, which delaysthe purchase of foodand the activities ofschool feeding ingeneral.
• Some foodstuffs arenot available locally,so the caterers haveto travel to buy them,this may be costly.
• Some schools servemid-morning snack,some do not. In someschools, the mid-morning snack isserved as the mainmeal.
• WFP food schemelacked variation andtherefore otherimportant nutrients.
• Monitoring of theproject is not regular.
• There is no financialaccountability byschool principals onfood sold.
• In some schoolsvegetables fromgardens are ex-hausted before theend of the year.
• Some schools haveterminated thefeeding schemebecause parents arereluctant to pay thefees.
• The project is stillnew, its problemshave not beenidentified yet.


155
Moet Bursary Scheme
Introduction
he Ministry of Education and Train-ing has two bursary schemes at the lev-els of basic (seven years of primary andthe first three years of secondary) andsecondary education. Both the Gov-
ernment of Lesotho (GOL) and the World Bankfund the basic education bursaries under whatis known as the Targeted Equity BasedProgramme (TEBP). The Global Fund funds thesecondary (Forms D and E) bursaries.
1. Targeted Equity Based Programme
Targeted Equity Based Programme, component2.5 of the Education Sector DevelopmentProject, Phase II is a poverty reductionprogramme whose main aim is to increase ac-cess to basic education. The scheme providesbursaries to orphans and vulnerable children.
1.1. Objective
The main objective of the bursary scheme is toreduce the number of children who drop out ofschool due to failure to pay fees, which is a re-quirement of all schools in the country. Secondly,the scheme is geared to retain children who en-roll into schools despite the poor economic sta-tus of their families lest they drop out of school.
1.2. Eligible groups
Eligible groups of children covered by the schemearranged by order of priority are:
• Double orphans.• Single orphans whose remaining parents are
chronically ill.• Children with disabilities /or children whose
parents have severe disabilities that hinderthem from earning a living.
• Abandoned children whose parents’ where-abouts are not known and are living withgrand parents.
• Out-of-school children.
Summary of Bursary Programs in LesothoBy Liako Selokoma and Mrs. ‘Mamohau Mochebelele
Comparison between Moet Bursary Scheme andSocial Welfare Public Assistance
ANNEX 3.2
T

156 Primary and Secondary Education in Lesotho
1.3. Coverage
GOL has introduced Free Primary Education(FPE) that is incremental by standards andwhich is up to standard six in 2005. As a result,standard 7 and junior secondary levels of edu-cation are covered by the scheme. Since pov-erty is rife countrywide, the scheme assists chil-dren in both rural and urban areas in the tendistricts. While the scheme does not differenti-ate between rural and urban children, it doesnot cover children who attend private schoolsand children who go to schools that are not reg-istered with the Ministry of Education andTraining and are therefore considered ‘illegal’schools.
1.4. Fees
The scheme pays
• Registration fee• Tuition fee• Book fee• Examinations fee• Stationery• Practical/special subject fee• Boarding fee
There is no differentiation regarding theamount of fees paid for students in rural andurban areas. The only factor, which determinesthe difference in fees, is fees that are charged byrespective schools.
Payment of fees
Initially disbursement of bursaries to schools wasmade by cheques. However, it was decided thatfees should be paid through the bank. While thissystem has proven quick and more efficient,many primary schools do not have bank ac-counts and are still paid by cheques. This is prob-lematic because a significant number of chequesexpire before they are cashed.
1.5. Administration and management ofthe scheme
The Scholarship Officer who is accountable tothe Chairman of the Bursary Scheme Committee(HQ) manages the Bursary Scheme on a daily basisand reports progress to the Projects Coordinatorwho reports directly to Director of Planning.
The Bursary Office is manned by 13 officersof whom ten are based in the districts and threeat the headquarters. Among other responsibili-ties the Bursary Office liaises with stakehold-ers, designs and processes applications; providesguidance to District Bursary Committees (DBCs)and Advisory School Committees (ASCs) andreports to relevant ministerial authorities.
1.6. Composition of bursary committees
There are three levels to determine if candidatesqualify for support. Committees have been es-tablished to perform this duty. School Commit-tees operate at the school level and District Bur-sary Committees operate at the district level andthe MOET Bursary Committee serves as a Na-tion Bursary Committee.
1.6.1. Advisory School Committee —Village based
• Village chief• School principal• Teacher representative• Proprietor—church representative or MOET
representative in a case of a communityschool.
• Parents’ representative.
Role of the Advisory School Committee
• Identifies children who need support• Assesses bursary applications and recom-
mends qualifying candidates for award ofbursaries.
• Can apply for bursary on behalf of an out-of-school child who is in an exceptionally dif-

Annex 3.2: Summary of Bursary Programs in Lesotho 157
ficult circumstance e.g. a family head child,an abandoned child etc.
1.6.2. District Bursary Committee —District based
• Senior Education Officer• Bursary Field Officer• A Principal Chief• A member of the Urban Board• School principals, representative• A member from World Vision or Red Cross• Representative from the Department of So-
cial Welfare
Role of the District Bursary Committee
• Selects candidates for award of bursaries• Recommends suitable candidates to the
MOET Bursary Committee.• Writes a report to inform future selection pro-
cesses and procedures.
1.6.3. MOET Bursary Committee —Based at the MOET headquarters
• Chief Education Officer—Secondary (Chair-man)
• Director of Planning• Chief Inspector—Central Inspectorate• Chief Inspector Field Services• Financial Controller—PSCU• Financial Controller—MOET• Scholarship Officer
Role of the MOET Bursary Committee
• Assesses and moderates all recommendedapplications.
• Ensures that the District Bursaries Committee’sselection processes and procedures complywith those of the scheme.
• Upon completion, the MOET Bursary Com-mittee recommends and forwards the lists tothe Principal Secretary for approval.
1.7. Letters to chiefs; school principals;parents and members of parliament.
Once disbursement of fees to schools is com-pleted letters to parents and school principalsare drafted and signed by the Principal Secre-tary. Blank copies of letters together with ben-eficiary lists are sent to the districts to be for-warded to the chiefs.
Lists of children who benefit from the schemeare forwarded to the Principal Secretaries officeas well as the Assistant Minister’s office.
1.8. Application procedures
Currently, the Bursary Scheme has structures atthe school level. Advisory School Committeesand School Boards at schools recommend can-didates for award of bursaries. These bodies arerepresentatives of all stakeholders; parent, pro-prietors, local authorities and teachers.
Family Level
In child headed households, children are allowedto write application letters for themselves. How-ever, for children whose parent/guardians arestill alive parents/guardian are expected to ap-ply on behalf of their children. People of good-will and authorities such as principals, DistrictSecretaries, chiefs etc can apply for bursarieson behalf of Orphans and Vulnerable Children(OVCs) who are in exceptionally difficult posi-tions.
School Level
The application procedures at school level aretwo tiered. Firstly, the principal of the schoolhas to ensure that all deserving children in hisschool have and fill in bursary application forms.Thereafter, the principal fills in relevant infor-mation in the application form and invites theschool committee to evaluate applications andrecommend qualifying applicants for award ofbursaries.

158 Primary and Secondary Education in Lesotho
1.9. The selection process
The selection of worthy children is communitybased with chiefs recommending children foraward of bursaries. ASCs further recommendchildren while the DBC performs the actual se-lection of children to be awarded bursaries. Therationale behind the above arrangement is toensure participation of the communities andtransparency to the selection process.
1.10. Budget
The bilateral credit agreement between theGOL and the International Development As-sociation indicates that the partners will eachcontribute 50% of the total sum required topay bursaries.
The budget allocation by district
The bursary allocation model is based on thedistrict population of school going age thatdropped out of school. Again, the budget allo-cation is determined by the primary and second-ary distribution per district. Each district has abudget and will award bursaries on the basis ofthe budget. Thus, the DBC will only award newbursaries if the budget permits.
1.11. Linkages with other Organisations
The Bursary Office collaborates with interna-tional as well as local organizations. It worksclosely with Lesotho AIDS Programme Coor-dinating Agency, Ministry of Health and So-cial Welfare, UNICEF, Office of the First Lady,Office of the Master of the High Court,Lesotho Save the Children etc, which are gov-ernment bodies; Non- governmental organi-zations such as Save the Children (UK), WorldVision etc. It also works hand in hand withUnited Nations agencies such as UNICEF andWFP.
2. Global fund
2.1. Objective
The objective of the education component of theGlobal Fund project in Lesotho is to ensure thateducation and learning opportunities are pro-vided to HIV and AIDS orphans.
2.2. Eligible children and schools
Unlike the bursary scheme for primary and sec-ondary students, only orphans benefit. Thisscheme supports double orphans and single or-phans in Forms D and E. Secondly, only highschools benefit from this arrangement for it isrealized that organizations that used to supportvulnerable children with school fees have eitherclosed down or have stopped supporting or-phans e.g. NMDS, the Department of SocialWelfare; Save the Children Fund; etc. It was alsorealized that children currently benefiting fromthe MOET Bursary Scheme would not continueschooling after Form C if an opportunity is notcreated for them. Only registered high schoolsbenefit from this programme.
2.3. Application process and procedures
In January 2004, the Ministry of Health andSocial Welfare approached the MOET to assistto process bursary applications for HIV andAIDS orphans to be supported under the Glo-bal Fund. It was decided that charity institutionsshould submit lists of orphans seeking assistance.Many institutions that submitted applicationsoperate in villages and this was deemed advan-tageous because most of them would bring inout-of-school children. Applications in the formof letters were received from
• The Office of the First Lady• AIDS District Task Forces• World Vision• Department of Social Welfare• Office of the Master of the High Court

Annex 3.2: Summary of Bursary Programs in Lesotho 159
• Ministry of Education and Training (applica-tions only)
The Scholarship Officer- MoET, the then Eco-nomic Planner LAPCA and an officer from theMinistry of Finance and Development Planningcompiled lists from other institutions jointly.Since the lists did not match funds available,MOET sent forms to secondary and high schoolsto fill for both double and single orphans. Aftercompilation, a report was written and submit-ted to the Ministry of Health and Social Welfarefor approval and disbursement of bursaries.
Social Welfare
Introduction
New intakes into the Ministry of Health andSocial Welfare and the Ministry of Finance andDevelopment Planning in the National Man-power Development Secretariat (NMDS) bur-sary assistance were stopped in 2002. Assistanceexists with the on-going pupils in Primary andSecondary Schools. As a result, the explanationbelow shows what used to happen when newintakes were selected into the bursary schemewhich is to some extent still used when reas-sessing the existing pupils.
Social Welfare administers Public Assistance(PA) which is the monthly allowance of M100targeted to the destitute and poor people whofall under orphans, the severely disabled, theseverely ill or the very elderly. In to be eligiblefor PA, one must be in a household without regu-lar income, or the monthly income within thehousehold should be less than M150; or withina household with livestock or assets which cangenerate a monthly income of less than M150.
Assessment for eligibility into the PA assis-tance is based on the applicant’s situation at thetime of application. The same method of assess-ment is used for eligibility of pupils into thebursary assistance for primary grades which arenot covered by Free Primary Education and for
secondary levels. However, the budget and fundscome from NMDS while Social Welfare makesthe selection.
Selection Procedure
A needy child can apply for bursary him/herselfor a parent/guardian/relative/people of good willcan apply on behalf of the child. The applicantobtains a letter from the chief that certifies thathe/she is needy. The applicant takes the applica-tion letter to Offices of the Social Welfare. Uponsubmission of the application, a Social Workerinterviews the applicant and fills the assessmentform about the applicant. As a follow-up as-sessment, the social worker then goes to visitthe family which the child lives in. If on the ba-sis of the selection criteria the Social Worker issatisfied that the child is needy he/she approvesthe application and lets the applicant know im-mediately that they will be awarded bursary. TheSocial Worker then writes a letters to the Princi-pals showing a list of pupils that will be awardedbursaries. The Social Workers from the ten dis-tricts send lists of needy children to the SocialWelfare Headquarters. A list is then compiledand sent to NMDS to process payment. No que-ries are made from the Headquarters when theDistrict Social Workers have recommended thechildren for award of bursaries.
Fees
All the fees are paid for (books, tuition, exami-nation and other fees) according to the individualchild’s need. In some cases uniforms are boughtfor the child, while in other cases parents or rela-tives can afford to buy uniform or some itemsof the uniform and do not require SocialWelfare’s assistance in that regard.
Payment Process
In order to process payment to schools, Princi-pals fill in three (3) Claim Forms. One form is

160 Primary and Secondary Education in Lesotho
submitted to Social Welfare, the other is sub-mitted NMDS and the last form is submittedto the Treasury Department of the Ministry ofFinance and Development Planning for pay-ment.
Budget
Social Welfare does not budget for the bursa-ries and therefore does not have a limited num-ber of children to select. However, they put abudget limit of M300 and M3,000 per assistedprimary and secondary pupil respectively, peryear. Bursaries are budgeted for by NMDS andthe Social Welfare is not informed of how muchthe budget amount is for the bursaries eachyear.
Monitoring
Social Workers have to visit schools regularlyto ensure that the beneficiaries of the bursariesare still in school. However, due to lack of hu-man resource and transport, this kind of moni-toring is not carried out regularly. The onlymonitoring that is in place is the use of pupils’End-of-year Performance Reports, which areused for renewal of the bursaries each year. Ifthe child fails, he/she is not considered for bur-sary the following year.
Since the Social Welfare is concerned aboutthe situation of the child at a period in ques-tion, reassessments are made even for childrenwho have passed their exams, to check if theyare still eligible for the bursary. If their situationhas improved, they are not assisted.

161
Preamble:
he history of Education in Lesothobears its origin from the ChristianMissionaries (1833). For more than100 years the British Colonial Govern-ment left education entirely in the
hands of the churches, namely, the Paris Evan-gelical Missionary Society (PEMS) now LesothoEvangelical Church, the Roman CatholicChurch and the Anglican Church in Lesotho.Recently the smaller other churches own a fewschools.
The only government school which was es-tablished in the pre-independent Lesotho wasBasutoland High School (50 years) now knownas Lesotho High School. This was started as adepartment of the Ministry of Education andhas remained so to date. Though the principaland teachers at Lesotho High School are remu-nerated by the Teaching Service, the school it-self remains a government department, with itsbursar directly responsible to the Treasury cadre.
In recent years, mainly after independence,the government of Lesotho has gradually estab-lished its own schools, not because there wasany pressure because the common assumptionfrom both the government and the church was
that all schools assumed the status of publicschools. This understanding remained as longas there were cordial relationships between gov-ernment and the church, but in some instances,when government wanted to make some im-provements or changes that were not in thechurch’s favour, some scuffles ensued.
For many years, at least from 1970s, govern-ment secondary schools with status not similarto Lesotho High School were:
1. Hlotse High School in Leribe2. Mohale’s Hoek High School in Mohale’s
Hoek3. Maseru High School in Maseru, and4. Maseru Day High School in Maseru.From mid 1980s new ones were added, namely5. Mafeteng High School in Mafeteng6. Qacha’s Nek High School in Qacha’s Nek7. Sechaba High School in Leribe8. Thetsane High School in Maseru9. Sekonyalela Secondary School in Mokhotlong
Machabeng High School, now MachabengCollege is another government school estab-lished mainly to meet the needs of the childrenof international diplomats assigned to Lesotho.The Administration of this school has been dif-
Subvention for GovernmentSecondary Schools
Ms. Liteboho L. Maqalika-Lerotholi and Mr. S’khulumi Ntsoaole
ANNEX 3.3
T

162 Primary and Secondary Education in Lesotho
ferent from the rest of the other schools.Machabeng High School Subvention has beendetermined by Cabinet in recent years.
The Origin of Subventions
While government secondary schools alsocharged school fees in a manner determined bythem, the government, through the Ministry ofEducation found it necessary to provide themwith small cash for starting and maintainingprojects such as poultry, piggery, garden pro-duce, etc. Around 1995 the subvention given tothe first 4 government secondary school wasM10 000 each. To monitor the use of funds in-cluding subvention in these schools, the Minis-try of Education appointed auditors who werepaid by the individual schools to audit the booksannually.
When the new schools were established, theirsubvention differed from the old schools.Mafeteng, Qacha’s Nek, Thetsane and SechabaHigh schools’ subvention started with M60 000each per annum. No specific reason for the de-cision was made expect that the schools werenew and would need more money to meet theirneeds. So, all schools that received subventionwere now required to make annual subventionbudgets on the fixed amounts given to them.In other words, the subvention budget wasdriven by the fixed allocation while in ideal fi-nancial situations the school requirementswould determine the subvention required byeach school.
In 2000 the then Principal Secretary increasedsubvention for new secondary schools to M100000 while the old schools subvention came to
M60 000 per year. Although the subvention wasmeant specifically for projects, some schools’projects have been very poor and they decidedto use their subventions to cover certain areaswhich could not be covered by the school fees.The schools’ projects have ranged from rearinganimals to building teachers’ quarters and newclassrooms. Some schools have used subventionfor renovation and maintenance, thus ignoringcritical financial practices of including mainte-nance in their regular annual budgets.
It can not be justified why government schoolsreceive subvention because even their mode ofcollecting school fees differs and charge differ-ent fees.
Way forward and recommendations
The way forward with fees and subventions ingovernment schools could be a starting pointfor rationalizing school fees in Lesotho in gen-eral. Putting all government schools at par withLesotho High School where fees are low andare paid into the Ministry’s Accounts depart-ment could bring equity and address the seem-ing imbalances in enrolments. Coupled with theenvisaged amendments of the 1995 EducationAct, the leadership in rationalizing fees in gov-ernment schools would provoke debate to fol-low suit in the proposed public schools.
To address the question of transparency inthe use of school fees and any funding in theschools, a strong financial management systemshould be established with strict regulations andenforcement agencies. Special auditors shouldbe put in place to monitor the use and advicethe Ministry regularly.

163
ANNEX 4.1
Table:Incidence of orphanhood among children below 15 years, Lesotho and other African countries circa 2000(percentage)
Orphans
Sample Father Mother Bothsize Non-orphans dead dead parents dead Total Total
Lesotho, 2000 12,004 84.2 12.1 2.1 1.6 15.8 100.0
Age group
0–5 years 4,438 91.0 7.7 0.8 0.5 9.0 100.0
6–14 years 7,566 80.2 14.7 2.9 2.2 19.8 100.0
Location
Urban 2,261 85.7 11.1 2.1 1.1 14.3 100.0
Rural 9,733 83.9 12.3 2.1 1.7 16.2 100.0
District
Butha-Buthe 753 84.2 11.7 1.9 2.2 15.8 100.0
Leribe 1,686 84.6 11.4 2.1 1.8 15.3 100.0
Berea 1,511 86.0 9.7 2.4 1.7 13.9 100.0
Maseru 2,470 83.3 13.4 1.6 1.6 16.6 100.0
Mafeteng 1,480 84.9 11.7 2.5 0.9 15.1 100.0
Mohale’s Hoek 1,136 78.6 14.9 2.9 3.5 21.3 100.0
Quthing 809 85.9 11.0 2.4 0.7 14.1 100.0
Qacha’s Nek 442 85.3 13.8 0.7 0.2 14.7 100.0
Mokhotlong 705 85.5 11.3 2.3 0.8 14.4 100.0
Thaba-Tseka 1,002 85.4 11.7 2.1 0.8 14.5 100.0
Other African countries
Ghana, 1998 9,783 93.7 3.6 1.9 0.8 6.3 100.0
Kenya, 1998 16,881 89.8 6.5 1.8 1.9 10.2 100.0
Malawi, 2000 28,888 88.3 6.5 2.9 2.3 11.7 100.0
Mozambique, 1997 19,891 86.6 6.7 4.2 2.5 13.5 100.1
Namibia, 1992 11,123 90.5 5 1.5 3 9.5 100.0
(continued on next page)

164 Primary and Secondary Education in Lesotho
Table: (continued)Incidence of orphanhood among children below 15 years, Lesotho and other African countries circa 2000(percentage)
Orphans
Sample Father Mother Bothsize Non-orphans dead dead parents dead Total Total
Niger, 1998 17,701 93.4 3.3 2 1.3 6.6 100.0
Tanzania, 1999 8,339 90.9 5.3 2.2 1.6 9.1 100.0
Uganda, 2000 18,449 87.2 7.2 2.9 2.7 12.7 99.9
Zambia, 1996 18,107 87.4 7.4 2.9 2.3 12.6 100.0
Zimbabwe, 1999 11,999 84.7 9.3 2.6 3.4 15.3 100.0
Sources: author’s calculation for Lesotho based on the 2000 MICS Survey; for all other countries: World Bank 2005,Education in Ethiopia: Strengthening the Foundation for Sustainable Progress, Washington DC.

165
ANNEX 4.2
Table: Distribution of new entrants in Standard 1 by age in the school census, Lesotho 1999–2003(percentage)
1999 2000 2001 2002 2003
Age
<6 years 5.9 5.0 7.8 7.6 7.1
6 years 34.2 29.8 38.4 42.3 44.6
7 years 27.2 24.9 26.3 27.0 28.4
8 years 14.2 14.1 11.2 11.0 10.2
9 years 8.4 8.7 5.7 4.9 4.4
10 years 4.8 6.7 3.9 2.7 2.2
11 years 2.5 4.1 2.5 1.6 1.2
12 years and more 2.9 6.8 4.3 2.8 1.8
Total 100.0 100.0 100.0 100.0 100.0
Number of new entrants 51,778 98,517 69,597 60,250 59,390
Source: author’s calculation based on the 1999-2003 school censuses.


167
ANNEX 4.3
Table:Means of variables in the logit model of nonparticipation to school
2000 2002
Whole 6–8 9–12 13–14 6–8 9–12 13–14sample years years years Total years years years
Child characteristics
Age 10.1 6.96 10.5 13.5 10.2 6.9 10.6 13.5
Boy (girl) 50.1 49.4 51.7 47.8 49.7 50.8 50.0 47.9
Orphanhood status (both parents alive)
Mother alive-father dead 13.6 11.2 14.0 16.1 - - - -
Father alive-mother dead 2.7 2.0 2.9 3.4 - - - -
Both parents dead 2.1 1.4 2.1 3.0 - - - -
Household head characteristics
Male (female) 1.280 1.271 1.286 1.279 66.6 67.8 66.5 65.2
Age (in years) 51.1 49.6 51.3 52.6 49.9 48.9 50.2 50.7
Education (no schooling)
Primary education 60.3 60.3 60.1 60.9 54.3 53.5 55.1 53.8
Secondary or higher education 14.8 16.4 13.9 14.2 16.2 16.3 16.0 16.5
Household income group (poorest)
Second 21.1 20.9 21.8 19.9 20.3 19.2 20.3 21.6
Middle 21.3 20.3 21.2 22.7 20.0 20.2 20.0 19.9
Fourth 20.0 20.1 19.8 20.1 17.6 17.5 18.0 17.2
Richest 19.7 19.7 19.7 19.6 19.0 18.6 18.6 20.1
Household composition
Members less than 6 years old (%) 11.5 12.9 11.2 10.0 15.0 20.1 13.3 11.2
Members more than 14 years old (%) 50.7 48.8 51.1 52.8 55.6 52.0 53.9 63.4
(continued on next page)

168 Primary and Secondary Education in Lesotho
Table: (continued)Means of variables in the logit model of nonparticipation to school
2000 2002
Whole 6–8 9–12 13–14 6–8 9–12 13–14sample years years years Total years years years
Distance to nearest primary school (<15 minutes)
15–29 minutes — — — — 24.9 24.5 24.6 25.7
30–44 minutes — — — — 23.2 23.2 22.8 23.9
45–59 minutes — — — — 11.5 11.0 11.5 12.3
>= 60 minutes — — — — 19.6 19.3 20.0 19.4
Living in rural area (in urban area) 81.5 81.3 81.5 81.9 74.4 75.2 74.4 73.2
District (Butha-Buthe)
Leribe 13.3 13.9 13.2 12.8 10.1 10.0 9.5 11.5
Berea 12.7 12.7 12.4 13.0 9.9 10.9 9.1 10.2
Maseru 20.7 21.0 20.4 20.8 9.9 9.6 9.6 10.7
Mafeteng 13.0 12.4 13.5 12.6 9.6 9.6 9.8 9.3
Mohale Hoek 9.8 9.5 9.4 11.0 9.6 8.2 10.3 9.9
Quthing 6.8 7.7 6.2 6.7 9.8 10.0 10.0 9.3
Qacha’s Nek 3.7 3.7 3.8 3.4 10.6 10.1 10.9 10.6
Mokhotlong 5.7 6.1 5.6 5.5 10.1 10.4 10.2 9.5
Thaba Tseka 8.0 7.5 8.4 7.7 10.3 11.5 10.1 9.2
Has never been to school 11.7 18.6 6.9 7.0 11.5 20.9 6.6 6.6
Number of observations 6,893 2,178 3,126 1,589 5,553 1,765 2,410 1,378
a/ Omitted category of dummy variables in parentheses. Means of dummies variables expressed in percentage.
Source: author’s calculation based on the 2000 MISC Survey and the 2002 CWIQ survey

169
ANNEX 4.4

170 Primary and Secondary Education in Lesotho
Table:Promotion, repetition and dropping out rates by grade, Lesotho 2000 (percentage) a
Standard 1 Standard 2 Standard 3 Standard 4
Advance Repeat Drop Advance Repeat Drop Advance Repeat Drop Advance Repeat Drop
Gender
Boys 67.2 27.0 5.7 88.8 6.8 4.4 85.7 8.4 5.9 90.3 5.6 4.1
Girls 71.4 22.8 5.9 88.9 7.6 3.5 88.7 5.7 5.7 93.4 3.2 3.4
Wealth index
Poorest 69.7 20.2 10.1 87.9 8.5 3.5 86.2 6.5 7.3 92.5 4.3 3.2
Second 67.9 23.5 8.6 86.5 4.3 9.1 85.6 5.2 9.2 88.5 3.1 8.5
Middle 68.9 25.2 5.9 88.7 7.5 3.8 86.4 6.3 7.3 90.7 6.2 3.1
Fourth 66.9 28.9 4.2 88.3 9.3 2.4 86.4 9.2 4.4 92.5 4.6 2.9
Richest 73.6 25.9 0.5 92.8 6.7 0.5 91.2 7.6 1.2 94.8 3.1 2.1
Orphanhood status
Both parents alive 69.0 26.4 4.6 89.7 7.9 2.4 89.2 7.1 3.7 92.9 4.5 2.6
Mother alive- father dead 71.5 22.8 5.7 91.3 6.3 2.4 87.1 6.9 6.0 95.8 4.2 0.0
Father alive- mother dead 77.8 20.0 2.2 86.4 9.1 4.5 84.6 0.0 15.4 92.9 7.1 0.0
Both parents dead 60.0 26.7 13.3 90.9 0.0 9.1 73.3 6.7 20.0 92.9 7.1 0.0
Total orphans 72.0 22.5 5.5 90.6 5.8 3.5 85.4 5.7 8.9 95.0 5.0 0.0
Location
Urban 70.9 25.1 4.3 93.9 3.7 2.2 92.5 3.7 3.8 95.6 3.1 1.3
Rural 68.7 25.6 6.1 87.7 8.0 4.4 86.0 7.9 6.2 91.0 4.6 4.4
District
Butha-Buthe 85.9 6.3 7.8 88.2 5.9 5.9 91.0 1.6 7.5 92.6 1.5 5.9
Leribe 64.3 30.4 5.5 88.9 9.6 1.5 88.6 7.9 3.5 92.9 4.4 2.7
Berea 68.3 25.5 6.2 90.2 3.9 5.7 89.8 6.1 4.1 89.8 3.8 6.5
Maseru 70.2 24.0 6.7 88.8 6.1 5.1 84.0 9.0 7.2 96.5 2.0 1.4
Mafeteng 65.6 30.2 4.8 87.4 9.7 3.1 87.2 5.7 7.2 87.3 9.8 2.9
Mohale’s hoek 67.5 26.2 7.9 87.7 5.9 6.2 93.5 4.2 2.2 90.3 4.9 4.8
Quthing 73.8 21.0 6.0 89.5 8.0 2.6 76.5 10.9 13.2 86.4 9.4 4.5
Qacha’s nek 72.9 24.0 2.1 97.4 0.0 2.6 88.2 5.9 5.9 96.0 0.0 4.0
Mokhotlong 73.5 24.5 2.0 84.9 11.5 3.8 97.2 2.7 0.0 92.0 0.0 8.0
Thaba-tseka 65.9 28.2 4.9 88.5 9.0 2.6 79.6 16.0 4.1 100.0 0.0 0.0
Lesotho 69.2 25.1 5.8 88.9 7.2 4.0 87.2 7.1 5.8 92.0 4.3 3.7
a/ Cells are left empty where the number of observations is too small to calculate reliable promotion, repetition and dropping out rates.Source: author’s calculation based on the 2000 MISC Survey
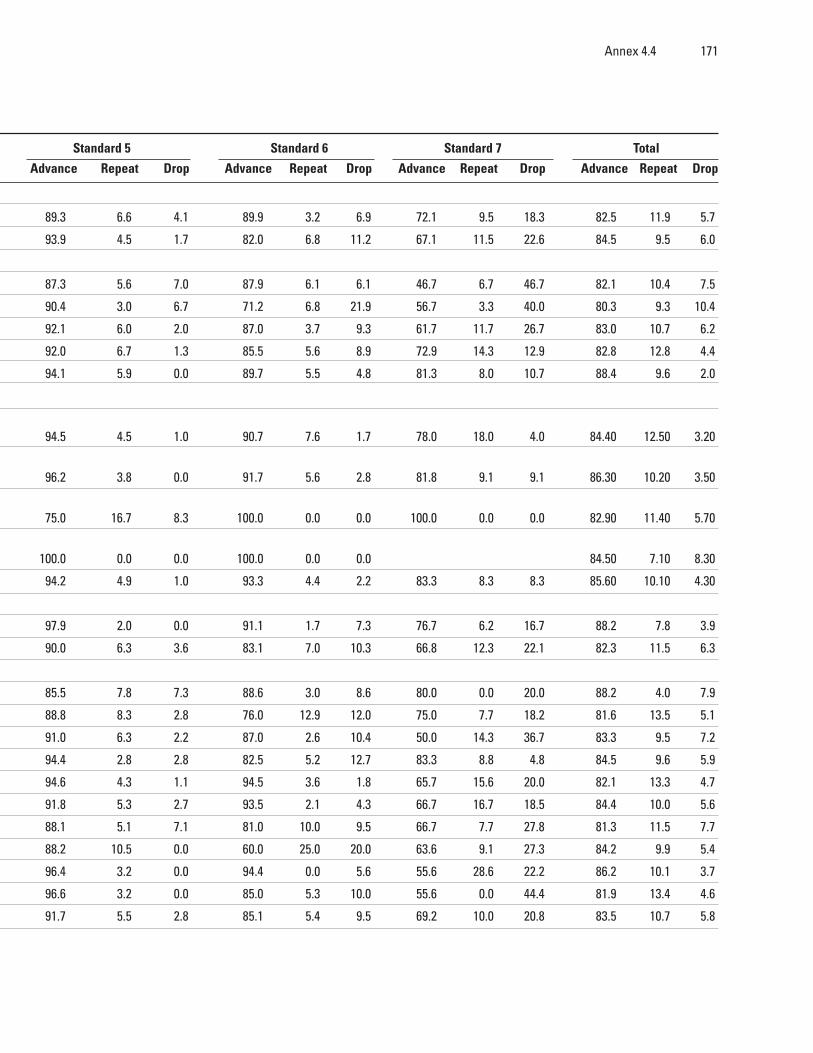
Annex 4.4 171
Standard 5 Standard 6 Standard 7 Total
Advance Repeat Drop Advance Repeat Drop Advance Repeat Drop Advance Repeat Drop
89.3 6.6 4.1 89.9 3.2 6.9 72.1 9.5 18.3 82.5 11.9 5.7
93.9 4.5 1.7 82.0 6.8 11.2 67.1 11.5 22.6 84.5 9.5 6.0
87.3 5.6 7.0 87.9 6.1 6.1 46.7 6.7 46.7 82.1 10.4 7.5
90.4 3.0 6.7 71.2 6.8 21.9 56.7 3.3 40.0 80.3 9.3 10.4
92.1 6.0 2.0 87.0 3.7 9.3 61.7 11.7 26.7 83.0 10.7 6.2
92.0 6.7 1.3 85.5 5.6 8.9 72.9 14.3 12.9 82.8 12.8 4.4
94.1 5.9 0.0 89.7 5.5 4.8 81.3 8.0 10.7 88.4 9.6 2.0
94.5 4.5 1.0 90.7 7.6 1.7 78.0 18.0 4.0 84.40 12.50 3.20
96.2 3.8 0.0 91.7 5.6 2.8 81.8 9.1 9.1 86.30 10.20 3.50
75.0 16.7 8.3 100.0 0.0 0.0 100.0 0.0 0.0 82.90 11.40 5.70
100.0 0.0 0.0 100.0 0.0 0.0 84.50 7.10 8.30
94.2 4.9 1.0 93.3 4.4 2.2 83.3 8.3 8.3 85.60 10.10 4.30
97.9 2.0 0.0 91.1 1.7 7.3 76.7 6.2 16.7 88.2 7.8 3.9
90.0 6.3 3.6 83.1 7.0 10.3 66.8 12.3 22.1 82.3 11.5 6.3
85.5 7.8 7.3 88.6 3.0 8.6 80.0 0.0 20.0 88.2 4.0 7.9
88.8 8.3 2.8 76.0 12.9 12.0 75.0 7.7 18.2 81.6 13.5 5.1
91.0 6.3 2.2 87.0 2.6 10.4 50.0 14.3 36.7 83.3 9.5 7.2
94.4 2.8 2.8 82.5 5.2 12.7 83.3 8.8 4.8 84.5 9.6 5.9
94.6 4.3 1.1 94.5 3.6 1.8 65.7 15.6 20.0 82.1 13.3 4.7
91.8 5.3 2.7 93.5 2.1 4.3 66.7 16.7 18.5 84.4 10.0 5.6
88.1 5.1 7.1 81.0 10.0 9.5 66.7 7.7 27.8 81.3 11.5 7.7
88.2 10.5 0.0 60.0 25.0 20.0 63.6 9.1 27.3 84.2 9.9 5.4
96.4 3.2 0.0 94.4 0.0 5.6 55.6 28.6 22.2 86.2 10.1 3.7
96.6 3.2 0.0 85.0 5.3 10.0 55.6 0.0 44.4 81.9 13.4 4.6
91.7 5.5 2.8 85.1 5.4 9.5 69.2 10.0 20.8 83.5 10.7 5.8


173
ANNEX 5.1
Primary teacher qualifications by school type (2003)
Qualification Gov. Community LEC RCM ACL AME Others Private Total
Primary school 0.4 2.0 0.4 0.4 0.1 0.0 0.6 0.0 0.4
Junior Certificate 7.0 7.4 13.8 9.1 12.0 8.3 13.4 0.0 11.1
COSC 43.9 18.7 21.1 18.5 20.0 29.3 31.3 21.4 21.1
COSC and pre-service 30.3 50.5 35.2 37.5 32.3 25.6 29.6 71.4 36.0
COSC and in-service 14.3 14.0 22.5 26.1 28.3 28.6 21.0 7.1 24.0
Higher and pre-service 1.7 2.5 0.1 0.1 0.0 0.0 0.0 0.0 0.2
Higher and in-service 0.4 0.5 0.8 0.7 1.3 0.8 1.1 0.0 0.8
Unknown 2.1 4.5 6.2 7.7 6.1 7.5 3.1 0.0 6.5
Total 100.0 100.0 100.0 100.0 100.0 100.0 100.0 100.0 100.0
Teachers teaching multigrade
Primary school 1.0 0.0 0.1 0.9 0.4 0.0 0.0 0.0 0.5
Junior Certificate 6.0 9.0 17.9 12.6 15.5 17.1 12.4 0.0 14.3
COSC 41.0 17.2 30.4 25.3 27.1 36.6 39.5 25.0 28.4
Secondary and pre-service 34.0 49.2 28.3 31.0 27.1 12.2 27.2 75.0 30.5
Secondary and in-service 13.0 14.8 17.3 21.2 22.7 26.8 17.3 0.0 19.1
Higher and pre-service 1.0 2.5 0.0 0.0 0.0 0.0 0.0 0.0 0.2
Higher and in-service 1.0 0.8 0.1 0.5 0.8 0.0 1.2 0.0 0.5
Unknown 3.0 6.6 5.9 8.5 6.4 7.3 2.5 0.0 6.6
Total 100.0 100.0 100.0 100.0 100.0 100.0 100.0 100.0 100.0
Teachers teaching monograde
Primary school 0.0 2.8 0.5 0.2 0.0 0.0 0.7 0.0 0.4
Junior Certificate 7.5 6.8 12.6 8.1 11.1 4.4 13.7 0.0 10.2
COSC 45.5 19.3 18.5 16.6 18.2 26.1 28.9 16.7 19.0
Secondary and pre-service 28.3 50.9 37.2 39.3 33.6 31.5 30.3 66.7 37.5
Secondary and in-service 15.0 13.7 23.9 27.4 29.6 29.4 22.0 16.7 25.4
Higher and pre-service 2.1 2.5 0.1 0.1 0.0 0.0 0.0 0.0 0.2
Higher and in-service 0.0 0.3 0.9 0.7 1.4 1.1 1.1 0.0 0.9
Unknown 1.6 3.7 6.3 7.5 6.1 7.6 3.3 0.0 6.4
Total 100.0 100.0 100.0 100.0 100.0 100.0 100.0 100.0 100.0


175
Secondary teacher qualifications by school type (2003)
ACL AME Community Government LEC Others Private RCM Total
Masters Degree 4 8 7 4 3 3 26 4 4
Bachelors Degree 53 40 53 55 46 61 50 48 50
Diploma 12 7 15 13 12 13 9 13 13
Advanced Certificates 1 0 0 0 0 0 0 1 1
Secondary Teachers Certificate 14 11 10 11 21 15 7 18 17
Secondary Technical Teachers Certificate 3 1 0 3 2 0 0 2 2
Teachers Certificate 1 0 1 3 1 0 0 1 1
Cambridge Overseas School Certificate 8 23 9 4 10 2 5 7 8
Joint Matriculation Board Certificate 0 0 0 0 0 2 0 0 0
Primary Teachers Certificate 1 0 2 1 1 1 0 1 1
Other Certificates 1 7 1 2 1 2 0 2 1
COSC & JC Plus In-Service Education 0 0 0 0 0 1 0 0 0
Associate of the College of Preceptors 2 10 2 4 3 4 3 4 3
Unknown 0 0 1 1 0 1 0 1 1
ANNEX 5.2


177
Average years of experience for current teachers.
All teachers Government Community LEC RCM ACL AME Others Private Total
Mountains 5 10.4 11.6 14.3 11.6 10.2 10 4.7 12.5
Lowlands 10.8 12.7 15.3 18.3 15.9 15.8 10.8 11.3 15.7
Senqu River Valley 4.9 13 15.7 12.9 13.8
Foothills 8.4 10.2 14.1 15.3 13 10.1 8 14.2
Unknown 6.7 5.1 6.3
Total 8.3 12.3 14 16.3 14.4 14.1 10.2 9.9 14.5
Male teachers
Mountains 6.2 7 10.3 14.6 10.2 8.3 9 12.1
Lowlands 8.1 11.6 13.1 14.7 13.1 9.2 9 10 12.9
Senqu River Valley 1 11 18.2 17 14.1
Foothills 9 7.8 13.1 13.2 9.8 4.8 12.3
Unknown 2.7 3.3 3
Total 7.1 10.4 12 14.5 11.6 8.8 8 10 12.5
Female teachers
Mountains 4.7 11.5 12.1 14.2 12.1 11.2 10.4 4.7 12.6
Lowlands 11.7 12.9 15.7 19 16.5 17.1 11.1 11.6 16.3
Senqu River Valley 5.5 13.6 14.7 12.4 13.7
Foothills 8.2 11.1 14.5 15.7 13.8 10.1 9.2 14.7
Unknown 7.6 6.5 7.3
Total 8.7 12.7 14.5 16.8 15 15.3 10.8 9.8 15
ANNEX 5.3


179
By Zone
nalysis of teacher deployment by geo-graphical region reveals that teacherdistribution is more random in moun-tain areas. In Mountain areas, Low-land, and Senqu River Valley, even
though there is a positive correlation between
the number of students and teachers, the mag-nitude of the disparities is wider than that forthe whole country as documented by the lowervalue of R2 (Figures 4.6, 4.7, and 4.8). On theother hand, in the Foothills area, the magnitudeof disparities is less conspicuous as documentedby R2 (Figure 5.9).
Randomness of Teacher Deployment
ANNEX 5.4
AFigure 1Relationship between Number of Teachers and Students in Mountain Areas, 2003
Source: School Census (2003)
0
y = 0.0165x + 1.0092
R2 = 0.692
0
Number of Students
Num
ber o
f Tea
cher
s
2
4
6
8
10
12
14
16
18
100 200 300 400 500 600 700 800 900

180 Primary and Secondary Education in Lesotho
Figure 2Relationship between Number of Teachers and Students in Lowlands, 2003
Source: School Census (2003)
Figure 3Relationship between Number of Teachers and Students in Senqu River, 2003
Source: School Census (2003)
By District
To determine whether the issue lies with betweenor within districts, a relatively straightforward
solution consists of using a set of dummy vari-ables for the different districts. Table 5.10 showsthe variations existing between districts in theallocation of teachers at the primary level. While
0
y = 0.0164x + 2.4447
R2 = 0.7934
0
Number of Students
Num
ber o
f Tea
cher
s
5
10
15
20
25
30
35
40
500 1000 1500 2000 2500
0
y = 0.0158x + 1.5955
R2 = 0.726
0
Number of Students
Num
ber o
f Tea
cher
s
5
10
15
20
25
200 400 600 800 1000 1200 1400

Annex 5.4: Randomness of Teacher Deployment 181
Model 1 represents the variance within a dis-trict, Model 2 represents the variance betweenthe districts.
The study first considers the total number ofpupils and teachers at the district level. It ap-pears very clearly that some districts benefit froma similar number of teachers although they maybe servicing distinctly different numbers of pu-pils. This is the case of Thaba-Tseka and Butha-Buthe: although they each have about 620 teach-ers, Thaba-Tseka has an enrolment of 31,000pupils whereas Butha-Buthe has 28,000 pupils(3,000 pupils fewer than Thaba-Tseka). In-versely, Quthing and Butha-Buthe each hasabout 28,000 pupils in enrollment; Butha-Buthe,however, has 630 teachers while Quthing hasonly 570 teachers. These figures suggest thatthere is inconsistency in teacher allocation to theprovinces and some provinces benefit more thanothers. For instance, Butha-Buthe andMokhotlong appear to benefit from relativelygenerous endowments of teachers given the num-ber of pupils currently enrolled (the teacher-stu-dent ratios in these two provinces is 44). On the
other hand, Thaba-Tseka and Quthing reaplesser benefits (the ratio is 50 and 49, respec-tively).
With regards to the results of the two mod-els, it appears that allowing variations betweenprovinces helps to reduce the residual variabil-ity of the model (R2 increases from 81.8% to82.6%). Model 1 shows that inconsistency inteacher allocation to individual schools repre-sents 18.2 percent (100%-81.8%) of the totalvariability in the number of teachers at the schoollevel. Model 2 indicates that by allowing dis-parities in teacher allocation between districts,the inconsistency (or variance) within each prov-ince accounts for 17.6 percent (100%–82.4%).This means that of the 18.2 percentage pointsof total inconsistency (or variance in the distri-bution of teacher resources), 17.6 percentagepoints correspond to inconsistency in the distri-bution of resources within the districts. In rela-tive terms, this indicates that 80 percent of totalinconsistency is found within the provinces inthe allocation of teachers to individual schools,and that only 20 percent stems from variations
Figure 4Relationship between Number of Teachers and Students in Foothill, 2003
Source: School Census (2003)
0
y = 0.0159x + 1.7099
R2 = 0.8375
0
Number of Students
Num
ber o
f Tea
cher
s
5
10
15
20
25
30
35
200 400 600 800 1000 1200 1400 1600 1800

182 Primary and Secondary Education in Lesotho
between the district’s allocations of teachers.This does not imply that the allocation of re-
sources between the districts is adequate andefficient or that all districts are characterized byan equal degree of inconsistency in allocatingteachers to individual schools. To analyze thefirst point, a possibility consists of using thecoefficients of the dummy variables for districtsin Model 2 as presented in Table 5.10. (Follow-ing this method, we would flag Thaba-Tseka andMohale as districts that are under-endowed inteachers given the number of pupils enrolled,while Butha-Buthe and Qacha’s Nek would beidentified, in relative terms, as over-endowed).A second and preferred analysis (as it providesa better description of reality) consists of con-ducting the estimation of the relationship be-tween teachers and pupils at the school levelseparately for each of the 9 provinces. Table 5.11provides these estimates.
Based on the estimates, it is possible to simu-late the average number of teachers in schools
of a given size. Table 5.12 provides these simu-lations for schools of 300 pupils, a number thatis close to the average size of primary publicschools in the country. Inter-province dispari-ties appear to be quite substantial; Thaba-Tsekaand Mokhotlong are under-endowed in relativeterms as schools of 300 pupils have on averagearound 6 teachers. On the other hand, Butha-Buthe and Berea have more than 7 teachers forthe same enrollment size. This means that it maybe necessary to increase the number of teachersin the three under-endowed districts.
By Management Type
A similar analysis of teacher deployment wasconducted by the type of school management:1) government schools; 2) community schools;3) church schools; and 4) private schools, amongothers. As seen from the figures below, the mag-nitude of disparities is wider in government
Table 1Relation between the Number of Teachers and Pupils in Primary Schools, by District, 2003
Number of Number Model 1 Model 2Districts pupils of teachers coefficient t- value coefficient t-value
Student 0.0173 77.940 0.017 71.9
Maseru 89058 1919 Reference
Thaba-Tseka 30845 615 –1.135 –5.2
Butha-Buthe 27770 629 0.319 1.2
Leribe 69433 1478 –0.045 –0.2
Berea 55381 1175 0.266 1.2
Mafeteng 47981 1060 –0.156 –0.7
Mohale’s Hoek 41134 899 –0.568 –2.8
Quthing 27937 569 –0.970 –4.2
Qacha’s Nek 18515 456 –0.419 –1.7
Mokhotlong 21666 494 –0.566 –2.4intercept 1.375 Intercept 1.861
R2 81.8 R2 82.4
Source: School Census (2003)

Annex 5.4: Randomness of Teacher Deployment 183
schools, community schools, African Method-ist Episcopal Church schools, and private schools(others), compared to the whole country as docu-mented by the lower value of R2 (Figures, 5.10,5.11, 5.15 and 5.16). On the other hand, themagnitude of disparities is lesser among schoolsowned by Lesotho Evangelical Church, RomanCatholic Church, Anglican Church of Lesotho(Figures 5.12, 5.13, and 5.14).
The study also examined the resource alloca-tion of teachers by type of school management.Model 1 represents the variance within schoolsof management type, while Model 2 representsthe variance among schools of different types of
management. As seen from Table 3, the magni-tude of disparities is slightly wider within typeof school management (R2=87.5) compared tobetween management type (R2=87.9).
Simulation of the average number of teach-ers in school of a given size reveals that thereare disparities among management type ofschools. As seen from Table 4, government-owned schools clearly do not have sufficientteachers to the number of students (the averageteacher-student ratio is 1:41). On the other hand,schools owned by the community and churcheshave more teachers relative to the number ofstudents.
Table 2Relationship between the Number of Teachers and Students at the School Level by District (PrimaryEducation)
Number ofSchools (n) Intercept coefficient* R2 N300** t-value
Lesotho 1,355 1.375 0.0173 81.8 6.6 77.940
Region
Thaba-Tseka 135 0.747 0.0167 74.0 5.7 19.481
Butha-Buthe 75 2.096 0.0170 79.8 7.2 16.968
Leribe 173 2.184 0.0158 74.4 6.9 22.315
Berea 116 2.394 0.0162 81.0 7.3 22.012
Maseru 229 1.761 0.0170 79.0 6.9 29.189
Mafeteng 150 1.812 0.0164 85.8 6.7 29.876
Mohale’s Hoek 162 0.866 0.0184 87.4 6.4 33.376
Quthing 113 1.069 0.0160 83.7 5.9 23.838
Qacha’s Nek 101 1.195 0.0181 72.6 6.6 16.214
Mokhotlong 101 1.483 0.0159 57.0 6.2 11.457
Source: School Census (2003)*: all coefficients are significant at the 0.001 level**: N 300 is the estimated number of teachers in a 300 pupil school (country average)

184 Primary and Secondary Education in Lesotho
Figure 5Relationship between Number of Teachers and Students in Government schools 2003
Source: School Census (2003)
Figure 6Relationship between Number of Teachers and Students in Community Schools, 2003
Source: School Census (2003)
0
y = 0.0278x - 0.997
R2 = 0.5368
0
Government Schools
20
40
60
80
100
120
500 1000 1500 2000 2500 3000 3500
0
y = 0.0218x + 6.57
R2 = 0.6828
0
20
40
60
80
100
120
Community Schools140
500 1000 1500 2000 2500 3000 3500 4000 4500 5000

Annex 5.4: Randomness of Teacher Deployment 185
Figure 7Relationship between Number of Teachers and Students in Schools Governedby Lesotho Evangelical Church, 2003
Source: School Census (2003)
Figure 8Relationship between Number of Teachers and Students in Schools Governed byRoman Catholic Church, 2003
Source: School Census (2003)
0
y = 0.0177x + 4.7556
R2 = 0.8916
20
40
60
80
100
120
140
Lesotho Evangelical Church
160
180
0 1000 2000 3000 4000 5000 6000 7000 8000 9000 10000
0
y = 0.0182x + 4.8138
R2 = 0.9201
20
40
60
80
100
120
140
160
180
0 1000 2000 3000 4000 5000 6000 7000 8000 9000
Roman Catholic Church

186 Primary and Secondary Education in Lesotho
Figure 9Relationship between Number of Teachers and Students in Schools Governedby Anglican Church of Lesotho, 2003
Source: School Census (2003)
Figure 10Relationship between Number of Teachers and Students in Schools Governedby African Methodist Church, 2003
Source: School Census (2003)
0
y = 0.017x + 6.6835
R2 = 0.9164
20
40
60
80
100
120
140
160
180
0
Anglican Church of Lesohto200
2000 4000 6000 8000 10000 12000
0
y = 0.0196x + 5.7236
R2 = 0.783
0
Anglican Methodist Episcopal Church
10
20
30
40
50
60
70
80
500 1000 1500 2000 2500 3000 3500 4000

Annex 5.4: Randomness of Teacher Deployment 187
Table 3Relation between the Number of Teachers and Pupils in Primary Schools, by Management Type, 2003
Number of Number Model 1 Model 2Districts pupils of teachers coefficient t- value coefficient t-value
Student 0.018 97.14 0.018 97.22
Government 27,372 701 (ref)
Community 71,754 1927 8.128 5.27
Lesotho Evangelical Church 771,844 15,944 0.835 0.73
Roman Catholic Church 786,762 16,766 1.688 1.49
Anglican Church 286,584 6,044 1.602 1.29
African Methodist 25,087 629 3.971 2.00
Others 69,467 1,751 6.790 4.27intercept 5.232 intercept 3.409
R2 87.5 R2 87.9
Source: School Census (2003)
Figure 11Relationship between Number of Teachers and Students in Schools Governedby Private Schools and Other Schools, 2003
Source: School Census (2003)
0
y = 0.0178x + 10.499
R2 = 0.765
0
10
20
30
40
50
60
70
80Others (includes Private Schools)
500 1000 1500 2000 2500 3000 3500 4000 4500

188 Primary and Secondary Education in Lesotho
Table 4Relationship between the Number of Teachers and Students at the School Level by Management Type(Primary Education)
Number ofSchools (n) Intercept coefficient* R2 N300** t-value
Lesotho 1,355 1.375 0.0173 81.8 6.6 77.94
Proprietor
Government 61 –0.997 0.028 53.7 7.4 8.269
Community 55 6.570 0.022 68.3 13.1 10.682
Lesotho Evangelical Church 481 4.610 0.018 89.2 9.9 62.744
Roman Catholic Church 509 4.814 0.018 92.0 10.3 76.414
Anglican Church 176 6.684 0.017 91.6 11.8 43.660
African Methodist 24 5.724 0.020 78.3 11.6 8.909
Others 49 10.499 0.018 76.5 15.8 12.369
Source: School Census (2003)*: all coefficients are significant at the 0.001 level**: N 300 is the estimated number of teachers in a 300 pupil school (country average)

189
able 1 below presents the evolutionof primary teacher-student ratios inLesotho. Overall the ratio as re-mained stable at between 45 to 47despite the introduction of Free Pri-
mary Education in 1999. As seen, the ratio hasincreased 2.2. Percent from 45.2 in 1988 to46.2 in 2003. The magnitude of ratios differs
from district to district but in the past six years,the ratio has increased significantly inMokhotlong (11.8 percent), Maseru (7.2 per-cent), and Mohale’s Hoek (5.3 percent). On theother hand, the teacher-student ratios in dis-tricts such as Qacha’s Nek (–8.4 percent) andMafeteng (–2.1 percent), and Leribe (–0.7 per-cent) have declined. In other words, the num-
Evolution of Teacher-Student Ratiofrom 1998 to 2003
ANNEX 5.5
T
Table 1Evolution of Teacher/student Ratio at Primary Schools by District
1998 1999 2000 2001 2002 2003 % changes
Butha-Buthe 43.6 41.4 45.1 44.9 42.2 44.1 1.3%
Leribe 47.3 47.3 48.5 47.0 47.3 47.0 –0.7%
Berea 46.5 45.1 49.0 49.5 48.0 47.1 1.4%
Maseru 43.3 43.5 46.6 46.4 45.6 46.4 7.2%
Mafeteng 46.2 44.0 47.5 47.5 47.1 45.3 –2.1%
Mohale’s Hoek 43.4 42.0 45.7 46.3 45.4 45.8 5.3%
Quthing 49.0 47.0 50.4 50.8 50.4 49.1 0.3%
Qacha’s Nek 44.3 43.9 45.8 43.9 45.8 40.6 –8.4%
Mokhotlong 39.2 39.4 47.0 43.7 45.8 43.9 11.8%
Thaba-Tseka 48.7 47.7 55.7 54.0 55.6 50.2 3.1%
Total 45.2 44.4 47.9 47.4 47.0 46.2 2.2%
Source: MOE Education Statistics

190 Primary and Secondary Education in Lesotho
Table 2.Evolution of Teacher/student Ratio at Primary Schools by Management Type
1998 1999 2000 2001 2002 2003 % changes
Government and Community 31.4 32.2 35.4 40.0 42.6 35.7%
Lesotho Evangelical Church 47.5 45.7 49.4 49.2 48.1 1.3%
Roman Catholic Church 44.9 44.8 48.0 47.1 46.0 2.5%
Anglican Church 46.8 46.3 47.9 47.3 46.4 –0.8%
African Methodist Church 37.2 36.8 39.2 42.9 41.0 10.3%
Other Churches 39.5 37.8 40.6 38.8 40.4 2.4%
Private 19.0 30.1 26.5 35.0 84.2%
Total 45.2 44.4 47.9 47.4 47 46.2 2.2%
Source: Education Statistics 1997–2003
Note: Number of private schools are only 2; % change in private schools is from 1999 to 2003.
ber of students as well as teachers has increasedsignificantly in these three districts.
Examination of teacher-student ratios by typeof school management reveals that the ratioamong government and community primaryschools has increased significantly (35.7 percent)in the past six years (see Table 2). During thesame period, the ratios in schools owned by theAfrican Methodist church (10.3 percent) andprivate schools (84.2 percent) have also increased.In the case of private schools, there are only twoprimary schools in Lesotho. On the other hand,the teacher-student ratio in schools owned by An-glican Church has declined (–0.8 percent).
In the year 2003 (Table 3, government pri-mary schools had the highest average pupilteacher ratio of 56. The ratio was especially high
at the mountain areas (60) and at the SenquRiver Valley (more than 80). On the other hand,primary schools in the lowlands area had thelowest pupil teacher ratio.
At the secondary level, average pupil teacherratio was about 24 which is low compared toother countries, indicating that there is muchroom for the efficiency gain in secondary teacherutilization. Community and government second-ary schools tend to have lower pupil teacher ratio(22 and 21) compared to schools under othertypes of management. In fact, governmentschools in the foothills and Senqu River Valleyas well as the community secondary schools inthe mountain areas had pupil teacher ratio ofonly 14 and 18. Private schools in the lowlandsareas had the lowest ratio of 12.

Annex 5.5: Evolution of Teacher-Student Ratio from 1998 to 2003 191
Table 3Pupil: TEACHER ratio by zone and by management type in 2003
Government Community LEC RCM ACL AME Others Private Total
Primary
Mountains 67.4 66.7 49.1 46.4 46.3 61.9 56.7 50 49
Lowlands 42.2 41.7 46.7 45.4 45.1 39.2 39.5 30.9 44.7
Senqu River Valley 80.8 47.7 44.5 34.9 47.1
Foothills 47.9 42.6 48.4 48.5 44.7 60.2 44.1 47.7
Unknown 48.6 10.9 41.1
Total 55.7 44.6 48.1 46.5 45.1 48.5 42.5 40.5 47.1
Secondary
Mountains 24 18 25 22 21 0 0 28 23
Lowlands 23 21 25 24 26 25 24 12 24
Senqu River Valley 18 0 29 28 0 0 21 0 28
Foothills 14 22 26 24 24 0 0 0 25
Total 22 21 26 24 25 25 24 17 24


193
ANNEX 5.6
Mean and standard error of students test scores by subject and country in the 2000–2003 SACMEQ survey
Reading Mathematics
Mean SE Mean SE
Botswana 521,1 3,47 512,9 3,15
Kenya 546,5 4,97 563,3 4,64
Lesotho 451,2 2,93 447,2 3,24
Malawi 428,9 2,37 432,9 2,25
Mauritius 536,4 5,51 584,6 6,32
Mozambique 516,7 2,29 530 2,08
Namibia 448,8 3,13 430,9 2,94
Seychelles 582 3,1 554,3 2,68
South Africa 492,3 9 486,1 7,19
Swaziland 529,6 3,74 516,5 3,41
Tanzania 545,9 5,03 522,4 4,2
Uganda 482,4 6,12 506,3 8,17
Zambia 440,1 4,47 435,2 3,54
Zanzibar 478,2 1,49 478,1 1,26
All countries 500,0 11,6 500,0 11,2
Source: SACMEQ II data


195
Ernst & Young. National Manpower Develop-ment Secretariat. Draft Report.
Kushnarova, Inna. 2005. Public ExpenditureTracking Surveys: A Review of Surveys Com-pleted from 1996 to 2004. World Bank, Wash-ington, D.C.
Lesotho, 1995. Final report on the Consultancyfor the Rationalization of Fees in the Second-ary and High Schools in Lesotho. Preparedby Miser Consulting (Pty) Ltd. Maseru.
Lesotho. 1997. Primary Syllabus Standards1–7. Maseru.
Lesotho, 1997. Government Gazette Extraor-dinary Vol. XLII Thursday—3rd July, 1997.No. 41.
Lesotho. 1998. Government Gazette Extraor-dinary. Vol. XLIII. Friday—27th March,1998. No. 20. Published by the Authority ofHis Majesty the King. Maseru.
Lesotho, 2000. Performance Audit report on theStructures and Systems for Payment of LoanBursary in Lesotho and the Republic of SouthAfrica. Office of the Auditor General. Na-tional Manpower Development Secretariat.Maseru.
Lesotho. 2001. Total Population by single yearsand sex, Lesotho Demographic Survey 2001.Bureau of Statistics. Maseru.
Lesotho. 2001/2002. The National Universityof Lesotho Recurrent Budget Estimates.Maseru.
Lesotho. 2002/2003. The National Universityof Lesotho Recurrent Budget Estimates.Maseru.
Lesotho. 2003/2004. The National Universityof Lesotho Recurrent Budget Estimates.Maseru.
Lesotho. 2004/2005. The National Universityof Lesotho Recurrent Budget Estimates.Maseru.
Lesotho. 2002. Government Gazette Extraor-dinary. Vol. XLVII . Tuesday—8th January,2002. No. 4. Published by the Authority ofHis Majesty the King. Maseru.
Lesotho. 2002. NUL Annual Statistical Bulle-tin. Produced by Development and PlanningOffice. The National University of Lesotho.Roma.
Lesotho. 2002. National University of LesothoStrategic Plan: Re-connecting with the Na-tion. Policy Programme 2002/2007. Roma.
Lesotho. 2003. NUL Annual Statistical Bulle-tin. Produced by Development and PlanningOffice. The National University of Lesotho.Roma.
Lesotho, 2003. Draft Report by the NUL FeeStructure Review Task Force Held atMolengoane Lodge on the 21st and 22nd ofJuly 2003. Roma.
Lesotho. Compiled Status of Funds Report forthe Years 1999–2005. Ministry of Educationand Training. Maseru.
References

196 Primary and Secondary Education in Lesotho
Lesotho. MTEF Based Budget Estimates 2005/2006–2007/2008. Ministry of Education andTraining. Maseru.
Lesotho. 2003/2004. Draft Capital Budget. Min-istry of Finance and Development Planning.Maseru.
Lesotho. 2003. Baseline Pilot Survey of Attain-ment in Literacy and Numeracy. Examina-tion Council of Lesotho. Ministry of Educa-tion and Training. Maseru.
Lesotho. 2003. Report on Functions to be De-centralized to Local Authorities. Prepared bythe Ministry of Local Government. Maseru,Lesotho.
Lesotho, 2003. Sensitisation Strategy. Ministryof Local Government. Maseru, Lesotho.
Lesotho. 2003. Lesotho’s Education StatisticsBulletin 1999–2003. Ministry of Educationand Training. Planning Unit.
Lesotho. 2004. National Report on the Devel-opment of Education for the InternationalConference on Education: Geneva Septem-ber 2004. Ministry of Education and Train-ing. Maseru.
Lesotho. 2004. Draft White Paper on the Re-view of the Education Act No. 10 of 1995.Ministry of Education and Training. Maseru.
Lesotho. 2004. Education Statistics Report2004. Ministry of Education and Training.
Lesotho. 2004. Draft National Policy DocumentTeacher Education and Training. Ministry ofEducation and Training. By the Task Forceon the Formulation of A National Policy onTeacher Education and Training.
Lesotho. 2004. Decentralization Concept Paper.Ministry of Education and Training.
Lesotho. 2005. Education Sector Strategic Plan.Ministry of Education and Training.
Ogawa, Keiichi. 2004. First Draft Lesotho Edu-cation Country Status Report.
Phamotse, Parament, Nkoja Khechane, PhillipMapetla, Mapitso Panyane, Mofota Phatela,Aidan Mulkeen, 2005. Policy, Planning andManagement of Rural Primary Teachers inLesotho: Background paper prepared for the
World Bank Workshop on Policy, Planningand Management of Rural Primary Teachers,Maseru. Lesotho. May 2005.
Reinikka, Ritva, and Jakob Svensson. 2004.Fighting Corruption to Improve Schooling:Evidence from a Newspaper Campaign inUganda.
SACMEQ. The SACMEQ II Project: A Studyof the Conditions of Schooling and the Qual-ity of Education in Southern and Eastern Af-rica Draft Report: Lesotho.
Senaoana, Moeketsi. 2004. Restructuring of theNational Manpower Development Council,Secretariat and Revolving Fund: Interim Re-port Presented to the Principal Secretary, Min-istry of Finance and Development Planning.Maseru, Lesotho.
Sugrue, Ciaran. 2003. Teacher Development andTraining in Lesotho.
Turner, John D. The National Teacher TrainingCollege, Lesotho: The Concept of Autonomy.Faculty of Education, University of Manches-ter, Great Britain.
World Bank. African Development Indicators2001–2004. Washington, D.C.
World Bank. 2002. Education and Training inMadagascar: Towards a Policy Agenda forEconomic Growth and Poverty Reduction.Washington, D.C.
World Bank, 2004. Education in Ethiopia:Strengthening the Foundation for SustainableProgress. Washington, D.C.
World Bank, 2005. Lesotho Country EconomicMemorandum: Growth and EmploymentOptions Study. Report No. 26130. Washing-ton, D.C.
World Bank, 2005. EFA Global MonitoringReport: Education for All The Quality Im-perative. Washington, D.C.
World Bank, 2004. Namibia Human Capital andKnowledge Development for EconomicGrowth with Equity. Africa Region HumanDevelopment Working Paper Series – No. 84.Washington, D.C.