building the road to greener pastures
TRANSCRIPT
ww
ww
orld
com
mer
cere
view
com
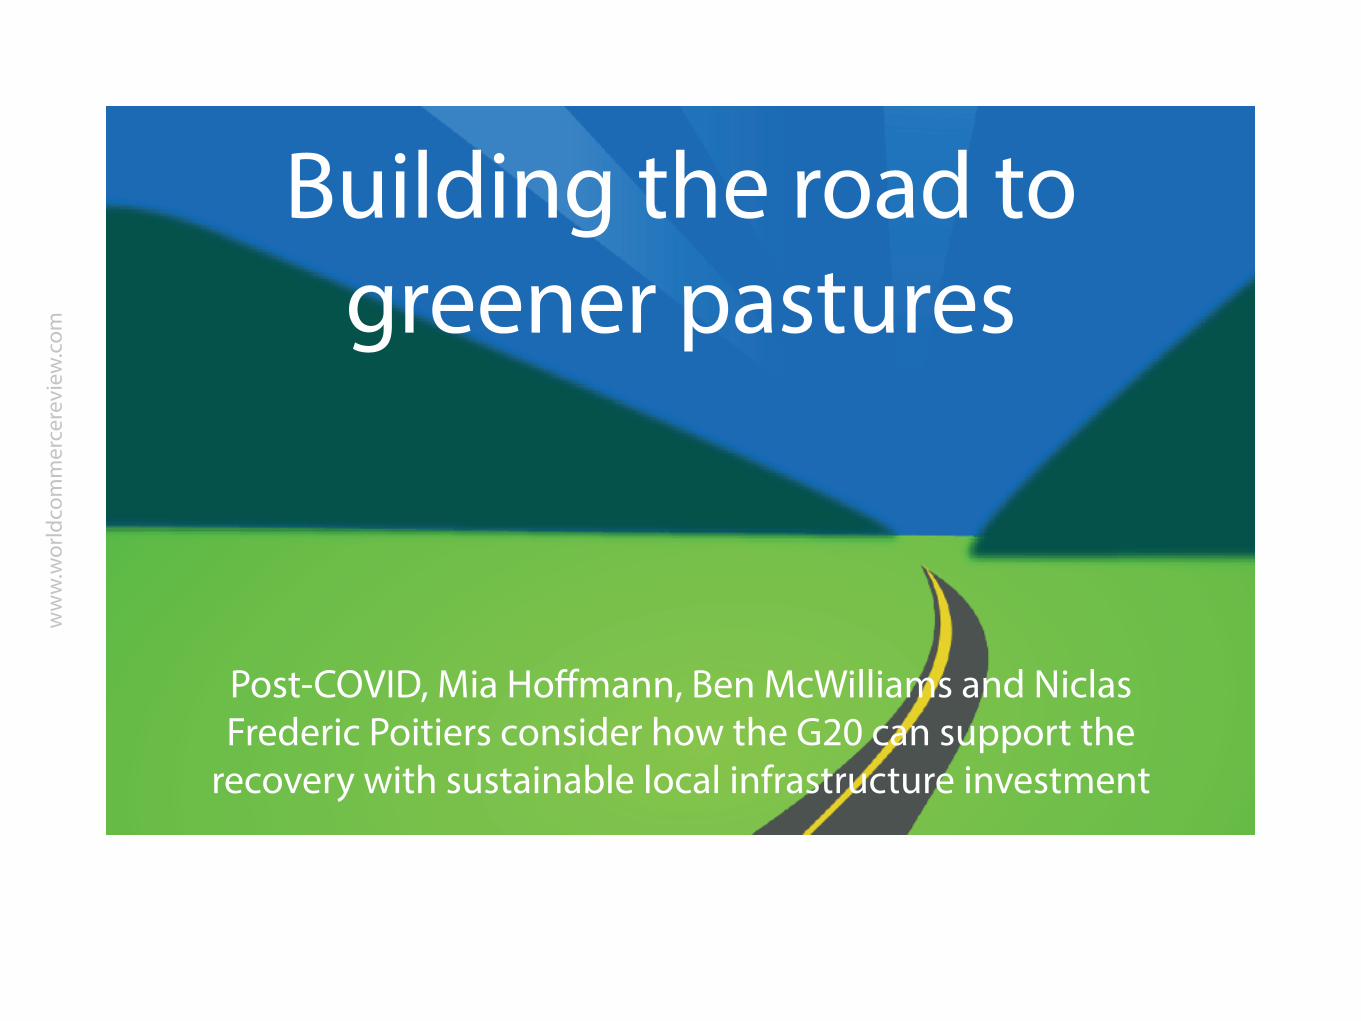
Post-COVID Mia Hoffmann Ben McWilliams and Niclas Frederic Poitiers consider how the G20 can support the
recovery with sustainable local infrastructure investment
Building the road to greener pastures
ww
ww
orld
com
mer
cere
view
com
Executive summaryThe economic consequences of COVID-19 have increased the need for substantial infrastructure investment to support the global recovery This report recommends that the focus should be in particular on sustainable investment to help achieve the Paris Agreement climate targets and to avoid more capital becoming stranded as climate policies toughen in the coming decades
Local infrastructure which accounts for most sustainable infrastructure needs should be a major target area Building on the G20 Principles for Quality Infrastructure this report investigates the role that different aspects of predominantly local infrastructure could play in the decarbonisation of the G20 economies
The economic crisis arising from COVID-19 has led G20 economies to unleash huge volumes of fiscal support This support has tended to prioritise protection of existing economic structures As support measures transition into fiscal stimulus G20 governments must consider the structural impact that measures will have on long-term economic growth
The necessity for fiscal stimulus in the recovery provides a unique opportunity for a sustainable infrastructure strategy aimed at transforming G20 economies into economies fit for the challenges and changes of the twenty-first century
The global lsquoinfrastructure gaprsquo in investment needed to reach sustainable development goals has been estimated at between $7 trillion and $8 trillion annually (Bhattacharya et al 2019 OECD 2017) Priority areas for sustainable infrastructure investment are energy transport water and sanitation and the telecomsdigital sector
ww
ww
orld
com
mer
cere
view
com
About 70 of global greenhouse gas (GHG) emissions come from the construction development and operation of infrastructure in the energy buildings and transport sectors
We outline general principles for urgent action that G20 economies should take whilst being cognizant of the fact that lsquocommon but differentiated responsibilitiesrsquo form the cornerstone of the UNFCCC negotiations resulting in the Paris Agreement of 2015
The time has now come for the G20 to place sustainable and local elements at the centre of the conversation surrounding infrastructure
ww
ww
orld
com
mer
cere
view
com
In the electricity sector key priorities are stopping the deployment of new coal-fired power generation plants and focusing on enabling infrastructure such power grids which need to become more flexible so they can incorporate decentralised power generation
In the buildings sector many G20 economies face the challenge of overhauling their buildings stocks to introduce new sources of clean energy while improving energy efficiency Investment in buildings must also take account of the changing climate and its implications in terms of necessary resilience
In mobility a shift away from of the current model of polluting private vehicles is required to decarbonise the sector Infrastructure deployment should focus on clean charging stations improved public transport networks and walking and cycling routes
Increasingly access to high-speed internet and the deployment of other digital infrastructure is necessary for sustained economic growth Efforts are still required to improve the disposal and recycling of solid waste and wastewater both of which contribute to greenhouse gas emissions and to local pollution
Discussions about sustainable infrastructure normally focus on the end-use This report instead advocates a lifecycle approach to assessing the sustainability of infrastructure This must begin by addressing the significant GHG emissions associated with basic construction materials
A number of difficulties associated with decarbonising the production of steel aluminium and cement make it imperative that the G20 should collaborate to support low-carbon options
ww
ww
orld
com
mer
cere
view
com
To close the multi-trillion dollar investment gap new sources of financing must be found Public investment can provide some of the required infrastructure but crowding-in of private funds will be crucial to achieve sufficiently high levels of infrastructure investment
The current financial market with a combination of excess savings and low interest rates presents an ideal opportunity for doing so
However a number of barriers continue to block these flows particularly to local projects Local governments find it difficult to access private finance while private investors often struggle to invest because of a lack of infrastructure opportunities of sufficient size and quality
A final obstacle to private investment is the high risk associated with local infrastructure projects Infrastructure projects are generally long-term entailing substantial and costly planning preparation and construction while cost overruns and delays are pervasive
National and international development banks do and must continue to play a critical role in tackling these issues Development banks are in an ideal position to assess the risks of projects and simultaneously implement best management practices Their involvement in a project can reduce the cost of financing for the borrower in particular when the public sector is ready to assume the greatest funding risk That would make projects more attractive for private investors
National governments can play a central role in crowding-in private sector investment by ensuring a supportive and enabling investment environment This involves addressing macroeconomic barriers and project-specific elements such as the risk of construction delays cost overruns and project non-completion
ww
ww
orld
com
mer
cere
view
com
Establishing a sustainable and local infrastructure strategy is not without challenges but offers significant economic benefits A coordinated effort by G20 economies to pursue the approaches outlined in this report building on previous G20 commitments can underpin sustainable economic strategies for successful economic recovery in the wake of COVID-19
The report closes with some recommendations to the G20
bull Place climate sustainability at the core of the infrastructure agendabull Sustainability plans must start locallybull Improve access to finance for low-carbon projectsbull Address the shortage of bankable infrastructure projectsbull Commit to supporting bilateral and multilateral development banksbull Stimulate demand for low-carbon industrial materialsbull Improve cooperation across the G20bull Focus on lifecycle infrastructure sustainability
1 IntroductionThe world is in the midst of a global pandemic The COVID-19 virus has killed millions led to border closures and nationwide shutdowns and has driven the world economy into the deepest recession since the Second World War
Meanwhile other major global challenges continue to demand attention and action The past seven years have been the warmest ever recorded (NASA 2021) Over the past few decades the world has witnessed extreme weather events of unprecedented scale
ww
ww
orld
com
mer
cere
view
com
The United Nations and the Centre for Research on the Epidemiology of Disaster have reported that major disasters have affected 42 billion people claimed 123 million lives and resulted in US$297 trillion in economic losses over the past 20 years (CRED and UNDRR 2020)
It is imperative that G20 governments take more action now to address ever-increasing concentrations of atmospheric greenhouse gases (GHGs) and to protect the worldrsquos citizens from the effects of human-induced climate change
This challenge is made more urgent by a growing global population the world population is projected to reach 85 billion people by 2030 and 97 billion by 2050 (United Nations Department of Economic and Social Affairs Population Division 2019a)
Within the same timeframe more than two out of three people are expected to live in cities (United Nations Department of Economic and Social Affairs Population Division 2019b)
Today eight out of the ten most populous cities are located in the G20 where half of the ten fastest growing cities are also found (Satterthwaite 2020 UN World Urbanization Prospects 2018)
Addressing climate change while enabling sustainable economic growth for a growing and increasingly urban world population will be one of the defining challenges of the twenty-first century The ongoing economic recession is expected to cause a rise in global extreme poverty for the first time in over 20 years with an estimated 150 million people being pushed into extreme poverty by 2021 (World Bank 2020)1
ww
ww
orld
com
mer
cere
view
com
If countries fail to address the climate crisis another estimated 100 million people will fall into poverty by 2030 (Hallegatte et al 2016) This rapidly urbanising world needs to adapt its infrastructures to reduce the effects of climate change and to deliver prosperity for its citizens G20 leadership is vital for this
The G20 economies are responsible for 79 of global CO2 emissions (see Figure 1) The three largest economies alone ndash China the US and the EU ndash account for over half of global emissions2 The decarbonisation of the G20 economies is thus critical for reaching the goals of the Paris Climate Agreement
In the Leadersrsquo Declaration from the 2020 G20 Riyadh Summit all G20 countries with the exception of the United States reaffirmed their commitment to the full implementation of the Agreement and US President Biden signed an executive action to re-join the Paris Climate Agreement on his first day in office (G20 2020a sect33 White House 2021) Hence there is now a broad agreement within the G20 about the urgency of addressing climate change
In this report we look at how the G20 can address one major part of the puzzle local infrastructure Approximately 70 of global GHG emissions come from the construction development and operation of infrastructure in the energy buildings and transport sectors
Therefore it is critical that infrastructure investment strategies are underpinned by sustainability considerations ldquoMaximizing the positive impact of infrastructure to achieve sustainable growth and developmentrdquo is indeed the first of the G20 Principles for Quality Infrastructure developed at the 2019 Finance Ministersrsquo and Central Bank Governorsrsquo Meeting in Fukuoka (G20 2019)
Green infrastructure can reduce local air pollution and GHG emissions support climate-change adaptation and contribute to the efficient use of resources (Bhattacharya et al 2019) Local infrastructure plays a particularly
ww
ww
orld
com
mer
cere
view
com
Figure 1 Annual CO2 Emissions by Region
Source Bruegel representation of Our World in Data for emissions in 2018
000204060810
0 20 40 60 80 100
Non G20
Remaining G20
United States
Russia
Japan
India
EU-28
China
28 9 7 3 5 15 12 21
ww
ww
orld
com
mer
cere
view
com
important role in the context of estimates that suggest urban areas are responsible for up to 70 of consumption-based GHG emissions (UN Habitat 2011)
Building on the G20 Principles for Quality Infrastructure this report investigates the role that different aspects of local infrastructure could play in the decarbonisation of the G20 economies and develops proposals for a local green infrastructure strategy for the G20
We take into account the global recession caused by the COVID-19 pandemic and our policy recommendations are intended to inform the recovery investment the G20 Finance Ministers and Central Bank Governors committed to in the G20 Action Plan ndash Supporting the Global Economy Through the COVID-19 Pandemic (G20 2020b Annex I)
Local authorities build and maintain a large share of infrastructure for the purpose of serving local communities Local public transport networks electricity and energy supply and water and waste management account for a large share of total infrastructure spending
Increasing the quality of local infrastructure is key to meeting the Sustainable Development Goals in poor communities within the G20 while deteriorating infrastructure that is not well suited to the needs of the modern economy is an impediment to economic growth in industrialised regions
In light of this challenge our analysis applies a comprehensive approach to the sustainability of infrastructure following the life-cycle principle regarding environmental costs in the G20 Principles for Quality Infrastructure (principle 31)
ww
ww
orld
com
mer
cere
view
com
Infrastructure affects the carbon footprint of an economy at all three stages of its life cycle the environmental impacts of the construction of the infrastructure the emissions generated through its use and the long-term negative environmental effect of the decommissioning of infrastructure
Additionally infrastructure has major secondary effects through the type of use it encourages and what existing infrastructure it replaces and complements Policies aimed at improving the greenness of local infrastructure projects should consider all four aspects
The G20 can play an important role by creating standards and best practices for the assessment of life-cycle costs
The financing of local infrastructure varies between G20 members and between projects Local communities have the best understanding of their infrastructure needs but often lack the financial capacity and experience in developing new projects
Sustainable infrastructure should meet local requirements whilst being financially sustainable Our recommendations for the G20 local infrastructure strategy will therefore focus on areas where global cooperation between the G20 countries can improve the policy outcomes This is done with the aim of increasing the efficiency of public infrastructure spending
High quality public infrastructure is fundamental for long-term economic growth and productivity (Calderon and Serven 2014) Under the right conditions it can boost industrialisation and competitiveness reduce the costs of connecting people with markets and improve living conditions while creating job opportunities
ww
ww
orld
com
mer
cere
view
com
These positive economic effects are especially important given the need for economic stimulus created by the COVID-19 pandemic which we discuss in the next section
11 The COVID-19 crisis and the G20rsquos responsebull Large fiscal stimulus was enacted by developed economies to address the economic fallout of COVID-19 but
developing countries had much less fiscal space to support their economiesbull Much of the initial stimulus was aimed at preserving existing industries and as a result had a net negative
effect on the environmentbull In the recovery phase fiscal stimulus should be used to address climate change through ecologically
sustainable investments
The case for a strong investment agenda has become more urgent by the need to address the economic shock caused by COVID-19 The pandemic led to the largest contraction of the world economy since the Second World War The IMF (2021) estimates that global GDP declined by 35 in 2020 more than during the Great Financial Crisis in 20082009
While the crisis has been unprecedented so has been the response The G20rsquos reaction to the crisis was carved out in its April virtual meeting of Finance Ministers and Central Bank Governors where the G20 Action Plan ndash Supporting the Global Economy Through the COVID-19 Pandemic was agreed
In this document the G20 endorsed the importance of economic policy support to businesses and workers and recognised the need to support developing economies through the crisis In particular in developed economies there has been massive fiscal support for employees and businesses affected by the economic downturn
ww
ww
orld
com
mer
cere
view
com
According to the IMF (2020b) as of September 2020 fiscal support to businesses and workers in developed economies amounts to around 20 of GDP This has significantly reduced the impact of the crisis on the economy
However there is a substantial gap between high- middle- and low-income countries For developing economies and emerging markets fiscal space is far more limited and as a result the size of government stimulus packages in developing countries and emerging markets have been far smaller
In emerging markets fiscal support amounted to approximately 55 and in low-income countries the fiscal stimulus amounted to 18 of GDP As the effect of the economic crisis is more severe in emerging markets and developing countries without significant social safety nets this development is very worrisome
The IMF warns ldquoThe pandemic will reverse the progress made since the 1990s in reducing global poverty and will increase inequalityrdquo (IMF 2020 page XV)
So far the most important G20 initiative to address this problem came in the form of debt relief In April 2020 G20 Finance Ministers and the World Bankrsquos Development Committee endorsed the DSSI (agreed by the Paris Club) which grants debt service suspension on bilateral loans owed by 73 of the worldrsquos poorest countries in order to enable an effective crisis response The initiative has been extended by one year until December 2021 with repayments spread over six years thereafter
However there has only been limited financial support granted to developing economies through international financial institutions and more financial support is needed3 There should be a strong role for multinational development banks to support developing countries in the G20rsquos recovery infrastructure agenda
ww
ww
orld
com
mer
cere
view
com
Figure 2 Overview of G20 Fiscal Stimulus as percent of GDP
Source Discretionary fiscal response as of September 11 2020 IMF (2020b)
45
40
35
30
25
20
15
10
5
0
Additional spending and foregone revenue
Equity loans and guarantees
US
Chin
a
Japa
n
Ger
man
y
Indi
a
UK
Fran
ce
Italy
Braz
il
Cana
da
Sout
h Ko
rea
Russ
ia
Aust
ria
Mex
ico
Indo
nesi
a
Saud
i Ara
bia
Turk
ey
Arg
entin
a
Sout
h A
fric
a
Adv
Eco
Em amp
Dev
Low
-inco
me
ww
ww
orld
com
mer
cere
view
com
The immediate response to the economic crisis caused by COVID-19 was for governments to protect jobs and existing economic structures and initially little attention was devoted to sustainability issues
As a result the economic stimulus measures announced by G20 members in response to COVID-19 mostly had a net negative effect on the environment (Vivid Economics 2020) After the immediate economic shock was contained and governments began to consider the long-term structural growth effect of the stimulus investments have tended to became more environmentally sustainable (Vivid Economics 2020)
This becomes particularly clear when considering spending on energy-related investments since COVID-19 Around 73 of global GHG emissions are energy-related and the majority of sustainably relevant economic stimulus is energy-related4
IISD (2020a) provides a breakdown of spending on energy sectors in the recovery packages in the G20 is shown in Figure 3 Governments in G20 countries have committed at least US$ 485 billion to energy investments In total US$242 billion have flown to support fossil fuel energy while only US$187 billion have flown to clean energy
Most worryingly over US$200 billion has been unconditional support for fossil fuel energy
Table 1 provides an overview of some of the largest energy-related investments that G20 countries have made between March 2020 and February 2021 Analysis of the complete list of energy-related investments shows that bailouts of aviation companies have been commonplace (IISD 2020a) A focus on energy efficiency is noted as well as general investments into the power sector and support for railways
ww
ww
orld
com
mer
cere
view
com
Figure 3 G20 Public Commitments to Energy Stimulus Fossil Fuel Clean and other
Source IISD (2020a) accessed on 050220215
Other energy
Clean conditional
Clean unconditional
Fossil conditional
Fossil unconditional
42
810
29
11
ww
ww
orld
com
mer
cere
view
com
Moving forward there should be a considerable shift towards sustainable long-term investments in the stimulus and recovery packages A positive example of such ambitions is the Next Generation EU recovery fund
The Next Generation EU (euro750 million) package comprises euro390 billion in grants and euro360 billion in loans to support member states Of this 30 is committed to lsquofighting climate changersquo (European Commission 2021)
Under the auspices of the Green Deal a variety of strategies are being put forward from hydrogen to biodiversity to agricultural which provide guidelines for how this lsquogreenrsquo money is to be spent
Policy Value committed(USD billions) Country
Aviation industry bailout 58 billion USA
Road building and repair 35 billion UK
Fund for carbon-neutral technology development 19 billion Japan
National railway deployment 14 billion China
Electricity price subsidies 13 billion Germany
Liquidity boost for power distribution companies 12 billion India
Table 1 Recent major energy-related investments in the G20
Source IISD (2020a) accessed on 05022021
ww
ww
orld
com
mer
cere
view
com
As fiscal support shifts from emergency liquidity relief towards more structural fiscal stimulus ambitious global investment programmes should be pursued and they must be sustainable As IMF (2020b chapter 2) argues investment in the recovery phase will play an important role in ensuring that global economic growth recovers
The case for green infrastructure investment is furthered by survey-based estimates of fiscal multipliers by Hepburn et al (2020)6 The study provides estimates associated with different kinds of economic recovery policies in the context of the COVID-19 crisis Airline bailouts chosen by many G20 countries are associated with a very low multiplier by respondents Meanwhile clean connectivity infrastructure has a larger multiplier than traditional transport infrastructure
While research on the employment effects of green infrastructure spending is still inconclusive most studies point to a neutral or positive effect Most of the available literature finds that investing in low-carbon infrastructure is unlikely to lead to lower levels of job creation than investing in fossil fuel infrastructure (Blyth et al 2014)
Moreover by tailoring policies to country-specific characteristics it appears likely that renewable energy projects can lead to a net increase in employment Meyer and Sommer (2014) and Fragkos and Paroussos (2018) both find larger domestic job creation when compared to fossil fuels7
As with all infrastructure projects job creation will be particularly large while economies are still experiencing output gaps in the wake of the COVID-19 economic crisis
2 Scale of the challenge infrastructure gapbull Even before the pandemic a large sustainable infrastructure gap persisted To reach sustainability goals
annual infrastructure spending in the scale of US$7 to 8 trillion is needed a gap of 21 of GDP
ww
ww
orld
com
mer
cere
view
com
Figure 4 COVID Recovery Policies Relative Fiscal Multipliers
Source Hepburn et al (2020)
10
5
0
-5
-10
-15
-20
Airl
ine
bailo
uts
Educ
atio
n ca
pita
l inv
estm
ent
Hea
lthca
re c
apita
l inv
estm
ent
Rura
l sup
port
pol
icie
s
Trad
ition
al tr
ansp
ort i
nfr
Proj
ect-
base
d lo
cal i
nfr
gran
ts
Clea
n co
nnec
tivity
infr
Clea
n en
ergy
infr
inve
stm
ent
Build
ing
upgr
ades
Gre
en s
pace
s an
d na
tura
l inf
r
ww
ww
orld
com
mer
cere
view
com
bull Local infrastructure in urban areas accounts for 70 of the green infrastructure needed by 2030bull Green infrastructure investment is expected to have a positive fiscal multiplier especially in the recovery
phase after the pandemic has come under control
Global infrastructure needs are rising In order to meet increasing demand from a growing population accelerating urbanization and technological progress the world will need to invest more than $90 trillion in infrastructure between 2016 and 20308
This is more than the entire existing global infrastructure stock (New Climate Economy 2016) Bhattacharya et al (2019) estimates that 70 of the infrastructure required by 2050 is yet to be built This lsquoinfrastructure gaprsquo is particularly acute in urban areas
CCFLA (2015) estimates that 70 of the green infrastructure needed by 2030 is to be built in urban areas Only half of the $45 to $54 trillion annual investment need for low-carbon urban development is currently met (CCFLA 2015)
Many cities in emerging markets and developing countries lack basic water and waste management reliable transport infrastructure and access to electricity and heating This includes many citizens of the G20 member states themselves and even in the richest G20 members some poor communities lack access to clean water and public sewerage (Alston 2018)
Importantly the type of infrastructure investments that are undertaken in the next few years will lock in technologies for decades to come Decisions taken now are critical to ensure the world is on path towards a low-carbon and climate resilient future
ww
ww
orld
com
mer
cere
view
com
Infrastructure investment in high- and middle-income regions will need to focus on upgrading and greening existing systems Low-income economies need to create new infrastructure networks that are sustainable and adaptable to climate economic and demographic changes while at the same time providing much needed access to basic services for their citizens
There is the opportunity for them to leap-frog the networks built around carbon-intensive energy production in developed economies Priority should therefore be given to improving local infrastructure with low-emission technology
Global annual investment into core infrastructure needed to fulfil expected demand by 2030 is estimated to lie between $63 and $68 trillion annually (Bhattacharya et al 2019 OECD 2017) Core infrastructure includes power generation and distribution transport water and sanitation systems and telecommunications
The additional costs of aligning these investments with the Paris goal of limiting global warming to well below 2degC are estimated to lie between $06 trillion and $11 trillion (see Table 2) These additional costs are likely to be offset by reduced expenses for fossil fuels as well as lower lifecycle costs of sustainable infrastructure in general (OECD 2017)
Most of the investment is needed for energy and transport infrastructure ndash according to Bhattacharya (2019) US$39 trillion and US$2 trillion respectively Compared to the business-as-usual-scenario sustainable infrastructure investment will have to shift away from primary energy sources such as oil gas and coal and towards energy efficiency and low-carbon core infrastructure9 (NCE 2016)
ww
ww
orld
com
mer
cere
view
com
Currently sustainable infrastructure investments are falling short of the target by US$32 trillion per year or 21 of global GDP (Bhattacharya et al 2019) Local infrastructure will play a key role in this shift as we will discuss in the next chapter
3 Sustainable local infrastructureThe roll-out of low-carbon infrastructure within cities must be at the core of any sustainable development strategy G20 countries should avoid building new infrastructure that will become obsolete due to its incompatibility with
Table 2 Annual Infrastructure Investment Gap
Source Bruegel replication of table 1 from Bhattacharya et al (2019)
OECD Bhattacharya
Energy 27 39
Transport 27 20
Water and sanitation 09 09
Telecoms 06 10
Total 69 79
2015 USD trillion
ww
ww
orld
com
mer
cere
view
com
Existing foundations for future measures history of Infrastructure on the G20 agenda
The Italian G20 Presidencyrsquos focus on local sustainable infrastructure continues a decade-long history of infrastructure on the G20rsquos agenda Future action can build on the foundation of previous initiatives and principles and leverage existing capacities
Infrastructure first appeared on the G20rsquos agenda during the 2010 Korean Presidency when the G20 formally recognised the importance of infrastructure for economic growth (G20 2010) and outlined concrete measures in a Multi-Year Action plan aimed to address bottlenecks in infrastructure provision in low-income countries
Furthermore the G20 created a High-Level panel on Infrastructure to mobilise support for scaling up infrastructure financing and tasked MDBs with developing an action plan to increase infrastructure financing and improve project implementation
The panelrsquos report and the MDBsrsquo action plan were presented and endorsed by the G20 at the 2011 Cannes summit (G20 2011) Recommendations included creating an enabling investment environment in low-income countries through legal and regulatory reforms promoting capacities for bankable projects mitigating risks to increase the availability of long-term funding and expanding the role of MDBs in infrastructure financing Further measures along these recommendations were concluded at the 2012 Summit in Los Cabos under the Mexican Presidency
The 2013 Russia Presidency focused on the role of long-term financing in infrastructure development and took action to attract such investment in the G20 The St Petersburg Summit endorsed the working plan prepared
ww
ww
orld
com
mer
cere
view
com
by the G20 Study Group on Financing for Investment and the G20OECD High-Level Principles of Long-Term Investment Financing by Institutional Investors (G20 2013) and agreed on the implementation of a set of collective and country-specific actions
During the Australian Presidency in 2014 infrastructure became a G20 priority through the endorsement of the Global Infrastructure Initiative (GII) a multi-year programme to promote quality public and private infrastructure investment
The Group identified guidelines to identify prioritise plan and deliver infrastructure projects and established the Global Infrastructure Hub (GIH) a non-profit organization to support he G20 in the implementation of the GII and future infrastructure programmes
As part of this initiative the World Bank launched the Global Infrastructure Facility (GIF) a global platform that supports the identification high-quality preparation financial structuring and procurement of infrastructure projects in emerging markets and developing economies to enable private investment
The private sector was identified as a main stakeholder in mobilising investment in infrastructure (G20 2014) Private sector involvement remained the focus of the G20rsquos infrastructure strategy in 2015 The 2015 Antalya Summit developed guidelines and best practices for public-private-partnership (PPP) models as well as country-specific investment strategies to improve the investment ecosystem and foster long-term infrastructure investment
ww
ww
orld
com
mer
cere
view
com
The G20 further worked on toolkits to support countries better prepare prioritise and finance infrastructure projects (G20 2015)
During the Chinese Presidency in 2016 emphasis is placed on quality infrastructure investment and the role of MDBs within the infrastructure agenda Quality infrastructure investment aims to ensure economic efficiency in view of life-cycle cost safety resilience against natural disaster job creation capacity building and transfer of expertise and know-how on mutually agreed terms and conditions while addressing social and environmental impacts and aligning with economic and development strategies (G20 2016a)
The 2016 Hangzhou Summit encouraged the MDBs to scale up infrastructure investment attract private finance and strengthen project pipelines through better project preparation (G20 2016b)
Finally the G20 recognised the importance of infrastructure connectivity meaning the linkages of communities economies and nations through transport communications energy and water networks for achieving sustainable development and shared prosperity
To this end it endorsed the Global Infrastructure Connectivity Alliance (GICA) which aims to enhance the synergy and cooperation among various infrastructure connectivity programs in a holistic way
The 2018 Buenos Aires Summit once again focused on infrastructure for development and members reaffirmed their commitment to attract more private capital to fill the infrastructure investment gap (G20 2018)
ww
ww
orld
com
mer
cere
view
com
To achieve this the G20 endorsed the Roadmap to Infrastructure as an Asset Class and the G20 Principles for the Infrastructure Project Preparation and committed to take actions towards greater contractual standardization reducing data gaps and improving risk mitigation instruments
At the 2019 Osaka Summit the G20 established the G20 Principles on Quality Infrastructure as a common strategic direction Building on the G7 Ise-Shima Principles of Quality Infrastructure quality infrastructure investment should aim to maximise the impact of infrastructure on sustainable growth and development raise economic efficiency in view of life-cycle cost integrate environmental and social considerations contribute to building resilience against natural disasters and other risks and strengthen infrastructure governance (G20 2019)
Finally under the Saudi Arabian Presidency the G20 endorsed the Riyadh InfraTech Agenda which provides policy guidance to governmentsrsquo and international organizationsrsquo infrastructure technology strategy Infrastructure technology refers to the integration of material machine and digital technologies across the infrastructure lifecycle including in the design planning delivery and in the structures themselves
The Agenda endorsed at the 2020 Riyadh Summit aims to harness technology to deliver quality infrastructure investment promote inclusive accessible sustainable and affordable infrastructure in view of lifecycle costs mobilise private-sector financing and support the development of infrastructure as an asset class (G20 2020c)
ww
ww
orld
com
mer
cere
view
com
future sustainability goals and needs (lsquostranded assetsrsquo) Without sensible and sustainable infrastructure investment climate targets will be unattainable
At the same time global temperatures are already 1 degree Celsius above pre-industrial times and certain effects of climate change are inevitable Infrastructure planning must therefore consider not only mitigation of further GHG emissions but also adaptation to a changing environment
At least 55 of the global population are already living in infrastructure-dense urban areas (cities) Therefore the roll-out of sustainable infrastructure both to mitigate emissions and to adapt to a changing climate will be highly relevant for local communities
Countries and cities across the G20 differ in their climate income urban form and levels of industrial activity There exists therefore a wide variation in the type of low-carbon infrastructure that different cities could use to reduce emissions (Kennedy et al 2014)
For example colder cities will focus on building construction and renovation for maintaining heat while warmer cities will focus on urban design to avoid retaining heat or reducing building exposure to heat in the first place This report therefore identifies some general themes for low-carbon infrastructure
In the following section we will focus on several areas of local infrastructure investment that are key for reaching these goals shifting to a zero-carbon electricity (power) sector energy-efficient buildings zero-emission mobility digital infrastructure water and waste management as well as low-carbon construction materials
ww
ww
orld
com
mer
cere
view
com
These areas are selected to cover those proposed for sustainable infrastructure by Bhattacharya et al (2019) as well as due to their high contribution to global GHG emissions Together the sectors under focus account for over 40 of global GHG emissions10
31 Electricity sectorbull Stopping the deployment of new coal-fired power plants should be a priority for infrastructure investment A
significant co-benefit will be improved local air qualitybull Renewable electricity generation can be deployed in a decentralised manner allowing for local production
storage and usage of electricity increasing benefits for local economies This leads to both economic and health benefits
bull G20 infrastructure investment strategies in the electricity sector should focus upon enabling investments which incentivise further private investment
311 Electricity generationSecuring a reliable supply of decarbonised electricity is a fundamental building block for all G20 economies to comply with the goals of the Paris Agreement GHG emissions from electricity (power) generation accounted for 38 of total energy-related emissions in 2018 (IEA 2019)
Moreover the decarbonisation of many different end use sectors that currently rely upon alternative fuels lies in electrification For example electrification is seen as key for the decarbonisation of both the road transport and household heating sectors
Over the past few yearsrsquo investment has been significantly larger in solar and wind power compared to coal or gas power showing that the global power market is already moving in the right direction ndash albeit at too slow a pace11
ww
ww
orld
com
mer
cere
view
com
As Figure 5 shows solar photovoltaic (PV) was the electricity sector technology with the largest annual investment in 2019 with around US$140 billion a year The investment into solar PV is in fact larger than gas and coal power combined
For projects with low- cost financing which use high quality resources solar PV is already today the cheapest electricity source in history (IEA 2020a) and these costs are forecasted to continue decreasing
In spite of the aggregate global shift toward solar PV global coal-fired power capacity is set to increase further as certain countries continue to expand their coal-based energy production A 2019 report shows that G20 economies still provide at least $48 billion per year to support coal-fired power generation (Genccedilsuuml et al 2019)
G20 economies must urgently phase out government support to coal-fired power generation both home and abroad Higher costs of financing further impede the deployment of renewable power plants which are capital intensive relative to their fossil fuel counterparts
Many of the areas where coal-fired power plants are still being constructed are in developing regions where access to low-cost finance for the deployment of renewable power can be challenging A priority for the G20 should be ensuring the access to cheap capital for the deployment of renewable power generation across the world
Replacing existing coal-fired power plants with low-carbon power generation is more difficult than not building them in the first place Once built vested interests incumbents political opportunism and incumbent employment all create difficulties to shut down a coal-fired power plant
ww
ww
orld
com
mer
cere
view
com
Figure 5 Global Investment in the Power Sector by Technology 2017-2020
Source Bruegel on IEA (2020a)
350
300
250
200
150
100
50
0Electricity networks
Coal power Gas power Nuclear Solar PV Wind Other renewables
Battery storage
2017 2018 2019 2020
ww
ww
orld
com
mer
cere
view
com
Economically an already built coal plant is also more competitive when compared with newly built low-carbon power While best avoiding new coal power plant deployment G20 countries invested into coal must also begin to plan for the equitable phaseout (lsquojust transitionrsquo) from coal power generation
312 Local and smarter electricity gridsThe shift from fossil fuel to renewable power generation holds a significant side-effect which is the shift toward democratisation of energy Over the past 15 years a variety of schemes in G20 countries particularly in Europe have incentivised consumers to purchase their own solar panels12
This helped created a worldwide market for household solar PV Households who invest in their own electricity generation can enjoy significant economic savings on energy bills
Community schemes which allow groups of households to invest together into small solar or wind plants have also grown in number Such schemes have the benefit of allowing many households within a community to come together and act as a larger economic agent investing into larger clean power plants and sharing the economic and energy benefits
The costs are also likely to be lower on average than single household PV (Lazard 2020) This distributed power generation has the important co-benefits of democratising energy empowering citizens to feel a part of the energy transition and potentially positive network spill over effects whereby neighbours adopt solar panels
Household- or community-level deployment of renewable electricity generation involves private investment into infrastructure which provides a public good namely the mitigation of GHG emissions and perhaps more
ww
ww
orld
com
mer
cere
view
com
importantly for a local community the mitigation of local air pollutants that are harmful to human health Schemes to encourage the growth of such private agent behaviour are attractive options
Local authorities might consider further subsidy schemes or feed-in tariffs to accelerate the adoption of household solar PV However this is an expensive (and regressive) policy and the price of solar PV has already been driven significantly down
A more sensible approach would involve the redesign of electricity markets to allow households to receive fair compensation for the electricity they provide to the grid An example of this would be the trade of electricity between households at a local level13 another example is mechanisms designed to encourage flexible household electricity demand depending on current market conditions14
Such a market mechanism if well-designed should incentivise private investment into local renewable power generation with the important co-benefit of creating a local shared community spirit of renewable energy
Moreover in many developing economies grid infrastructure has not yet been built to reach all of the population Here decentralised renewable electricity generation is an attractive option for providing much-needed electricity to households and communities in rural or other areas without main grid connections
313 Enabling infrastructure investmentIn addition to facilitating the shift in investment toward low-carbon power generation an equally important challenge for G20 countries lies in future-proofing the electricity grids of today Significant investments are required to upgrade grids for the challenges they will face These arise both on the supply and demand side
ww
ww
orld
com
mer
cere
view
com
On the supply side the challenge will be to successfully incorporate increasing shares of intermittent renewable electricity generation Grids have traditionally comprised a few central generation units which ramp production up and down to distribute power to multiple homogenous end users
The drop in the costs of solar PV has changed this dynamic It is now possible for households or firms to purchase solar panels place them on their roof and generate their own electricity
The electricity grid is being forced to adapt toward a situation in which power is being fed into the grid from an ever-growing number of sources with non-constant supply
On the demand side in countries that pursue electrification of non-traditionally electrically-powered sectors there will be additional strains placed on power grids
This is particularly relevant with the electrification of transport the charging of large fleets of electric vehicles will put substantial new loads on electricity grids
Sensible infrastructure projects should prepare electricity grids for this twin challenge Grids must be reinforced and strengthened in particular areas whilst the implementation of digital technologies will facilitate smarter grids which are better able to balance fluctuating supply and demand
The ability of demand response ie rapidly adjusting power demand to accommodate shifts in supply is one of the most commonly discussed options for integrating higher shares of renewables into power grids Rapid fluctuations in demand will only be possible with sophisticated digital infrastructure
ww
ww
orld
com
mer
cere
view
com
The roll-out of smart meters allowing for accurate monitoring of electricity demand on a minute-by-minute basis is an important precursor to a flexible demand-side Smart charging of electric vehicles altering demand to match supply is also an important overlap into mobility infrastructure
This may further include vehicle-to-grid technologies whereby plugged-in electric vehicles are able to supply electricity to the grid at times of high demand effectively acting as a large battery for managing grid fluctuations
Further incentives to develop solutions for the intermittency of renewables will be required A commonly discussed option is batteries Figure 5 shows that in comparison with traditional power generation investments into battery storage technology are still relatively small Batteries and similar technologies for accommodating renewable power generation will become increasingly imperative infrastructure investments over the coming years
Cities must evolve to become smarter producers and consumers of renewable electricity Doing so requires significant upfront infrastructure investments The size of infrastructure investments required in electricity grids is extremely large
G20 countries should therefore focus their strategy upon enabling investments which hold a high investment multiplier ndash their provision and expansion will attract private capital investment into other sections of the grid
32 Buildings and climate resiliencebull Buildings are an inherently local infrastructure responsible for significant GHG emissions While for many G20
countries the challenge lies in redesigning buildings to lower levels of GHG emissions developing countries are focussed on building new stock
bull For G20 countries energy efficiency infrastructure should be deployed which is able to reduce the energy
ww
ww
orld
com
mer
cere
view
com
Fossil fuel subsidies
Within G20 countries fossil fuel subsidies are a problem much broader than coal-fired power generation A failure to shift away from these subsidies undermines commitments to sustainability goals whether they be under infrastructure or not G20 leaders have recognised this fact and repeatedly pledged to remove fossil fuel support
However G20 governments provided $584 billion annually to the production and consumption of fossil fuels at home and abroad (2017-2019 average) (IISD 2020b) This is down 9 from 2014-2016 values On aggregate G20 countries have doubled down on support to fossil fuel industries in response to the COVID-19 pandemic
IISD (2020b) helpfully distinguish five different forms of government support for fossil fuels These include direct budget transfers (through spending on RampD fossil fuel exploration for example) tax expenditures (such as tax breaks) price support (artificially lowering the market price for fossil fuels) public finance (loans and guarantees) and state-owned enterprise investments
The breakdown of both type of mechanism as well as by fossil fuel related activity is shown in Figure The majority of support for fossil fuels came through price support and State-Owned Enterprises (SOEs) investments and most of it went to oil and gas production
While not all of these support measures would technically fall under the definition of a subsidy by the World Trade Agreement on Subsidies and Countervailing Measures agreement direct budget transfers price support and tax expenditures do
ww
ww
orld
com
mer
cere
view
com
Figure 6 Fossil Fuel Subsidies in the G20
Source IISD (2020b)
Under this definition around $280 billion annually is used by G20 economies to artificially support the competitiveness of fossil fuels Simply removing these economically inefficient subsidies would have significant environmental benefits as well as sending a powerful signal to markets
Other forms of subsidies such as SOEs may be more difficult to address but should still be high on the agenda for any G20 nation looking toward a sustainable infrastructure agenda Efforts by central government to remove inefficient subsidies will make it easier for local governments to pursue a sustainable infrastructure agenda
SOE investment
Price support
Tax expenditures
Public nance
Direct budget
Oil and gas
Fossil fuel use
Fossil fuel-base
Coal production
Tota
l gov
ernm
ent
supp
ort
USD
bill
ions
G20 government support bytype of mechanism
G20 government support byfossil fuel related activity
257 277
168
126
172
79
51
25
ww
ww
orld
com
mer
cere
view
com
consumption of residential and commercial buildings Construction and renovation are a labour-intensive process and well suited for government spending with the intention of job creation
bull Concentrations of GHGs in the earthrsquos atmosphere already guarantee a rapidly changing climate The effects of this can be highly adverse and infrastructure planning particularly for buildings should consider the increased risk of adverse climate events
Buildings are an inherently local infrastructure clearly affecting the communities which live sleep and work within them Buildings are also responsible for a large share of GHG emissions
For many G20 countries the challenge lies in redesigning buildings to reduce their emissions while for developing economies with expanding populations and cities the challenge is to build in a sustainable manner to begin with
At the same time countries around the world must recognise the fact of a changing climate and the need for buildings to adapt to this
321 Reducing GHG emissions from buildingsEnergy usage in buildings today accounts for 18 of global GHG emissions (Our World in Data) Reducing energy demand from residential and commercial buildings is a priority area for green public investment
Energy efficiency measures can greatly reduce building energy demand for cooking space and water heating and cooling as well as for electrical appliances While certain efficiency gains are likely to be driven by public policy and regulation there is an important role for low-carbon infrastructure Namely the renovation of existing buildings to higher standards of energy efficiency through measures such as replacing loftwall insulation and replacing windows with double glazing
ww
ww
orld
com
mer
cere
view
com
Estimates by the Coalition for Urban Transitions (2019) show that building heating and cooling efficiency could lead to global abatement of 144 Gt CO2 from urban environment by 2050
The renovation of buildings toward higher energy efficiency standards is a highly labour-intensive task Rollouts of renovation infrastructure programmes therefore appear timely as governments respond to the fallout from the COVID-19 economic crisis particularly looking for investments with high returns in terms of jobs created per dollar spent
Beyond energy efficiency fossil fuels are still the largest global source for household heating There are a variety of options for decarbonising household heating but G20 countries today should begin sending clear market signals that the future of household heating will be through a non-carbon route
Infrastructure investments must begin here today if they are to be scaled in time to meet Paris Agreement commitments
322 Preventing emission lock in for developing economiesIn many parts of the world the construction of urban housing has not kept pace with population growth and internal migration towards cities From a GHG perspective developing countries face a different situation whereby the challenge lies more in rolling-out new sustainable housing rather than retrofitting existing housing to be sustainable
For example in sub-Saharan Africa 55 of the population still live in slums (Figure 7) To achieve the Sustainable Development Goals a clear first step is building housing which provides the necessary basic amenities for healthy living clean water clean cooking facilities clean heatingcooling equipment clean lighting
ww
ww
orld
com
mer
cere
view
com
Careful planning is also necessary for facilitating rapid migration into cities to avoid issues such as population build-up in areas vulnerable to hydro-geological hazards or expansion of cities with a lack of green spaces
In the context of developing economies the design of buildings that are low in GHG-emissions is just one among many (at least locally more) urgent considerations Developed economies have more capacity to place GHG-considerations higher up the policy agenda when considering the roll-out of new urban infrastructure
There is therefore a risk that developing countries will under-invest into the required steps for low GHG emission buildings instead building out large new cities that will become responsible for growing shares of the global GHG emissions
Here there is a role for the G20 to play in providing financial means to encourage the build out of sustainable infrastructure in developing economies from the beginning
323 Building sensibly for a changing climateMitigation of future greenhouse gas emissions must be central to the debate on sustainable infrastructure Unfortunately the existing concentration of GHG emissions in the atmosphere is sufficient to cause adverse climate related events
Substantial investments will be required to create sustainable and resilient cities and support adaptation to climate change The UCCRN Technical Report (2018) offers an exploratory analysis on the likely magnitude of these adverse events including heat extremes water availability food security and sea level rise
ww
ww
orld
com
mer
cere
view
com
Figure 7 Share of the Urban Population Living in Slums
Source Bruegel based on United Nations Global SDG Database
70
60
50
40
30
20
10
0Australia and New Zealand
Europe and Northern Amercia
Latin America and the
Caribbean
World Northern Africa and Western
Asia
Eastern and South
Easern Asia
Central and Southern
Asia
Sub-Saharan Africa
2000 2014 2016 2018
ww
ww
orld
com
mer
cere
view
com
The report is focussed upon adverse climate effects within cities One key finding is that by 2050 over 16 billion people living in more than 970 cities will face extreme heat of over 35 degrees Celsius for 3 consecutive months
At the same time over 800 million people from 570 coastal cities will be at risk of flooding due to at least 05 metres of sea level rise Declines in the national yields of major crops and a decrease in the availability of freshwater will also affect millions of G20 citizens
Different cities will face different challenges in adapting to climate change The common theme is that urban planning and infrastructure deployment must be always evaluated against the likely climate change impacts of the area over the coming decades There is a growing scientific literature offering evidence and advice on this
33 Mobilitybull A shift away from the internal combustion engine is necessarybull Transitions may occur toward cleaner vehicles or more systematic solutions would see a modal shift away
from private road transport and toward walking cycling and public transportbull Through either route infrastructure requirements are large
Mobility within cities must change significantly in order to meet goals of the Paris Agreement A modal shift away from the dominant combination of private and polluting vehicles will be required Different routes may be taken to achieve this
A technological route sees little consumer change as internal combustion engine automobiles are replaced with electric and other low-carbon vehicles Other routes may see more significant shifts in consumer behaviours with increased acceptance of public transport and walkingcycling in place of private automobile journeys
ww
ww
orld
com
mer
cere
view
com
Regardless of the route taken by individual cities infrastructure will be key For example under scenarios with little behavioural change an accelerated roll-out of electric charging infrastructure will be required to allow the transformation of most of the global vehicle fleet away from the internal combustion engine and toward electric vehicles by 2050
Alternative strategies with increased behavioural change will require investments into public transport and walkingcycling infrastructure In particular investments into city and walkingcycling infrastructure are low in most countries
Increasing the share of citizens travelling by foot or bike reduces GHG emissions and has alternative co-benefits of exercise leading to a healthier population reduced air pollution and reduced noise pollution see Figure 8
Public transport infrastructure in most parts of the world needs to be significantly improved such that it more efficiently competes with the automobile for a door-to-door journey15 This is a problem as many cities still lack effective schemes for integrating long and short distance transport means
A modal shift from road to rail will also require investment into high-speed rail Improving rail connections has been shown to increase demand For example when China connected the isolated Zhengzhou-Xi line in 2012 to the Beijing High Speed Rail network passenger volume increased by 43 (Lawrence et al 2019)
The adoption of multi-modal solutions to effectively integrate the lsquolast milersquo within public transport networks requires systems innovation and infrastructure
ww
ww
orld
com
mer
cere
view
com
Figure 8 Concentration of Fine Particles in Cities in the G20
Note the figure shows mean annual concentration of fine suspended particles where the mean is a population-weighted average for urban population in a countrySource UN Global SDG Database for 2016
100908070605040302010
0
Cana
da
Aust
ralia
USA U
K
Arg
entin
a
Braz
il
Japa
n
Ger
man
y
Fran
ce
Euro
pe
Russ
ian
Fede
ratio
n
Italy
Indo
nesi
a
Mex
ico
Sout
h A
fric
a
Sout
h Ko
rea
Turk
ey
Chin
a
Indi
a
Saud
i Ara
bia
μgm
sup3
ww
ww
orld
com
mer
cere
view
com
For example in 2015 the Metropolitan Atlanta Rapid Transit Authority (MARTA) announced a partnership with Uber whereby MARTA public transport users can directly link to Uber from the app and request an Uber which will be waiting when the passenger arrives Such lsquosmart cityrsquo solutions to transport require adequate telecommunication networks
In the next section we will look at such digital infrastructure
34 Digital Infrastructurebull Digital infrastructure is key for achieving SDGsbull Access to high-speed internet is an important prerequisite for the effective integration of firms and workers
into the global economy and increasingly for citizens into local communities
An increasingly important part of connecting local communities with the global economy is digital connectiveness Investment into digital infrastructure is important for sustainable development
Indeed target 9c of the SDGs is to significantly increase access to ICT technology and to strive to provide universal and affordable access to the internet globally
The COVID-19 pandemic has further illustrated the importance of digital technologies not least with regards to achieving other SDG targets involving education decent work and economic growth as well as gender equality
Access to reliable internet is increasingly becoming a prerequisite for both workers and firms to participate in the global economy and for citizens to participate in local or global communities
ww
ww
orld
com
mer
cere
view
com
A UNCTAD (2017) report lays out key areas for digital infrastructure investment The report breaks down investment needs for internet availability into three areas where there is no coverage where there is cellular coverage and where cellular coverage has been upgraded to broadband
For different countries investment needs will differ by the share of these three regions For some countries investment needs will be substantial to roll-out out internet infrastructure to current areas of no coverage characterised by high deployment costs andor low demand
For other countries mostly G20 countries where universal cellular connection is already established the challenge is one of upgrading the technology
Infrastructure to improve the speed of internet connection will also have positive economic effects Figure 9 shows the scale of this challenge across different G20 countries The figure refers to subscriptions to the public internet at downstream speeds equal to or greater than 256 kbits
Beyond internet access G20 countries should also look to pursue policies which enable private investment into digital firms as well as encouraging digital adoption by traditionally non-digital firms where appropriate Digitalisation offers significant development opportunities in terms of employment and by facilitating new and more efficient business models
Mobile banking as one example has provided affordable access to many individuals in situations with difficult access to conventional banking systems Encouraging investments into telemedicine online retail online payments are other examples of likely desirable digital infrastructure policy objectives
ww
ww
orld
com
mer
cere
view
com
Figure 9 Share of Population with a Fixed Broadband Subscription in G20 Countries
Source Bruegel based on World Development Indicators EU data for 2018 all other data 2019
50454035
2530
201510
50
Indi
a
Sout
h A
fric
a
Indo
nesi
a
Mex
ico
Braz
il
Turk
ey
Arg
entin
a
Saud
i Ara
bia
Russ
ian
Fede
ratio
n
Italy
Chin
a
Japa
n EU
Aust
ralia U
S
UK
Cana
da
Ger
man
y
Sout
h Ko
rea
Fran
ce
Perc
ent
ww
ww
orld
com
mer
cere
view
com
The application of digital technologies to infrastructure described by the G20 InfraTech Agenda16 as ldquothe integration of material machine and digital technologies across the infrastructure lifecyclerdquo will also play a major role in the transition to low- and eventually zero-carbon economies As a cross-cutting technology it has the potential to increase efficiency and reduce emissions in many crucial infrastructure systems
One example discussed above is the digitalisation of electricity grids facilitating more efficient accommodation of renewable electricity sources Importantly digital infrastructure also allows environmental data collection sharing and analysis which can be a major mitigating factor of climate change17
35 Waste and water managementbull Waste and water management processes contribute significantly to global GHG emissions Moreover their
effective design is essential for shifting toward a more circular economybull Sensible water policies will become increasingly important over the next decades with the effects of climate
change
Waste and water management both directly affect local communities In certain regions the burning of waste releases toxic gases which contribute toward air pollution
Moreover waste which is not properly disposed of can lead to land or water pollution Securing a fresh water supply to local citizens is a growing problem exasperated by the effects of climate change Beyond local issues the treatment of solid and water waste contributes a significant share of global GHG emissions estimated at 2 and 1 respectively18
ww
ww
orld
com
mer
cere
view
com
351 Solid wasteWaste management must be considered central to sustainability goals The current model of extracting natural resources consuming them and then disposing a large proportion in the form of useless waste is by definition unsustainable
G20 governments should pursue plans to shift toward the circular economy and zero waste societies To illustrate the scale of the problem data from the US show that 50 of municipal solid waste ended up in landfill in 201819
It is acknowledged that the lack of effective solid waste management as well as unsustainable production and consumption patterns are key to the problem
From an infrastructure perspective efforts can be made to improve recycling capacity This might involve expanding the institutional and logistics chain to better involve consumers in the separation of waste into recyclable components as well as increasing final capacity for recycling
Another infrastructure option would be increasing capacity to generate useful energy from solid waste or capturing fugitive emissions from landfills Such projects should be viewed as a complement to first reducing the volume of waste ending up in landfills in the first place
352 WaterAs of 2015 21 billion people lacked access to safely managed drinking water services (WHO and UNICEF 2017) Difficulties in accessing freshwater are set to increase with the effects of climate change Policy design and infrastructure should focus on managing water resources well in order to maximise human welfare
ww
ww
orld
com
mer
cere
view
com
On a local level infrastructure requirements in many countries will be dominated by the need to adapt to a changing climate and provide a secure supply of freshwater
There exists a substantial gap between current financing and required needs for water infrastructure OECD (2018) outlines some key reasons for this water is generally an under-valued resource water infrastructure is capital intensive with high sunk costs and its benefits are of both private and public nature making it hard to monetise
The capacity to treat and clean wastewater also needs to be expanded in many regions of the world United Nations (2017) estimates that high-income countries treat about 70 of the wastewater they generate but this drops to 8 for low-income countries
Globally over 80 of all wastewater is discharged without any treatment which contributes to the spread of water-borne diseases A key challenge is rolling out further global wastewater treatment infrastructure capacities and best practices
Wastewater treatment plants themselves are also responsible for significant GHG emissions Options should be explored for decarbonising this process There are also substantial improvements necessary regarding the effective treatment of water run-off from industry and agriculture
36 Industrial materialsbull Building infrastructure is a resource and greenhouse gas intensive process responsible for 11 of global
GHG emissions20bull Beyond building the infrastructure needed for a low-carbon economy the construction of the infrastructure
itself must become sustainable
ww
ww
orld
com
mer
cere
view
com
bull The G20 should support the commercialisation of low emission technologies for the production of materials used in infrastructure development by creating lead markets
Building construction itself accounts for 11 of global GHG emissions (Our World in Data) Before any infrastructure strategy can be deemed truly sustainable the materials used to build with must first be sustainable
Instead there is significant carbon embedded in the infrastructure projects of the past and without swift action at the G20 level this will continue to be the case for almost all infrastructure projects in the future
An important aspect is therefore developing low-carbon technologies for some of the key elements used in manufacturing and construction process namely steel aluminium and cement All three have proved difficult to decarbonise and still contribute significantly to GHG emissions
Infrastructure lock-in in the form of carbon-intensive production capacity for each of these sectors is a problem At current trends it is likely that many G20 economies will have to decommission and replace todayrsquos fossil fuel intensive production facilities with low-carbon production facilities of the future
While carbon neutral technologies are currently not competitive in prices the G20 could create markets through public procurement and subsidies that would incentivise investment into research and development of these technologies
Steel is fundamental to modern life being used widely in infrastructure ships trains cars and machines Steel also has important uses cases for the transition toward low-carbon economies in electric vehicles and wind turbines
ww
ww
orld
com
mer
cere
view
com
Aluminium is used for infrastructure transportation vehicles electrical conductors and consumer goods such as packaging It has a high strength to weight ratio great flexibility and is infinitely recyclable which makes it an attractive material Cement is used to make concrete which is a vital building block for infrastructure
Current methods for the production of steel aluminium and cement are both energy and GHG intensive Estimates suggest that the production of steel aluminium and cement account for approximately 7 2 and 4 of global GHG emissions respectively21
To meet sustainable development scenarios it is imperative to reduce the carbon emissions associated with the production of these key industrial materials
In all cases some energy and material efficiency gains may be made and end-use cases may undergo some substitution toward less carbon-intensive materials Increased recycling can also play a key role
However it will still be essential to redesign current carbon-intensive production methodologies This may involve shifting to new primary production technologies the consumption of different fuels for energy provision or the adoption of carbon capture and storage technologies
OECD (2019) identify some of the key barriers which have so far prevented low-carbon innovation and deployment in these sectors First steel and cement plants operate with low profit margins in competitive markets
This has led to fears of carbon leakage and in emissions trading programs such as the EU ETS the sectors have consequently received a large share of free allowances As a consequence innovation in the heavy industrial sectors has remained muted
ww
ww
orld
com
mer
cere
view
com
Secondly heavy industry plants operate at very long timescales They can last for between 25 and 50 years Much new capacity is being built in developing economies while developed economies already enjoy an oversupply of production capacity Moreover there has so far been no serious attempts to create demand for low-carbon heavy industrial materials (OECD 2018)
Reducing carbon emissions from heavy industry sectors can be viewed from a supply and demand perspective From a demand perspective policy tools should be used to increase material efficiency (ie using less material to achieve the same result) and encourage material recycling From a supply perspective the challenge is to support low-carbon alternatives
Given the long lifecycles of heavy industry plants to meet targets of the Paris Agreement low-carbon technologies should already be commercialised by the mid-2030s It is therefore of fundamental importance for G20 countries to create lead markets and demand for low-carbon steel cement and aluminium
A variety of options can be followed by G20 governments to decarbonise these sectors One option is green public procurement where governments purchase only low-carbon construction materials or commit to targets for procurement of low-carbon materials in the future Other options are regulations to impose a minimum percentage share of low-carbon materials in any construction project
Carbon pricing is conventionally seen as driving low-carbon deployment In construction materials the problem is that globally carbon prices that exist do not reach the levels required to sufficiently incentivise low-carbon production
ww
ww
orld
com
mer
cere
view
com
Carbon contracts for difference are an option for artificially increasing the carbon price for certain sectors for a period of time Here a government guarantees a certain carbon price to eg the steel sector and pays a steel producer the difference between the existing carbon price and a higher promised carbon price for every tonne of carbon abated
Such a scheme would be implemented for a few years until the price of low-carbon production was driven down to levels whereby a conventional carbon tax can stimulate further demand
G20 action is vital for the deployment of the technologies for low-carbon production in these sectors Without its leadership in promoting green industrial materials infrastructure construction will continue being carbon intensive Infrastructure projects designed for the abatement of GHG emissions or adaption to a changing climate will continue to further exasperate the issue at hand
Successful policy design should allow G20 countries to drive down costs in a manner similar to that in which European lead markets drove down costs for solar and wind power generation in the 2000s As costs are driven down it will also become increasingly feasible to bring other global actors on board
4 Financing sustainable local infrastructurebull Strained public budgets are unable to finance the massive sustainable infrastructure gap but private sector
investment falls short of the needs due to inherent complexities and risks of infrastructure projectsbull Local governments face unique challenges in financing infrastructure due to complex decision-making
structures limited access to funding and technical assistance and the lack of capacity to structure projects for private investment
ww
ww
orld
com
mer
cere
view
com
bull Development financing institutions should expand their services to local communities by providing funding and technical assistance to small-scale projects and to crowd-in private financing
bull Pervasive structural budget overruns and project delays in the infrastructure sector must be addressed by national governments to increase private sector investment
Traditionally infrastructure and the services it provides are managed by the public sector For many types of infrastructure governments are the best-suited providers As a result of a global decentralisation trend in the public sector today municipalities are frequently in charge of selecting and managing infrastructure implementation (Merk et al 2012)
Furthermore national climate plans are often implemented through local action In most G20 countries over 50 of investments in infrastructure are made by local governments In OECD countries more than 60 of climate-smart investments are made at the local level
To close the multi-trillion-dollar sustainable infrastructure gap discussed in Section 2 which resulted from years of global underinvestment new sources of financing have to be found This is especially true for low- and middle-income countries whose public budgets are already stretched thin in the wake of the COVID-19 pandemic
Prohibitively high capital costs often make it impossible to afford the high upfront investments many infrastructure projects require Hence there is widespread agreement among policymakers researchers and climate activists that the infrastructure gap can only be closed with significant private sector investment (Bhattacharya et al 2019 Grimm and Boukerche 2020)
ww
ww
orld
com
mer
cere
view
com
This will enable governments to allocate scarce public funds more efficiently The current financial market environment represents an opportunity for sustainable infrastructure investment in developing and emerging economies by the private sector the combination of excess savings and low interest rates in advanced economies with high foreign investment needs and returns in the emerging economies and developing countries is an ideal setting for more efficient capital allocation
Most countries are unable to translate the tremendous needs and opportunities for sustainable infrastructure into realised demand and a significant proportion of investment is not as sustainable as it should be
One good example is FDI flows Global FDI flows to advanced as well as emerging and developing economies are dominated by the G20rsquos investments Bhattacharya et al (2019) analyse these capital flows between 2011 and 2017 with respect to their sustainability Only 11 of the US$4 trillion foreign investment by G20 countries was channelled into sustainable infrastructure
As Figure 10 shows low- and lower-middle income countries make up a disproportionately low share of recipients relative to their investment needs Similarly when considering the type of infrastructure that is being funded the vast majority flows into the energy sector
Local infrastructure such as water waste and transport represent an almost negligible share of the G20rsquos FDI in sustainable infrastructure in emerging markets and developing countries It appears that capital does not flow where it is needed most This is due largely to the inherent complexities of local green infrastructure development
This firstly relates to funding In general cities rely on transfers of federal funds or on reallocation of existing municipal budgets to fund investments in local green infrastructure But local governments face unique barriers
ww
ww
orld
com
mer
cere
view
com
Figure 10 Distribution of Sustainable Infrastructure FDI from G20 Countries to EMDCs by Income Level of Recipient 2011-2017 in USD Billion
Source Bruegel based on Bhattacharya et al (2019)22
140
120
100
80
60
40
20
0High income Upper middle income Lower middle income Low income
Waste Transport Water Energy
ww
ww
orld
com
mer
cere
view
com
in accessing private finance and the ability to do so varies substantially with their size political autonomy and institutional capacity
Ivanyna and Shah (2012) show that only 16 of countries authorise regional authorities to set local tax rates independently More so the majority of national governments either forbid or heavily restrict local authoritiesrsquo ability to raise money from capital markets and prohibit them from issuing municipal bonds (Ivanyna and Shah 2012)
Among those that are in theory able to issue debt many have no or very low ratings on credit markets especially in lower income countries (Carter and Boukerche 2020)
A second major barrier to local infrastructure investment is the lack of investment opportunities of sufficient quality and appropriate size This includes both the lack of investible projects and the challenge of matching them with the suitable financier
Much infrastructure does not generate direct and quantifiable returns In many cases its aim is to expand the accessibility to the service it provides to the largest possible number of citizens Even if there are monetary profits they are generated gradually over long-time horizons
Similarly one source of private financing that has received a lot of attention in the recent policy discussion are institutional investors The capital pool managed by such institutional investors in the OECD alone amounts to US$100 trillion which would be more than enough to close the sustainable infrastructure gap (Grimm and Boukerche 2020)
ww
ww
orld
com
mer
cere
view
com
However local infrastructure projects are usually too small for institutional investors A study by the C40 Cities Finance Facility found that 45 of municipal infrastructure projects are smaller than $10 million (C40 2018)
Therefore it is crucial that the source of funding and the specific infrastructure project are efficiently matched The missing lsquopipeline of projectsrsquo is a recognised obstacle to infrastructure investment at all scales and sectors (Bhattacharya et al 2019) but is exacerbated at lower levels of governments
Most local administrations do not have the resources nor the expertise to identify design and structure sustainable projects that could attract private investors
Climate-related investments also frequently require technical feasibility and impact studies which municipalities are unable to afford (Carter and Boukerche 2020) Access to external concessional finance for project preparation is scarce at the local level
A final obstacle to private sector investment in local green infrastructure is risk Projects are generally long-term and entail substantial and costly planning preparation and construction phases with no monetary returns for years Cost overruns and delays are pervasive in the infrastructure sector
Municipal infrastructure projects face additional bureaucratic hurdles due to often complex and opaque decision-making structures between regional and higher-level governments Due to their cross-cutting impact infrastructure projects require the involvement of many diverse stakeholders and a substantial fraction of the funding needs to be paid upfront
ww
ww
orld
com
mer
cere
view
com
This cost structure is exacerbated in sustainable infrastructure where upfront costs tend to be 5-10 higher while operating and maintenance costs are lower (Bouton et al 2015) In addition due to the time-dimension there is substantial uncertainty related to future regulatory economic technological and political developments which is compounded in local projects as regional governmentsrsquo influence on national strategies is limited
Finally positive and negative externalities of infrastructure must be assessed and quantified For example a desired if long-term outcome of investments in green infrastructure is the positive environmental impact and other collective social benefits But these positive externalities are difficult to quantify in terms of revenue or returns on investment (Carter and Boukerche 2020)
In other words the lack of appropriate carbon prices makes it impossible to incorporate the negative environmental effects of high-carbon infrastructure into investment opportunities All this makes green local infrastructure inherently risky for investors
Local governmentsrsquo room for manoeuvring these difficulties is relatively scarce However they can attempt to strategize their revenue system Urban administrations are advantaged with respect to their revenue system because the infrastructure sectors with the highest lsquogreeningrsquo potential such as buildings (energy efficiency) transport (public transport roads electric vehicle charging stations) water and waste are the sources of a substantial share of citiesrsquo revenues
By setting transport and parking fees utility charges and possibly property taxes accordingly local governments are in a unique position to lsquogreenrsquo their revenues by incentivising a more sustainable use of existing resources as well as the transition towards more climate-smart infrastructure (Merk et al 2012)
ww
ww
orld
com
mer
cere
view
com
The purpose of this policy is not to gather additional earnings On the contrary if higher parking fees lead to reduced downtown car traffic revenues may even decline Instead it can encourage a shift in the local communitiesrsquo infrastructure use from dirtier to more sustainable alternatives
The following sections will expand on the role that development finance institutions and national governments can play in alleviating barriers and crowding-in private investment in local sustainable infrastructure Finally we discuss the widespread occurrence of cost overlays and construction delays and non-completion of infrastructure projects
41 Mobilising private funding for sustainable local infrastructure the role DFIsNational and international development banks (henceforth summarised under the term development finance institutions or DFIs) will play a critical role in filling the global infrastructure gap particularly but not only in low- and middle-income countries
Backed by the strong credit ratings of their members DFIs are able to borrow cheaply from capital markets and thereby bring down the cost of finance for their debtors According to World Bank estimates emerging market and low-income economies alone require annual investments of approximately US$15-27 trillion in sustainable infrastructure until 2030 in order to achieve the SDGs and meet a 2degC climate target (Rozenberg and Fay 2019)
As Table 3 shows annual investments in sustainable infrastructure in EMDEs by multilateral and national development banks and G20 FDI combined accounted only for US$1548 billion between 2011 and 2017
A recent study suggests that MDBs could substantially increase their lending headroom while maintaining their excellent credit ratings (Munir and Gallagher 2018) Specifically depending on the scenario considered lending capacity could be increased by between US$598 billion and 19 trillion
ww
ww
orld
com
mer
cere
view
com
While this is noteworthy it is clear that financing the trillion-dollar yearly gap is well beyond the direct capacity of DFIs Instead the primary role of DFIs should shift from providing funding themselves to catalysing private sector investments
The true power of DFIs lies in their project expertise which enables them to fill two crucial gaps in the local sustainable infrastructure investment system risk mitigation and project supply
Thanks to their expertise DFIs are in the ideal position to assess and ensure appropriate risk sharing among participating investors As explained above many factors make local climate-smart infrastructure projects relatively unattractive for private investors
In addition for investments in emerging markets and low-income countries risks such as inflation currency fluctuation and convertibility or expropriation are also present
Table 3 Sustainable Infrastructure Investments in EMDCs by Source of Financing
Source Bruegel replication of Table 2 in Bhattacharya et al (2019)
Total (USD billion) Annual (USD billion) Share of EMDC need Share of global need
MDBs 180 257 12 03
NDBs 621 888 42 12
G20 FDI 282 403 19 05
Total 1083 1548 74 20
ww
ww
orld
com
mer
cere
view
com
Thanks to their longstanding experience of successfully lending to and implementing projects in high-risk contexts DFIs are adept at negotiating with stakeholders managing risks and monitoring and measuring project impact
Their past relationships with governments reduce political and operational risks of investments and MDBs have a proven track record of serving as intermediaries between developing countries and investors (Mohieldin et al 2018)
DFIs should increase their participation in blended finance structures for private sector investment while continuing to engage in institutional strengthening and capacity building and bolstering the fundament of market-oriented growth in the receiving countries
The second major barrier to be addressed is the lack of investible projects This is akin to supporting the demand side of infrastructure financing
By providing technical assistance along all stages of preparation from project identification over feasibility studies to matching with investors DFIs can contribute to a reliable supply of high-quality local sustainable infrastructure investment opportunities This would not only increase the projectsrsquo quality but also build local capacities and transfer knowledge to municipalities
For this to have an impact on local infrastructure it is crucial that DFIs expand their services to lower level of governments While DFIs are already an important source of funding for urban and sustainable infrastructure for example through the Global Environment Facility the Green Climate Fund and the Adaptation Fund (Carter and Boukerche 2020) they generally work at the national level
ww
ww
orld
com
mer
cere
view
com
This means that the financing provided in the above-mentioned facilities must be accessed through the national government which increases coordination needs and bureaucratic load (Alexander et al 2019)
DFIs should cooperate with the G20rsquos Global Infrastructure Facility (GIF) which was established precisely for that purpose and has experience in providing technical assistance to local governments and municipalities in infrastructure project design and structuring in order to attract private sector investment
The World Bankrsquos City Creditworthiness Initiative (World Bank 2018) is another great step towards this goal The program aims to improve municipalitiesrsquo access to financing for sustainable infrastructure by improving their creditworthiness
To this end the initiative provides a capacity-building lsquoacademyrsquo and a technical assistance program to enhance citiesrsquo ability to attract structure and manage private financing
42 Mobilising private funding for sustainable local infrastructure the role of national governmentsNational governments play a central role in crowding-in private sector investment in local green infrastructure Their main responsibility is to ensure a supportive and enabling investment environment for sustainable local infrastructure
Naturally this means addressing macroeconomic barriers to private-sector investment such as inflation or currency convertibility But increasing transparency in terms of climate intentions is also crucial The central government must be the leader in greening infrastructure investment
ww
ww
orld
com
mer
cere
view
com
This entails aligning national policies and regulatory frameworks with national climate commitments thereby sending clear signals to markets about infrastructure investment intentions Revising assessment frameworks environmental regulations and infrastructure standards at the national level to reflect sustainability goals facilitates their implementation for local governments
At the same time central governments could increase municipalitiesrsquo autonomy over their revenue systems in order to increase their room for policy action Eventually they should reassess and revise their institutional framework for municipal financing to ensure efficient allocation of resources while maintaining financial sustainability
In addition central governments must invest in administrative capacity-building This should also include increased coordination among higher and lower levels of government as well as transparent distribution of responsibilities
43 Infrastructure project performanceIn order to attract a higher share of private investment in sustainable local infrastructure governments must address the risk of construction delays cost overruns and project non- completion
Poor infrastructure project performance as measured by budget overruns and implementation delays is widespread The influential study by Flyvbjerg et al (2003) was one of the first to document the pervasiveness and magnitude of the problem Their analysis of 258 transport infrastructure projects in twenty countries found that almost 90 of projects experienced substantial delays and budget overruns of on average 26
Among them are for example the Channel Tunnel (80 cost overrun) and the Humber Bridge in the UK (175 overrun) Another investigation into the cost burden of large infrastructure projects around the world found that
ww
ww
orld
com
mer
cere
view
com
only four of the 52 projects studied remained within the forecasted budget and cost overruns averaged at 88 (Merrow et al 1988)
Prominent examples of delayed and excessively expensive infrastructure projects abound across the world and studies investigating this problem in virtually all G20 economies prove that this is still widespread today (See Fiedler and Schuster 2016 for Germany Lee 2008 and Han et al 2009 for Korea Pickrell 1990 and 1992 for the USA Doloi et al 2012 for India Durdyev et al 2012 for Turkey Kaming et al 1997 for Indonesia Allahaim and Liu 2015 for Saudi Arabia Creedy et al 2010 for Australia Baloyi and Bekker 2011 for South Africa Flyvbjerg et al 2003 for France Huo et al 2018 for China)
Similar findings to those in the transport sector have been found in other sectors of infrastructure and demonstrate considerable differences in average cost and time performance Sectors such as transmission lines (8) or solar (1) wind (8) and thermal power plants (12) seem to face fewer unanticipated cost hikes than nuclear power plants and large dam projects where cost escalation amount to 113 and 96 on average and the pattern is mirrored in delays in project completion (Ansar et al 2014 Sovacool et al 2014)
IT and ICT perform comparatively well on average but the sector includes frequent outliers with massively escalated costs23 It is important to note here however that national experiences may differ considerably from the averages found in trans-national studies especially at the subsectoral level24
Delayed projects that eventually turn into permanent and abandoned construction sites are more prominent in the developing world Recent evidence suggests that more than one-third of infrastructure projects in emerging markets and developing countries are not completed (Rasul and Rogger 2018 Williams 2017)
ww
ww
orld
com
mer
cere
view
com
These lsquowhite elephantsrsquo are a tremendous waste of resources in addition to presenting a potential danger to the local populations (Bancalari 2020) The studies estimate that waste of public resources through non-completion of infrastructure projects is of the same order of magnitude as the loss through corruption in infrastructure projects (around 2425) and is similar to the percentage of government spending that is lost due to politically motivated distortions (around 26) (Olken 2007)
Yet infrastructure non-completion receives much less attention in the development policy discussion and in academic literature than corruption and clientelism which is why the underlying causes are not yet well understood
The studies that are available identify the drivers of (non-) completion to be specific to the local institutions26 and identify a positive effect of budget conditionality on project completion that is fund disbursement for a new project to be conditional on the completion of the previous one
Similarly a striking feature of the existing literature on project cost and schedule performance is that it focuses almost exclusively on large infrastructure projects and megaprojects which are defined as ldquohelliplarge-scale complex ventures that typically cost US$1 billion or more take many years to develop and build involve multiple public and private stakeholders are transformational and impact millions of peoplerdquo (Flyvbjerg 2014 p3) and are managed by central governments
Literature on project performance for smaller infrastructure projects managed by local administrations is still scarce which is likely due to lack of reliable administrative data on infrastructure projects across levels of governments
ww
ww
orld
com
mer
cere
view
com
Understanding and mitigating the causes is absolutely vital By improving infrastructure project performance even marginally governments have the chance to generate substantial additional economic benefits from their investments in the wake of the current crisis
The magnitude of waste of fiscal resources is substantial and for middle- and low-income countries the social and developmental costs are tremendous Even a marginal decrease in the cost overruns in infrastructure projects could make billions of USD of public funds available for investment
While an analysis of the underlying determinants is beyond the scope of this report an assessment of local small-scale infrastructure service delivery in G20 countries will be instrumental to identify obstacles to timely and cost-efficient construction and address them27
Recommendations to the G20The G20 has had considerable success driving infrastructure up the agenda notably following the G20 Principles on Quality Infrastructure adopted at the 2019 Osaka summit and the InfraTech Agenda adopted at the 2020 Riyadh summit
The time has now come for the G20 to place sustainable and local elements at the centre of the conversation surrounding infrastructure We outline the key measures that should be taken to do so
bull Place climate sustainability at the core of the infrastructure agenda Infrastructure investments that are made now will lock in technologies for decades to come It is imperative that these contribute to limiting global warming to 15degC which needs to be emphasised in the G20 infrastructure agenda
ww
ww
orld
com
mer
cere
view
com
The G20 should revise the Principles on Quality Infrastructure to explicitly encompass climate change mitigative adaptive and resilient infrastructure
bull Sustainable policies start locally Building sustainable cities will be key to solving two of the most pressing challenges of our time climate change and population growth Covering only 2 of the planetrsquos surface cities are responsible for up to 70 of global GHG-emissions and home to the majority of the worldrsquos population
The G20 should recalibrate their individual and common infrastructure agendas to prioritise small-scale local investment that serves local communities
bull Improve access to finance for low-carbon projects Many low-carbon infrastructure projects such as deployment of solar PV are particularly capital intensive Higher costs of financing can prohibit ambitious levels of sustainable investment
In order to sustainable infrastructure investment in low- and middle-income countries the G20 should cooperate to provide cheaper financing This could be done through blended finance or concessional loan programs by DFIs
bull Address the shortage of bankable infrastructure projects Local administrations lack the capacity to identify prepare and structure sustainable infrastructure projects for private investment in their communities The G20 should expand the capacity of the Global Infrastructure Facility (GIF) to provide technical assistance to local governments throughout the project cycle in order to crowd-in private sector investments
ww
ww
orld
com
mer
cere
view
com
bull Commit to supporting bilateral and multilateral development banks DFIs are the key to unlocking large-scale infrastructure investments thanks to their expertise and long-term experience with risky project delivery With cities at the heart of the global zero carbon infrastructure transition they are only now beginning to support local governments directly
The G20 should continue to commit future funding to these institutions and promote their engagement at lower levels of government to enable them to provide much-needed support especially in low- and middle-income countries
bull Stimulate demand for low-carbon industrial materials Industrial materials are essential for sustainable infrastructure are responsible for significant GHG emissions Addressing this problem is difficult for a number of reasons The most efficient solution will be a coordinated commitment by the G20 to boost demand for low-carbon options
There are a range of policy options which could be deployed but whatever route is chosen it is essential that the G20 commits to this challenge now Further delays are incompatible with Paris Agreement targets
bull Improved cooperation across the G20 Decarbonising economies requires risk-taking experimenting and innovation Certain actions such as implicit or explicit carbon prices are essential for encouraging sustainable infrastructure but difficult for countries to implement unilaterally G20 coordination and stronger commitments to decarbonisation can facilitate more ambitious action at the national and in turn local level
bull Focus of lifecycle sustainability The G20 should advocate a shift toward a policy-making paradigm where policies are evaluated from a lifecycle sustainabilityemissions standpoint This would involve evaluating the
ww
ww
orld
com
mer
cere
view
com
whole chain of an infrastructure project from basic materials construction to recycling possibilities or waste disposal issues Best practices for this could be agreed at the G20 level
Mia Hoffmann is a Research Assistant Ben McWilliams a Research Analyst and Niclas Frederic Poitiers a Research Fellow all at Bruegel
Endnotes1 Extreme poverty is defined as living on less than $190 per day2 China is the largest emitter of CO2 with 28 of global emissions followed by the US (15) and the EU (9) In terms of per-capita emissions Saudi Arabia Australia and the United States lead the list of emitters among G20 economies Source Our World in Data (based on the Global Carbon Project)3 The financial support granted by IFI was around $200 billion roughly on par with the support during the Global Financial Crisis which affected developing economies only moderately compared to the current recession4 Energy-related emissions are to be understood as emissions derived from the purposeful transformation or use of energy The notable sectors are electricity production transport and buildings5 The reference is a collaborative effort to compile data from predominantly government sources Fossil Unconditional refers to policies that support the production and consumption of fossil fuels without any climate targets or additional pollution reduction requirements Fossil conditional includes such requirements Clean unconditional spending supports production and consumption of energy that is both low-carbon and has negligible effects on the environment Clean conditional energy intends to support the transition away from fossil fuels but the effect on the environment is unclear6 The results are from a survey of 231 finance ministry officials central bank officials and other economists representing 53 countries including all G20 nations Respondents were asked to assess the fiscal multiplier of each policy in a relative
ww
ww
orld
com
mer
cere
view
com
and subjective manner using 100-point sliding scale Respondents were not homogenous in their use of the sliding point scale and therefore respondents scores were re-based so that the y-axis now records a zero-mean zero-sum score ie comparable7 Ram et al (2020) investigates the global job effects in a scenario where accelerated renewable deployment sees the world transitioning to 100 renewable electricity by 2050 Their estimates are such that a scenario would see direct jobs associated with the electricity sector increasing from 21 million in 2015 to nearly 35 million by 2050 Solar PV wind power and batteries are the main job creators On the other hand a more recent study by Aldieri et al (2019) assessing literature from 2000-2019 finds that job creation connected to wind power installations is rather limited8 This estimate by New Climate Economy (2016) includes investments in urban transport waste water telecommunications and energy infrastructure systems but excludes investments in natural infrastructure9 Energy efficiency in buildings energy and transportation low-carbon core infrastructure renewable energy nuclear low-carbon transport climate-proof water and sanitation adaptation infrastructure10 Energy use in buildings (175) road transport (119) waste (32) and iron steel and cement (102) (Our World in Data)11 The IEA has recently declared solar the King of electricity markets12 For example in the UK (httpswwwofgemgovukenvironmental-programmesfitfit-tariff-rates)13 An example can be found in Brooklyn New York (httpswwwbrooklynenergy)14 An example can be found in California (httpswwwohmconnectcomabout-usnewsresi-station)15 The absolute time taken to get from departing point to destination point16 G20 Infrastructure Working Group (2020)17 Sarker et al (2020) Gijzen (2013)18 Our World in Data19 EPA accessed on 0203202120 Global Alliance for Buildings and Construction International Energy Agency and the United Nations Environment
ww
ww
orld
com
mer
cere
view
com
Programme (2019)21 Our World in Data Saevarsdottir et al (2020) and UN Environment and International Energy Agency (2017)22 Emerging markets and developing countries according to the IMFrsquos country classification income groups according to the World Bank23 Approximatively one out of six IT projects faces cost overruns over 200 (Flyvbjerg and Budzier 2011)24 For a discussion of this and an analysis by sector for Germany see Anzinger and Kostka (2016)25 Olken (2007)26 Williams (2017) finds that project non-completion is the outcome of a dynamically inconsistent collective choice process among political actors facing commitment problems in contexts of limited resources Rasul and Roggerson (2018) find that the management style of local public offices plays a role with higher autonomy of contributing to project-completion27 For an overview over causes and determinants of project performance see Aljohani et al (2017) Fiedler and Schuster (2016) and Pinheiro Catalatildeo et al (2019)
ReferencesAldieri L Grafstrom J Sundstrom K and Paolo Vinci C 2020 ldquoWind Power and Job Creationrdquo Sustainability 12(1) 45Alexander J Nassiry D Barnard S Lindfield M Teipelke R Wilder M 2019 ldquoFinancing the sustainable urban future Scoping a green cities development bankrdquo ODI Working Paper 552 Overseas Development InstituteAljohani A Ahiaga-Dagbui D amp Moore D 2017 ldquoConstruction projects cost overrun What does the literature tell usrdquo International Journal of Innovation Management and Technology 8(2) 137Allahaim FS amp Liu L 2015 ldquoCauses of cost overruns on infrastructure projects in Saudi Arabiardquo International Journal of Collaborative Enterprise 5(1-2) 32-57
ww
ww
orld
com
mer
cere
view
com
Alston P 2018 ldquoReport of the Special Rapporteur on Extreme Poverty and Human Rights on his mission to the United States of Americardquo Report of the Special Procedure of the Human Rights Council GenevaAnsar A Flyvbjerg B Budzier A amp Lunn D 2014 ldquoShould we build more large dams The actual costs of hydropower megaproject developmentrdquo Energy policy 69 43-56Baloyi L amp Bekker M 2011 ldquoCauses of construction cost and time overruns The 2010 FIFA World Cup stadia in South Africardquo Acta Structilia 18(1) 51-67Bancalari A 2020 ldquoCan White Elephants Kill Unintended Consequences of Infrastructure Development in Perurdquo The Institute for Fiscal Studies Working Paper Volume 20 Issue 32Bataille C 2019 ldquoLow and zero emissions in the steel and cement industries Barriers technologies and policiesrdquo OECD Issue Paper Conference VersionBhattacharya A KP Gallagher M Muntildeoz Cabreacute M Jeong and X Ma 2019 ldquoAligning G20 Infrastructure Investment with Climate Goals and the 2030 Agendardquo Foundations 20 Platform a report to the G20Blyth W Gross R Speirs J Sorrell S Nicholls J Dorgan A and Hughes N 2014 ldquoLow-carbon jobs The evidence for net job creation from policy support for energy efficiency and renewable energyrdquo 2014 A report for UKERC by UKERC Technology amp Policy Assessment Function UK Energy Research CentreBouton S Newsome D and Woetzel J 2015 ldquoBuilding the cities of the future with green districtsrdquo McKinsey amp CompanyC40 Cities Finance Facility CDP and Global Covenant of Mayors 2018 ldquoThe demand for financing climate projects in citiesrdquoCalderon C and L Luis 2014 ldquoInfrastructure Growth and Inequality An Overviewrdquo Policy Research Working Paper No 7034 World BankCarter L and Boukerche S 2020 ldquoCatalyzing Private Sector Investment in Climate-Smart Citiesrdquo Invest4Climate Knowledge Series Washington DC World BankCCFLA (2015) State of City Climate Finance 2015 Cities Climate Finance Leadership Alliance (CCFLA) New YorkCoalition for Urban Transitions 2019 ldquoClimate Emergency Urban Opportunityrdquo September 2019
ww
ww
orld
com
mer
cere
view
com
CRED and UNDRR 2020 ldquoHuman cost of disasters an overview over the past twenty years (2000- 2019)rdquoCreedy GD Skitmore M amp Wong JK 2010 ldquoEvaluation of risk factors leading to cost overrun in delivery of highway construction projectsrdquo Journal of construction engineering and management 136(5) 528-537Doloi H Sawhney A Iyer KC amp Rentala S 2012 ldquoAnalysing factors affecting delays in Indian construction projectsrdquo International journal of project management 30(4) 479-489Durdyev S Ismail S amp Bakar NA 2012 ldquoFactors causing cost overruns in construction of residential projects case study of Turkeyrdquo International Journal of Science and Management 1(1) 3-12EPA (United States Environmental Protection Agency) ldquoNational Overview Facts and Figures on Materials Wastes and RecyclingrdquoEuropean Commission 2021 ldquoThe EUrsquos 2021-2027 long-term budget amp NextGenerationEU - Facts and figuresrdquoFiedler J and Schuster S 2016 ldquoThe Elbphilharmonie Hamburgrdquo in Kostka G and J Fiedler (Eds) Large infrastructure projects in Germany Between Ambitions and Reality Palgrave MacmillanFinan F and M Mazzocco 2016 ldquoElectoral Incentives and the Allocation of Public Fundsrdquo NBER Working Paper No 21859Flyvbjerg B 2014 ldquoWhat you should know about megaprojects and why An overviewrdquo Project management journal 45(2) 6-19Flyvbjerg B and Budzier A 2011 lsquoWhy your IT project may be riskier than you thinkrdquo Harvard Business ReviewFlyvbjerg B Bruzelius N amp Rothengatter W 2003 ldquoMegaprojects and risk An anatomy of ambitionrdquo Cambridge University PressFragkos P and Paroussos 2018 ldquoEmployment created in EU related to renewables expansionrdquo Applied Energy Volume 230 pages 935-945G20 2010 ldquoSeoul G20 Summit Final Declaration 2010rdquo November 11ndash12 2010G20 2011 ldquoCannes G20 Summit Final Declaration 2011rdquo November 3ndash4 2011G20 2013 ldquoSt Petersburg G20 Leadersrsquo Declaration 2013rdquo September 6 2013G20 2014 ldquoBrisbane G20 Summit Declarationrdquo November 15-16 2014
ww
ww
orld
com
mer
cere
view
com
G20 2015 ldquoAntalya G20 Leadersrsquo Communiqueacuterdquo November 15ndash16 2015G20 2016a ldquoG20 Leadersrsquo Communiqueacute Hangzhou Summitrdquo September 5 2016G20 2016b ldquoMDBs Joint Declaration 2016rdquoG20 2018 ldquoG20 2018 Leadersrsquo Declarationrdquo November 30 ndash December 1 2018G20 2019 ldquoG20 Principles for Quality Infrastructure InvestmentrdquoG20 2020a ldquoLeadersrsquo Declarationrdquo G20 Riyadh Summit November 21-22 2020G20 2020b ldquoCommuniqueacute G20 Finance Ministers and Central Bank Governors Meetingrdquo April 15 2020G20 2020c ldquoG20 Riyadh InfraTech AgendardquoGenccedilsuuml I Whitley S Roberts Leo Beaton C Chen H Doukas A Geddes A Gerasimchuk I Sanchez L amp Suharsono A 2019 lsquoG20 coal subsidies Tracking government support to a fading industryrsquo ODI Report June 2019Gijzen H 2013 ldquoBig data for a sustainable futurerdquo Nature Volume 502 Issue 38Global Alliance for Buildings and Construction International Energy Agency and the United Nations Environment Programme 2019 lsquo2019 global status report for buildings and construction Towards a zero-emission efficient and resilient buildings and construction sectorrsquoGrimm M and S Boukerche 2020 ldquoEngaging Institutional Investment in Climate-Smart Infrastructurerdquo Invest4Climate Knowledge Series World BankHallegatte S M Bangalore L Bonzanigo M Fay T Kane U Narloch J Rozenberg D Treguer and A Vogt-Schilb 2016 ldquoShock Waves Managing the Impacts of Climate Change on Povertyrdquo Climate Change and Development World BankHan SH Yun S Kim H Kwak YH Park HK and SH Lee 2009 ldquoAnalyzing Schedule Delay of Mega Project Lessons Learned From Korea Train Expressrdquo IEEE Transactions on Engineering Management 56(2) pp 243-256Hepburn C OrsquoCallaghan B Stern N Stiglitz J and Zenghelis D 2020 ldquoWill COVID-19 fiscal recovery packages accelerate or retard progress on climate changerdquo Oxford Review of Economic Policy Volume 36 Issue Supplement_1 pages S359-S381
ww
ww
orld
com
mer
cere
view
com
Huo T Ren H Cai W Shen GQ Liu B Zhu M amp Wu H 2018 ldquoMeasurement and dependence analysis of cost overruns in megatransport infrastructure projects Case study in Hong Kongrdquo Journal of construction engineering and management 144(3) 05018001IEA 2019 lsquoGlobal Energy amp CO2 Status Report 2019rsquo March 2019IEA 2020a ldquoWorld Energy Investment Flagship Reportrdquo May 2020IEA 2020b ldquoIron and Steel Technology Roadmaprdquo Energy Technology Perspectives October 2020IMF 2019 ldquoFiscal Policies for Paris Climate Strategies - from Principle to Practicerdquo IMF Policy Paper May 2019IMF 2020a ldquoWorld Economic Outlook A Long and Difficult Ascentrdquo Washington DC October 2020 IMF 2020b ldquoFiscal Monitor Policies for the Recoveryrdquo Washington October 2020IMF 2021 lsquoWorld Economic Outlook Updatersquo Washington January 2021International Institute for Sustainable Development (IISD) 2020a ldquoEnergy Policy TrackerrdquoInternational Institute for Sustainable Development (IISD) 2020b ldquoDoubling Back and Doubling Down G20 scorecard on fossil fuel fundingrdquo Published by the International Institute for Sustainable DevelopmentIvanyna M and A Shah 2012 ldquoHow Close Is Your Government to Its People Worldwide Indicators in Localization and Decentralizationrdquo World Bank Policy Research Working Paper 6138 World BankKaming PF Olomolaiye PO Holt GD amp Harris FC 1997 ldquoFactors influencing construction time and cost overruns on high-rise projects in Indonesiardquo Construction Management amp Economics 15(1) 83-94Kennedy C Ibrahim N and Hoornweg D 2014 ldquoLow-carbon infrastructure strategies for citiesrdquo Nature Climate Change 4 343-346Lawrence M R Bullock and Z Liu 2019 ldquoChinarsquos High-Speed Rail Developmentrdquo International Bank for Reconstruction and DevelopmentThe World BankLazard (2020) lsquoLazardrsquos Levelized Cost of Energy Analysis ndash Version 140rsquo October 2020Lee J-K (2008) Cost overrun and cause in Korean social overhead capital projects roads rails airports and ports Journal of urban planning and development 134 59ndash62
ww
ww
orld
com
mer
cere
view
com
Merk O Saussier S Staropoli C Slack E and Kim J-H 2012) Financing Green Urban Infrastructure OECD Regional Development Working Papers 201210 OECD PublishingMerrow EW McDonnell LM and RY Arguden 1988 ldquoUnderstanding the Outcomes of Megaprojects A Quantitative Analysis of Very Large Civilian Projectsrdquo Rand Corporation Meyer I and M Sommer 2016 ldquoEmployment effects of renewable energy deployment ndash a reviewrdquo International Journal of Sustainable Development 19(3)217Mohieldin M N Subramaniam and J Verbeek 2018 ldquoMultilateral Development Banks must mobilize private finance to achieve the SDGsrdquo Brookings Munir W and KP Gallagher 2018 ldquoScaling Up Lending at the Multilateral Development Banks Benefits and Costs of Expanding and Optimizing MDB Balance Sheetsrdquo Global Economic Governance Initiative Working Paper No013 Global Development Policy CenterNASA 2021 2020 Tied for Warmest Year on Record NASA Analysis Showsrdquo January 2021New Climate Economy 2016 ldquoThe Sustainable Infrastructure Imperative Financing for better growth and developmentrdquo New Climate EconomyOECD 2017 Investing in Climate Investing in Growth OECD Publishing ParisOECD 2018 ldquoFinancing water Investing in sustainable growthrdquo Policy Perspectives OECD Environment Policy Paper No 11Olken B 2007 ldquoMonitoring Corruption Evidence from a Field Experiment in Indonesiardquo Journal of Political Economy Volume 115 Issue 2 200-249Our World in Data available at httpsourworldindataorgco2-emissions and httpsourworldindataorgemissions-by-sectorPickrell DH 1990 ldquoUrban Rail Transit Projects Forecast Versus Actual Ridership and Costrdquo Department of Transportation Washington DC p 164
ww
ww
orld
com
mer
cere
view
com
Pickrell DH 1992 ldquoA desire named streetcar fantasy and fact in rail transit planningrdquo Journal of the American Planning Association 58(2) pp 158-176Pinheiro Catalatildeo F Cruz CO amp Miranda Sarmento J 2019 ldquoExogenous determinants of cost deviations and overruns in local infrastructure projectsrdquo Construction Management and Economics 37(12) 697-711Ram M Aghahosseini A and Breyer C 2020 ldquoJob creation during the global energy transition towards 100 renewable power system by 2050rdquo Technological Forecasting and Social Change Volume 151 119682Rasul I and D Rogger 2018 ldquoManagement of Bureaucrats and Public Service Delivery Evidence from the Nigerian Civil Servicerdquo The Economic Journal Volume 128 Issue 608 413ndash46Rozenberg J and M Fay 2019 ldquoBeyond the Gap How Countries Can Afford the Infrastructure They Need while Protecting the Planetrdquo Sustainable Infrastructure World Bank Washington DCSaevarsdottir G Kvande H and Welch B 2019 ldquoAluminum Production in the Times of Climate Change The Global Challenge to Reduce the Carbon Footprint and Prevent Carbon Leakagerdquo JOM the journal of the Minerals Metals amp Materials Society 72(1)Saevarsdottir G Kvande H amp Welch B 2020 ldquoAluminium Production in the Times of Climate Change The Global Challenge to Reduce the Carbon Footprint and Prevent Carbon Leakagerdquo JOM the Journal of the Minerals Metals amp Materials Society 72(1)Sarker MNI Y Peng C Yiran and RC Shouse 2020 ldquoDisaster resilience through big data Way to environmental sustainabilityrdquo International Journal of Disaster Risk Reduction Volume 51 Issue 101769Satterthwaite (2020) The worldrsquos fastest growing cities iied blogSingh R 2009 ldquoDelays and Cost Overruns in Infrastructure Projects An Enquiry into Extents causes and Remediesrdquo Working Paper No 181 Delhi School of EconomicsSovacool BK Gilbert A amp Nugent D 2014 ldquoAn international comparative assessment of construction cost overruns for electricity infrastructurerdquo Energy Research amp Social Science 3 152- 160
ww
ww
orld
com
mer
cere
view
com
Stotsky J and M Ghazanchyan 2013 ldquoDrivers of Growth Evidence from Sub-Saharan Africardquo IMF Working Paper No 13236 International Monetary FundTruman EM 2020 ldquoThe G20 missed an opportunity to expand financial resources for vulnerable countriesrdquo PIIE Realtime Economic Issues Watch April 2020UCCRN 2018 ldquoThe Future We Donrsquot Want How Climate Change Could Impact the Worldrsquos Greatest Citiesrdquo February 2018 UCCRN Technical ReportUN Environment and International Energy Agency 2017 ldquoTowards a zero-emission efficient and resilient buildings and construction sectorrdquo Global Status Report 2017UN Habitat 2011 lsquoGlobal Report on Human Settlements 2011 Cities and Climate Changersquo United Nations Human Settlements ProgrammeUN SDG Indicator database UNCTAD 2017 ldquoWorld Investment Report Investment and the Digital Economyrdquo United NationsPublication GenevaUNCTAD 2018 ldquoTrade and Development Report 2018 Power Platforms and Free Trade DelusionrdquoUNCTAD 2020 ldquoWorld Investment Report 2020 International Production Beyond the PandemicrdquoUnited Nations Publication UNCTADWIR2020United Nations Department of Economic and Social Affairs Population Division (2019b) World Urbanization Prospects The 2018 Revision New York United NationsUnited Nations Department of Economic and Social Affairs Population Division (2019a) World Population Prospects 2019 HighlightsUnited Nations 2017 ldquoWastewater The Untapped Resourcerdquo The United Nations World Water Development Report FranceVan de Walle D M Ravallion V Mendiratta and G Koolwal 2013 ldquoLong-Term Impacts of Household Electrification in Rural Indiardquo Policy Research Working Paper No 6527 World Bank
ww
ww
orld
com
mer
cere
view
com
Vivid Economics 2020 ldquoGreenness of Stimulus Indexrdquo Vivid Economics October 2020White House 2021 ldquoParis Climate Agreementrdquo Press Release January 20 2021Williams MJ 2017 ldquoThe Political Economy of Unfinished Development Projects Corruption Clientelism or Collective Choicerdquo American Political Science Review Volume 111 Issue 4 705ndash723World Bank 2018 ldquoCity Creditworthiness Initiative A Partnership to Deliver Municipal Financerdquo World Bank BriefWorld Bank 2020 ldquoCOVID-19 to Add as Many as 150 Million Extreme Poor by 2021rdquo Press Release October 7 2020World Health Organisation (WHO) and the United Nations Childrenrsquos Fund (UNICEF) 2017 ldquoProgress on drinking water sanitation and hygiene 2017 update and SDG baselinesrdquo Geneva World Health Organization
We owe our gratitude to Suman Bery Nicola Bilotta Maria Demertzis Alberto Franco Pozzolo Simone Tagliapietra Guntram Wolff and Georg Zachmann for their input and comments as well as Alma Kurtovic for her excellent management of this project We would also like to thank the Italian Ministry of Finance and Economics and the members of the G20 Infrastructure Working Group for their valuable feedback to our research This paper was prepared for the a meeting of G20 Finance Ministers and Central Bank Governors (FMCBG) on 9 and 10 July 2021 and was published on Bruegel

ww
ww
orld
com
mer
cere
view
com
If countries fail to address the climate crisis another estimated 100 million people will fall into poverty by 2030 (Hallegatte et al 2016) This rapidly urbanising world needs to adapt its infrastructures to reduce the effects of climate change and to deliver prosperity for its citizens G20 leadership is vital for this
The G20 economies are responsible for 79 of global CO2 emissions (see Figure 1) The three largest economies alone ndash China the US and the EU ndash account for over half of global emissions2 The decarbonisation of the G20 economies is thus critical for reaching the goals of the Paris Climate Agreement
In the Leadersrsquo Declaration from the 2020 G20 Riyadh Summit all G20 countries with the exception of the United States reaffirmed their commitment to the full implementation of the Agreement and US President Biden signed an executive action to re-join the Paris Climate Agreement on his first day in office (G20 2020a sect33 White House 2021) Hence there is now a broad agreement within the G20 about the urgency of addressing climate change
In this report we look at how the G20 can address one major part of the puzzle local infrastructure Approximately 70 of global GHG emissions come from the construction development and operation of infrastructure in the energy buildings and transport sectors
Therefore it is critical that infrastructure investment strategies are underpinned by sustainability considerations ldquoMaximizing the positive impact of infrastructure to achieve sustainable growth and developmentrdquo is indeed the first of the G20 Principles for Quality Infrastructure developed at the 2019 Finance Ministersrsquo and Central Bank Governorsrsquo Meeting in Fukuoka (G20 2019)
Green infrastructure can reduce local air pollution and GHG emissions support climate-change adaptation and contribute to the efficient use of resources (Bhattacharya et al 2019) Local infrastructure plays a particularly
ww
ww
orld
com
mer
cere
view
com
Figure 1 Annual CO2 Emissions by Region
Source Bruegel representation of Our World in Data for emissions in 2018
000204060810
0 20 40 60 80 100
Non G20
Remaining G20
United States
Russia
Japan
India
EU-28
China
28 9 7 3 5 15 12 21
ww
ww
orld
com
mer
cere
view
com
important role in the context of estimates that suggest urban areas are responsible for up to 70 of consumption-based GHG emissions (UN Habitat 2011)
Building on the G20 Principles for Quality Infrastructure this report investigates the role that different aspects of local infrastructure could play in the decarbonisation of the G20 economies and develops proposals for a local green infrastructure strategy for the G20
We take into account the global recession caused by the COVID-19 pandemic and our policy recommendations are intended to inform the recovery investment the G20 Finance Ministers and Central Bank Governors committed to in the G20 Action Plan ndash Supporting the Global Economy Through the COVID-19 Pandemic (G20 2020b Annex I)
Local authorities build and maintain a large share of infrastructure for the purpose of serving local communities Local public transport networks electricity and energy supply and water and waste management account for a large share of total infrastructure spending
Increasing the quality of local infrastructure is key to meeting the Sustainable Development Goals in poor communities within the G20 while deteriorating infrastructure that is not well suited to the needs of the modern economy is an impediment to economic growth in industrialised regions
In light of this challenge our analysis applies a comprehensive approach to the sustainability of infrastructure following the life-cycle principle regarding environmental costs in the G20 Principles for Quality Infrastructure (principle 31)
ww
ww
orld
com
mer
cere
view
com
Infrastructure affects the carbon footprint of an economy at all three stages of its life cycle the environmental impacts of the construction of the infrastructure the emissions generated through its use and the long-term negative environmental effect of the decommissioning of infrastructure
Additionally infrastructure has major secondary effects through the type of use it encourages and what existing infrastructure it replaces and complements Policies aimed at improving the greenness of local infrastructure projects should consider all four aspects
The G20 can play an important role by creating standards and best practices for the assessment of life-cycle costs
The financing of local infrastructure varies between G20 members and between projects Local communities have the best understanding of their infrastructure needs but often lack the financial capacity and experience in developing new projects
Sustainable infrastructure should meet local requirements whilst being financially sustainable Our recommendations for the G20 local infrastructure strategy will therefore focus on areas where global cooperation between the G20 countries can improve the policy outcomes This is done with the aim of increasing the efficiency of public infrastructure spending
High quality public infrastructure is fundamental for long-term economic growth and productivity (Calderon and Serven 2014) Under the right conditions it can boost industrialisation and competitiveness reduce the costs of connecting people with markets and improve living conditions while creating job opportunities
ww
ww
orld
com
mer
cere
view
com
These positive economic effects are especially important given the need for economic stimulus created by the COVID-19 pandemic which we discuss in the next section
11 The COVID-19 crisis and the G20rsquos responsebull Large fiscal stimulus was enacted by developed economies to address the economic fallout of COVID-19 but
developing countries had much less fiscal space to support their economiesbull Much of the initial stimulus was aimed at preserving existing industries and as a result had a net negative
effect on the environmentbull In the recovery phase fiscal stimulus should be used to address climate change through ecologically
sustainable investments
The case for a strong investment agenda has become more urgent by the need to address the economic shock caused by COVID-19 The pandemic led to the largest contraction of the world economy since the Second World War The IMF (2021) estimates that global GDP declined by 35 in 2020 more than during the Great Financial Crisis in 20082009
While the crisis has been unprecedented so has been the response The G20rsquos reaction to the crisis was carved out in its April virtual meeting of Finance Ministers and Central Bank Governors where the G20 Action Plan ndash Supporting the Global Economy Through the COVID-19 Pandemic was agreed
In this document the G20 endorsed the importance of economic policy support to businesses and workers and recognised the need to support developing economies through the crisis In particular in developed economies there has been massive fiscal support for employees and businesses affected by the economic downturn
ww
ww
orld
com
mer
cere
view
com
According to the IMF (2020b) as of September 2020 fiscal support to businesses and workers in developed economies amounts to around 20 of GDP This has significantly reduced the impact of the crisis on the economy
However there is a substantial gap between high- middle- and low-income countries For developing economies and emerging markets fiscal space is far more limited and as a result the size of government stimulus packages in developing countries and emerging markets have been far smaller
In emerging markets fiscal support amounted to approximately 55 and in low-income countries the fiscal stimulus amounted to 18 of GDP As the effect of the economic crisis is more severe in emerging markets and developing countries without significant social safety nets this development is very worrisome
The IMF warns ldquoThe pandemic will reverse the progress made since the 1990s in reducing global poverty and will increase inequalityrdquo (IMF 2020 page XV)
So far the most important G20 initiative to address this problem came in the form of debt relief In April 2020 G20 Finance Ministers and the World Bankrsquos Development Committee endorsed the DSSI (agreed by the Paris Club) which grants debt service suspension on bilateral loans owed by 73 of the worldrsquos poorest countries in order to enable an effective crisis response The initiative has been extended by one year until December 2021 with repayments spread over six years thereafter
However there has only been limited financial support granted to developing economies through international financial institutions and more financial support is needed3 There should be a strong role for multinational development banks to support developing countries in the G20rsquos recovery infrastructure agenda
ww
ww
orld
com
mer
cere
view
com
Figure 2 Overview of G20 Fiscal Stimulus as percent of GDP
Source Discretionary fiscal response as of September 11 2020 IMF (2020b)
45
40
35
30
25
20
15
10
5
0
Additional spending and foregone revenue
Equity loans and guarantees
US
Chin
a
Japa
n
Ger
man
y
Indi
a
UK
Fran
ce
Italy
Braz
il
Cana
da
Sout
h Ko
rea
Russ
ia
Aust
ria
Mex
ico
Indo
nesi
a
Saud
i Ara
bia
Turk
ey
Arg
entin
a
Sout
h A
fric
a
Adv
Eco
Em amp
Dev
Low
-inco
me
ww
ww
orld
com
mer
cere
view
com
The immediate response to the economic crisis caused by COVID-19 was for governments to protect jobs and existing economic structures and initially little attention was devoted to sustainability issues
As a result the economic stimulus measures announced by G20 members in response to COVID-19 mostly had a net negative effect on the environment (Vivid Economics 2020) After the immediate economic shock was contained and governments began to consider the long-term structural growth effect of the stimulus investments have tended to became more environmentally sustainable (Vivid Economics 2020)
This becomes particularly clear when considering spending on energy-related investments since COVID-19 Around 73 of global GHG emissions are energy-related and the majority of sustainably relevant economic stimulus is energy-related4
IISD (2020a) provides a breakdown of spending on energy sectors in the recovery packages in the G20 is shown in Figure 3 Governments in G20 countries have committed at least US$ 485 billion to energy investments In total US$242 billion have flown to support fossil fuel energy while only US$187 billion have flown to clean energy
Most worryingly over US$200 billion has been unconditional support for fossil fuel energy
Table 1 provides an overview of some of the largest energy-related investments that G20 countries have made between March 2020 and February 2021 Analysis of the complete list of energy-related investments shows that bailouts of aviation companies have been commonplace (IISD 2020a) A focus on energy efficiency is noted as well as general investments into the power sector and support for railways
ww
ww
orld
com
mer
cere
view
com
Figure 3 G20 Public Commitments to Energy Stimulus Fossil Fuel Clean and other
Source IISD (2020a) accessed on 050220215
Other energy
Clean conditional
Clean unconditional
Fossil conditional
Fossil unconditional
42
810
29
11
ww
ww
orld
com
mer
cere
view
com
Moving forward there should be a considerable shift towards sustainable long-term investments in the stimulus and recovery packages A positive example of such ambitions is the Next Generation EU recovery fund
The Next Generation EU (euro750 million) package comprises euro390 billion in grants and euro360 billion in loans to support member states Of this 30 is committed to lsquofighting climate changersquo (European Commission 2021)
Under the auspices of the Green Deal a variety of strategies are being put forward from hydrogen to biodiversity to agricultural which provide guidelines for how this lsquogreenrsquo money is to be spent
Policy Value committed(USD billions) Country
Aviation industry bailout 58 billion USA
Road building and repair 35 billion UK
Fund for carbon-neutral technology development 19 billion Japan
National railway deployment 14 billion China
Electricity price subsidies 13 billion Germany
Liquidity boost for power distribution companies 12 billion India
Table 1 Recent major energy-related investments in the G20
Source IISD (2020a) accessed on 05022021
ww
ww
orld
com
mer
cere
view
com
As fiscal support shifts from emergency liquidity relief towards more structural fiscal stimulus ambitious global investment programmes should be pursued and they must be sustainable As IMF (2020b chapter 2) argues investment in the recovery phase will play an important role in ensuring that global economic growth recovers
The case for green infrastructure investment is furthered by survey-based estimates of fiscal multipliers by Hepburn et al (2020)6 The study provides estimates associated with different kinds of economic recovery policies in the context of the COVID-19 crisis Airline bailouts chosen by many G20 countries are associated with a very low multiplier by respondents Meanwhile clean connectivity infrastructure has a larger multiplier than traditional transport infrastructure
While research on the employment effects of green infrastructure spending is still inconclusive most studies point to a neutral or positive effect Most of the available literature finds that investing in low-carbon infrastructure is unlikely to lead to lower levels of job creation than investing in fossil fuel infrastructure (Blyth et al 2014)
Moreover by tailoring policies to country-specific characteristics it appears likely that renewable energy projects can lead to a net increase in employment Meyer and Sommer (2014) and Fragkos and Paroussos (2018) both find larger domestic job creation when compared to fossil fuels7
As with all infrastructure projects job creation will be particularly large while economies are still experiencing output gaps in the wake of the COVID-19 economic crisis
2 Scale of the challenge infrastructure gapbull Even before the pandemic a large sustainable infrastructure gap persisted To reach sustainability goals
annual infrastructure spending in the scale of US$7 to 8 trillion is needed a gap of 21 of GDP
ww
ww
orld
com
mer
cere
view
com
Figure 4 COVID Recovery Policies Relative Fiscal Multipliers
Source Hepburn et al (2020)
10
5
0
-5
-10
-15
-20
Airl
ine
bailo
uts
Educ
atio
n ca
pita
l inv
estm
ent
Hea
lthca
re c
apita
l inv
estm
ent
Rura
l sup
port
pol
icie
s
Trad
ition
al tr
ansp
ort i
nfr
Proj
ect-
base
d lo
cal i
nfr
gran
ts
Clea
n co
nnec
tivity
infr
Clea
n en
ergy
infr
inve
stm
ent
Build
ing
upgr
ades
Gre
en s
pace
s an
d na
tura
l inf
r
ww
ww
orld
com
mer
cere
view
com
bull Local infrastructure in urban areas accounts for 70 of the green infrastructure needed by 2030bull Green infrastructure investment is expected to have a positive fiscal multiplier especially in the recovery
phase after the pandemic has come under control
Global infrastructure needs are rising In order to meet increasing demand from a growing population accelerating urbanization and technological progress the world will need to invest more than $90 trillion in infrastructure between 2016 and 20308
This is more than the entire existing global infrastructure stock (New Climate Economy 2016) Bhattacharya et al (2019) estimates that 70 of the infrastructure required by 2050 is yet to be built This lsquoinfrastructure gaprsquo is particularly acute in urban areas
CCFLA (2015) estimates that 70 of the green infrastructure needed by 2030 is to be built in urban areas Only half of the $45 to $54 trillion annual investment need for low-carbon urban development is currently met (CCFLA 2015)
Many cities in emerging markets and developing countries lack basic water and waste management reliable transport infrastructure and access to electricity and heating This includes many citizens of the G20 member states themselves and even in the richest G20 members some poor communities lack access to clean water and public sewerage (Alston 2018)
Importantly the type of infrastructure investments that are undertaken in the next few years will lock in technologies for decades to come Decisions taken now are critical to ensure the world is on path towards a low-carbon and climate resilient future
ww
ww
orld
com
mer
cere
view
com
Infrastructure investment in high- and middle-income regions will need to focus on upgrading and greening existing systems Low-income economies need to create new infrastructure networks that are sustainable and adaptable to climate economic and demographic changes while at the same time providing much needed access to basic services for their citizens
There is the opportunity for them to leap-frog the networks built around carbon-intensive energy production in developed economies Priority should therefore be given to improving local infrastructure with low-emission technology
Global annual investment into core infrastructure needed to fulfil expected demand by 2030 is estimated to lie between $63 and $68 trillion annually (Bhattacharya et al 2019 OECD 2017) Core infrastructure includes power generation and distribution transport water and sanitation systems and telecommunications
The additional costs of aligning these investments with the Paris goal of limiting global warming to well below 2degC are estimated to lie between $06 trillion and $11 trillion (see Table 2) These additional costs are likely to be offset by reduced expenses for fossil fuels as well as lower lifecycle costs of sustainable infrastructure in general (OECD 2017)
Most of the investment is needed for energy and transport infrastructure ndash according to Bhattacharya (2019) US$39 trillion and US$2 trillion respectively Compared to the business-as-usual-scenario sustainable infrastructure investment will have to shift away from primary energy sources such as oil gas and coal and towards energy efficiency and low-carbon core infrastructure9 (NCE 2016)
ww
ww
orld
com
mer
cere
view
com
Currently sustainable infrastructure investments are falling short of the target by US$32 trillion per year or 21 of global GDP (Bhattacharya et al 2019) Local infrastructure will play a key role in this shift as we will discuss in the next chapter
3 Sustainable local infrastructureThe roll-out of low-carbon infrastructure within cities must be at the core of any sustainable development strategy G20 countries should avoid building new infrastructure that will become obsolete due to its incompatibility with
Table 2 Annual Infrastructure Investment Gap
Source Bruegel replication of table 1 from Bhattacharya et al (2019)
OECD Bhattacharya
Energy 27 39
Transport 27 20
Water and sanitation 09 09
Telecoms 06 10
Total 69 79
2015 USD trillion
ww
ww
orld
com
mer
cere
view
com
Existing foundations for future measures history of Infrastructure on the G20 agenda
The Italian G20 Presidencyrsquos focus on local sustainable infrastructure continues a decade-long history of infrastructure on the G20rsquos agenda Future action can build on the foundation of previous initiatives and principles and leverage existing capacities
Infrastructure first appeared on the G20rsquos agenda during the 2010 Korean Presidency when the G20 formally recognised the importance of infrastructure for economic growth (G20 2010) and outlined concrete measures in a Multi-Year Action plan aimed to address bottlenecks in infrastructure provision in low-income countries
Furthermore the G20 created a High-Level panel on Infrastructure to mobilise support for scaling up infrastructure financing and tasked MDBs with developing an action plan to increase infrastructure financing and improve project implementation
The panelrsquos report and the MDBsrsquo action plan were presented and endorsed by the G20 at the 2011 Cannes summit (G20 2011) Recommendations included creating an enabling investment environment in low-income countries through legal and regulatory reforms promoting capacities for bankable projects mitigating risks to increase the availability of long-term funding and expanding the role of MDBs in infrastructure financing Further measures along these recommendations were concluded at the 2012 Summit in Los Cabos under the Mexican Presidency
The 2013 Russia Presidency focused on the role of long-term financing in infrastructure development and took action to attract such investment in the G20 The St Petersburg Summit endorsed the working plan prepared
ww
ww
orld
com
mer
cere
view
com
by the G20 Study Group on Financing for Investment and the G20OECD High-Level Principles of Long-Term Investment Financing by Institutional Investors (G20 2013) and agreed on the implementation of a set of collective and country-specific actions
During the Australian Presidency in 2014 infrastructure became a G20 priority through the endorsement of the Global Infrastructure Initiative (GII) a multi-year programme to promote quality public and private infrastructure investment
The Group identified guidelines to identify prioritise plan and deliver infrastructure projects and established the Global Infrastructure Hub (GIH) a non-profit organization to support he G20 in the implementation of the GII and future infrastructure programmes
As part of this initiative the World Bank launched the Global Infrastructure Facility (GIF) a global platform that supports the identification high-quality preparation financial structuring and procurement of infrastructure projects in emerging markets and developing economies to enable private investment
The private sector was identified as a main stakeholder in mobilising investment in infrastructure (G20 2014) Private sector involvement remained the focus of the G20rsquos infrastructure strategy in 2015 The 2015 Antalya Summit developed guidelines and best practices for public-private-partnership (PPP) models as well as country-specific investment strategies to improve the investment ecosystem and foster long-term infrastructure investment
ww
ww
orld
com
mer
cere
view
com
The G20 further worked on toolkits to support countries better prepare prioritise and finance infrastructure projects (G20 2015)
During the Chinese Presidency in 2016 emphasis is placed on quality infrastructure investment and the role of MDBs within the infrastructure agenda Quality infrastructure investment aims to ensure economic efficiency in view of life-cycle cost safety resilience against natural disaster job creation capacity building and transfer of expertise and know-how on mutually agreed terms and conditions while addressing social and environmental impacts and aligning with economic and development strategies (G20 2016a)
The 2016 Hangzhou Summit encouraged the MDBs to scale up infrastructure investment attract private finance and strengthen project pipelines through better project preparation (G20 2016b)
Finally the G20 recognised the importance of infrastructure connectivity meaning the linkages of communities economies and nations through transport communications energy and water networks for achieving sustainable development and shared prosperity
To this end it endorsed the Global Infrastructure Connectivity Alliance (GICA) which aims to enhance the synergy and cooperation among various infrastructure connectivity programs in a holistic way
The 2018 Buenos Aires Summit once again focused on infrastructure for development and members reaffirmed their commitment to attract more private capital to fill the infrastructure investment gap (G20 2018)
ww
ww
orld
com
mer
cere
view
com
To achieve this the G20 endorsed the Roadmap to Infrastructure as an Asset Class and the G20 Principles for the Infrastructure Project Preparation and committed to take actions towards greater contractual standardization reducing data gaps and improving risk mitigation instruments
At the 2019 Osaka Summit the G20 established the G20 Principles on Quality Infrastructure as a common strategic direction Building on the G7 Ise-Shima Principles of Quality Infrastructure quality infrastructure investment should aim to maximise the impact of infrastructure on sustainable growth and development raise economic efficiency in view of life-cycle cost integrate environmental and social considerations contribute to building resilience against natural disasters and other risks and strengthen infrastructure governance (G20 2019)
Finally under the Saudi Arabian Presidency the G20 endorsed the Riyadh InfraTech Agenda which provides policy guidance to governmentsrsquo and international organizationsrsquo infrastructure technology strategy Infrastructure technology refers to the integration of material machine and digital technologies across the infrastructure lifecycle including in the design planning delivery and in the structures themselves
The Agenda endorsed at the 2020 Riyadh Summit aims to harness technology to deliver quality infrastructure investment promote inclusive accessible sustainable and affordable infrastructure in view of lifecycle costs mobilise private-sector financing and support the development of infrastructure as an asset class (G20 2020c)
ww
ww
orld
com
mer
cere
view
com
future sustainability goals and needs (lsquostranded assetsrsquo) Without sensible and sustainable infrastructure investment climate targets will be unattainable
At the same time global temperatures are already 1 degree Celsius above pre-industrial times and certain effects of climate change are inevitable Infrastructure planning must therefore consider not only mitigation of further GHG emissions but also adaptation to a changing environment
At least 55 of the global population are already living in infrastructure-dense urban areas (cities) Therefore the roll-out of sustainable infrastructure both to mitigate emissions and to adapt to a changing climate will be highly relevant for local communities
Countries and cities across the G20 differ in their climate income urban form and levels of industrial activity There exists therefore a wide variation in the type of low-carbon infrastructure that different cities could use to reduce emissions (Kennedy et al 2014)
For example colder cities will focus on building construction and renovation for maintaining heat while warmer cities will focus on urban design to avoid retaining heat or reducing building exposure to heat in the first place This report therefore identifies some general themes for low-carbon infrastructure
In the following section we will focus on several areas of local infrastructure investment that are key for reaching these goals shifting to a zero-carbon electricity (power) sector energy-efficient buildings zero-emission mobility digital infrastructure water and waste management as well as low-carbon construction materials
ww
ww
orld
com
mer
cere
view
com
These areas are selected to cover those proposed for sustainable infrastructure by Bhattacharya et al (2019) as well as due to their high contribution to global GHG emissions Together the sectors under focus account for over 40 of global GHG emissions10
31 Electricity sectorbull Stopping the deployment of new coal-fired power plants should be a priority for infrastructure investment A
significant co-benefit will be improved local air qualitybull Renewable electricity generation can be deployed in a decentralised manner allowing for local production
storage and usage of electricity increasing benefits for local economies This leads to both economic and health benefits
bull G20 infrastructure investment strategies in the electricity sector should focus upon enabling investments which incentivise further private investment
311 Electricity generationSecuring a reliable supply of decarbonised electricity is a fundamental building block for all G20 economies to comply with the goals of the Paris Agreement GHG emissions from electricity (power) generation accounted for 38 of total energy-related emissions in 2018 (IEA 2019)
Moreover the decarbonisation of many different end use sectors that currently rely upon alternative fuels lies in electrification For example electrification is seen as key for the decarbonisation of both the road transport and household heating sectors
Over the past few yearsrsquo investment has been significantly larger in solar and wind power compared to coal or gas power showing that the global power market is already moving in the right direction ndash albeit at too slow a pace11
ww
ww
orld
com
mer
cere
view
com
As Figure 5 shows solar photovoltaic (PV) was the electricity sector technology with the largest annual investment in 2019 with around US$140 billion a year The investment into solar PV is in fact larger than gas and coal power combined
For projects with low- cost financing which use high quality resources solar PV is already today the cheapest electricity source in history (IEA 2020a) and these costs are forecasted to continue decreasing
In spite of the aggregate global shift toward solar PV global coal-fired power capacity is set to increase further as certain countries continue to expand their coal-based energy production A 2019 report shows that G20 economies still provide at least $48 billion per year to support coal-fired power generation (Genccedilsuuml et al 2019)
G20 economies must urgently phase out government support to coal-fired power generation both home and abroad Higher costs of financing further impede the deployment of renewable power plants which are capital intensive relative to their fossil fuel counterparts
Many of the areas where coal-fired power plants are still being constructed are in developing regions where access to low-cost finance for the deployment of renewable power can be challenging A priority for the G20 should be ensuring the access to cheap capital for the deployment of renewable power generation across the world
Replacing existing coal-fired power plants with low-carbon power generation is more difficult than not building them in the first place Once built vested interests incumbents political opportunism and incumbent employment all create difficulties to shut down a coal-fired power plant
ww
ww
orld
com
mer
cere
view
com
Figure 5 Global Investment in the Power Sector by Technology 2017-2020
Source Bruegel on IEA (2020a)
350
300
250
200
150
100
50
0Electricity networks
Coal power Gas power Nuclear Solar PV Wind Other renewables
Battery storage
2017 2018 2019 2020
ww
ww
orld
com
mer
cere
view
com
Economically an already built coal plant is also more competitive when compared with newly built low-carbon power While best avoiding new coal power plant deployment G20 countries invested into coal must also begin to plan for the equitable phaseout (lsquojust transitionrsquo) from coal power generation
312 Local and smarter electricity gridsThe shift from fossil fuel to renewable power generation holds a significant side-effect which is the shift toward democratisation of energy Over the past 15 years a variety of schemes in G20 countries particularly in Europe have incentivised consumers to purchase their own solar panels12
This helped created a worldwide market for household solar PV Households who invest in their own electricity generation can enjoy significant economic savings on energy bills
Community schemes which allow groups of households to invest together into small solar or wind plants have also grown in number Such schemes have the benefit of allowing many households within a community to come together and act as a larger economic agent investing into larger clean power plants and sharing the economic and energy benefits
The costs are also likely to be lower on average than single household PV (Lazard 2020) This distributed power generation has the important co-benefits of democratising energy empowering citizens to feel a part of the energy transition and potentially positive network spill over effects whereby neighbours adopt solar panels
Household- or community-level deployment of renewable electricity generation involves private investment into infrastructure which provides a public good namely the mitigation of GHG emissions and perhaps more
ww
ww
orld
com
mer
cere
view
com
importantly for a local community the mitigation of local air pollutants that are harmful to human health Schemes to encourage the growth of such private agent behaviour are attractive options
Local authorities might consider further subsidy schemes or feed-in tariffs to accelerate the adoption of household solar PV However this is an expensive (and regressive) policy and the price of solar PV has already been driven significantly down
A more sensible approach would involve the redesign of electricity markets to allow households to receive fair compensation for the electricity they provide to the grid An example of this would be the trade of electricity between households at a local level13 another example is mechanisms designed to encourage flexible household electricity demand depending on current market conditions14
Such a market mechanism if well-designed should incentivise private investment into local renewable power generation with the important co-benefit of creating a local shared community spirit of renewable energy
Moreover in many developing economies grid infrastructure has not yet been built to reach all of the population Here decentralised renewable electricity generation is an attractive option for providing much-needed electricity to households and communities in rural or other areas without main grid connections
313 Enabling infrastructure investmentIn addition to facilitating the shift in investment toward low-carbon power generation an equally important challenge for G20 countries lies in future-proofing the electricity grids of today Significant investments are required to upgrade grids for the challenges they will face These arise both on the supply and demand side
ww
ww
orld
com
mer
cere
view
com
On the supply side the challenge will be to successfully incorporate increasing shares of intermittent renewable electricity generation Grids have traditionally comprised a few central generation units which ramp production up and down to distribute power to multiple homogenous end users
The drop in the costs of solar PV has changed this dynamic It is now possible for households or firms to purchase solar panels place them on their roof and generate their own electricity
The electricity grid is being forced to adapt toward a situation in which power is being fed into the grid from an ever-growing number of sources with non-constant supply
On the demand side in countries that pursue electrification of non-traditionally electrically-powered sectors there will be additional strains placed on power grids
This is particularly relevant with the electrification of transport the charging of large fleets of electric vehicles will put substantial new loads on electricity grids
Sensible infrastructure projects should prepare electricity grids for this twin challenge Grids must be reinforced and strengthened in particular areas whilst the implementation of digital technologies will facilitate smarter grids which are better able to balance fluctuating supply and demand
The ability of demand response ie rapidly adjusting power demand to accommodate shifts in supply is one of the most commonly discussed options for integrating higher shares of renewables into power grids Rapid fluctuations in demand will only be possible with sophisticated digital infrastructure
ww
ww
orld
com
mer
cere
view
com
The roll-out of smart meters allowing for accurate monitoring of electricity demand on a minute-by-minute basis is an important precursor to a flexible demand-side Smart charging of electric vehicles altering demand to match supply is also an important overlap into mobility infrastructure
This may further include vehicle-to-grid technologies whereby plugged-in electric vehicles are able to supply electricity to the grid at times of high demand effectively acting as a large battery for managing grid fluctuations
Further incentives to develop solutions for the intermittency of renewables will be required A commonly discussed option is batteries Figure 5 shows that in comparison with traditional power generation investments into battery storage technology are still relatively small Batteries and similar technologies for accommodating renewable power generation will become increasingly imperative infrastructure investments over the coming years
Cities must evolve to become smarter producers and consumers of renewable electricity Doing so requires significant upfront infrastructure investments The size of infrastructure investments required in electricity grids is extremely large
G20 countries should therefore focus their strategy upon enabling investments which hold a high investment multiplier ndash their provision and expansion will attract private capital investment into other sections of the grid
32 Buildings and climate resiliencebull Buildings are an inherently local infrastructure responsible for significant GHG emissions While for many G20
countries the challenge lies in redesigning buildings to lower levels of GHG emissions developing countries are focussed on building new stock
bull For G20 countries energy efficiency infrastructure should be deployed which is able to reduce the energy
ww
ww
orld
com
mer
cere
view
com
Fossil fuel subsidies
Within G20 countries fossil fuel subsidies are a problem much broader than coal-fired power generation A failure to shift away from these subsidies undermines commitments to sustainability goals whether they be under infrastructure or not G20 leaders have recognised this fact and repeatedly pledged to remove fossil fuel support
However G20 governments provided $584 billion annually to the production and consumption of fossil fuels at home and abroad (2017-2019 average) (IISD 2020b) This is down 9 from 2014-2016 values On aggregate G20 countries have doubled down on support to fossil fuel industries in response to the COVID-19 pandemic
IISD (2020b) helpfully distinguish five different forms of government support for fossil fuels These include direct budget transfers (through spending on RampD fossil fuel exploration for example) tax expenditures (such as tax breaks) price support (artificially lowering the market price for fossil fuels) public finance (loans and guarantees) and state-owned enterprise investments
The breakdown of both type of mechanism as well as by fossil fuel related activity is shown in Figure The majority of support for fossil fuels came through price support and State-Owned Enterprises (SOEs) investments and most of it went to oil and gas production
While not all of these support measures would technically fall under the definition of a subsidy by the World Trade Agreement on Subsidies and Countervailing Measures agreement direct budget transfers price support and tax expenditures do
ww
ww
orld
com
mer
cere
view
com
Figure 6 Fossil Fuel Subsidies in the G20
Source IISD (2020b)
Under this definition around $280 billion annually is used by G20 economies to artificially support the competitiveness of fossil fuels Simply removing these economically inefficient subsidies would have significant environmental benefits as well as sending a powerful signal to markets
Other forms of subsidies such as SOEs may be more difficult to address but should still be high on the agenda for any G20 nation looking toward a sustainable infrastructure agenda Efforts by central government to remove inefficient subsidies will make it easier for local governments to pursue a sustainable infrastructure agenda
SOE investment
Price support
Tax expenditures
Public nance
Direct budget
Oil and gas
Fossil fuel use
Fossil fuel-base
Coal production
Tota
l gov
ernm
ent
supp
ort
USD
bill
ions
G20 government support bytype of mechanism
G20 government support byfossil fuel related activity
257 277
168
126
172
79
51
25
ww
ww
orld
com
mer
cere
view
com
consumption of residential and commercial buildings Construction and renovation are a labour-intensive process and well suited for government spending with the intention of job creation
bull Concentrations of GHGs in the earthrsquos atmosphere already guarantee a rapidly changing climate The effects of this can be highly adverse and infrastructure planning particularly for buildings should consider the increased risk of adverse climate events
Buildings are an inherently local infrastructure clearly affecting the communities which live sleep and work within them Buildings are also responsible for a large share of GHG emissions
For many G20 countries the challenge lies in redesigning buildings to reduce their emissions while for developing economies with expanding populations and cities the challenge is to build in a sustainable manner to begin with
At the same time countries around the world must recognise the fact of a changing climate and the need for buildings to adapt to this
321 Reducing GHG emissions from buildingsEnergy usage in buildings today accounts for 18 of global GHG emissions (Our World in Data) Reducing energy demand from residential and commercial buildings is a priority area for green public investment
Energy efficiency measures can greatly reduce building energy demand for cooking space and water heating and cooling as well as for electrical appliances While certain efficiency gains are likely to be driven by public policy and regulation there is an important role for low-carbon infrastructure Namely the renovation of existing buildings to higher standards of energy efficiency through measures such as replacing loftwall insulation and replacing windows with double glazing
ww
ww
orld
com
mer
cere
view
com
Estimates by the Coalition for Urban Transitions (2019) show that building heating and cooling efficiency could lead to global abatement of 144 Gt CO2 from urban environment by 2050
The renovation of buildings toward higher energy efficiency standards is a highly labour-intensive task Rollouts of renovation infrastructure programmes therefore appear timely as governments respond to the fallout from the COVID-19 economic crisis particularly looking for investments with high returns in terms of jobs created per dollar spent
Beyond energy efficiency fossil fuels are still the largest global source for household heating There are a variety of options for decarbonising household heating but G20 countries today should begin sending clear market signals that the future of household heating will be through a non-carbon route
Infrastructure investments must begin here today if they are to be scaled in time to meet Paris Agreement commitments
322 Preventing emission lock in for developing economiesIn many parts of the world the construction of urban housing has not kept pace with population growth and internal migration towards cities From a GHG perspective developing countries face a different situation whereby the challenge lies more in rolling-out new sustainable housing rather than retrofitting existing housing to be sustainable
For example in sub-Saharan Africa 55 of the population still live in slums (Figure 7) To achieve the Sustainable Development Goals a clear first step is building housing which provides the necessary basic amenities for healthy living clean water clean cooking facilities clean heatingcooling equipment clean lighting
ww
ww
orld
com
mer
cere
view
com
Careful planning is also necessary for facilitating rapid migration into cities to avoid issues such as population build-up in areas vulnerable to hydro-geological hazards or expansion of cities with a lack of green spaces
In the context of developing economies the design of buildings that are low in GHG-emissions is just one among many (at least locally more) urgent considerations Developed economies have more capacity to place GHG-considerations higher up the policy agenda when considering the roll-out of new urban infrastructure
There is therefore a risk that developing countries will under-invest into the required steps for low GHG emission buildings instead building out large new cities that will become responsible for growing shares of the global GHG emissions
Here there is a role for the G20 to play in providing financial means to encourage the build out of sustainable infrastructure in developing economies from the beginning
323 Building sensibly for a changing climateMitigation of future greenhouse gas emissions must be central to the debate on sustainable infrastructure Unfortunately the existing concentration of GHG emissions in the atmosphere is sufficient to cause adverse climate related events
Substantial investments will be required to create sustainable and resilient cities and support adaptation to climate change The UCCRN Technical Report (2018) offers an exploratory analysis on the likely magnitude of these adverse events including heat extremes water availability food security and sea level rise
ww
ww
orld
com
mer
cere
view
com
Figure 7 Share of the Urban Population Living in Slums
Source Bruegel based on United Nations Global SDG Database
70
60
50
40
30
20
10
0Australia and New Zealand
Europe and Northern Amercia
Latin America and the
Caribbean
World Northern Africa and Western
Asia
Eastern and South
Easern Asia
Central and Southern
Asia
Sub-Saharan Africa
2000 2014 2016 2018
ww
ww
orld
com
mer
cere
view
com
The report is focussed upon adverse climate effects within cities One key finding is that by 2050 over 16 billion people living in more than 970 cities will face extreme heat of over 35 degrees Celsius for 3 consecutive months
At the same time over 800 million people from 570 coastal cities will be at risk of flooding due to at least 05 metres of sea level rise Declines in the national yields of major crops and a decrease in the availability of freshwater will also affect millions of G20 citizens
Different cities will face different challenges in adapting to climate change The common theme is that urban planning and infrastructure deployment must be always evaluated against the likely climate change impacts of the area over the coming decades There is a growing scientific literature offering evidence and advice on this
33 Mobilitybull A shift away from the internal combustion engine is necessarybull Transitions may occur toward cleaner vehicles or more systematic solutions would see a modal shift away
from private road transport and toward walking cycling and public transportbull Through either route infrastructure requirements are large
Mobility within cities must change significantly in order to meet goals of the Paris Agreement A modal shift away from the dominant combination of private and polluting vehicles will be required Different routes may be taken to achieve this
A technological route sees little consumer change as internal combustion engine automobiles are replaced with electric and other low-carbon vehicles Other routes may see more significant shifts in consumer behaviours with increased acceptance of public transport and walkingcycling in place of private automobile journeys
ww
ww
orld
com
mer
cere
view
com
Regardless of the route taken by individual cities infrastructure will be key For example under scenarios with little behavioural change an accelerated roll-out of electric charging infrastructure will be required to allow the transformation of most of the global vehicle fleet away from the internal combustion engine and toward electric vehicles by 2050
Alternative strategies with increased behavioural change will require investments into public transport and walkingcycling infrastructure In particular investments into city and walkingcycling infrastructure are low in most countries
Increasing the share of citizens travelling by foot or bike reduces GHG emissions and has alternative co-benefits of exercise leading to a healthier population reduced air pollution and reduced noise pollution see Figure 8
Public transport infrastructure in most parts of the world needs to be significantly improved such that it more efficiently competes with the automobile for a door-to-door journey15 This is a problem as many cities still lack effective schemes for integrating long and short distance transport means
A modal shift from road to rail will also require investment into high-speed rail Improving rail connections has been shown to increase demand For example when China connected the isolated Zhengzhou-Xi line in 2012 to the Beijing High Speed Rail network passenger volume increased by 43 (Lawrence et al 2019)
The adoption of multi-modal solutions to effectively integrate the lsquolast milersquo within public transport networks requires systems innovation and infrastructure
ww
ww
orld
com
mer
cere
view
com
Figure 8 Concentration of Fine Particles in Cities in the G20
Note the figure shows mean annual concentration of fine suspended particles where the mean is a population-weighted average for urban population in a countrySource UN Global SDG Database for 2016
100908070605040302010
0
Cana
da
Aust
ralia
USA U
K
Arg
entin
a
Braz
il
Japa
n
Ger
man
y
Fran
ce
Euro
pe
Russ
ian
Fede
ratio
n
Italy
Indo
nesi
a
Mex
ico
Sout
h A
fric
a
Sout
h Ko
rea
Turk
ey
Chin
a
Indi
a
Saud
i Ara
bia
μgm
sup3
ww
ww
orld
com
mer
cere
view
com
For example in 2015 the Metropolitan Atlanta Rapid Transit Authority (MARTA) announced a partnership with Uber whereby MARTA public transport users can directly link to Uber from the app and request an Uber which will be waiting when the passenger arrives Such lsquosmart cityrsquo solutions to transport require adequate telecommunication networks
In the next section we will look at such digital infrastructure
34 Digital Infrastructurebull Digital infrastructure is key for achieving SDGsbull Access to high-speed internet is an important prerequisite for the effective integration of firms and workers
into the global economy and increasingly for citizens into local communities
An increasingly important part of connecting local communities with the global economy is digital connectiveness Investment into digital infrastructure is important for sustainable development
Indeed target 9c of the SDGs is to significantly increase access to ICT technology and to strive to provide universal and affordable access to the internet globally
The COVID-19 pandemic has further illustrated the importance of digital technologies not least with regards to achieving other SDG targets involving education decent work and economic growth as well as gender equality
Access to reliable internet is increasingly becoming a prerequisite for both workers and firms to participate in the global economy and for citizens to participate in local or global communities
ww
ww
orld
com
mer
cere
view
com
A UNCTAD (2017) report lays out key areas for digital infrastructure investment The report breaks down investment needs for internet availability into three areas where there is no coverage where there is cellular coverage and where cellular coverage has been upgraded to broadband
For different countries investment needs will differ by the share of these three regions For some countries investment needs will be substantial to roll-out out internet infrastructure to current areas of no coverage characterised by high deployment costs andor low demand
For other countries mostly G20 countries where universal cellular connection is already established the challenge is one of upgrading the technology
Infrastructure to improve the speed of internet connection will also have positive economic effects Figure 9 shows the scale of this challenge across different G20 countries The figure refers to subscriptions to the public internet at downstream speeds equal to or greater than 256 kbits
Beyond internet access G20 countries should also look to pursue policies which enable private investment into digital firms as well as encouraging digital adoption by traditionally non-digital firms where appropriate Digitalisation offers significant development opportunities in terms of employment and by facilitating new and more efficient business models
Mobile banking as one example has provided affordable access to many individuals in situations with difficult access to conventional banking systems Encouraging investments into telemedicine online retail online payments are other examples of likely desirable digital infrastructure policy objectives
ww
ww
orld
com
mer
cere
view
com
Figure 9 Share of Population with a Fixed Broadband Subscription in G20 Countries
Source Bruegel based on World Development Indicators EU data for 2018 all other data 2019
50454035
2530
201510
50
Indi
a
Sout
h A
fric
a
Indo
nesi
a
Mex
ico
Braz
il
Turk
ey
Arg
entin
a
Saud
i Ara
bia
Russ
ian
Fede
ratio
n
Italy
Chin
a
Japa
n EU
Aust
ralia U
S
UK
Cana
da
Ger
man
y
Sout
h Ko
rea
Fran
ce
Perc
ent
ww
ww
orld
com
mer
cere
view
com
The application of digital technologies to infrastructure described by the G20 InfraTech Agenda16 as ldquothe integration of material machine and digital technologies across the infrastructure lifecyclerdquo will also play a major role in the transition to low- and eventually zero-carbon economies As a cross-cutting technology it has the potential to increase efficiency and reduce emissions in many crucial infrastructure systems
One example discussed above is the digitalisation of electricity grids facilitating more efficient accommodation of renewable electricity sources Importantly digital infrastructure also allows environmental data collection sharing and analysis which can be a major mitigating factor of climate change17
35 Waste and water managementbull Waste and water management processes contribute significantly to global GHG emissions Moreover their
effective design is essential for shifting toward a more circular economybull Sensible water policies will become increasingly important over the next decades with the effects of climate
change
Waste and water management both directly affect local communities In certain regions the burning of waste releases toxic gases which contribute toward air pollution
Moreover waste which is not properly disposed of can lead to land or water pollution Securing a fresh water supply to local citizens is a growing problem exasperated by the effects of climate change Beyond local issues the treatment of solid and water waste contributes a significant share of global GHG emissions estimated at 2 and 1 respectively18
ww
ww
orld
com
mer
cere
view
com
351 Solid wasteWaste management must be considered central to sustainability goals The current model of extracting natural resources consuming them and then disposing a large proportion in the form of useless waste is by definition unsustainable
G20 governments should pursue plans to shift toward the circular economy and zero waste societies To illustrate the scale of the problem data from the US show that 50 of municipal solid waste ended up in landfill in 201819
It is acknowledged that the lack of effective solid waste management as well as unsustainable production and consumption patterns are key to the problem
From an infrastructure perspective efforts can be made to improve recycling capacity This might involve expanding the institutional and logistics chain to better involve consumers in the separation of waste into recyclable components as well as increasing final capacity for recycling
Another infrastructure option would be increasing capacity to generate useful energy from solid waste or capturing fugitive emissions from landfills Such projects should be viewed as a complement to first reducing the volume of waste ending up in landfills in the first place
352 WaterAs of 2015 21 billion people lacked access to safely managed drinking water services (WHO and UNICEF 2017) Difficulties in accessing freshwater are set to increase with the effects of climate change Policy design and infrastructure should focus on managing water resources well in order to maximise human welfare
ww
ww
orld
com
mer
cere
view
com
On a local level infrastructure requirements in many countries will be dominated by the need to adapt to a changing climate and provide a secure supply of freshwater
There exists a substantial gap between current financing and required needs for water infrastructure OECD (2018) outlines some key reasons for this water is generally an under-valued resource water infrastructure is capital intensive with high sunk costs and its benefits are of both private and public nature making it hard to monetise
The capacity to treat and clean wastewater also needs to be expanded in many regions of the world United Nations (2017) estimates that high-income countries treat about 70 of the wastewater they generate but this drops to 8 for low-income countries
Globally over 80 of all wastewater is discharged without any treatment which contributes to the spread of water-borne diseases A key challenge is rolling out further global wastewater treatment infrastructure capacities and best practices
Wastewater treatment plants themselves are also responsible for significant GHG emissions Options should be explored for decarbonising this process There are also substantial improvements necessary regarding the effective treatment of water run-off from industry and agriculture
36 Industrial materialsbull Building infrastructure is a resource and greenhouse gas intensive process responsible for 11 of global
GHG emissions20bull Beyond building the infrastructure needed for a low-carbon economy the construction of the infrastructure
itself must become sustainable
ww
ww
orld
com
mer
cere
view
com
bull The G20 should support the commercialisation of low emission technologies for the production of materials used in infrastructure development by creating lead markets
Building construction itself accounts for 11 of global GHG emissions (Our World in Data) Before any infrastructure strategy can be deemed truly sustainable the materials used to build with must first be sustainable
Instead there is significant carbon embedded in the infrastructure projects of the past and without swift action at the G20 level this will continue to be the case for almost all infrastructure projects in the future
An important aspect is therefore developing low-carbon technologies for some of the key elements used in manufacturing and construction process namely steel aluminium and cement All three have proved difficult to decarbonise and still contribute significantly to GHG emissions
Infrastructure lock-in in the form of carbon-intensive production capacity for each of these sectors is a problem At current trends it is likely that many G20 economies will have to decommission and replace todayrsquos fossil fuel intensive production facilities with low-carbon production facilities of the future
While carbon neutral technologies are currently not competitive in prices the G20 could create markets through public procurement and subsidies that would incentivise investment into research and development of these technologies
Steel is fundamental to modern life being used widely in infrastructure ships trains cars and machines Steel also has important uses cases for the transition toward low-carbon economies in electric vehicles and wind turbines
ww
ww
orld
com
mer
cere
view
com
Aluminium is used for infrastructure transportation vehicles electrical conductors and consumer goods such as packaging It has a high strength to weight ratio great flexibility and is infinitely recyclable which makes it an attractive material Cement is used to make concrete which is a vital building block for infrastructure
Current methods for the production of steel aluminium and cement are both energy and GHG intensive Estimates suggest that the production of steel aluminium and cement account for approximately 7 2 and 4 of global GHG emissions respectively21
To meet sustainable development scenarios it is imperative to reduce the carbon emissions associated with the production of these key industrial materials
In all cases some energy and material efficiency gains may be made and end-use cases may undergo some substitution toward less carbon-intensive materials Increased recycling can also play a key role
However it will still be essential to redesign current carbon-intensive production methodologies This may involve shifting to new primary production technologies the consumption of different fuels for energy provision or the adoption of carbon capture and storage technologies
OECD (2019) identify some of the key barriers which have so far prevented low-carbon innovation and deployment in these sectors First steel and cement plants operate with low profit margins in competitive markets
This has led to fears of carbon leakage and in emissions trading programs such as the EU ETS the sectors have consequently received a large share of free allowances As a consequence innovation in the heavy industrial sectors has remained muted
ww
ww
orld
com
mer
cere
view
com
Secondly heavy industry plants operate at very long timescales They can last for between 25 and 50 years Much new capacity is being built in developing economies while developed economies already enjoy an oversupply of production capacity Moreover there has so far been no serious attempts to create demand for low-carbon heavy industrial materials (OECD 2018)
Reducing carbon emissions from heavy industry sectors can be viewed from a supply and demand perspective From a demand perspective policy tools should be used to increase material efficiency (ie using less material to achieve the same result) and encourage material recycling From a supply perspective the challenge is to support low-carbon alternatives
Given the long lifecycles of heavy industry plants to meet targets of the Paris Agreement low-carbon technologies should already be commercialised by the mid-2030s It is therefore of fundamental importance for G20 countries to create lead markets and demand for low-carbon steel cement and aluminium
A variety of options can be followed by G20 governments to decarbonise these sectors One option is green public procurement where governments purchase only low-carbon construction materials or commit to targets for procurement of low-carbon materials in the future Other options are regulations to impose a minimum percentage share of low-carbon materials in any construction project
Carbon pricing is conventionally seen as driving low-carbon deployment In construction materials the problem is that globally carbon prices that exist do not reach the levels required to sufficiently incentivise low-carbon production
ww
ww
orld
com
mer
cere
view
com
Carbon contracts for difference are an option for artificially increasing the carbon price for certain sectors for a period of time Here a government guarantees a certain carbon price to eg the steel sector and pays a steel producer the difference between the existing carbon price and a higher promised carbon price for every tonne of carbon abated
Such a scheme would be implemented for a few years until the price of low-carbon production was driven down to levels whereby a conventional carbon tax can stimulate further demand
G20 action is vital for the deployment of the technologies for low-carbon production in these sectors Without its leadership in promoting green industrial materials infrastructure construction will continue being carbon intensive Infrastructure projects designed for the abatement of GHG emissions or adaption to a changing climate will continue to further exasperate the issue at hand
Successful policy design should allow G20 countries to drive down costs in a manner similar to that in which European lead markets drove down costs for solar and wind power generation in the 2000s As costs are driven down it will also become increasingly feasible to bring other global actors on board
4 Financing sustainable local infrastructurebull Strained public budgets are unable to finance the massive sustainable infrastructure gap but private sector
investment falls short of the needs due to inherent complexities and risks of infrastructure projectsbull Local governments face unique challenges in financing infrastructure due to complex decision-making
structures limited access to funding and technical assistance and the lack of capacity to structure projects for private investment
ww
ww
orld
com
mer
cere
view
com
bull Development financing institutions should expand their services to local communities by providing funding and technical assistance to small-scale projects and to crowd-in private financing
bull Pervasive structural budget overruns and project delays in the infrastructure sector must be addressed by national governments to increase private sector investment
Traditionally infrastructure and the services it provides are managed by the public sector For many types of infrastructure governments are the best-suited providers As a result of a global decentralisation trend in the public sector today municipalities are frequently in charge of selecting and managing infrastructure implementation (Merk et al 2012)
Furthermore national climate plans are often implemented through local action In most G20 countries over 50 of investments in infrastructure are made by local governments In OECD countries more than 60 of climate-smart investments are made at the local level
To close the multi-trillion-dollar sustainable infrastructure gap discussed in Section 2 which resulted from years of global underinvestment new sources of financing have to be found This is especially true for low- and middle-income countries whose public budgets are already stretched thin in the wake of the COVID-19 pandemic
Prohibitively high capital costs often make it impossible to afford the high upfront investments many infrastructure projects require Hence there is widespread agreement among policymakers researchers and climate activists that the infrastructure gap can only be closed with significant private sector investment (Bhattacharya et al 2019 Grimm and Boukerche 2020)
ww
ww
orld
com
mer
cere
view
com
This will enable governments to allocate scarce public funds more efficiently The current financial market environment represents an opportunity for sustainable infrastructure investment in developing and emerging economies by the private sector the combination of excess savings and low interest rates in advanced economies with high foreign investment needs and returns in the emerging economies and developing countries is an ideal setting for more efficient capital allocation
Most countries are unable to translate the tremendous needs and opportunities for sustainable infrastructure into realised demand and a significant proportion of investment is not as sustainable as it should be
One good example is FDI flows Global FDI flows to advanced as well as emerging and developing economies are dominated by the G20rsquos investments Bhattacharya et al (2019) analyse these capital flows between 2011 and 2017 with respect to their sustainability Only 11 of the US$4 trillion foreign investment by G20 countries was channelled into sustainable infrastructure
As Figure 10 shows low- and lower-middle income countries make up a disproportionately low share of recipients relative to their investment needs Similarly when considering the type of infrastructure that is being funded the vast majority flows into the energy sector
Local infrastructure such as water waste and transport represent an almost negligible share of the G20rsquos FDI in sustainable infrastructure in emerging markets and developing countries It appears that capital does not flow where it is needed most This is due largely to the inherent complexities of local green infrastructure development
This firstly relates to funding In general cities rely on transfers of federal funds or on reallocation of existing municipal budgets to fund investments in local green infrastructure But local governments face unique barriers
ww
ww
orld
com
mer
cere
view
com
Figure 10 Distribution of Sustainable Infrastructure FDI from G20 Countries to EMDCs by Income Level of Recipient 2011-2017 in USD Billion
Source Bruegel based on Bhattacharya et al (2019)22
140
120
100
80
60
40
20
0High income Upper middle income Lower middle income Low income
Waste Transport Water Energy
ww
ww
orld
com
mer
cere
view
com
in accessing private finance and the ability to do so varies substantially with their size political autonomy and institutional capacity
Ivanyna and Shah (2012) show that only 16 of countries authorise regional authorities to set local tax rates independently More so the majority of national governments either forbid or heavily restrict local authoritiesrsquo ability to raise money from capital markets and prohibit them from issuing municipal bonds (Ivanyna and Shah 2012)
Among those that are in theory able to issue debt many have no or very low ratings on credit markets especially in lower income countries (Carter and Boukerche 2020)
A second major barrier to local infrastructure investment is the lack of investment opportunities of sufficient quality and appropriate size This includes both the lack of investible projects and the challenge of matching them with the suitable financier
Much infrastructure does not generate direct and quantifiable returns In many cases its aim is to expand the accessibility to the service it provides to the largest possible number of citizens Even if there are monetary profits they are generated gradually over long-time horizons
Similarly one source of private financing that has received a lot of attention in the recent policy discussion are institutional investors The capital pool managed by such institutional investors in the OECD alone amounts to US$100 trillion which would be more than enough to close the sustainable infrastructure gap (Grimm and Boukerche 2020)
ww
ww
orld
com
mer
cere
view
com
However local infrastructure projects are usually too small for institutional investors A study by the C40 Cities Finance Facility found that 45 of municipal infrastructure projects are smaller than $10 million (C40 2018)
Therefore it is crucial that the source of funding and the specific infrastructure project are efficiently matched The missing lsquopipeline of projectsrsquo is a recognised obstacle to infrastructure investment at all scales and sectors (Bhattacharya et al 2019) but is exacerbated at lower levels of governments
Most local administrations do not have the resources nor the expertise to identify design and structure sustainable projects that could attract private investors
Climate-related investments also frequently require technical feasibility and impact studies which municipalities are unable to afford (Carter and Boukerche 2020) Access to external concessional finance for project preparation is scarce at the local level
A final obstacle to private sector investment in local green infrastructure is risk Projects are generally long-term and entail substantial and costly planning preparation and construction phases with no monetary returns for years Cost overruns and delays are pervasive in the infrastructure sector
Municipal infrastructure projects face additional bureaucratic hurdles due to often complex and opaque decision-making structures between regional and higher-level governments Due to their cross-cutting impact infrastructure projects require the involvement of many diverse stakeholders and a substantial fraction of the funding needs to be paid upfront
ww
ww
orld
com
mer
cere
view
com
This cost structure is exacerbated in sustainable infrastructure where upfront costs tend to be 5-10 higher while operating and maintenance costs are lower (Bouton et al 2015) In addition due to the time-dimension there is substantial uncertainty related to future regulatory economic technological and political developments which is compounded in local projects as regional governmentsrsquo influence on national strategies is limited
Finally positive and negative externalities of infrastructure must be assessed and quantified For example a desired if long-term outcome of investments in green infrastructure is the positive environmental impact and other collective social benefits But these positive externalities are difficult to quantify in terms of revenue or returns on investment (Carter and Boukerche 2020)
In other words the lack of appropriate carbon prices makes it impossible to incorporate the negative environmental effects of high-carbon infrastructure into investment opportunities All this makes green local infrastructure inherently risky for investors
Local governmentsrsquo room for manoeuvring these difficulties is relatively scarce However they can attempt to strategize their revenue system Urban administrations are advantaged with respect to their revenue system because the infrastructure sectors with the highest lsquogreeningrsquo potential such as buildings (energy efficiency) transport (public transport roads electric vehicle charging stations) water and waste are the sources of a substantial share of citiesrsquo revenues
By setting transport and parking fees utility charges and possibly property taxes accordingly local governments are in a unique position to lsquogreenrsquo their revenues by incentivising a more sustainable use of existing resources as well as the transition towards more climate-smart infrastructure (Merk et al 2012)
ww
ww
orld
com
mer
cere
view
com
The purpose of this policy is not to gather additional earnings On the contrary if higher parking fees lead to reduced downtown car traffic revenues may even decline Instead it can encourage a shift in the local communitiesrsquo infrastructure use from dirtier to more sustainable alternatives
The following sections will expand on the role that development finance institutions and national governments can play in alleviating barriers and crowding-in private investment in local sustainable infrastructure Finally we discuss the widespread occurrence of cost overlays and construction delays and non-completion of infrastructure projects
41 Mobilising private funding for sustainable local infrastructure the role DFIsNational and international development banks (henceforth summarised under the term development finance institutions or DFIs) will play a critical role in filling the global infrastructure gap particularly but not only in low- and middle-income countries
Backed by the strong credit ratings of their members DFIs are able to borrow cheaply from capital markets and thereby bring down the cost of finance for their debtors According to World Bank estimates emerging market and low-income economies alone require annual investments of approximately US$15-27 trillion in sustainable infrastructure until 2030 in order to achieve the SDGs and meet a 2degC climate target (Rozenberg and Fay 2019)
As Table 3 shows annual investments in sustainable infrastructure in EMDEs by multilateral and national development banks and G20 FDI combined accounted only for US$1548 billion between 2011 and 2017
A recent study suggests that MDBs could substantially increase their lending headroom while maintaining their excellent credit ratings (Munir and Gallagher 2018) Specifically depending on the scenario considered lending capacity could be increased by between US$598 billion and 19 trillion
ww
ww
orld
com
mer
cere
view
com
While this is noteworthy it is clear that financing the trillion-dollar yearly gap is well beyond the direct capacity of DFIs Instead the primary role of DFIs should shift from providing funding themselves to catalysing private sector investments
The true power of DFIs lies in their project expertise which enables them to fill two crucial gaps in the local sustainable infrastructure investment system risk mitigation and project supply
Thanks to their expertise DFIs are in the ideal position to assess and ensure appropriate risk sharing among participating investors As explained above many factors make local climate-smart infrastructure projects relatively unattractive for private investors
In addition for investments in emerging markets and low-income countries risks such as inflation currency fluctuation and convertibility or expropriation are also present
Table 3 Sustainable Infrastructure Investments in EMDCs by Source of Financing
Source Bruegel replication of Table 2 in Bhattacharya et al (2019)
Total (USD billion) Annual (USD billion) Share of EMDC need Share of global need
MDBs 180 257 12 03
NDBs 621 888 42 12
G20 FDI 282 403 19 05
Total 1083 1548 74 20
ww
ww
orld
com
mer
cere
view
com
Thanks to their longstanding experience of successfully lending to and implementing projects in high-risk contexts DFIs are adept at negotiating with stakeholders managing risks and monitoring and measuring project impact
Their past relationships with governments reduce political and operational risks of investments and MDBs have a proven track record of serving as intermediaries between developing countries and investors (Mohieldin et al 2018)
DFIs should increase their participation in blended finance structures for private sector investment while continuing to engage in institutional strengthening and capacity building and bolstering the fundament of market-oriented growth in the receiving countries
The second major barrier to be addressed is the lack of investible projects This is akin to supporting the demand side of infrastructure financing
By providing technical assistance along all stages of preparation from project identification over feasibility studies to matching with investors DFIs can contribute to a reliable supply of high-quality local sustainable infrastructure investment opportunities This would not only increase the projectsrsquo quality but also build local capacities and transfer knowledge to municipalities
For this to have an impact on local infrastructure it is crucial that DFIs expand their services to lower level of governments While DFIs are already an important source of funding for urban and sustainable infrastructure for example through the Global Environment Facility the Green Climate Fund and the Adaptation Fund (Carter and Boukerche 2020) they generally work at the national level
ww
ww
orld
com
mer
cere
view
com
This means that the financing provided in the above-mentioned facilities must be accessed through the national government which increases coordination needs and bureaucratic load (Alexander et al 2019)
DFIs should cooperate with the G20rsquos Global Infrastructure Facility (GIF) which was established precisely for that purpose and has experience in providing technical assistance to local governments and municipalities in infrastructure project design and structuring in order to attract private sector investment
The World Bankrsquos City Creditworthiness Initiative (World Bank 2018) is another great step towards this goal The program aims to improve municipalitiesrsquo access to financing for sustainable infrastructure by improving their creditworthiness
To this end the initiative provides a capacity-building lsquoacademyrsquo and a technical assistance program to enhance citiesrsquo ability to attract structure and manage private financing
42 Mobilising private funding for sustainable local infrastructure the role of national governmentsNational governments play a central role in crowding-in private sector investment in local green infrastructure Their main responsibility is to ensure a supportive and enabling investment environment for sustainable local infrastructure
Naturally this means addressing macroeconomic barriers to private-sector investment such as inflation or currency convertibility But increasing transparency in terms of climate intentions is also crucial The central government must be the leader in greening infrastructure investment
ww
ww
orld
com
mer
cere
view
com
This entails aligning national policies and regulatory frameworks with national climate commitments thereby sending clear signals to markets about infrastructure investment intentions Revising assessment frameworks environmental regulations and infrastructure standards at the national level to reflect sustainability goals facilitates their implementation for local governments
At the same time central governments could increase municipalitiesrsquo autonomy over their revenue systems in order to increase their room for policy action Eventually they should reassess and revise their institutional framework for municipal financing to ensure efficient allocation of resources while maintaining financial sustainability
In addition central governments must invest in administrative capacity-building This should also include increased coordination among higher and lower levels of government as well as transparent distribution of responsibilities
43 Infrastructure project performanceIn order to attract a higher share of private investment in sustainable local infrastructure governments must address the risk of construction delays cost overruns and project non- completion
Poor infrastructure project performance as measured by budget overruns and implementation delays is widespread The influential study by Flyvbjerg et al (2003) was one of the first to document the pervasiveness and magnitude of the problem Their analysis of 258 transport infrastructure projects in twenty countries found that almost 90 of projects experienced substantial delays and budget overruns of on average 26
Among them are for example the Channel Tunnel (80 cost overrun) and the Humber Bridge in the UK (175 overrun) Another investigation into the cost burden of large infrastructure projects around the world found that
ww
ww
orld
com
mer
cere
view
com
only four of the 52 projects studied remained within the forecasted budget and cost overruns averaged at 88 (Merrow et al 1988)
Prominent examples of delayed and excessively expensive infrastructure projects abound across the world and studies investigating this problem in virtually all G20 economies prove that this is still widespread today (See Fiedler and Schuster 2016 for Germany Lee 2008 and Han et al 2009 for Korea Pickrell 1990 and 1992 for the USA Doloi et al 2012 for India Durdyev et al 2012 for Turkey Kaming et al 1997 for Indonesia Allahaim and Liu 2015 for Saudi Arabia Creedy et al 2010 for Australia Baloyi and Bekker 2011 for South Africa Flyvbjerg et al 2003 for France Huo et al 2018 for China)
Similar findings to those in the transport sector have been found in other sectors of infrastructure and demonstrate considerable differences in average cost and time performance Sectors such as transmission lines (8) or solar (1) wind (8) and thermal power plants (12) seem to face fewer unanticipated cost hikes than nuclear power plants and large dam projects where cost escalation amount to 113 and 96 on average and the pattern is mirrored in delays in project completion (Ansar et al 2014 Sovacool et al 2014)
IT and ICT perform comparatively well on average but the sector includes frequent outliers with massively escalated costs23 It is important to note here however that national experiences may differ considerably from the averages found in trans-national studies especially at the subsectoral level24
Delayed projects that eventually turn into permanent and abandoned construction sites are more prominent in the developing world Recent evidence suggests that more than one-third of infrastructure projects in emerging markets and developing countries are not completed (Rasul and Rogger 2018 Williams 2017)
ww
ww
orld
com
mer
cere
view
com
These lsquowhite elephantsrsquo are a tremendous waste of resources in addition to presenting a potential danger to the local populations (Bancalari 2020) The studies estimate that waste of public resources through non-completion of infrastructure projects is of the same order of magnitude as the loss through corruption in infrastructure projects (around 2425) and is similar to the percentage of government spending that is lost due to politically motivated distortions (around 26) (Olken 2007)
Yet infrastructure non-completion receives much less attention in the development policy discussion and in academic literature than corruption and clientelism which is why the underlying causes are not yet well understood
The studies that are available identify the drivers of (non-) completion to be specific to the local institutions26 and identify a positive effect of budget conditionality on project completion that is fund disbursement for a new project to be conditional on the completion of the previous one
Similarly a striking feature of the existing literature on project cost and schedule performance is that it focuses almost exclusively on large infrastructure projects and megaprojects which are defined as ldquohelliplarge-scale complex ventures that typically cost US$1 billion or more take many years to develop and build involve multiple public and private stakeholders are transformational and impact millions of peoplerdquo (Flyvbjerg 2014 p3) and are managed by central governments
Literature on project performance for smaller infrastructure projects managed by local administrations is still scarce which is likely due to lack of reliable administrative data on infrastructure projects across levels of governments
ww
ww
orld
com
mer
cere
view
com
Understanding and mitigating the causes is absolutely vital By improving infrastructure project performance even marginally governments have the chance to generate substantial additional economic benefits from their investments in the wake of the current crisis
The magnitude of waste of fiscal resources is substantial and for middle- and low-income countries the social and developmental costs are tremendous Even a marginal decrease in the cost overruns in infrastructure projects could make billions of USD of public funds available for investment
While an analysis of the underlying determinants is beyond the scope of this report an assessment of local small-scale infrastructure service delivery in G20 countries will be instrumental to identify obstacles to timely and cost-efficient construction and address them27
Recommendations to the G20The G20 has had considerable success driving infrastructure up the agenda notably following the G20 Principles on Quality Infrastructure adopted at the 2019 Osaka summit and the InfraTech Agenda adopted at the 2020 Riyadh summit
The time has now come for the G20 to place sustainable and local elements at the centre of the conversation surrounding infrastructure We outline the key measures that should be taken to do so
bull Place climate sustainability at the core of the infrastructure agenda Infrastructure investments that are made now will lock in technologies for decades to come It is imperative that these contribute to limiting global warming to 15degC which needs to be emphasised in the G20 infrastructure agenda
ww
ww
orld
com
mer
cere
view
com
The G20 should revise the Principles on Quality Infrastructure to explicitly encompass climate change mitigative adaptive and resilient infrastructure
bull Sustainable policies start locally Building sustainable cities will be key to solving two of the most pressing challenges of our time climate change and population growth Covering only 2 of the planetrsquos surface cities are responsible for up to 70 of global GHG-emissions and home to the majority of the worldrsquos population
The G20 should recalibrate their individual and common infrastructure agendas to prioritise small-scale local investment that serves local communities
bull Improve access to finance for low-carbon projects Many low-carbon infrastructure projects such as deployment of solar PV are particularly capital intensive Higher costs of financing can prohibit ambitious levels of sustainable investment
In order to sustainable infrastructure investment in low- and middle-income countries the G20 should cooperate to provide cheaper financing This could be done through blended finance or concessional loan programs by DFIs
bull Address the shortage of bankable infrastructure projects Local administrations lack the capacity to identify prepare and structure sustainable infrastructure projects for private investment in their communities The G20 should expand the capacity of the Global Infrastructure Facility (GIF) to provide technical assistance to local governments throughout the project cycle in order to crowd-in private sector investments
ww
ww
orld
com
mer
cere
view
com
bull Commit to supporting bilateral and multilateral development banks DFIs are the key to unlocking large-scale infrastructure investments thanks to their expertise and long-term experience with risky project delivery With cities at the heart of the global zero carbon infrastructure transition they are only now beginning to support local governments directly
The G20 should continue to commit future funding to these institutions and promote their engagement at lower levels of government to enable them to provide much-needed support especially in low- and middle-income countries
bull Stimulate demand for low-carbon industrial materials Industrial materials are essential for sustainable infrastructure are responsible for significant GHG emissions Addressing this problem is difficult for a number of reasons The most efficient solution will be a coordinated commitment by the G20 to boost demand for low-carbon options
There are a range of policy options which could be deployed but whatever route is chosen it is essential that the G20 commits to this challenge now Further delays are incompatible with Paris Agreement targets
bull Improved cooperation across the G20 Decarbonising economies requires risk-taking experimenting and innovation Certain actions such as implicit or explicit carbon prices are essential for encouraging sustainable infrastructure but difficult for countries to implement unilaterally G20 coordination and stronger commitments to decarbonisation can facilitate more ambitious action at the national and in turn local level
bull Focus of lifecycle sustainability The G20 should advocate a shift toward a policy-making paradigm where policies are evaluated from a lifecycle sustainabilityemissions standpoint This would involve evaluating the
ww
ww
orld
com
mer
cere
view
com
whole chain of an infrastructure project from basic materials construction to recycling possibilities or waste disposal issues Best practices for this could be agreed at the G20 level
Mia Hoffmann is a Research Assistant Ben McWilliams a Research Analyst and Niclas Frederic Poitiers a Research Fellow all at Bruegel
Endnotes1 Extreme poverty is defined as living on less than $190 per day2 China is the largest emitter of CO2 with 28 of global emissions followed by the US (15) and the EU (9) In terms of per-capita emissions Saudi Arabia Australia and the United States lead the list of emitters among G20 economies Source Our World in Data (based on the Global Carbon Project)3 The financial support granted by IFI was around $200 billion roughly on par with the support during the Global Financial Crisis which affected developing economies only moderately compared to the current recession4 Energy-related emissions are to be understood as emissions derived from the purposeful transformation or use of energy The notable sectors are electricity production transport and buildings5 The reference is a collaborative effort to compile data from predominantly government sources Fossil Unconditional refers to policies that support the production and consumption of fossil fuels without any climate targets or additional pollution reduction requirements Fossil conditional includes such requirements Clean unconditional spending supports production and consumption of energy that is both low-carbon and has negligible effects on the environment Clean conditional energy intends to support the transition away from fossil fuels but the effect on the environment is unclear6 The results are from a survey of 231 finance ministry officials central bank officials and other economists representing 53 countries including all G20 nations Respondents were asked to assess the fiscal multiplier of each policy in a relative
ww
ww
orld
com
mer
cere
view
com
and subjective manner using 100-point sliding scale Respondents were not homogenous in their use of the sliding point scale and therefore respondents scores were re-based so that the y-axis now records a zero-mean zero-sum score ie comparable7 Ram et al (2020) investigates the global job effects in a scenario where accelerated renewable deployment sees the world transitioning to 100 renewable electricity by 2050 Their estimates are such that a scenario would see direct jobs associated with the electricity sector increasing from 21 million in 2015 to nearly 35 million by 2050 Solar PV wind power and batteries are the main job creators On the other hand a more recent study by Aldieri et al (2019) assessing literature from 2000-2019 finds that job creation connected to wind power installations is rather limited8 This estimate by New Climate Economy (2016) includes investments in urban transport waste water telecommunications and energy infrastructure systems but excludes investments in natural infrastructure9 Energy efficiency in buildings energy and transportation low-carbon core infrastructure renewable energy nuclear low-carbon transport climate-proof water and sanitation adaptation infrastructure10 Energy use in buildings (175) road transport (119) waste (32) and iron steel and cement (102) (Our World in Data)11 The IEA has recently declared solar the King of electricity markets12 For example in the UK (httpswwwofgemgovukenvironmental-programmesfitfit-tariff-rates)13 An example can be found in Brooklyn New York (httpswwwbrooklynenergy)14 An example can be found in California (httpswwwohmconnectcomabout-usnewsresi-station)15 The absolute time taken to get from departing point to destination point16 G20 Infrastructure Working Group (2020)17 Sarker et al (2020) Gijzen (2013)18 Our World in Data19 EPA accessed on 0203202120 Global Alliance for Buildings and Construction International Energy Agency and the United Nations Environment
ww
ww
orld
com
mer
cere
view
com
Programme (2019)21 Our World in Data Saevarsdottir et al (2020) and UN Environment and International Energy Agency (2017)22 Emerging markets and developing countries according to the IMFrsquos country classification income groups according to the World Bank23 Approximatively one out of six IT projects faces cost overruns over 200 (Flyvbjerg and Budzier 2011)24 For a discussion of this and an analysis by sector for Germany see Anzinger and Kostka (2016)25 Olken (2007)26 Williams (2017) finds that project non-completion is the outcome of a dynamically inconsistent collective choice process among political actors facing commitment problems in contexts of limited resources Rasul and Roggerson (2018) find that the management style of local public offices plays a role with higher autonomy of contributing to project-completion27 For an overview over causes and determinants of project performance see Aljohani et al (2017) Fiedler and Schuster (2016) and Pinheiro Catalatildeo et al (2019)
ReferencesAldieri L Grafstrom J Sundstrom K and Paolo Vinci C 2020 ldquoWind Power and Job Creationrdquo Sustainability 12(1) 45Alexander J Nassiry D Barnard S Lindfield M Teipelke R Wilder M 2019 ldquoFinancing the sustainable urban future Scoping a green cities development bankrdquo ODI Working Paper 552 Overseas Development InstituteAljohani A Ahiaga-Dagbui D amp Moore D 2017 ldquoConstruction projects cost overrun What does the literature tell usrdquo International Journal of Innovation Management and Technology 8(2) 137Allahaim FS amp Liu L 2015 ldquoCauses of cost overruns on infrastructure projects in Saudi Arabiardquo International Journal of Collaborative Enterprise 5(1-2) 32-57
ww
ww
orld
com
mer
cere
view
com
Alston P 2018 ldquoReport of the Special Rapporteur on Extreme Poverty and Human Rights on his mission to the United States of Americardquo Report of the Special Procedure of the Human Rights Council GenevaAnsar A Flyvbjerg B Budzier A amp Lunn D 2014 ldquoShould we build more large dams The actual costs of hydropower megaproject developmentrdquo Energy policy 69 43-56Baloyi L amp Bekker M 2011 ldquoCauses of construction cost and time overruns The 2010 FIFA World Cup stadia in South Africardquo Acta Structilia 18(1) 51-67Bancalari A 2020 ldquoCan White Elephants Kill Unintended Consequences of Infrastructure Development in Perurdquo The Institute for Fiscal Studies Working Paper Volume 20 Issue 32Bataille C 2019 ldquoLow and zero emissions in the steel and cement industries Barriers technologies and policiesrdquo OECD Issue Paper Conference VersionBhattacharya A KP Gallagher M Muntildeoz Cabreacute M Jeong and X Ma 2019 ldquoAligning G20 Infrastructure Investment with Climate Goals and the 2030 Agendardquo Foundations 20 Platform a report to the G20Blyth W Gross R Speirs J Sorrell S Nicholls J Dorgan A and Hughes N 2014 ldquoLow-carbon jobs The evidence for net job creation from policy support for energy efficiency and renewable energyrdquo 2014 A report for UKERC by UKERC Technology amp Policy Assessment Function UK Energy Research CentreBouton S Newsome D and Woetzel J 2015 ldquoBuilding the cities of the future with green districtsrdquo McKinsey amp CompanyC40 Cities Finance Facility CDP and Global Covenant of Mayors 2018 ldquoThe demand for financing climate projects in citiesrdquoCalderon C and L Luis 2014 ldquoInfrastructure Growth and Inequality An Overviewrdquo Policy Research Working Paper No 7034 World BankCarter L and Boukerche S 2020 ldquoCatalyzing Private Sector Investment in Climate-Smart Citiesrdquo Invest4Climate Knowledge Series Washington DC World BankCCFLA (2015) State of City Climate Finance 2015 Cities Climate Finance Leadership Alliance (CCFLA) New YorkCoalition for Urban Transitions 2019 ldquoClimate Emergency Urban Opportunityrdquo September 2019
ww
ww
orld
com
mer
cere
view
com
CRED and UNDRR 2020 ldquoHuman cost of disasters an overview over the past twenty years (2000- 2019)rdquoCreedy GD Skitmore M amp Wong JK 2010 ldquoEvaluation of risk factors leading to cost overrun in delivery of highway construction projectsrdquo Journal of construction engineering and management 136(5) 528-537Doloi H Sawhney A Iyer KC amp Rentala S 2012 ldquoAnalysing factors affecting delays in Indian construction projectsrdquo International journal of project management 30(4) 479-489Durdyev S Ismail S amp Bakar NA 2012 ldquoFactors causing cost overruns in construction of residential projects case study of Turkeyrdquo International Journal of Science and Management 1(1) 3-12EPA (United States Environmental Protection Agency) ldquoNational Overview Facts and Figures on Materials Wastes and RecyclingrdquoEuropean Commission 2021 ldquoThe EUrsquos 2021-2027 long-term budget amp NextGenerationEU - Facts and figuresrdquoFiedler J and Schuster S 2016 ldquoThe Elbphilharmonie Hamburgrdquo in Kostka G and J Fiedler (Eds) Large infrastructure projects in Germany Between Ambitions and Reality Palgrave MacmillanFinan F and M Mazzocco 2016 ldquoElectoral Incentives and the Allocation of Public Fundsrdquo NBER Working Paper No 21859Flyvbjerg B 2014 ldquoWhat you should know about megaprojects and why An overviewrdquo Project management journal 45(2) 6-19Flyvbjerg B and Budzier A 2011 lsquoWhy your IT project may be riskier than you thinkrdquo Harvard Business ReviewFlyvbjerg B Bruzelius N amp Rothengatter W 2003 ldquoMegaprojects and risk An anatomy of ambitionrdquo Cambridge University PressFragkos P and Paroussos 2018 ldquoEmployment created in EU related to renewables expansionrdquo Applied Energy Volume 230 pages 935-945G20 2010 ldquoSeoul G20 Summit Final Declaration 2010rdquo November 11ndash12 2010G20 2011 ldquoCannes G20 Summit Final Declaration 2011rdquo November 3ndash4 2011G20 2013 ldquoSt Petersburg G20 Leadersrsquo Declaration 2013rdquo September 6 2013G20 2014 ldquoBrisbane G20 Summit Declarationrdquo November 15-16 2014
ww
ww
orld
com
mer
cere
view
com
G20 2015 ldquoAntalya G20 Leadersrsquo Communiqueacuterdquo November 15ndash16 2015G20 2016a ldquoG20 Leadersrsquo Communiqueacute Hangzhou Summitrdquo September 5 2016G20 2016b ldquoMDBs Joint Declaration 2016rdquoG20 2018 ldquoG20 2018 Leadersrsquo Declarationrdquo November 30 ndash December 1 2018G20 2019 ldquoG20 Principles for Quality Infrastructure InvestmentrdquoG20 2020a ldquoLeadersrsquo Declarationrdquo G20 Riyadh Summit November 21-22 2020G20 2020b ldquoCommuniqueacute G20 Finance Ministers and Central Bank Governors Meetingrdquo April 15 2020G20 2020c ldquoG20 Riyadh InfraTech AgendardquoGenccedilsuuml I Whitley S Roberts Leo Beaton C Chen H Doukas A Geddes A Gerasimchuk I Sanchez L amp Suharsono A 2019 lsquoG20 coal subsidies Tracking government support to a fading industryrsquo ODI Report June 2019Gijzen H 2013 ldquoBig data for a sustainable futurerdquo Nature Volume 502 Issue 38Global Alliance for Buildings and Construction International Energy Agency and the United Nations Environment Programme 2019 lsquo2019 global status report for buildings and construction Towards a zero-emission efficient and resilient buildings and construction sectorrsquoGrimm M and S Boukerche 2020 ldquoEngaging Institutional Investment in Climate-Smart Infrastructurerdquo Invest4Climate Knowledge Series World BankHallegatte S M Bangalore L Bonzanigo M Fay T Kane U Narloch J Rozenberg D Treguer and A Vogt-Schilb 2016 ldquoShock Waves Managing the Impacts of Climate Change on Povertyrdquo Climate Change and Development World BankHan SH Yun S Kim H Kwak YH Park HK and SH Lee 2009 ldquoAnalyzing Schedule Delay of Mega Project Lessons Learned From Korea Train Expressrdquo IEEE Transactions on Engineering Management 56(2) pp 243-256Hepburn C OrsquoCallaghan B Stern N Stiglitz J and Zenghelis D 2020 ldquoWill COVID-19 fiscal recovery packages accelerate or retard progress on climate changerdquo Oxford Review of Economic Policy Volume 36 Issue Supplement_1 pages S359-S381
ww
ww
orld
com
mer
cere
view
com
Huo T Ren H Cai W Shen GQ Liu B Zhu M amp Wu H 2018 ldquoMeasurement and dependence analysis of cost overruns in megatransport infrastructure projects Case study in Hong Kongrdquo Journal of construction engineering and management 144(3) 05018001IEA 2019 lsquoGlobal Energy amp CO2 Status Report 2019rsquo March 2019IEA 2020a ldquoWorld Energy Investment Flagship Reportrdquo May 2020IEA 2020b ldquoIron and Steel Technology Roadmaprdquo Energy Technology Perspectives October 2020IMF 2019 ldquoFiscal Policies for Paris Climate Strategies - from Principle to Practicerdquo IMF Policy Paper May 2019IMF 2020a ldquoWorld Economic Outlook A Long and Difficult Ascentrdquo Washington DC October 2020 IMF 2020b ldquoFiscal Monitor Policies for the Recoveryrdquo Washington October 2020IMF 2021 lsquoWorld Economic Outlook Updatersquo Washington January 2021International Institute for Sustainable Development (IISD) 2020a ldquoEnergy Policy TrackerrdquoInternational Institute for Sustainable Development (IISD) 2020b ldquoDoubling Back and Doubling Down G20 scorecard on fossil fuel fundingrdquo Published by the International Institute for Sustainable DevelopmentIvanyna M and A Shah 2012 ldquoHow Close Is Your Government to Its People Worldwide Indicators in Localization and Decentralizationrdquo World Bank Policy Research Working Paper 6138 World BankKaming PF Olomolaiye PO Holt GD amp Harris FC 1997 ldquoFactors influencing construction time and cost overruns on high-rise projects in Indonesiardquo Construction Management amp Economics 15(1) 83-94Kennedy C Ibrahim N and Hoornweg D 2014 ldquoLow-carbon infrastructure strategies for citiesrdquo Nature Climate Change 4 343-346Lawrence M R Bullock and Z Liu 2019 ldquoChinarsquos High-Speed Rail Developmentrdquo International Bank for Reconstruction and DevelopmentThe World BankLazard (2020) lsquoLazardrsquos Levelized Cost of Energy Analysis ndash Version 140rsquo October 2020Lee J-K (2008) Cost overrun and cause in Korean social overhead capital projects roads rails airports and ports Journal of urban planning and development 134 59ndash62
ww
ww
orld
com
mer
cere
view
com
Merk O Saussier S Staropoli C Slack E and Kim J-H 2012) Financing Green Urban Infrastructure OECD Regional Development Working Papers 201210 OECD PublishingMerrow EW McDonnell LM and RY Arguden 1988 ldquoUnderstanding the Outcomes of Megaprojects A Quantitative Analysis of Very Large Civilian Projectsrdquo Rand Corporation Meyer I and M Sommer 2016 ldquoEmployment effects of renewable energy deployment ndash a reviewrdquo International Journal of Sustainable Development 19(3)217Mohieldin M N Subramaniam and J Verbeek 2018 ldquoMultilateral Development Banks must mobilize private finance to achieve the SDGsrdquo Brookings Munir W and KP Gallagher 2018 ldquoScaling Up Lending at the Multilateral Development Banks Benefits and Costs of Expanding and Optimizing MDB Balance Sheetsrdquo Global Economic Governance Initiative Working Paper No013 Global Development Policy CenterNASA 2021 2020 Tied for Warmest Year on Record NASA Analysis Showsrdquo January 2021New Climate Economy 2016 ldquoThe Sustainable Infrastructure Imperative Financing for better growth and developmentrdquo New Climate EconomyOECD 2017 Investing in Climate Investing in Growth OECD Publishing ParisOECD 2018 ldquoFinancing water Investing in sustainable growthrdquo Policy Perspectives OECD Environment Policy Paper No 11Olken B 2007 ldquoMonitoring Corruption Evidence from a Field Experiment in Indonesiardquo Journal of Political Economy Volume 115 Issue 2 200-249Our World in Data available at httpsourworldindataorgco2-emissions and httpsourworldindataorgemissions-by-sectorPickrell DH 1990 ldquoUrban Rail Transit Projects Forecast Versus Actual Ridership and Costrdquo Department of Transportation Washington DC p 164
ww
ww
orld
com
mer
cere
view
com
Pickrell DH 1992 ldquoA desire named streetcar fantasy and fact in rail transit planningrdquo Journal of the American Planning Association 58(2) pp 158-176Pinheiro Catalatildeo F Cruz CO amp Miranda Sarmento J 2019 ldquoExogenous determinants of cost deviations and overruns in local infrastructure projectsrdquo Construction Management and Economics 37(12) 697-711Ram M Aghahosseini A and Breyer C 2020 ldquoJob creation during the global energy transition towards 100 renewable power system by 2050rdquo Technological Forecasting and Social Change Volume 151 119682Rasul I and D Rogger 2018 ldquoManagement of Bureaucrats and Public Service Delivery Evidence from the Nigerian Civil Servicerdquo The Economic Journal Volume 128 Issue 608 413ndash46Rozenberg J and M Fay 2019 ldquoBeyond the Gap How Countries Can Afford the Infrastructure They Need while Protecting the Planetrdquo Sustainable Infrastructure World Bank Washington DCSaevarsdottir G Kvande H and Welch B 2019 ldquoAluminum Production in the Times of Climate Change The Global Challenge to Reduce the Carbon Footprint and Prevent Carbon Leakagerdquo JOM the journal of the Minerals Metals amp Materials Society 72(1)Saevarsdottir G Kvande H amp Welch B 2020 ldquoAluminium Production in the Times of Climate Change The Global Challenge to Reduce the Carbon Footprint and Prevent Carbon Leakagerdquo JOM the Journal of the Minerals Metals amp Materials Society 72(1)Sarker MNI Y Peng C Yiran and RC Shouse 2020 ldquoDisaster resilience through big data Way to environmental sustainabilityrdquo International Journal of Disaster Risk Reduction Volume 51 Issue 101769Satterthwaite (2020) The worldrsquos fastest growing cities iied blogSingh R 2009 ldquoDelays and Cost Overruns in Infrastructure Projects An Enquiry into Extents causes and Remediesrdquo Working Paper No 181 Delhi School of EconomicsSovacool BK Gilbert A amp Nugent D 2014 ldquoAn international comparative assessment of construction cost overruns for electricity infrastructurerdquo Energy Research amp Social Science 3 152- 160
ww
ww
orld
com
mer
cere
view
com
Stotsky J and M Ghazanchyan 2013 ldquoDrivers of Growth Evidence from Sub-Saharan Africardquo IMF Working Paper No 13236 International Monetary FundTruman EM 2020 ldquoThe G20 missed an opportunity to expand financial resources for vulnerable countriesrdquo PIIE Realtime Economic Issues Watch April 2020UCCRN 2018 ldquoThe Future We Donrsquot Want How Climate Change Could Impact the Worldrsquos Greatest Citiesrdquo February 2018 UCCRN Technical ReportUN Environment and International Energy Agency 2017 ldquoTowards a zero-emission efficient and resilient buildings and construction sectorrdquo Global Status Report 2017UN Habitat 2011 lsquoGlobal Report on Human Settlements 2011 Cities and Climate Changersquo United Nations Human Settlements ProgrammeUN SDG Indicator database UNCTAD 2017 ldquoWorld Investment Report Investment and the Digital Economyrdquo United NationsPublication GenevaUNCTAD 2018 ldquoTrade and Development Report 2018 Power Platforms and Free Trade DelusionrdquoUNCTAD 2020 ldquoWorld Investment Report 2020 International Production Beyond the PandemicrdquoUnited Nations Publication UNCTADWIR2020United Nations Department of Economic and Social Affairs Population Division (2019b) World Urbanization Prospects The 2018 Revision New York United NationsUnited Nations Department of Economic and Social Affairs Population Division (2019a) World Population Prospects 2019 HighlightsUnited Nations 2017 ldquoWastewater The Untapped Resourcerdquo The United Nations World Water Development Report FranceVan de Walle D M Ravallion V Mendiratta and G Koolwal 2013 ldquoLong-Term Impacts of Household Electrification in Rural Indiardquo Policy Research Working Paper No 6527 World Bank
ww
ww
orld
com
mer
cere
view
com
Vivid Economics 2020 ldquoGreenness of Stimulus Indexrdquo Vivid Economics October 2020White House 2021 ldquoParis Climate Agreementrdquo Press Release January 20 2021Williams MJ 2017 ldquoThe Political Economy of Unfinished Development Projects Corruption Clientelism or Collective Choicerdquo American Political Science Review Volume 111 Issue 4 705ndash723World Bank 2018 ldquoCity Creditworthiness Initiative A Partnership to Deliver Municipal Financerdquo World Bank BriefWorld Bank 2020 ldquoCOVID-19 to Add as Many as 150 Million Extreme Poor by 2021rdquo Press Release October 7 2020World Health Organisation (WHO) and the United Nations Childrenrsquos Fund (UNICEF) 2017 ldquoProgress on drinking water sanitation and hygiene 2017 update and SDG baselinesrdquo Geneva World Health Organization
We owe our gratitude to Suman Bery Nicola Bilotta Maria Demertzis Alberto Franco Pozzolo Simone Tagliapietra Guntram Wolff and Georg Zachmann for their input and comments as well as Alma Kurtovic for her excellent management of this project We would also like to thank the Italian Ministry of Finance and Economics and the members of the G20 Infrastructure Working Group for their valuable feedback to our research This paper was prepared for the a meeting of G20 Finance Ministers and Central Bank Governors (FMCBG) on 9 and 10 July 2021 and was published on Bruegel
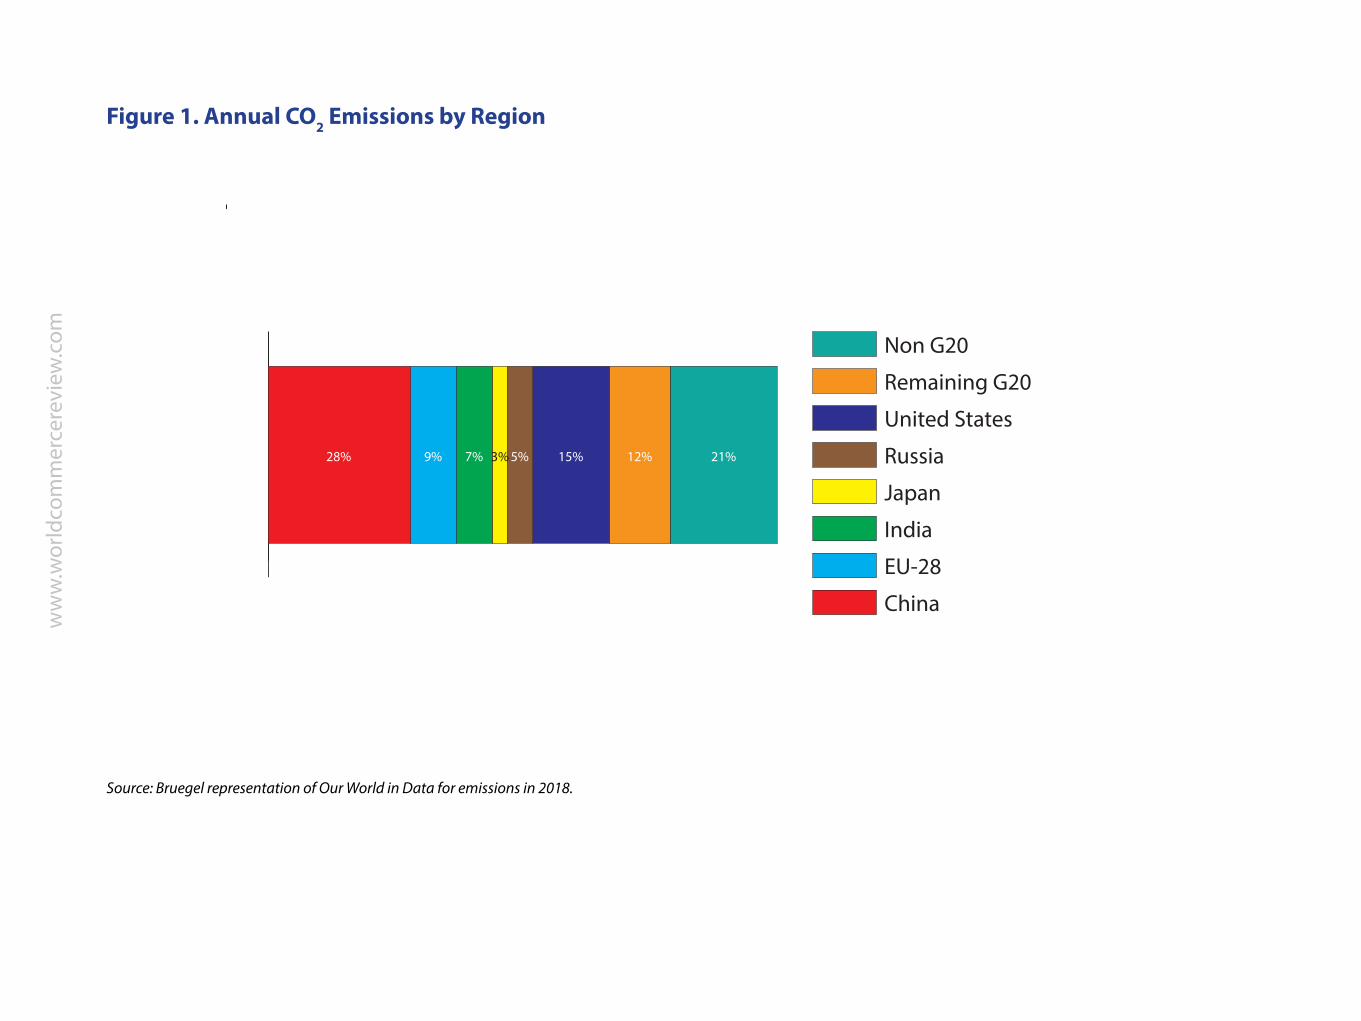
ww
ww
orld
com
mer
cere
view
com
Moving forward there should be a considerable shift towards sustainable long-term investments in the stimulus and recovery packages A positive example of such ambitions is the Next Generation EU recovery fund
The Next Generation EU (euro750 million) package comprises euro390 billion in grants and euro360 billion in loans to support member states Of this 30 is committed to lsquofighting climate changersquo (European Commission 2021)
Under the auspices of the Green Deal a variety of strategies are being put forward from hydrogen to biodiversity to agricultural which provide guidelines for how this lsquogreenrsquo money is to be spent
Policy Value committed(USD billions) Country
Aviation industry bailout 58 billion USA
Road building and repair 35 billion UK
Fund for carbon-neutral technology development 19 billion Japan
National railway deployment 14 billion China
Electricity price subsidies 13 billion Germany
Liquidity boost for power distribution companies 12 billion India
Table 1 Recent major energy-related investments in the G20
Source IISD (2020a) accessed on 05022021
ww
ww
orld
com
mer
cere
view
com
As fiscal support shifts from emergency liquidity relief towards more structural fiscal stimulus ambitious global investment programmes should be pursued and they must be sustainable As IMF (2020b chapter 2) argues investment in the recovery phase will play an important role in ensuring that global economic growth recovers
The case for green infrastructure investment is furthered by survey-based estimates of fiscal multipliers by Hepburn et al (2020)6 The study provides estimates associated with different kinds of economic recovery policies in the context of the COVID-19 crisis Airline bailouts chosen by many G20 countries are associated with a very low multiplier by respondents Meanwhile clean connectivity infrastructure has a larger multiplier than traditional transport infrastructure
While research on the employment effects of green infrastructure spending is still inconclusive most studies point to a neutral or positive effect Most of the available literature finds that investing in low-carbon infrastructure is unlikely to lead to lower levels of job creation than investing in fossil fuel infrastructure (Blyth et al 2014)
Moreover by tailoring policies to country-specific characteristics it appears likely that renewable energy projects can lead to a net increase in employment Meyer and Sommer (2014) and Fragkos and Paroussos (2018) both find larger domestic job creation when compared to fossil fuels7
As with all infrastructure projects job creation will be particularly large while economies are still experiencing output gaps in the wake of the COVID-19 economic crisis
2 Scale of the challenge infrastructure gapbull Even before the pandemic a large sustainable infrastructure gap persisted To reach sustainability goals
annual infrastructure spending in the scale of US$7 to 8 trillion is needed a gap of 21 of GDP
ww
ww
orld
com
mer
cere
view
com
Figure 4 COVID Recovery Policies Relative Fiscal Multipliers
Source Hepburn et al (2020)
10
5
0
-5
-10
-15
-20
Airl
ine
bailo
uts
Educ
atio
n ca
pita
l inv
estm
ent
Hea
lthca
re c
apita
l inv
estm
ent
Rura
l sup
port
pol
icie
s
Trad
ition
al tr
ansp
ort i
nfr
Proj
ect-
base
d lo
cal i
nfr
gran
ts
Clea
n co
nnec
tivity
infr
Clea
n en
ergy
infr
inve
stm
ent
Build
ing
upgr
ades
Gre
en s
pace
s an
d na
tura
l inf
r
ww
ww
orld
com
mer
cere
view
com
bull Local infrastructure in urban areas accounts for 70 of the green infrastructure needed by 2030bull Green infrastructure investment is expected to have a positive fiscal multiplier especially in the recovery
phase after the pandemic has come under control
Global infrastructure needs are rising In order to meet increasing demand from a growing population accelerating urbanization and technological progress the world will need to invest more than $90 trillion in infrastructure between 2016 and 20308
This is more than the entire existing global infrastructure stock (New Climate Economy 2016) Bhattacharya et al (2019) estimates that 70 of the infrastructure required by 2050 is yet to be built This lsquoinfrastructure gaprsquo is particularly acute in urban areas
CCFLA (2015) estimates that 70 of the green infrastructure needed by 2030 is to be built in urban areas Only half of the $45 to $54 trillion annual investment need for low-carbon urban development is currently met (CCFLA 2015)
Many cities in emerging markets and developing countries lack basic water and waste management reliable transport infrastructure and access to electricity and heating This includes many citizens of the G20 member states themselves and even in the richest G20 members some poor communities lack access to clean water and public sewerage (Alston 2018)
Importantly the type of infrastructure investments that are undertaken in the next few years will lock in technologies for decades to come Decisions taken now are critical to ensure the world is on path towards a low-carbon and climate resilient future
ww
ww
orld
com
mer
cere
view
com
Infrastructure investment in high- and middle-income regions will need to focus on upgrading and greening existing systems Low-income economies need to create new infrastructure networks that are sustainable and adaptable to climate economic and demographic changes while at the same time providing much needed access to basic services for their citizens
There is the opportunity for them to leap-frog the networks built around carbon-intensive energy production in developed economies Priority should therefore be given to improving local infrastructure with low-emission technology
Global annual investment into core infrastructure needed to fulfil expected demand by 2030 is estimated to lie between $63 and $68 trillion annually (Bhattacharya et al 2019 OECD 2017) Core infrastructure includes power generation and distribution transport water and sanitation systems and telecommunications
The additional costs of aligning these investments with the Paris goal of limiting global warming to well below 2degC are estimated to lie between $06 trillion and $11 trillion (see Table 2) These additional costs are likely to be offset by reduced expenses for fossil fuels as well as lower lifecycle costs of sustainable infrastructure in general (OECD 2017)
Most of the investment is needed for energy and transport infrastructure ndash according to Bhattacharya (2019) US$39 trillion and US$2 trillion respectively Compared to the business-as-usual-scenario sustainable infrastructure investment will have to shift away from primary energy sources such as oil gas and coal and towards energy efficiency and low-carbon core infrastructure9 (NCE 2016)
ww
ww
orld
com
mer
cere
view
com
Currently sustainable infrastructure investments are falling short of the target by US$32 trillion per year or 21 of global GDP (Bhattacharya et al 2019) Local infrastructure will play a key role in this shift as we will discuss in the next chapter
3 Sustainable local infrastructureThe roll-out of low-carbon infrastructure within cities must be at the core of any sustainable development strategy G20 countries should avoid building new infrastructure that will become obsolete due to its incompatibility with
Table 2 Annual Infrastructure Investment Gap
Source Bruegel replication of table 1 from Bhattacharya et al (2019)
OECD Bhattacharya
Energy 27 39
Transport 27 20
Water and sanitation 09 09
Telecoms 06 10
Total 69 79
2015 USD trillion
ww
ww
orld
com
mer
cere
view
com
Existing foundations for future measures history of Infrastructure on the G20 agenda
The Italian G20 Presidencyrsquos focus on local sustainable infrastructure continues a decade-long history of infrastructure on the G20rsquos agenda Future action can build on the foundation of previous initiatives and principles and leverage existing capacities
Infrastructure first appeared on the G20rsquos agenda during the 2010 Korean Presidency when the G20 formally recognised the importance of infrastructure for economic growth (G20 2010) and outlined concrete measures in a Multi-Year Action plan aimed to address bottlenecks in infrastructure provision in low-income countries
Furthermore the G20 created a High-Level panel on Infrastructure to mobilise support for scaling up infrastructure financing and tasked MDBs with developing an action plan to increase infrastructure financing and improve project implementation
The panelrsquos report and the MDBsrsquo action plan were presented and endorsed by the G20 at the 2011 Cannes summit (G20 2011) Recommendations included creating an enabling investment environment in low-income countries through legal and regulatory reforms promoting capacities for bankable projects mitigating risks to increase the availability of long-term funding and expanding the role of MDBs in infrastructure financing Further measures along these recommendations were concluded at the 2012 Summit in Los Cabos under the Mexican Presidency
The 2013 Russia Presidency focused on the role of long-term financing in infrastructure development and took action to attract such investment in the G20 The St Petersburg Summit endorsed the working plan prepared
ww
ww
orld
com
mer
cere
view
com
by the G20 Study Group on Financing for Investment and the G20OECD High-Level Principles of Long-Term Investment Financing by Institutional Investors (G20 2013) and agreed on the implementation of a set of collective and country-specific actions
During the Australian Presidency in 2014 infrastructure became a G20 priority through the endorsement of the Global Infrastructure Initiative (GII) a multi-year programme to promote quality public and private infrastructure investment
The Group identified guidelines to identify prioritise plan and deliver infrastructure projects and established the Global Infrastructure Hub (GIH) a non-profit organization to support he G20 in the implementation of the GII and future infrastructure programmes
As part of this initiative the World Bank launched the Global Infrastructure Facility (GIF) a global platform that supports the identification high-quality preparation financial structuring and procurement of infrastructure projects in emerging markets and developing economies to enable private investment
The private sector was identified as a main stakeholder in mobilising investment in infrastructure (G20 2014) Private sector involvement remained the focus of the G20rsquos infrastructure strategy in 2015 The 2015 Antalya Summit developed guidelines and best practices for public-private-partnership (PPP) models as well as country-specific investment strategies to improve the investment ecosystem and foster long-term infrastructure investment
ww
ww
orld
com
mer
cere
view
com
The G20 further worked on toolkits to support countries better prepare prioritise and finance infrastructure projects (G20 2015)
During the Chinese Presidency in 2016 emphasis is placed on quality infrastructure investment and the role of MDBs within the infrastructure agenda Quality infrastructure investment aims to ensure economic efficiency in view of life-cycle cost safety resilience against natural disaster job creation capacity building and transfer of expertise and know-how on mutually agreed terms and conditions while addressing social and environmental impacts and aligning with economic and development strategies (G20 2016a)
The 2016 Hangzhou Summit encouraged the MDBs to scale up infrastructure investment attract private finance and strengthen project pipelines through better project preparation (G20 2016b)
Finally the G20 recognised the importance of infrastructure connectivity meaning the linkages of communities economies and nations through transport communications energy and water networks for achieving sustainable development and shared prosperity
To this end it endorsed the Global Infrastructure Connectivity Alliance (GICA) which aims to enhance the synergy and cooperation among various infrastructure connectivity programs in a holistic way
The 2018 Buenos Aires Summit once again focused on infrastructure for development and members reaffirmed their commitment to attract more private capital to fill the infrastructure investment gap (G20 2018)
ww
ww
orld
com
mer
cere
view
com
To achieve this the G20 endorsed the Roadmap to Infrastructure as an Asset Class and the G20 Principles for the Infrastructure Project Preparation and committed to take actions towards greater contractual standardization reducing data gaps and improving risk mitigation instruments
At the 2019 Osaka Summit the G20 established the G20 Principles on Quality Infrastructure as a common strategic direction Building on the G7 Ise-Shima Principles of Quality Infrastructure quality infrastructure investment should aim to maximise the impact of infrastructure on sustainable growth and development raise economic efficiency in view of life-cycle cost integrate environmental and social considerations contribute to building resilience against natural disasters and other risks and strengthen infrastructure governance (G20 2019)
Finally under the Saudi Arabian Presidency the G20 endorsed the Riyadh InfraTech Agenda which provides policy guidance to governmentsrsquo and international organizationsrsquo infrastructure technology strategy Infrastructure technology refers to the integration of material machine and digital technologies across the infrastructure lifecycle including in the design planning delivery and in the structures themselves
The Agenda endorsed at the 2020 Riyadh Summit aims to harness technology to deliver quality infrastructure investment promote inclusive accessible sustainable and affordable infrastructure in view of lifecycle costs mobilise private-sector financing and support the development of infrastructure as an asset class (G20 2020c)
ww
ww
orld
com
mer
cere
view
com
future sustainability goals and needs (lsquostranded assetsrsquo) Without sensible and sustainable infrastructure investment climate targets will be unattainable
At the same time global temperatures are already 1 degree Celsius above pre-industrial times and certain effects of climate change are inevitable Infrastructure planning must therefore consider not only mitigation of further GHG emissions but also adaptation to a changing environment
At least 55 of the global population are already living in infrastructure-dense urban areas (cities) Therefore the roll-out of sustainable infrastructure both to mitigate emissions and to adapt to a changing climate will be highly relevant for local communities
Countries and cities across the G20 differ in their climate income urban form and levels of industrial activity There exists therefore a wide variation in the type of low-carbon infrastructure that different cities could use to reduce emissions (Kennedy et al 2014)
For example colder cities will focus on building construction and renovation for maintaining heat while warmer cities will focus on urban design to avoid retaining heat or reducing building exposure to heat in the first place This report therefore identifies some general themes for low-carbon infrastructure
In the following section we will focus on several areas of local infrastructure investment that are key for reaching these goals shifting to a zero-carbon electricity (power) sector energy-efficient buildings zero-emission mobility digital infrastructure water and waste management as well as low-carbon construction materials
ww
ww
orld
com
mer
cere
view
com
These areas are selected to cover those proposed for sustainable infrastructure by Bhattacharya et al (2019) as well as due to their high contribution to global GHG emissions Together the sectors under focus account for over 40 of global GHG emissions10
31 Electricity sectorbull Stopping the deployment of new coal-fired power plants should be a priority for infrastructure investment A
significant co-benefit will be improved local air qualitybull Renewable electricity generation can be deployed in a decentralised manner allowing for local production
storage and usage of electricity increasing benefits for local economies This leads to both economic and health benefits
bull G20 infrastructure investment strategies in the electricity sector should focus upon enabling investments which incentivise further private investment
311 Electricity generationSecuring a reliable supply of decarbonised electricity is a fundamental building block for all G20 economies to comply with the goals of the Paris Agreement GHG emissions from electricity (power) generation accounted for 38 of total energy-related emissions in 2018 (IEA 2019)
Moreover the decarbonisation of many different end use sectors that currently rely upon alternative fuels lies in electrification For example electrification is seen as key for the decarbonisation of both the road transport and household heating sectors
Over the past few yearsrsquo investment has been significantly larger in solar and wind power compared to coal or gas power showing that the global power market is already moving in the right direction ndash albeit at too slow a pace11
ww
ww
orld
com
mer
cere
view
com
As Figure 5 shows solar photovoltaic (PV) was the electricity sector technology with the largest annual investment in 2019 with around US$140 billion a year The investment into solar PV is in fact larger than gas and coal power combined
For projects with low- cost financing which use high quality resources solar PV is already today the cheapest electricity source in history (IEA 2020a) and these costs are forecasted to continue decreasing
In spite of the aggregate global shift toward solar PV global coal-fired power capacity is set to increase further as certain countries continue to expand their coal-based energy production A 2019 report shows that G20 economies still provide at least $48 billion per year to support coal-fired power generation (Genccedilsuuml et al 2019)
G20 economies must urgently phase out government support to coal-fired power generation both home and abroad Higher costs of financing further impede the deployment of renewable power plants which are capital intensive relative to their fossil fuel counterparts
Many of the areas where coal-fired power plants are still being constructed are in developing regions where access to low-cost finance for the deployment of renewable power can be challenging A priority for the G20 should be ensuring the access to cheap capital for the deployment of renewable power generation across the world
Replacing existing coal-fired power plants with low-carbon power generation is more difficult than not building them in the first place Once built vested interests incumbents political opportunism and incumbent employment all create difficulties to shut down a coal-fired power plant
ww
ww
orld
com
mer
cere
view
com
Figure 5 Global Investment in the Power Sector by Technology 2017-2020
Source Bruegel on IEA (2020a)
350
300
250
200
150
100
50
0Electricity networks
Coal power Gas power Nuclear Solar PV Wind Other renewables
Battery storage
2017 2018 2019 2020
ww
ww
orld
com
mer
cere
view
com
Economically an already built coal plant is also more competitive when compared with newly built low-carbon power While best avoiding new coal power plant deployment G20 countries invested into coal must also begin to plan for the equitable phaseout (lsquojust transitionrsquo) from coal power generation
312 Local and smarter electricity gridsThe shift from fossil fuel to renewable power generation holds a significant side-effect which is the shift toward democratisation of energy Over the past 15 years a variety of schemes in G20 countries particularly in Europe have incentivised consumers to purchase their own solar panels12
This helped created a worldwide market for household solar PV Households who invest in their own electricity generation can enjoy significant economic savings on energy bills
Community schemes which allow groups of households to invest together into small solar or wind plants have also grown in number Such schemes have the benefit of allowing many households within a community to come together and act as a larger economic agent investing into larger clean power plants and sharing the economic and energy benefits
The costs are also likely to be lower on average than single household PV (Lazard 2020) This distributed power generation has the important co-benefits of democratising energy empowering citizens to feel a part of the energy transition and potentially positive network spill over effects whereby neighbours adopt solar panels
Household- or community-level deployment of renewable electricity generation involves private investment into infrastructure which provides a public good namely the mitigation of GHG emissions and perhaps more
ww
ww
orld
com
mer
cere
view
com
importantly for a local community the mitigation of local air pollutants that are harmful to human health Schemes to encourage the growth of such private agent behaviour are attractive options
Local authorities might consider further subsidy schemes or feed-in tariffs to accelerate the adoption of household solar PV However this is an expensive (and regressive) policy and the price of solar PV has already been driven significantly down
A more sensible approach would involve the redesign of electricity markets to allow households to receive fair compensation for the electricity they provide to the grid An example of this would be the trade of electricity between households at a local level13 another example is mechanisms designed to encourage flexible household electricity demand depending on current market conditions14
Such a market mechanism if well-designed should incentivise private investment into local renewable power generation with the important co-benefit of creating a local shared community spirit of renewable energy
Moreover in many developing economies grid infrastructure has not yet been built to reach all of the population Here decentralised renewable electricity generation is an attractive option for providing much-needed electricity to households and communities in rural or other areas without main grid connections
313 Enabling infrastructure investmentIn addition to facilitating the shift in investment toward low-carbon power generation an equally important challenge for G20 countries lies in future-proofing the electricity grids of today Significant investments are required to upgrade grids for the challenges they will face These arise both on the supply and demand side
ww
ww
orld
com
mer
cere
view
com
On the supply side the challenge will be to successfully incorporate increasing shares of intermittent renewable electricity generation Grids have traditionally comprised a few central generation units which ramp production up and down to distribute power to multiple homogenous end users
The drop in the costs of solar PV has changed this dynamic It is now possible for households or firms to purchase solar panels place them on their roof and generate their own electricity
The electricity grid is being forced to adapt toward a situation in which power is being fed into the grid from an ever-growing number of sources with non-constant supply
On the demand side in countries that pursue electrification of non-traditionally electrically-powered sectors there will be additional strains placed on power grids
This is particularly relevant with the electrification of transport the charging of large fleets of electric vehicles will put substantial new loads on electricity grids
Sensible infrastructure projects should prepare electricity grids for this twin challenge Grids must be reinforced and strengthened in particular areas whilst the implementation of digital technologies will facilitate smarter grids which are better able to balance fluctuating supply and demand
The ability of demand response ie rapidly adjusting power demand to accommodate shifts in supply is one of the most commonly discussed options for integrating higher shares of renewables into power grids Rapid fluctuations in demand will only be possible with sophisticated digital infrastructure
ww
ww
orld
com
mer
cere
view
com
The roll-out of smart meters allowing for accurate monitoring of electricity demand on a minute-by-minute basis is an important precursor to a flexible demand-side Smart charging of electric vehicles altering demand to match supply is also an important overlap into mobility infrastructure
This may further include vehicle-to-grid technologies whereby plugged-in electric vehicles are able to supply electricity to the grid at times of high demand effectively acting as a large battery for managing grid fluctuations
Further incentives to develop solutions for the intermittency of renewables will be required A commonly discussed option is batteries Figure 5 shows that in comparison with traditional power generation investments into battery storage technology are still relatively small Batteries and similar technologies for accommodating renewable power generation will become increasingly imperative infrastructure investments over the coming years
Cities must evolve to become smarter producers and consumers of renewable electricity Doing so requires significant upfront infrastructure investments The size of infrastructure investments required in electricity grids is extremely large
G20 countries should therefore focus their strategy upon enabling investments which hold a high investment multiplier ndash their provision and expansion will attract private capital investment into other sections of the grid
32 Buildings and climate resiliencebull Buildings are an inherently local infrastructure responsible for significant GHG emissions While for many G20
countries the challenge lies in redesigning buildings to lower levels of GHG emissions developing countries are focussed on building new stock
bull For G20 countries energy efficiency infrastructure should be deployed which is able to reduce the energy
ww
ww
orld
com
mer
cere
view
com
Fossil fuel subsidies
Within G20 countries fossil fuel subsidies are a problem much broader than coal-fired power generation A failure to shift away from these subsidies undermines commitments to sustainability goals whether they be under infrastructure or not G20 leaders have recognised this fact and repeatedly pledged to remove fossil fuel support
However G20 governments provided $584 billion annually to the production and consumption of fossil fuels at home and abroad (2017-2019 average) (IISD 2020b) This is down 9 from 2014-2016 values On aggregate G20 countries have doubled down on support to fossil fuel industries in response to the COVID-19 pandemic
IISD (2020b) helpfully distinguish five different forms of government support for fossil fuels These include direct budget transfers (through spending on RampD fossil fuel exploration for example) tax expenditures (such as tax breaks) price support (artificially lowering the market price for fossil fuels) public finance (loans and guarantees) and state-owned enterprise investments
The breakdown of both type of mechanism as well as by fossil fuel related activity is shown in Figure The majority of support for fossil fuels came through price support and State-Owned Enterprises (SOEs) investments and most of it went to oil and gas production
While not all of these support measures would technically fall under the definition of a subsidy by the World Trade Agreement on Subsidies and Countervailing Measures agreement direct budget transfers price support and tax expenditures do
ww
ww
orld
com
mer
cere
view
com
Figure 6 Fossil Fuel Subsidies in the G20
Source IISD (2020b)
Under this definition around $280 billion annually is used by G20 economies to artificially support the competitiveness of fossil fuels Simply removing these economically inefficient subsidies would have significant environmental benefits as well as sending a powerful signal to markets
Other forms of subsidies such as SOEs may be more difficult to address but should still be high on the agenda for any G20 nation looking toward a sustainable infrastructure agenda Efforts by central government to remove inefficient subsidies will make it easier for local governments to pursue a sustainable infrastructure agenda
SOE investment
Price support
Tax expenditures
Public nance
Direct budget
Oil and gas
Fossil fuel use
Fossil fuel-base
Coal production
Tota
l gov
ernm
ent
supp
ort
USD
bill
ions
G20 government support bytype of mechanism
G20 government support byfossil fuel related activity
257 277
168
126
172
79
51
25
ww
ww
orld
com
mer
cere
view
com
consumption of residential and commercial buildings Construction and renovation are a labour-intensive process and well suited for government spending with the intention of job creation
bull Concentrations of GHGs in the earthrsquos atmosphere already guarantee a rapidly changing climate The effects of this can be highly adverse and infrastructure planning particularly for buildings should consider the increased risk of adverse climate events
Buildings are an inherently local infrastructure clearly affecting the communities which live sleep and work within them Buildings are also responsible for a large share of GHG emissions
For many G20 countries the challenge lies in redesigning buildings to reduce their emissions while for developing economies with expanding populations and cities the challenge is to build in a sustainable manner to begin with
At the same time countries around the world must recognise the fact of a changing climate and the need for buildings to adapt to this
321 Reducing GHG emissions from buildingsEnergy usage in buildings today accounts for 18 of global GHG emissions (Our World in Data) Reducing energy demand from residential and commercial buildings is a priority area for green public investment
Energy efficiency measures can greatly reduce building energy demand for cooking space and water heating and cooling as well as for electrical appliances While certain efficiency gains are likely to be driven by public policy and regulation there is an important role for low-carbon infrastructure Namely the renovation of existing buildings to higher standards of energy efficiency through measures such as replacing loftwall insulation and replacing windows with double glazing
ww
ww
orld
com
mer
cere
view
com
Estimates by the Coalition for Urban Transitions (2019) show that building heating and cooling efficiency could lead to global abatement of 144 Gt CO2 from urban environment by 2050
The renovation of buildings toward higher energy efficiency standards is a highly labour-intensive task Rollouts of renovation infrastructure programmes therefore appear timely as governments respond to the fallout from the COVID-19 economic crisis particularly looking for investments with high returns in terms of jobs created per dollar spent
Beyond energy efficiency fossil fuels are still the largest global source for household heating There are a variety of options for decarbonising household heating but G20 countries today should begin sending clear market signals that the future of household heating will be through a non-carbon route
Infrastructure investments must begin here today if they are to be scaled in time to meet Paris Agreement commitments
322 Preventing emission lock in for developing economiesIn many parts of the world the construction of urban housing has not kept pace with population growth and internal migration towards cities From a GHG perspective developing countries face a different situation whereby the challenge lies more in rolling-out new sustainable housing rather than retrofitting existing housing to be sustainable
For example in sub-Saharan Africa 55 of the population still live in slums (Figure 7) To achieve the Sustainable Development Goals a clear first step is building housing which provides the necessary basic amenities for healthy living clean water clean cooking facilities clean heatingcooling equipment clean lighting
ww
ww
orld
com
mer
cere
view
com
Careful planning is also necessary for facilitating rapid migration into cities to avoid issues such as population build-up in areas vulnerable to hydro-geological hazards or expansion of cities with a lack of green spaces
In the context of developing economies the design of buildings that are low in GHG-emissions is just one among many (at least locally more) urgent considerations Developed economies have more capacity to place GHG-considerations higher up the policy agenda when considering the roll-out of new urban infrastructure
There is therefore a risk that developing countries will under-invest into the required steps for low GHG emission buildings instead building out large new cities that will become responsible for growing shares of the global GHG emissions
Here there is a role for the G20 to play in providing financial means to encourage the build out of sustainable infrastructure in developing economies from the beginning
323 Building sensibly for a changing climateMitigation of future greenhouse gas emissions must be central to the debate on sustainable infrastructure Unfortunately the existing concentration of GHG emissions in the atmosphere is sufficient to cause adverse climate related events
Substantial investments will be required to create sustainable and resilient cities and support adaptation to climate change The UCCRN Technical Report (2018) offers an exploratory analysis on the likely magnitude of these adverse events including heat extremes water availability food security and sea level rise
ww
ww
orld
com
mer
cere
view
com
Figure 7 Share of the Urban Population Living in Slums
Source Bruegel based on United Nations Global SDG Database
70
60
50
40
30
20
10
0Australia and New Zealand
Europe and Northern Amercia
Latin America and the
Caribbean
World Northern Africa and Western
Asia
Eastern and South
Easern Asia
Central and Southern
Asia
Sub-Saharan Africa
2000 2014 2016 2018
ww
ww
orld
com
mer
cere
view
com
The report is focussed upon adverse climate effects within cities One key finding is that by 2050 over 16 billion people living in more than 970 cities will face extreme heat of over 35 degrees Celsius for 3 consecutive months
At the same time over 800 million people from 570 coastal cities will be at risk of flooding due to at least 05 metres of sea level rise Declines in the national yields of major crops and a decrease in the availability of freshwater will also affect millions of G20 citizens
Different cities will face different challenges in adapting to climate change The common theme is that urban planning and infrastructure deployment must be always evaluated against the likely climate change impacts of the area over the coming decades There is a growing scientific literature offering evidence and advice on this
33 Mobilitybull A shift away from the internal combustion engine is necessarybull Transitions may occur toward cleaner vehicles or more systematic solutions would see a modal shift away
from private road transport and toward walking cycling and public transportbull Through either route infrastructure requirements are large
Mobility within cities must change significantly in order to meet goals of the Paris Agreement A modal shift away from the dominant combination of private and polluting vehicles will be required Different routes may be taken to achieve this
A technological route sees little consumer change as internal combustion engine automobiles are replaced with electric and other low-carbon vehicles Other routes may see more significant shifts in consumer behaviours with increased acceptance of public transport and walkingcycling in place of private automobile journeys
ww
ww
orld
com
mer
cere
view
com
Regardless of the route taken by individual cities infrastructure will be key For example under scenarios with little behavioural change an accelerated roll-out of electric charging infrastructure will be required to allow the transformation of most of the global vehicle fleet away from the internal combustion engine and toward electric vehicles by 2050
Alternative strategies with increased behavioural change will require investments into public transport and walkingcycling infrastructure In particular investments into city and walkingcycling infrastructure are low in most countries
Increasing the share of citizens travelling by foot or bike reduces GHG emissions and has alternative co-benefits of exercise leading to a healthier population reduced air pollution and reduced noise pollution see Figure 8
Public transport infrastructure in most parts of the world needs to be significantly improved such that it more efficiently competes with the automobile for a door-to-door journey15 This is a problem as many cities still lack effective schemes for integrating long and short distance transport means
A modal shift from road to rail will also require investment into high-speed rail Improving rail connections has been shown to increase demand For example when China connected the isolated Zhengzhou-Xi line in 2012 to the Beijing High Speed Rail network passenger volume increased by 43 (Lawrence et al 2019)
The adoption of multi-modal solutions to effectively integrate the lsquolast milersquo within public transport networks requires systems innovation and infrastructure
ww
ww
orld
com
mer
cere
view
com
Figure 8 Concentration of Fine Particles in Cities in the G20
Note the figure shows mean annual concentration of fine suspended particles where the mean is a population-weighted average for urban population in a countrySource UN Global SDG Database for 2016
100908070605040302010
0
Cana
da
Aust
ralia
USA U
K
Arg
entin
a
Braz
il
Japa
n
Ger
man
y
Fran
ce
Euro
pe
Russ
ian
Fede
ratio
n
Italy
Indo
nesi
a
Mex
ico
Sout
h A
fric
a
Sout
h Ko
rea
Turk
ey
Chin
a
Indi
a
Saud
i Ara
bia
μgm
sup3
ww
ww
orld
com
mer
cere
view
com
For example in 2015 the Metropolitan Atlanta Rapid Transit Authority (MARTA) announced a partnership with Uber whereby MARTA public transport users can directly link to Uber from the app and request an Uber which will be waiting when the passenger arrives Such lsquosmart cityrsquo solutions to transport require adequate telecommunication networks
In the next section we will look at such digital infrastructure
34 Digital Infrastructurebull Digital infrastructure is key for achieving SDGsbull Access to high-speed internet is an important prerequisite for the effective integration of firms and workers
into the global economy and increasingly for citizens into local communities
An increasingly important part of connecting local communities with the global economy is digital connectiveness Investment into digital infrastructure is important for sustainable development
Indeed target 9c of the SDGs is to significantly increase access to ICT technology and to strive to provide universal and affordable access to the internet globally
The COVID-19 pandemic has further illustrated the importance of digital technologies not least with regards to achieving other SDG targets involving education decent work and economic growth as well as gender equality
Access to reliable internet is increasingly becoming a prerequisite for both workers and firms to participate in the global economy and for citizens to participate in local or global communities
ww
ww
orld
com
mer
cere
view
com
A UNCTAD (2017) report lays out key areas for digital infrastructure investment The report breaks down investment needs for internet availability into three areas where there is no coverage where there is cellular coverage and where cellular coverage has been upgraded to broadband
For different countries investment needs will differ by the share of these three regions For some countries investment needs will be substantial to roll-out out internet infrastructure to current areas of no coverage characterised by high deployment costs andor low demand
For other countries mostly G20 countries where universal cellular connection is already established the challenge is one of upgrading the technology
Infrastructure to improve the speed of internet connection will also have positive economic effects Figure 9 shows the scale of this challenge across different G20 countries The figure refers to subscriptions to the public internet at downstream speeds equal to or greater than 256 kbits
Beyond internet access G20 countries should also look to pursue policies which enable private investment into digital firms as well as encouraging digital adoption by traditionally non-digital firms where appropriate Digitalisation offers significant development opportunities in terms of employment and by facilitating new and more efficient business models
Mobile banking as one example has provided affordable access to many individuals in situations with difficult access to conventional banking systems Encouraging investments into telemedicine online retail online payments are other examples of likely desirable digital infrastructure policy objectives
ww
ww
orld
com
mer
cere
view
com
Figure 9 Share of Population with a Fixed Broadband Subscription in G20 Countries
Source Bruegel based on World Development Indicators EU data for 2018 all other data 2019
50454035
2530
201510
50
Indi
a
Sout
h A
fric
a
Indo
nesi
a
Mex
ico
Braz
il
Turk
ey
Arg
entin
a
Saud
i Ara
bia
Russ
ian
Fede
ratio
n
Italy
Chin
a
Japa
n EU
Aust
ralia U
S
UK
Cana
da
Ger
man
y
Sout
h Ko
rea
Fran
ce
Perc
ent
ww
ww
orld
com
mer
cere
view
com
The application of digital technologies to infrastructure described by the G20 InfraTech Agenda16 as ldquothe integration of material machine and digital technologies across the infrastructure lifecyclerdquo will also play a major role in the transition to low- and eventually zero-carbon economies As a cross-cutting technology it has the potential to increase efficiency and reduce emissions in many crucial infrastructure systems
One example discussed above is the digitalisation of electricity grids facilitating more efficient accommodation of renewable electricity sources Importantly digital infrastructure also allows environmental data collection sharing and analysis which can be a major mitigating factor of climate change17
35 Waste and water managementbull Waste and water management processes contribute significantly to global GHG emissions Moreover their
effective design is essential for shifting toward a more circular economybull Sensible water policies will become increasingly important over the next decades with the effects of climate
change
Waste and water management both directly affect local communities In certain regions the burning of waste releases toxic gases which contribute toward air pollution
Moreover waste which is not properly disposed of can lead to land or water pollution Securing a fresh water supply to local citizens is a growing problem exasperated by the effects of climate change Beyond local issues the treatment of solid and water waste contributes a significant share of global GHG emissions estimated at 2 and 1 respectively18
ww
ww
orld
com
mer
cere
view
com
351 Solid wasteWaste management must be considered central to sustainability goals The current model of extracting natural resources consuming them and then disposing a large proportion in the form of useless waste is by definition unsustainable
G20 governments should pursue plans to shift toward the circular economy and zero waste societies To illustrate the scale of the problem data from the US show that 50 of municipal solid waste ended up in landfill in 201819
It is acknowledged that the lack of effective solid waste management as well as unsustainable production and consumption patterns are key to the problem
From an infrastructure perspective efforts can be made to improve recycling capacity This might involve expanding the institutional and logistics chain to better involve consumers in the separation of waste into recyclable components as well as increasing final capacity for recycling
Another infrastructure option would be increasing capacity to generate useful energy from solid waste or capturing fugitive emissions from landfills Such projects should be viewed as a complement to first reducing the volume of waste ending up in landfills in the first place
352 WaterAs of 2015 21 billion people lacked access to safely managed drinking water services (WHO and UNICEF 2017) Difficulties in accessing freshwater are set to increase with the effects of climate change Policy design and infrastructure should focus on managing water resources well in order to maximise human welfare
ww
ww
orld
com
mer
cere
view
com
On a local level infrastructure requirements in many countries will be dominated by the need to adapt to a changing climate and provide a secure supply of freshwater
There exists a substantial gap between current financing and required needs for water infrastructure OECD (2018) outlines some key reasons for this water is generally an under-valued resource water infrastructure is capital intensive with high sunk costs and its benefits are of both private and public nature making it hard to monetise
The capacity to treat and clean wastewater also needs to be expanded in many regions of the world United Nations (2017) estimates that high-income countries treat about 70 of the wastewater they generate but this drops to 8 for low-income countries
Globally over 80 of all wastewater is discharged without any treatment which contributes to the spread of water-borne diseases A key challenge is rolling out further global wastewater treatment infrastructure capacities and best practices
Wastewater treatment plants themselves are also responsible for significant GHG emissions Options should be explored for decarbonising this process There are also substantial improvements necessary regarding the effective treatment of water run-off from industry and agriculture
36 Industrial materialsbull Building infrastructure is a resource and greenhouse gas intensive process responsible for 11 of global
GHG emissions20bull Beyond building the infrastructure needed for a low-carbon economy the construction of the infrastructure
itself must become sustainable
ww
ww
orld
com
mer
cere
view
com
bull The G20 should support the commercialisation of low emission technologies for the production of materials used in infrastructure development by creating lead markets
Building construction itself accounts for 11 of global GHG emissions (Our World in Data) Before any infrastructure strategy can be deemed truly sustainable the materials used to build with must first be sustainable
Instead there is significant carbon embedded in the infrastructure projects of the past and without swift action at the G20 level this will continue to be the case for almost all infrastructure projects in the future
An important aspect is therefore developing low-carbon technologies for some of the key elements used in manufacturing and construction process namely steel aluminium and cement All three have proved difficult to decarbonise and still contribute significantly to GHG emissions
Infrastructure lock-in in the form of carbon-intensive production capacity for each of these sectors is a problem At current trends it is likely that many G20 economies will have to decommission and replace todayrsquos fossil fuel intensive production facilities with low-carbon production facilities of the future
While carbon neutral technologies are currently not competitive in prices the G20 could create markets through public procurement and subsidies that would incentivise investment into research and development of these technologies
Steel is fundamental to modern life being used widely in infrastructure ships trains cars and machines Steel also has important uses cases for the transition toward low-carbon economies in electric vehicles and wind turbines
ww
ww
orld
com
mer
cere
view
com
Aluminium is used for infrastructure transportation vehicles electrical conductors and consumer goods such as packaging It has a high strength to weight ratio great flexibility and is infinitely recyclable which makes it an attractive material Cement is used to make concrete which is a vital building block for infrastructure
Current methods for the production of steel aluminium and cement are both energy and GHG intensive Estimates suggest that the production of steel aluminium and cement account for approximately 7 2 and 4 of global GHG emissions respectively21
To meet sustainable development scenarios it is imperative to reduce the carbon emissions associated with the production of these key industrial materials
In all cases some energy and material efficiency gains may be made and end-use cases may undergo some substitution toward less carbon-intensive materials Increased recycling can also play a key role
However it will still be essential to redesign current carbon-intensive production methodologies This may involve shifting to new primary production technologies the consumption of different fuels for energy provision or the adoption of carbon capture and storage technologies
OECD (2019) identify some of the key barriers which have so far prevented low-carbon innovation and deployment in these sectors First steel and cement plants operate with low profit margins in competitive markets
This has led to fears of carbon leakage and in emissions trading programs such as the EU ETS the sectors have consequently received a large share of free allowances As a consequence innovation in the heavy industrial sectors has remained muted
ww
ww
orld
com
mer
cere
view
com
Secondly heavy industry plants operate at very long timescales They can last for between 25 and 50 years Much new capacity is being built in developing economies while developed economies already enjoy an oversupply of production capacity Moreover there has so far been no serious attempts to create demand for low-carbon heavy industrial materials (OECD 2018)
Reducing carbon emissions from heavy industry sectors can be viewed from a supply and demand perspective From a demand perspective policy tools should be used to increase material efficiency (ie using less material to achieve the same result) and encourage material recycling From a supply perspective the challenge is to support low-carbon alternatives
Given the long lifecycles of heavy industry plants to meet targets of the Paris Agreement low-carbon technologies should already be commercialised by the mid-2030s It is therefore of fundamental importance for G20 countries to create lead markets and demand for low-carbon steel cement and aluminium
A variety of options can be followed by G20 governments to decarbonise these sectors One option is green public procurement where governments purchase only low-carbon construction materials or commit to targets for procurement of low-carbon materials in the future Other options are regulations to impose a minimum percentage share of low-carbon materials in any construction project
Carbon pricing is conventionally seen as driving low-carbon deployment In construction materials the problem is that globally carbon prices that exist do not reach the levels required to sufficiently incentivise low-carbon production
ww
ww
orld
com
mer
cere
view
com
Carbon contracts for difference are an option for artificially increasing the carbon price for certain sectors for a period of time Here a government guarantees a certain carbon price to eg the steel sector and pays a steel producer the difference between the existing carbon price and a higher promised carbon price for every tonne of carbon abated
Such a scheme would be implemented for a few years until the price of low-carbon production was driven down to levels whereby a conventional carbon tax can stimulate further demand
G20 action is vital for the deployment of the technologies for low-carbon production in these sectors Without its leadership in promoting green industrial materials infrastructure construction will continue being carbon intensive Infrastructure projects designed for the abatement of GHG emissions or adaption to a changing climate will continue to further exasperate the issue at hand
Successful policy design should allow G20 countries to drive down costs in a manner similar to that in which European lead markets drove down costs for solar and wind power generation in the 2000s As costs are driven down it will also become increasingly feasible to bring other global actors on board
4 Financing sustainable local infrastructurebull Strained public budgets are unable to finance the massive sustainable infrastructure gap but private sector
investment falls short of the needs due to inherent complexities and risks of infrastructure projectsbull Local governments face unique challenges in financing infrastructure due to complex decision-making
structures limited access to funding and technical assistance and the lack of capacity to structure projects for private investment
ww
ww
orld
com
mer
cere
view
com
bull Development financing institutions should expand their services to local communities by providing funding and technical assistance to small-scale projects and to crowd-in private financing
bull Pervasive structural budget overruns and project delays in the infrastructure sector must be addressed by national governments to increase private sector investment
Traditionally infrastructure and the services it provides are managed by the public sector For many types of infrastructure governments are the best-suited providers As a result of a global decentralisation trend in the public sector today municipalities are frequently in charge of selecting and managing infrastructure implementation (Merk et al 2012)
Furthermore national climate plans are often implemented through local action In most G20 countries over 50 of investments in infrastructure are made by local governments In OECD countries more than 60 of climate-smart investments are made at the local level
To close the multi-trillion-dollar sustainable infrastructure gap discussed in Section 2 which resulted from years of global underinvestment new sources of financing have to be found This is especially true for low- and middle-income countries whose public budgets are already stretched thin in the wake of the COVID-19 pandemic
Prohibitively high capital costs often make it impossible to afford the high upfront investments many infrastructure projects require Hence there is widespread agreement among policymakers researchers and climate activists that the infrastructure gap can only be closed with significant private sector investment (Bhattacharya et al 2019 Grimm and Boukerche 2020)
ww
ww
orld
com
mer
cere
view
com
This will enable governments to allocate scarce public funds more efficiently The current financial market environment represents an opportunity for sustainable infrastructure investment in developing and emerging economies by the private sector the combination of excess savings and low interest rates in advanced economies with high foreign investment needs and returns in the emerging economies and developing countries is an ideal setting for more efficient capital allocation
Most countries are unable to translate the tremendous needs and opportunities for sustainable infrastructure into realised demand and a significant proportion of investment is not as sustainable as it should be
One good example is FDI flows Global FDI flows to advanced as well as emerging and developing economies are dominated by the G20rsquos investments Bhattacharya et al (2019) analyse these capital flows between 2011 and 2017 with respect to their sustainability Only 11 of the US$4 trillion foreign investment by G20 countries was channelled into sustainable infrastructure
As Figure 10 shows low- and lower-middle income countries make up a disproportionately low share of recipients relative to their investment needs Similarly when considering the type of infrastructure that is being funded the vast majority flows into the energy sector
Local infrastructure such as water waste and transport represent an almost negligible share of the G20rsquos FDI in sustainable infrastructure in emerging markets and developing countries It appears that capital does not flow where it is needed most This is due largely to the inherent complexities of local green infrastructure development
This firstly relates to funding In general cities rely on transfers of federal funds or on reallocation of existing municipal budgets to fund investments in local green infrastructure But local governments face unique barriers
ww
ww
orld
com
mer
cere
view
com
Figure 10 Distribution of Sustainable Infrastructure FDI from G20 Countries to EMDCs by Income Level of Recipient 2011-2017 in USD Billion
Source Bruegel based on Bhattacharya et al (2019)22
140
120
100
80
60
40
20
0High income Upper middle income Lower middle income Low income
Waste Transport Water Energy
ww
ww
orld
com
mer
cere
view
com
in accessing private finance and the ability to do so varies substantially with their size political autonomy and institutional capacity
Ivanyna and Shah (2012) show that only 16 of countries authorise regional authorities to set local tax rates independently More so the majority of national governments either forbid or heavily restrict local authoritiesrsquo ability to raise money from capital markets and prohibit them from issuing municipal bonds (Ivanyna and Shah 2012)
Among those that are in theory able to issue debt many have no or very low ratings on credit markets especially in lower income countries (Carter and Boukerche 2020)
A second major barrier to local infrastructure investment is the lack of investment opportunities of sufficient quality and appropriate size This includes both the lack of investible projects and the challenge of matching them with the suitable financier
Much infrastructure does not generate direct and quantifiable returns In many cases its aim is to expand the accessibility to the service it provides to the largest possible number of citizens Even if there are monetary profits they are generated gradually over long-time horizons
Similarly one source of private financing that has received a lot of attention in the recent policy discussion are institutional investors The capital pool managed by such institutional investors in the OECD alone amounts to US$100 trillion which would be more than enough to close the sustainable infrastructure gap (Grimm and Boukerche 2020)
ww
ww
orld
com
mer
cere
view
com
However local infrastructure projects are usually too small for institutional investors A study by the C40 Cities Finance Facility found that 45 of municipal infrastructure projects are smaller than $10 million (C40 2018)
Therefore it is crucial that the source of funding and the specific infrastructure project are efficiently matched The missing lsquopipeline of projectsrsquo is a recognised obstacle to infrastructure investment at all scales and sectors (Bhattacharya et al 2019) but is exacerbated at lower levels of governments
Most local administrations do not have the resources nor the expertise to identify design and structure sustainable projects that could attract private investors
Climate-related investments also frequently require technical feasibility and impact studies which municipalities are unable to afford (Carter and Boukerche 2020) Access to external concessional finance for project preparation is scarce at the local level
A final obstacle to private sector investment in local green infrastructure is risk Projects are generally long-term and entail substantial and costly planning preparation and construction phases with no monetary returns for years Cost overruns and delays are pervasive in the infrastructure sector
Municipal infrastructure projects face additional bureaucratic hurdles due to often complex and opaque decision-making structures between regional and higher-level governments Due to their cross-cutting impact infrastructure projects require the involvement of many diverse stakeholders and a substantial fraction of the funding needs to be paid upfront
ww
ww
orld
com
mer
cere
view
com
This cost structure is exacerbated in sustainable infrastructure where upfront costs tend to be 5-10 higher while operating and maintenance costs are lower (Bouton et al 2015) In addition due to the time-dimension there is substantial uncertainty related to future regulatory economic technological and political developments which is compounded in local projects as regional governmentsrsquo influence on national strategies is limited
Finally positive and negative externalities of infrastructure must be assessed and quantified For example a desired if long-term outcome of investments in green infrastructure is the positive environmental impact and other collective social benefits But these positive externalities are difficult to quantify in terms of revenue or returns on investment (Carter and Boukerche 2020)
In other words the lack of appropriate carbon prices makes it impossible to incorporate the negative environmental effects of high-carbon infrastructure into investment opportunities All this makes green local infrastructure inherently risky for investors
Local governmentsrsquo room for manoeuvring these difficulties is relatively scarce However they can attempt to strategize their revenue system Urban administrations are advantaged with respect to their revenue system because the infrastructure sectors with the highest lsquogreeningrsquo potential such as buildings (energy efficiency) transport (public transport roads electric vehicle charging stations) water and waste are the sources of a substantial share of citiesrsquo revenues
By setting transport and parking fees utility charges and possibly property taxes accordingly local governments are in a unique position to lsquogreenrsquo their revenues by incentivising a more sustainable use of existing resources as well as the transition towards more climate-smart infrastructure (Merk et al 2012)
ww
ww
orld
com
mer
cere
view
com
The purpose of this policy is not to gather additional earnings On the contrary if higher parking fees lead to reduced downtown car traffic revenues may even decline Instead it can encourage a shift in the local communitiesrsquo infrastructure use from dirtier to more sustainable alternatives
The following sections will expand on the role that development finance institutions and national governments can play in alleviating barriers and crowding-in private investment in local sustainable infrastructure Finally we discuss the widespread occurrence of cost overlays and construction delays and non-completion of infrastructure projects
41 Mobilising private funding for sustainable local infrastructure the role DFIsNational and international development banks (henceforth summarised under the term development finance institutions or DFIs) will play a critical role in filling the global infrastructure gap particularly but not only in low- and middle-income countries
Backed by the strong credit ratings of their members DFIs are able to borrow cheaply from capital markets and thereby bring down the cost of finance for their debtors According to World Bank estimates emerging market and low-income economies alone require annual investments of approximately US$15-27 trillion in sustainable infrastructure until 2030 in order to achieve the SDGs and meet a 2degC climate target (Rozenberg and Fay 2019)
As Table 3 shows annual investments in sustainable infrastructure in EMDEs by multilateral and national development banks and G20 FDI combined accounted only for US$1548 billion between 2011 and 2017
A recent study suggests that MDBs could substantially increase their lending headroom while maintaining their excellent credit ratings (Munir and Gallagher 2018) Specifically depending on the scenario considered lending capacity could be increased by between US$598 billion and 19 trillion
ww
ww
orld
com
mer
cere
view
com
While this is noteworthy it is clear that financing the trillion-dollar yearly gap is well beyond the direct capacity of DFIs Instead the primary role of DFIs should shift from providing funding themselves to catalysing private sector investments
The true power of DFIs lies in their project expertise which enables them to fill two crucial gaps in the local sustainable infrastructure investment system risk mitigation and project supply
Thanks to their expertise DFIs are in the ideal position to assess and ensure appropriate risk sharing among participating investors As explained above many factors make local climate-smart infrastructure projects relatively unattractive for private investors
In addition for investments in emerging markets and low-income countries risks such as inflation currency fluctuation and convertibility or expropriation are also present
Table 3 Sustainable Infrastructure Investments in EMDCs by Source of Financing
Source Bruegel replication of Table 2 in Bhattacharya et al (2019)
Total (USD billion) Annual (USD billion) Share of EMDC need Share of global need
MDBs 180 257 12 03
NDBs 621 888 42 12
G20 FDI 282 403 19 05
Total 1083 1548 74 20
ww
ww
orld
com
mer
cere
view
com
Thanks to their longstanding experience of successfully lending to and implementing projects in high-risk contexts DFIs are adept at negotiating with stakeholders managing risks and monitoring and measuring project impact
Their past relationships with governments reduce political and operational risks of investments and MDBs have a proven track record of serving as intermediaries between developing countries and investors (Mohieldin et al 2018)
DFIs should increase their participation in blended finance structures for private sector investment while continuing to engage in institutional strengthening and capacity building and bolstering the fundament of market-oriented growth in the receiving countries
The second major barrier to be addressed is the lack of investible projects This is akin to supporting the demand side of infrastructure financing
By providing technical assistance along all stages of preparation from project identification over feasibility studies to matching with investors DFIs can contribute to a reliable supply of high-quality local sustainable infrastructure investment opportunities This would not only increase the projectsrsquo quality but also build local capacities and transfer knowledge to municipalities
For this to have an impact on local infrastructure it is crucial that DFIs expand their services to lower level of governments While DFIs are already an important source of funding for urban and sustainable infrastructure for example through the Global Environment Facility the Green Climate Fund and the Adaptation Fund (Carter and Boukerche 2020) they generally work at the national level
ww
ww
orld
com
mer
cere
view
com
This means that the financing provided in the above-mentioned facilities must be accessed through the national government which increases coordination needs and bureaucratic load (Alexander et al 2019)
DFIs should cooperate with the G20rsquos Global Infrastructure Facility (GIF) which was established precisely for that purpose and has experience in providing technical assistance to local governments and municipalities in infrastructure project design and structuring in order to attract private sector investment
The World Bankrsquos City Creditworthiness Initiative (World Bank 2018) is another great step towards this goal The program aims to improve municipalitiesrsquo access to financing for sustainable infrastructure by improving their creditworthiness
To this end the initiative provides a capacity-building lsquoacademyrsquo and a technical assistance program to enhance citiesrsquo ability to attract structure and manage private financing
42 Mobilising private funding for sustainable local infrastructure the role of national governmentsNational governments play a central role in crowding-in private sector investment in local green infrastructure Their main responsibility is to ensure a supportive and enabling investment environment for sustainable local infrastructure
Naturally this means addressing macroeconomic barriers to private-sector investment such as inflation or currency convertibility But increasing transparency in terms of climate intentions is also crucial The central government must be the leader in greening infrastructure investment
ww
ww
orld
com
mer
cere
view
com
This entails aligning national policies and regulatory frameworks with national climate commitments thereby sending clear signals to markets about infrastructure investment intentions Revising assessment frameworks environmental regulations and infrastructure standards at the national level to reflect sustainability goals facilitates their implementation for local governments
At the same time central governments could increase municipalitiesrsquo autonomy over their revenue systems in order to increase their room for policy action Eventually they should reassess and revise their institutional framework for municipal financing to ensure efficient allocation of resources while maintaining financial sustainability
In addition central governments must invest in administrative capacity-building This should also include increased coordination among higher and lower levels of government as well as transparent distribution of responsibilities
43 Infrastructure project performanceIn order to attract a higher share of private investment in sustainable local infrastructure governments must address the risk of construction delays cost overruns and project non- completion
Poor infrastructure project performance as measured by budget overruns and implementation delays is widespread The influential study by Flyvbjerg et al (2003) was one of the first to document the pervasiveness and magnitude of the problem Their analysis of 258 transport infrastructure projects in twenty countries found that almost 90 of projects experienced substantial delays and budget overruns of on average 26
Among them are for example the Channel Tunnel (80 cost overrun) and the Humber Bridge in the UK (175 overrun) Another investigation into the cost burden of large infrastructure projects around the world found that
ww
ww
orld
com
mer
cere
view
com
only four of the 52 projects studied remained within the forecasted budget and cost overruns averaged at 88 (Merrow et al 1988)
Prominent examples of delayed and excessively expensive infrastructure projects abound across the world and studies investigating this problem in virtually all G20 economies prove that this is still widespread today (See Fiedler and Schuster 2016 for Germany Lee 2008 and Han et al 2009 for Korea Pickrell 1990 and 1992 for the USA Doloi et al 2012 for India Durdyev et al 2012 for Turkey Kaming et al 1997 for Indonesia Allahaim and Liu 2015 for Saudi Arabia Creedy et al 2010 for Australia Baloyi and Bekker 2011 for South Africa Flyvbjerg et al 2003 for France Huo et al 2018 for China)
Similar findings to those in the transport sector have been found in other sectors of infrastructure and demonstrate considerable differences in average cost and time performance Sectors such as transmission lines (8) or solar (1) wind (8) and thermal power plants (12) seem to face fewer unanticipated cost hikes than nuclear power plants and large dam projects where cost escalation amount to 113 and 96 on average and the pattern is mirrored in delays in project completion (Ansar et al 2014 Sovacool et al 2014)
IT and ICT perform comparatively well on average but the sector includes frequent outliers with massively escalated costs23 It is important to note here however that national experiences may differ considerably from the averages found in trans-national studies especially at the subsectoral level24
Delayed projects that eventually turn into permanent and abandoned construction sites are more prominent in the developing world Recent evidence suggests that more than one-third of infrastructure projects in emerging markets and developing countries are not completed (Rasul and Rogger 2018 Williams 2017)
ww
ww
orld
com
mer
cere
view
com
These lsquowhite elephantsrsquo are a tremendous waste of resources in addition to presenting a potential danger to the local populations (Bancalari 2020) The studies estimate that waste of public resources through non-completion of infrastructure projects is of the same order of magnitude as the loss through corruption in infrastructure projects (around 2425) and is similar to the percentage of government spending that is lost due to politically motivated distortions (around 26) (Olken 2007)
Yet infrastructure non-completion receives much less attention in the development policy discussion and in academic literature than corruption and clientelism which is why the underlying causes are not yet well understood
The studies that are available identify the drivers of (non-) completion to be specific to the local institutions26 and identify a positive effect of budget conditionality on project completion that is fund disbursement for a new project to be conditional on the completion of the previous one
Similarly a striking feature of the existing literature on project cost and schedule performance is that it focuses almost exclusively on large infrastructure projects and megaprojects which are defined as ldquohelliplarge-scale complex ventures that typically cost US$1 billion or more take many years to develop and build involve multiple public and private stakeholders are transformational and impact millions of peoplerdquo (Flyvbjerg 2014 p3) and are managed by central governments
Literature on project performance for smaller infrastructure projects managed by local administrations is still scarce which is likely due to lack of reliable administrative data on infrastructure projects across levels of governments
ww
ww
orld
com
mer
cere
view
com
Understanding and mitigating the causes is absolutely vital By improving infrastructure project performance even marginally governments have the chance to generate substantial additional economic benefits from their investments in the wake of the current crisis
The magnitude of waste of fiscal resources is substantial and for middle- and low-income countries the social and developmental costs are tremendous Even a marginal decrease in the cost overruns in infrastructure projects could make billions of USD of public funds available for investment
While an analysis of the underlying determinants is beyond the scope of this report an assessment of local small-scale infrastructure service delivery in G20 countries will be instrumental to identify obstacles to timely and cost-efficient construction and address them27
Recommendations to the G20The G20 has had considerable success driving infrastructure up the agenda notably following the G20 Principles on Quality Infrastructure adopted at the 2019 Osaka summit and the InfraTech Agenda adopted at the 2020 Riyadh summit
The time has now come for the G20 to place sustainable and local elements at the centre of the conversation surrounding infrastructure We outline the key measures that should be taken to do so
bull Place climate sustainability at the core of the infrastructure agenda Infrastructure investments that are made now will lock in technologies for decades to come It is imperative that these contribute to limiting global warming to 15degC which needs to be emphasised in the G20 infrastructure agenda
ww
ww
orld
com
mer
cere
view
com
The G20 should revise the Principles on Quality Infrastructure to explicitly encompass climate change mitigative adaptive and resilient infrastructure
bull Sustainable policies start locally Building sustainable cities will be key to solving two of the most pressing challenges of our time climate change and population growth Covering only 2 of the planetrsquos surface cities are responsible for up to 70 of global GHG-emissions and home to the majority of the worldrsquos population
The G20 should recalibrate their individual and common infrastructure agendas to prioritise small-scale local investment that serves local communities
bull Improve access to finance for low-carbon projects Many low-carbon infrastructure projects such as deployment of solar PV are particularly capital intensive Higher costs of financing can prohibit ambitious levels of sustainable investment
In order to sustainable infrastructure investment in low- and middle-income countries the G20 should cooperate to provide cheaper financing This could be done through blended finance or concessional loan programs by DFIs
bull Address the shortage of bankable infrastructure projects Local administrations lack the capacity to identify prepare and structure sustainable infrastructure projects for private investment in their communities The G20 should expand the capacity of the Global Infrastructure Facility (GIF) to provide technical assistance to local governments throughout the project cycle in order to crowd-in private sector investments
ww
ww
orld
com
mer
cere
view
com
bull Commit to supporting bilateral and multilateral development banks DFIs are the key to unlocking large-scale infrastructure investments thanks to their expertise and long-term experience with risky project delivery With cities at the heart of the global zero carbon infrastructure transition they are only now beginning to support local governments directly
The G20 should continue to commit future funding to these institutions and promote their engagement at lower levels of government to enable them to provide much-needed support especially in low- and middle-income countries
bull Stimulate demand for low-carbon industrial materials Industrial materials are essential for sustainable infrastructure are responsible for significant GHG emissions Addressing this problem is difficult for a number of reasons The most efficient solution will be a coordinated commitment by the G20 to boost demand for low-carbon options
There are a range of policy options which could be deployed but whatever route is chosen it is essential that the G20 commits to this challenge now Further delays are incompatible with Paris Agreement targets
bull Improved cooperation across the G20 Decarbonising economies requires risk-taking experimenting and innovation Certain actions such as implicit or explicit carbon prices are essential for encouraging sustainable infrastructure but difficult for countries to implement unilaterally G20 coordination and stronger commitments to decarbonisation can facilitate more ambitious action at the national and in turn local level
bull Focus of lifecycle sustainability The G20 should advocate a shift toward a policy-making paradigm where policies are evaluated from a lifecycle sustainabilityemissions standpoint This would involve evaluating the
ww
ww
orld
com
mer
cere
view
com
whole chain of an infrastructure project from basic materials construction to recycling possibilities or waste disposal issues Best practices for this could be agreed at the G20 level
Mia Hoffmann is a Research Assistant Ben McWilliams a Research Analyst and Niclas Frederic Poitiers a Research Fellow all at Bruegel
Endnotes1 Extreme poverty is defined as living on less than $190 per day2 China is the largest emitter of CO2 with 28 of global emissions followed by the US (15) and the EU (9) In terms of per-capita emissions Saudi Arabia Australia and the United States lead the list of emitters among G20 economies Source Our World in Data (based on the Global Carbon Project)3 The financial support granted by IFI was around $200 billion roughly on par with the support during the Global Financial Crisis which affected developing economies only moderately compared to the current recession4 Energy-related emissions are to be understood as emissions derived from the purposeful transformation or use of energy The notable sectors are electricity production transport and buildings5 The reference is a collaborative effort to compile data from predominantly government sources Fossil Unconditional refers to policies that support the production and consumption of fossil fuels without any climate targets or additional pollution reduction requirements Fossil conditional includes such requirements Clean unconditional spending supports production and consumption of energy that is both low-carbon and has negligible effects on the environment Clean conditional energy intends to support the transition away from fossil fuels but the effect on the environment is unclear6 The results are from a survey of 231 finance ministry officials central bank officials and other economists representing 53 countries including all G20 nations Respondents were asked to assess the fiscal multiplier of each policy in a relative
ww
ww
orld
com
mer
cere
view
com
and subjective manner using 100-point sliding scale Respondents were not homogenous in their use of the sliding point scale and therefore respondents scores were re-based so that the y-axis now records a zero-mean zero-sum score ie comparable7 Ram et al (2020) investigates the global job effects in a scenario where accelerated renewable deployment sees the world transitioning to 100 renewable electricity by 2050 Their estimates are such that a scenario would see direct jobs associated with the electricity sector increasing from 21 million in 2015 to nearly 35 million by 2050 Solar PV wind power and batteries are the main job creators On the other hand a more recent study by Aldieri et al (2019) assessing literature from 2000-2019 finds that job creation connected to wind power installations is rather limited8 This estimate by New Climate Economy (2016) includes investments in urban transport waste water telecommunications and energy infrastructure systems but excludes investments in natural infrastructure9 Energy efficiency in buildings energy and transportation low-carbon core infrastructure renewable energy nuclear low-carbon transport climate-proof water and sanitation adaptation infrastructure10 Energy use in buildings (175) road transport (119) waste (32) and iron steel and cement (102) (Our World in Data)11 The IEA has recently declared solar the King of electricity markets12 For example in the UK (httpswwwofgemgovukenvironmental-programmesfitfit-tariff-rates)13 An example can be found in Brooklyn New York (httpswwwbrooklynenergy)14 An example can be found in California (httpswwwohmconnectcomabout-usnewsresi-station)15 The absolute time taken to get from departing point to destination point16 G20 Infrastructure Working Group (2020)17 Sarker et al (2020) Gijzen (2013)18 Our World in Data19 EPA accessed on 0203202120 Global Alliance for Buildings and Construction International Energy Agency and the United Nations Environment
ww
ww
orld
com
mer
cere
view
com
Programme (2019)21 Our World in Data Saevarsdottir et al (2020) and UN Environment and International Energy Agency (2017)22 Emerging markets and developing countries according to the IMFrsquos country classification income groups according to the World Bank23 Approximatively one out of six IT projects faces cost overruns over 200 (Flyvbjerg and Budzier 2011)24 For a discussion of this and an analysis by sector for Germany see Anzinger and Kostka (2016)25 Olken (2007)26 Williams (2017) finds that project non-completion is the outcome of a dynamically inconsistent collective choice process among political actors facing commitment problems in contexts of limited resources Rasul and Roggerson (2018) find that the management style of local public offices plays a role with higher autonomy of contributing to project-completion27 For an overview over causes and determinants of project performance see Aljohani et al (2017) Fiedler and Schuster (2016) and Pinheiro Catalatildeo et al (2019)
ReferencesAldieri L Grafstrom J Sundstrom K and Paolo Vinci C 2020 ldquoWind Power and Job Creationrdquo Sustainability 12(1) 45Alexander J Nassiry D Barnard S Lindfield M Teipelke R Wilder M 2019 ldquoFinancing the sustainable urban future Scoping a green cities development bankrdquo ODI Working Paper 552 Overseas Development InstituteAljohani A Ahiaga-Dagbui D amp Moore D 2017 ldquoConstruction projects cost overrun What does the literature tell usrdquo International Journal of Innovation Management and Technology 8(2) 137Allahaim FS amp Liu L 2015 ldquoCauses of cost overruns on infrastructure projects in Saudi Arabiardquo International Journal of Collaborative Enterprise 5(1-2) 32-57
ww
ww
orld
com
mer
cere
view
com
Alston P 2018 ldquoReport of the Special Rapporteur on Extreme Poverty and Human Rights on his mission to the United States of Americardquo Report of the Special Procedure of the Human Rights Council GenevaAnsar A Flyvbjerg B Budzier A amp Lunn D 2014 ldquoShould we build more large dams The actual costs of hydropower megaproject developmentrdquo Energy policy 69 43-56Baloyi L amp Bekker M 2011 ldquoCauses of construction cost and time overruns The 2010 FIFA World Cup stadia in South Africardquo Acta Structilia 18(1) 51-67Bancalari A 2020 ldquoCan White Elephants Kill Unintended Consequences of Infrastructure Development in Perurdquo The Institute for Fiscal Studies Working Paper Volume 20 Issue 32Bataille C 2019 ldquoLow and zero emissions in the steel and cement industries Barriers technologies and policiesrdquo OECD Issue Paper Conference VersionBhattacharya A KP Gallagher M Muntildeoz Cabreacute M Jeong and X Ma 2019 ldquoAligning G20 Infrastructure Investment with Climate Goals and the 2030 Agendardquo Foundations 20 Platform a report to the G20Blyth W Gross R Speirs J Sorrell S Nicholls J Dorgan A and Hughes N 2014 ldquoLow-carbon jobs The evidence for net job creation from policy support for energy efficiency and renewable energyrdquo 2014 A report for UKERC by UKERC Technology amp Policy Assessment Function UK Energy Research CentreBouton S Newsome D and Woetzel J 2015 ldquoBuilding the cities of the future with green districtsrdquo McKinsey amp CompanyC40 Cities Finance Facility CDP and Global Covenant of Mayors 2018 ldquoThe demand for financing climate projects in citiesrdquoCalderon C and L Luis 2014 ldquoInfrastructure Growth and Inequality An Overviewrdquo Policy Research Working Paper No 7034 World BankCarter L and Boukerche S 2020 ldquoCatalyzing Private Sector Investment in Climate-Smart Citiesrdquo Invest4Climate Knowledge Series Washington DC World BankCCFLA (2015) State of City Climate Finance 2015 Cities Climate Finance Leadership Alliance (CCFLA) New YorkCoalition for Urban Transitions 2019 ldquoClimate Emergency Urban Opportunityrdquo September 2019
ww
ww
orld
com
mer
cere
view
com
CRED and UNDRR 2020 ldquoHuman cost of disasters an overview over the past twenty years (2000- 2019)rdquoCreedy GD Skitmore M amp Wong JK 2010 ldquoEvaluation of risk factors leading to cost overrun in delivery of highway construction projectsrdquo Journal of construction engineering and management 136(5) 528-537Doloi H Sawhney A Iyer KC amp Rentala S 2012 ldquoAnalysing factors affecting delays in Indian construction projectsrdquo International journal of project management 30(4) 479-489Durdyev S Ismail S amp Bakar NA 2012 ldquoFactors causing cost overruns in construction of residential projects case study of Turkeyrdquo International Journal of Science and Management 1(1) 3-12EPA (United States Environmental Protection Agency) ldquoNational Overview Facts and Figures on Materials Wastes and RecyclingrdquoEuropean Commission 2021 ldquoThe EUrsquos 2021-2027 long-term budget amp NextGenerationEU - Facts and figuresrdquoFiedler J and Schuster S 2016 ldquoThe Elbphilharmonie Hamburgrdquo in Kostka G and J Fiedler (Eds) Large infrastructure projects in Germany Between Ambitions and Reality Palgrave MacmillanFinan F and M Mazzocco 2016 ldquoElectoral Incentives and the Allocation of Public Fundsrdquo NBER Working Paper No 21859Flyvbjerg B 2014 ldquoWhat you should know about megaprojects and why An overviewrdquo Project management journal 45(2) 6-19Flyvbjerg B and Budzier A 2011 lsquoWhy your IT project may be riskier than you thinkrdquo Harvard Business ReviewFlyvbjerg B Bruzelius N amp Rothengatter W 2003 ldquoMegaprojects and risk An anatomy of ambitionrdquo Cambridge University PressFragkos P and Paroussos 2018 ldquoEmployment created in EU related to renewables expansionrdquo Applied Energy Volume 230 pages 935-945G20 2010 ldquoSeoul G20 Summit Final Declaration 2010rdquo November 11ndash12 2010G20 2011 ldquoCannes G20 Summit Final Declaration 2011rdquo November 3ndash4 2011G20 2013 ldquoSt Petersburg G20 Leadersrsquo Declaration 2013rdquo September 6 2013G20 2014 ldquoBrisbane G20 Summit Declarationrdquo November 15-16 2014
ww
ww
orld
com
mer
cere
view
com
G20 2015 ldquoAntalya G20 Leadersrsquo Communiqueacuterdquo November 15ndash16 2015G20 2016a ldquoG20 Leadersrsquo Communiqueacute Hangzhou Summitrdquo September 5 2016G20 2016b ldquoMDBs Joint Declaration 2016rdquoG20 2018 ldquoG20 2018 Leadersrsquo Declarationrdquo November 30 ndash December 1 2018G20 2019 ldquoG20 Principles for Quality Infrastructure InvestmentrdquoG20 2020a ldquoLeadersrsquo Declarationrdquo G20 Riyadh Summit November 21-22 2020G20 2020b ldquoCommuniqueacute G20 Finance Ministers and Central Bank Governors Meetingrdquo April 15 2020G20 2020c ldquoG20 Riyadh InfraTech AgendardquoGenccedilsuuml I Whitley S Roberts Leo Beaton C Chen H Doukas A Geddes A Gerasimchuk I Sanchez L amp Suharsono A 2019 lsquoG20 coal subsidies Tracking government support to a fading industryrsquo ODI Report June 2019Gijzen H 2013 ldquoBig data for a sustainable futurerdquo Nature Volume 502 Issue 38Global Alliance for Buildings and Construction International Energy Agency and the United Nations Environment Programme 2019 lsquo2019 global status report for buildings and construction Towards a zero-emission efficient and resilient buildings and construction sectorrsquoGrimm M and S Boukerche 2020 ldquoEngaging Institutional Investment in Climate-Smart Infrastructurerdquo Invest4Climate Knowledge Series World BankHallegatte S M Bangalore L Bonzanigo M Fay T Kane U Narloch J Rozenberg D Treguer and A Vogt-Schilb 2016 ldquoShock Waves Managing the Impacts of Climate Change on Povertyrdquo Climate Change and Development World BankHan SH Yun S Kim H Kwak YH Park HK and SH Lee 2009 ldquoAnalyzing Schedule Delay of Mega Project Lessons Learned From Korea Train Expressrdquo IEEE Transactions on Engineering Management 56(2) pp 243-256Hepburn C OrsquoCallaghan B Stern N Stiglitz J and Zenghelis D 2020 ldquoWill COVID-19 fiscal recovery packages accelerate or retard progress on climate changerdquo Oxford Review of Economic Policy Volume 36 Issue Supplement_1 pages S359-S381
ww
ww
orld
com
mer
cere
view
com
Huo T Ren H Cai W Shen GQ Liu B Zhu M amp Wu H 2018 ldquoMeasurement and dependence analysis of cost overruns in megatransport infrastructure projects Case study in Hong Kongrdquo Journal of construction engineering and management 144(3) 05018001IEA 2019 lsquoGlobal Energy amp CO2 Status Report 2019rsquo March 2019IEA 2020a ldquoWorld Energy Investment Flagship Reportrdquo May 2020IEA 2020b ldquoIron and Steel Technology Roadmaprdquo Energy Technology Perspectives October 2020IMF 2019 ldquoFiscal Policies for Paris Climate Strategies - from Principle to Practicerdquo IMF Policy Paper May 2019IMF 2020a ldquoWorld Economic Outlook A Long and Difficult Ascentrdquo Washington DC October 2020 IMF 2020b ldquoFiscal Monitor Policies for the Recoveryrdquo Washington October 2020IMF 2021 lsquoWorld Economic Outlook Updatersquo Washington January 2021International Institute for Sustainable Development (IISD) 2020a ldquoEnergy Policy TrackerrdquoInternational Institute for Sustainable Development (IISD) 2020b ldquoDoubling Back and Doubling Down G20 scorecard on fossil fuel fundingrdquo Published by the International Institute for Sustainable DevelopmentIvanyna M and A Shah 2012 ldquoHow Close Is Your Government to Its People Worldwide Indicators in Localization and Decentralizationrdquo World Bank Policy Research Working Paper 6138 World BankKaming PF Olomolaiye PO Holt GD amp Harris FC 1997 ldquoFactors influencing construction time and cost overruns on high-rise projects in Indonesiardquo Construction Management amp Economics 15(1) 83-94Kennedy C Ibrahim N and Hoornweg D 2014 ldquoLow-carbon infrastructure strategies for citiesrdquo Nature Climate Change 4 343-346Lawrence M R Bullock and Z Liu 2019 ldquoChinarsquos High-Speed Rail Developmentrdquo International Bank for Reconstruction and DevelopmentThe World BankLazard (2020) lsquoLazardrsquos Levelized Cost of Energy Analysis ndash Version 140rsquo October 2020Lee J-K (2008) Cost overrun and cause in Korean social overhead capital projects roads rails airports and ports Journal of urban planning and development 134 59ndash62
ww
ww
orld
com
mer
cere
view
com
Merk O Saussier S Staropoli C Slack E and Kim J-H 2012) Financing Green Urban Infrastructure OECD Regional Development Working Papers 201210 OECD PublishingMerrow EW McDonnell LM and RY Arguden 1988 ldquoUnderstanding the Outcomes of Megaprojects A Quantitative Analysis of Very Large Civilian Projectsrdquo Rand Corporation Meyer I and M Sommer 2016 ldquoEmployment effects of renewable energy deployment ndash a reviewrdquo International Journal of Sustainable Development 19(3)217Mohieldin M N Subramaniam and J Verbeek 2018 ldquoMultilateral Development Banks must mobilize private finance to achieve the SDGsrdquo Brookings Munir W and KP Gallagher 2018 ldquoScaling Up Lending at the Multilateral Development Banks Benefits and Costs of Expanding and Optimizing MDB Balance Sheetsrdquo Global Economic Governance Initiative Working Paper No013 Global Development Policy CenterNASA 2021 2020 Tied for Warmest Year on Record NASA Analysis Showsrdquo January 2021New Climate Economy 2016 ldquoThe Sustainable Infrastructure Imperative Financing for better growth and developmentrdquo New Climate EconomyOECD 2017 Investing in Climate Investing in Growth OECD Publishing ParisOECD 2018 ldquoFinancing water Investing in sustainable growthrdquo Policy Perspectives OECD Environment Policy Paper No 11Olken B 2007 ldquoMonitoring Corruption Evidence from a Field Experiment in Indonesiardquo Journal of Political Economy Volume 115 Issue 2 200-249Our World in Data available at httpsourworldindataorgco2-emissions and httpsourworldindataorgemissions-by-sectorPickrell DH 1990 ldquoUrban Rail Transit Projects Forecast Versus Actual Ridership and Costrdquo Department of Transportation Washington DC p 164
ww
ww
orld
com
mer
cere
view
com
Pickrell DH 1992 ldquoA desire named streetcar fantasy and fact in rail transit planningrdquo Journal of the American Planning Association 58(2) pp 158-176Pinheiro Catalatildeo F Cruz CO amp Miranda Sarmento J 2019 ldquoExogenous determinants of cost deviations and overruns in local infrastructure projectsrdquo Construction Management and Economics 37(12) 697-711Ram M Aghahosseini A and Breyer C 2020 ldquoJob creation during the global energy transition towards 100 renewable power system by 2050rdquo Technological Forecasting and Social Change Volume 151 119682Rasul I and D Rogger 2018 ldquoManagement of Bureaucrats and Public Service Delivery Evidence from the Nigerian Civil Servicerdquo The Economic Journal Volume 128 Issue 608 413ndash46Rozenberg J and M Fay 2019 ldquoBeyond the Gap How Countries Can Afford the Infrastructure They Need while Protecting the Planetrdquo Sustainable Infrastructure World Bank Washington DCSaevarsdottir G Kvande H and Welch B 2019 ldquoAluminum Production in the Times of Climate Change The Global Challenge to Reduce the Carbon Footprint and Prevent Carbon Leakagerdquo JOM the journal of the Minerals Metals amp Materials Society 72(1)Saevarsdottir G Kvande H amp Welch B 2020 ldquoAluminium Production in the Times of Climate Change The Global Challenge to Reduce the Carbon Footprint and Prevent Carbon Leakagerdquo JOM the Journal of the Minerals Metals amp Materials Society 72(1)Sarker MNI Y Peng C Yiran and RC Shouse 2020 ldquoDisaster resilience through big data Way to environmental sustainabilityrdquo International Journal of Disaster Risk Reduction Volume 51 Issue 101769Satterthwaite (2020) The worldrsquos fastest growing cities iied blogSingh R 2009 ldquoDelays and Cost Overruns in Infrastructure Projects An Enquiry into Extents causes and Remediesrdquo Working Paper No 181 Delhi School of EconomicsSovacool BK Gilbert A amp Nugent D 2014 ldquoAn international comparative assessment of construction cost overruns for electricity infrastructurerdquo Energy Research amp Social Science 3 152- 160
ww
ww
orld
com
mer
cere
view
com
Stotsky J and M Ghazanchyan 2013 ldquoDrivers of Growth Evidence from Sub-Saharan Africardquo IMF Working Paper No 13236 International Monetary FundTruman EM 2020 ldquoThe G20 missed an opportunity to expand financial resources for vulnerable countriesrdquo PIIE Realtime Economic Issues Watch April 2020UCCRN 2018 ldquoThe Future We Donrsquot Want How Climate Change Could Impact the Worldrsquos Greatest Citiesrdquo February 2018 UCCRN Technical ReportUN Environment and International Energy Agency 2017 ldquoTowards a zero-emission efficient and resilient buildings and construction sectorrdquo Global Status Report 2017UN Habitat 2011 lsquoGlobal Report on Human Settlements 2011 Cities and Climate Changersquo United Nations Human Settlements ProgrammeUN SDG Indicator database UNCTAD 2017 ldquoWorld Investment Report Investment and the Digital Economyrdquo United NationsPublication GenevaUNCTAD 2018 ldquoTrade and Development Report 2018 Power Platforms and Free Trade DelusionrdquoUNCTAD 2020 ldquoWorld Investment Report 2020 International Production Beyond the PandemicrdquoUnited Nations Publication UNCTADWIR2020United Nations Department of Economic and Social Affairs Population Division (2019b) World Urbanization Prospects The 2018 Revision New York United NationsUnited Nations Department of Economic and Social Affairs Population Division (2019a) World Population Prospects 2019 HighlightsUnited Nations 2017 ldquoWastewater The Untapped Resourcerdquo The United Nations World Water Development Report FranceVan de Walle D M Ravallion V Mendiratta and G Koolwal 2013 ldquoLong-Term Impacts of Household Electrification in Rural Indiardquo Policy Research Working Paper No 6527 World Bank
ww
ww
orld
com
mer
cere
view
com
Vivid Economics 2020 ldquoGreenness of Stimulus Indexrdquo Vivid Economics October 2020White House 2021 ldquoParis Climate Agreementrdquo Press Release January 20 2021Williams MJ 2017 ldquoThe Political Economy of Unfinished Development Projects Corruption Clientelism or Collective Choicerdquo American Political Science Review Volume 111 Issue 4 705ndash723World Bank 2018 ldquoCity Creditworthiness Initiative A Partnership to Deliver Municipal Financerdquo World Bank BriefWorld Bank 2020 ldquoCOVID-19 to Add as Many as 150 Million Extreme Poor by 2021rdquo Press Release October 7 2020World Health Organisation (WHO) and the United Nations Childrenrsquos Fund (UNICEF) 2017 ldquoProgress on drinking water sanitation and hygiene 2017 update and SDG baselinesrdquo Geneva World Health Organization
We owe our gratitude to Suman Bery Nicola Bilotta Maria Demertzis Alberto Franco Pozzolo Simone Tagliapietra Guntram Wolff and Georg Zachmann for their input and comments as well as Alma Kurtovic for her excellent management of this project We would also like to thank the Italian Ministry of Finance and Economics and the members of the G20 Infrastructure Working Group for their valuable feedback to our research This paper was prepared for the a meeting of G20 Finance Ministers and Central Bank Governors (FMCBG) on 9 and 10 July 2021 and was published on Bruegel