bulgaria - food and agriculture organizationbulgaria global forest resources assessment 2015 country...
TRANSCRIPT

Bulgaria
GLOBAL FOREST RESOURCES ASSESSMENT 2015
COUNTRY REPORT
Rome, 2014

FAO, at the request of its member countries, regularly monitors the world´s forests and theirmanagement and uses through the Global Forest Resources Assessment (FRA). This country reportis prepared as a contribution to the FAO publication, the Global Forest Resources Assessment 2015(FRA 2015).The content and the structure are in accordance with the recommendations and guidelines given byFAO in the document Guide for country reporting for FRA 2015 (http://www.fao.org/3/a-au190e.pdf).These reports were submitted to FAO as official government documents.
The content and the views expressed in this report are the responsibility of the entity submitting thereport to FAO. FAO may not be held responsible for the use which may be made of the informationcontained in this report.

FRA 2015 – Country Report, Bulgaria
3
TABLE OF CONTENTSReport preparation and contact persons...............................................................................................................................41. What is the area of forest and other wooded land and how has it changed over time? ................................................. 52. What is the area of natural and planted forest and how has it changed over time? ..................................................... 123. What are the stocks and growth rates of the forests and how have they changed? .....................................................174. What is the status of forest production and how has it changed over time? .................................................................315. How much forest area is managed for protection of soil and water and ecosystem services? ..................................... 396. How much forest area is protected and designated for the conservation of biodiversity and how has it changed overtime? ................................................................................................................................................................................... 457. What is the area of forest affected by woody invasive species? .................................................................................. 488. How much forest area is damaged each year? ............................................................................................................ 519. What is the forest area with reduced canopy cover? ....................................................................................................5510. What forest policy and regulatory framework exists to support implementation of sustainable forest managementSFM? .................................................................................................................................................................................. 5611. Is there a national platform that promotes stakeholder participation in forest policy development? ............................ 5812. What is the forest area intended to be in permanent forest land use and how has it changed over time? .................. 5913. How does your country measure and report progress towards SFM at the national level? ........................................ 6214. What is the area of forest under a forest management plan and how is this monitored? ........................................... 6415. How are stakeholders involved in the management decision making for publicly owned forests? .............................. 6616. What is the area of forest under an independently verified forest certification scheme? .............................................6817. How much money do governments collect from and spend on forests? .....................................................................7018. Who owns and manages the forests and how has this changed? ..............................................................................7219. How many people are directly employed in forestry? ................................................................................................. 7920. What is the contribution of forestry to Gross Domestic Product (GDP)? .................................................................... 8121. What is forest area likely to be in the future ...............................................................................................................82

FRA 2015 – Country Report, Bulgaria
4
Report preparation and contact personsContact personsThe present report was prepared by the following person(s)
Name (FAMILYNAME, first name) Institution/address Email Tables
Bobeva Albena Executive Forest Agency, blvd.Hristo Botev 55, Sofia 1040,Bulgaria
[email protected]@gmail.com
T1 - T21
Zhelev Ljuben Executive Forest Agency, blvd.Hristo Botev 55, Sofia 1040,Bulgaria
[email protected] T1, T2, T3, T5, T6, T12, T13
Ilcheva Darina Executive Forest Agency, blvd.Hristo Botev 55, Sofia 1040,Bulgaria
[email protected] T1, T2, T5, T6, T14, T18
Chambov Valentin Executive Forest Agency, blvd.Hristo Botev 55, Sofia 1040,Bulgaria
Balov Stefan Executive Forest Agency, blvd.Hristo Botev 55, Sofia 1040,Bulgaria
[email protected] T7, T8
Konstantinov Vladimir Executive Forest Agency, blvd.Hristo Botev 55, Sofia 1040,Bulgaria
Tashev Kiril Executive Forest Agency, blvd.Hristo Botev 55, Sofia 1040,Bulgaria
Ilieva Lubomira Executive Forest Agency, blvd.Hristo Botev 55, Sofia 1040,Bulgaria
[email protected] T17, T19
Introductory TextPlace an introductory text on the content of this report
The assessment is based on the official database of Executive Forest Agency /EFA/, Ministry of agriculture andfood - since 1955. EFA is the responsible institution for forestry statistics in the country. The National instituteof statistics is also involved in data preparation.
Desk Study?
Check "yes" if this survey is a Desk Study, "no" otherwise
Desk Study? no

FRA 2015 – Country Report, Bulgaria
5
1. What is the area of forest and other wooded land and how has it changed over time?Documents for this question:
• Guide for country reporting FRA 2015• FRA 2015 Terms and Definitions
1.1 Categories and definitions
Category Definition
Forest Land spanning more than 0.5 hectares with trees higher than 5 meters and a canopy cover of more than10 percent or trees able to reach these thresholds in situ. It does not include land that is predominantlyunder agricultural or urban land use.
Other wooded land Land not classified as "Forest" spanning more than 0.5 hectares with trees higher than 5 meters anda canopy cover of 5-10 percent or trees able to reach these thresholds ; or with a combined coverof shrubs bushes and trees above 10 percent. It does not include land that is predominantly underagricultural or urban land use.
Other land All land that is not classified as "Forest" or "Other wooded land".
...of which with tree cover(sub-category)
Land considered as "Other land", that is predominantly agricultural or urban lands use and has patchesof tree cover that span more than 0.5 hectares with a canopy cover of more than 10 percent of trees ableto reach a height of 5 meters at maturity. It includes bothe forest and non-forest tree species.
Inland water bodies Inland water bodies generally include major rivers, lakes and water reservoirs.
Forest expansion Expansion of forest on land that, until then, was not defined as forest.
...of which afforestation(sub-category)
Establishment of forest through planting and/or deliberate seeding on land that, until then, was notdefined as forest.
...of which naturalexpansion of forest (sub-category)
Expansion of forests through natural succession on land that, until then, was under another land use(e.g. forest succession on land previously used for agriculture).
Deforestation The conversion of forest to other land use or the longterm reduction of the tree canopy cover below theminimum 10 percent threshold.
...of which humaninduced (sub-category)
Human induced conversion of forest to other land use or the permanent reduction of the tree canopycover below the minimum 10 percent threshold.
Reforestation Natural regeneration or re-establishment of forest through planting and/or deliberate seeding on landalready in forest land use.
...of which artificialreforestation (sub-category)
Re-establishment of forest through planting and/or deliberate seeding on land already in forest land use.
1.2 National data1.2.1 Data sources
References to sourcesof information Variables Years Additional comments

FRA 2015 – Country Report, Bulgaria
6
1 National forest fund report Forest Other wooded landOther land Other landwith tree cover Inlandwater bodies Afforestation,reforestation and naturalexpansion of forests
Since 1955 The annual National ForestFund report is an officialreport and database of theNational Forestry Boardfor the forest resources inBulgaria. It is presented in theform of database and is notexact publication.
2 FAOSTAT data Total area Land area 1990, 2000, 2002 N/A
3 “Agrostatistics – BASINK– final results for theemployment and land use inBulgaria”
Other wooded land …ofwhich with tree cover
2000 2005 Official report of Ministry ofagriculture and food supply2007 Web information http://www.mzgar.government.bg/StatPazari/Agrostatistika/agrostatistika.htm
4 Inventory of forestplantations
Afforestation from 1995 Executive Forest Agencyand its Regional forestdirectorates
5 Annual agricultural report Other wooded land …ofwhich with tree cover
2011 report of Ministry ofagriculture and food
1.2.2 Classification and definitions
National class Definition
Forest All the area covered with trees higher than 5m, with canopycover of more than 10 percent and spanning more than 0.1hectares
Other wooded land with trees higher than 5 meters with a combined cover of shrubs,bushes and trees above 10 percent and spanning more than 0.1hectares
Other land All the area not covered by forest or water
Other land with tree cover Trees able to reach a height of 5 meters at maturity and spanningmore than 0.1 hectares
Inland water bodies The area that include rivers, lakes and water reservoirs
Afforestation The same as FRA category
Reforestation The same as FRA category. Re-establishment of forest throughplanting and/or deliberate seeding on land classified as forest.Natural regeneration is also included
Natural expansion of forest Natural succession of forest in agricultural fund on the territoryof the country (includes also abandoned agricultural area)
1.2.3 Original data
Forestarea

FRA 2015 – Country Report, Bulgaria
7
Area (1000 hectares)
FRACategories
1990 2000 2005 2010
Forest 3327.027 3375.117 3651.243 3737.542
Other woodedland
130.08 104.73 26.308 23.757
Other land 7605.893 7583.153 7186.449 7094.701
...of which withtree cover
n.a. 98.820 71.457 72.913
Inland waterbodies
36 36 236 244
TOTAL 11099 11099 11100 11100
* In FRA 2005 data were derived from latest data from 31.12.2004 from National forest fund report and thelatest FAOSTAT data. The data for 2005 in this report are new (for 2005 from National forest fund report,Bulgaria. Starting in 2004, data relating to “Country area”, “Land area” and “Inland water” have been reviseddue to different sources and definitions (differences in Inland water bodies and country area in 2005)
Cate-gories
...of which of introduced species
2008 2009 2010 2011 2012 Average2010
2008 2009 2010 2011 2012 Av2010
Forestexpansion
7 6.7 8.1 -6.2 1.07 3.3
…ofwhichaffore-station
0,353 0,621 0,197 0,103 0,077 0,2702 0 0 0 0 0 0
…ofwhichnaturalexpansionofforest
6.7 6.1 7.9 -6.3 1 3.03
Defore-station
n.a. n.a. n.a. n.a. n.a. n.a. n.a. n.a. n.a. n.a. n.a. n.a.

FRA 2015 – Country Report, Bulgaria
8
…ofwhichhumaninduced
n.a. n.a. n.a. n.a. n.a. n.a. n.a. n.a. n.a. n.a. n.a. n.a.
Refore-station
43.3 20.6 21.07 -2.96 29.8 22.4 0,972 1,394 0,732 0,596 0,544 0,8476
…ofwhichartificial
3,293 3,979 2,066 1,141 0,877 2,2712 0,972 1,394 0,732 0,596 0,544 0,8476
*Introduced species: poplars, Douglas fir, cedar, red oak, gleditsia
2005
Cate-gories
...of which of introduced species
2003 2004 2005 2006 2007 Average2005
2003 2004 2005 2006 2007 Av2005
Reforestation
withoutartificial
64.4 94.5 49.7 33.3 34 55.2 n.a n.a n.a n.a n.a n.a
2000
Cate-gories
...of which of introduced species
1998 1999 2000 2001 2002 Average2000
1998 1999 2000 2001 2002 Av2000
Reforestation
withoutartificial
18.7 -36.8 78.6 72.6 54.1 37.4 n.a n.a n.a n.a n.a n.a
*The calculations for 2010 are the same like for the other years

FRA 2015 – Country Report, Bulgaria
9
1.3 Analysis and processing of national data1.3.1 Adjustment
Forest area
No need for calibration. The total land area of the country matches the official, reported land area accordingto FAOSTAT.
1.3.2 Estimation and forecasting
The data for 2015 are calculated : Forecasting using linear interpolation
1.3.3 Reclassification
1.4 DataTable 1a
Area (000 hectares)Categories
1990 2000 2005 2010 2015
Forest 3327 3375 3651 3737 3823
Other wooded land 130 105 26 24 22
Other land 7606 7583 7187 7095 7011
... of which with tree cover N/A 99 72 73 74
Inland water bodies 36 36 236 244 244
TOTAL 11099.00 11099.00 11100.00 11100.00 11100.00
Table 1bAnnual forest establishment /loss (000 hectares per year)
...of which of introducedspecies (000 hectares per year)
Categories1990 2000 2005 2010 1990 2000 2005 2010

FRA 2015 – Country Report, Bulgaria
10
Forest expansion N/A 14.8 43.3 3.3 N/A N/A N/A N/A
... of which afforestation 5.798 2.681 5.953 0.27 N/A 0.409 0.327 0
... of which natural
expansion of forest
N/A 12.102 37.267 3.03 N/A N/A N/A N/A
Deforestation N/A N/A N/A N/A N/A N/A N/A N/A
... of which human induced N/A N/A N/A N/A N/A N/A N/A N/A
Reforestation 20.259 37.4 55.2 22.4 N/A N/A N/A N/A
... of which artificial 20.259 4.065 2.799 2.3 N/A 1.056 0.733 0.85
Tiers
Category Tier for status Tier for reported trend
Forest Tier 3 Tier 3
Other wooded land Tier 3 Tier 3
Forest expansion Tier 3 Tier 3
Deforestation Tier 3 Tier 3
Reforestation Tier 3 Tier 3
Tier criteria
Category Tier for status Tier for reported trend
• Forest• Other wooded land• Afforestation• Reforestation• Natural expansion of forest• Deforestation
Tier 3 : Data sources: Either recent(less than 10 years ago) National ForestInventory or remote sensing, with groundtruthing, or programme for repeatedcompatible NFIs Tier 2 : Data sources:Full cover mapping / remote sensing orold NFI (more than 10 years ago) Tier 1 :Other
Tier 3 : Estimate based on repeatedcompatible tiers 3 (tier for status) Tier 2 :Estimate based on repeated compatible tier2 or combination tier 3 and 2 or 1 (tier forstatus) Tier 1 : Other
1.5 Comments
Category Comments related todata definitions etc Comments on the reported trends

FRA 2015 – Country Report, Bulgaria
11
Forest N/A There is a large increase in the forest areafor the period 2000-2005. According tothe Forest Act and the preparation of themap of the restored ownership for thisperiod, in the Forest fund were includedall excluded in the past, but not destroyedforests, all forests given up for utilizationto other organizations and also all areasfrom agricultural fund - forested andself-forested. In this period actually theupdate of the Forest fund was done. Part of"Other wooded land" was also included inthe Forest fund when forested. The processcontinues and is still not finished.
Other wooded land Pinus mugo + trees higher than 5 meterswith a combined cover of shrubs andbushes
The steep decrease between 2000 and2005 are in part due the updating of theForest Fund, where part of the otherwooded land was reclassified as forest .Itmay therefore not reflect the real trend forthis category. See also comment on Forest.
Other land N/A N/A
Other land with tree cover N/A Data for category "Other land of whichwith tree cover" include only orchardson the territory of the country. Datafor 1990 are not available. Data arederived from the official report of theMinistry of agriculture and food supply("Agrostatistics - BANSIK - final resultsfor the employment and land use inBulgaria") and Annual agricultural report
Inland water bodies N/A N/A
Forest expansion The average data for 1990 for introducedspecies can not be reported becauseduring these years the forest inventorywas not full and these species were notinvestigated and reported n.a. - suchinformation for the forest fund in Bulgariais not available
N/A
Deforestation N/A N/A
Reforestation ...of which on areas previously planted'' -data available only for Poplar
N/A
Other general comments to the table
N/A

FRA 2015 – Country Report, Bulgaria
12
2. What is the area of natural and planted forest and how has it changed over time?Documents for this question:
• Guide for country reporting FRA 2015• FRA 2015 Terms and Definitions
2.1 Categories and definitions
Term Definition
Naturally regeneratedforest
Forest predominantly composed of trees established through natural regeneration.
Naturalized introducedspecies
Other naturally regenerated forest where the tree species are predominantly non-native and do not needhuman help to reproduce/maintain populations over time.
Introduced species A species, subspecies or lower taxon occurring outside its natural range (past or present) and dispersalpotential (i.e. outside the range it occupies naturally or could occupy without direct or indirectintroduction or care by humans).
Category Definition
Primary forest Naturally regenerated forest of native species where there are no clearly visible indications of humanactivities and the ecological processes are not significantly disturbed.
Other naturallyregenerated forest
Naturally regenerated forest where there are clearly visible indications of human activities.
...of which of introducedspecies (sub-category)
Other naturally regenerated forest where the trees are predominantly of introduced species.
...of which naturalized(sub-sub category)
Other naturally regenerated forest where the trees are predominantly of naturalized introduced species.
Planted forest Forest predominantly composed of trees established through planting and/or deliberate seeding.
...of which of introducedspecies (sub-category)
Planted forest where the planted/seeded trees are predominantly of introduced species.
Mangroves Area of forest and other wooded land with mangrove vegetation.
...of which planted (sub-category)
Mangroves predominantly composed of trees established through planting.
2.2 National data2.2.1 Data sources
References to sourcesof information Variables Years Additional comments
1 National forest fund report(NFB)
Protected native forests;Virgin forests; Nativeforest with productiondesignation; Introducedspecies; Recreational forest(introduced and nativespecies mixed)
Since 1955 Executive Forest Agency -responsible for the nationalforest fund report

FRA 2015 – Country Report, Bulgaria
13
2 Virgin forests in Bulgaria Virgin forests 2005 PINMATRA Project Royaldutch society for natureprotection; Ministry ofenvironment and water /Bulgaria/
3 N/A N/A N/A N/A
4 N/A N/A N/A N/A
2.2.2 Classification and definitions
National class Definition
Protected native forests Forest of native species, where the ecological processes are notsignificantly disturbed
Virgin forests Forest ecosystem, product of natural evolution, as well as thosewith partial exogenic influences of anthropogenic character, withpreserved structure and relationship between biocenosis andenvironment
Planted forest Forest composed of trees established through planting and/ordeliberate seeding.
Primary forest The same as FRA definition
Other naturally regenerated forest Naturally regenerated forest where there are clearly visibleindications of human activities.
2.2.3 Original data
Original data
1990 2000 2005 2010National class
Forests (1000ha)
Protected nativeforests
131.551 245.159 278.514 571.744
Virgin forestsoutside protectedareas *
25.037* 25.037* 25.037* 25.037*

FRA 2015 – Country Report, Bulgaria
14
Other naturallyregeneratedforests
2138 2172.224 2473.034 2323.774
...of whichof introducedspecies
96.204 110.809 139.855 150.590
Planted forests 1032 933.034 873.858 816.987
...of whichof introducedspecies
37.173 28.226 33.309 53.077
*The data for 2010 are available
2.3 Analysis and processing of national data2.3.1 Adjustment
2.3.2 Estimation and forecasting
2015 forecasting- linear interpolation
Linear interpolation will be not used for 2015 data - please see explanation in the comments. Please also see theexplanation for primary forests! The data for VIRGIN FORESTS for 2005 are reliable - please see comments
An important increase in primary forest is reported which is probably not real, but only due to different datasetand calculations, also differring from FRA 2010 (http://www.fao.org/docrep/013/al467e/al467e.pdf). - NO! Itis because NATURA 2000 - please see COMMENTS
2.3.3 Reclassification
Data about characteristics of Forests in Bulgaria are calculated in every 5 years (1990, 1995, 2000, 2005, 2010).
2.4 DataTable 2a
Forest area (000 hectares)Categories
1990 2000 2005 2010 2015
Primary forest 157 270 304 597 N/A

FRA 2015 – Country Report, Bulgaria
15
Other naturally regeneratedforest
2138 2172 2473 2323 N/A
... of which of introducedspecies
96 111 140 151 N/A
... of which naturalized 96 111 140 151 N/A
Planted forest 1032 933 874 817 N/A
... of which of introducedspecies
37 28 33 53 N/A
TOTAL 3327.00 3375.00 3651.00 3737.00 .00
Table 2b
Primary forest converted to (000 ha)
1990-2000 2000-2010 2010-2015
Othernatural
regenerationPlanted Other land
Othernatural
regenerationPlanted Other land
Othernatural
regenerationPlanted Other land
N/A N/A N/A N/A N/A N/A N/A N/A N/A
Table 2c
Area (000 hectares)Categories
1990 2000 2005 2010 2015
Mangroves (forest and OWL) 0 0 0 0 0
... of which planted 0 0 0 0 0
Tiers
Category Tier for status Tier for reported trend
Primary forest Tier 3 Tier 3
Other naturally regenerated forest Tier 3 Tier 3
Planted forest Tier 3 Tier 3
Mangroves Tier 3 Tier 3
Tier Criteria
Category Tier for status Tier for reported trend

FRA 2015 – Country Report, Bulgaria
16
Primary forest/Other naturally regeneratedforest/Planted forest
Tier 3 : Data sources: Recent (less than10 years) National Forest Inventory orremote sensing with ground truthing ordata provided by official agencies orprogramme for repeated compatible NFIsTier 2 : Data sources: Full cover mapping/remote sensing or old NFI (more than 10years) Tier 1 : Other
Tier 3 : Estimate based on repeatedcompatible tiers 3 (tier for status) Tier 2 :Estimate based on repeated compatible tier2 or combination tier 3 and 2 or 1 (tier forstatus) Tier 1 : Other
2.5 Comments
Category Comments related todata definitions etc Comments on reported trend
Primary forest Sum of Protected areas and Virgin forests.The data for virgin forests for 1990 and2000 are interpreted using National ForestFund report and are not very reliable andprecise. Till 2002 no exact investigationson Virgin forests in Bulgaria were carriedout. During the period 2002 and 2005 theproject "PINMATRA -Virgin forests inBulgaria" was lunched. For 2005 wereused the data according to this report,which are very reliable and new.
According to the results of the projectPINMATRA - Virgin forests in Bulgaria",the total area of Virgin forests in Bulgariais 103 356.1 ha, of which 78 318.7 haare included in the category "Protectedareas" according to Bulgarian legislation /category "Protected native forests" -National class /see table 4.2.3 in thecountry report/. Because the 2005 wasfound as reliable, contrary to the old ones,the 2005 data on the area of virgin forestsoutside the protected areas (25 037 ha)were used for all reference periods. Thereis an increase in Primary forest in Bulgariabecause some of the NATURA 2000 sitesafter EU accession were reclassified asPrimary forests, e.g. some of the Water-protective forests. Further prognosis basedon the interpolation of the data is notpossible because of the big difference inthe area of Primary forest, which is notexpected to grow during the next years.
Other naturally regenerating forest N/A N/A
Planted forest N/A N/A
Mangroves N/A N/A
Other general comments to the table
Other naturally regenerated forest of introduced species # Acacia sp. Planted forest of introduced species - Poplar ; Douglas fir ;larch Forecasting for 2015 is possible only for the total forest area. Forecasting will be not realistic for the other categories becauseof the drastic change in category Primary forest.

FRA 2015 – Country Report, Bulgaria
17
3. What are the stocks and growth rates of the forests and how have they changed?Documents for this question:
• Guide for country reporting FRA 2015• FRA 2015 Terms and Definitions
3.1 Categories and definitions
Category Definition
Growing stock Volume over bark of all living trees with a minimum diameter of 10 cm at breast height (or abovebuttress if these are higher). Includes the stem from ground level up to a top diameter of 0 cm,excluding branches.
Net Annual Increment(NAI)
Average annual volume of gross increment over the given reference period less that of natural losses onall trees, measured to minimum diameters as defined for "Growing stock".
Above-ground biomass All living biomass above the soil including stem stump branches bark seeds and foliage.
Below-ground biomass All biomass of live roots. Fine roots of less than 2 mm diameter are excluded because these often cannotbe distinguished empirically from soil organic matter or litter.
Dead wood All non-living woody biomass not contained in the litter either standing lying on the ground or in thesoil. Dead wood includes wood lying on the surface dead roots and stumps larger than or equal to 10 cmin diameter or any other diameter used by the country.
Carbon in above-groundbiomass
Carbon in all living biomass above the soil including stem stump branches bark seeds and foliage.
Carbon in below-groundbiomass
Carbon in all biomass of live roots. Fine roots of less than 2 mm diameter are excluded because theseoften cannot be distinguished empirically from soil organic matter or litter.
Carbon in dead wood Carbon in all non-living woody biomass not contained in the litter, either standing, lying on the ground,or in the soil. Dead wood includes wood lying on the surface, dead roots and stumps larger than or equalto 10 cm in diameter or any other diameter used by the country.
Carbon in litter Carbon in all non-living biomass with a diameter less than the minimum diameter for dead wood (e.g.10 cm ) lying dead in various states of decomposition above the mineral or organic soil.
Soil carbon Organic carbon in mineral and organic soils (including peat) to a soil depth of 30 cm.
3.2 National data3.2.1 Data sources
References to sourcesof information Variables Years Additional comments
1 National forest fund report Growing stock Since 1955 Executive Forest Agency
2 IPCC Guidelines for NationalGreenhouse Gas Inventories
Biomass factors Litter anddead wood carbon stocks Soilorganic C stocks
2006 N/A
3 N/A N/A N/A N/A
4 N/A N/A N/A N/A

FRA 2015 – Country Report, Bulgaria
18
3.2.2 Classification and definitions
National class Definition
Growing stock Volume over bark of all living trees higher than 3m withbranches
Above-ground biomass The same as FRA 2015 category
Below-ground biomass The same as FRA 2015 category
Dead wood The same as FRA 2015 category
3.2.3 Original data
Growing stock
Volume (1000 cubic meters over bark)
FRACategories
Forest
1990 1990 2000 2005 2010
Growing stock 404 872 404 872 526 063 591 162 644 840
Growing stockof commercialspecies
259 175 259 175 321 058 378 143 372 230
Biomass stock
Calculations – year 1990
Foresttype Growing stock /m3/
Area /ha/ Growing stock/ha
/million m3/
BCEF*

FRA 2015 – Country Report, Bulgaria
19
Hardwood 246 510 254 2 220 090 111.04 0.6
Pines 111 412 294 897 557 124.13 0.4
Other conifers 46 949 452 209 380 224.23 0.4
Calculations – year 2000
Foresttype Growing stock/m3/
Area /ha/ Growing stock/ha
/million m3/
BCEF*
Hardwood 293 935 467 2 336 641 125.8 0.6
Pines 172 669 779 691 054 249.8 0.4
Other conifers 58 591 514 347 422 168.6 0.4
Calculations – year 2005
Foresttype Growing stock /m3/
Area /ha/ Growing stock/ha
/million m3/
BCEF*
Hardwood 332 467 909 2 572 260 129.3 0.6
Pines 192 580 943 851 123 226.3 0.4
Other conifers 66 113 110 227 860 290.1 0.4
Calculations – year 2010
Foresttype Growing stock/m3/
Area /ha/ Growing stock/ha /million m3/
BCEF*
Hardwood 357 721 821 2 666 259 134.2 0.6

FRA 2015 – Country Report, Bulgaria
20
Pines 213228143 857 787 248.5 0.4
Other conifers 73890283 213496 346 0.4
*The Growing stock includes branches and stem tops – lower values are used
Carbon stock
Original data for broadleaf and needle-leaf forests needed for calculations
Forest area /1000ha/
1990 2000 2005 2010
Broadleafdeciduous
2135 2337 2572 2666
Needeleafevergreen
1192 1038 1079 1071
Total 3327 3375 3651 3737
Carbon in litter /million metrictonnes/
1990 2000 2005 2010
Broadleafdeciduous
34 160 37 392 41 152 42 656
Needeleafevergreen
30 992 26 988 28 054 27846
Total 65 152 64 380 69 206 70 502
Forest 1990 2000 2005 2010
Soil carbon factor 95 95 95 95

FRA 2015 – Country Report, Bulgaria
21
Forest area /ha/ 3327 3375 3651 3737
Soil carbon /mil.metr.t/
316 065 320 625 346 845 355 015
OWL 1990 2000 2005 2010
Soil carbon factor 95 95 95 95
OWL area 130 105 26 24
Soil carbon /mil.metr. tonnes/
12 350 9975 2470 2280
3.3 Analysis and processing of national data3.3.1 Adjustment
3.3.2 Estimation and forecasting
Growing stock
The data for 2010 are available. Original data are used for calculations.
Biomass stock
Calculation of AGB
1990
AGB hardwood = GS x BCEF = 246 510 254x 0.6 = 147 906 152.4
AGB pines = GS x BCEF = 111 412 294x 0.4 = 44 564 917.6

FRA 2015 – Country Report, Bulgaria
22
AGB other conifers = GS x BCEF = 46 949 452x 0.4 = 18 779 780.8
AGB total = 211 250 850.8
2000
AGB hardwood = GS x BCEF = 293 935 467 x 0.6 = 176 361 280
AGB pines = GS x BCEF = 172 669 779 x 0.4 = 69 067 911
AGB other conifers = GS x BCEF = 58 591 514 x 0.4 = 23 436 605.6
AGB total = 268 865 796.6
2005
AGB hardwood = GS x BCEF = 332 467 909x 0.6 = 199 480 745.4
AGB pines = GS x BCEF = 192 580 943x 0.4 = 77 032 377.2
AGB other conifers = GS x BCEF = 66 113 110x 0.4 = 26 445 244
AGB total = 302 958 366.6

FRA 2015 – Country Report, Bulgaria
23
2010
AGB hardwood = GS x BCEF = 357 721 821x 0.6 = 214 633 092.6
AGB pines = GS x BCEF = 213 228 143x 0.4 = 85 291 257.2
AGB other conifers = GS x BCEF = 73 890 283x 0.4 = 29 556 113.2
AGB total = 329 480 463
Calculation of BGB = AGB x R
1990
BGB hardwood = 147 906 152.4 x 0.27 = 39 934 661
*0.265 is an average sum according to table 5.3 for temperate forests
BGB pines = 44 564 917.6 x 0.29= 12 923 826.1
BGB other conifers = 18 779 780x0.29= 5 446 136.432

FRA 2015 – Country Report, Bulgaria
24
BGBtotal = 58 304 624
2000
BGB hardwood = 176 361 280 x 0.27= 47 617 545.6
*0.27 is an average sum according to table 5.3 for temperate forests
BGB pines = 69 067 911 x 0.29= 20 029 694.2
BGB other conifers = 23 436 605.6x0.29= 6 796 615.6
BGBtotal = 74 443 855
2005
BGB hardwood = 199 480 745.4x 0.27= 53859801.3
*0.27 is an average sum according to table 5.3 for temperate forests
BGB pines = 77 032 377.2 x 0.29= 22 339 389.4
BGB other conifers = 26 445 244x0.29= 7 669 120.8
BGBtotal = 83 868 312

FRA 2015 – Country Report, Bulgaria
25
2010
BGB hardwood = 214 633 092.6x 0.27= 57 950 935
*0.27 is an average sum according to table 5.3 for temperate forests
BGB pines = 85 291 257.2x 0.29= 24 734 464.6
BGB other conifers = 29 556 113.2x0.29= 8 571 273
BGBtotal = 91 256 672.6
Carbon stock
The applied factor is the default global carbon fraction recommended by IPCC – 0.47
Default values for litter and wood carbon stocks
Litter:
- for Broadleaf deciduous /cold temperate, moist/ - 16 tonnes C ha -1
- for needleleaf evergreen/cold temperate, moist/ – 26 tonnes C ha -1
Soil organic C stocks

FRA 2015 – Country Report, Bulgaria
26
– HAC soils /cold temperate, moist/ - 95 tonnes C ha -1
The data for 2015 are forecasted using linear interpolation - FRA guide
3.3.3 Reclassification
3.4 DataTable 3a
Growing stock volume (million m 3 over bark)
Forest Other wooded landCategory
1990 2000 2005 2010 2015 1990 2000 2005 2010 2015
Totalgrowingstock
405 526 591 645 699 N/A N/A N/A N/A N/A
... ofwhichconiferous
158 231 259 287 315 N/A N/A N/A N/A N/A
... ofwhichbroadleaved
247 295 332 358 384 N/A N/A N/A N/A N/A
Table 3b
Category/Species name Growing stock in forest (million cubic meters)
Rank Scientific name Common name 1990 2000 2005 2010
1 st Fagus sylvatica Beech 107.3 130.1 142.6 154.6
2 nd Pinus sylvestris Scots pine 85.2 114.4 125.2 138
3 rd Quercus sp. Oak 63.9 76.9 87 93.2
4 th Pinus nigra Black pine 22 53.6 62.6 70.2
5 th Picea abies Norway spruce 35.1 42.6 48.5 55.3
6 th Quercus cerris Bitter oak 25.8 32.5 42.3 44.8
7 th Carpinusbetulus
Hornbeam 23.9 20.5 23 24.8
8 th Abies alba Silver fir 10.4 10.8 11.8 13.2
9 th Tilia sp. Lime 6.3 8.2 11.1 11.2

FRA 2015 – Country Report, Bulgaria
27
10 th Populus sp. Poplar 2 1.8 2.5 2.8
Remaining 23.1 34.6 34.4 36.9
TOTAL 405.00 526.00 591.00 645.00
THE PRE-FILLED VALUES FOR GROWING STOCK REFER TO THE FOLLOWINGTHRESHOLD VALUES (SEE TABLE BELOW)
Item Value Complementary information
Minimum diameter (cm) at breast heightof trees included in growing stock (X)
Not applicable Trees above 3 meters
Minimum diameter (cm) at the top end ofstem for calculation of growing stock (Y)
0 N/A
Minimum diameter (cm) of branchesincluded in growing stock (W)
0 N/A
Volume refers to above ground (AG) orabove stump (AS)
AG N/A
PLEASE NOTE THAT THE DEFINITION OF GROWING STOCK HAS CHANGED AND SHOULDBE REPORTED AS GROWING STOCK DBH 10 CM INCLUDING THE STEM FROM GROUNDLEVEL UP TO A DIAMETER OF 0 CM, EXCLUDING BRANCHES.
Table 3c
Net annual increment (m 3 per hectare and year)
ForestCategory
1990 2000 2005 2010 2015
Net annualincrement
3.4 4 3.9 3.8 3.7
... of whichconiferous
4.6 6.8 6.6 5.5 4.4
... of whichbroadleaved
2.9 2.9 2.7 2.35 2
Table 3d
Biomass (million metric tonnes oven-dry weight)
Forest Other wooded landCategory
1990 2000 2005 2010 2015 1990 2000 2005 2010 2015
Abovegroundbiomass
211 269 303 329 355 N/A N/A N/A N/A N/A

FRA 2015 – Country Report, Bulgaria
28
Belowgroundbiomass
58 74 84 91 98 N/A N/A N/A N/A N/A
Deadwood
N/A N/A N/A N/A N/A N/A N/A N/A N/A N/A
TOTAL 269.00 343.00 387.00 420.00 453.00 .00 .00 .00 .00 .00
Table 3e
Carbon (Million metric tonnes)
Forest Other wooded landCategory
1990 2000 2005 2010 2015 1990 2000 2005 2010 2015
Carbonin abovegroundbiomass
99.3 126.4 142.4 154.6 166.8 N/A N/A N/A N/A N/A
Carbonin belowgroundbiomass
27.3 34.8 39.5 42.8 46.1 N/A N/A N/A N/A N/A
SubtotalLivingbiomass
126.6 161.2 181.9 197.4 212.9 N/A N/A N/A N/A N/A
Carbonin deadwood
N/A N/A N/A N/A N/A N/A N/A N/A N/A N/A
Carbonin litter
6.5 6.4 6.9 7.5 8.1 N/A N/A N/A N/A N/A
SubtotalDeadwoodand litter
N/A N/A N/A N/A N/A N/A N/A N/A N/A N/A
Soilcarbon
316 321 347 355 363 12 10 2.5 2.3 2.1
TOTAL 449.10 488.60 535.80 559.90 584.00 12.00 10.00 2.50 2.30 2.10
Tiers
Variable/category Tier for status Tier for trend
Total growing stock Tier 3 Tier 3
Net annual increment Tier 2 Tier 2
Above ground biomass Tier 1 Tier 2
Below ground biomass Tier 1 Tier 2

FRA 2015 – Country Report, Bulgaria
29
Dead wood Tier 1 Tier 2
Carbon in above-ground biomass Tier 1 Tier 2
Carbon in below ground biomass Tier 1 Tier 2
Carbon in dead wood and litter Tier 1 Tier 2
Soil carbon Tier 1 Tier 2
Tier criteria
Category Tier for status Tier for reported trend
Total growing stock Tier 3: Data sources Recent 10 yearsNational Forest Inventory or remotesensing with ground truthing orprogramme for repeated compatible NFI10 years Domestic volume functions Tier2: Data sources/registers and statisticsmodelling or old NFI 10 years or partialfield inventory Tier 1: Other data sources
Tier 3: Estimate based on repeatedcompatible tiers 3 (tier for status)Domestic growth functions Tier 2:Estimate based on repeated compatible tier2 or combination tier 3 and 2 or 1 tier forstatus Tier 1: Other
Net annual increment Tier 3: Scientifically tested nationalvolume and growth functions Tier 2:Selection of volume and growth functionsas relevant as possible Tier 1: Other
Tier 3: Confirmation/adjustment offunctions used through scientific workTier 2: Review work done to seekalternative functions Tier: 1 Other
Biomass Tier 3: Country-specific national or sub-national biomass conversion expansionfactors applied or other domestic orotherwise nationally relevant biomassstudies Tier 2: Application of countryspecific national or sub-national biomassconversion factors from other countrywith similar climatic conditions and foresttypes Tier 1: International/regional defaultbiomass expansion factors applied
Tier 3 : Estimate based on repeatedcompatible tiers 3 (tier for status) Tier 2 :Estimate based on repeated compatible tier2 or combination tier 3 and 2 or 1 (tier forstatus) Tier 1 : Other
• Carbon in above ground biomass• Carbon in below ground biomass• Carbon in dead wood and litter• Soil carbon
Tier 3: Country-specific national or sub-national biomass conversion expansionfactors applied Tier 2: Applicationof country specific national or sub-national biomass conversion factorsform from other country with similarclimatic conditions and forest types Tier1: International/regional default biomassexpansion factors applied
Tier 3 : Estimate based on repeatedcompatible tiers 3 (tier for status) Tier 2 :Estimate based on repeated compatible tier2 or combination tier 3 and 2 or 1 (tier forstatus) Tier 1 : Other
3.5 Comments on growing stock biomass and carbon
Category Comments related todata definitions etc Comments on the reported trend
Total growing stock Volume over bark of all living treeshigher than 3m with branches
N/A
Growing stock of broadleaved coniferous N/A N/A

FRA 2015 – Country Report, Bulgaria
30
Growing stock composition N/A N/A
Net annual increment Declining trend of the increment /esp.coniferous stands/: Replacement ofartificially created coniferous plantationswith naturally regenerated broadleafstands. Also, in stands with age more than80 years thinnings are conducted. Thisleads to age structure change of the standand to reduction of the stand density.
N/A
Above-ground biomass N/A N/A
Below-ground biomass N/A N/A
Dead wood N/A N/A
Carbon in above-ground biomass N/A N/A
Carbon in below-ground biomass N/A N/A
Carbon in dead wood N/A N/A
Carbon in litter N/A N/A
Soil carbon N/A N/A
Other general comments to the table
List of non-commercial species: Ulmus sp., Carpinus orientalis, Fraxinus ornus, Alnus glutinosa, Pinus heldreichii, Pinus mugo,Fruit trees except wild cherry-tree
FRA 2015 – Country Report, Bulgaria
31
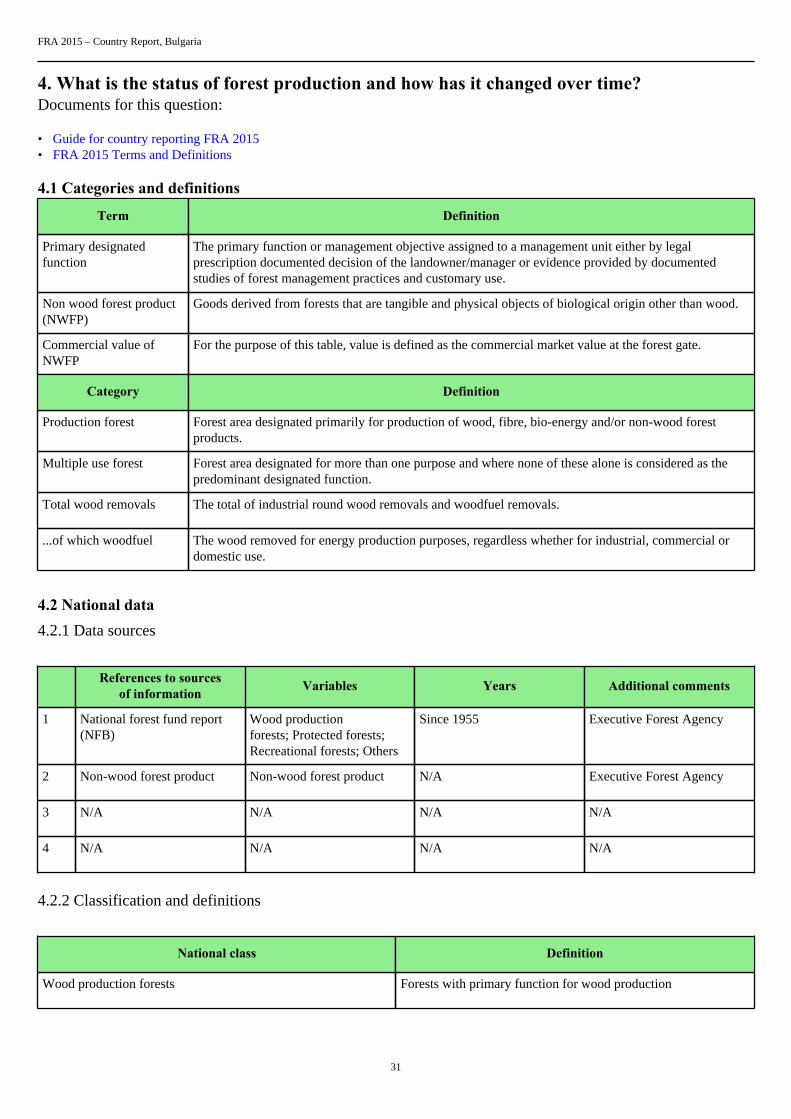
4. What is the status of forest production and how has it changed over time?Documents for this question:
• Guide for country reporting FRA 2015• FRA 2015 Terms and Definitions
4.1 Categories and definitions
Term Definition
Primary designatedfunction
The primary function or management objective assigned to a management unit either by legalprescription documented decision of the landowner/manager or evidence provided by documentedstudies of forest management practices and customary use.
Non wood forest product(NWFP)
Goods derived from forests that are tangible and physical objects of biological origin other than wood.
Commercial value ofNWFP
For the purpose of this table, value is defined as the commercial market value at the forest gate.
Category Definition
Production forest Forest area designated primarily for production of wood, fibre, bio-energy and/or non-wood forestproducts.
Multiple use forest Forest area designated for more than one purpose and where none of these alone is considered as thepredominant designated function.
Total wood removals The total of industrial round wood removals and woodfuel removals.
...of which woodfuel The wood removed for energy production purposes, regardless whether for industrial, commercial ordomestic use.
4.2 National data4.2.1 Data sources
References to sourcesof information Variables Years Additional comments
1 National forest fund report(NFB)
Wood productionforests; Protected forests;Recreational forests; Others
Since 1955 Executive Forest Agency
2 Non-wood forest product Non-wood forest product N/A Executive Forest Agency
3 N/A N/A N/A N/A
4 N/A N/A N/A N/A
4.2.2 Classification and definitions
National class Definition
Wood production forests Forests with primary function for wood production

FRA 2015 – Country Report, Bulgaria
32
Protective forests Forests with protective functions including water protectingforests; erosion preventing; irrigation (forest belts)
Protected forests Natural reserves, national parks, protected areas, historicalplaces, protected landscapes, natural sightseeing
Recreational forests resort forests and areas and forest parks outside settlements(forests with social functions)
Others All forests not included into other categories (with seed-producing plants and gardens; with forest nurseries; withgeographical crops; with dendraria; forests around monuments ofculture; research and experimentation forests, etc.)
4.2.3 Original data
1990 2000 2005 2010
Forest (1000 ha)
Wood productionforests
2364.539 2258.312 2561.410 2386.927
Protective forests 430.253 432.955 450.847 438.901
Protected forests 131.551 245.159 278.514 571.744
Recreationalforests
221.615 222.757 237.620 219.397
Others 179.069 215.934 123.362 120.573
TOTAL 3327.027 3375.117 3651.753 3737.542
*The data for NWFP are original /collected in the same format as FRA category/.
4.3 Analysis and processing of national data4.3.1 Adjustment
No need for calibration

FRA 2015 – Country Report, Bulgaria
33
4.3.2 Estimation and forecasting
Data about designated function of Forest in Bulgaria are calculated in every 5 years (1990, 1995, 2000, 2005,etc.) The report about 2015 is not ready up to now. Reported values for 2015 were calculated with the use ofpreliminary data for 2010 - forecasting linear interpolation
4.3.3 Reclassification
FORESTS
/for1990/
Production Protectionof soil andwater
Conservationofbiodiversity
Socialservices
Multiplepurpose
No orunknownfunction
Woodproductionforests
100%
Protectiveforests
100%
Protectedforests
36%* 6.13% ** 57.87%
Recreationalforests
100%
Others 100%
FORESTS
/for2000/
Production Protectionof soil andwater
Conservationofbiodiversity
Socialservices
Multiplepurpose
No orunknownfunction
Woodproductionforests
100%
Protectiveforests
100%
Protectedforests
19%* 81%

FRA 2015 – Country Report, Bulgaria
34
Recreationalforests
100%
Others 100%
FORESTS
/for2005/
Production Protectionof soil andwater
Conservationofbiodiversity
Socialservices
Multiplepurpose
No orunknownfunction
Woodproductionforests
100%
Protectiveforests
100%
Protectedforests
12%* 88%
Recreationalforests
100%
Others 100%
FORESTS
/for2010/
Production Protectionof soil andwater
Conservationofbiodiversity
Socialservices
Multiplepurpose
No orunknownfunction
Woodproductionforests
100%
Protectiveforests
100%
Protectedforests
8.7%* 91.3%
Recreationalforests
100%
Others 100%
Multiple use forests are calculated according to the Tables above.
4.4 Data

FRA 2015 – Country Report, Bulgaria
35
Table 4a
Forest area (000 hectares)Categories
1990 2000 2005 2010 2015
Production forest 2365 2258 2561 2387 2213
Multiple useforest
255 415 367 642 N/A
Table 4b
Rank Name of product Key species
Commercial valueof NWFP removals
2010 (value 1000local currency)
NWFP category
1 st Mushrooms Boletus edulis;Cantharellus cibarius;Marasmius oreades;Lactarius deliciosus, etc.
168 1
2 nd Forest fruits Raspberry, blackberry,blueberry, etc.
137 1
3 rd Forest wildlings broadleaves, coniferous 97 6.8
4 th Christmas tree - 72 6
5 th Shelled nuts walnuts, hazelnuts,almonds, etc.
43 1
6 th Herbs - 28 3
7 th Lime flowers - 22 3
8 th Rosa canina - 6 3
9 th Bark N/A 6 8
10 th Forest seeds broadleaves, coniferous 7 8
TOTAL 586.00
2010
Name of local currency lev
Category
Plant products / raw material
1 Food
2 Fodder

FRA 2015 – Country Report, Bulgaria
36
3 Raw material for medicine and aromatic products
4 Raw material for colorants and dyes
5 Raw material for utensils handicrafts construction
6 Ornamental plants
7 Exudates
8 Other plant products
Animal products / raw material
9 Living animals
10 Hides skins and trophies
11 Wild honey and beewax
12 Wild meat
13 Raw material for medicine
14 Raw material for colorants
15 Other edible animal products
16 Other non-edible animal products
Table 4c Pre-filled data from FAOSTAT
FRA 2015 category (1000 m 3 u.b.)Year
Total wood removals ...of which woodfuel
1990 4089 1503
1991 3650 1450
1992 3545 1870
1993 3547 1710
1994 2685 887
1995 2844 874
1996 3205 1185
1997 3041 1179
1998 3231 1388

FRA 2015 – Country Report, Bulgaria
37
1999 4351 1101
2000 4784 2107
2001 3992 1635
2002 4832 2187
2003 5388 2541
2004 5987 2909
2005 5862 2678
2006 5992 2885
2007 5696 2526
2008 6071 2692
2009 4599 2375
2010 5668 2657
2011 6205 2841
Tiers
Category Tier for status Tier for reported trend
Production forest Tier 3 Tier 3
Multiple use forest Tier 3 Tier 3
Tier Criteria
Category Tier for status Tier for reported trend
Production forest Multiple use forest Tier 3: Updated including fieldverifications national forest mapsincluding functions Tier 2: Forest mapsolder than 6 years including forestfunctions Tier 1: Other
Tier 3 : Estimate based on repeatedcompatible tiers 3 (tier for status) Tier 2 :Estimate based on repeated compatible tier2 or combination tier 3 and 2 or 1 (tier forstatus) Tier 1 : Other
4.5 Comments
Category Comments related todata definitions etc Comments on the reported trend
Production forest N/A N/A

FRA 2015 – Country Report, Bulgaria
38
Multiple use forest After the increase of the Protectedforests /after NATURA 2000 wasintroduced/ the data for Multiple useforest derived from linear interpolation arenot reliable because no other increase inprotected forests in the country is expectedin the next years
N/A
Total wood removals N/A N/A
Commercial value of NWFP The data are official data for 2010received from regional Forest Directoratesin EFA. No data available for game meetor other NWFP for 2010. Wildlingsare used for afforestation, esp. in areaswithout sufficient natural regeneration.
N/A
Other general comments to the table
Data about designated function of Forest in Bulgaria are calculated in every 5 years (1990, 1995, 2000, 2005, etc.). Data for 2010are available.

FRA 2015 – Country Report, Bulgaria
39
5. How much forest area is managed for protection of soil and water and ecosystemservices?Documents for this question:
• Guide for country reporting FRA 2015• FRA 2015 Terms and Definitions
5.1 Categories and definitions
Category Definition
Protection of soil andwater
Forest area designated or managed for protection of soil and water
...of which productionof clean water (sub-category)
Forest area primarily designated or managed for water production, where most human uses are excludedor heavily modified to protect water quality.
...of which coastalstabilization (sub-category)
Forest area primarily designated or managed for coastal stabilization.
...of which desertificationcontrol (sub-category)
Forest area primarily designated or managed for desertification control.
...of which avalanchecontrol (sub-category)
Forest area primarily designated or managed to prevent the development or impact of avalanches onhuman life assets or infrastructure.
...of which erosion, floodprotection or reducingflood risk (sub-category)
Forest area primarily designated or managed for protecting communities or assets from the impacts oferosion riparian floods and landslides or for providing flood plain services.
...of which other (sub-category)
Forest area primarily designated or managed for other protective functions.
Ecosystem services,cultural or spiritual values
Forest area primarily designated or managed for selected ecosystem services or cultural or spiritualvalues.
...of which publicrecreation (sub-category)
Forest area designated or managed for public recreation.
...of which carbon storageor sequestration (sub-category)
Forest area designated or managed for carbon storage or sequestration.
...of which spiritual orcultural services (sub-category)
Forest area designated or managed for spiritual or cultural services.
...of which other (sub-category)
Forest area designated or managed for other ecosystem services.
5.2 National data5.2.1 Data sources
References to sourcesof information Variables Years Additional comments
1 National forest fund report(NFB)
N/A since 1955 Executive Forest Agency

FRA 2015 – Country Report, Bulgaria
40
2 N/A N/A N/A N/A
3 N/A N/A N/A N/A
4 N/A N/A N/A N/A
5.2.2 Classification and definitions
National class Definition
Protective forests Forests with protective functions including water protectingforests; erosion preventing; irrigation (forest belts)
Water protective Forests designated for water production and protection ofdrinking water protected areas
Anti-erosion and meliorative forest Forests designaten for erosion control, prevention of floods,reducing flood risks; forest belts
N/A N/A
5.2.3 Original data
1990 2000 2005 2010
Forest (1000 ha)
Protective forests 431 433 451 439
From wich waterprotective
254 221 231 229
From whichanti-erosion andmeliorative
177 212 220 210
2015 data are calculated using linear interpolation
5.3 Analysis and processing of national data5.3.1 Adjustment

FRA 2015 – Country Report, Bulgaria
41
5.3.2 Estimation and forecasting
5.3.3 Reclassification
FORESTS
1990/2000/2005/2010
Protection of soil andwater
of which production ofclean water
of which erosion, floodprotection or reducingflood risk
Protective forests 100%
From wich waterprotective
100%
From which anti-erosion and meliorative
100%
5.4 DataTable 5a
Forest area (1000 hectares)Categories
1990 2000 2005 2010 2015
Protection of soiland water
430 433 451 439 427
... of whichproduction ofclean water
254 221 231 229 227
... of whichcoastalstabilization
0 0 0 0 0
... of whichdesertificationcontrol
0 0 0 0 0
... of whichavalanchecontrol
0 0 0 0 0

FRA 2015 – Country Report, Bulgaria
42
... of whicherosion, floodprotection orreducing floodrisk
176 212 220 210 200
... of which other(please specifyin commentsbelow the table)
0 0 0 0 0
Other
N/A
Table 5b
Forest area (1000 hectares)Categories
1990 2000 2005 2010 2015
Ecosystem services,cultural or spiritualvalues
230 223 238 219 200
...of which publicrecreation
N/A N/A N/A N/A N/A
...of whichcarbon storage orsequestration
N/A N/A N/A N/A N/A
...of which spiritualor cultural services
N/A N/A N/A N/A N/A
...of which other(please specify incomments belowthe table)
N/A N/A N/A N/A N/A
Tiers
Category Tier for reported trend Tier for status
Protection of soil and water Tier 3 Tier 3
Ecosystem services, cultural or spiritualvalues
Tier 3 Tier 3
Tier criteria
Category Tier for status Tier for reported trend

FRA 2015 – Country Report, Bulgaria
43
Protection of soil and water Tier 3: High reliability data derived eitherfrom high intensity sample survey or dataobtained from national or state agenciesresponsible for regulations or legislationrelating to soil and water protection. Tier2: Approaches based on low intensityor incomplete sample-based surveys orstudies that provide data for specific areasthat is extrapolated through statisticalanalysis to national level estimates. Tier 1:Other
Tier 3 : Estimate based on repeatedcompatible tiers 3 (tier for status) Tier 2 :Estimate based on repeated compatible tier2 or combination tier 3 and 2 or 1 (tier forstatus) Tier 1 : Other
• Cultural or spiritual values• Public recreation• Spiritual or cultural services• Other
Tier 3: High reliability data derivedeither from high intensity sample surveyor data obtained from national or stateagencies responsible for regulations. Tier2: Approaches based on low intensityor incomplete sample-based surveys orstudies that provide data for specific areasthat is extrapolated through statisticalanalysis to national level estimates. Tier 1:Other
Tier 3 : Estimate based on repeatedcompatible tiers 3 (tier for status) Tier 2 :Estimate based on repeated compatible tier2 or combination tier 3 and 2 or 1 (tier forstatus) Tier 1 : Other
5.5 Comments
Category Comments related todata definitions etc Comments on the reported trend
Protection of soil and water N/A N/A
Production of clean water N/A N/A
Coastal stabilization N/A N/A
Desertification control N/A N/A
Avalanche control N/A N/A
Erosion, flood protection or reducing floodrisk
Part of the national category protectiveforests.
N/A
Other protective functions N/A N/A
Ecosystem services, cultural or spiritualvalues
The forest in this category arerecreational, cultural, with spiritual valuesand could not be distinguished
N/A
Public recreation N/A N/A
Carbon storage or sequestration N/A N/A
Spiritual or cultural services N/A N/A
Other ecosystem services N/A N/A
Other general comments to the table

FRA 2015 – Country Report, Bulgaria
44
N/A

FRA 2015 – Country Report, Bulgaria
45
6. How much forest area is protected and designated for the conservation of biodiversityand how has it changed over time?Documents for this question:
• Guide for country reporting FRA 2015• FRA 2015 Terms and Definitions
6.1 Categories and definitions
Category Definition
Conservation ofbiodiversity
Forest area designated primarily for conservation of biological diversity. Includes but is not limited toareas designated for biodiversity conservation within the protected areas.
Forest area withinprotected areas
Forest area within formally established protected areas independently of the purpose for which theprotected areas were established.
6.2 National data6.2.1 Data sources
References to sourcesof information Variables Years Additional comments
1 National forest fund report(NFB)
Wood productionforests; Protected forests;Recreational forests; Others
Since 1955 Executive Forest Agency
2 N/A N/A N/A N/A
3 N/A N/A N/A N/A
4 N/A N/A N/A N/A
6.2.2 Classification and definitions
National class Definition
Protected forests Natural reserves, national parks, protected areas, historicalplaces, protected landscapes, natural sightseeing
N/A N/A
N/A N/A
N/A N/A
6.2.3 Original data
See 4.2.3.
FRA 2015 – Country Report, Bulgaria
46
6.3 Analysis and processing of national data6.3.1 Adjustment
6.3.2 Estimation and forecasting
6.3.3 Reclassification
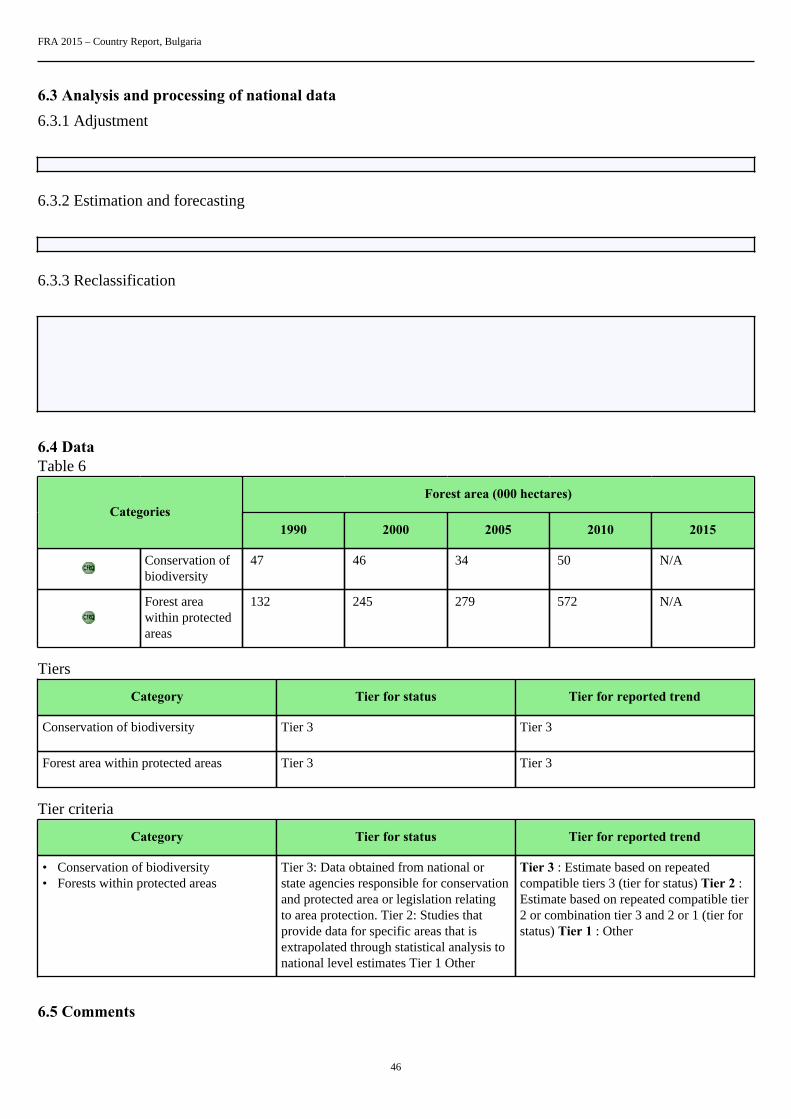
6.4 DataTable 6
Forest area (000 hectares)Categories
1990 2000 2005 2010 2015
Conservation ofbiodiversity
47 46 34 50 N/A
Forest areawithin protectedareas
132 245 279 572 N/A
Tiers
Category Tier for status Tier for reported trend
Conservation of biodiversity Tier 3 Tier 3
Forest area within protected areas Tier 3 Tier 3
Tier criteria
Category Tier for status Tier for reported trend
• Conservation of biodiversity• Forests within protected areas
Tier 3: Data obtained from national orstate agencies responsible for conservationand protected area or legislation relatingto area protection. Tier 2: Studies thatprovide data for specific areas that isextrapolated through statistical analysis tonational level estimates Tier 1 Other
Tier 3 : Estimate based on repeatedcompatible tiers 3 (tier for status) Tier 2 :Estimate based on repeated compatible tier2 or combination tier 3 and 2 or 1 (tier forstatus) Tier 1 : Other
6.5 Comments

FRA 2015 – Country Report, Bulgaria
47
Category Comments related todata definitions etc Comments on the reported trend
Conservation of biodiversity N/A N/A
Forest area within protected areas The reason for the big increase are theforests incl. in NATURA 2000 sites afterEU accession. About 54% of the forests inthe country are in NATURA 2000 sites.About 60% of them are at the expense ofthe category forests designated for woodsupply.
No sense to calculate the 2015 datausing linear interpolation/ because of thevery big difference in the protected areascategory
Other general comments to the table
N/A

FRA 2015 – Country Report, Bulgaria
48
7. What is the area of forest affected by woody invasive species?Documents for this question:
• Guide for country reporting FRA 2015• FRA 2015 Terms and Definitions
7.1 Categories and definitions
Category Definition
Invasive species Species that are non-native to a particular ecosystem and whose introduction and spread cause, or arelikely to cause, socio-cultural, economic or environmental harm or harm to human health.
7.2 National data7.2.1 Data sources
References to sourcesof information Variables Years Additional comments
1 National forest fund report N/A Since 1955 Executive Forest Agency
2 Forest protection stations –official statistics (Branches ofNFB)
Disturbance by insects,disturbance by insects, other
annual www.iag.bg - annual EFAreport
3 N/A N/A N/A N/A
4 N/A N/A N/A N/A
7.2.2 Classification and definitions
National class Definition
N/A N/A
N/A N/A
N/A N/A
N/A N/A
7.2.3 Original data
7.3 Analysis and processing of national data7.3.1 Adjustment

FRA 2015 – Country Report, Bulgaria
49
7.3.2 Estimation and forecasting
7.3.3 Reclassification
7.4 DataTable 7
Forest area affected (000 ha)Scientific name of
woody invasive species2005 2010
Amorpha fruticosa N/A N/A
Fraxinus americana N/A N/A
Ailantus altisima N/A N/A
N/A N/A N/A
N/A N/A N/A
N/A N/A N/A
N/A N/A N/A
N/A N/A N/A
N/A N/A N/A
N/A N/A N/A
Total N/A N/A
Tiers
Category Tier for status Tier for reported trend
Invasive species Tier 3 Tier 3
Tier Criteria
Category Tier for status Tier for reported trend

FRA 2015 – Country Report, Bulgaria
50
Invasive species Tier 3: Systematic assessment in forestinventory or other survey (e.g. byconservation department) within the last5 years) Tier 2: Systematic assessment inforest inventory or other survey (e.g. byconservation department conducted morethan 5 years ago) Tier 1: Other
Tier 3 : Estimate based on repeatedcompatible tiers 3 (tier for status) Tier 2 :Estimate based on repeated compatible tier2 or combination tier 3 and 2 or 1 (tier forstatus) Tier 1 : Other
7.5 Comments
Category Comments related todata definitions etc Comments on the reported trend
Invasive species There is no methodology for systematicmonitoring of invasive species; there areonly a few scientific investigations in thearea
N/A
Other general comments to the table
N/A

FRA 2015 – Country Report, Bulgaria
51
8. How much forest area is damaged each year?Documents for this question:
• Guide for country reporting FRA 2015• FRA 2015 Terms and Definitions
8.1 Categories and definitions
Category Definition
Number of fires Number of fires per year
Burned area Area burned per year
Outbreaks of insects A detectable reduction in forest health caused by a sudden increase in numbers of harmful insects.
Outbreaks of diseases A detectable reduction in forest health caused by a sudden increase in numbers of harmful pathogens,such as bacteria, fungi, phytoplasma or virus.
Severe weather events Damage caused severe weather events, such as snow, storm, drought, etc.
8.2 National data8.2.1 Data sources
References to sourcesof information Variables Years Additional comments
1 National forest fund report N/A since 1955 Executive Forest Agency -responsible for the report
2 N/A N/A N/A N/A
3 N/A N/A N/A N/A
4 N/A N/A N/A N/A
8.2.2 Classification and definitions
National class Definition
Number of fires Number of fires per year.
Burned area Area burned per year
Outbreaks of insects A detectable reduction in forest health caused by a suddenincrease in numbers of harmful insects.
Outbreaks of diseases A detectable reduction in forest health caused by a suddenincrease in numbers of harmful pathogens, such as bacteria,fungi, phytoplasma or virus.

FRA 2015 – Country Report, Bulgaria
52
8.2.3 Original data
8.3 Analysis and processing of national data8.3.1 Adjustment
8.3.2 Estimation and forecasting
8.3.3 Reclassification
8.4 DataTable 8a
000 ha, number of fires
2003 2004 2005 2006 2007Category
000 ha # 000 ha # 000 ha # 000 ha # 000 ha #
Totalland areaburned
83.77 N/A 106.08 N/A 36.61 N/A 206.72 N/A 258.67 N/A
... ofwhichforestareaburned
5 452 1.14 294 1.46 241 3.54 393 43 1479
2008 2009 2010 2011 2012Category
000 ha # 000 ha # 000 ha # 000 ha # 000 ha #
Totalland areaburned
227.27 N/A 78.15 N/A 118.48 N/A 141.94 N/A 254.11 N/A
... ofwhichforestareaburned
5.3 582 2.3 314 6.5 222 6.9 635 12.7 876
Table 8b
Outbreak category Description/name Year(s) of latest outbreak Area damaged (000 hectares)

FRA 2015 – Country Report, Bulgaria
53
1 Lymantria dispar 2009 and 2011 38
1 Geometridae, Torticidae 2010 54
1 Euproctis chrysorrhea 2010 - 2011 0.14
1 Traumatocampa pityocampa 2010 19.6
1 Neodiprion pini 2009 8.3
2 Pine drying 2011 2.1
2 Oak drying 2010 2.8
2 Hypoxylon mediterraneum /Quercus cerris drying/
2010 1.3
N/A N/A N/A N/A
N/A N/A N/A N/A
Outbreak category
1 Insects
2 Diseases
3 Severe weather events
Tiers
Category Tier for status Tier for trend
Area affected by fire Tier 2 Tier 2
• Insects• Diseases• Severe weather events
Tier 3 Tier 3
Tier criteria
Category Tier for status Tier for reported trend
Burned area Tier 3 : National fire monitoring routinesTier 2 : Remote sensing surveys Tier 1 :Other
Tier 3 : Estimate based on repeatedcompatible tiers 3 (tier for status) Tier 2 :Estimate based on repeated compatible tier2 or combination tier 3 and 2 or 1 (tier forstatus) Tier 1 : Other
• Insects• Diseases• Severe weather events
Tier 3 : Systematic survey (e.g. viainventory or aerial damage assessment)Tier 2 : Management records Tier 1 :Other
Tier 3 : Estimate based on repeatedcompatible tiers 3 (tier for status) Tier 2 :Estimate based on repeated compatible tier2 or combination tier 3 and 2 or 1 (tier forstatus) Tier 1 : Other

FRA 2015 – Country Report, Bulgaria
54
8.5 Comments
Category Comments related todata definitions etc Comments on the reported trend
Burned area Tier 2 data have been used for burnedarea detected through MODIS andprovided by FAO.
N/A
Insects N/A The damaged areas in the years after 2008are smaller. The outbreaks are the mostrecent
Diseases N/A The damaged areas in the years after 2008are smaller. The outbreaks are the mostrecent
Severe weather events N/A N/A
Other general comments to the table
*Quercus cerris drying (Hypoxylon mediterraneum) – the reason for drying is more complex than activeness of Hypoxylonmediterraneum. The definitions correspond to the FRA ones.

FRA 2015 – Country Report, Bulgaria
55
9. What is the forest area with reduced canopy cover?Documents for this question:
• Guide for country reporting FRA 2015• FRA 2015 Terms and Definitions
Category Definition
Reduction in canopycover
Forest that has undergone a reduction of canopy cover of more than 20% between the years 2000 and2010 within the forest canopy cover range of 30-80% as detected by the MODIS VCF sensor.
Table 9
Category Area of forest with reduced canopy cover (000 ha)
Reduction in canopycover
11.6
Tiers
Category Tier for reported trend
Reduction in canopycover
Tier 3
Tier criteria
Category Tier for reported trend
Reduction in canopycover
Tier 3 : Remote sensing with ground truthing and/or Landsat imagery Tier 2 : Remote sensing usingModis (using pre-filled data provided by FAO) Tier 1 : Expert opinion
Comments
Category Comments related to data definitions etc
Reduction in canopycover
N/A
Other general comments

FRA 2015 – Country Report, Bulgaria
56
10. What forest policy and regulatory framework exists to support implementation ofsustainable forest management SFM?Documents for this question:
• Guide for country reporting FRA 2015• FRA 2015 Terms and Definitions
10.1 Categories and definitions
Category Definition
Policies supportingsustainable forestmanagement
Policies or strategies that explicitly encourage sustainable forest management.
Legislation andregulations supportingsustainable forestmanagement
Legislation and regulations that govern and guide sustainable forest management, operations and use.
10.2 National data10.2.1 Data sources
References to sourcesof information Variables Years Additional comments
1 Forest act and sub-ordinatelegislation www.iag.bg
laws, regulations, ordinances N/A Executive Forest Agency
2 National strategy forsustainable development offorest sector www.iag.bg /new strategy underpreparation/
strategy 2006-2015 Executive Forest Agency
3 Strategic plan fordevelopment of forest sectorwww.iag.bg
action plan 2007 - 2011 Executive Forest Agency
4 Forest managment plans N/A every 10 years Executive Forest Agency
10.2.2 Classification and definitions
National class Definition
N/A N/A
N/A N/A
N/A N/A
N/A N/A

FRA 2015 – Country Report, Bulgaria
57
10.2.3 Original data
10.3 DataTable 10
Sub-nationalCategoryNational
Regional Provincial/State Local
Policies supportingsustainable forestmanagement
yes yes no yes
... of which, in publiclyowned forests
yes yes no yes
... of which, in privatelyowned forests
yes yes no yes
Legislation andregulations supportingsustainable forestmanagement
yes no no no
... of which, in publiclyowned forests
yes no no no
... of which, in privatelyowned forests
yes no no no
10.4 Comments
Variable / category Comments related to data definitions etc
Policies supporting sustainable forest management According to the Forest legislation /Forest law/ and Nationalstrategy for the development of the forest sector 2013 -2020,there are forest management programmes and plans on regionaland local level
Legislation and regulations supporting sustainable forestmanagement
N/A
Other general comments

FRA 2015 – Country Report, Bulgaria
58
11. Is there a national platform that promotes stakeholder participation in forest policydevelopment?Documents for this question:
• Guide for country reporting FRA 2015• FRA 2015 Terms and Definitions
11.1 Categories and definitions
Category Definition
National stakeholderplatform
A recognized procedure that a broad range of stakeholders can use to provide opinions, suggestions,analysis, recommendations and other input into the development of national forest policy.
11.2 National data11.2.1 Data sources
References to sources of information Years Additional comments
1 Forest Act 2014 /last amendment/ not officially available in Englishwww.iag.bg
2 N/A N/A N/A
3 N/A N/A N/A
4 N/A N/A N/A
Table 11Is there a national platform that promotes or allows forstakeholder participation in forest policy development?
yes
11.3 Comments
Category Comments related to data definitions etc
National stakeholder platform National Forest Council /art. 155 of the Forest Act - with theparticipation of all stakleholders/
Other general comments

FRA 2015 – Country Report, Bulgaria
59
12. What is the forest area intended to be in permanent forest land use and how has itchanged over time?Documents for this question:
• Guide for country reporting FRA 2015• FRA 2015 Terms and Definitions
12.1 Categories and definitions
Category Definition
Forest area intended to bein permanent forest landuse
Forest area that is designated or expected to be retained as forest and is highly unlikely to be convertedto other land use.
...of which permanentforest estate (sub-category)
Forest area that is designated by law or regulation to be retained as forest and may not be converted toother land use.
12.2 National data12.2.1 Data sources
References to sourcesof information Variables Years Additional comments
1 National forest fund report(NFB)
Wood productionforests; Protected forests;Recreational forests; Others
Since 1955 Executive Forest Agency
2 N/A N/A N/A N/A
3 N/A N/A N/A N/A
4 N/A N/A N/A N/A
12.2.2 Classification and definitions
National class Definition
N/A N/A
N/A N/A
N/A N/A
N/A N/A
12.2.3 Original data
See Table 1.2.3.

FRA 2015 – Country Report, Bulgaria
60
12.3 Analysis and processing of national data12.3.1 Adjustment
12.3.2 Estimation and forecasting
see Table 1.3.2
12.3.3 Reclassification
12.4 DataTable 12
Categories Forest area 2010 (000 ha)
Forest area intended to be in permanentforest land use
3737
... of which permanent forest estate 3737
Tiers
Category Tier for status
Forest area intended to be in permanent forest land use Tier 3
Permanent forest estate Tier 3
Tier Criteria
Category Tier for status
Forest area intended to be in permanent forest land use Tier 3 : National or sub-national land use plans strategydocuments or other reports within the past 10 years Tier 2 :National or sub-national land use plans strategy documents orother reports within the past 20 years Tier 1 : Other
Permanent forest estate Tier 3 : National or sub-national land use plans strategydocuments or other reports within the past 10 years Tier 2 :National or sub-national land use plans strategy documents orother reports within the past 20 years Tier 1 : Other
12.5 Comments
Category Comments related to data definitions etc
Forest area intended to be in permanent forest land use According to the Forest Act the forest area in the country mustbe in permanent forest land use. Exceptions only for importantinfrastructural projects or projects very important for the society

FRA 2015 – Country Report, Bulgaria
61
Permanent forest estate Forest area according to Forest Act is permanent forest estateby default. Only for projects of very important interests forthe society ,forest area can change its purpose /infrastructuralprojects, electric power line, etc.
Other general comments

FRA 2015 – Country Report, Bulgaria
62
13. How does your country measure and report progress towards SFM at the nationallevel?Documents for this question:
• Guide for country reporting FRA 2015• FRA 2015 Terms and Definitions
13.1 Categories and definitions
Category Definition
Forest area monitoredunder a national forestmonitoring framework
Forest area monitored by a national monitoring framework or systems that provide measurement basedperiodic monitoring of forest extent and quality.
Forest reporting atnational scale
National reporting of forest extent and characteristics that includes some measure of progress towardsustainable forest management.
13.2 National data13.2.1 Data sources
References to sourcesof information Variables Years Additional comments
1 Forest managment plans N/A every 10 years Executive Forest Agency
2 N/A N/A N/A N/A
3 N/A N/A N/A N/A
4 N/A N/A N/A N/A
13.2.2 Classification and definitions
National class Definition
N/A N/A
N/A N/A
N/A N/A
N/A N/A
13.3 DataTable 13a

FRA 2015 – Country Report, Bulgaria
63
Check all boxes that apply
Category % of totalforest area
Mostrecent year
Continuous PeriodicPermanent
groundplots
Temporaryground
plots
Aerial/remotesensingsamplebased
Aerial/remote
sensing fullcoverage
Forestinventory
100 2013 yes yes no no no no
Other fieldassessments
N/A 2013 no yes no yes no no
Updatesto othersources
N/A N/A no no no no no no
Expertestimate
N/A N/A
Table 13b
Type of forest reporting used at national scale Check boxes that apply
1 Criteria and Indicators reporting yes
2 Periodic national state of the forest report yes
3 Other (please document) no
4 None no
Other type of forest reporting
N/A
13.4 Comments
Category Comments
Other field assessment Field assessment taken in the framework of different projectsimplemented by the Executive Forest Agency
N/A N/A
N/A N/A
Other general comments
FRA 2015 – Country Report, Bulgaria
64
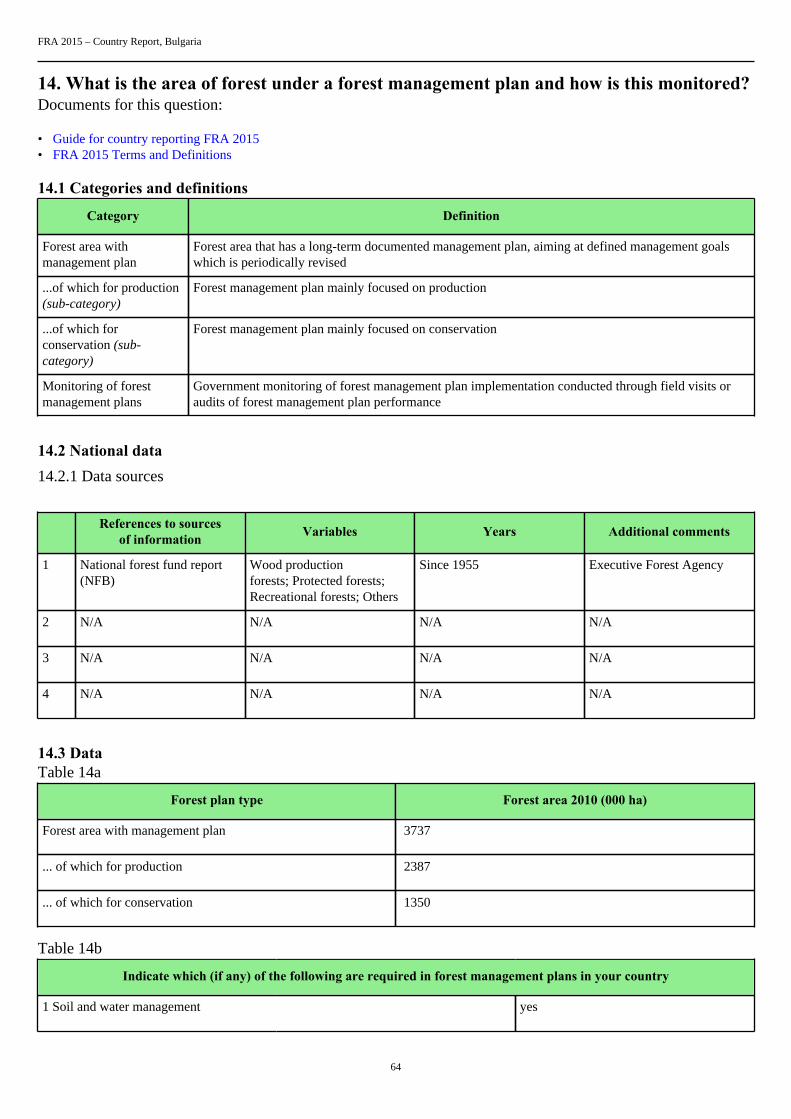
14. What is the area of forest under a forest management plan and how is this monitored?Documents for this question:
• Guide for country reporting FRA 2015• FRA 2015 Terms and Definitions
14.1 Categories and definitions
Category Definition
Forest area withmanagement plan
Forest area that has a long-term documented management plan, aiming at defined management goalswhich is periodically revised
...of which for production(sub-category)
Forest management plan mainly focused on production
...of which forconservation (sub-category)
Forest management plan mainly focused on conservation
Monitoring of forestmanagement plans
Government monitoring of forest management plan implementation conducted through field visits oraudits of forest management plan performance
14.2 National data14.2.1 Data sources
References to sourcesof information Variables Years Additional comments
1 National forest fund report(NFB)
Wood productionforests; Protected forests;Recreational forests; Others
Since 1955 Executive Forest Agency
2 N/A N/A N/A N/A
3 N/A N/A N/A N/A
4 N/A N/A N/A N/A
14.3 DataTable 14a
Forest plan type Forest area 2010 (000 ha)
Forest area with management plan 3737
... of which for production 2387
... of which for conservation 1350
Table 14b
Indicate which (if any) of the following are required in forest management plans in your country
1 Soil and water management yes
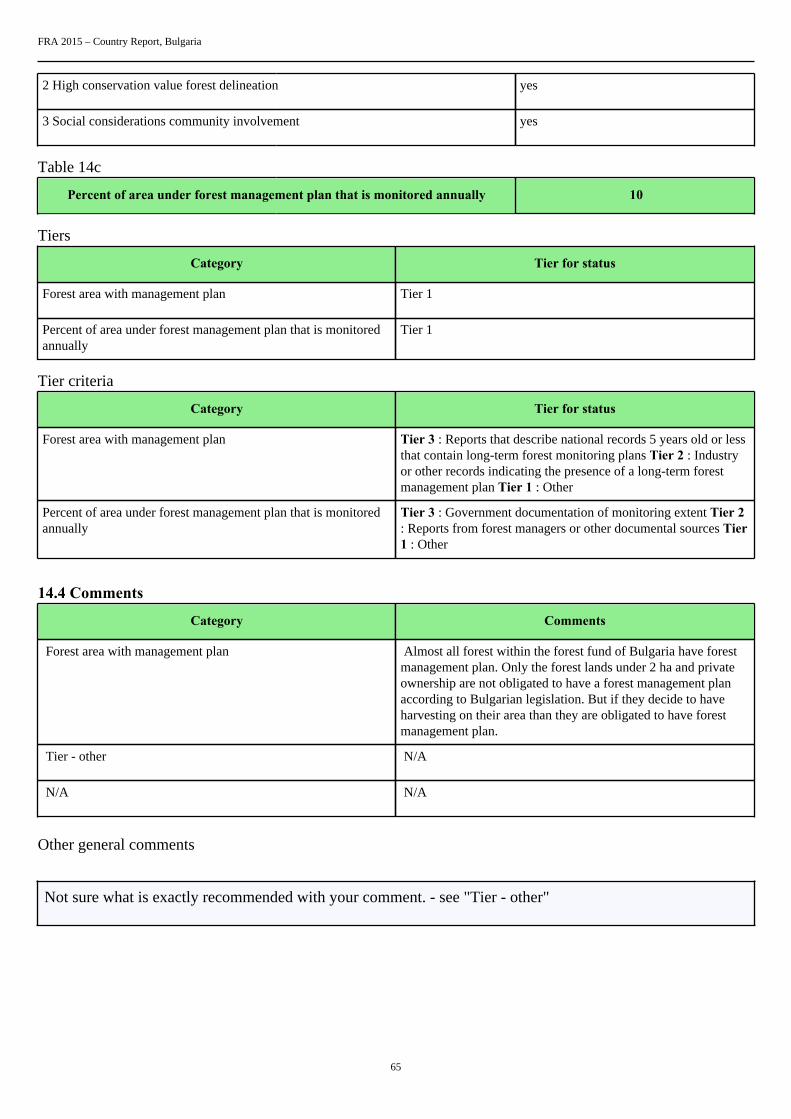
FRA 2015 – Country Report, Bulgaria
65
2 High conservation value forest delineation yes
3 Social considerations community involvement yes
Table 14c
Percent of area under forest management plan that is monitored annually 10
Tiers
Category Tier for status
Forest area with management plan Tier 1
Percent of area under forest management plan that is monitoredannually
Tier 1
Tier criteria
Category Tier for status
Forest area with management plan Tier 3 : Reports that describe national records 5 years old or lessthat contain long-term forest monitoring plans Tier 2 : Industryor other records indicating the presence of a long-term forestmanagement plan Tier 1 : Other
Percent of area under forest management plan that is monitoredannually
Tier 3 : Government documentation of monitoring extent Tier 2: Reports from forest managers or other documental sources Tier1 : Other
14.4 Comments
Category Comments
Forest area with management plan Almost all forest within the forest fund of Bulgaria have forestmanagement plan. Only the forest lands under 2 ha and privateownership are not obligated to have a forest management planaccording to Bulgarian legislation. But if they decide to haveharvesting on their area than they are obligated to have forestmanagement plan.
Tier - other N/A
N/A N/A
Other general comments
Not sure what is exactly recommended with your comment. - see "Tier - other"

FRA 2015 – Country Report, Bulgaria
66
15. How are stakeholders involved in the management decision making for publiclyowned forests?Documents for this question:
• Guide for country reporting FRA 2015• FRA 2015 Terms and Definitions
15.1 Categories and definitions
Category Definition
Stakeholder involvement Stakeholder involvement is defined as significant inputs into at least one aspect of forest management atthe operational scale
Table 15
Please indicate the type of stakeholder involvement in forest management decision making required in your country
1. Planning phase yes
2. Operations phase no
3. Review of operations yes
Tiers
Category Tier for status
Type of stakeholder inputs Tier 3
Tier criteria
Category Tier for status
Type of stakeholder inputs Tier 3 : Government (national or sub-national) documentation ofstakeholder inputs Tier 2 : Government (national or subnational)requirement but stakeholder inputs not documented Tier 1 :Other
15.2 Comments
Category Comments
Planning phase According to the national legislation stakeholders are involvedin the planning phase of the elaboration of forest managementplans through their direct participation in the official expertmeetings for their preparation and approval - giving suggestions,opinions, etc.
Review of operators Participation in official public discussions
N/A N/A

FRA 2015 – Country Report, Bulgaria
67
Other general comments

FRA 2015 – Country Report, Bulgaria
68
16. What is the area of forest under an independently verified forest certification scheme?Documents for this question:
• Guide for country reporting FRA 2015• FRA 2015 Terms and Definitions
16.1 Categories and definitions
Category Definition
FSC certification Forest area certified under the Forest Stewardship Council certification scheme
PEFC certification Forest area certified under the Programme for the Endorsement of Forest Certification scheme
Other international forestmanagement certification
Forest area certified under an international forest management certification scheme with publishedstandards and is independently verified by a third-party, excluding FSC and PEFC certification.
Certified forest areausing a domestic forestmanagement certificationscheme
Area certified under a forest management certification scheme with published standards that arenationally recognized and independently verified by a thirdparty
16.2 DataTable 16a
Forest area (000 ha)International forest
management certification2000 2001 2002 2003 2004 2005 2006
FSC 0 0 0 0 0 0 20.2
PEFC 0 0 0 0 0 0 0
Other 0 0 0 0 0 0 0
2007 2008 2009 2010 2011 2012
FSC 21.61 106.2 104.36 303.58 217.55 218.39
PEFC 0 0 0 0 0 0
Other 0 0 0 0 0 0
Table 16b
Forest area (000 ha)Domestic forest
management certification2000 2001 2002 2003 2004 2005 2006
na 0 0 0 0 0 0 0
na 0 0 0 0 0 0 0
na 0 0 0 0 0 0 0

FRA 2015 – Country Report, Bulgaria
69
2007 2008 2009 2010 2011 2012
na 0 0 0 0 0 0
na 0 0 0 0 0 0
na 0 0 0 0 0 0
Tier criteria
Category Tier for status
International forest management certification Tier 3: International forest management scheme recordsmaintained by the certifying organization for the reporting yearTier 2: International forest management scheme records reportedby the certifying organization for a period 2 years prior to thereporting year Tier: 1 Other
Domestic forest management certification Tier 3: National registry reports for domestic forest managementcertification maintained by the certifying organization for thereporting year Tier 2: Domestic forest management schemerecords reported by the certifying organization for a period 2years prior to the reporting year Tier: 1 Other
Tiers
Category Tier for status
International forest management certification Tier 3
Domestic forest management certification Tier 3
16.3 Comments
Category Comments related to data definitions etc
Certified forest area using an international forest managementcertification scheme
N/A
Domestic forest management certification N/A
Other general comments

FRA 2015 – Country Report, Bulgaria
70
17. How much money do governments collect from and spend on forests?Documents for this question:
• Guide for country reporting FRA 2015• FRA 2015 Terms and Definitions
17.1 Categories and definitions
Category Definition
Forest revenue All government revenue collected from the domestic production and trade of forest products andservices. For this purpose revenue include:• Goods : roundwood; sawnwood; biomass; woodbased panels; pulp and paper and non-wood forest
products.• Services : including concession fees and royalties, stumpage payments, public timber sales revenue
taxes and charges based on forest area or yield, taxes on domestic trade and export of forest products,special levies on forestry activities and payments into forest related funds, other miscellaneousinspection, licence and administrative fees levied by forest administrations, permit and licence feesfor recreation and other forest related activities.
Public expenditure onforestry
All government expenditure on forest related activities.
17.2 National data17.2.1 Data sources
References to sourcesof information Variables Years Additional comments
1 Official State ForestryAgency budget report
Revenues, Expenditures /operational, transfer/
2000, 2005, 2010 N/A
2 N/A N/A N/A N/A
3 N/A N/A N/A N/A
4 N/A N/A N/A N/A
17.3 DataTable 17
Revenues / expenditures (000 local currency)Category
2000 2005 2010
Forest revenue 75480 72390 70416
Public expenditure on forestry 84286 91077 51369
2000 2005 2010
Name of Local Currency lev lev lev

FRA 2015 – Country Report, Bulgaria
71
17.4 Comments
Category Comments related to data definitions etc
Forest revenue N/A
Public expenditure on forestry Due to a very big international project (Forest sectordevelopment project sponsored by World Bank), Bulgariareceived the amount of 1048$ from the World bank.
Other general comments All European and international projects/from EU funds/ areincluded
Other general comments

FRA 2015 – Country Report, Bulgaria
72
18. Who owns and manages the forests and how has this changed?Documents for this question:
• Guide for country reporting FRA 2015• FRA 2015 Terms and Definitions
18.1 Categories and definitions
Category Definition
Public ownership Forest owned by the State or administrative units of the public administration or by institutions orcorporations owned by the public administration.
...of which owned by thestate at national scale(sub-category)
Forest owned by the State at the national scale or administrative units of the public administration or byinstitutions or corporations owned by the public administration.
...of which owned by thestate at the sub-nationalgovernment scale (sub-category)
Forest owned by the State at the sub-national government scale or administrative units of the publicadministration or by institutions or corporations owned by the public administration.
Private ownership Forest owned by individuals, families, communities, private cooperatives corporations and otherbusiness entities, private, religious and educational institutions, pension or investment funds, NGOs,nature conservation associations and other private institutions.
...of which individuals(sub-category)
Forest owned by individuals and families.
...of which privatebusiness entities andinstitutions (sub-category)
Forest owned by private corporations cooperatives companies and other business entities as well asprivate nonprofit organizations such as NGOs nature conservation associations, and private religiousand educational institutions etc.
...of which local tribal andindigenous communities(sub-category)
Forest owned by a group of individuals belonging to the same community residing within or in thevicinity of a forest area or forest owned by communities of indigenous or tribal people The communitymembers are coowners that share exclusive rights and duties and benefits contribute to the communitydevelopment.
Unknown ownership Forest area where ownership is unknown includes areas where ownership is unclear or disputed.
Categories related tomanagement rights
of public forestsDefinition
Public Administration The Public Administration (or institutions or corporations owned by the Public Administration) retainsmanagement rights and responsibilities within the limits specified by the legislation.
Individuals households Forest management rights and responsibilities are transferred from the Public Administration toindividuals or households through long-term leases or management agreements.
Private companies Forest management rights and responsibilities are transferred from the Public Administration tocorporations, other business entities private cooperatives, private nonprofit institutions and associations,etc., through long-term leases or management agreements.
Communities Forest management rights and responsibilities are transferred from the Public Administration to localcommunities (including indigenous and tribal communities) through long-term leases or managementagreements.
Other form ofmanagement rights
Forests for which the transfer of management rights does not belong to any of the categories mentionedabove.
18.2 National data

FRA 2015 – Country Report, Bulgaria
73
18.2.1 Data sources
References to sourcesof information Variables Years Additional comments
1 National forest fund report Public ownership Privateownership ...of which ownedby individuals ...of whichowned by private businessentities and institutions ...ofwhich owned by localcommunities ...of whichowned by indigenous / tribalcommunities Other types ofownership
Since 1955 Original data source ofExecutive forest agency
2 N/A N/A N/A N/A
3 N/A N/A N/A N/A
4 N/A N/A N/A N/A
18.2.2 Classification and definitions
National class Definition
State ownership Forest owned by the State
Community ownership Forest owned by the municipalities
Religious institution ownership Forest area owned by the church
Private ownership All individual, family ownership (physical and legal bodies)
18.2.3 Original data
Original data
Forestarea (1000 hectares)
Original data
1990 2000 2005 2010
Public ownership 3327.027 2763.847 2651.566 2611.619

FRA 2015 – Country Report, Bulgaria
74
Community/municipality/ownership
0 205.843 427.750 465.321
Forests belongingto Ministry ofEnvironment andWater
0 93.447 108.206 108.323
“Agricultural”forest fund
0 14.556 52.302 90.889
Educational andexperimentalforests
0 14.148 10.602 10.570
Privateindividuals
0 264.272 374.441 405.211
Private legalentities
0 3.168 8.865 27.542
Religiousinstitutions
15.836 17.511 18.067
TOTAL 3327 3375.117 3651.243 3737.542
18.3 Analysis and processing of national data18.3.1 Adjustment
No calibration needed
18.3.2 Estimation and forecasting
Not needed
18.3.3 Reclassification

FRA 2015 – Country Report, Bulgaria
75
National categories
FRAcategories
Publicownership
Community/municipality/ownership
ForestsbelongingtoMinistryofEnvironmentandWater
“Agricultural”forestfund
Educationalandexperimentalforests
Privateindividuals
Privatelegalentities
Religiousinstitutions
Publicownership
100% 100% 100% 100% 100%
Privateownership
100% 100% 100%
...ofwhichownedbyindividuals
100%
...ofwhichownedbyprivatebusinessentitiesandinstitutions
100% 100%
...ofwhichownedby localcommunities
...ofwhichownedbyindigenous /tribalcommunities

FRA 2015 – Country Report, Bulgaria
76
Othertypes ofownership
18.4 DataTable 18a
Forest area (1000 hectares)Categories
1990 2000 2005 2010
Public ownership 3327 3092 3250 3286
... of which ownedby the state atnational scale
3327 3092 3250 3286
... of which ownedby the state atthe sub-nationalgovernment scale
0 0 0 0
Private ownership 0 283 401 451
... of which ownedby individuals
0 264 374 405
... of which ownedby private businessentities andinstitutions
0 19 27 46
... of which ownedby local, tribaland indigenouscommunities
0 0 0 0
Unknownownership
0 0 0 0
TOTAL 3327.00 3375.00 3651.00 3737.00
Tiers
Category Tier for status Tier for reported trend
Public ownership Tier 3 Tier 3
Private ownership Tier 3 Tier 3
Unknown ownership Tier 3 Tier 3
Tier criteria
Category Tier for status Tier for reported trend

FRA 2015 – Country Report, Bulgaria
77
Ownership Tier 3: National forestry statistics registersof land titles or maps on land ownershipor all forest area under one ownershipcategory that is five years old or less. Tier2:National forestry statistics registers ofland titles or maps on land ownership orquestionnaires that are more than fiveyears old. Tier 1: Other
Tier 3 : Estimate based on repeatedcompatible tiers 3 (tier for status) Tier 2 :Estimate based on repeated compatible tier2 or combination tier 3 and 2 or 1 (tier forstatus) Tier 1 : Other
Table 18b - Holder of management rights of public forests
Forest area (000 hectares)Categories
1990 2000 2005 2010
Public Administration 3327 2886 2822 2577
Individuals 0 0 0 0
Private companies 0 0 0 244
Communities 0 206 428 465
Other 0 0 0 0
TOTAL 3327.00 3092.00 3250.00 3286.00
Category Tier for reported trend Tier for status
Public Administration Tier 3 Tier 3
Individuals Tier 3 Tier 3
Private companies Tier 3 Tier 3
Communities Tier 3 Tier 3
Other Tier 3 Tier 3
18.5 Comments
Category Comments related todata definitions etc Comments on the reported trend
Public ownership Community forests are state ownership N/A
Private ownership N/A N/A
Unknown ownership N/A N/A
Management rights The management rights of communityforests belong to the community /this isdefined by the Bulgarian Forestry Act/
N/A

FRA 2015 – Country Report, Bulgaria
78
Other general comments to the table
N/A

FRA 2015 – Country Report, Bulgaria
79
19. How many people are directly employed in forestry?Documents for this question:
• Guide for country reporting FRA 2015• FRA 2015 Terms and Definitions
19.1 Categories and definitions
Category Definition
Full-time equivalents(FTE)
A measurement equal to one person working full-time during a specified reference period.
Employment in forestry Employment in activities related to production of goods derived from forests. This category correspondsto the ISIC/NACE Rev. 4 activity A02 (Forestry and logging).
19.2 National data19.2.1 Data sources
References to sourcesof information Variables Years Additional comments
1 Labour Force Survey 2000, 2005, 2010 N/A EUROSTAT, Nationalstatistic institute
2 2000, 2005 R&D survey 2000, 2005 N/A EUROSTAT, Nationalstatistic institute
3 EUROSTAT, Nationalstatistic institute
2010 N/A EUROSTAT, Nationalstatistic institute
4 N/A N/A N/A N/A
19.2.2 Classification and definitions
National class Definition
N/A N/A
N/A N/A
N/A N/A
N/A N/A
19.2.3 Original data
1.1.1

FRA 2015 – Country Report, Bulgaria
80
1990 2000 2005
Employment inforestry, loggingand related serviceactivities *
n.a. 26.3 20.5
...of which paidemployment *
n.a. 23.0 18.9
...of which self-employment *
n.a. 3.3 1.6
*Data are reported in number of employed persons
The unit “Full-time equivalents (FTE) corresponds to one person working full time. 1000 years FTE correspondsto 1000 persons working full-time during one year, or 2000 persons working half time during one year.
19.3 DataTable 19
Employment (000 years FTE)Category
1990 2000 2005 2010
Employment inforestry
N/A 26 21 20.2
... of which female N/A N/A 5.2 5.3
19.4 Comments
Category Comments related todata definitions etc Comments on the reported trend
Employment in forestry Incl. administrative staff /2378 employed/ N/A
Other general comments to the table
Data are reported in number of employed persons (data are not converted into full-time equivalents). There are no detailed datafor 2010 available. The data are taken from Eurostat statistics. The female are expert calculated as a percentage. The data fromEUROSTAT are taken more than 6 months ago when this report was created. Changes in the statistics are possible.

FRA 2015 – Country Report, Bulgaria
81
20. What is the contribution of forestry to Gross Domestic Product (GDP)?Documents for this question:
• Guide for country reporting FRA 2015• FRA 2015 Terms and Definitions
20.1 Categories and definitions
Category Definition
Gross value added fromforestry (at basic prices)
This category corresponds to the ISIC/NACE Rev. 4 activity A02 (Forestry and logging).
20.2 DataTable 20 (Pre-filled data from UNdata/EUROSTAT)
Category Million Currency Year for latestavailable information
Gross value added fromforestry (at basic prices)
151.56 lev 2010
20.3 Comments
Category Comments
N/A N/A
Other general comments

FRA 2015 – Country Report, Bulgaria
82
21. What is forest area likely to be in the futureDocuments for this question:
• Guide for country reporting FRA 2015• FRA 2015 Terms and Definitions
21.1 Categories and definitions
Category Definition
Government target/aspiration for forest area
Government target/aspiration for forest area for a specific year.
Forests earmarked forconversion
Forest area that is allocated/classified or scheduled to be converted into non-forest uses.
21.2 National data21.2.1 Data sources
References to sourcesof information Variables Years Additional comments
1 Forest Act N/A 2012 Executive forest agency,www.iag.bg
2 3rd National action plan forclimate change 2013 -2020,Ministry of environment andwaters
N/A N/A N/A
3 National strategy forsustainable development offorest sector /New strategyunder preparation/, Executiveforest agency, Ministry ofagriculture and food
N/A 2006-2015 Ministry of agriculture andfood
4 Strategic plan fordevelopment of forest sector,Executive forest agencywww.iag.bg
N/A 2007-2011 Executive forest agency
21.3 DataTable 21a
Forest area (000 ha)Category
2020 2030
Government target/aspiration for forestarea
3900 4080
Table 21b
Forest area (000 ha)Category
2013

FRA 2015 – Country Report, Bulgaria
83
Forests earmarked for conversion N/A
21.4 Comments
Category Comments
Government target/aspiration for forest area Forest area will continue to increase, because of sometendencies marked in Forest Act, strategic or other documents,approved on governmental level, e.g. 1. Possibility fortransformation of abandoned agricultural land into forest land– Forest Act, 3d national action plan for climate change 2.Biological recultivation of destroyed lands /e.g. sedimentaryplaces of plants/, financed on governmental level /Ministry ofenvironment and water/ 3. Compensation mechanisms in case ofconversion of forest land /obligation for afforestation of the samearea/
Forests earmarked for conversion Possible only in case if the conversion is of interest of thesociety, e.g. infrastructure, dumping grounds, etc.
Other general comments