buoyancy-driven natural ventilation of enclosed spaces
TRANSCRIPT

I.CHEM.E. SYMPOSIUM SERIES NO. 97
BUOYANCY-DRIVEN NATURAL VENTILATION OP ENCLOSED SPACES
M. R. Marshall* and P. L. Stewart-Darling*
A simple mathematical model for the buoyancy driven ventilation of an enclosed space, using a two-pipe ventilation system, is described. Experimental data which support the predictions of this model are presented and practical means of achieving recommended ventilation levels are discussed. (Key words: ventilation, buoyancy, natural gas, confined spaces).
INTRODUCTION
The accidental release of a flammable gas or vapour from process plant housed in a building could result in the formation of potentially hazardous mixtures unless means of preventing such a situation developing are available. An effective measure is to provide sufficient ventilation air so that any credible accidental leakage can be dispersed safely. Normally, the ventilation air will be provided by natural ventilation and in most cases this will derive from the pressure differentials created across a building by the effect of wind. However, in some circumstances, natural ventilation will be dependent on buoyancy forces derived from the difference in densities of the atmosphere within and outside a building. Por example, at low wind speeds (i.e. below about 1ms-1) provided that ventilator openings are suitably positioned, the natural ventilation of a building will be provided mainly by buoyancy forces rather than wind effects. In addition, for the particular case of a below ground installation the provision of adequate natural ventilation will depend almost entirely on the effective use of available buoyancy forces.
Normally the density difference that promotes air movement due to buoyancy will result from a difference in temperature between the atmospheres within and outside a building but the
*British Gas Corporation, Midlands Research Station, Wharf Lane, Solihull, West Midlands B91 2JW.
7

I.CHEM.E. SYMPOSIUM SERIES NO. 97
density difference can also be caused by the release of a buoyant gas within a building.
A simple mathematical model of buoyancy driven ventilation, based on a two-pipe ventilation system, has been developed in which the pressure differential to cause air movement is derived from the release of a buoyant gas within an enclosure. A design formula based on this simple model is used to determine the ventilator area requirement of underground pits and similar installations operated by British Gas. Use of this formula should ensure that the levels of ventilation achieved are adequate to disperse 3afely any credible natural gas leakages that occur in these installations.
This paper presents the results of an experimental study of buoyancy driven ventilation (caused by the release of a buoyant gas) and the application of the data to the design of an effective natural ventilation system is discussed.
MODEL OP BUOYANCY-DRIVEN VENTILATION
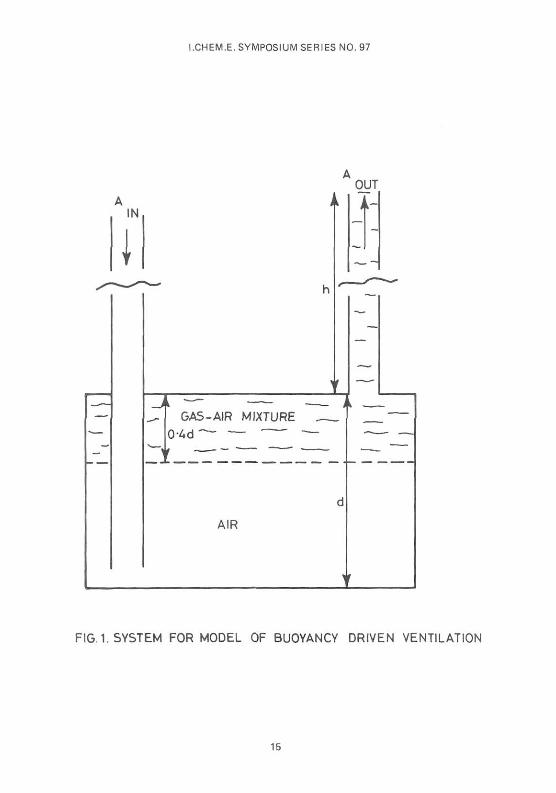
A relationship has been derived between ventilator area, gas leakage rate and steady state gas concentration on the basis that the driving force for air movement is provided by the presence of a layer of buoyant gas-air mixture within an enclosure. The situation considered was that of an underground pit having a two-pipe ventilation system, the air inlet pipe terminating close to the floor of the pit and the outlet pipe being located at high level. (Figure 1). In deriving the relationship, it was assumed that gas released in the enclosure would produce a layer of gas-air mixture of uniform concentration extending downwards from the top of the enclosure to the level of the point of leakage (1). On this basis, a layer depth of 0-4d (where d is the depth of the enclosure) was taken to be representative.
The flow of mixture out of the enclosure is given by (2):
QM = CdAeff (2AP//>m)*
where,
P =VGho and
1/AJff • 1/Ai2n + 1/Agut
Optimum ventilation air flow is achieved when k± ^out and for this condition,
Aeff = AinA/2 = Aout/ /2
(D
8

I.CHEM.E. SYMPOSIUM SERIES NO. 97
Substituting into equation (1) gives:
QM = Cd Ain (Gh0 A/>//>m)^ (2)
The density difference is given "by:
A/> =/>a [(1-Cg)/>a + Cg/g]
i.e.A/> = Cg (fa. -/>g) (3)
The mean density of the gases flowing out of the enclosure is:
/>m =/>& - Cg(/>a -/>g) (4)
Hence,
A/>/f® = Cg(/a -/>g)/[/>a. - Cg (/a -/g)]
which can be re-written as:
V / A = cg(i - s)/[i - cgd-s)] (5)
Any gas leakage is assumed to mix instantaneously and uniformly with the air in the enclosure. At steady-state condition, therefore:
Cg = Qg/(QA + Qg) i.e. QM = QA + Qg = Qg/Cg (6)
Substituting equation (5) and (6) into equation (2) and rearranging gives:
Qg = Cd klny/Q.Jh + 0.4d.VCg(1-s)/(1-Cg(1-s)). Cg (7)
where the effective buoyant height ho = h + 0.4d.
i.e. Qg = 1.208 AinJh + 0.4d-7Cg/(1-0.4Cg). Cg (8) on substituting the appropriate numerical values for C<j, G- and s.
When, in this paper, experimental data are compared to the predictions of the 'simple model', these predictions are based on equation (8).
The total ventilator area required to safely disperse a given natural gas release (i.e. prevent the average gas concentration exceeding 25$ of the lower explosion limit) can be obtained by re-arranging equation (8) and substituting the appropriate value for Cg ( = 0.0125). The total ventilator area (i.e.
Ain + Aout) is t h e n :
As = 1200Qg/(h + 0.4d) (9)

I.CHEM.E. SYMPOSIUM SERIES NO. 97
EXPERIMENTAL
In order to test the validity of the simple model of buoyancy driven ventilation, experiments using releases of natural gas were conducted in several vessels, which differed in both volume and shape. All of these were fitted with a two-pipe ventilation system as shown diagramatically in Figure 1 . To simulate practical leakage scenarios, the natural gas was released into the test enclosures as a pressurised jet, via small nozzles ranging in diameter from 0.6mm to 4-Omm. The influence on steady state gas concentrations of the gas delivery pressure and the leak orientation, as well as the actual gas release rate, were investigated.
The majority of the experiments were conducted with a vessel having dimensions of 1.23m x 1.54m x 0.92m deep and an internal volume of 1.7m3. Using this enclosure, the effect on the steady state gas concentration of changes in pipe diameter and pipe height were investigated, for natural gas release rates between 8.10-5 and 3-3.10~3 m3s-1.
The influence of vessel volume and shape on the steady state gas concentration was investigated by conducting additional experiments in two other enclosures: a duct-like vessel 0.61m x 1.83m x 0.61m deep, of internal volume 0.68m3, and a cubical enclosure of 3ide length 2.7m and an internal volume of approximately 20m3.
In practice, it is likely that cowls would be fitted bo the vent pipes to prevent ingress of water into an enclosure. Consequently, the effect of these on steady state gas concentrations was investigated.
During an experiment the build up of gas concentration within the test enclosure was continuously monitored by means of a multi-stream rapid gas chromatograph. Sampling points were located specifically under the base of the inlet and outlet pipes, others being located at various positions throughout the enclosure volume.
RESULTS _AND _DISCUSSION
A typical curve of the build-up of gas concentration with time is shown in Figure 2. This illustrates clearly that a buoyancy driven flow has been established i.e. fresh air is sampled at the base of the inlet pipe and gas-air mixture is leaving the enclosure via the outlet pipe. The curve also indicates that the mixture accumulation within the enclosure is of essentially uniform concentration. Data from all the tests performed showed that the time taken to reach steady state conditions was inversely proportional the magnitudes of both the gas leakage rate and the available ventilator area (hence, the air ventilation rate).
The build-up of gas concentration illustrated in Figure 2 is representative of experiments in which the flow is established
10

I.CHEM.E. SYMPOSIUM SERIES NO. 97
correctly. However, in some cases flow reversal occured; the effect of this on the gas concentration is described in a later section.
M^SSi o f Pipe Diameter
All the tests to investigate the effect of pipe diameter on the gas build-up were carried out in the 1.7m3 vessel, using an horizontal leak orientation in the middle of the vessel and a gas delivery pressure of 0-35bar. In any given test, the pipes were of the same diameter with heights of 4m and 3m for the outlet and inlet pipes respectively. Figure 3 summarises the variation of the measured steady state gas concentrations with gas leakage rate for each of the pipe diameters used. The trend observed is as expected from the predictions of the 'simple model' i.e. the larger the pipe diamter, the lower the final gas concentration for a given gas leakage rate.
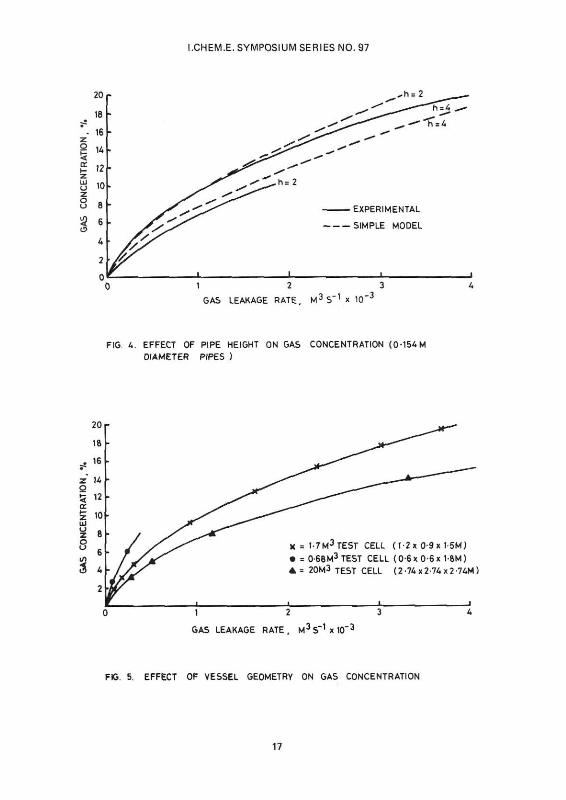
Effect of Pipe Height
To determine the effect of both the relative and actual heights of the vent pipes, tests were carried out with inlet and outlet pipe heights of 1m and 2m and also 1m and 4m respectively, in addition to those in which the corresponding pipe heights were 3m and 4m.
With a difference in vent pipe height of 1m (i.e. a height combination of 3m and 4m or 1m and 2m), the results obtained for the three diameters of pipe used were similar: for an outlet pipe height of 4m, the measured steady state gas concentrations were about 20$ - 30$ higher than predicted, whereas for an outlet pipe height of 2m the measured gas concentrations were approximately 20$ - 30$ lower than predicted by the simple model. Data for the 0.154m diameter pipes is presented in Figure 4- Tests carried out with a larger difference in the pipe heights (e.g. an inlet pipe height of 1m and an outlet pipe height of 4m) resulted in lower steady state gas concentrations than predicted.
It is considered that the differences between measured and calculated gas concentrations may be due to frictional losses caused by flow along the vent pipes. This factor can be included in the mathematical model. However, in practice its effect on the calculation of the required ventilator area is not significant for the small leakage rates typical of real situations (i.e. up to about lO-4 ra3s-1).
Effect of Vessel Geometry
The influence of vessel geometry is included in the simple model only indirectly, through defining the depth of the layer of gas-air mixture as being equal to 0.4d.
The effect on steady state gas concentrations of variations in vessel volume and shape is illustrated in Figure 5- It is clear that, for a given gas release rate, the measured steady state gas concentration decreases as the vessel volume is increased. This agrees with the model predictions but there is
11

I.CHEM.E. SYMPOSIUM SERIES NO. 97
some evidence to suggest that the shape of the enclosure also has an influence. Thus, for the 20m3 cubical vessel the measured and predicted gas concentrations were almost identical whereas concentrations measured in the smaller, non-cubical vessels were higher than expected and, in fact, increased as the ratio of Lmax: Lmin for the vessel increased. However, this apparent effect of vessel shape could also be a consequence of the initial momentum of the gas jet release, which would become less significant as the volume of the enclosure increased.
Effect of Leak Source Characteristics
In deriving the simple model the gas leak source characteristics were not specified i.e. no attempt was made to include such parameters as gas delivery pressure, leak orientation or the position of the gas release within an enclosure. Consequently, the influence of these factors on steady state gas concentrations was investigated experimentally. However, the data indicates that, in practice, the influence of leak source characteristics is relatively minor. Thus, measured gas concentrations were independent of the gas supply pressure over the range investigated i.e. 0.07 to 0-35 bar (Figure 6) and, whilst the leak orientation did affect the steady state gas concentration (Figure 7). the variation was limited to a maximum of about ±15$ of the mean, decreasing to about ±10$ at higher gas leakage rates. In the 1.7m3 vessel used for the experiments, with a vertical leak orientation (upwards or downwards) the jet momentum would tend to induce an essentially upwards flow in the enclosure and, hence, assist the outward flow of gases. However, a horizontal gas release could not and this, combined with the fact that the horizontal gas releases were always directed away from the outlet pipe, might explain the higher gas concentrations obtained with this leak orientation. In a larger volume enclosure, it is anticipated that the influence of leak orientation on gas concentration would be less.
Although the effect was relatively small, the influence on steady state gas concentrations of the position of the gas release within an enclosure was in general as predicted by the simple model. That is, the higher the level of the leak (and hence the shallower the layer of gas-air mixture formed) the greater the magnitude of the steady state gas concentration achieved.
m°Jl Reversal
During some experiments, usually with high gas release rates (greater than 1.2.10-3 m 3s _ 1), flow reversal(s) occurred -particularly under gusty wind conditions. In some cases, a steady flow pattern was never established whilst in others a reverse flow was established and maintained. i.e. fresh air was drawn into the outlet pipe and mixture flowed out of the test vessel via the (shorter) inlet pipe. The effect of this flow reversal is to reduce the effective height of the outlet pipe and hence lead to an increase in the steady state gas concentration due to the reduced flow of ventilation air.
12

I.CHEM.E. SYMPOSIUM SERIES NO. 97
Table 1 compares some measured gas concentrations obtained under 'correct' and reversed flow conditions.
TABLE 1. EFFECT OF FLOW REVERSAL ON GAS CONCENTRATION
3-3 5-7
10.5 14.0
4-3 7-0
12.0 16.0
Gas Leakage Rate Measured Gas Concentration {% gas-in-air) (m3s-1) Correct Flow Reversed Flow
2.4- 10"" 6.5- 10-1* 1.2. TO"3
2. 10-3
To overcome the problem, the use of different types of cowls was investigated. These included the standard 'chinamans hat' type, a modified version of this design which has an inner inverted cone (claimed by the manufacturers to prevent back pressure in a vent pipe) and a rotating, French designed 'Aspiromatic' cowl (which was installed only on the outlet pipe). All of the cowls were successful in preventing flow reversal and, in addition, did not affect the ventilation air flow to any significant extent. The 'Aspiromatic' cowl (installed only on the oulet pipe) was particularly effective: because this rotated freely in the wind, it tended to induce gas-air mixture up the outlet pipe, hence assisting to establish flow in the correct direction.
CONCLUSIONS
1. Given the assumptions inherent in the derivation of the simple mathematical model of buoyancy driven ventilation, the model predictions and experimental data were in reasonable agreement.
2. Ventilator areas calculated using this model will provide levels of ventilation adequate to disperse 3afely gas leakages of the magnitude anticipated in governor pits and similar below ground installations. (i.e. leakages up to about 10-4 m3s-1).
3- The use of cowls on vent pipes will normally prevent flow reversal. The most effective arrangement would appear to be a 'Chinamans hat' type of cowl on the inlet pipe and an 'Aspiromatic' cowl on the outlet pipe.
13

I.CHEM.E. SYMPOSIUM SERIES NO. 97
1
2
LIST OF SYMBOLS
Ae-f-f - effective area of inlet and outlet ventilators (m2)
A^n - area of inlet ventilators (m2)
^out ~ a r e a of outlet ventilators (m2)
Ag - total ventilator area, Ain + AQut (m2)
C^ - discharge coefficient (taken as 0.61)
Cg - gas concentration
d - depth of enclosure (ra)
G - gravitational constant (9-81) (ms-2)
h - height of outlet pipe (m)
ho - effective "buoyant height (m)
Lmax - maximum dimension of enclosure (m)
Lmin - minimum dimension of enclosure (m)
A P - pressure differential (Nm-2)
Q_A - ventilation air flow rate (m3s-1)
Qg - gas leakage rate (m3s-1)
Qjd - mixture flow rate (m3s-1)
s - relative density
/^a. - density of air (kg.m-3)
/9g - density of gas (kg.m-3)
/?m - mean density of gas-air mixture (kg.m-3)
REFERENCES
. Marshall, M.R., 1983, 4th International Loss Prevention Symposium, Harrogate.
. BS5925, 1980, British Standards Institution.
14
LCHEM.E. SYMPOSIUM SERIES NO. 97
OUT
IN
I
Jf GAS-AIR MIXTURE
AIR
FIG. 1. SYSTEM FOR MODEL OF BUOYANCY DRIVEN VENTILATION
15

I.CHEM.E. SYMPOSIUM SERIES NO. 97
12 r
10 -
GAS OFF
4 = SAMPLE POINT AT OUTLET • = SAMPLE POINT AT INLET
• = SAMPLE POINT AT CENTRE X = SAMPLE POINT AT BASE
10 15 20 TIME, MINUTES
25 30
FIG. 2. REPRESENTIVE CURVE OF BUILD-UP OF GAS CONCENTRATION FOR CORRECT FLOW PATTERN
20 r
18
16
14
12
10
8
6
4
2
;0-051 M D= 0-103M
D = ^ ' tS4M
EXPERIMENTAL
SIMPLE MODEL
GAS LEAKAGE RATE, M3S_1x10"3
FIG. 3 EFFECT OF PIPE DIAMETER ON GAS CONCENTRATION (OUTLET PIPE AM. INLET PIPE 3M )
16
I.CHEM.E. SYMPOSIUM SERIES NO. 97
GAS LEAKAGE RATE, M3 S 1 x 10"
FIG. A. EFFECT OF PIPE HEIGHT ON GAS CONCENTRATION (0-154 M DIAMETER PIPES )
GAS LEAKAGE RATE. M3S~1x10"3
FIG. 5. EFFECT OF VESSEL GEOMETRY ON GAS CONCENTRATION
17

I.CHEM.E. SYMPOSIUM SERIES NO. 97
10 r
8 -
i> -
• = MEASURED AT 5 PSIG • = MEASURED AT 1 PSIG K = SIMPLE MODEL
HORIZONTAL LEAK
VERTICAL LEAK
2 i. GAS LEAKAGE RATE, M 3 S"1 x 10
FIG. 6. EFFECT OF GAS PRESSURE ON GAS CONCENTRATION
HORIZONTAL LEAK POSITION VERTICAL LEAK DOWNWARDS VERTICAL LEAK UPWARDS
GAS LEAKAGE RATE. M*S x 10""
FIG.7. EFFECT OF DIFFERENT LEAK ORIENTATIONS ON GAS CONCENTRATION
1R